
Assessment of Lean Maturity Levels in Industries of the Luanda Region, Angola


 ,
,  and
and 
Abstract
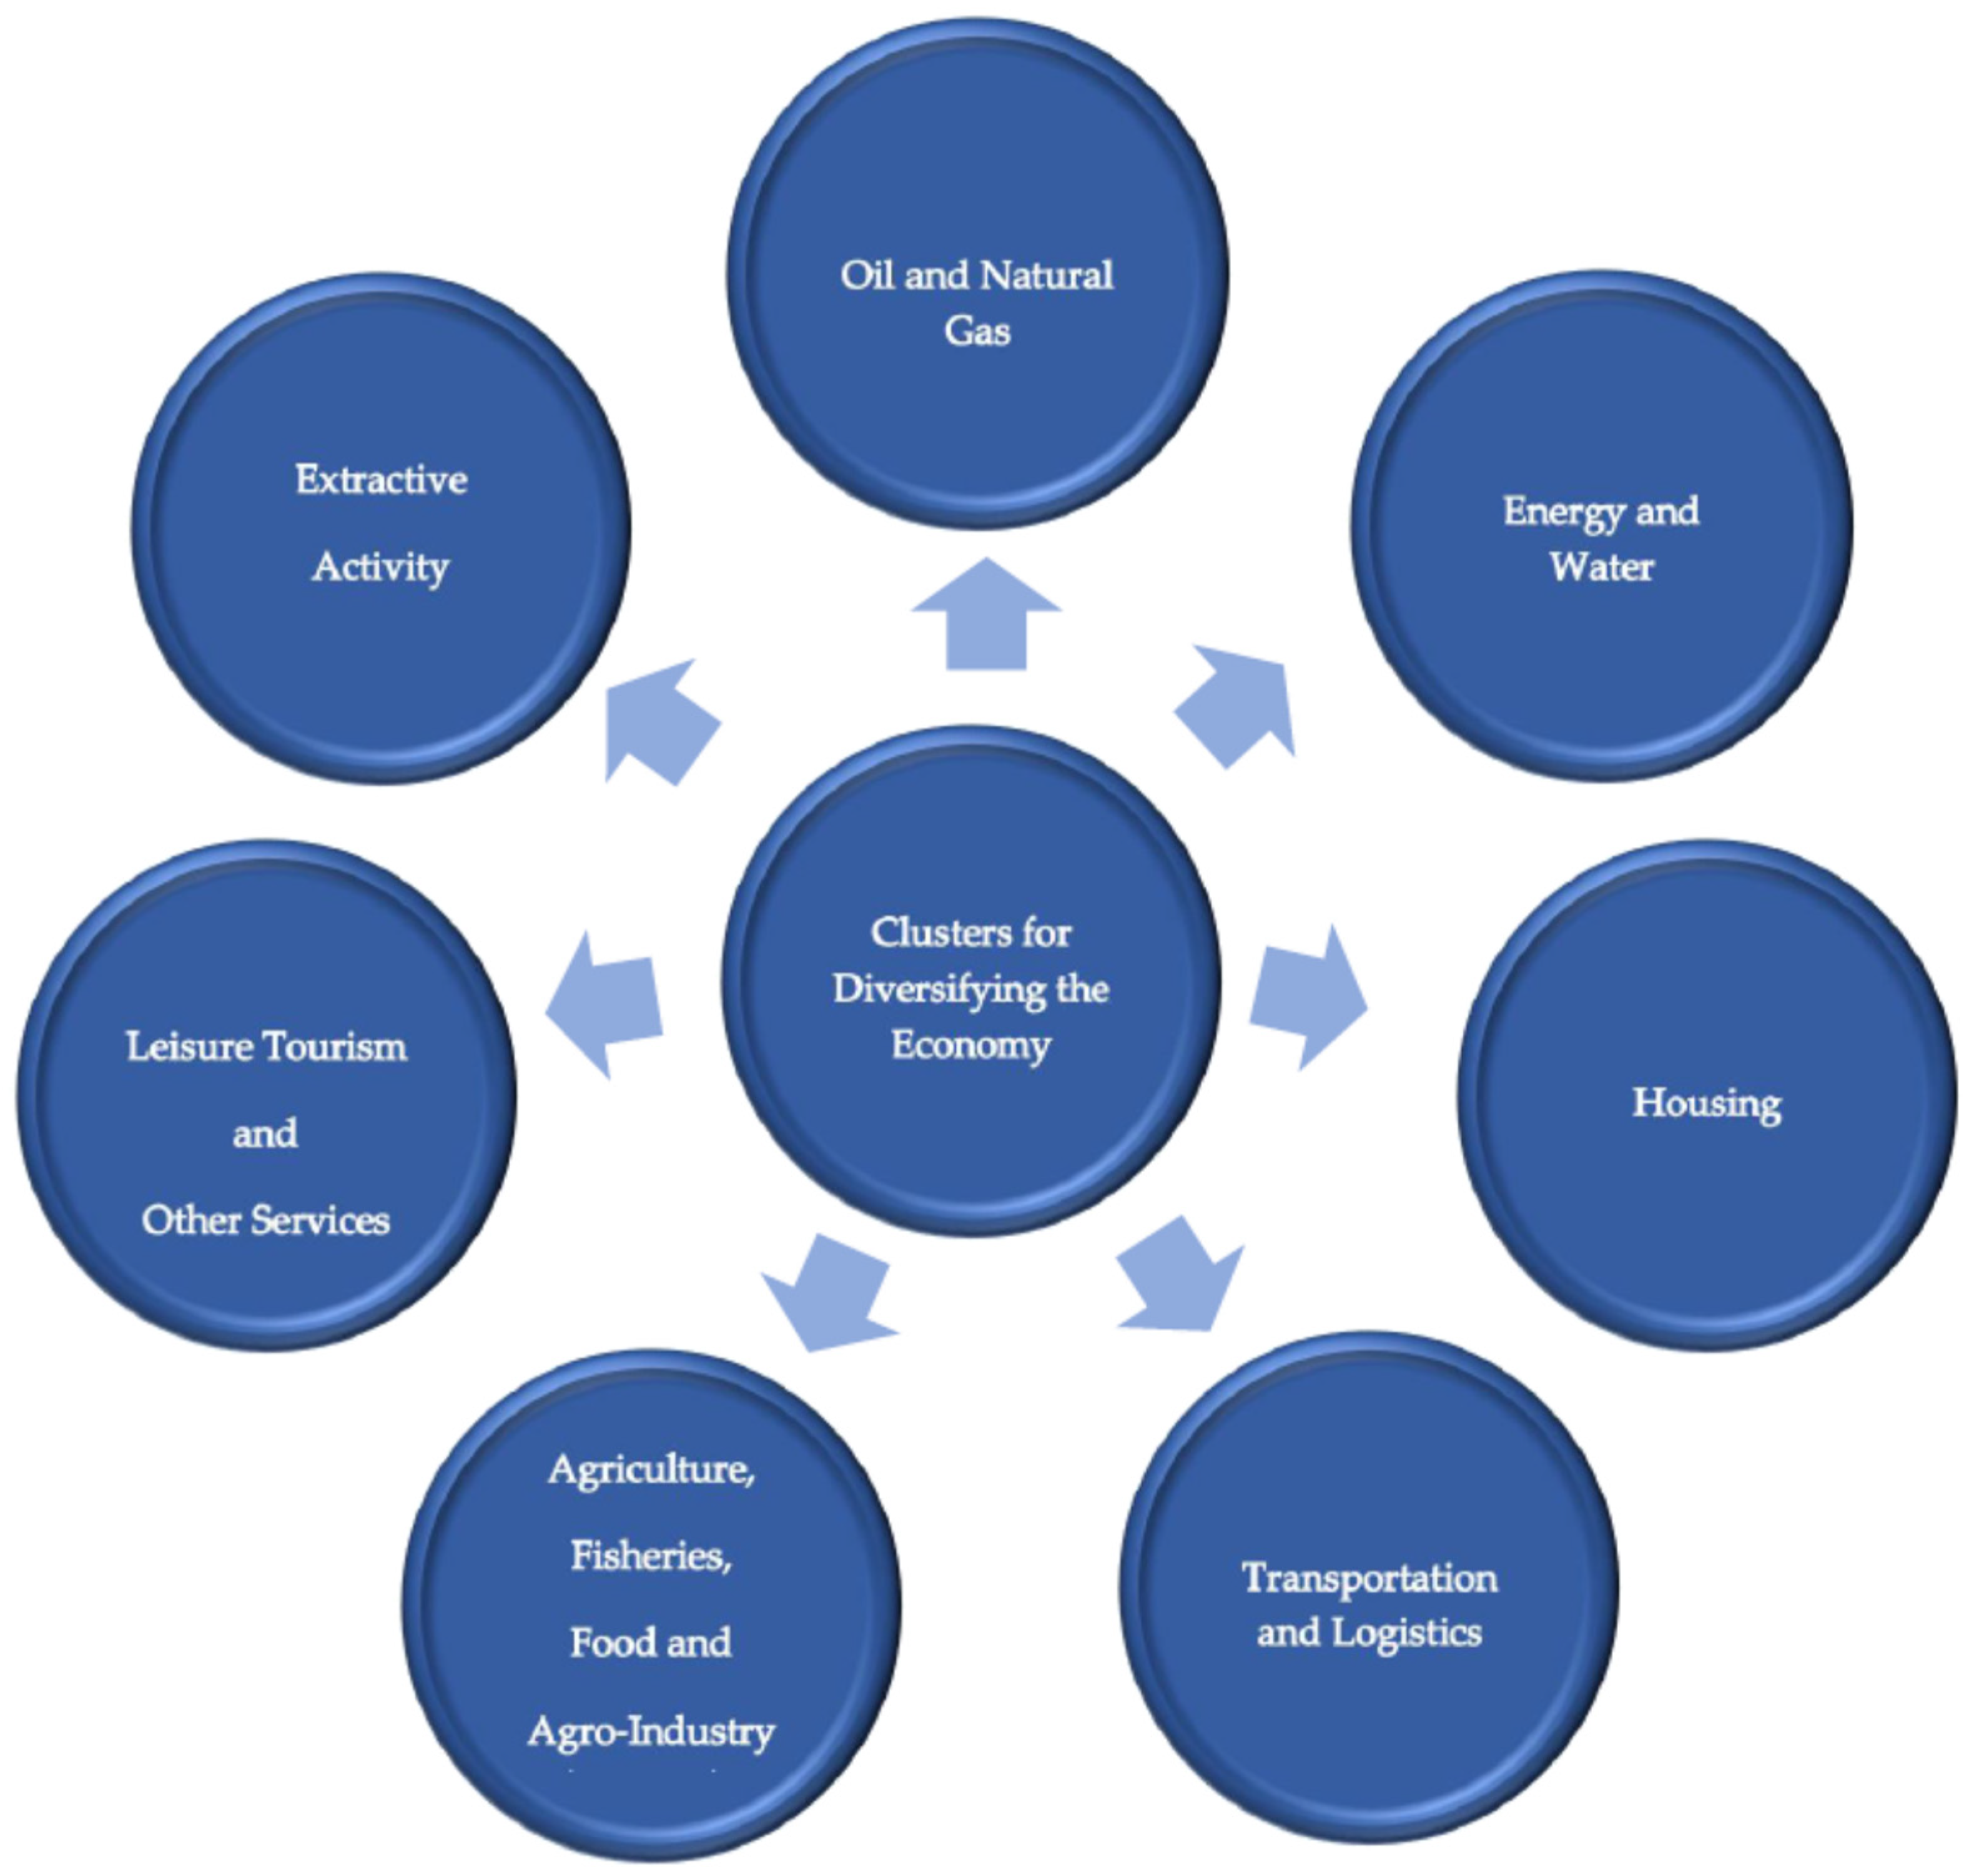
:1. Introduction
- Increase the national production;
- Reduce the national dependence on imports;
- Strengthen the Angolan enterprise;
- Promote job creation;
- Diversify sources of revenue and foreign exchange.
2. Materials and Methods
3. Importance of Implementing Lean Philosophy in Industries
4. Brief Contextualisation of Lean and Maturity Philosophy
- Value: Generally, when referring to a product that you buy, you risk using the designation value when evaluating. When there is satisfaction, we affirm that it has reached the expected value.
- Value Chain: The next step is to identify the value chain. This is a process or a set of process steps that each product must go through to be completed.
- Continuous Flow: The flow is conducted throughout the value chain, and must be continuous, which means that no problems should exist to stop or reduce an operation.
- Pull System: The principle of the pull system follows the creation’s flow and production start only if the customer requests it.
- Pursuit the perfection: It comes by continuous improvement.
5. The Application of Lean Philosophy in the Angolan Industrial Fabric
6. Analysis of Lean Maturity in the Industrial Sector of Angola
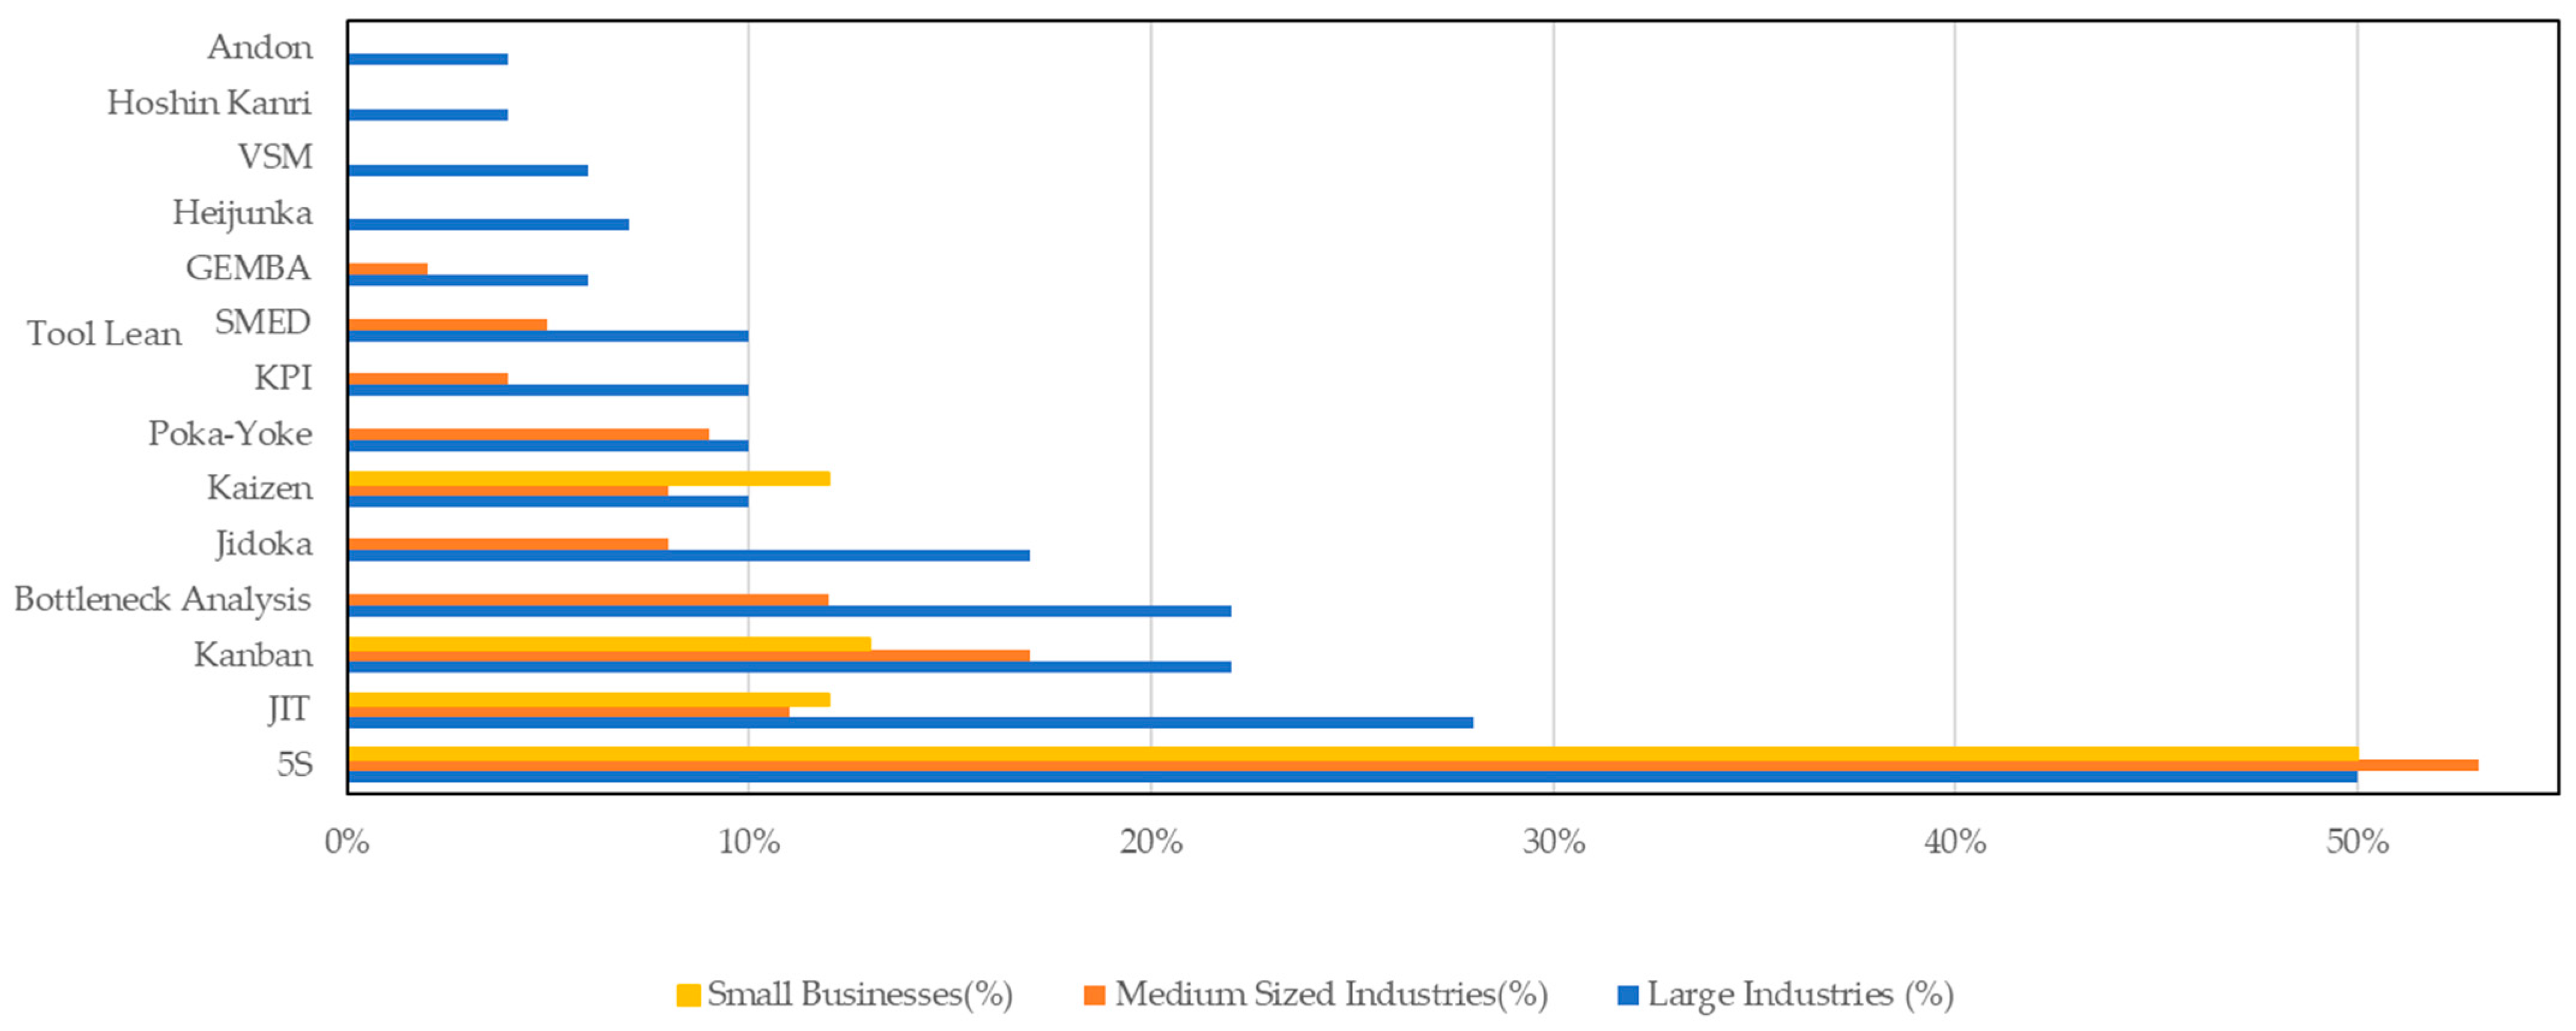
6.1. Analysis of Knowledge of Lean Philosophy Tools
6.2. Analysis of the Use of Lean Tools
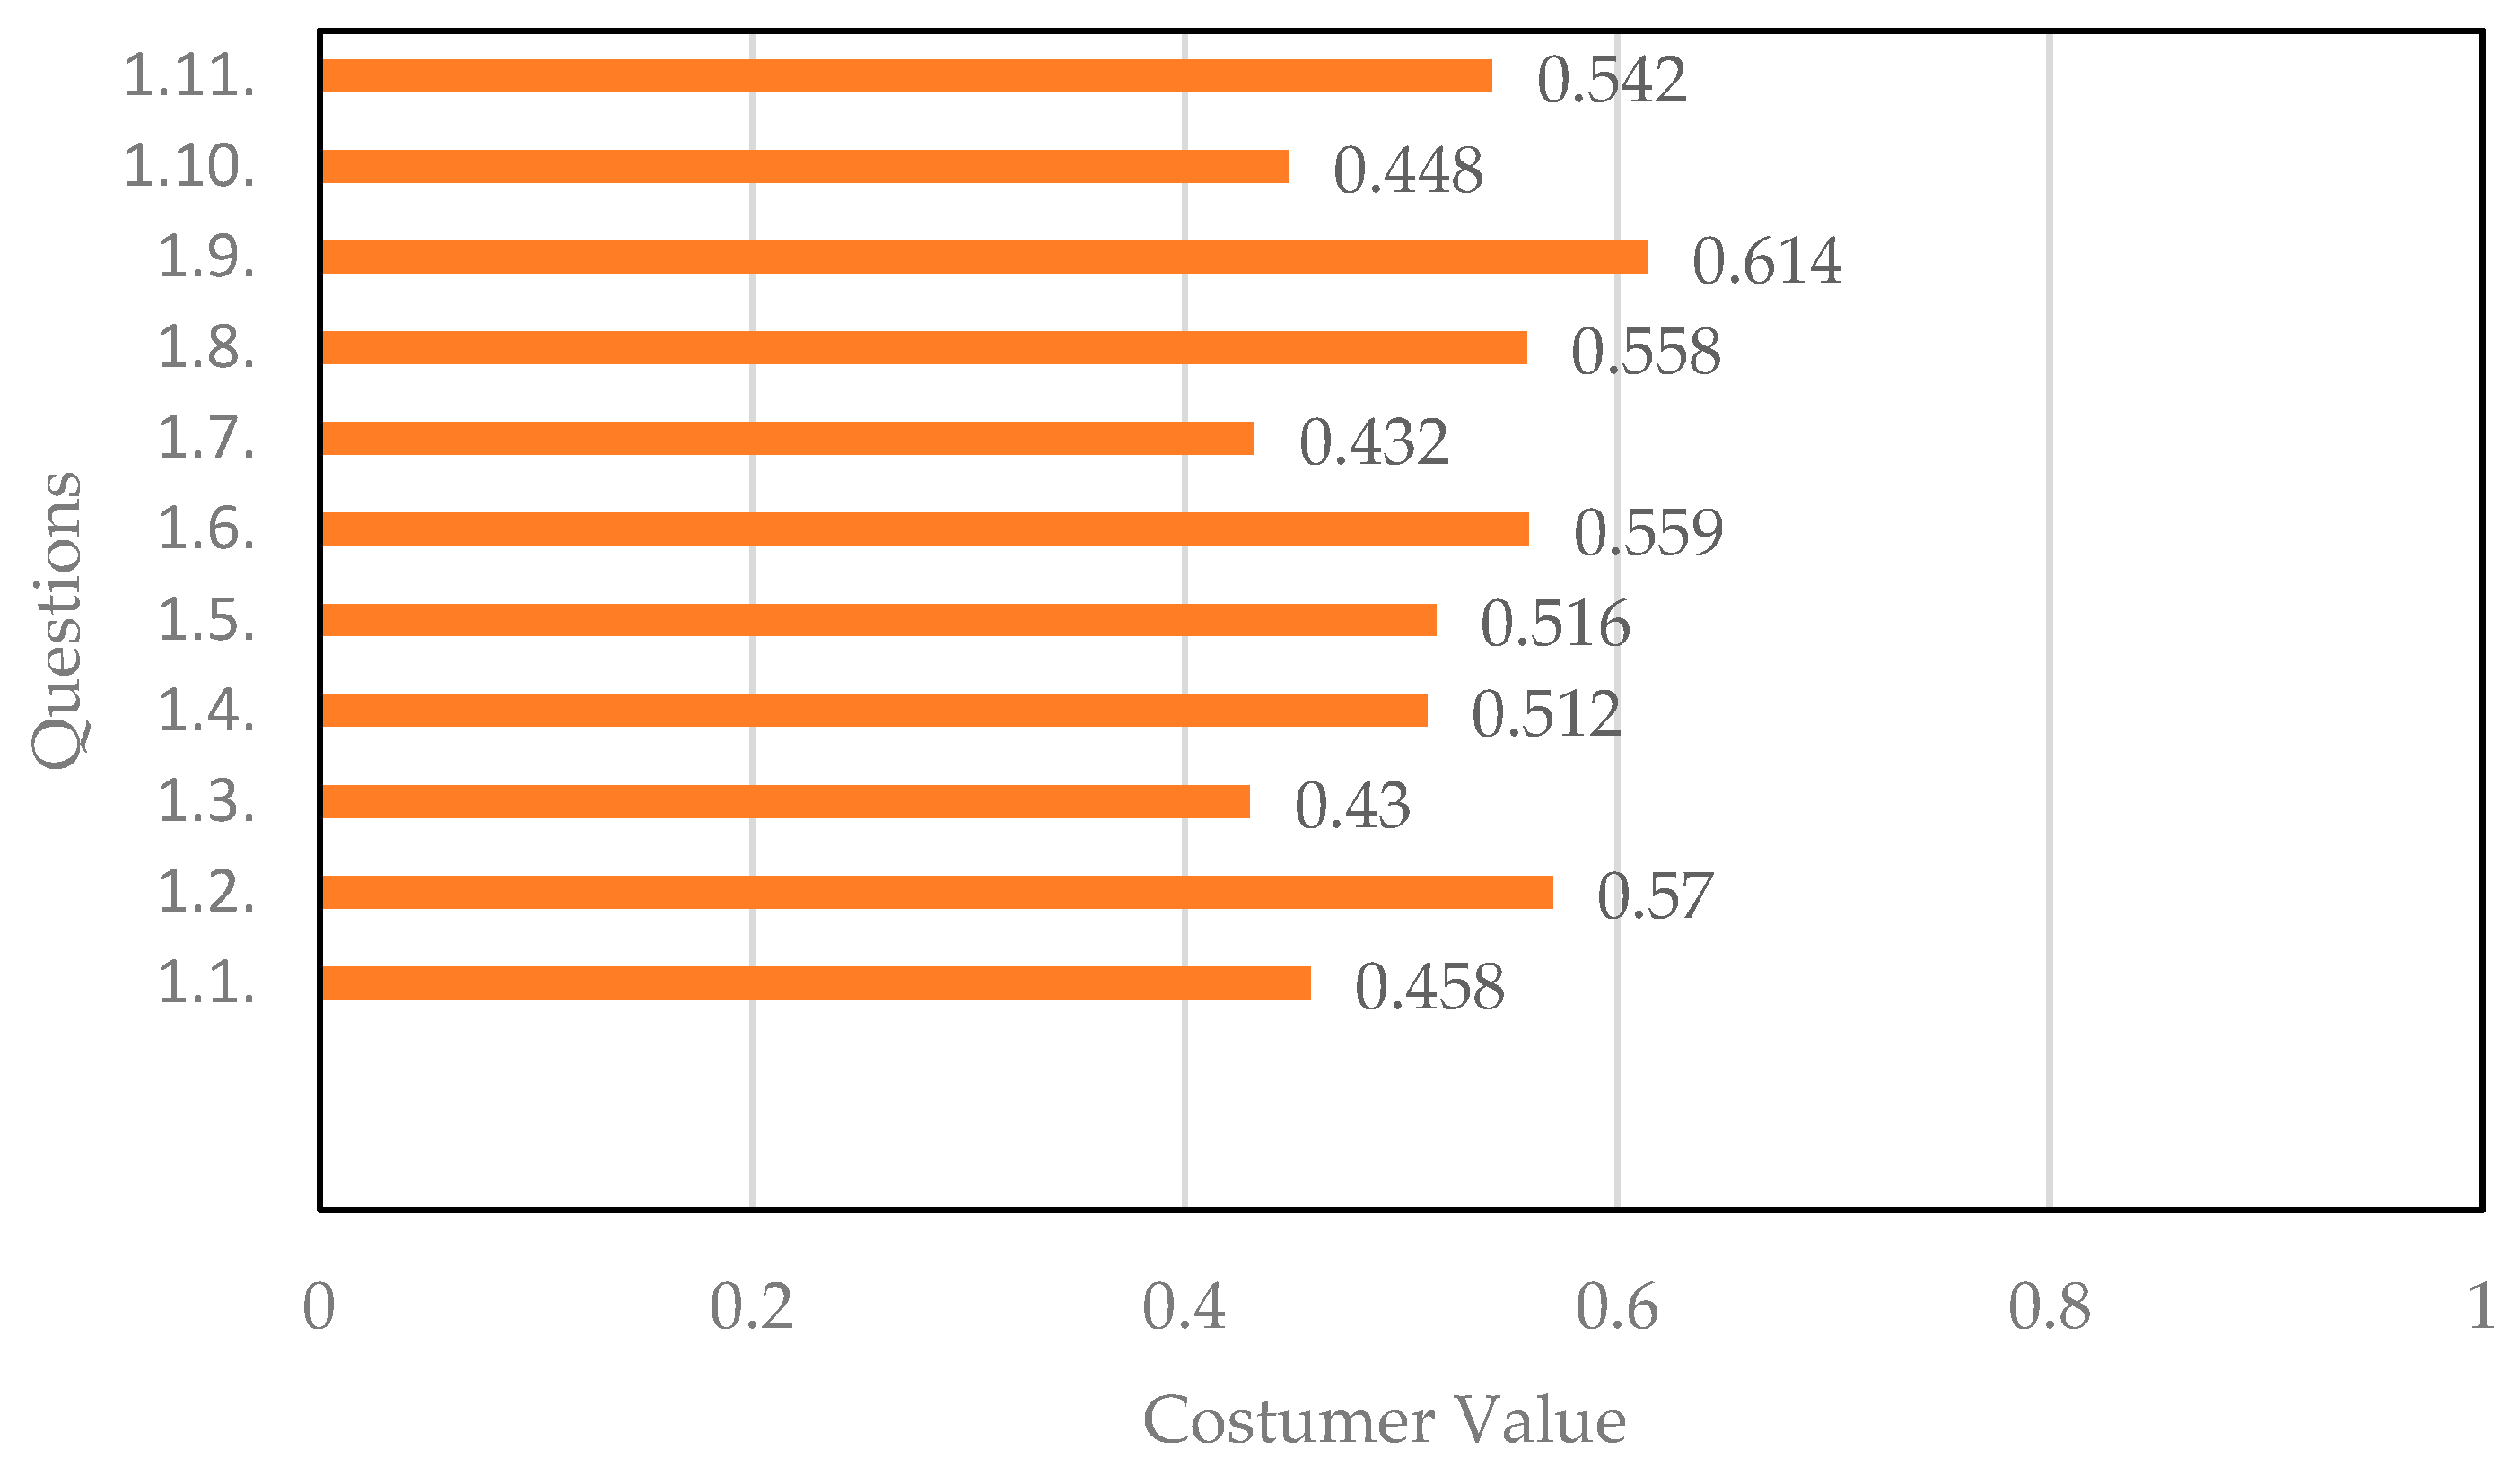
6.3. Search for the Lean Principle via Analysis of “Customer Value (CV)”
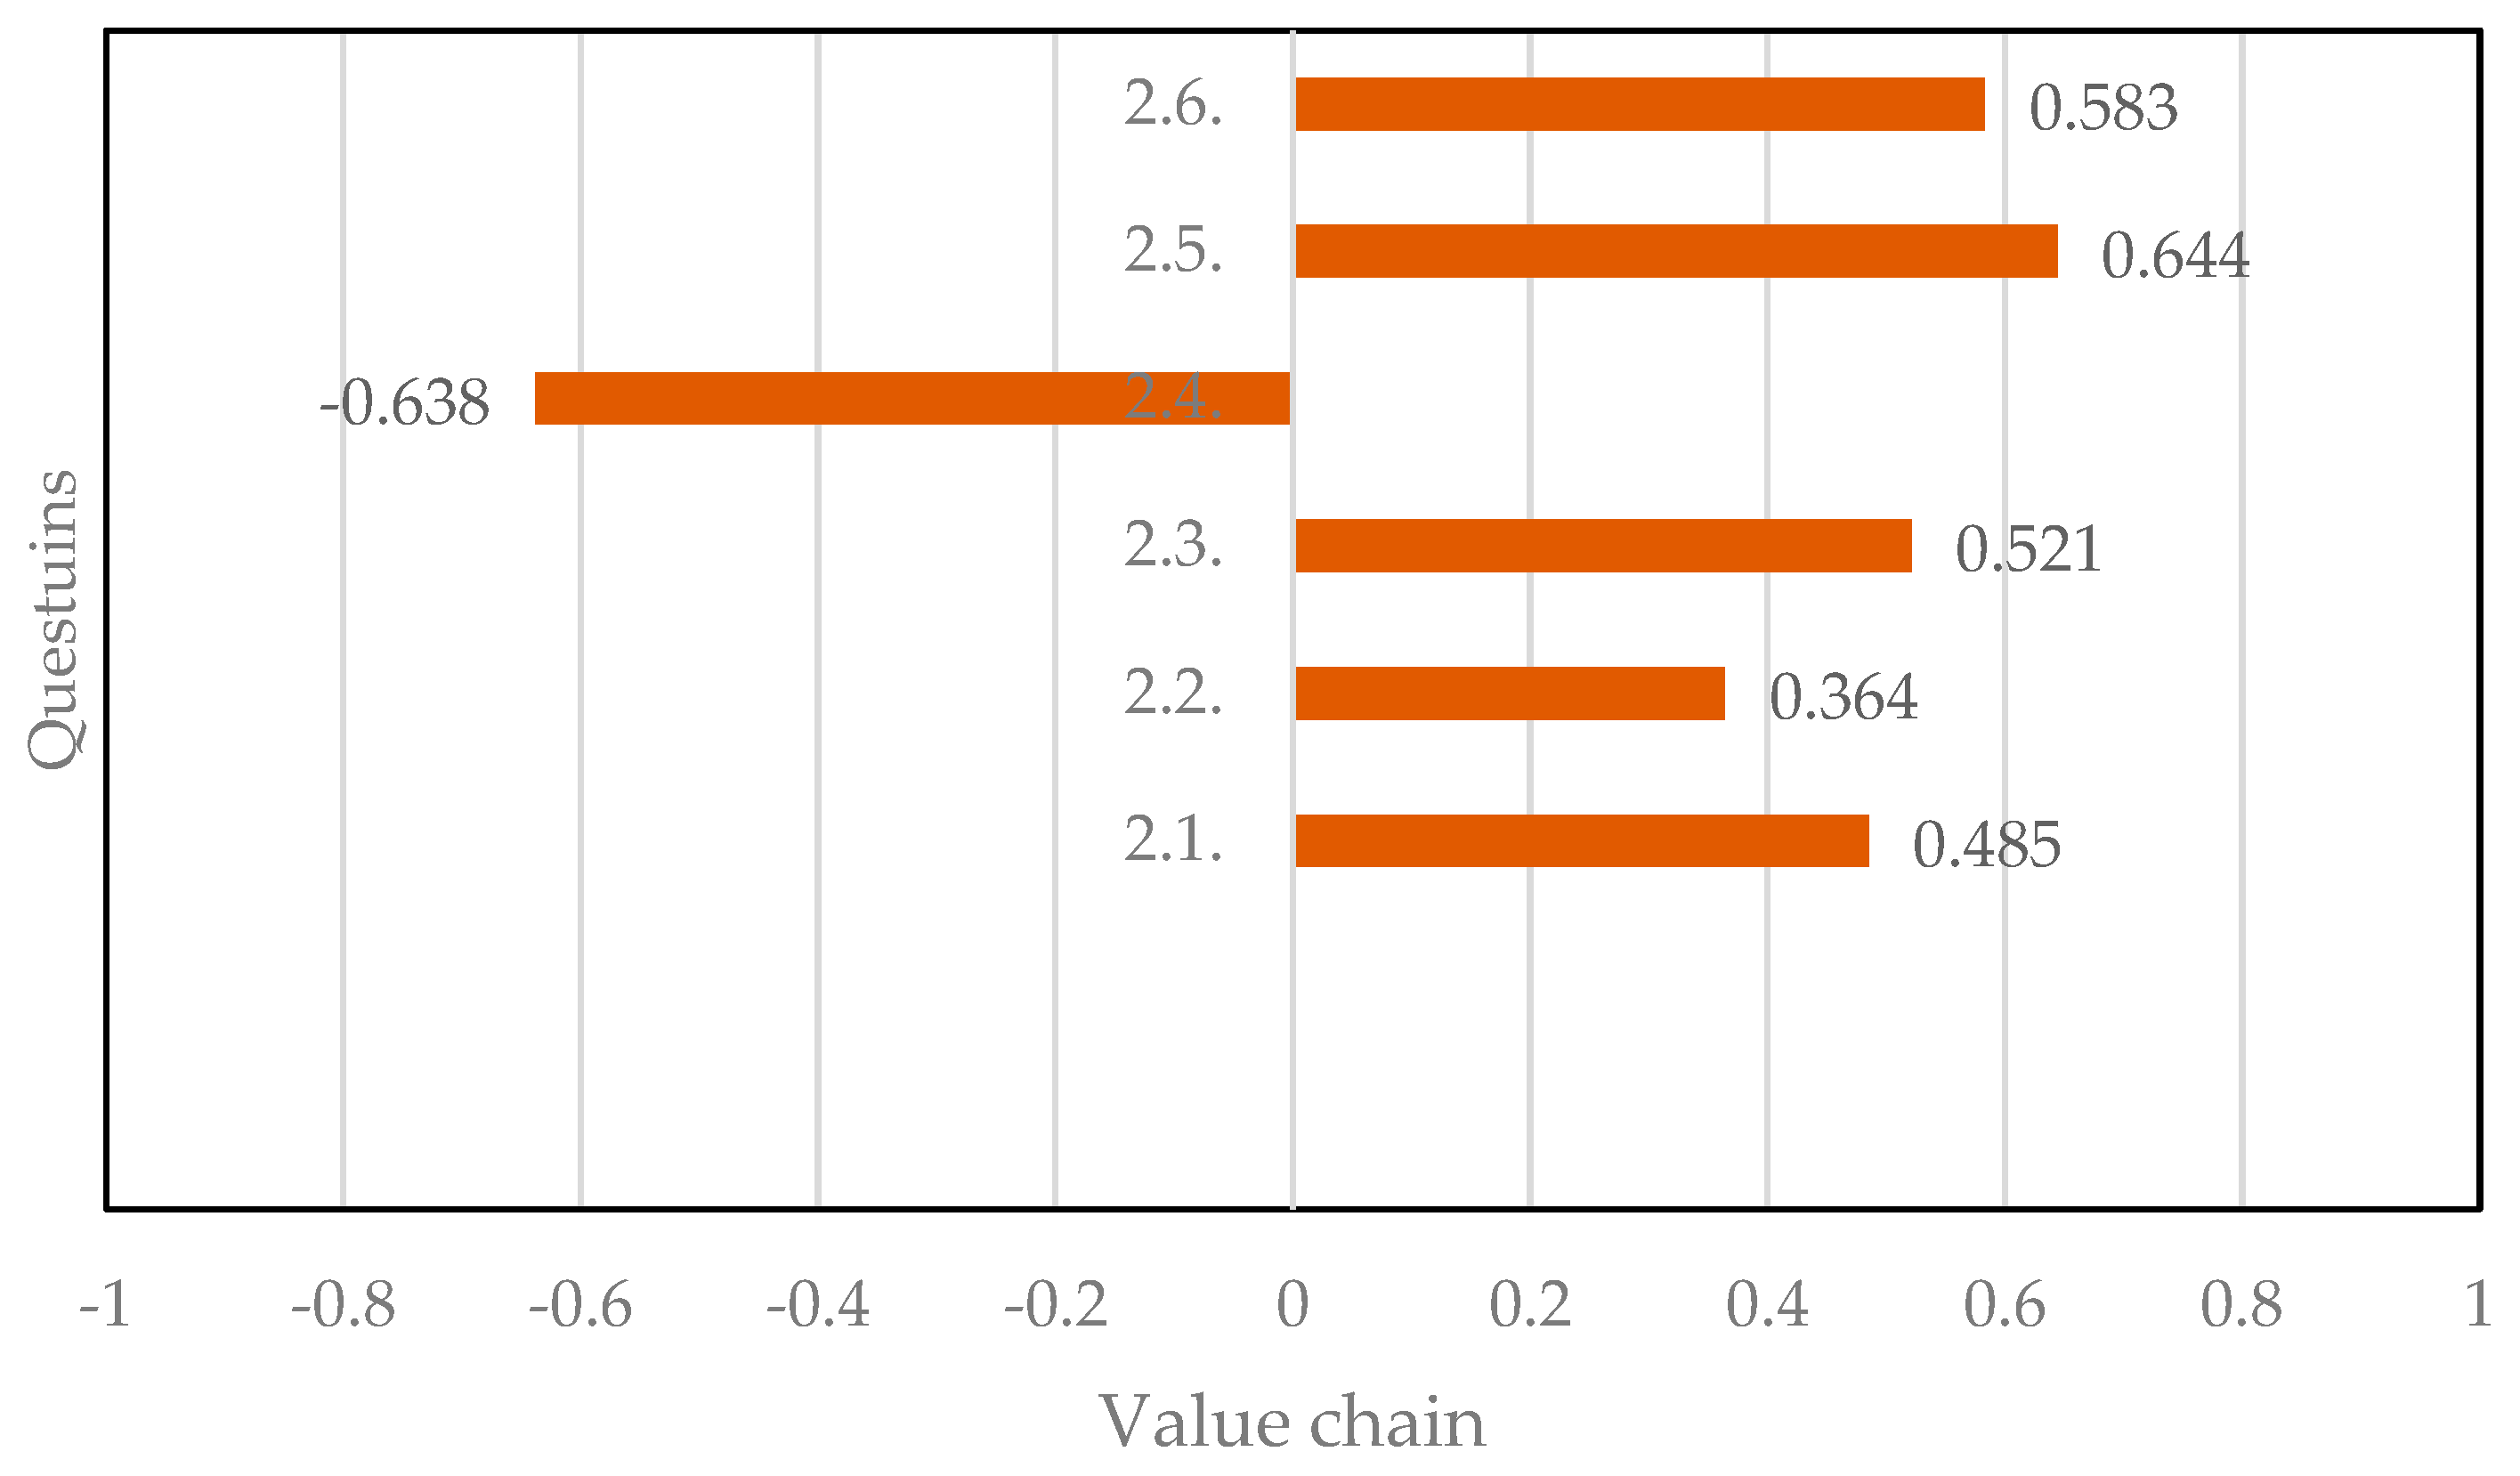
6.4. Search for the Lean Principle via Analysis of the “Value Chain (VC)”
6.5. Search for the Lean Principle Using the “Pull Production System (PPS)”
6.6. Search for the Lean Principle Using the “Continuous Production Flow (CPF)”
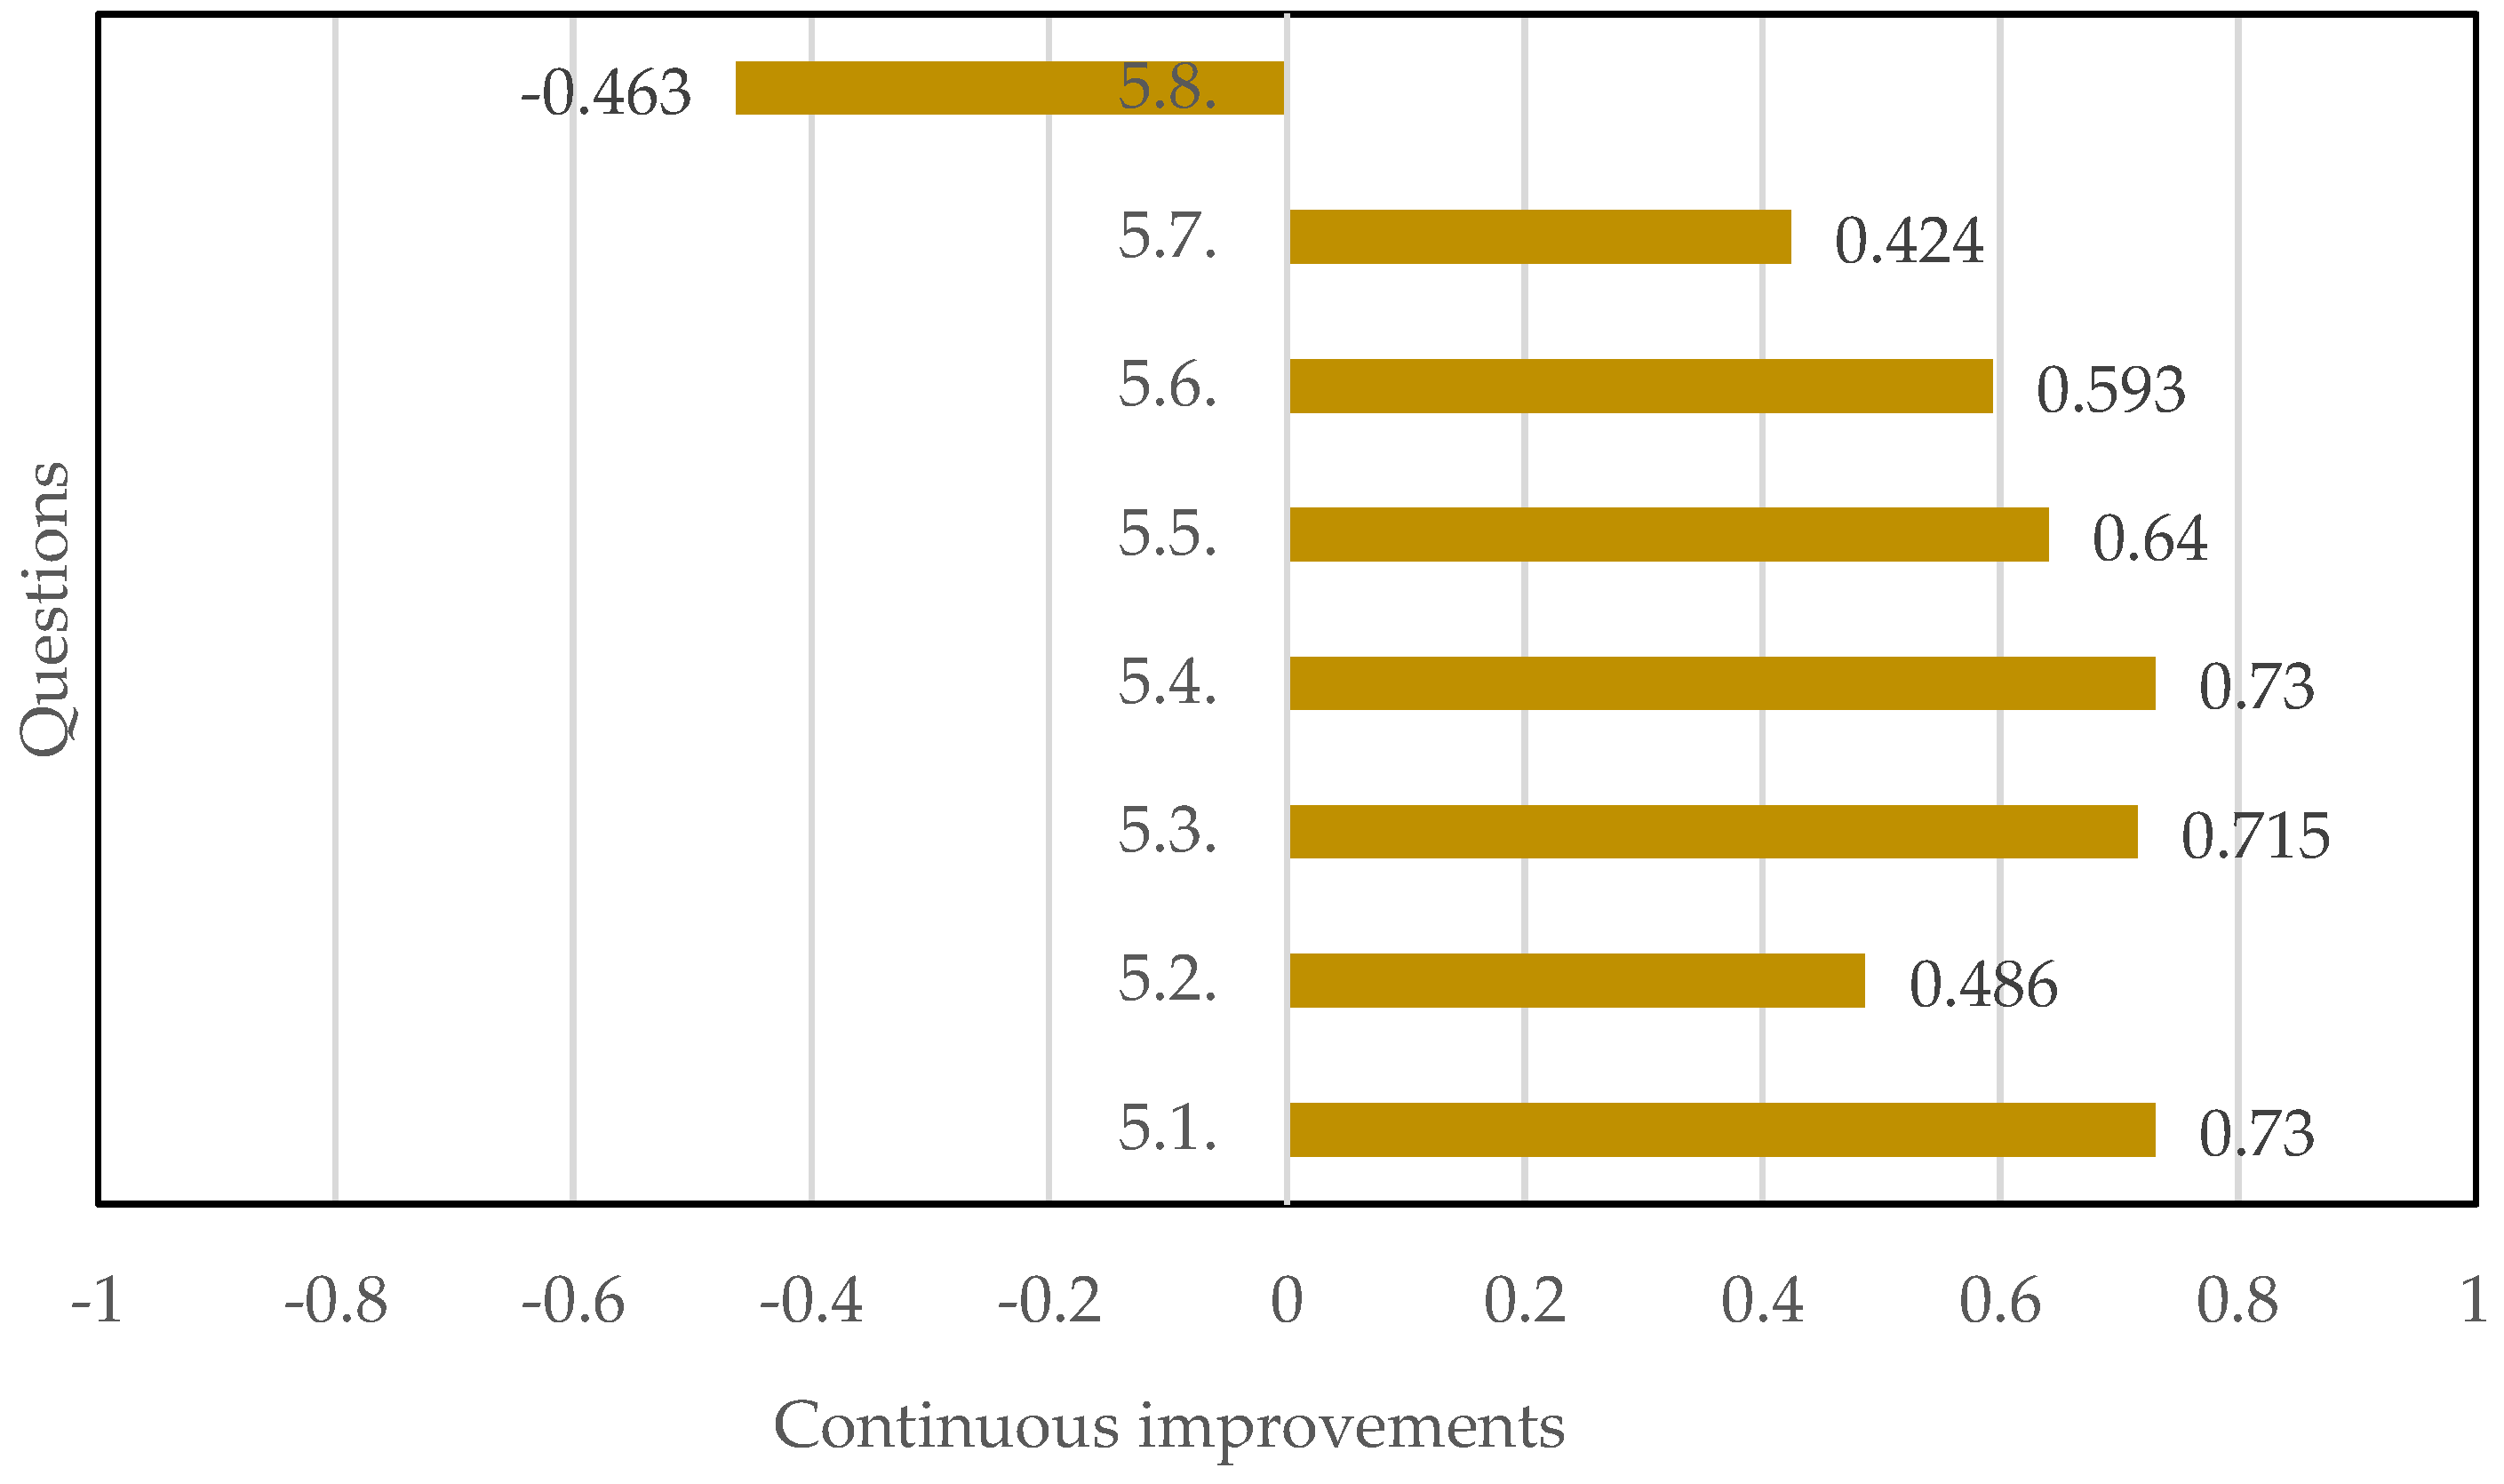
6.7. Search for the Lean Principle via Analysis of “Continuous Improvement (CI)”
7. Summary of the Analysis of Maturity of Luanda’s Region Industries
- (a)
- Simple table of the percentages when the dimension reached 4 or more.
- (b)
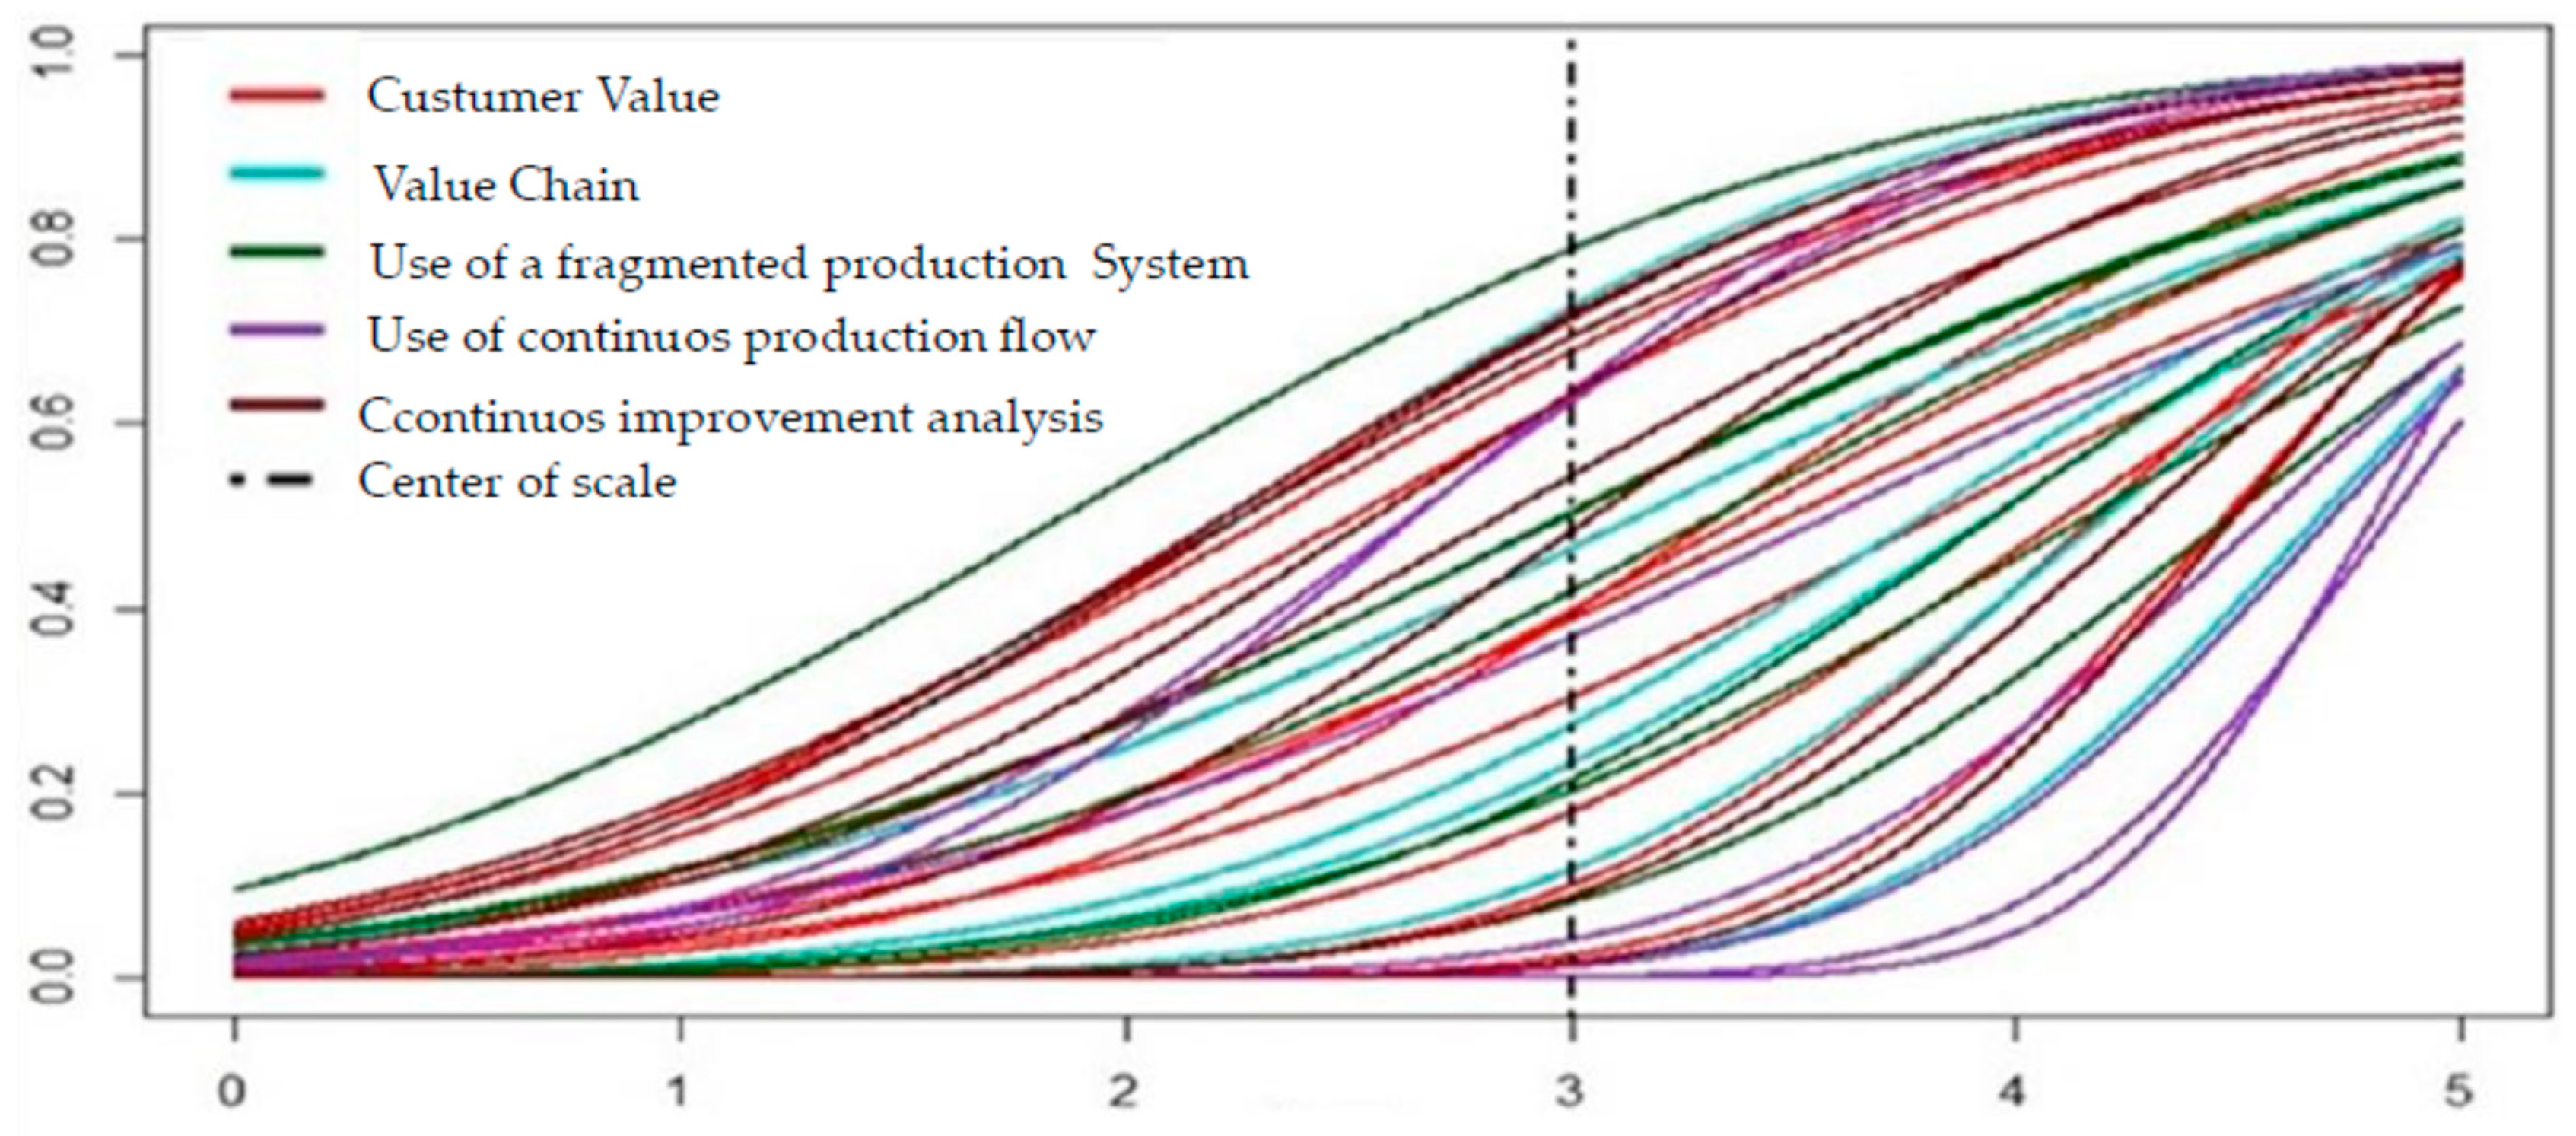
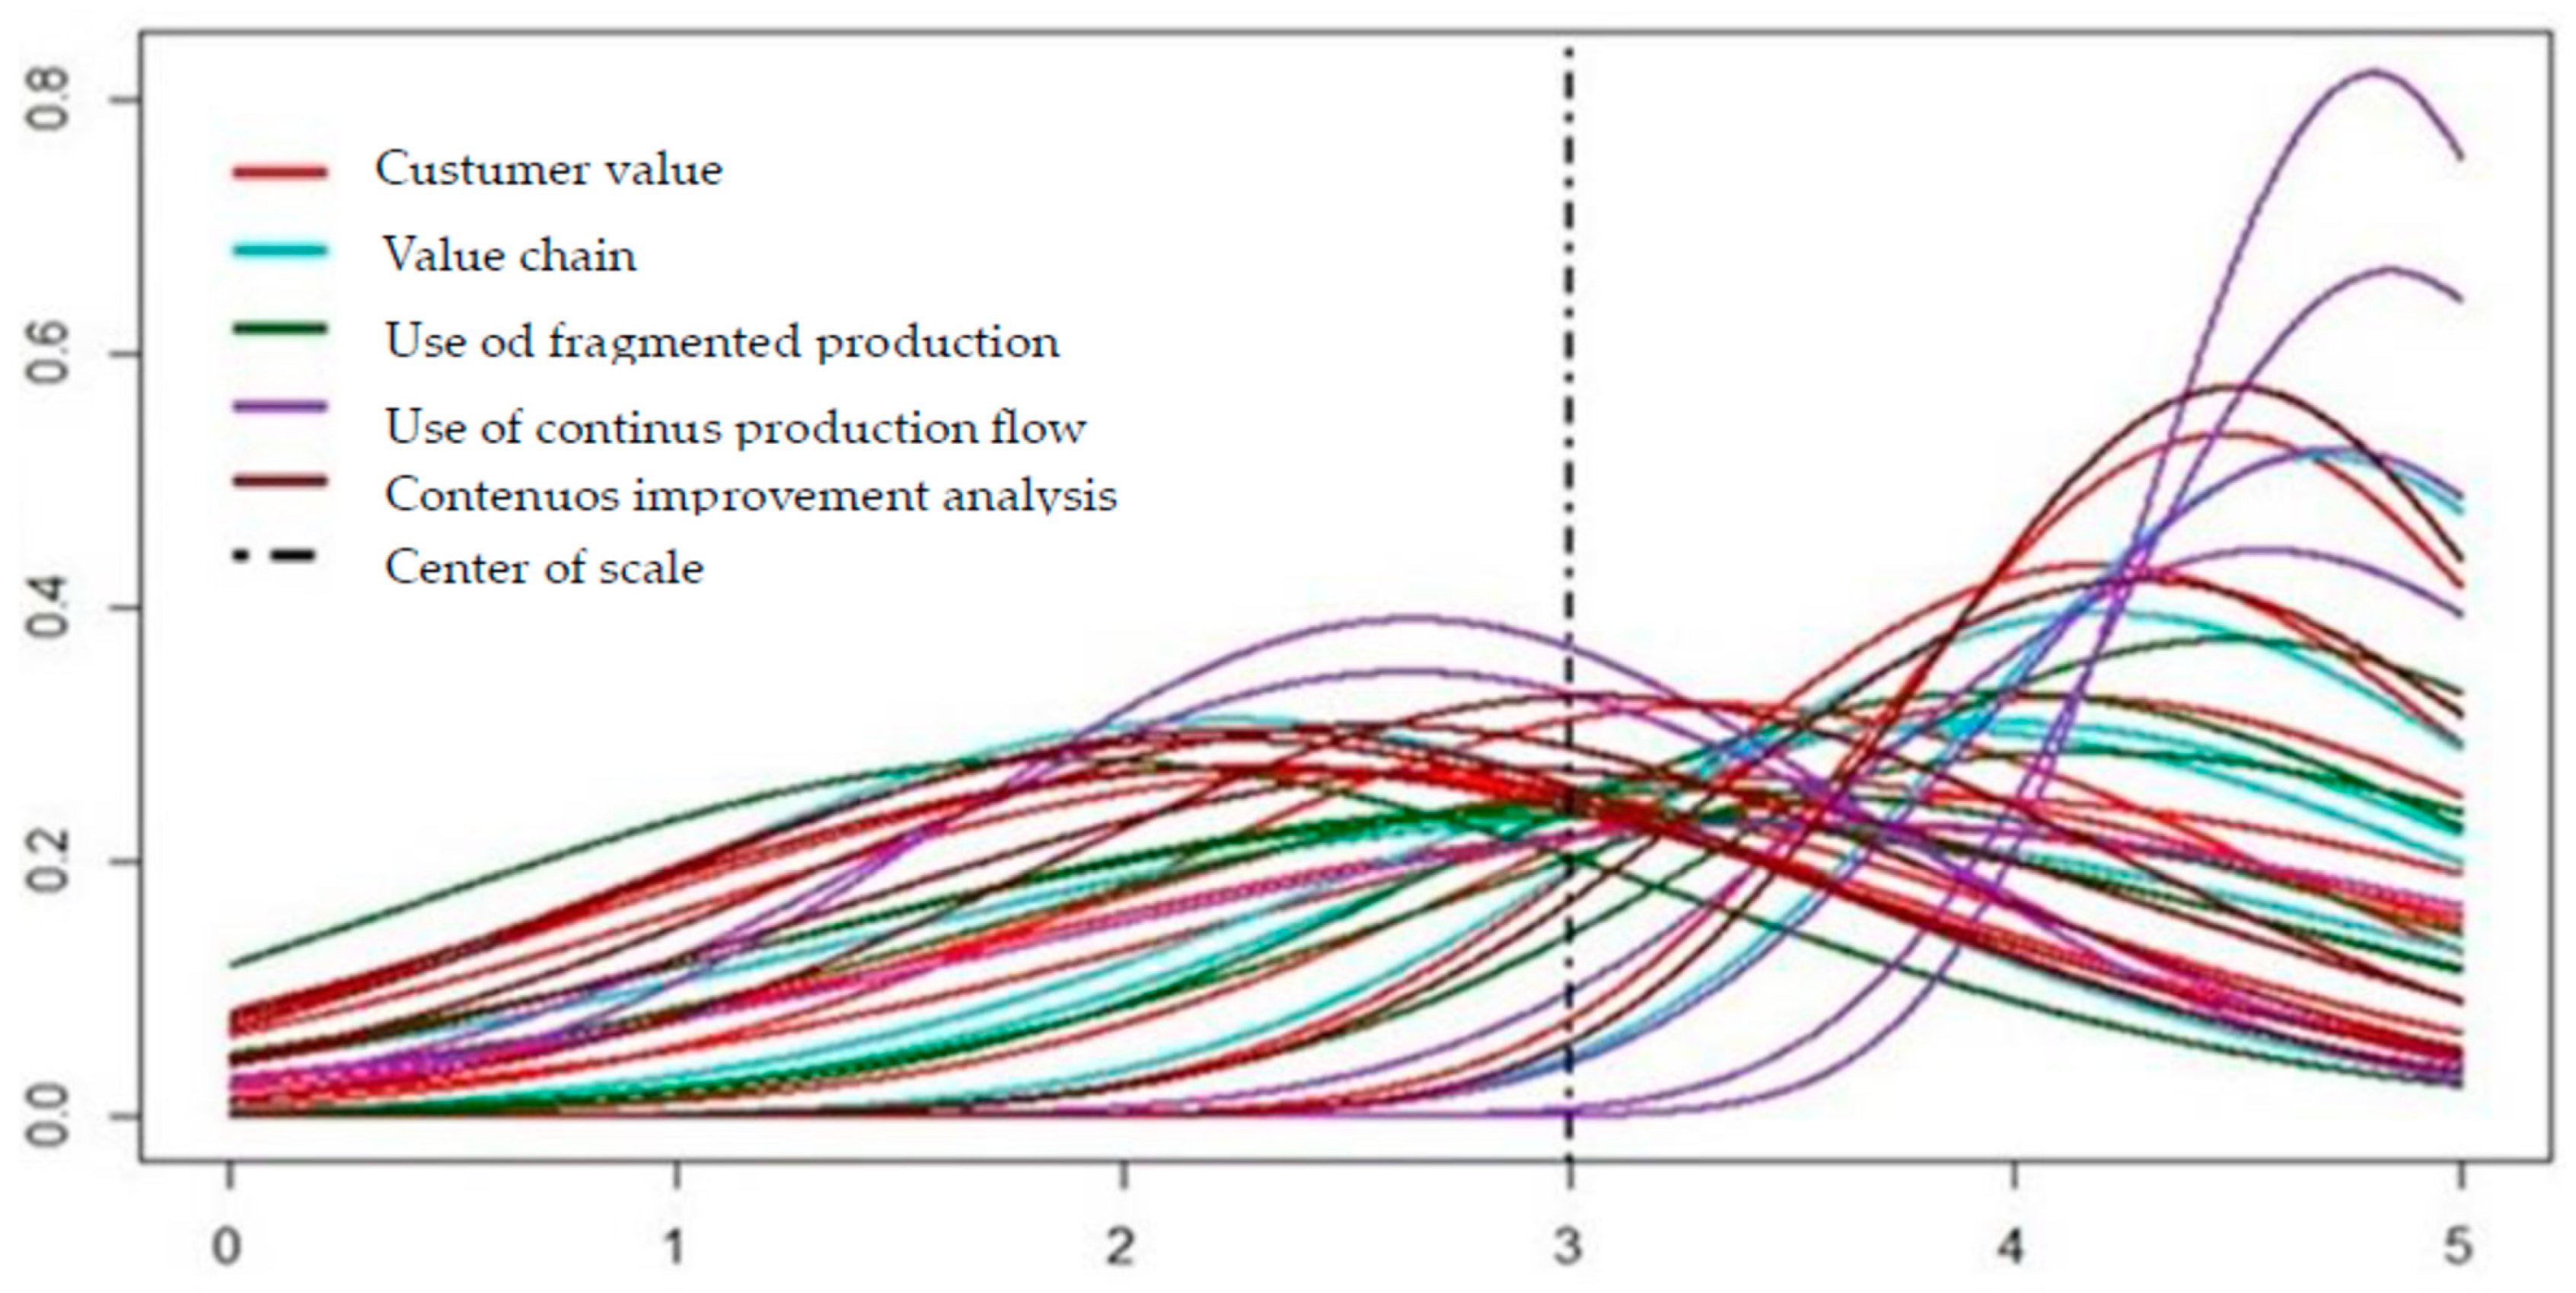
- Analysis of the probability of the responses being lower than the centre of the scale and classification of the group’s response:
- (c)
- Analysis in Table 21 of the percentages when the dimension reached 4 or more. Table 21 shows that knowledge (28.5%), use of Lean tools (10.8%), and the practice of continuous improvement (12.5%) are very low. The other four practices, namely customer value, value chain, use of pulled production, and continuous flow, gave average results between 42 and 57%, showing that, in fact, the value of maturity is very low. The median value of these four practices was affected by the big industries, which raised the numerical value.
8. Conclusions
Author Contributions
Funding
Institutional Review Board Statement
Informed Consent Statement
Data Availability Statement
Conflicts of Interest
Appendix A
Appendix A.1. Sample Characterisation
| Main Activity Branch | ||
| (A) Classification of the company as to Size | ||
| (a.1) Small | (a.2) Average | (a.3) Big |
| (B) Legal classification of the company (Ownership) | ||
| (b.1) Private | (b.2) State-owned | (b.3) Mixed |
| Company Country of Origin | ||
Appendix A.2. Instructions for Filling in the General Questions on Knowledge and Application of Principles of Lean Philosophy
- Does the company know the practices of the Lean philosophy? YES
![Applsci 14 06949 i001]() NO
NO ![Applsci 14 06949 i001]()
- Does the company apply the practices of the Lean philosophy? YES
![Applsci 14 06949 i001]() NO
NO ![Applsci 14 06949 i001]()

Appendix A.3. Instructions for Filling in the Specific Questions on the Application of the Principles of the Lean Philosophy (LP)
| 3.1. Customer Value | |||||
| Customer Value Practices | 1 | 2 | 3 | 4 | 5 |
| 3.1.1. Valuing customer needs. | |||||
| 3.1.2. Production according to customer orders. | |||||
| 3.1.3. Conducting customer satisfaction surveys. | |||||
| 3.1.4. Existence of a register of complaints. | |||||
| 3.1.5. Existence of a complaint handling procedure. | |||||
| 3.1.6. Produce based on product quality. | |||||
| 3.1.7. Compliance with the delivery deadline. | |||||
| 3.1.8. Distribution of products to customers by the company. | |||||
| 3.1.9. Holding meetings with customers. | |||||
| 3.1.10. Adjustment of prices to the customer’s purchasing power. | |||||
| 3.1.11. Availability of company and product information. | |||||
| 3.2. Value Chain | |||||
| Value chain practices | 1 | 2 | 3 | 4 | 5 |
| 3.2.1. Valuing the activities of the production process that add value | |||||
| 3.2.2. Registration of the existence of the product in stock | |||||
| 3.2.3. Calculation of product processing time | |||||
| 3.2.4. Identification of the time it takes to perform the activities | |||||
| Value chain practices | 1 | 2 | 3 | 4 | 5 |
| 3.2.5 Graphic representation of the production process | |||||
| 3.2.6. Tracking of the process from the supplier to the distribution of the product to the customer | |||||
| 3.3. Pull Production System | |||||
| Pull Production System Practices | 1 | 2 | 3 | 4 | 5 |
| 3.3.1. Produce according to customer demand | |||||
| 3.3.2. Plan production daily | |||||
| 3.3.3. Supply of raw material from the warehouse in function of needs | |||||
| 3.3.4. Levelling of production according to demand | |||||
| 3.3.5. Specific location for stock | |||||
| 3.3.6. Visual devices that identify problems in production | |||||
| 3.3.7. Production control by means of automatic systems for detecting anomalies or quality problems | |||||
| 3.4. Continuous Production Flow | |||||
| Continuous Production Flow Practices | 1 | 2 | 3 | 4 | 5 |
| 3.4.1. Interconnection of the stages of the process | |||||
| 3.4.2. Sequencing of operations | |||||
| 3.4.3. Processing per unit | |||||
| 3.4.4. Production according to plan | |||||
| 3.4.5. Organisation of the machines according to the sequence of the process | |||||
| 3.4.6. Interrupted processes | |||||
| 3.4.7. Processes without delay in carrying out activities | |||||
| 3.5. Continuous Improvement | |||||
| Continuous Improvement Practices | 1 | 2 | 3 | 4 | 5 |
| 3.5.1. Existence of programmes for monitoring, evaluation, and development of employee skills | |||||
| 3.5.2. Autonomy of employees in solving specific problems | |||||
| 3.5.3. Dissemination of evaluation and productivity results | |||||
| 3.5.4. Employee involvement in the design of the continuous improvement programme | |||||
| 3.5.5. Training of employees in matters of continuous improvement | |||||
| 3.5.6. Dissemination of production strategies to all employees of the company | |||||
| 3.5.7. Cleaning, tidiness, organisation, discipline, and safety procedures | |||||
| 3.5.8. Implementation of improvement per part or per machine | |||||
Appendix A.4. Instructions for Filling in the Questions on the Knowledge of the Tools of Lean Philosophy Practices
| Answers | ||
| Lean Philosophy Tools | YES | NO |
| 5 S | ||
| Andon | ||
| Bottleneck Analysis | ||
| Gemba | ||
| Heijunka | ||
| Hoshin Kanri | ||
| Jidoka | ||
| Kaizen | ||
| Kanban | ||
| KPI | ||
| PDCA | ||
| Poka-Yoke | ||
| SMED | ||
| VSM | ||
| JIT | ||
References
- IMF. World Economic Outlook Challenges to Steady Growth; International Monetary Fund (IMF): Washington, DC, USA, 2018; Available online: www.elibrary.imf.org (accessed on 24 June 2024).
- Benhamou, Z.A. Are all cycles alike? An empirical investigation of regional and global factors in developed and emerging economies. Int. Econ. 2018, 156, 45–60. [Google Scholar] [CrossRef]
- Da Rocha, A.; Paulo, F.; Bonfim, L.; Santos, R. Estudos Sobre a Diversificação da Economia Angolana; Centro de Estudos e Investigação Científica da UCAN: Luanda, Angola, 2016. [Google Scholar]
- Leitão, A.N. Mercado Económico em Angola. Perspectiva de Evolução; Embaixada da República de Angola em Portugal, Representação Comercial: Luanda, Angola, 2015. [Google Scholar]
- MIA. Decreto no 44/05 de 6 de Julho. Licenciamento das Atividades Industriais; Ministry of Industry of Angola (MIA): Luanda, Angola, 2017.
- Milan, G.S.; Dos Reis, Z.C.; Costa, C.A. A implementação dos conceitos lean no processo de desenvolvimento de novos produtos. Qual. Rev. Eletrônica 2015, 17, 1–14. [Google Scholar]
- MEP. Plano de Desenvolvimento Nacional 2018–2022; Ministry of Economy and Planning (MEP): Luanda, Angola, 2018.
- MFA. Discurso Proferido pela Ministra das Finanças na Apresentação da Proposta do OGE 2020 Revisto à Assembleia Nacional; Ministry of Finance of Angola: Luanda, Angola, 2017. Available online: https://www.minfin.gov.ao/portalminfin/#!/materias-de-realce/pronunciamentos (accessed on 24 June 2024).
- Fernandez, C.M.; Alves, J.; Gaspar, P.D.; Lima, T.M. Fostering Awareness on Environmentally Sustainable Technological Solutions for the Post-Harvest Food Supply Chain. Processes 2021, 9, 1611. [Google Scholar] [CrossRef]
- Liheng, W.; Hailing, T.; Kunsheng, W. Assessment of Industry Maturity Levels: Research and Practice. Chin. J. Eng. Sci. 2016, 18, 9. [Google Scholar] [CrossRef]
- Bento, G.D.S.; Tontini, G. Maturity of lean practices in brazilian manufacturing companies. Total Qual. Manag. Bus. Excell. 2019, 30 (Suppl. 1), 114–128. [Google Scholar] [CrossRef]
- CESO Development Consultants. Estudo Logística Angola; CESO Development Consultants: Lisboa, Portugal, 2016; Available online: https://www.ceso.pt/pdfs/LogisticaAngola.pdf (accessed on 24 June 2024).
- Womack, J.P.; Jones, D.T. Beyond Toyota: How to Root Out Waste and Pursue Perfectoin. Harv Bus Rev. 1996, 74, 140–151. [Google Scholar]
- Maasouman, M.A.; Demirli, K. Development of a lean maturity model for operational level planning. Int. J. Adv. Manuf. Technol. 2016, 83, 1171–1188. [Google Scholar] [CrossRef]
- Gil, A.C. Métodos e Técnicas de Pesquisa Social, 6th ed.; Atlas: São Paulo, Brazil, 2008. [Google Scholar]
- Coutinho, C. Metodologia de Investigação em Ciências Sociais e Humanas, 2nd ed.; Almedina: Coimbra, Portugal, 2018. [Google Scholar]
- Black, T. Doing Quantitative Research in the Social Sciences: An Integrated Approach to Reserch Design, Measurement and Statistics; S. Publications: London, UK, 1999. [Google Scholar]
- Pereira, A. SPSS Guia Prático de Utilização, Análise de Dados para Ciências Sociais e Psicologia, 7th ed.; L. Silabo: Lisboa, Portugal, 2008. [Google Scholar]
- Hill, M.M.; Hill, A. Investigação por Questionário, 2nd ed.; Sílabo: Lisboa, Portugal, 2016. [Google Scholar]
- Prodanov, C.C.; de Freitas, E.C. Metodologia do Trabalho Científico: Métodos e Técnicas da Pesquisa e do Trabalho Acadêmico, 6th ed.; E. Feevale: Rio Grande do Sul, Brazil, 2013. [Google Scholar]
- Guzmán, G.M.; Del Toro Raymundo, J.; Morejón, M.M. Are Lean practices the solution to improve business performance in Mexico’s manufacturing industry? Multidiscip. Bus. Rev. 2023, 17, 33–48. [Google Scholar]
- Lima, J.; Da, C.; Ricardo, J.; Da, C. Production management and value flow: Systematic review of the benefits of VSM for the red ceramic industry. Rev. Foco 2024, 17, 1–32. [Google Scholar]
- Martínez, A.; Hernández-Gracia, T.J.; Duana, D.; Martínez, E. Proceso productivo aplicando el Value Stream Mapping en la industria del plástico. Rev. Venez. Gerenc. 2024, 29, 568–580. [Google Scholar] [CrossRef]
- Sajjad, A.; Ahmad, W.; Hussain, S.; Chuddher, B.A.; Sajid, M.; Jahanjaib, M.; Ali, M.K.; Jaward, M. Assessment by lean modified manufacturing maturity model for industry 4.0: A Case Study of Pakistan’s Manufacturing Sector. IEEE Trans. Eng. Manag. 2024, 71, 6420–6434. [Google Scholar] [CrossRef]
- De Paula e Silva, M.H.; Mergulhão, R.C.; Vieira, J.G.V.; Pampanelli, A.B.; Salvador, R.; Silva, D.A.L. Modelo de Maturidade Lean-Circular (LCMM) para Autoavaliação de Empresas em Termos de Pensamento de Processo, Produto e Ciclo de Vida; Elsvier: Amsterdam, The Netherlands, 2024; Volume 173, pp. 172–183. [Google Scholar]
- Gatell, I.S.; Avella, L. A maturity model for assessing digital green Lean leadership and culture implementation in manufacturing companies. Total Qual. Manag. 2024, 35, 860–897. [Google Scholar] [CrossRef]
- Ruiz-Benitez, R.; López, C.; Real, J.C. Environmental benefits of lean, green and resilient supply chain management: The case of the aerospace sector. J. Clean. Prod. 2017, 167, 850–862. [Google Scholar] [CrossRef]
- Teixeira, E.S.M.; Melim, J.M. Proposta de cálculo de graus de maturidade da cultura lean. In Proceedings of the IV Congresso de Sistemas Lean, Porto Alegre, Brazil, 23–24 May 2014. [Google Scholar]
- Özdagoglu, A.; Rebis, S. Applications of kaizen and cycle time reduction as lean production techniques in a semi-flexible PVC. J. Manag. Econ. Bus. 2016, 12, 25–38. [Google Scholar]
- Suárez-Barraza, M.F.; Ramis-Pujol, J.; Estrada-Robles, M. Applying Gemba-Kaizen in a multinational food company: A process innovation framework. Int. J. Qual. Serv. Sci. 2012, 4, 27–50. [Google Scholar]
- Pakdil, F.; Leonard, K.M. The effect of organizational culture on implementing and sustaining lean processes. J. Manuf. Technol. Manag. 2015, 26, 725–743. [Google Scholar] [CrossRef]
- Pinto, J.P. Pensamento Lean a Filosofia das Organizações Vencedoras, 6th ed.; Lidel: Lisboa, Portugal, 2014. [Google Scholar]
- Singh, S.; Kumar, K. Review of literature of lean construction and lean tools using systematic literature review technique (2008–2018). Ain Shams Eng. J. 2020, 11, 465–471. [Google Scholar] [CrossRef]
- Susilawati, A.; Tan, J.; Bell, D.; Sarwar, M. Fuzzy logic based method to measure degree of lean activity in manufacturing industry. J. Manuf. Syst. 2015, 34, 1–11. [Google Scholar] [CrossRef]
- Massachusetts Institute of Technology. LAI Enterprise Self-Assessment Tool (LESAT), Version 2; Massachusetts Institute of Technology: Cambridge, MA, USA, 2012. [Google Scholar]
- Al-Ashaab, A.; Golob, M.; Urrutia, U.A.; Gourdin, M.; Petritsch, C.; Summers, M.; El-Nounu, A. Development and application of lean product development performance measurement tool. Int. J. Comput. Integr. Manuf. 2016, 29, 342–354. [Google Scholar] [CrossRef]
- Ramos, K. Sector Industrial é Constituído por 700 Fábricas em Todo o País; Jornal de Angola: Luanda, Angola, 2017. [Google Scholar]
- Womack, J.P.; Jones, D.T. Lean thinking−banish waste and create wealth in your corporation. J. Oper. Res. Soc. 1997, 48, 1148. [Google Scholar] [CrossRef]


| Step 1: Starting Aspects | ||
| Matter | Assessment of Lean Maturity Levels in Industries of the Luanda Region, Angola | |
| Objective | To make a diagnosis of the state of application of LP practices in companies operating in the industrial fabric of Angola. | |
| Instructions | (1) All data collected will be treated with total anonymity and confidentiality in aggregate form and will only be used for this study. | |
| (2) Estimated time for completion is 15 min. | ||
| (3) The questions should reflect your personal perception and opinion, so there are no right or wrong answers. | ||
| Step 2: Sample characterisation | ||
| Objective | Characterise the requested companies in the aspects with the greatest impact on the results. | |
| Instruction | The information requested in the following table aims to characterise the sample of the population participating in this study. Please fill in the box below as per the items requested. | |
| Elements | (1) Main branch of activity. | |
| (2) Classification of the company as to size. | ||
| (3) Legal classification of the company. | ||
| Step 3: General questions about the knowledge and application of LP practices | ||
| Objective | Verify knowledge of LP practices and their application in the company. | |
| Instruction | The questions that follow are to verify LP’s practices in this company. Mark with “X” the answers that best suit your opinion. | |
| Elements |
| |
| ||
| Step 4: Specific questions on following the LP principles | ||
| Objective | Evaluate your company’s compliance with the following principles. | |
| Instruction | Evaluate your company’s adherence to the following principles, knowing that the number 1 (one) means “not followed” and the number 5, “completely followed”. Indicate your answer with an “X.” | |
| Description of LP Principles | 3.1. Customer Value | 1.1. Valuing customer needs. |
| 1.2. Production according to customer orders. | ||
| 1.3. Conducting customer satisfaction surveys. | ||
| 1.4. Existence of a register of complaints. | ||
| 1.5. Existence of a complaint handling procedure;. | ||
| 1.6. Produce giving priority to product quality. | ||
| 1.7. Compliance with the delivery deadline. | ||
| 1.8. Distribution of products to customers by the company. | ||
| 1.9. Holding meetings with customers. | ||
| 1.10. Adjustment of prices to the customer’s purchasing power. | ||
| 1.11. Availability of company and product information. | ||
| 3.2. Chain Value | 2.1. Valuing the activities of the production process that add value. | |
| 2.2. Registration of the existence of the product in stock. | ||
| 2.3. Calculation of the product’s processing time. | ||
| 2.4. Identification of the time it takes to carry out the activities. | ||
| 2.5. Graphic representation of the production process. | ||
| 2.6. Tracking of the process from the supplier to the distribution of the product to the customer. | ||
| 3.3. Pull System | 3.1. Produce according to customer demand. | |
| 3.2. Daily production plan. | ||
| 3.3. Supply of raw material to the warehouse according to needs. | ||
| 3.4. Levelling of production according to demand. | ||
| 3.5. Specific location for stock. | ||
| 3.6. Visual devices that identify problems in production. | ||
| 3.7. Production control using automatic systems for detecting anomalies or quality problems. | ||
| 3.4. Continuous Production Flow | 4.1. Interconnection of the stages of the process. | |
| 4.2. Sequencing of operations. | ||
| 4.3. Processing per unit. | ||
| 4.4. Production according to plan. | ||
| 4.5. Organisation of the machines according to the sequence of the process. | ||
| 4.6. Uninterrupted processes. | ||
| 4.7. Processes without delay in carrying out activities. | ||
| 3.5. Continuous Improvement | 5.1. Existence of programs for monitoring, evaluation, and development of employees’ skills. | |
| 5.2. Autonomy of officials in solving personal problems. | ||
| 5.3. Dissemination of evaluation and productivity results. | ||
| 5.4. Involvement of employees in the preparation of the continuous improvement program. | ||
| 5.5. Training of officials in continuous improvements. | ||
| 5.6. Dissemination of production strategies to all employees of the company. | ||
| 5.7. Cleaning, tidiness, organisation, discipline, and safety procedures. | ||
| 5.8. Implementation of improvement per part or machine. | ||
| Step 5: Questions about knowledge of LP tools | ||
| Objective | Verify knowledge of LP practices in companies. | |
| Instruction | The questions that follow are to verify LP’s practices in this company. Mark with “X” the answer that best suits your opinion. | |
| LP tools | 5S, JIT, Kanban, Bottleneck Analysis, Jidoka, Kaizen, Poka-Yoke, KPI, SMED, Gemba, Heijunka, VSM, Hoshin Kanri and Andon | |
| Step 6: Question about the organisational model with a continuous production system | ||
| Objective | To verify if the company uses the production system with continuous flow. | |
| Instruction | Answer with “YES” if the answer about the production system used is with continuous production flow. | |
| Elements | Continuous flow production system. | |
| Principles of the Lean Philosophy (PLP) | |||||||||
|---|---|---|---|---|---|---|---|---|---|
| Dimensions | Customer Value (CV) | Dimensions | Value Chain (VC) | Dimensions | Pull Production System (PPS) | Dimensions | Continuous Production Flow (CPF) | Dimensions | Continuous Improvement (CI) |
| 1.1. | 0.458 | 2.1. | 0.485 | 3.1. | 0.592 | 4.1. | 0.505 | 5.1. | 0.730 |
| 1.2. | 0.570 | 2.2. | 0.364 | 3.2. | 0.487 | 4.2. | 0.580 | 5.2. | 0.486 |
| 1.3. | 0.430 | 2.3. | 0.521 | 3.3. | 0.489 | 4.3. | 0.543 | 5.3. | 0.715 |
| 1.4. | 0.512 | 2.4. | −0.638 | 3.4. | 0.501 | 4.4. | 0.423 | 5.4. | 0.730 |
| 1.5. | 0.516 | 2.5. | 0.644 | 3.5. | 0.475 | 4.5. | 0.456 | 5.5. | 0.640 |
| 1.6. | 0.559 | 2.6. | 0.583 | 3.6. | 0.405 | 4.6. | 0.448 | 5.6. | 0.593 |
| 1.7. | 0.432 | 3.7. | 0.624 | 5.7. | 0.424 | ||||
| 1.8. | 0.558 | 5.8. | −0.463 | ||||||
| 1.9. | 0.614 | ||||||||
| 1.10. | 0.448 | ||||||||
| 1.11. | 0.542 | ||||||||
| Cronbach’s Alpha | Cronbach’s Alpha Based on Standardised Items | N of Items |
|---|---|---|
| 0.921 | 0.923 | 49 |
| Criteria | Description | Justification |
|---|---|---|
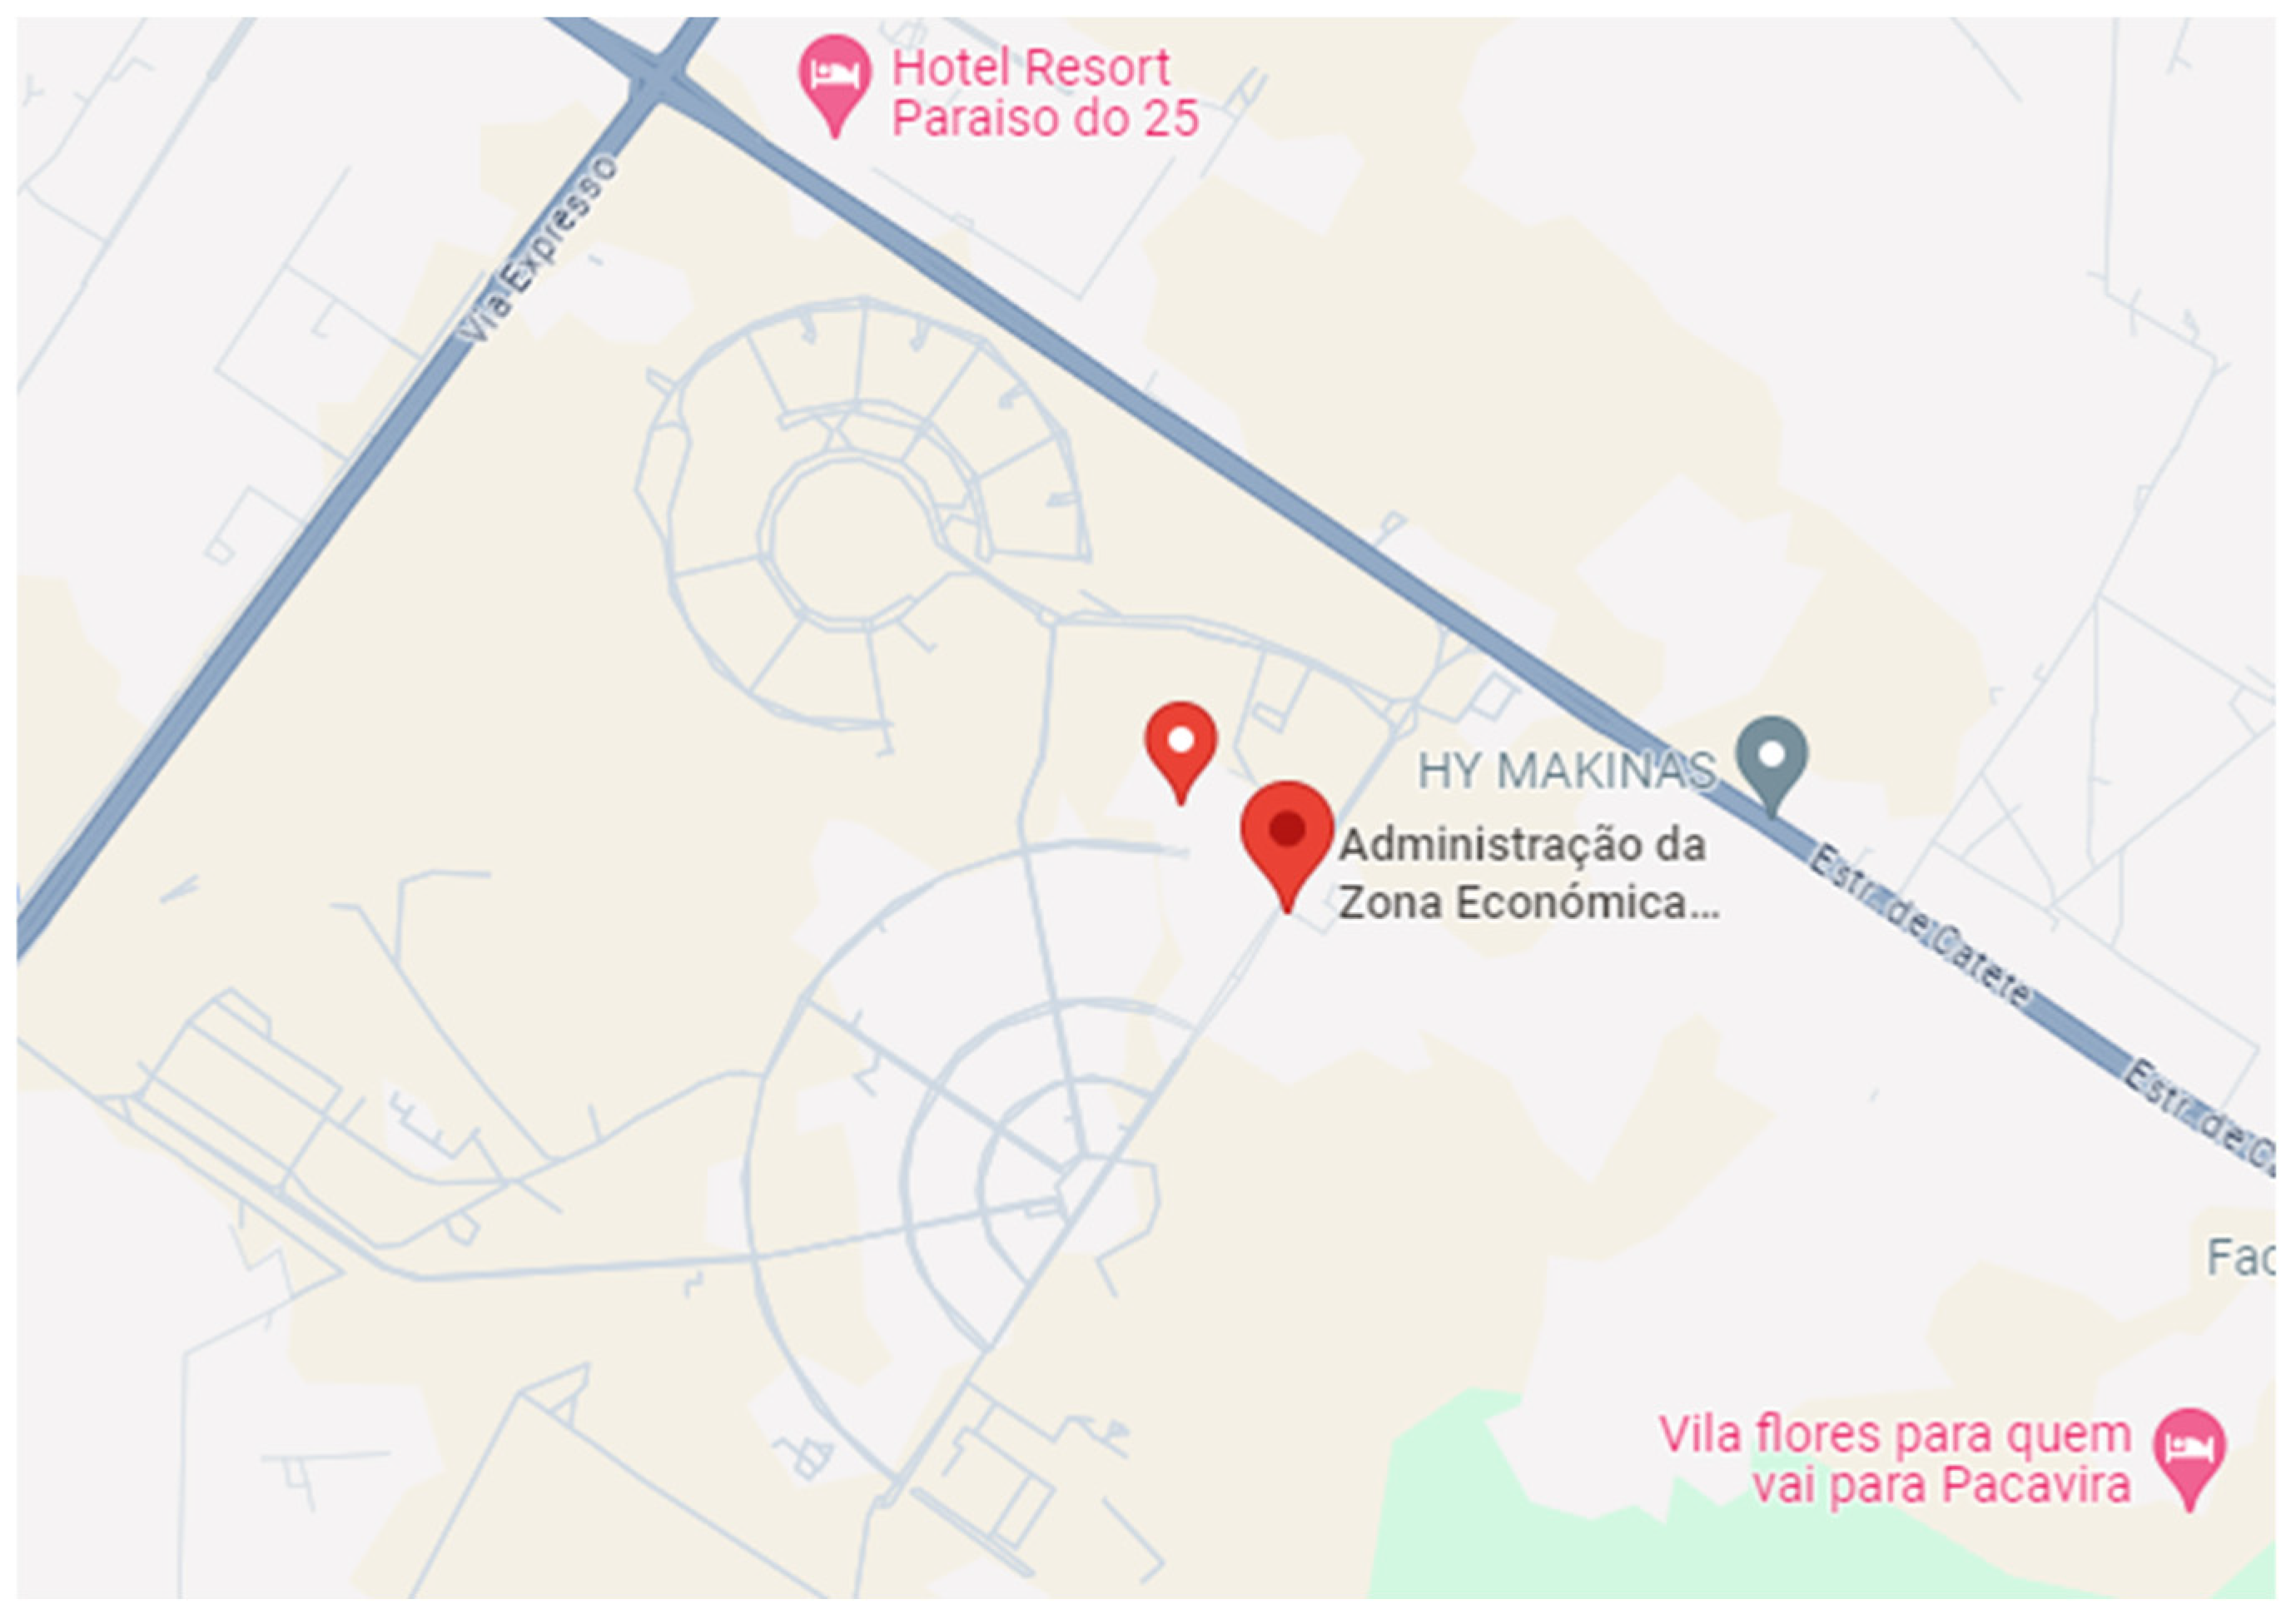
| Local | Special economic zone, Viana industrial pole | Geographical location, organisation of space, centralised management direction, proximity to factories. |
| Questioned | Directors and/or deputy directors of the production area | Knowledge and experience of the activities carried out. |
| Timetable | Morning (9:00–11:00 a.m.) | According to the availability of the respondents. |
| Instrument | Questionnaire with closed questions | Suitable for a sample of 87 companies and the type of investigation. |
| Verification of clarity and seriousness in the data collection process | Explanatory method | Initial meetings with the company’s management to clarify the objectives of the research, presentation of the documentation of guidance for carrying out the research, and identification of the researcher. |
| Questionnaire application | Data collection | Face-to-face completion after careful reading of the questionnaire and clarification of doubts. |
| N.er | Industrial Sector | N.er | Industrial Sector | N.er | Industrial Sector |
|---|---|---|---|---|---|
| 1 | Vegetable oil plant | 37 | Pipes, rails, and profiles | 73 | Electrical materials and equipment |
| 2 | Construction material | 38 | Articles of synthetic fibres | 74 | Cement |
| 3 | Medical gas producers | 39 | Plastic tubes | 75 | Pharmacy products |
| 4 | Miscellaneous products | 40 | Tubes | 76 | Bottled and bulk LPG gas |
| 5 | Miscellaneous mattresses | 41 | Tanks | 77 | Chemicals |
| 6 | Construction | 42 | Electroplating industrial unit | 78 | Plastic |
| 7 | Building material factory | 43 | Chemical products | 79 | Drinks |
| 8 | Bottling of water and juice | 44 | Concrete | 80 | Food industry |
| 9 | Fiber optic cables | 45 | Chemicals | 81 | Blocks and bricks |
| 10 | Metalworking | 46 | Plates | 82 | Wood processing |
| 11 | Plastic recycling | 47 | Construction | 83 | Soap factory |
| 12 | Pasta kiamo | 48 | Furniture industry | 84 | Marble and granite |
| 13 | Furnishings | 49 | Wood material | 85 | Vehicle maintenance consumables equipment |
| 14 | Lubricants | 50 | Paints and varnishes | 86 | Domestic paper products |
| 15 | Blocks | 51 | Plastics production | 87 | Prefabricated buildings |
| 16 | Blocks and cement | 52 | Hardware | 88 | Kitchen, school, and office furniture design |
| 17 | Manufacture of water pumps | 53 | Construction | 89 | Plastic |
| 18 | Drinks | 54 | Metalworking | 90 | Gas |
| 19 | Wines and waiters | 55 | Printing industry | 91 | Radiators |
| 20 | Construction and real estate | 56 | Electrical materials industry | 92 | Glass and crystals |
| 21 | Construction | 57 | Correction of automotive parts to produce street furniture | 93 | False ceilings |
| 22 | Cement and blocks | 58 | Vinegar, sauces, and dressings | 94 | Bakery and pastry shop |
| 23 | Rolling parts and equipment | 59 | Chemicals | 95 | Wood shredder machines |
| 24 | Automobile commercialisation | 60 | Detergents | 96 | Metal tiles |
| 25 | Automobile assembly industry | 61 | Cement glue | 97 | Paints and chemicals |
| 26 | Construction | 62 | Satellite dishes, antennas, and furniture | 98 | Paints |
| 27 | Bridges | 63 | Uniforms | 99 | Paints |
| 28 | Tires | 64 | Oil industry | 100 | Paints |
| 29 | Metalwork and metalworking | 65 | Ink | 101 | Plastic industry |
| 30 | Plates | 66 | Mattresses | 102 | Systems for aluminium frames |
| 31 | Plastic bag recycling | 67 | Compound feed | 103 | Drinks |
| 32 | Beverage | 68 | Granite, limestone, marble, and slate | 104 | Metallurgical |
| 33 | Beverage | 69 | Cement | 105 | Fences |
| 34 | Aluminium and iron lacquering | 70 | Pipes, seals, and wires | 106 | Pipes, seals, and wires |
| 35 | Manufacture of building materials and industrial buildings | 71 | Agricultural irrigation pivots | 107 | Tractor and bus assemblies |
| 36 | Machinery and articles for the food industry | 72 | Production of plastic utensils | 108 | Block and construction material |
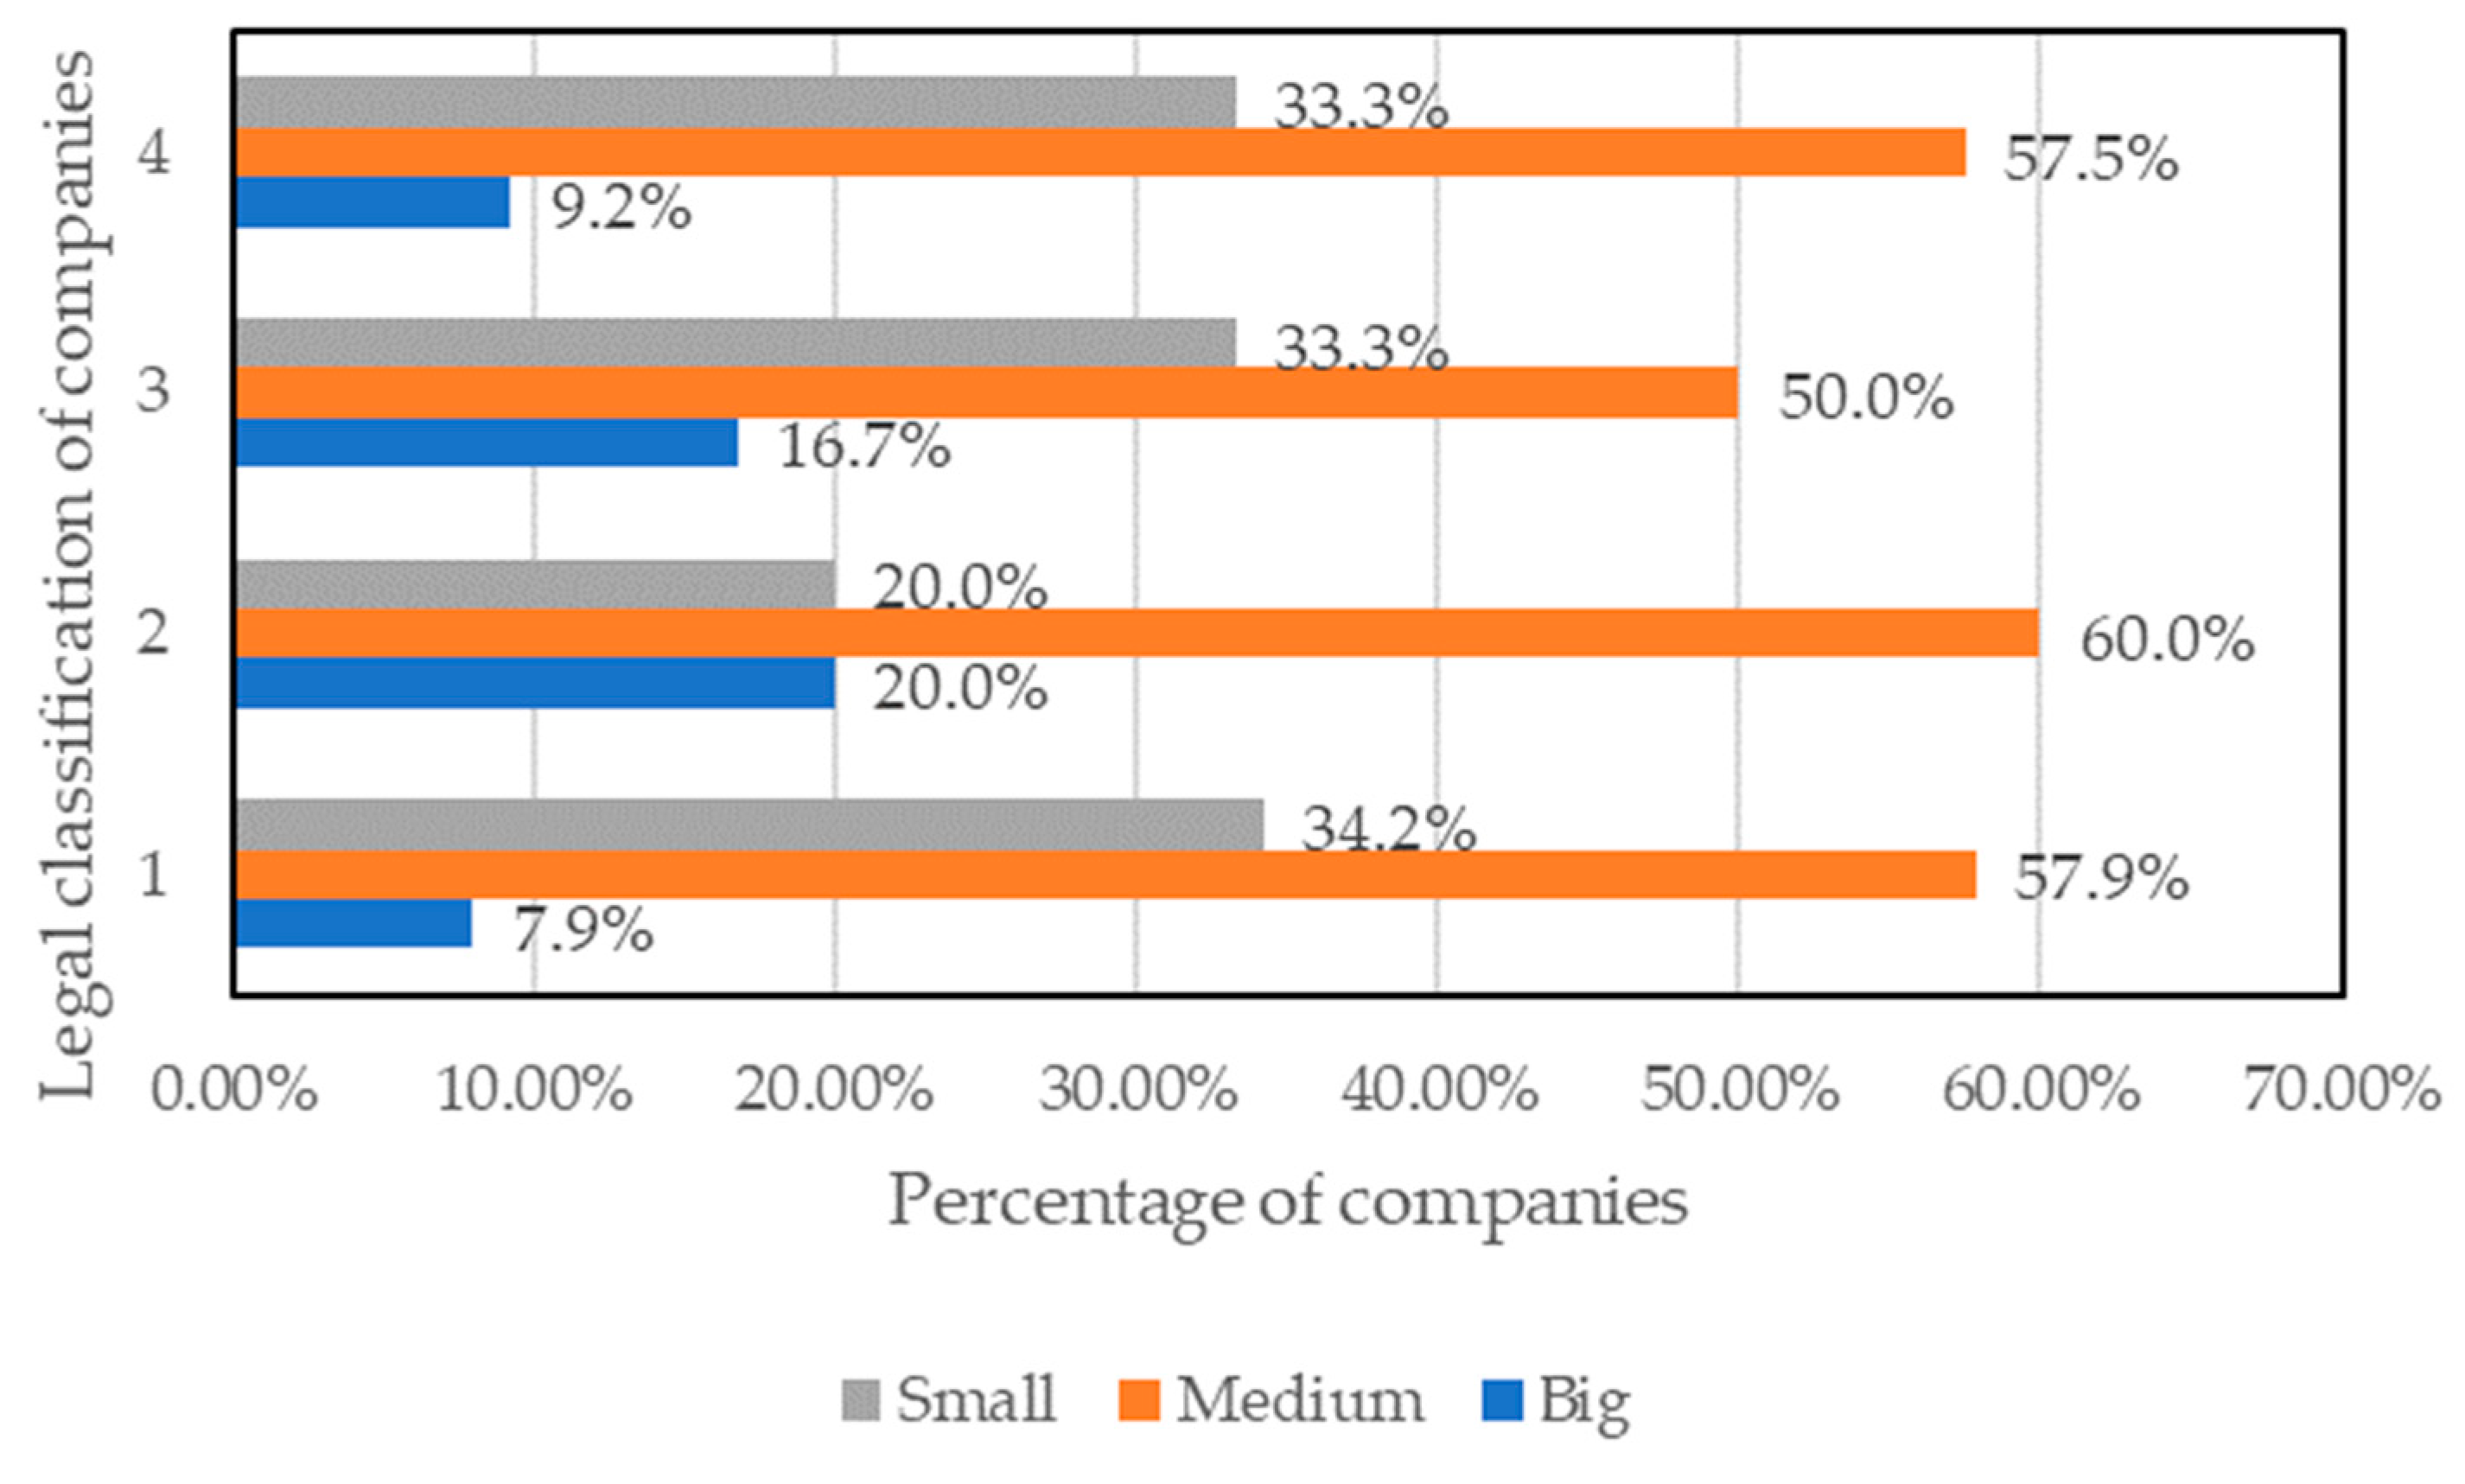
| Rating the Company by Size | Legal Classification of the Company | Total | ||
|---|---|---|---|---|
| Private | Public | Mixed | ||
| Small | 6 | 1 | 1 | 8 |
| 7.9% | 20.0% | 16.7% | 9.2% | |
| Average | 44 | 3 | 3 | 50 |
| 57.9% | 60.0% | 50.0% | 57.5% | |
| large | 26 | 1 | 2 | 29 |
| 34.2% | 20.0% | 33.3% | 33.3% | |
| Total | 76 | 5 | 6 | 87 |
| 100.0% | ||||
| Dimensions | 3 Clusters |
|---|---|
| 1:1 | 1 |
| 2:2 | 2 |
| 3:3 | 3 |
| 4:4 | 1 |
| 5:5 | 2 |
| 6:6 | 1 |
| 7:7 | 1 |
| 8:8 | 2 |
| 9:9 | 3 |
| 10:10 | 2 |
| 11:11 | 1 |
| Dimensions | 3 Clusters |
|---|---|
| 1:1 | 1 |
| 2:2 | 2 |
| 3:3 | 1 |
| 4:4 | 3 |
| 5:5 | 1 |
| 6:6 | 1 |
| Dimensions | 3 Clusters |
|---|---|
| 1:1 | 1 |
| 2:2 | 2 |
| 3:3 | 3 |
| 4:4 | 1 |
| 5:5 | 1 |
| 6:6 | 2 |
| 7:7 | 2 |
| Dimensions | 3 Clusters |
|---|---|
| 1:1 | 1 |
| 2:2 | 1 |
| 3:3 | 2 |
| 4:4 | 1 |
| 5:5 | 1 |
| 6:6 | 3 |
| 7:7 | 3 |
| Dimensions | 3 Clusters |
|---|---|
| 1:1 | 1 |
| 2:2 | 1 |
| 3:3 | 2 |
| 4:4 | 2 |
| 5:5 | 2 |
| 6:6 | 1 |
| 7:7 | 3 |
| 8:8 | 1 |
| Tools | Description |
|---|---|
| 5S | These are vital work environment practices for visual management, cleanliness, and organisation: Seiri: organisation, separating the necessary from the unnecessary; Seiton: storage, putting everything in its place; Seiso: clean and care for the work environment; Seiketsu: normalisation, making the work environment healthy; Shitsuke: self-discipline, standardise the application of previous S. |
| JIT | It consists of producing, only, what is necessary at the necessary time, avoiding any kind of waste. |
| Kanban | Visual control of production and materials is more used where there is pulled production, which authorises instructions for production or product withdrawals. |
| Bottleneck Analysis | It is a technique used to identify and locate the bottleneck in the production process. |
| Jidoka | It makes it possible to separate the workers from the machine operation and offers a better visibility of anomalies. |
| Kaizen | It is a process of continuous improvement that can be applied in any activity, to eliminate or reduce waste, creating more value through the workers, processes, time, and technology [29]. |
| POKA– YOKE | Protection mechanism in the manufacturing process that helps to avoid/prevent human errors. |
| KPI | “Key performance indicators” are goals and objectives seen as key performance indicators that guide resources in executing the strategy [29]. |
| SMED | Single Minute Exchange of Die, in approximate translation “quick tool change”, is used in the industry to reduce the time of the setup process (preparation of machines, equipment, and production lines). |
| Gemba | It is a tool that aims to get closer to the process [30]. |
| Heijunka | Relates to grade production and aims to seek the stability of the process, reduce the quantity of stock, reduce costs, and decrease labour and the production lead time [31]. |
| VSM | Used for mapping process activities by drawing a flowchart. |
| Hoshin Kanri | It is the method of management, planning, or even establishing the company’s policy [32]. |
| Andon | It is a way of sight management that informs the status of production to the entire organisation, displaying on boards, and lamps, audible or visual indications of anomalies and allows for corrective actions to be taken immediately [33]. |
| Section I—Enterprise Transformation/Leadership | Section II—Lifecycle Processes |
|
|
| Section III—Enabling Infrastructure | |
|
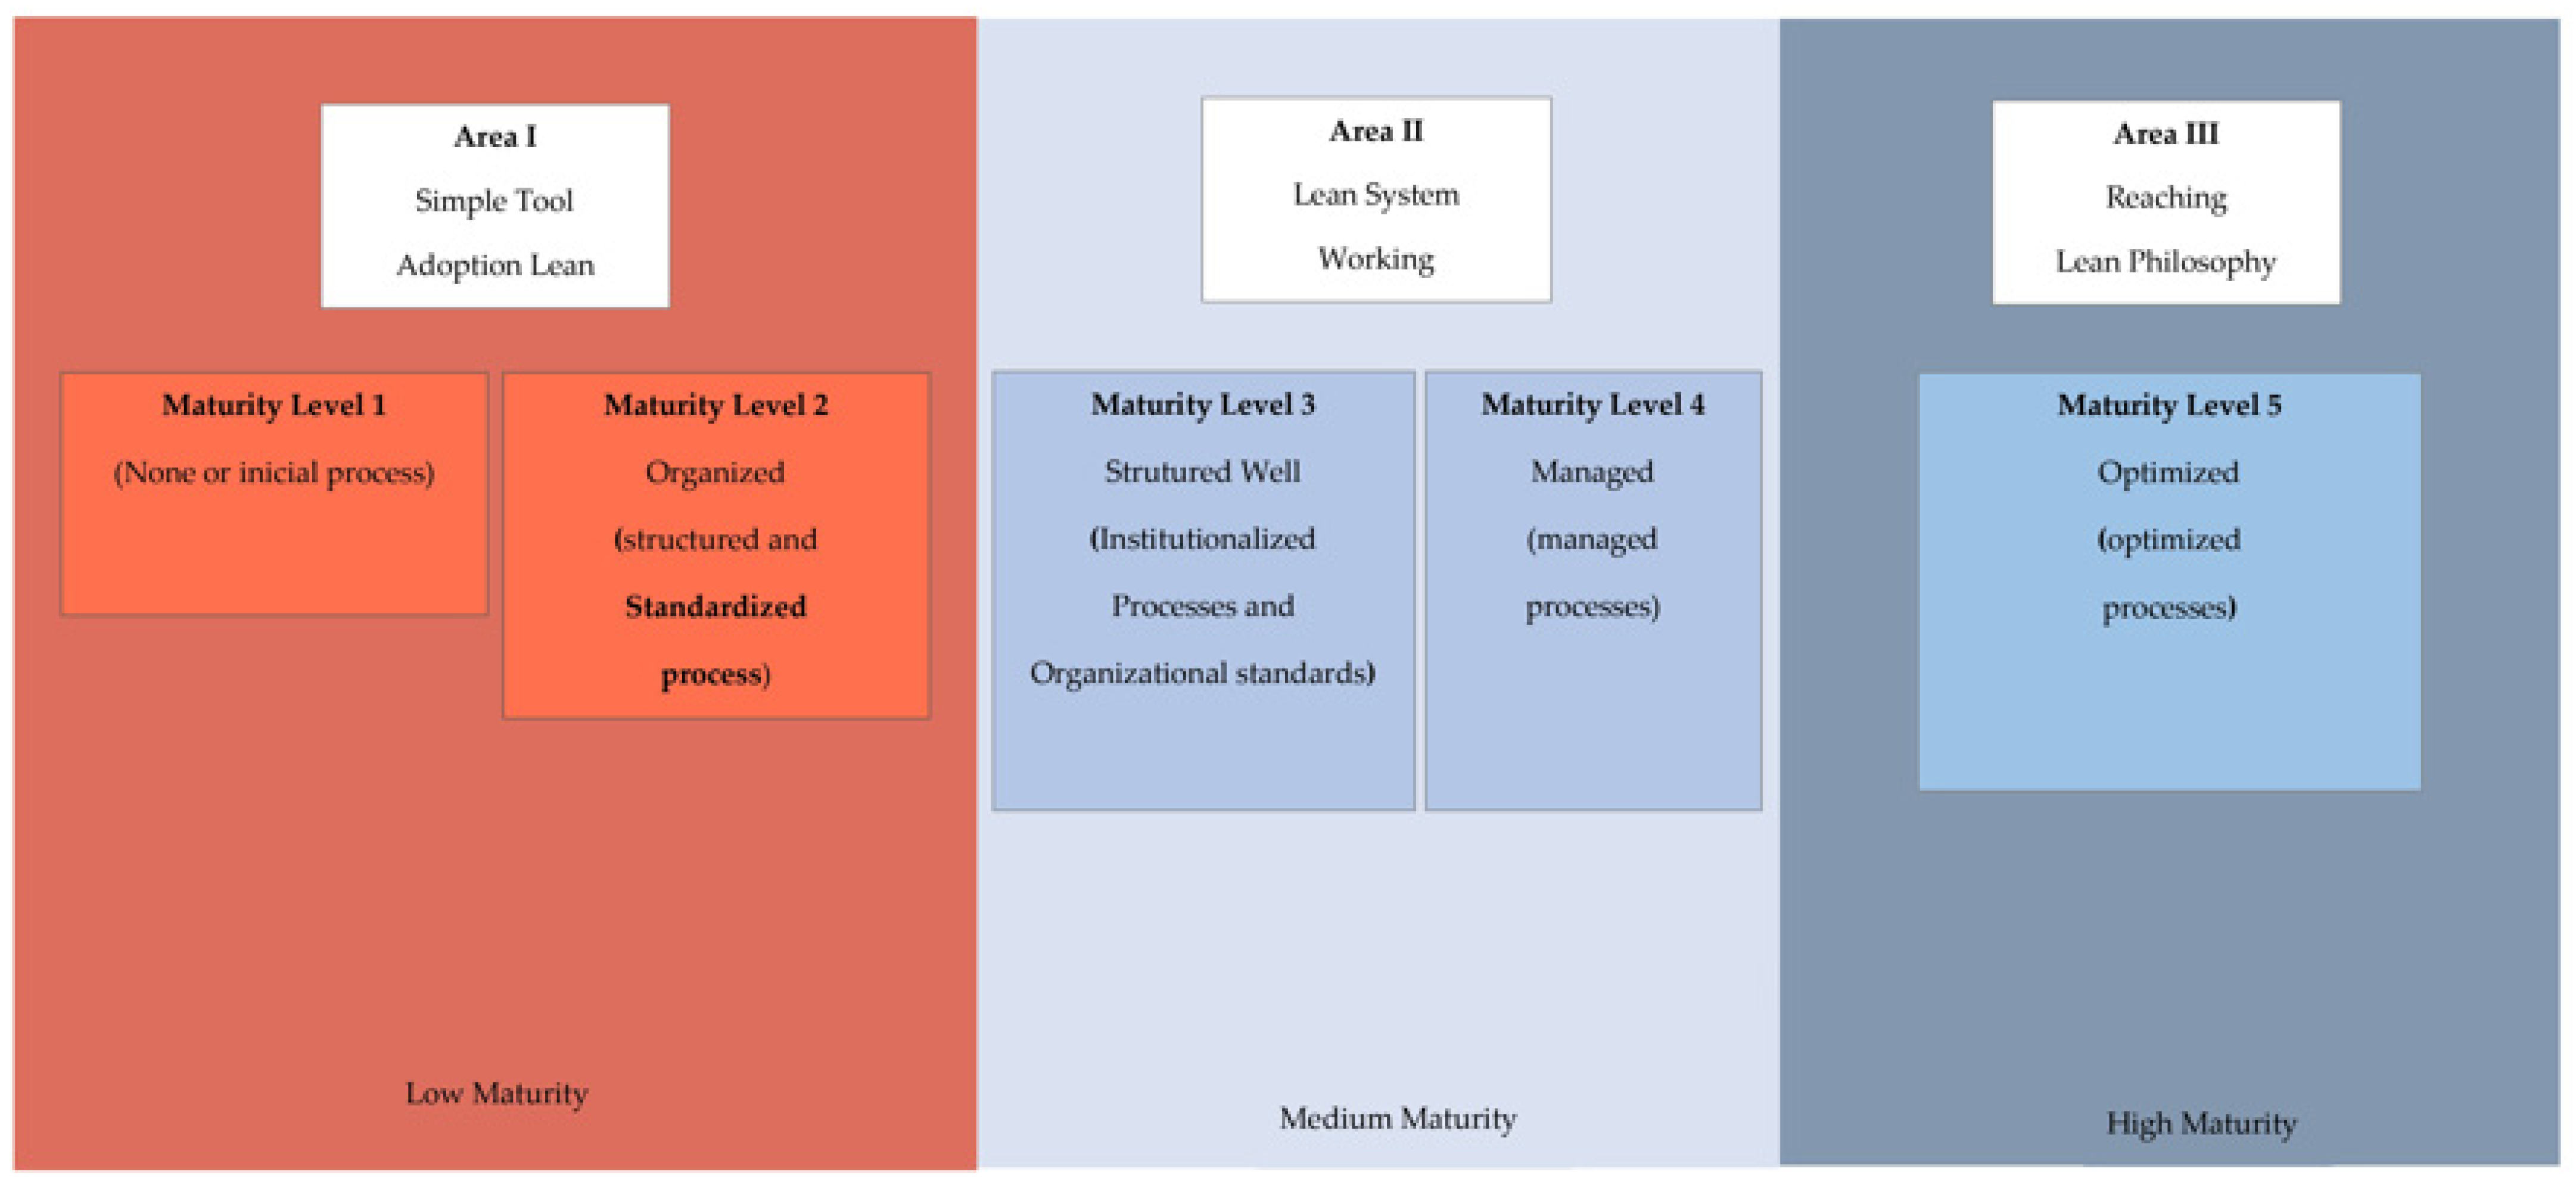
| Levels | Designation | Detailed Features of Each Lean Maturity Level |
|---|---|---|
| 1 | Informal (None or initial process) (Area I—Figure 2) |
|
| 2 | Organised (structured and standardised process) (Area I—Figure 2) |
|
| 3 | Well structured (institutionalised processes and organisational standards) (Area II—Figure 2) |
|
| 4 | Managed (managed processes) (Area II—Figure 2) |
|
| 5 | Optimised (optimised processes) (Area III—Figure 2) |
|
| Program | Description |
|---|---|
| PROFIR | It is a program to promote small rural industries, which aims to install small factory units to produce manioc (corn and bombó) in the municipalities; animal feed; general electromechanical workshops; etc. |
| PROPÃO | Bakery and pastry program. It is a program aimed at improving the competitiveness of the Angolan bakery and pastry sector. |
| RNPDI | National network of industrial development hubs, which consists of planning, coordinating activities aimed at the installation of hubs at the level of Angola, and their subsequent management. |
| PLP-CV Dimensions | Mean | Std. Deviation |
|---|---|---|
| 1.1. Valuing customer needs. | 4.49 | 0.697 |
| 1.2. Production according to customer orders. | 3.49 | 1.731 |
| 1.3. Conducting customer satisfaction surveys. | 2.33 | 1.452 |
| 1.4. Existence of registration of complaints. | 3.82 | 1.596 |
| 1.5. Existence of complaints handling procedure. | 3.39 | 1.505 |
| 1.6. Produce based on product quality. | 4.47 | 0.745 |
| 1.7. Compliance with delivery deadline. | 4.18 | 0.922 |
| 1.8. Distribution of products to customers by the company. | 3.15 | 1.709 |
| 1.9. Meetings with customers. | 2.51 | 1.478 |
| 1.10. Adjustment of prices to the customer’s purchasing power. | 3.33 | 1.236 |
| 1.11. Availability of company and product information. | 4.11 | 1.214 |
| Dimension of PLP-VC | Mean | Std. Deviation |
|---|---|---|
| 2.1. Valuing activities that add value. | 4.20 | 1.010 |
| 2.2. Record of existence of the product in stock. | 4.68 | 0.770 |
| 2.3. Calculation of product processing time. | 3.94 | 1.288 |
| 2.4. Identification of the delay time in the execution of activities. | 2.23 | 1.282 |
| 2.5. Graphical representation of the production process. | 3.15 | 1.702 |
| 2.6. Process tracking from the supplier to product distribution to the customer. | 3.79 | 1.313 |
| PLP-PPS Dimensions | Mean | Std. Deviation |
|---|---|---|
| 3.1. Produce according to customer demand. | 4.16 | 1.397 |
| 3.2. Daily production planning. | 2.99 | 1.688 |
| 3.3. Supply of raw material warehouse according to demand. | 1.86 | 1.424 |
| 3.4. Level production according to demand. | 3.95 | 1.200 |
| 3.5. Specific stock location. | 4.48 | 1.066 |
| 3.6. Visual devices that identify problems in production. | 3.32 | 1.559 |
| 3.7. Production control through anomaly detection systems. | 2.98 | 1.649 |
| PLP-CPF Dimensions | Mean | Std. Deviation |
|---|---|---|
| 4.1. Interconnection of process steps. | 4.80 | 0.487 |
| 4.2. Sequencing of operations. | 4.71 | 0.762 |
| 4.3. Unit processing. | 3.58 | 1.729 |
| 4.4. Production according to plan. | 4.56 | 0.898 |
| 4.5. Organisation of machines according to the process sequence. | 4.84 | 0.601 |
| 4.6. Processes without interruption during production. | 2.65 | 1.022 |
| 4.7. Processes without delay in carrying out activities. | 2.64 | 1.144 |
| PLP-CI Dimensions | Mean | Std. Deviation |
|---|---|---|
| 5.1. Existence of a monitoring program, employee skills assessment. | 2.75 | 1.519 |
| 5.2. Employee autonomy in solving specific problems. | 3.05 | 1.210 |
| 5.3. Dissemination of evaluation and productivity results. | 2.26 | 1.458 |
| 5.4. Employee involvement in developing the continuous improvement program. | 2.26 | 1.316 |
| 5.5. Training of employees on continuous improvement. | 2.22 | 1.350 |
| 5.6. Disclosure of production strategies to all company employees. | 2.84 | 1.462 |
| 5.7. Cleaning, tidiness, organisation, discipline and safety (C.T.O.D.S.) procedure. | 4.28 | 0.949 |
| 5.8. Improvement implementation by part or machine. | 2.56 | 1.300 |
| Analysis Performed | Compatibility Percentage |
|---|---|
| 4.1—Tool knowledge analysis. | 28.5% |
| 4.2—Tools analysis of use. | 10.8% |
| 4.3—Value to the client (VC). | 45.4% |
| 4.4—Customer value (CV. | 50.0% |
| 4.5—Use of the pull production system (PPS). | 42.8% |
| 4.6—Use of continuous production flow (CPF). | 57.2% |
| 4.7—Continuous improvement analysis (CI). | 12.5% |
| Dimensions | Item | p (Answer < 3) | Evaluation (Cut off = 0.5) |
|---|---|---|---|
| Customer Value | 1.1. Customer needs. | 0.0163 | High |
| 1.2. Order production. | 0.3886 | High | |
| 1.3. Satisfaction survey. | 0.6778 | Low | |
| 1.4. Registration of complaints. | 0.3037 | High | |
| 1.5. Handle complaints. | 0.3978 | High | |
| 1.6. Produce by quality. | 0.0242 | High | |
| 1.7. Accomplish deadlines. | 0.1003 | High | |
| 1.8. Distribute products. | 0.4650 | High | |
| 1.9. Meetings with customers. | 0.6299 | Low | |
| 1.10. Adjustment to purchasing power. | 0.3947 | High | |
| 1.11. Providing information. | 0.1803 | High | |
| Value Chain | 2.1. Valuing activities of value. | 0.1174 | High |
| 2.2. Stock registration. | 0.0146 | High | |
| 2.3. Process time calculation. | 0.2328 | High | |
| 2.4. Identify delay time. | 0.7260 | Low | |
| 2.5. Graphing the process. | 0.4649 | High | |
| 2.6. Track the entire process. | 0.2737 | High | |
| Pull Production System | 3.1. Produce by demand. | 0.2032 | High |
| 3.2. Plan daily production. | 0.5024 | Low | |
| 3.3. Supply MP warehouse. | 0.7883 | Low | |
| 3.4. Level production by demand. | 0.2143 | High | |
| 3.5. Stock location. | 0.0825 | High | |
| 3.6. Visual production devices. | 0.4187 | High | |
| 3.7. Anomaly detection control. | 0.5048 | Low | |
| Continuous Production Flow | 4.1. Interconnection in the process. | 0.0001 | High |
| 4.2. Sequencing operations. | 0.0124 | High | |
| 4.3. Process by unit. | 0.3686 | High | |
| 4.4. Produce as planned. | 0.0412 | High | |
| 4.5. Sort machines by sequence. | 0.0011 | High | |
| 4.6. Absence of interruptions. | 0.6340 | Low | |
| 4.7. Absence of delays. | 0.6235 | Low | |
| Continuous Improvement | 5.1. Programs to accompany employees. | 0.5654 | Low |
| 5.2. Employee autonomy. | 0.4835 | High | |
| 5.3. Disseminate evaluation results. | 0.6941 | Low | |
| 5.4. Engage employees in improvement. | 0.7130 | Low | |
| 5.5. Improving employee training. | 0.7183 | Low | |
| 5.6. Disseminate production strategies. | 0.5436 | Low | |
| 5.7. C.T.O.D.S. procedure. | 0.0887 | High | |
| 5.8. Improve by part and by machine. | 0.6325 | Low |
Disclaimer/Publisher’s Note: The statements, opinions and data contained in all publications are solely those of the individual author(s) and contributor(s) and not of MDPI and/or the editor(s). MDPI and/or the editor(s) disclaim responsibility for any injury to people or property resulting from any ideas, methods, instructions or products referred to in the content. |
© 2024 by the authors. Licensee MDPI, Basel, Switzerland. This article is an open access article distributed under the terms and conditions of the Creative Commons Attribution (CC BY) license (https://creativecommons.org/licenses/by/4.0/).
Share and Cite
Alberto, A.; Lima, T.M.; Charrua-Santos, F.; Gaspar, P.D. Assessment of Lean Maturity Levels in Industries of the Luanda Region, Angola. Appl. Sci. 2024, 14, 6949. https://doi.org/10.3390/app14166949
Alberto A, Lima TM, Charrua-Santos F, Gaspar PD. Assessment of Lean Maturity Levels in Industries of the Luanda Region, Angola. Applied Sciences. 2024; 14(16):6949. https://doi.org/10.3390/app14166949
Chicago/Turabian StyleAlberto, Agostinho, Tânia M. Lima, Fernando Charrua-Santos, and Pedro D. Gaspar. 2024. "Assessment of Lean Maturity Levels in Industries of the Luanda Region, Angola" Applied Sciences 14, no. 16: 6949. https://doi.org/10.3390/app14166949
APA StyleAlberto, A., Lima, T. M., Charrua-Santos, F., & Gaspar, P. D. (2024). Assessment of Lean Maturity Levels in Industries of the Luanda Region, Angola. Applied Sciences, 14(16), 6949. https://doi.org/10.3390/app14166949