Article

A Method for Extracting Dynamic Vortex Acoustic Signal Characteristics in Island and Reef Channels Based on Time-Reversal Mirrors

1
School of Naval Architecture, Ocean and Energy Power Engineering, Wuhan University of Technology, Wuhan 430074, China
2
China Ship Development and Design Center, Wuhan 430064, China
*
Author to whom correspondence should be addressed.
Appl. Sci. 2024, 14(16), 7042; https://doi.org/10.3390/app14167042 (registering DOI)
Submission received: 4 July 2024 / Revised: 6 August 2024 / Accepted: 9 August 2024 / Published: 11 August 2024
(This article belongs to the Special Issue Modeling, Guidance and Control of Marine Robotics)

Abstract

:
Ships navigating in channels with vortex fields face increased risks. However, these vortex fields can be monitored using acoustic methods. The key is to extract the phase characteristics of sound signals passing through the vortices. Using time-reversal mirrors, this paper studied the extraction method of characteristics both numerically and experimentally, aiming to verify the effectiveness of the numerical simulation method. Starting from this point, the impact of different movement forms and scale changes in vortex fields on the acoustic signal extraction method was further investigated. The results indicate that with the iterations of time reversal (N < 6), the method is effective for uniformly moving vortex fields, when the vortex center moving speed V w < 2.2 × 10⁻³ m/s and the radius diffusion speed V r < 2.5 × 10⁻³ m/s. On the other hand, for oscillating vortex fields, it is effective when the oscillation amplitude L D < 0.15 m and the radius diffusion speed V r < 2.4 × 10⁻³ m/s; meanwhile, the dynamic characteristics of the vortex field can be ignored by the phase extraction method based on time-reversal mirrors.

1. Introduction

China has a long and winding coastline dotted with numerous islands along the waterway, creating a complex navigational environment. Due to the effects of tides, vortex fields are often induced near reefs and islands. The spatial scale of vortex fields near reefs ranges from 0.1 to 10 km [1], with time lasting from several hours to days [2]. Despite its small temporal and spatial scales, ships passing through vortex fields are sometimes threatened by lateral thrust, eccentric lifting forces, and bow–stern unbalanced force couples [3]. These adverse impacts can impair the maneuverability of navigating ships, and may even cause small ships to lose control or capsize. For ships in the channels in reef sea areas, the risk and complexity of navigation increase significantly due to the presence of vortices. Therefore, for safety reasons, it is necessary to conduct monitoring studies on vortex fields in these channels to provide scientific guidance and decision-making support.
Acoustic waves, characterized by low attenuation in water, are suitable for monitoring vortex fields in channels. When propagating through vortex fields, acoustic waves couple with the vortex fields, and the resulting signals are referred to as vortex acoustic signals. The phase characteristics of vortex acoustic signals can aid in the determination of the presence of vortices, forming a vortex field monitoring method based on the phase characteristics of acoustic signals. This method is cost-effective and available for real-time dynamic monitoring.
For decades, extensive research has been conducted on acoustic–vortex coupling through numerical simulations. Iwatsu et al. [4] compared the radial velocity distributions and vortex speed profiles of Rankine vortices and Burgers vortices by simulating the acoustic scattering phenomena. S. Manneville et al. [5] used ray tracing and finite difference methods to numerically simulate the interaction between acoustic waves and vortices. It was found that when the characteristic radius of the vortex was far larger than the wavelength of the acoustic wave, ray tracing was efficient in the extraction of the phase of the vortex acoustic signal. Yu et al. [6] studied the influence of factors such as the characteristic radius of the vortex, vortex field type, and Mach number on the extraction of vortex acoustic signal characteristics based on ray acoustics theory. Yu et al. [7,8] simulated the ray trajectory and signal changes in acoustic signals passing through underwater steady-state vortex fields to establish a mapping relationship between the phase characteristics of vortex–acoustic signals and the characteristic parameters of vortex fields.
However, a low Mach number of underwater vortices seriously weakens the phase characteristics of vortex acoustic signals. Additionally, due to the dynamic changes and severe fading of vortices in underwater acoustic channels, it is difficult to extract phase characteristics using traditional array signal processing methods. Various methods have become available for monitoring vortex currents, including the satellite remote sensing technique [9,10,11,12], the Argo profiling floats technique [13,14,15], and ocean acoustic tomography [16,17,18]. However, each of these methods has its intrinsic limitations. For instance, the monitoring based on satellite remote sensing is not real-time; the Argo profiling floats technique requires manual round-trip measurements which can be labor-intensive; and ocean acoustic tomography is costly. Time-reversal mirror (TRM) technology, utilizing the time-reversal symmetry of acoustic waves, has been widely applied in underwater communication, acoustic imaging, and target localization [19,20,21]. Some scholars have also applied it to the extraction of underwater vortex acoustic signal characteristics. Roux et al. [22] demonstrated, through ultrasonic experiments, that dual-time-reversal mirror technology can be used to amplify the phase changes in acoustic signals originated from vortex fields. By designing an experimental setup for vertical vortex fields using a dual-sided TRM array, S. Manneville et al. [23,24] validated that time-reversal mirrors can be used to amplify the phase of vortex acoustic signals, and effectively extract phase characteristics. They therefore confirmed the feasibility of numerical simulation methods to extract vortex acoustic signal characteristics, thus presenting a non-invasive and non-local new method. However, these studies are mainly based on ideal steady-state vortex field models instead of actual vortex fields with dynamic characteristics.
In summary, progress has been made to a certain extent on extracting acoustic signals from vortex fields based on time-reversal mirrors, but the dynamic characteristics of actual vortex fields have not been considered. Therefore, in this paper, a new method to extract the acoustic signal characteristics of dynamic vortex fields using time-reversal mirror technology was proposed. This study can still be extended to the monitoring of real island reef channel environments in the future though it is based on numerical simulation. The structure of this paper is as follows. Section 2 introduces the theoretical basis for extracting vortex acoustic signal characteristics using time-reversal mirrors. Section 3 experimentally verifies the feasibility of the numerical simulation method for extracting vortex acoustic signal characteristics using time-reversal mirrors. Section 4 discusses the impact of different movement forms and scale changes in vortex fields on the effectiveness of vortex acoustic signal characteristic extraction through numerical simulation. Finally, Section 5 summarizes the conclusions and research prospects of this paper.

2. Vortex Acoustic Signal Feature Extraction

2.1. Vortex Sound Signal and Characteristics

The vortex fields change the propagation time of received acoustic signals by accelerating or decelerating sound propagation. This results in a phase change in the vortex acoustic signal compared to the signal received without the presence of a vortex field. To quantify the impact of vortex fields on acoustic wave propagation characteristics, this phase change is referred to as the vortex acoustic signal phase difference, and ϕ is calculated as follows [23]:
Δ ϕ ( x ) = ω τ = ω 1 2 d y ( c + u n )
where ω refers to the angular frequency related to the signal frequency f ; c denotes the speed of sound; u n stands for the projection of the vortex field velocity in the direction of sound propagation; and 1 2 d y represents the acoustic wave propagation distance. ϕ is a function of the array element position x i , indicating the acceleration or deceleration effect of the vortex field on acoustic waves along their propagation path.

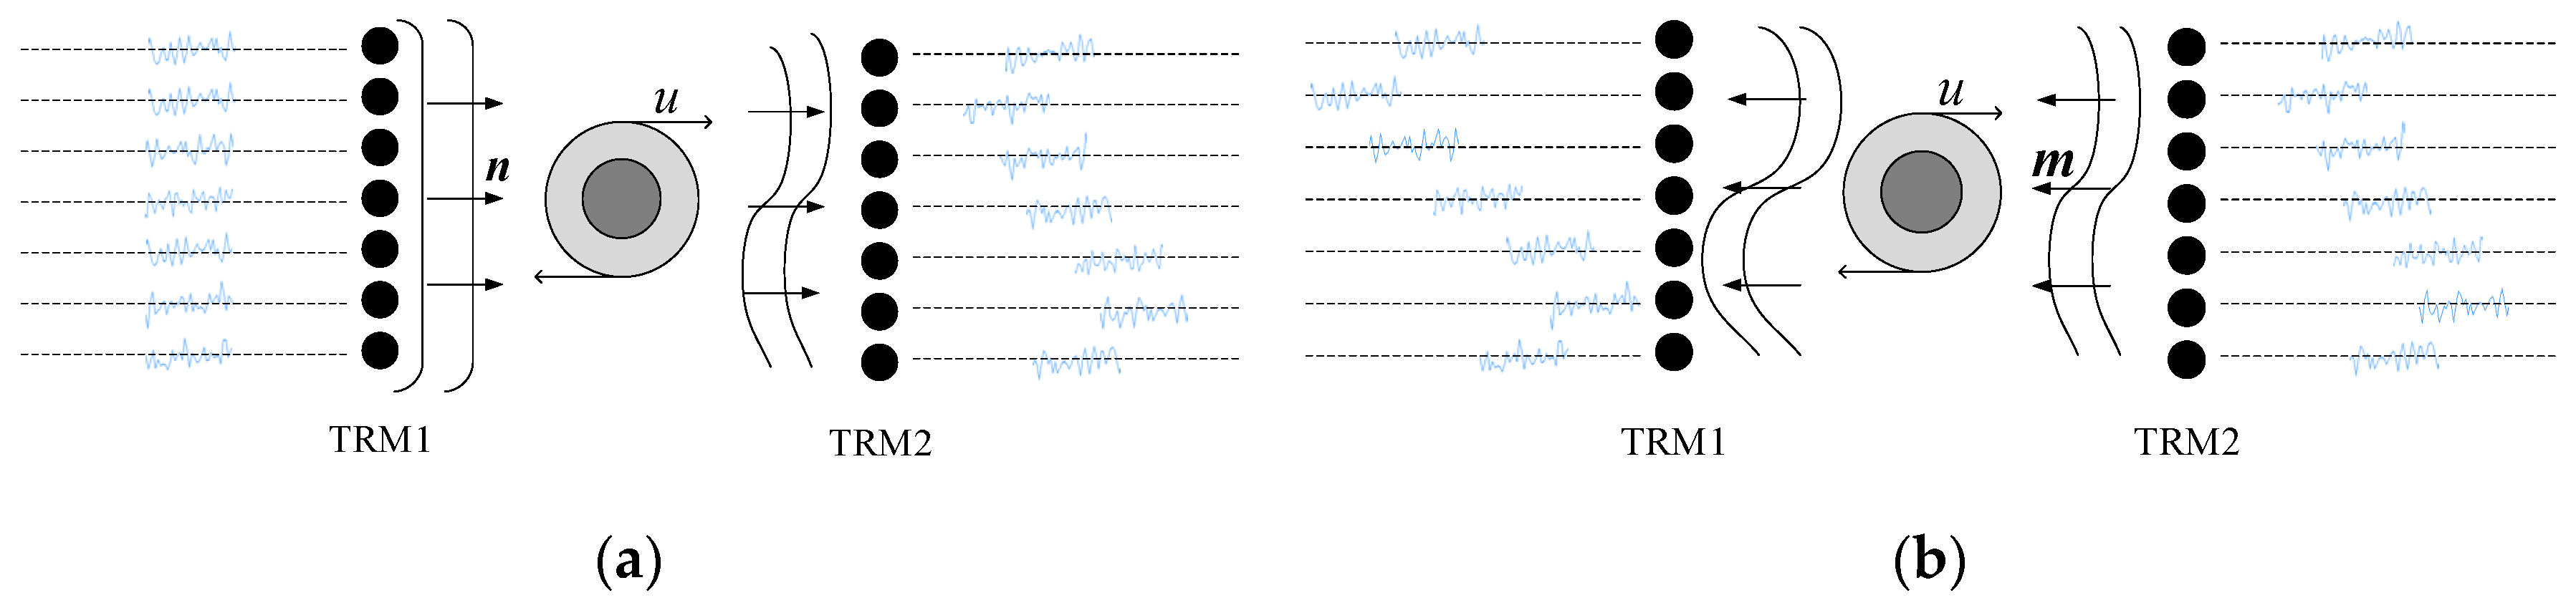
2.2. TRM Extracts Vortex Acoustic Signal Features

TRM technology, as a current research hotspot in underwater acoustics, has been applied to the extraction of vortex acoustic signal characteristics. Acoustic waves are affected by vortex fields, and the changes in sound speed are associated with the propagation directions n and m. The time-reversal invariance of acoustic waves can be disrupted, preventing the effective compensation for phase changes, and instead, wavefront deformation may be further amplified. As shown in Figure 1a, when TRM1 emits plane waves into a vortex field, acoustic waves passing through the upper part of the vortex are accelerated due to flow velocity, and reach TRM2 earlier, while those passing through the lower part are delayed due to speed reduction, resulting in phase shifts.
As shown in Figure 1b, TRM2 first emits the delayed acoustic waves. The waves that initially arrived are further accelerated in the lower part of the vortex field, while the delayed waves are further decelerated in the vortex field. After mutual transmission between TRM1 and TRM2, the received acoustic waves experience additional acceleration or deceleration, which enhances the wavefront deformation.
Numerical simulations of the received signals using TRM technology in both vortex and non-vortex conditions provide the phase difference in vortex acoustic signals under different iterations, offering a basic approach for extracting the phase characteristics of vortex acoustic signals.

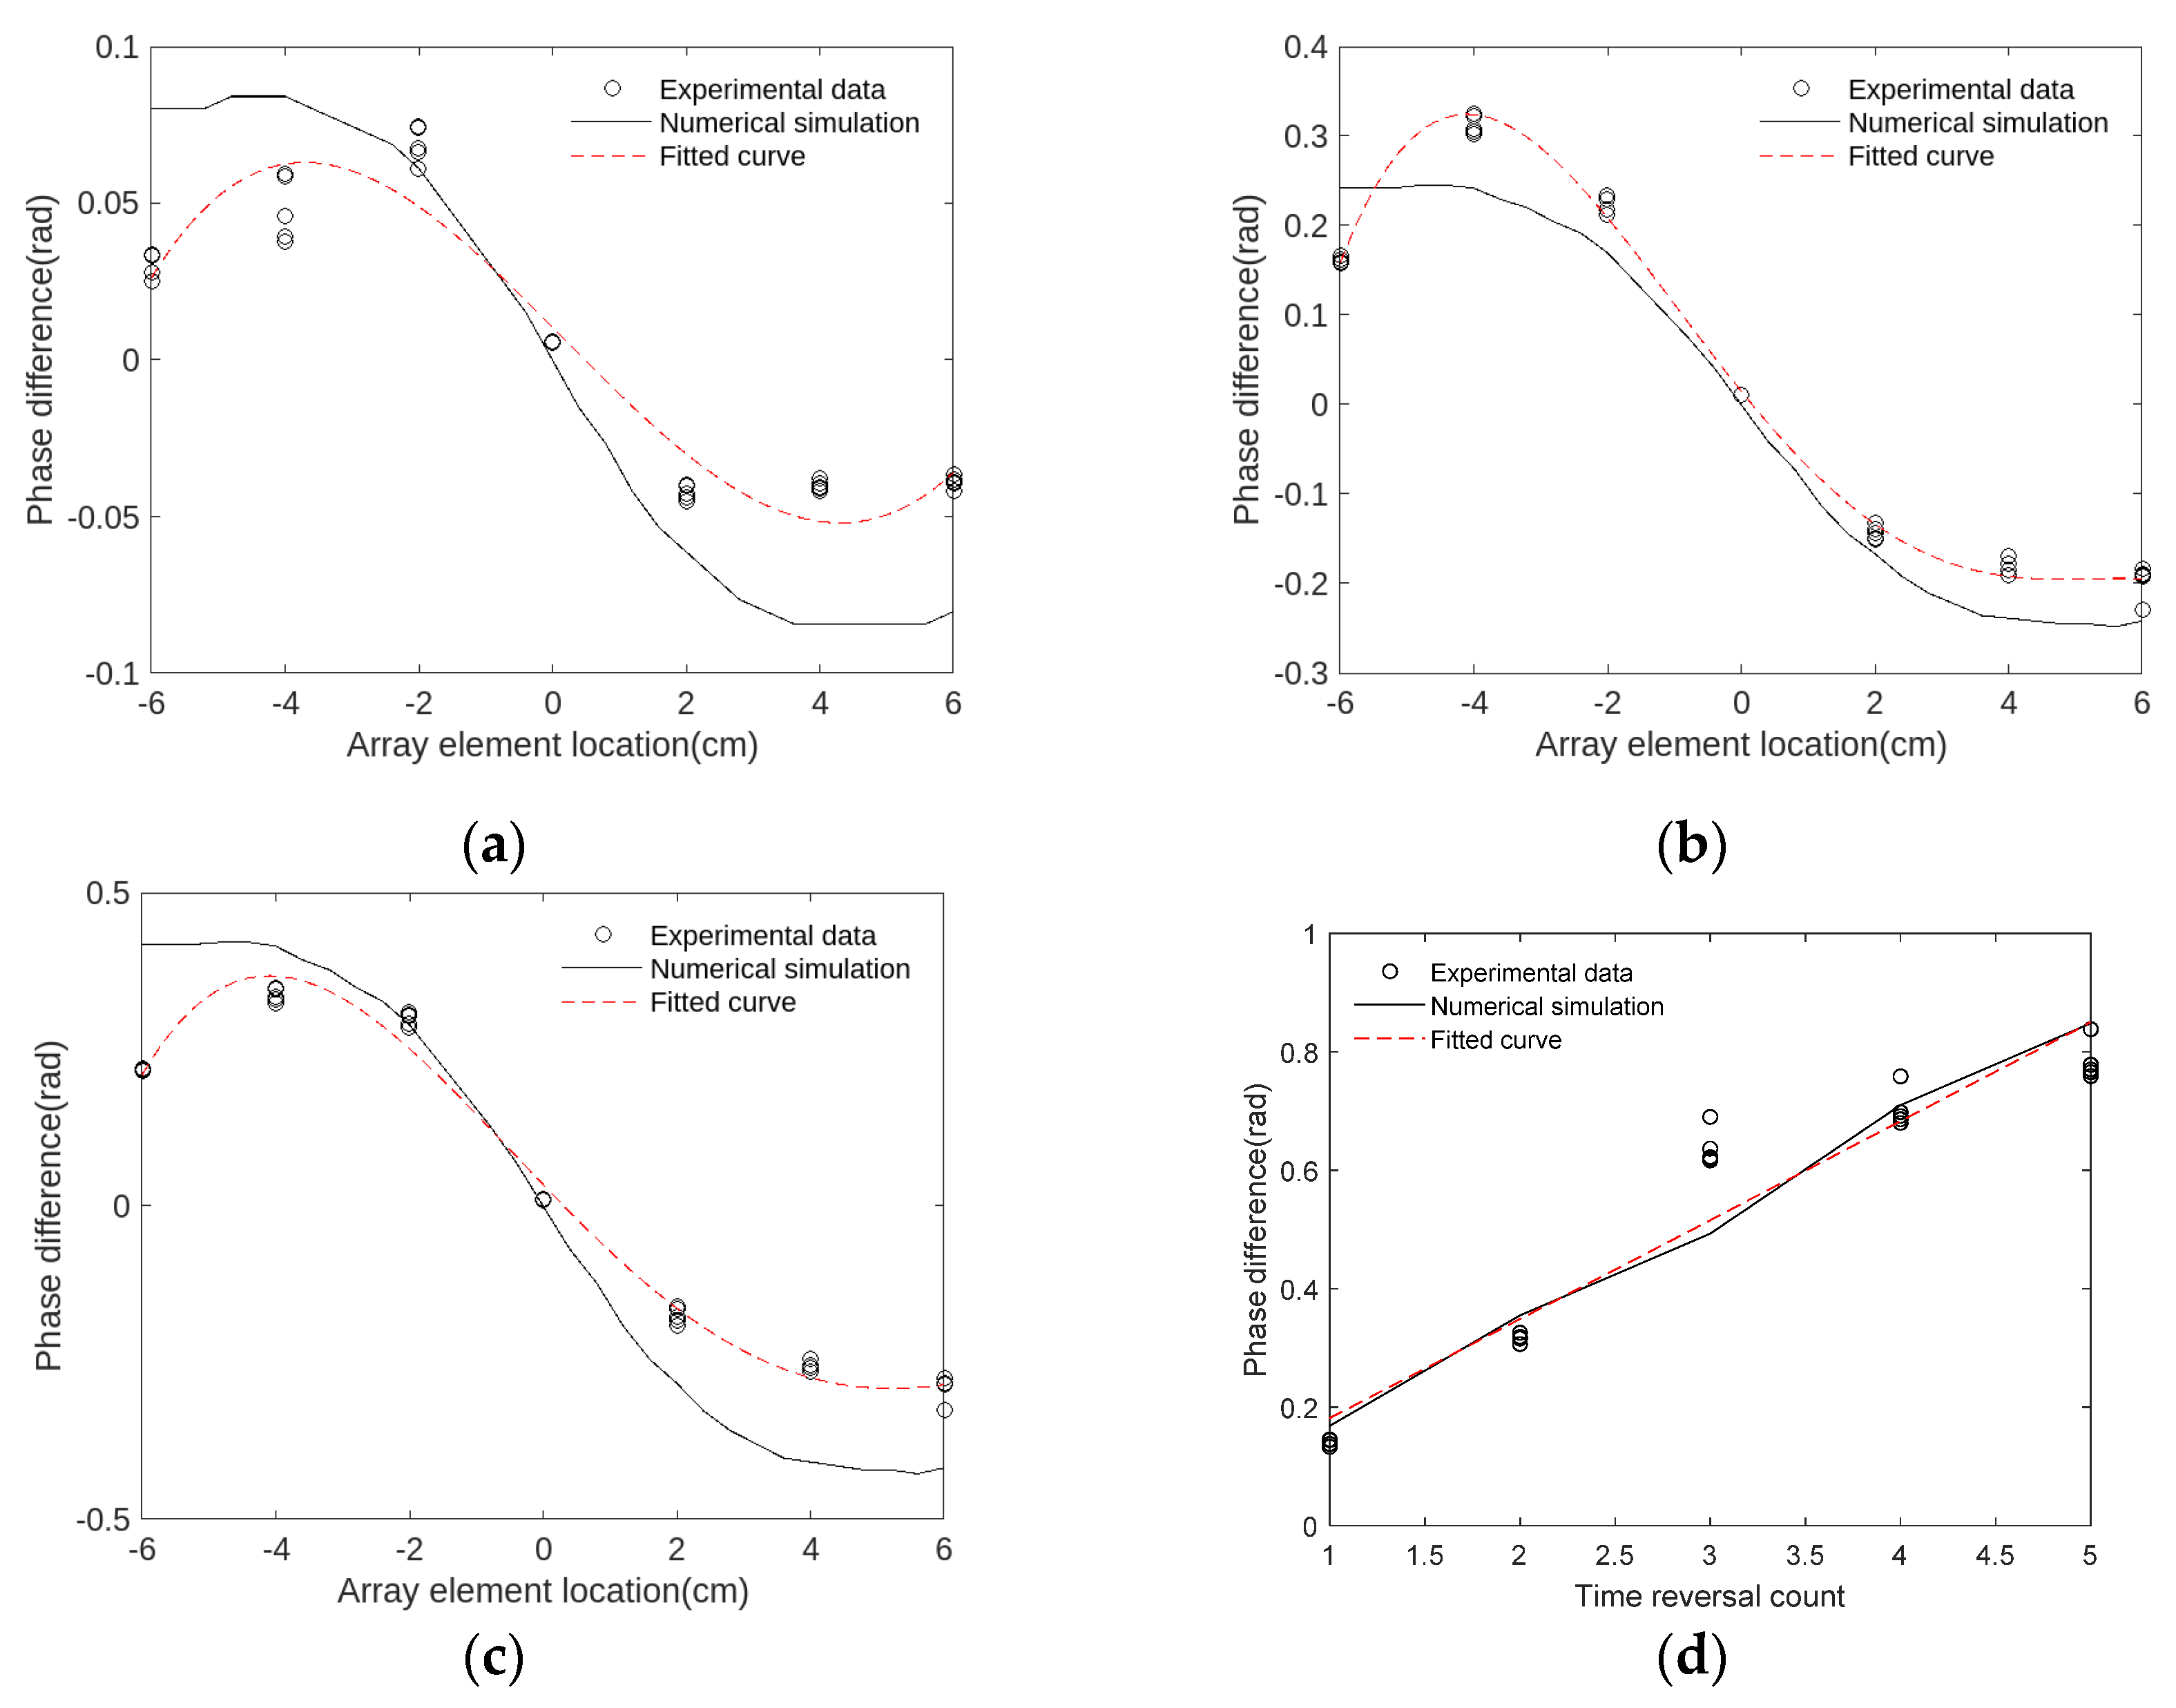
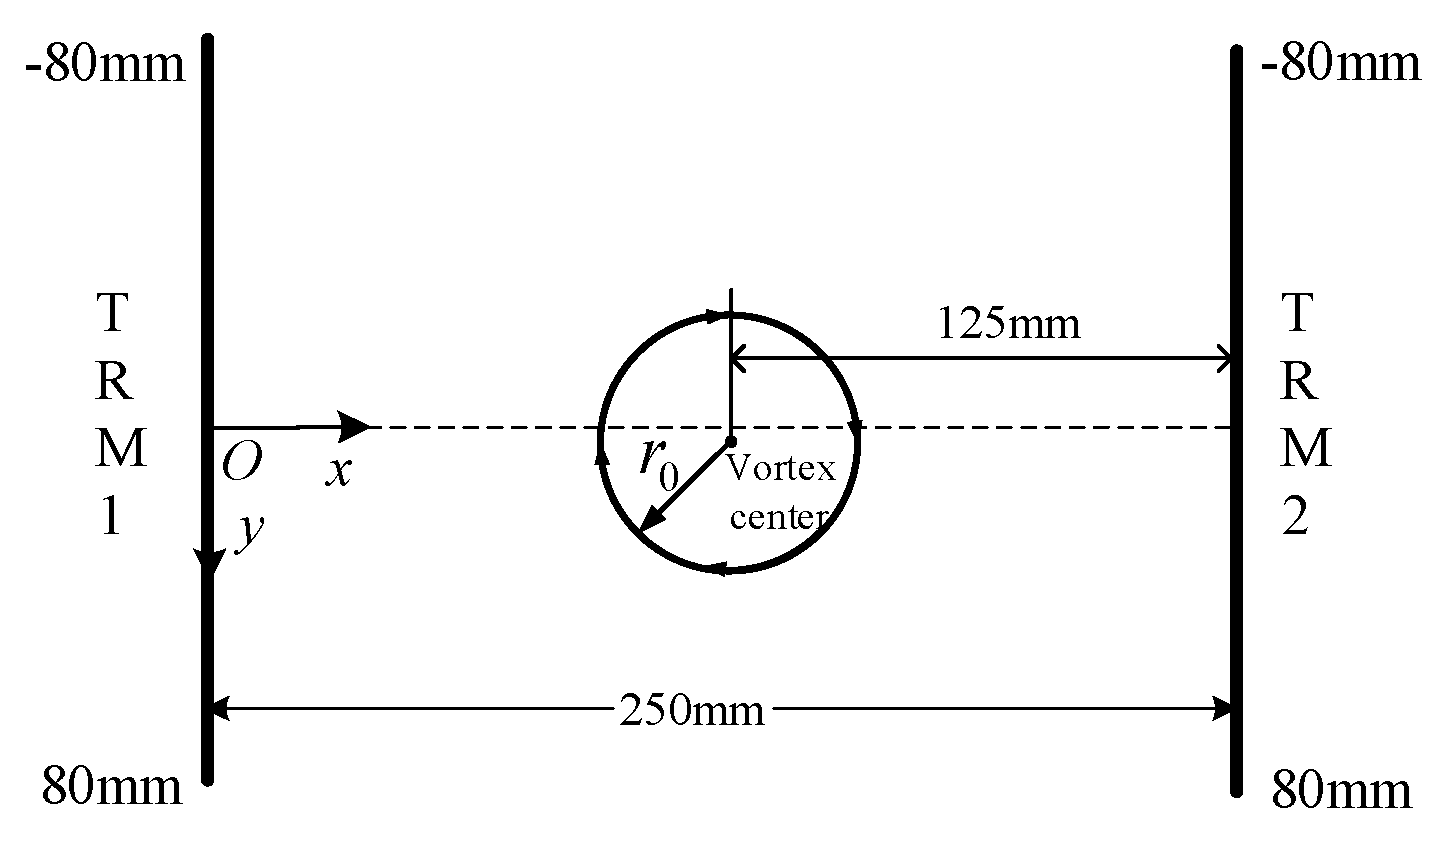
3. Experimental Verification

To verify the feasibility of numerical simulations in extracting vortex acoustic signal characteristics, in this paper, a vertical-axis vortex acoustic signal measurement experiment is conducted under laboratory setting [25]. Compared to the experiments in [23], the field of vertical-axis vortex is more stable with simpler equipment setup. In the experiment, the measurements of acoustic signals passing through the vortex field using a tri-element ultrasonic sensor array are compared with the results of numerical simulations. As shown in Figure 2a, the vertical-axis vortex is generated by opening a hole at the bottom of an acrylic open-loop water tank, with a water storage area on the left and a vortex zone on the right. A tri-element sensor array is arranged on both sides of the vortex zone, with a transmit–receive spacing of 25 cm. The sensors operates at a frequency of 500 kHz, a sharpness angle (beam width) of 5° ± 1° (−3 dB), and a usable range of 0.03~2 m. The data logger has a maximum sampling rate of 100 MHz, and the arbitrary waveform generator can output user-defined arbitrary waveforms. The dual-channel sampling rate is 2.4 GSa/s. As shown in Figure 2, taking the center point O of the vortex zone as the origin, a coordinate system is established. The middle sensor b in the TRM1 array serves as the reference coordinate for the array. By horizontally moving both TRM arrays along the y-axis by 4 cm in both positive and negative directions, flow field data within a range of −6 cm to 6 cm can be measured.
Fourier Transform [26] is applied to the signals with and without vortex presence after collecting vortex acoustic signal data based on time-frequency analysis theory. The cross-power spectral density method in the frequency domain is used to calculate the time delay difference in vortex acoustic signals, ϕ , at the same array element position for both conditions [27]:
Δ ϕ = ϕ i ϕ 0
Odgaard [28] derived the velocity distribution of the vertical-axis vortex based on experimental data:
v ( r ) = Γ 2 π r ( 1 exp ( 1.25 r 2 r 0 2 ) )
The formula above provides the basis for numerical simulations on the sound signals passing through the vertical-axis vortex, where the vortex characteristic radius r 0 = 4   c m , the Mach number M a = 3.33 × 10⁻⁴, and the circulation Γ = 2.8 π r 0 M a = 0.1759 m2/s, and the numerical simulation results of the vortex acoustic signal phase are obtained. As can be seen from Figure 3, a phase curve can be drawn by connecting the phase data points of the vortex acoustic signals received by the simulated array elements. The phase difference between the phase curve with vortex and the phase curve without vortex is the phase difference curve.
The maximum change in the vortex acoustic signal phase difference is defined as the phase jump ΔΦ, calculated as follows:
Δ Φ = max ( Δ ϕ i ( x ) ) min ( Δ ϕ i ( x ) )
Using least squares fitting, the phase difference data obtained from the experiment after reversals of five times are fitted and compared with the phase difference data obtained from numerical simulations, as shown in Figure 4.
As seen from Figure 4a–c, the fitted phase difference data within the vortex characteristic radius range (±4 cm) align well with the ones obtained by numerical simulation. Figure 4d shows that at time reversal N = 5, both experimental and numerical simulation results exhibit a characteristic of linear amplification with increased time reversals.
According to Table 1, the fitted data in the experiment and those obtained by the numerical simulation are in good agreement, with an error of less than 10%. This demonstrates that the numerical simulation of the method for extracting vortex acoustic signals using TRM is reliable and effective. Therefore, it is feasible to apply it to the numerical simulation of vortex acoustic signals in dynamic vortex fields.

4. Feature Extraction of Dynamic Vortex Acoustic Signals

In view of the dynamic nature of actual vortexes in channels, in this section, numerical simulation methods are used to explore the impact of dynamic characteristics of vortex fields on the numerical methods for extracting vortex acoustic signal characteristics using TRM.
As shown in Figure 5, the vortex field is flanked by TRM1 and TRM2. The length of the array in the y-direction is 160 mm, with the array evenly spaced to accommodate 41 sensors, and the spacing between each element is 0.0039 m. The length of the array in the y-direction serves as the acoustic field observation range L 0 , and the array spacing in the x-direction is 250 mm. The acoustic wave frequency is 500 kHz, and the speed of sound in water is c =1500 m/s. The center of the TRM1 array is taken as the coordinate origin O, the vortex characteristic radius r 0 = 10 mm, and the vortex center coordinates are (125 mm, 0 mm), located on the x-axis.
In the literature [8], a number of time reversals N ≤ 7 is selected to ensure the good linear amplification of phase jump, while in this paper, N = 6.

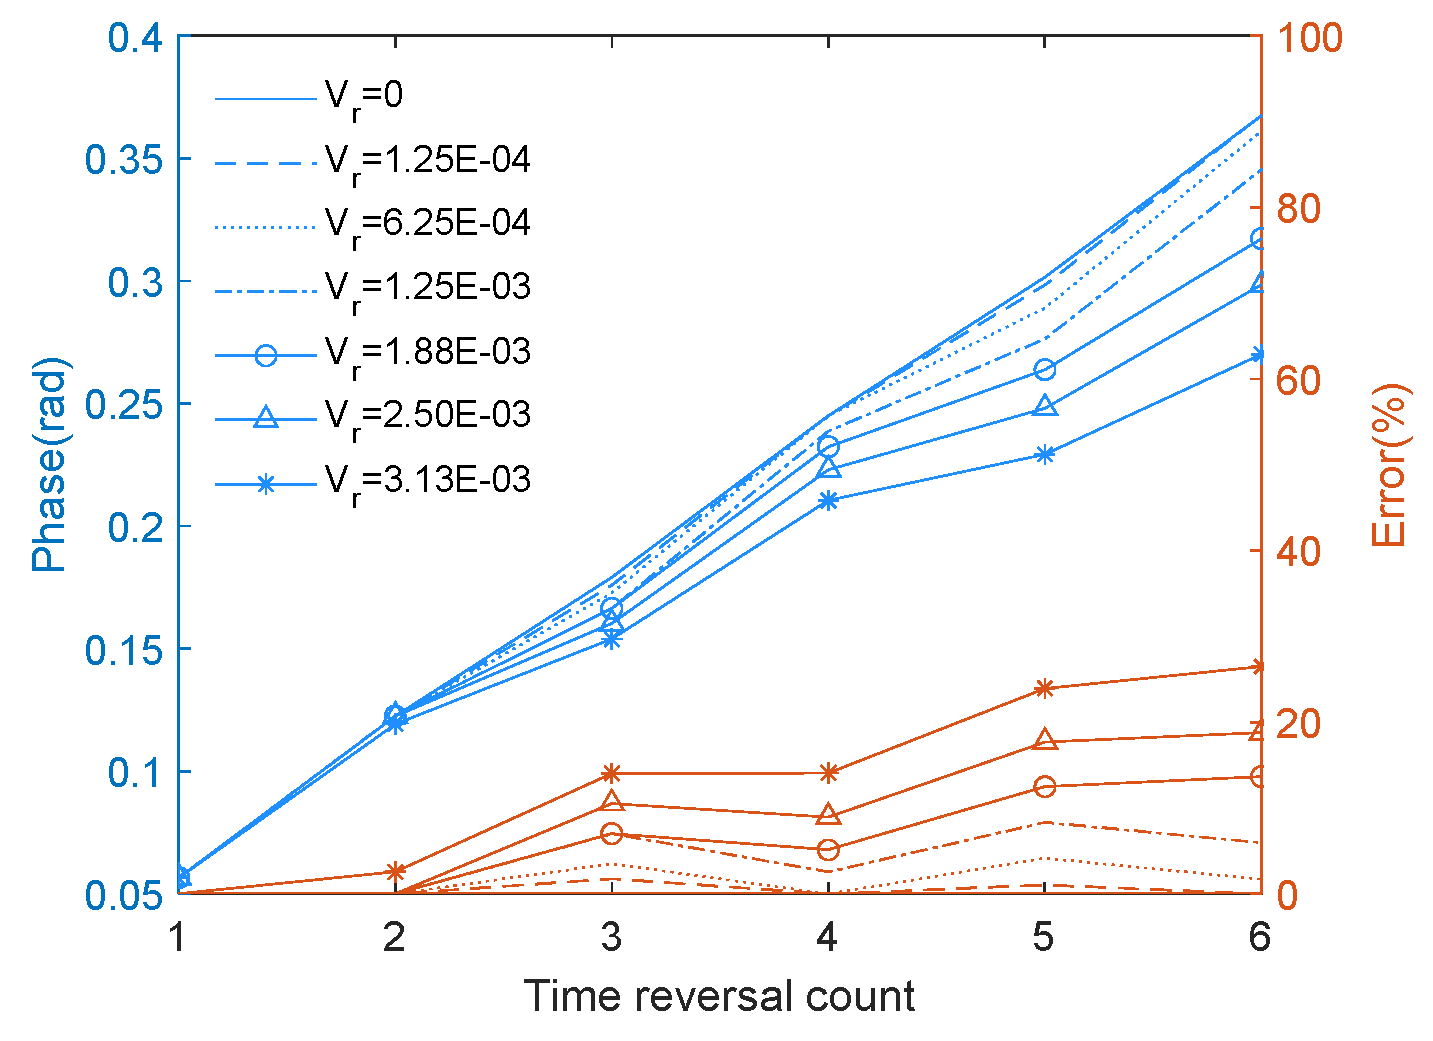
4.1. Unified Motion Vortex

The term “unified motion vortex” refers to the unified motion of the vortex center and the unified radial expansion of the vortex. The unified motion of the vortex center means that the position of the vortex center moves continuously in a certain direction at a constant speed. The unified radial expansion of the vortex means that the radius of the vortex expands continuously at a constant speed. Vortex center movement speed V w and vortex radius diffusion speed V r are introduced to better describe the dynamics and acoustic characteristics of a vortex field. In unified motion, the vortex center moves at speed V w in the positive direction of the y-axis uniformly and the vortex radius diffuses at speed V r .
To reasonably extract the phase characteristics of acoustic waves passing through a vortex field in uniform motion and diffusion, the extraction time interval t for the moving vortex field phase characteristics is specified. Based on t and the moving speed, the vortex center coordinates and the vortex radius at each time reversal can be determined. Assuming that the vortex center remains at the center of the transmit–receive array, the time interval for each time reversal processing (dynamic vortex change interval) is approximately equal to the sound signal propagation time between arrays. At a given array spacing, the dynamic vortex change interval in this example is calculated to be t = 8 s .
1.
Vortex position remains unchanged, while vortex radius diffuses.
If the position of the vortex remains unchanged, the vortex field is under diffusion effects, that is, the characteristic radius of the vortex increases with each time reversal. The impact of the vortex radius diffusion speed V r on the phase extraction effect is investigated in this study. For V r , the vortex field radius for each time reversal r i is given by r i = V r × i 1 t + r 0 , where i = 1, 2 ... 6. After extracting the vortex acoustic signal for six times, the phase jump curve (blue) is obtained. Taking the phase jump of a steady-state vortex field ( V w = V r = 0 ) as a reference, the relative error between the diffusion vortex field phase jump under six time reversals and the steady-state vortex field phase jump is calculated to form an error curve (red). Different vortex radius diffusion speeds, i.e., V r = 1.25 × 10⁻⁴ m/s, 6.25 × 10⁻⁴ m/s, 1.25 × 10⁻³ m/s, 1.88 × 10⁻³ m/s, 2.50 × 10⁻³ m/s, and 3.13 × 10⁻³ m/s, are tested, yielding six phase jump curves and error curves, as shown in Figure 6.
As assumed in this paper, if the relative error of the phase jump is less than 20%, the phase amplification based on time reversal is considered to satisfy the requirements of linear phase amplification, and the difference from the steady-state vortex condition is not significant. As shown in Figure 6, when V r is less than 2.50 × 10⁻³ m/s and the number of time reversals N is less than 6, TRM can effectively extract the vortex acoustic signal characteristics, and the dynamic characteristics of the diffusing vortex is ignorable.
2.
Vortex position changes, while vortex radius remains unchanged.
The vortex field does not undergo diffusion effects, and its position moves uniformly with increased time reversal counts. In this study, the impact of the vortex center movement speed V w on the phase extraction effect is investigated. For V w , the vortex center position for each time reversal w i is given by w i = V w × ( i 1 ) t where i = 1, 2... 6. After extracting the vortex acoustic signal for six times, the phase jump curve (blue) is obtained. Taking the phase jump of a steady-state vortex field as a reference, the relative error between the phase jump with reversals for six times at the movement speed V w and the steady-state vortex field phase jump is calculated to obtain an error curve (red). Different vortex center movement speeds, i.e., V w = 1.38 × 10⁻³ m/s, 1.63 × 10⁻³ m/s, 1.88 × 10⁻³ m/s, 2.13 × 10⁻³ m/s, and 2.38 × 10⁻³ m/s, are tested, yielding five phase jump curves and error curves, as shown in Figure 7.
As shown in Figure 7, when V w is less than 2.38 × 10⁻³ m/s and the number of time reversal N is less than 6, TRM is effective in the extraction of the characteristics of the vortex acoustic signals from the moving vortex center, which allows the dynamic characteristics of the vortex center to be disregarded.
3.
Both vortex position and radius change.
Considering the diffusion effects in the vortex field and the uniform motion of the vortex center, the phase characteristics of the vortex acoustic signals are extracted after six time reversals. The vortex radius diffusion speeds V r are set to 0, 1.25 × 10⁻⁴ m/s, 6.25 × 10⁻⁴ m/s, 1.25 × 10⁻³ m/s, 1.88 × 10⁻³ m/s, 2.50 × 10⁻³ m/s, and 3.13 × 10⁻³ m/s, and the vortex center moving speeds V w are set to 0, 1.38 × 10⁻³ m/s, 1.63 × 10⁻³ m/s, 1.88 × 10⁻³ m/s, 2.13 × 10⁻³ m/s, and 2.38 × 10⁻³ m/s, respectively. The initial time-reversal vortex acoustic signal is received with minimal error when the acoustic wave passes through a steady-state vortex field. The comparison between relative errors of the phase jump measurements of vortex acoustic signals from time reversals N = 2 to 6 and those from a steady-state vortex field are shown in Figure 8. This figure is plotted by using the built-in ‘pcolor’ function in Matlab 2019b, where the horizontal axis represents the vortex radius diffusion speed and the vertical axis stands for the vortex center movement speed.
As shown in Figure 8, the effectiveness of extracting phase characteristics from vortex acoustic signals decreases with the increase in the number of time reversals. Initially, TRM is highly effective. When the number of time reversals, denoted as N, is less than 5, TRM can successfully extract the phase characteristics of vortex acoustic signals. This remains true even under challenging conditions where the vortex field is moving at its maximum center speed and expanding at its maximum radius diffusion speed.
However, the situation changes significantly from the fifth time reversal onward. When the vortex moving speed V w exceeds 2.2× 10⁻³ m/s, and the radius diffusion speed V r exceeds 2.5 × 10⁻³ m/s, the effectiveness of TRM in extracting the phase characteristics of vortex acoustic signals diminishes. This reduction in effectiveness indicates that the dynamic changes in the uniformly diffusing motion of the vortex field introduce complexities that TRM cannot adequately address beyond a certain number of reversals.
The data in Figure 8 highlight this critical threshold. Before the fifth time reversal, the phase characteristics can be accurately captured, and the dynamic movement of the vortex field does not significantly impair TRM’s performance. However, once the threshold of N = 5 is crossed, the rapid movement and diffusion rates of the vortex create a scenario where the phase extraction becomes unreliable. This unreliability is due to the increased complexity and rapid changes in the vortex field dynamics, which TRM cannot sufficiently adapt to in higher reversal counts.
Therefore, to ensure accurate phase characteristic extraction from vortex acoustic signals in dynamic conditions, it is crucial to consider the limitations posed by the number of time reversals. When dealing with a highly dynamic vortex field, where both the center movement and radius expansion are substantial, alternative or supplementary methods may be necessary to account for the dynamic changes and ensure the reliability of the extracted phase characteristics.

4.2. Oscillating Motion Vortex

In the previous sections, the impact of uniform motion of the vortex center and the diffusion movement of the vortex radius on phase extraction effectiveness was discussed. However, the uniform motion is a relatively simple form of movement; therefore, to explore more complex forms of motion in the vortex field, this section will use a trigonometric function model to simulate the random oscillation phenomenon of the vortex field under the assumption that the oscillation trajectory of the vortex center is a sine curve. The oscillation amplitude L D is introduced to represent the degree of oscillation of the vortex center. Taking L D = 0.16 m as an example, the oscillation trajectory of the vortex center is shown in Figure 9, where the y-axis represents the y-coordinate position of the vortex center, and the x-axis refers to the duration of the vortex center’s oscillation. The sampling is carried out at a time interval of t = 8 s with the symbol * marking the oscillation positions of the vortex field’s core center.
To describe the effectiveness of vortex acoustic signal characteristic extraction under different vortex field oscillation amplitudes, L D is set to 0.04 m, 0.08 m, 0.12 m, 0.16 m, and 0.20 m, respectively.
Considering the diffusion of the vortex radius and the oscillatory motion of the vortex center, the phase characteristics of the vortex acoustic signals are extracted after six time reversals with L D values of 0.04 m, 0.08 m, 0.12 m, 0.16 m, and 0.20 m, and V r values of 0, 1.25 × 10⁻³ m/s, and 2.5 × 10⁻³ m/s, respectively. Since the initial state of the oscillating vortex field is steady, the relative error of the phase jump measurement of the initial time-reversal vortex acoustic signal is not considered. And its comparison with those from a steady-state vortex field for time reversal counts N = 2 to 6 is shown in Figure 10 plotted using the built-in ‘pcolor’ function in Matlab 2019b, with the y-axis representing the vortex field oscillation amplitude and the x-axis standing for the vortex radius diffusion speed.
This comprehensive analysis indicates that when the vortex field is subjected to both oscillatory motion and radius diffusion, the behavior of the oscillation amplitude L D and the radius diffusion speed V r changes in a specific manner as the number of time reversals increases.
Initially, as the number of time reversals increases, the oscillation amplitude L D that meets the error criteria for accurately extracting the phase characteristics of vortex acoustic signals tends to decrease. This means that for higher time reversal counts, the allowable oscillation amplitude within which TRM can still effectively extract phase characteristics becomes smaller.
Conversely, the vortex radius diffusion speed V r exhibits a different trend. Initially, V r decreases, indicating that for fewer time reversals, a lower radius diffusion speed is required to meet the error criteria. However, as the number of time reversals continues to increase, V r begins to increase. This suggests a more complex interaction between the time reversal process and the dynamic behavior of the vortex field.
One possible explanation for these observations is the position of the vortex center due to its oscillatory motion. When the vortex center moves to the edge of the acoustic observation range, it leads to a cancelation effect in the phase jump measurements at the radius of the vortex. This positional shift impacts the ability of TRM to accurately capture the phase characteristics, necessitating adjustments in both L D and V r to maintain accuracy.
At the maximum time reversal count N of 6, the analysis shows that TRM can still effectively extract the phase characteristics of vortex acoustic signals under certain conditions. Specifically, when the oscillation amplitude L D is less than 0.15 m and the radius diffusion speed V r is less than 2.4 × 10⁻³ m/s, the dynamic characteristics of the oscillating vortex field can be disregarded. This simplification allows for more straightforward calculations without a significant loss of accuracy.
However, if these thresholds are exceeded, the dynamic characteristics of the oscillating vortex field become significant and must be taken into account. This means that for larger oscillation amplitudes or higher radius diffusion speeds, the simplifications are no longer valid, and the full dynamic behavior of the vortex field needs to be considered to accurately extract phase characteristics using TRM.
This nuanced understanding highlights the delicate balance between the oscillation amplitude, radius diffusion speed, and the number of time reversals in ensuring accurate phase extraction from vortex acoustic signals. It underscores the importance of considering these factors in both experimental setups and data analysis to optimize the effectiveness of TRM.

5. Conclusions

Dynamic vortex fields shown frequently near island and reef channels can be dangerous to passing ships in terms of stability. In this study, a method for monitoring dynamic vortex fields was proposed based on the phase characteristics of vortex acoustic signals, which provides a new technical means to improve the safety of ship navigation. Using TRM technology, in this paper, the extraction of phase characteristics from dynamic vortex fields was achieved, and the impact of different moving vortex fields on the performance of the vortex acoustic signal characteristic extraction algorithm was defined, with the conclusions drawn below:
(1)
By comparing the results of vertical-axis vortex acoustic signal measurement experiments with numerical simulations, it is verified that TRM technology can linearly amplify the phase jump caused by the dynamic eddy current field to a certain extent.
(2)
The amplification effect of the acoustic signal phase and the effectiveness of phase characteristic extraction in dynamic vortex are influenced by different factors, including the vortex field’s movement speed, radius diffusion speed, and oscillatory movement amplitude. In the case that the time reversal count N is less than 6, for vortex fields in uniform motion, TRM can effectively extract the phase characteristics of the acoustic signal when the vortex center moving speed V w is less than 2.2 × 10⁻³ m/s and the radius diffusion speed V r is less than 2.5 × 10⁻³ m/s, disregarding the impact of the dynamic vortex field on the extraction results.
(3)
For vortex fields in oscillating motion, in the case that the time reversal count N is less than 6, when the oscillation amplitude L D exceeds 0.15 m and the radius diffusion speed V r exceeds 2.4 × 10⁻³ m/s, the influence of the oscillating vortex field on the vortex acoustic signal extraction algorithm must be considered.

Author Contributions

Conceptualization, H.L. and M.Y.; methodology, H.L. and M.Y.; software, H.L. and D.F.; validation, H.L. and D.F.; formal analysis, H.L., W.Z. and M.Y.; investigation, H.L.; resources, M.Y.; data curation, H.L.; writing—original draft preparation, H.L.; writing—review and editing, H.L., M.Y. and W.Z.; visualization, H.L.; supervision, M.Y.; project administration, M.Y.; funding acquisition, M.Y. All authors have read and agreed to the published version of the manuscript.

Funding

This work was supported by the National Natural Science Foundation of China (No. 42052271349).

Institutional Review Board Statement

Not applicable.

Informed Consent Statement

Not applicable.

Data Availability Statement

The data presented in this study are available upon request from the corresponding author.

Conflicts of Interest

The authors declare no conflicts of interest.

References

  1. Zhao, J.; Ding, Z.; Guo, W.; Qiu, J.; Wang, J.; Ma, Y. Small-scale vortex caused by the Damaigan reefs in Zhoushan. Mar. Forecast 2015, 32, 33–38. (In Chinese) [Google Scholar]
  2. Liu, F.; Liu, Y.; Tang, S.; Li, Q. Oceanic Kármán Vortex Streets in the Luzon Strait in the Lee of Didicas Island from Multiple Satellite Missions. Remote Sens. 2022, 14, 4136. [Google Scholar] [CrossRef]
  3. Yang, Q.; Nikurashin, M.; Sasaki, H.; Sun, H.; Tian, J. Dissipation of mesoscale eddies and its contribution to mixing in the northern South China Sea. Sci. Rep. 2019, 9, 556. [Google Scholar] [CrossRef]
  4. Iwatsu, R.; Tsuru, H. Numerical simulation of acoustic scattering from a circular vortex. Theor. Appl. Mech. Jpn. 2013, 61, 95–104. [Google Scholar]
  5. Manneville, S.; Prada, C.; Tanter, M.; Fink, M. Ultrasound Propagation through a Rotational Flow: Numerical Methods Com- 468 pared to Experiments. J. Comput. Acoust. 2001, 9, 841–852. [Google Scholar] [CrossRef]
  6. Yu, M.; Zhang, X.; Zhang, Y.; Wang, Z. Numerical Simulation of Vortex-acoustic Coupled Acoustic Signals Based on Ray Acoustics. In Proceedings of the 2021 OES China Ocean Acoustics, Harbin, China, 14–17 July 2021; pp. 335–339. [Google Scholar]
  7. Yu, M.; Yan, J.; Wang, Z.; Wang, X. Sound propagation characteristics of underwater steady-state vortex field. Acta Acust. 2023, 48, 1111–1118. (In Chinese) [Google Scholar]
  8. Yu, M.; Fan, D.; Zhang, Y.; Liu, H. Numerical simulation and experimental study of sound propagation in underwater steady vortex field. Tech. Acoust. 2023, 42, 419–425. (In Chinese) [Google Scholar]
  9. Li, J.; Ma, W.; Ma, Z.; Wang, L. Impacts of WRF Model Vertical Grid Resolution on Typhoon Numerical Simulation. Ocean Technol. 2013, 32, 76–81. (In Chinese) [Google Scholar]
  10. Siddique, M.F.; Ahmad, Z.; Ullah, N.; Ullah, S.; Kim, J.-M. Pipeline Leak Detection: A Comprehensive Deep Learning Model Using CWT Image Analysis and an Optimized DBN-GA-LSSVM Framework. Sensors 2024, 24, 4009. [Google Scholar] [CrossRef]
  11. Chaigneau, A.; Gizolme, A.; Grados, C. Mesoscale Eddies off Peru in Altimeter Records: Identification Algorithms and Eddy Spatio Temporal Patterns. Prog. Oceanogr. 2008, 79, 106–119. [Google Scholar] [CrossRef]
  12. Wang, G.; Su, J.; Chu, P.C. Mesoscale Eddies in the South China Sea Observed with Altimeter Data. Geophys. Res. Lett. 2003, 30, 2003GL018532. [Google Scholar] [CrossRef]
  13. Chen, X.; Chen, G.; Ge, L.; Huang, B.; Cao, C. Global Oceanic Eddy Identification: A Deep Learning Method From Argo Pro-files and Altimetry Data. Front. Mar. Sci. 2021, 8, 646926. [Google Scholar] [CrossRef]
  14. Chaigneau, A.; Le Texier, M.; Eldin, G.; Grados, C.; Pizarro, O. Vertical Structure of Mesoscale Eddies in the Eastern South 440 Pacific Ocean: A Composite Analysis from Altimetry and Argo Profiling Floats. J. Geophys. Res. 2011, 116, 2011JC007134. [Google Scholar] [CrossRef]
  15. Zhang, Z.; Wang, W.; Qiu, B. Oceanic Mass Transport by Mesoscale Eddies. Science 2014, 345, 322–324. [Google Scholar] [CrossRef] [PubMed]
  16. Mikryukov, A.V.; Popov, O.E. Penetration of Sound into the Cold Eddy of the Sargasso Sea. Acoust. Phys. 2008, 54, 65–70. [Google Scholar] [CrossRef]
  17. Ji, X.; Zhao, H. Three-Dimensional Sound Speed Inversion in South China Sea Using Ocean Acoustic Tomography Combined with Pressure Inverted Echo Sounders. In Proceedings of the Global Oceans of 2020, Singapore, 5–14 October 2020; pp. 1–6. [Google Scholar]
  18. Ji, X.; Cheng, L.; Zhao, H. Physics-Guided Reduced-Order Representation of Three-Dimensional Sound Speed Fields with Ocean Mesoscale Eddies. Remote Sens. 2022, 14, 5860. [Google Scholar] [CrossRef]
  19. Song, H.C.; Hodgkiss, W.S.; Kuperman, W.A.; Higley, W.J.; Raghukumar, K.; Akal, T.; Stevenson, M. Spatial diversity in passive time reversal communications. J. Acoust. Soc. Am. 2006, 120, 2067–2076. [Google Scholar] [CrossRef]
  20. Guan, R.; Fan, X.; Yang, W. Simulation of underwater target detection based on active time reversal. Ship Sci. Technol. 2020, 42, 135–139. (In Chinese) [Google Scholar]
  21. Stromkov, A.A. The use of the time reverse acoustics in a shallow sea. Hydroacoustics 2008, 11, 353–363. [Google Scholar]
  22. Roux, P.; de Rosny, J.; Tanter, M. The Aharonov-Bohm effect revisited by an acoustic time-reversal mirror. Phys. Rev. Lett. 1997, 79, 3170. [Google Scholar] [CrossRef]
  23. Manneville, S.; Maurel, A.; Roux, P.; Fink, M. Characterization of a Large Vortex Using Acoustic Time-Reversal Mirrors. Eur. Phys. J. B 1999, 9, 545–549. [Google Scholar] [CrossRef]
  24. Manneville, S.; Robres, J.H.; Maurel, A. Vortex dynamics investigation using an acoustic technique. Phys. Fluids 1999, 11, 3380–3389. [Google Scholar] [CrossRef]
  25. Yang, L.; Liang, B.; Li, X. Analysis of influencing factors of vertical axis vortex at the water inlet of hydraulic structures. China Water Transp. 2023, 23, 87–88+109. (In Chinese) [Google Scholar]
  26. Muhammad, F.S.; Zahoor, A.; Jong, M.K. Pipeline leak diagnosis based on leak-augmented scalograms and deep learning. Eng. Appl. Comput. Fluid Mech. 2023, 17, 2225577. [Google Scholar]
  27. Manneville, S.; Maurel, A.; Bottausci, F. Acoustic characterization of a stretched vortex in an infinite medium. In Proceedings of the Lectures of a Workshop, Rouen, France, 27–28 April 1999; pp. 231–240. [Google Scholar]
  28. Odgaard, A.J. Free-surface air core vortex. J. Hydraul. Eng. 1986, 112, 610–620. [Google Scholar] [CrossRef]
Figure 1. Time-reversal extraction of vortex acoustic signals. (a) Initial acoustic wave emission; (b) re-emission after time reversal.
Applsci 14 07042 g001
Figure 2. Vertical-axis vortex acoustic signal measurement. (a) Measurement top view and instrument connection. (b) Measurement front view.
Applsci 14 07042 g002
Figure 3. Vortex acoustic signal phase characteristics.
Applsci 14 07042 g003
Figure 4. Calculation of phase difference between numerical simulation and experimental data. (a) N = 1; (b) N = 3; (c) N = 5; (d) phase jump measurement.
Applsci 14 07042 g004
Figure 5. Dynamic vortex acoustic signal characteristic extraction.
Applsci 14 07042 g005
Figure 6. Phase characteristics of vortex acoustic signals at different vortex radius diffusion speeds.
Applsci 14 07042 g006
Figure 7. Phase characteristics of vortex acoustic signals at different vortex center movement speeds.
Applsci 14 07042 g007
Figure 8. Uniform motion vortex field phase jump error heatmap. (a) N = 2; (b) N = 3; (c) N = 4; (d) N = 5; (e) N = 6.
Applsci 14 07042 g008
Figure 9. Oscillation trajectory of the vortex center.
Applsci 14 07042 g009
Figure 10. Error heatmap of phase jump measurements for oscillatory motion in the vortex field. (a) N = 2; (b) N = 3; (c) N = 4; (d) N = 5; (e) N = 6.
Applsci 14 07042 g010
Table 1. Phase jump measurement error analysis.
Time Reversal CountNumerical Simulation/radExperimental Fit/radExperimental Data/radError between Experimental Fit and Numerical Simulation/%
10.16820.18140.13957.85%
20.3550.34850.3168−1.83%
30.50320.51560.63702.46%
40.7100.68270.7027−3.84%
50.84820.84990.78210.19%
Disclaimer/Publisher’s Note: The statements, opinions and data contained in all publications are solely those of the individual author(s) and contributor(s) and not of MDPI and/or the editor(s). MDPI and/or the editor(s) disclaim responsibility for any injury to people or property resulting from any ideas, methods, instructions or products referred to in the content.

