
Developing a Robust Training Dataset for AI-Driven Architectural Spatial Layout Generation


Abstract
:1. Introduction
2. Related Research
2.1. AI-Based Dataset Construction for Architectural Design
2.2. AI-Based Spatial Layout Generation Research
3. Methodology
3.1. Procedure
3.2. Raw Data Collection
3.3. Spatial Relationship Definition
3.4. YOLO-Based Spatial Relationship Diagram Extraction Method
4. Algorithm and Experiment
4.1. YOLO-Based Training Dataset Construction Algorithm
4.1.1. Algorithm for Spatial Relationship Diagram Extraction
4.1.2. Algorithm for Spatial Relationship Data Extraction
4.2. Experiment
4.2.1. Creating Training Data Using an Annotation Tool
4.2.2. Data Training and Testing
4.3. Result
4.3.1. Results of Spatial Relationship Diagram Extraction
4.3.2. Results of Spatial Relationship Data Extraction
- Project and Space Names: These were automatically sourced and include the project ID, layer, detected space name, class number, and a random “N” when there are identical space names;
- Space Size: This is determined as the percentage of the detected space area. For a total image size scaled to 100%, both the horizontal and vertical ratios were calculated. In raster images, the relative size of a space is typically inferred from the size of the door. The length of the side toward the door was standardized to 1 and the opposite side was scaled proportionally. The actual space area was derived by multiplying the total area (determined through data crawling) by the space ratio;
- Doors and Windows: These features are coded as binary data, where 1 indicates presence within the detected space and 0 indicates absence. For example, in the detected space, a single door (class12), double door (class13), sliding door (class14), and window (class15) were designated as either 1 or 0. The numbers of corresponding classes were also identified;
- Adjacent Spaces: These data were structured as an adjacency matrix, highlighting the connections of a particular space. If there was a wall or door connecting the space, it was marked as 1; otherwise, it was marked as 0. As per the adjacency definitions in Section 3.3, the connection weights for Cases 1, 2, and 3 were automatically set to 1, 0.5 for Case 2, and 0.25 for Case 3.
5. Discussion
5.1. Comparison of Dataset-Related Research
5.2. Implication
6. Conclusions
Author Contributions
Funding
Institutional Review Board Statement
Informed Consent Statement
Data Availability Statement
Conflicts of Interest
Nomenclature
Appendix A

| Category | Subdivision | Synonym |
|---|---|---|
| Living room | great room | great rm, grt rm |
| family room | family, fam rm, fam | |
| living room | living, liv rm, liv | |
| Dining | dining | breakfast nook, bfst, bfast, brk, dining rm, dining area, din, din rm, eating area |
| Kitchen | kitchen | country kitchen, kit |
| Bedroom | bedroom | bed rm, bed, br, bdrm, bedr |
| suite | suite, sui | |
| master suite | mstr ste | |
| master bedroom | master, master bed, master bdrm, mbr | |
| bonus room | bonus, bonus area, future future bonus, future bonus room | |
| guest room | guest, guest rm | |
| Private room | study room | nook, libr, library, library room, library rm |
| office room | office rm, office | |
| media room | media rm, media | |
| game room | game rm, game | |
| fitness room | fitness rm, fitness | |
| Closet room | closet | dress room, dress area, dress, drs, storage closet, waik in closet, walk-in, wic, clos, clo, clst |
| master closet | master closet, mclo, mcloset | |
| waik in closet room | waik in closet, wic | |
| Kitchen | kitchen | country kitchen, kit |
| Laundry room | laundry room | laundry, laund, lndry linen, lin, lnd |
| Pantry room | pantry room | pantry, pan |
| Utility room | utility room | utility, util |
| storage room | storage | |
| Bath room | bath | ba, half bath, w/d |
| master bath | master bath, mstr bath, mba, m.bath | |
| Foyer | foyer | foy, entry, entryway, lobby |
| Story | story | story, stor |
| Hall | hall | hall |
Appendix B
| Project and Space Names | Space Size | Doors and Windows | Adjacent Spaces | |||||||||||||||||||||||
|---|---|---|---|---|---|---|---|---|---|---|---|---|---|---|---|---|---|---|---|---|---|---|---|---|---|---|
| Project ID | Layer | Floor Plan ID | Space Name | Class | Random N | Ratio | Length Ratio | Area (sq/ft) | Space Area Ratio (%) | Building Total Area (sq/ft) | Class 12 | N | Class 13 | N | Class 14 | N | Class 15 | N | Space Name | Class Number | Random N | Wall | Door | Weight (Conversion) | ||
| Horizontal (%) | Vertical (%) | Horizontal (Ratio) | Vertical (Ratio) | |||||||||||||||||||||||
| 20-573 | 1 | 20-573-1 | Bedroom | 2 | 1 | 0.1748 | 0.2998 | 0.9701 | 1 | 98 | 0.0532 | 1835 | 1 | 3 | 0 | 0 | 0 | 0 | 1 | 2 | Closet | 11 | 2 | 1 | 1 | 0.25 |
| 20-573 | 1 | 20-573-1 | Bedroom | 2 | 1 | 0.1877 | 0.2837 | 1 | 0.908 | 98 | 0.0532 | 1835 | 1 | 3 | 0 | 0 | 0 | 0 | 1 | 2 | Closet | 11 | 3 | 1 | 1 | 0.25 |
| 20-573 | 1 | 20-573-1 | Bedroom | 2 | 1 | 0.1877 | 0.2837 | 1 | 0.908 | 98 | 0.0532 | 1835 | 1 | 3 | 0 | 0 | 0 | 0 | 1 | 2 | Hallway | 8 | 1 | 1 | 1 | 0.25 |
| 20-573 | 1 | 20-573-1 | Hallway | 8 | 1 | 0.1877 | 0.2837 | 1 | 0.908 | 47 | 0.0254 | 1835 | 1 | 4 | 0 | 0 | 0 | 0 | 0 | 0 | Living room | 1 | 1 | 0 | 0 | 1 |
| 20-573 | 1 | 20-573-1 | Hallway | 8 | 1 | 0.1003 | 0.2531 | 0.6596 | 1 | 47 | 0.0254 | 1835 | 1 | 4 | 0 | 0 | 0 | 0 | 0 | 0 | Closet | 11 | 1 | 1 | 1 | 0.25 |
| 20-573 | 1 | 20-573-1 | Hallway | 8 | 1 | 0.1003 | 0.2531 | 0.6596 | 1 | 47 | 0.0254 | 1835 | 1 | 4 | 0 | 0 | 0 | 0 | 0 | 0 | Laundry room | 10 | 1 | 1 | 1 | 0.25 |
| 20-573 | 1 | 20-573-1 | Hallway | 8 | 1 | 0.1003 | 0.2531 | 0.6596 | 1 | 47 | 0.0254 | 1835 | 1 | 4 | 0 | 0 | 0 | 0 | 0 | 0 | Living room | 1 | 1 | 0 | 0 | 1 |
| 20-573 | 1 | 20-573-1 | Hallway | 8 | 1 | 0.1003 | 0.2531 | 0.6596 | 1 | 47 | 0.0254 | 1835 | 1 | 4 | 0 | 0 | 0 | 0 | 0 | 0 | Bedroom | 2 | 1 | 1 | 1 | 0.25 |
| 20-573 | 1 | 20-573-1 | Hallway | 8 | 1 | 0.1003 | 0.2531 | 0.6596 | 1 | 47 | 0.0254 | 1835 | 1 | 4 | 0 | 0 | 0 | 0 | 0 | 0 | Bathroom | 4 | 1 | 1 | 1 | 0.25 |
| 20-573 | 1 | 20-573-1 | Closet | 11 | 1 | 0.1003 | 0.2531 | 0.6596 | 1 | 7 | 0.0037 | 1835 | 1 | 1 | 0 | 0 | 0 | 0 | 0 | 0 | Hallway | 8 | 1 | 1 | 1 | 0.25 |
| 20-573 | 1 | 20-573-1 | Kitchen | 3 | 1 | 0.0529 | 0.07 | 1 | 0.7959 | 85 | 0.0464 | 1835 | 1 | 1 | 0 | 0 | 0 | 0 | 0 | 0 | Living room | 1 | 1 | 0 | 0 | 1 |
| 20-573 | 1 | 20-573-1 | Kitchen | 3 | 1 | 0.1586 | 0.2926 | 0.9018 | 1 | 85 | 0.0464 | 1835 | 1 | 1 | 0 | 0 | 0 | 0 | 0 | 0 | Pantry room | 9 | 1 | 1 | 1 | 0.25 |
| 20-573 | 1 | 20-573-1 | Pantry room | 9 | 1 | 0.1586 | 0.2926 | 0.9018 | 1 | 4 | 0.0022 | 1835 | 1 | 1 | 0 | 0 | 0 | 0 | 0 | 0 | Kitchen | 3 | 1 | 1 | 1 | 0.25 |
| 20-573 | 1 | 20-573-1 | Stair room | 7 | 1 | 0.0367 | 0.0592 | 1 | 0.9706 | 50 | 0.0272 | 1835 | 1 | 1 | 0 | 0 | 0 | 0 | 1 | 1 | Entrance | 0 | 1 | 1 | 1 | 0.25 |
| 20-573 | 1 | 20-573-1 | Stair room | 7 | 1 | 0.1294 | 0.2101 | 1 | 0.975 | 50 | 0.0272 | 1835 | 1 | 1 | 0 | 0 | 0 | 0 | 1 | 1 | Entrance | 0 | 1 | 1 | 1 | 0.25 |
| 20-573 | 1 | 20-573-1 | Bathroom | 4 | 1 | 0.1294 | 0.2101 | 1 | 0.975 | 45 | 0.0244 | 1835 | 1 | 1 | 0 | 0 | 0 | 0 | 0 | 0 | Hallway | 8 | 1 | 1 | 1 | 0.25 |
| 20-573 | 1 | 20-573-1 | Garage | 19 | 1 | 0.164 | 0.149 | 1 | 0.5461 | 315 | 0.1714 | 1835 | 1 | 1 | 0 | 0 | 0 | 0 | 1 | 1 | Laundry room | 10 | 1 | 1 | 1 | 0.25 |
| 20-573 | 1 | 20-573-1 | Living room | 1 | 1 | 0.302 | 0.5673 | 0.8861 | 1 | 503 | 0.2742 | 1835 | 0 | 0 | 0 | 0 | 0 | 0 | 1 | 5 | Hallway | 8 | 1 | 0 | 0 | 1 |
| 20-573 | 1 | 20-573-1 | Living room | 1 | 1 | 0.4401 | 0.623 | 1 | 0.8505 | 503 | 0.2742 | 1835 | 0 | 0 | 0 | 0 | 0 | 0 | 1 | 5 | Kitchen | 3 | 1 | 0 | 0 | 1 |
| 20-573 | 1 | 20-573-1 | Living room | 1 | 1 | 0.4401 | 0.623 | 1 | 0.8505 | 503 | 0.2742 | 1835 | 0 | 0 | 0 | 0 | 0 | 0 | 1 | 5 | Hallway | 8 | 1 | 0 | 0 | 1 |
| 20-573 | 1 | 20-573-1 | Living room | 1 | 1 | 0.4401 | 0.623 | 1 | 0.8505 | 503 | 0.2742 | 1835 | 0 | 0 | 0 | 0 | 0 | 0 | 1 | 5 | Entrance | 0 | 1 | 0 | 0 | 1 |
| 20-573 | 1 | 20-573-1 | Porch | 18 | 1 | 0.4401 | 0.623 | 1 | 0.8505 | 187 | 0.1019 | 1835 | 1 | 1 | 0 | 0 | 0 | 0 | 0 | 0 | Entrance | 0 | 1 | 1 | 1 | 0.25 |
| 20-573 | 1 | 20-573-1 | Entrance | 0 | 1 | 0.3711 | 0.2747 | 1 | 0.4448 | 36 | 0.0194 | 1835 | 1 | 2 | 0 | 0 | 0 | 0 | 1 | 1 | Living room | 1 | 1 | 0 | 0 | 1 |
References
- Searle, J.R. Minds, brains, and programs. Behav. Brain Sci. 1980, 3, 417–424. [Google Scholar] [CrossRef]
- Chaillou, S. ArchiGAN: A Generative Stack for Apartment Building Design; NVIDIA Corporation: Santa Clara, CA, USA, 2019. [Google Scholar]
- Nauata, N.; Chang, K.H.; Cheng, C.Y.; Mori, G.; Furukawa, Y. House-gan: Relational generative adversarial networks for graph-constrained house layoutgeneration. In Computer Vision—ECCV 2020, Proceedings of the European Conference on Computer Vision (ECCV), Glasgow, UK, 23–28 August 2020; Springer: Cham, Switzerland, 2020; pp. 162–177. [Google Scholar] [CrossRef]
- Wu, W.; Xiao-Ming, F.; Tang, R.; Wang, Y.; Qi, Y.-H.; Liu, L. Data-driven interior plan generation for residential buildings. ACM Trans. Graph. 2019, 38, 234. [Google Scholar] [CrossRef]
- Hu, R.; Huang, Z.; Tang, Y.; Van Kaick, O.; Zhang, H.; Huang, H. Graph2plan: Learning floorplan generation from layout graphs. ACM Trans. Graph. 2020, 39, 118. [Google Scholar] [CrossRef]
- Park, H.; Suh, H.; Kim, J.; Choo, S. Floor plan recommendation system using graph neural network with spatial relationship dataset. J. Build. Eng. 2023, 71, 106378. [Google Scholar] [CrossRef]
- Davenport, T.H.; Ronanki, R. Artificial intelligence for the real world. Harv. Bus. Rev. 2018, 96, 108–116. [Google Scholar]
- Auric. Architecture & Urban Research Review. Available online: https://www.auric.or.kr/ (accessed on 19 July 2024).
- Liu, C.; Wu, J.; Kohli, P.; Furukawa, Y. Raster-to-vector: Revisiting floorplan transformation. In Proceedings of the IEEE International Conference on Computer Vision, Venice, Italy, 22–29 October 2017; pp. 2195–2203. [Google Scholar]
- Kalervo, A.; Ylioinas, J.; Haiki, M.; Karhu, A.; Kannala, J. CubiCasa5K: A dataset and an improved multi-task model for floorplan image analysis. In Image Analysis, Proceedings of the SCIA 2019, Norrköping, Sweden, 11–13 June 2019; Lecture Notes in Computer Science; Springer: Cham, Switzerland, 2019; Volume 11482, pp. 28–40. [Google Scholar] [CrossRef]
- Lu, Y.; Tian, R.; Li, A.; Wang, X.; Jose Luis, G.D.C.L. Cubigraph5k-organizational graph generation for structured architectural floor plan dataset. In Proceedings of the 26th CAADRIA Conference, Hong Kong, China, 29 March–1 April 2021; pp. 81–90. [Google Scholar] [CrossRef]
- Kim, G.; Gu, H.; Park, H.; Choo, S. Using genetic algorithm to automate the generation of an open-plan office layout. Int. J. Archit. Comput. 2022, 38, 67–74. [Google Scholar] [CrossRef]
- Kavakoglu, A.; Aysegul, A.; Bihter, E. AI Driven Creativity in Early Design Education-A pedagogical approach in the age of Industry 5.0. In Proceedings of the 40th Education and research in Computer Aided Architectural Design in Europe (eCAADe) Conference, Ghent, Belgium, 13–16 September 2022; Volume 1, pp. 133–142. [Google Scholar]
- Pizarro, P.N.; Hitschfeld, N.; Sipiran, I.; Saavedra, J.M. Automatic floor plan analysis and recognition. Autom. Constr. 2022, 140, 104348. [Google Scholar] [CrossRef]
- Hopgood, A.A. Intelligent Systems for Engineers and Scientists: A Practical Guide to Artificial Intelligence, 4th ed.; CRC Press: Boca Raton, FL, USA, 2021. [Google Scholar] [CrossRef]
- Cederfeldt, M. Planning Design Automation: A Structured Method and Supporting Tools. Ph.D. Thesis, Department of Product and Production Development, Chalmers University of Technology, Göteborg, Sweden, 2007. [Google Scholar]
- Carta, S. Self-organizing floor plans. Harv. Data Sci. Rev. HDSR 2021, 3, 1–35. [Google Scholar] [CrossRef]
- Seo, J.; Park, H.; Choo, S. Inference of Drawing Elements and Space Usage on Architectural Drawings Using Semantic Segmentation. Appl. Sci. 2020, 10, 7347. [Google Scholar] [CrossRef]
- Park, H.; Suh, H.; Kim, J.; Choo, S. AIBIM_House-Finder. Available online: https://github.com/andWHISKEY/AIBIM_House-Finder (accessed on 19 July 2024).
- Najork, M. Web Crawler Architecture. In Encyclopedia of Database Systems; Springer: Berlin/Heidelberg, Germany, 2009. [Google Scholar] [CrossRef]
- Houseplans. Search Nearly 40,000 Floor Plans and Find Your Dream Home Today. Available online: https://www.houseplans.com/ (accessed on 19 July 2024).
- Zeng, Z.; Li, X.; Yu, Y.K.; Fu, C.W. Deep floor plan recognition using a multi-task network with room-boundary-guided attention. In Proceedings of the IEEE/CVF International Conference on Computer Vision, Seoul, Republic of Korea, 27 October–2 November 2019; pp. 9096–9104. [Google Scholar] [CrossRef]
- Song, J.; Yu, K. Framework for Indoor Elements Classification via Inductive Learning on Floor Plan Graphs. ISPRS Int. J. Geo-Inf. 2021, 10, 97. [Google Scholar] [CrossRef]
- He, K.; Zhang, X.; Ren, S.; Sun, J. Spatial Pyramid Pooling in Deep Convolutional Networks for Visual Recognition. arXiv 2014. [Google Scholar] [CrossRef]
- Redmon, J.; Divvala, S.; Girshick, R.; Farhadi, A. You only look once: Unified, real-time object detection. In Proceedings of the IEEE Conference on Computer Vision and Pattern Recognition, Las Vegas, NV, USA, 27–30 June 2016; pp. 779–788. [Google Scholar]
- Duygulu, P.; Barnard, K.; de Freitas, J.F.; Forsyth, D.A. Object recognition as machine translation: Learning a lexicon for a fixed image vocabulary. In Proceedings of the Computer Vision—ECCV 2002: 7th European Conference on Computer Vision, Copenhagen, Denmark, 28–31 May 2002; Proceedings, Part IV. Springer: Berlin/Heidelberg, Germany, 2002; pp. 97–112. [Google Scholar] [CrossRef]
- Wikipedia. Data Annotation. Available online: https://simple.wikipedia.org/wiki/Data_annotation (accessed on 19 July 2024).
- Stehman, S.V. Selecting and interpreting measures of thematic classification accuracy. Remote Sens. Environ. 1997, 62, 77–89. [Google Scholar] [CrossRef]
- Powers, M.W. Evaluation: From Precision, Recall and F-Measure to ROC. arXiv 2010, arXiv:2010.16061. [Google Scholar] [CrossRef]
- Lv, X.; Zhao, S.; Yu, X.; Zhao, B. Residential floor plan recognition and reconstruction. In Proceedings of the IEEE/CVF Conference on Computer Vision and Pattern Recognition, Nashville, TN, USA, 19–25 June 2021; pp. 16717–16726. [Google Scholar] [CrossRef]
- IDR Group, National Institute of Informatics. LIFULL HOME’S. Available online: https://www.nii.ac.jp/dsc/idr/en/lifull (accessed on 19 July 2024).
- Murugan, G.; Moyal, V.; Nandankar, P.; Pandithurai, O.; John Pimo, E. A novel CNN method for the accurate spatial data recovery from digital images. Mater. Today Proceed. 2021, 80, 1706–1712. [Google Scholar] [CrossRef]
- Lu, Z.; Wang, T.; Guo, J.; Meng, W.; Xiao, J.; Zhang, W.; Zhang, X. Data-driven floor plan understanding in rural residential buildings via deep recognition. Inf. Sci. 2021, 567, 58–74. [Google Scholar] [CrossRef]
- Yamasaki, T.; Zhang, J.; Takada, Y. Apartment structure estimation using fully convolutional networks and graph model. In Proceedings of the 2018 ACM Workshop on Multimedia for Real Estate Tech, Yokohama, Japan, 11 June 2018; ACM: New York, NY, USA, 2018; pp. 1–6. [Google Scholar] [CrossRef]
- Takada, Y.; Inoue, N.; Yamasaki, T.; Aizawa, K. Similar floor plan retrieval featuring multi-task learning of layout type classification and room presence prediction. In Proceedings of the 2018 IEEE International Conference on Consumer Electronics, Las Vegas, NV, USA, 12–14 January 2018; IEEE: Las Vegas, NV, USA, 2018; pp. 1–6. [Google Scholar] [CrossRef]
- Yamada, M.; Wang, X.; Yamasaki, T. Graph Structure Extraction from Floor Plan Images and Its Application to Similar Property Retrieval. In Proceedings of the IEEE International Conference on Consumer Electronics (ICCE) 2021, Las Vegas, NV, USA, 10–12 January 2021; pp. 1–5. [Google Scholar] [CrossRef]
- Boden, M.A. Computer models of creativity. AI Mag. 2009, 30, 23. [Google Scholar] [CrossRef]


| Division | Class Name | Class Number | Color | |
|---|---|---|---|---|
| Indoor space | Public space | Living room | 1 | RGB(254,0,2) |
| Dining room | 20 | RGB(254,0,2) | ||
| Private space | Bedroom | 2 | RGB(255,255,0) | |
| Dressing room | 5 | RGB(255,255,0) | ||
| Closet | 11 | RGB(255,255,0) | ||
| Household space | Kitchen | 3 | RGB(0,0,254) | |
| Utility room | 6 | RGB(0,0,254) | ||
| Pantry room | 9 | RGB(0,0,254) | ||
| Laundry room | 10 | RGB(0,0,254) | ||
| Sanitary space | Bathroom | 4 | RGB(0,176,80) | |
| Aisle space | Entrance | 0 | RGB(128,15,181) | |
| Stair room | 7 | RGB(128,15,181) | ||
| Stair entrance | 17 | RGB(128,15,181) | ||
| Hallway | 8 | RGB(128,15,181) | ||
| Outdoor space | Porch | 18 | RGB(76, 76, 76) | |
| Garage | 19 | RGB(76, 76, 76) | ||
| Floor plan | |||
 | |||
| Definition of Adjacency in Spatial Relationships | |||
| Directly connected spaces | Case 1 |  | No walls (Completely open space) |
| Case 2 |  | Walls but no doors (Partially open space) | |
| Indirectly connected space | Case 3 |  | Walls and door or window |
| Disconnected space | - |  | Only walls |
| Step 1. Image input | Step 2. Class detection using YOLO model | Step 3. Center point calculated from bounding box | ||
 | → |  | → |  |
| Step 4. Connection by definition of adjacency | Step 5. Spatial relationship diagram extraction | |||
 | → | 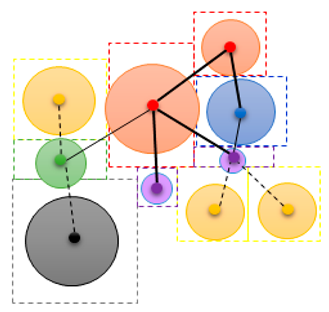 | ||
| Division | Case 1 | Case 2 | Case 3 | ||||||
|---|---|---|---|---|---|---|---|---|---|
| Definition | Completely open space | Partially open space | Indirectly connected space | ||||||
| Example |  |  |  | ||||||
| connection line | |||||||||
| Thick line | Thin line | Dotted line | |||||||
| Step 1. Detected Bounding Box | Step 2. Offset for Overlapping Regions | Step 3. Convert to Square and Determine Diagram Size | Step 4. Calculated Center Point | Step 5. Connect and Extract Circular Diagram | ||||
|---|---|---|---|---|---|---|---|---|
 | → |  | → |  | → |  | → |  |
| Procedure | Meaning of Input | Meaning of Output |
|---|---|---|
| Select floor plan → Search same project | Select one floor plan image | Search the same project as the selected floor plan image |
| Detection floor plan → Search class | Detect floor plan image | Search space and medium class |
| Connectalorithm.cs → Connection information | Run ‘Connectalorithm.cs’ to determine the adjacency of spatial relationships | Know connected information |
| Drawimages.cs → Show diagram image | Run‘Drawimages.cs’ | Show spatial relationship diagram image |
| Space Class | TP | FP | Precision (%) |
|---|---|---|---|
| Living room | 916 | 49 | 0.949 |
| Dining room | 191 | 45 | 0.809 |
| Bedroom | 2998 | 118 | 0.962 |
| Dressing room | 1279 | 108 | 0.922 |
| Closet | 2986 | 434 | 0.873 |
| Kitchen | 894 | 27 | 0.971 |
| Utility room | 693 | 259 | 0.728 |
| Pantry room | 360 | 122 | 0.747 |
| Laundry room | 728 | 279 | 0.723 |
| Bathroom | 2196 | 106 | 0.954 |
| Entrance | 391 | 95 | 0.805 |
| Stair room | 1000 | 48 | 0.954 |
| Stair entrance | 884 | 121 | 0.88 |
| Hallway | 2282 | 379 | 0.858 |
| Porch | 928 | 156 | 0.856 |
| Garage | 802 | 13 | 0.984 |
| Total | 19,528 | 2359 | 0.873 |
| Central Class | TP | FP | Precision (%) |
|---|---|---|---|
| Single door | 10,748 | 474 | 0.958 |
| Double door | 1228 | 105 | 0.921 |
| Sliding door | 1876 | 341 | 0.846 |
| Window | 11,322 | 247 | 0.901 |
| Opening | 1933 | 406 | 0.826 |
| Total | 27,107 | 2573 | 0.89 |
| Project and Space Names | Space Size | Doors and Windows | Adjacent Spaces | |||||||||||||||||||||||
|---|---|---|---|---|---|---|---|---|---|---|---|---|---|---|---|---|---|---|---|---|---|---|---|---|---|---|
| Ratio | Length Ratio | Area (sq/ft) | Space Area Ratio (%) | Building Area (sq/ft) | Class12 | Number | Class13 | Number | Class14 | Number | Class15 | Number | Space Name | Class Number | Random N | Wall | Door | Weight (Conversion) | ||||||||
| Project ID | Layer | Floor Plan ID | Space Name | Class Number | Random N | Horizontal (%) | Vertical (%) | Horizontal (Ratio) | Vertical (Ratio) | |||||||||||||||||
| 20-573 | 1 | 20-573-1 | Dining room | 20 | 1 | 0.1748 | 0.2998 | 0.9701 | 1 | 96 | 0.0524 | 1835 | 0 | 0 | 0 | 0 | 0 | 0 | 1 | 1 | Entrance | 0 | 1 | 1 | 1 | 0.5 |
| Dataset Name (Year) | Public Access | Model | Annotation | Number of Plans | Performance | Applied Studies |
|---|---|---|---|---|---|---|
| CubiCasa5K (2019) | ○ | Multi-task Model | 80 object categories (doors, windows, walls, etc.) | 5000 | Rooms (Mean accuracy 69.8%) (MIoU 57.5%) | Indoor elements classification [23], Vectorized 3D reconstruction [31], Spatial data recovery [32], Floor plan layout analysis [33] |
| Korea LH (2019) | ○ | DeepLabV3+ | 5 elements (walls, windows, hinged doors, sliding doors and evacuation doors) and 7 space (rooms, entrances, balconies, dress rooms, bathrooms, living rooms, evacuation space, and pantries) | 343 | Elements (MIoU 80.68%) Room (MIoU 81.75%) | Generating GAN-based zoning [18] |
| LIFULL (2020) | X | - | dataset contains the data of LIFULL HOME’S, a Real Estate Information Service in Japan | 5,300,000+ | - | Apartment structure estimation [34], Application to similar property retrieval [35,36] |
| RFP (2021) | ○ | YOLOv4, DeepLabv3+ | 4 elements (wall, window, door, doorway) and 7 room types (balcony, bedroom, kitchen, other, library, living room, toilet) | 7000 | Elements and Rooms (MIoU 85%) | - |
| AIBIM_House (2023) | ○ | YOLOv3 | 16 space class(living room, dining room, bedroom, etc.) and 5 medium class (doors, windows, etc.) | 14,970 | Space classes (mAP 87.3%) Mediums classes (mAP 89%) | Floor plan recommendation system [6] |
Disclaimer/Publisher’s Note: The statements, opinions and data contained in all publications are solely those of the individual author(s) and contributor(s) and not of MDPI and/or the editor(s). MDPI and/or the editor(s) disclaim responsibility for any injury to people or property resulting from any ideas, methods, instructions or products referred to in the content. |
© 2024 by the authors. Licensee MDPI, Basel, Switzerland. This article is an open access article distributed under the terms and conditions of the Creative Commons Attribution (CC BY) license (https://creativecommons.org/licenses/by/4.0/).
Share and Cite
Park, H.; Gu, H.; Hong, S.; Choo, S. Developing a Robust Training Dataset for AI-Driven Architectural Spatial Layout Generation. Appl. Sci. 2024, 14, 7095. https://doi.org/10.3390/app14167095
Park H, Gu H, Hong S, Choo S. Developing a Robust Training Dataset for AI-Driven Architectural Spatial Layout Generation. Applied Sciences. 2024; 14(16):7095. https://doi.org/10.3390/app14167095
Chicago/Turabian StylePark, Hyejin, Hyeongmo Gu, Soonmin Hong, and Seungyeon Choo. 2024. "Developing a Robust Training Dataset for AI-Driven Architectural Spatial Layout Generation" Applied Sciences 14, no. 16: 7095. https://doi.org/10.3390/app14167095