Article

Field Test and Numerical Simulation Study on Water Pressure Distribution and Lining Deformation Law in Water-Rich Tunnel Crossing Fault Zones

School of Highway, Chang’an University, South Second Ring Rd., Yanta District, Xi’an 710064, China
*
Author to whom correspondence should be addressed.
Appl. Sci. 2024, 14(16), 7110; https://doi.org/10.3390/app14167110
Submission received: 20 May 2024 / Revised: 29 June 2024 / Accepted: 5 August 2024 / Published: 13 August 2024
(This article belongs to the Section Civil Engineering)

Abstract

:

Featured Application

This paper examines the water pressure distribution and tunnel lining deformation in a water-rich tunnel crossing a fault zone, utilizing field tests and numerical simulations. The findings are applicable to the development of tunnels under similar geological conditions.

Abstract

This study investigates the water pressure distribution and deformation patterns in tunnel linings within water-rich tunnels traversing fault zones, focusing on the Gudou Mountain Tunnel. The study utilized field tests and numerical simulations to assess the water pressure distribution around test sections. Following the confirmation of consistent water pressure distribution patterns from field tests and simulations, we analyzed the deformation patterns of tunnel linings at various water levels. The results showed that water pressure is highest at the tunnel’s inverted arch and arch foot, moderately high at the vault and spandrel, and lowest at the arch waist. The sections RK51 + 590 and LK51 + 640, located on opposite sides of a fault crush zone, experience high fragmentation of surrounding rock. This allows rainfall and reservoir water to seep through fractures, causing increased water pressure and significant deformation at the inverted arch of these sections. With rising groundwater levels, deformation intensifies at the inverted arch, arch foot, and vault. The appearance of macro-cracks in these critical areas leads to groundwater seepage through the cracks, severely impacting tunnel operations. Consequently, reinforcing the inverted arch, arch foot, and vault is crucial to reduce the risk of water leakage in the tunnel.

1. Introduction

Groundwater significantly contributes to defects in tunnel operations [1,2]. In water-rich tunnels, high water pressure frequently leads to lining cracks, which are exacerbated by groundwater, significantly shortening the tunnel’s service life [3]. Statistics show that 80% of tunnels in southern China experience lining cracks, seepage, or leakage during operation [4,5].
The impact of unique geological conditions like faults and dam embankments on tunnel safety is significant during both construction and operation [6]. Recently, researchers have investigated water damage in tunnels within challenging geological settings. Field tests and numerical simulations are primary methods for studying underground engineering stability [7]. Field tests are particularly effective in capturing the actual distribution patterns of the seepage field surrounding tunnels. Chen et al. [8] conducted a field seepage test on closely spaced tunnels in water-abundant regions. The study findings suggest that the water pressure inside these tunnels is typically lower than outside. While the grouting ring effectively severs the hydraulic connection between the surrounding rock and groundwater, its ability to withstand pressure diminishes when groundwater levels rise excessively. Li et al. [9] conducted a seepage test to address the imbalance between the recharge and discharge of groundwater around tunnels under heavy rainfall conditions. The spatial distribution characteristics of the seepage field in variable water level tunnels indicate that the grouting cycle exacerbates the uneven distribution of water pressure behind the lining. Li et al. [10] treated the tunnel grouting ring and lining structure as a single entity. They proposed a spatial distribution formula for pore water pressure around tunnels based on Harr’s classic analytical solution. Field experiment data indicate that tunnels equipped with both grouting rings and linings better align with theoretically derived water pressure results compared to tunnels without linings. Liang et al. [11] analyzed the influence of tunnel construction phases on ground settlement through field tests. They identified fluctuations in tunnel pore water pressure as the primary cause of sand layer settlement. Based on an analysis of tunnel excavation parameters, they evaluated the effectiveness of on-site grouting reinforcement in the sandy soil layer. Li et al. [12] compared the analytical solution of tunnel seepage field distribution characteristics with field measurements of precipitation and groundwater distribution. They demonstrated that increased precipitation depth and aquifer thickness lead to a significant rise in pore water pressure, confirming the accuracy of the numerical analytical solution. Li et al. [13] discovered that an increase in the permeability coefficient of the grouting ring results in higher water pressure behind the tunnel lining structure. Additionally, using a grouting ring with a lower permeability coefficient in water-rich tunnels can effectively reduce the impact of groundwater seepage on the lining structure. Mei et al. [14] investigated the influence of grouting slurry parameters and geotechnical parameters on the lining structure of shield tunnels through field tests. The results indicated that the setting rate of the grouting slurry is negatively correlated with the uplift of the tunnel lining, whereas the elastic modulus of the geotechnical body is positively correlated with the uplift of the tunnel lining. The above studies indicate that conducting field tests can effectively and accurately identify the distribution characteristics of the tunnel seepage field. However, the impact of high water pressure around tunnels in water-rich areas on the lining structure remains a major concern. Due to on-site construction limitations, thoroughly investigating the deformation mechanisms of tunnel lining structures is often challenging. Nonetheless, numerical simulations can address this limitation.
Using numerical software to establish a model of the tunnel and the surrounding geotechnical body allows for the flexible simulation of various working conditions of the tunnel under fluid–solid coupling conditions. Shi et al. [15] considered the construction processes of tunnel lining installation, grouting material solidification, and tunnel excavation advancement to establish a refined numerical model. The results showed that the pore water pressure induced during tunnel construction is most affected by grouting support pressure, while the tunnel diameter and the compressibility of the surrounding geotechnical body have a smaller impact on the lining structure. He et al. [16] simulated the impact of uneven water pressure on the lining structure of water-rich tunnels. The simulation results indicated that under high external water pressure, tensile failure occurs at the arch foot and invert of the lining structure, while compressive failure occurs at the crown of the lining structure due to the surrounding rock pressure. Yang et al. [17] considered that groundwater infiltration reduces the mechanical properties of the surrounding rock and proposed a safety assessment method for water-rich tunnels in mudstone and sandstone formations. The reliability of this numerical assessment method was demonstrated in actual engineering projects. Huang et al. [18] derived the water resistance conversion coefficient of the tunnel lining structure through numerical calculations, subsequently converting the water pressure from model tests into the actual water pressure resistance applied to the lining. The existing analytical solution for the external water pressure of circular tunnels underestimates the water pressure at the invert. To address the issue of water leakage in water-rich tunnels, Zhu et al. [19] proposed an analytical solution for the distribution of external water pressure in non-circular tunnels and corrected the analytical solution for high external water pressure distribution in tunnels based on this. The finite discrete element method (FDEM) has not been previously applied to the study of the mechanical characteristics of mudstone. Based on the FDEM method, Wang et al. [20] discovered that an increase in the water content of mudstone results in a decrease in compressive strength and an increase in expansive deformation. The study results provide guidance for determining the lining structure parameters of water-rich tunnels in mountainous regions. Under high internal water pressure, DRC segments in shield tunnels develop cracks. Zhang et al. [21] addressed this problem by using MSC Marc to simulate the constitutive relationship distribution of DRC segments, effectively capturing their nonlinear behavior under combined loading conditions. Xie et al. [22] found in their simulation of water and mud inrush in water-rich fault tunnels that the inrush particles inside the tunnel exhibit an elliptical distribution. Excessive changes in groundwater flow velocity can cause negative pore water pressure. To efficiently calculate the external water pressure on tunnel linings in horizontal strata, Luo et al. [23] assumed that the strata traversed by the tunnel are entirely horizontal. They optimized the analytical solution for the external water pressure on tunnel linings and demonstrated that this theoretical solution is more accurate than the numerical solution. Jiang et al. [24] analyzed the deformation characteristics of tunnel lining structures in karst areas. Based on the relationship between the grouting ring and the lining structure, they proposed an analytical solution formula for groundwater level and tunnel seepage fields. The research results can help mitigate the adverse effects of karst water on tunnel linings. Addressing the water leakage issue in fault tunnel lining structures, Zhao et al. [25] simulated the surrounding rock in the fault fracture zone using fixed particles, moving particles, and the water phase. They observed that the groundwater seepage time in the fault area decreases with increasing initial water flow velocity. Additionally, the seepage time of groundwater is influenced by the dynamic viscosity and structure of the surrounding rock. Numerical simulation methods can effectively model the seepage field around tunnels and compensate for the limitations of field tests. However, they rely heavily on substantial original field data, necessitating a close integration of both methods.
This study conducted field experiments to examine water pressure distribution in water-rich tunnels crossing fault zones. Using the acquired field data, simulations with FLAC3D 5.0 finite difference software modeled the water pressure distribution and deformation characteristics of the tunnel lining under various groundwater levels. The study offers valuable insights for designing and monitoring tunnels under similar geological conditions.

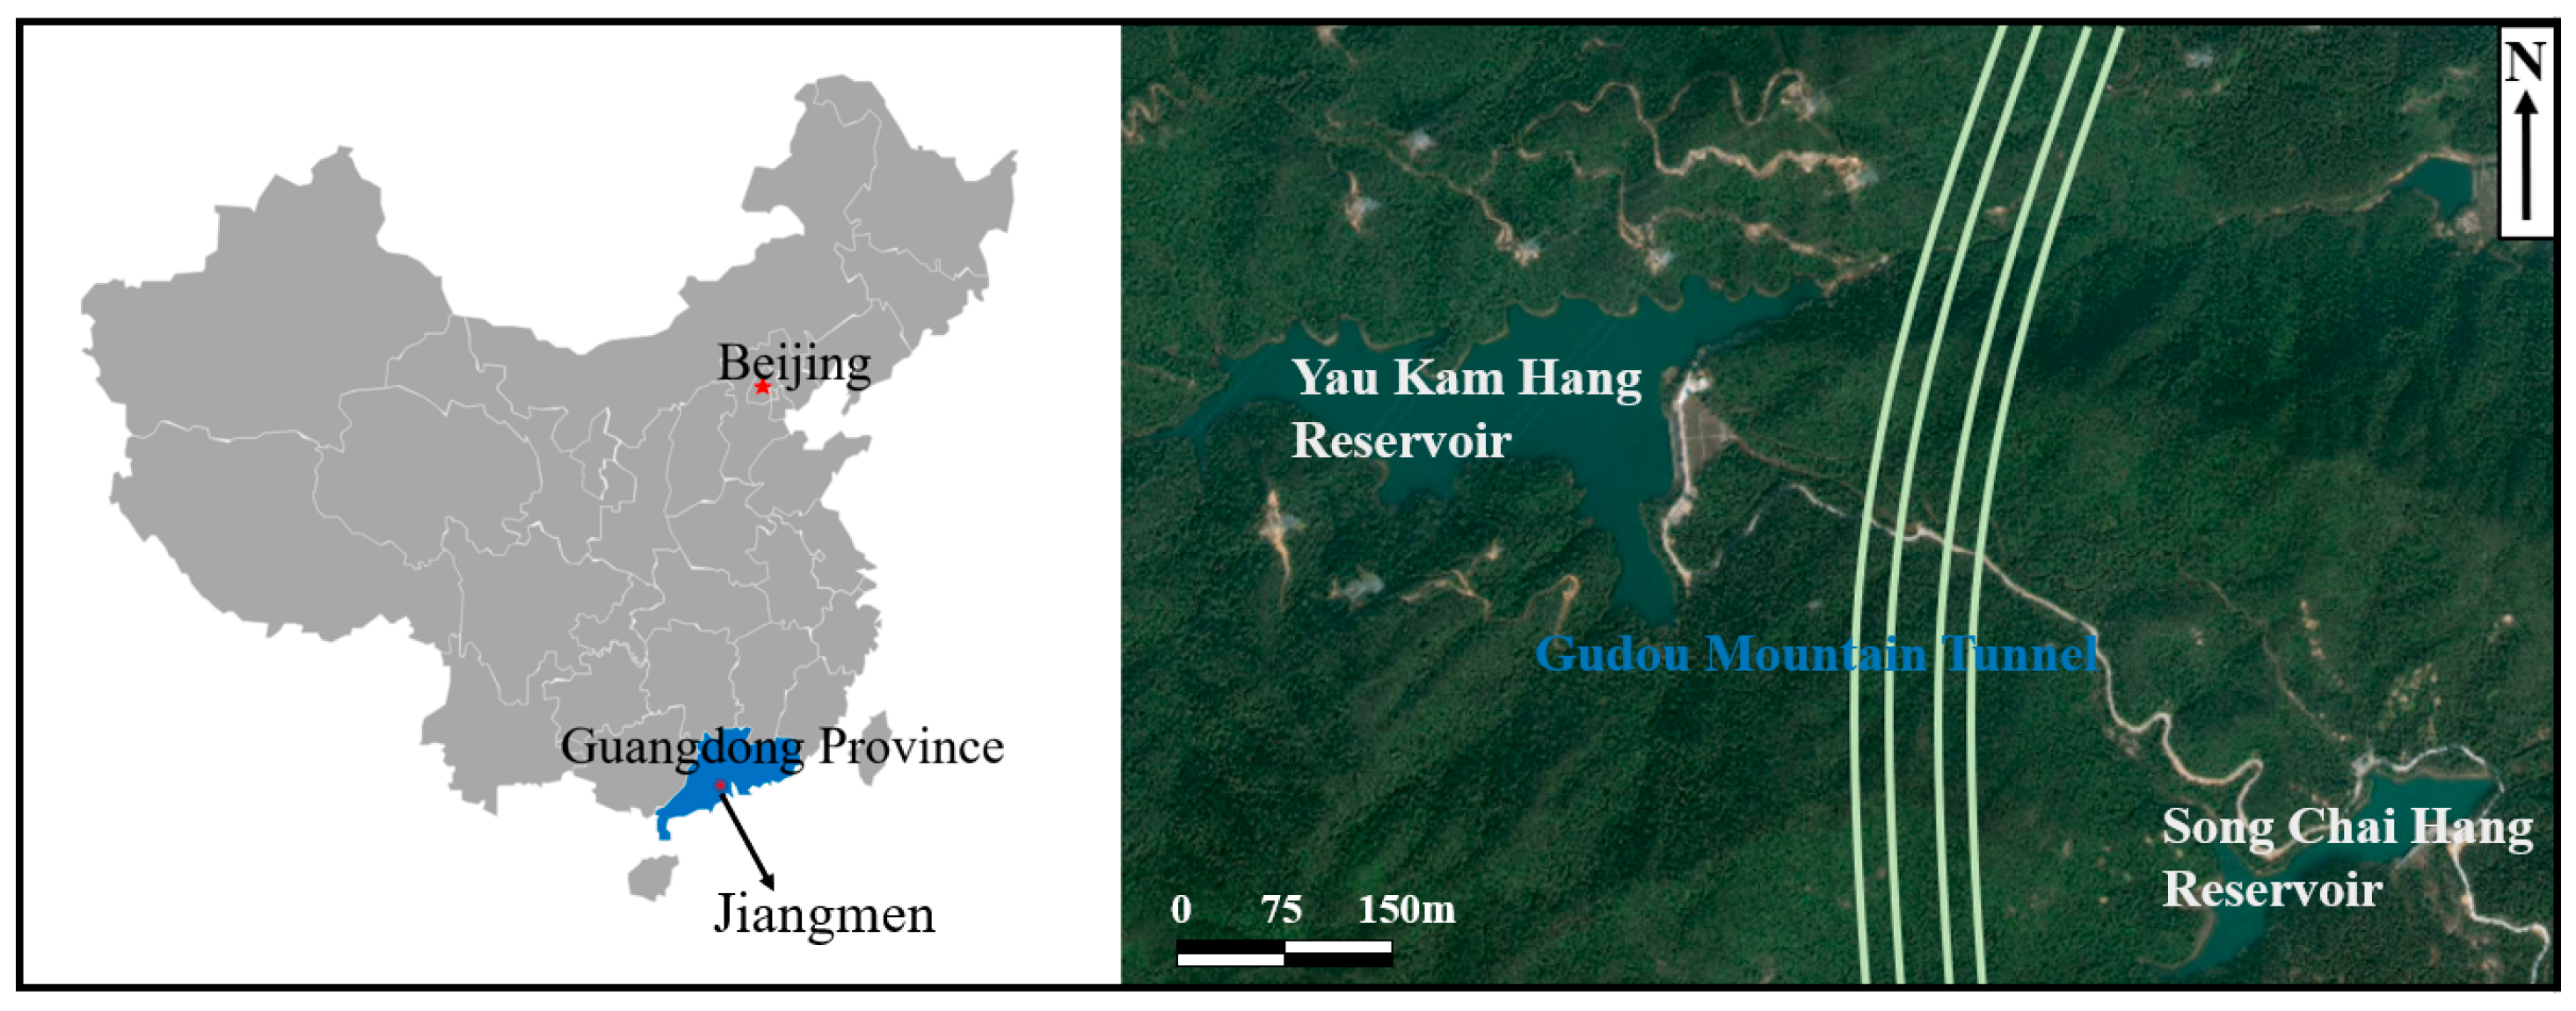
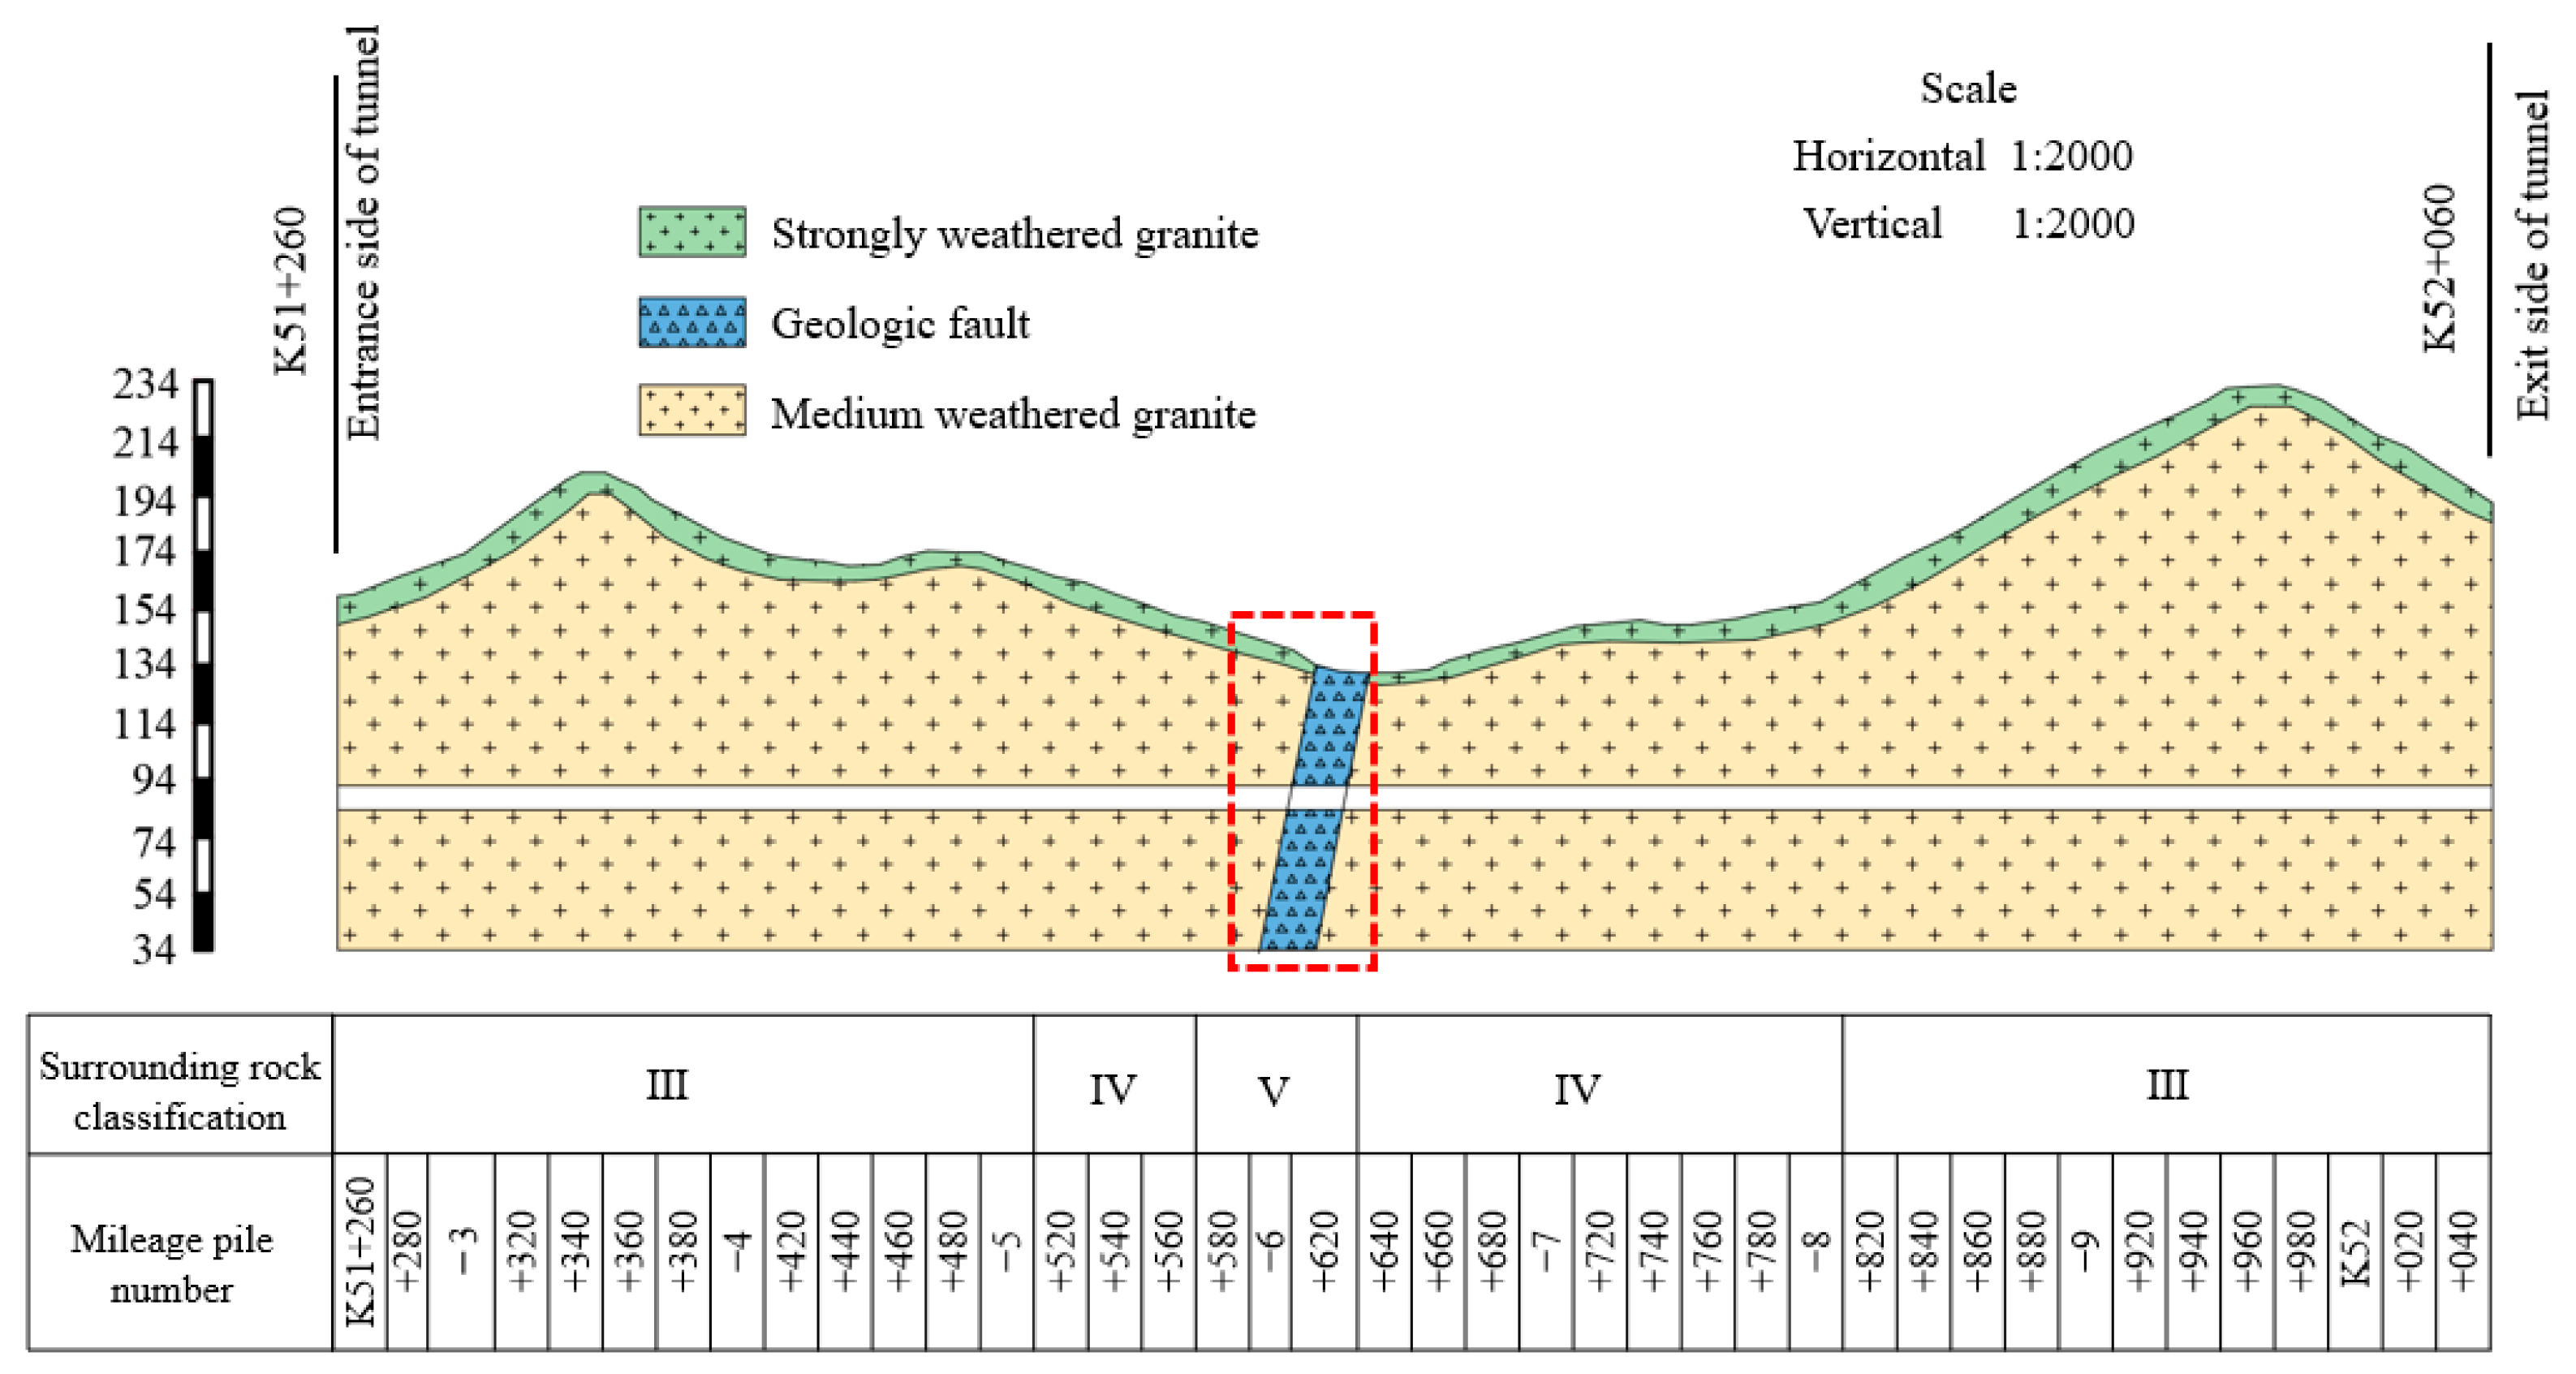
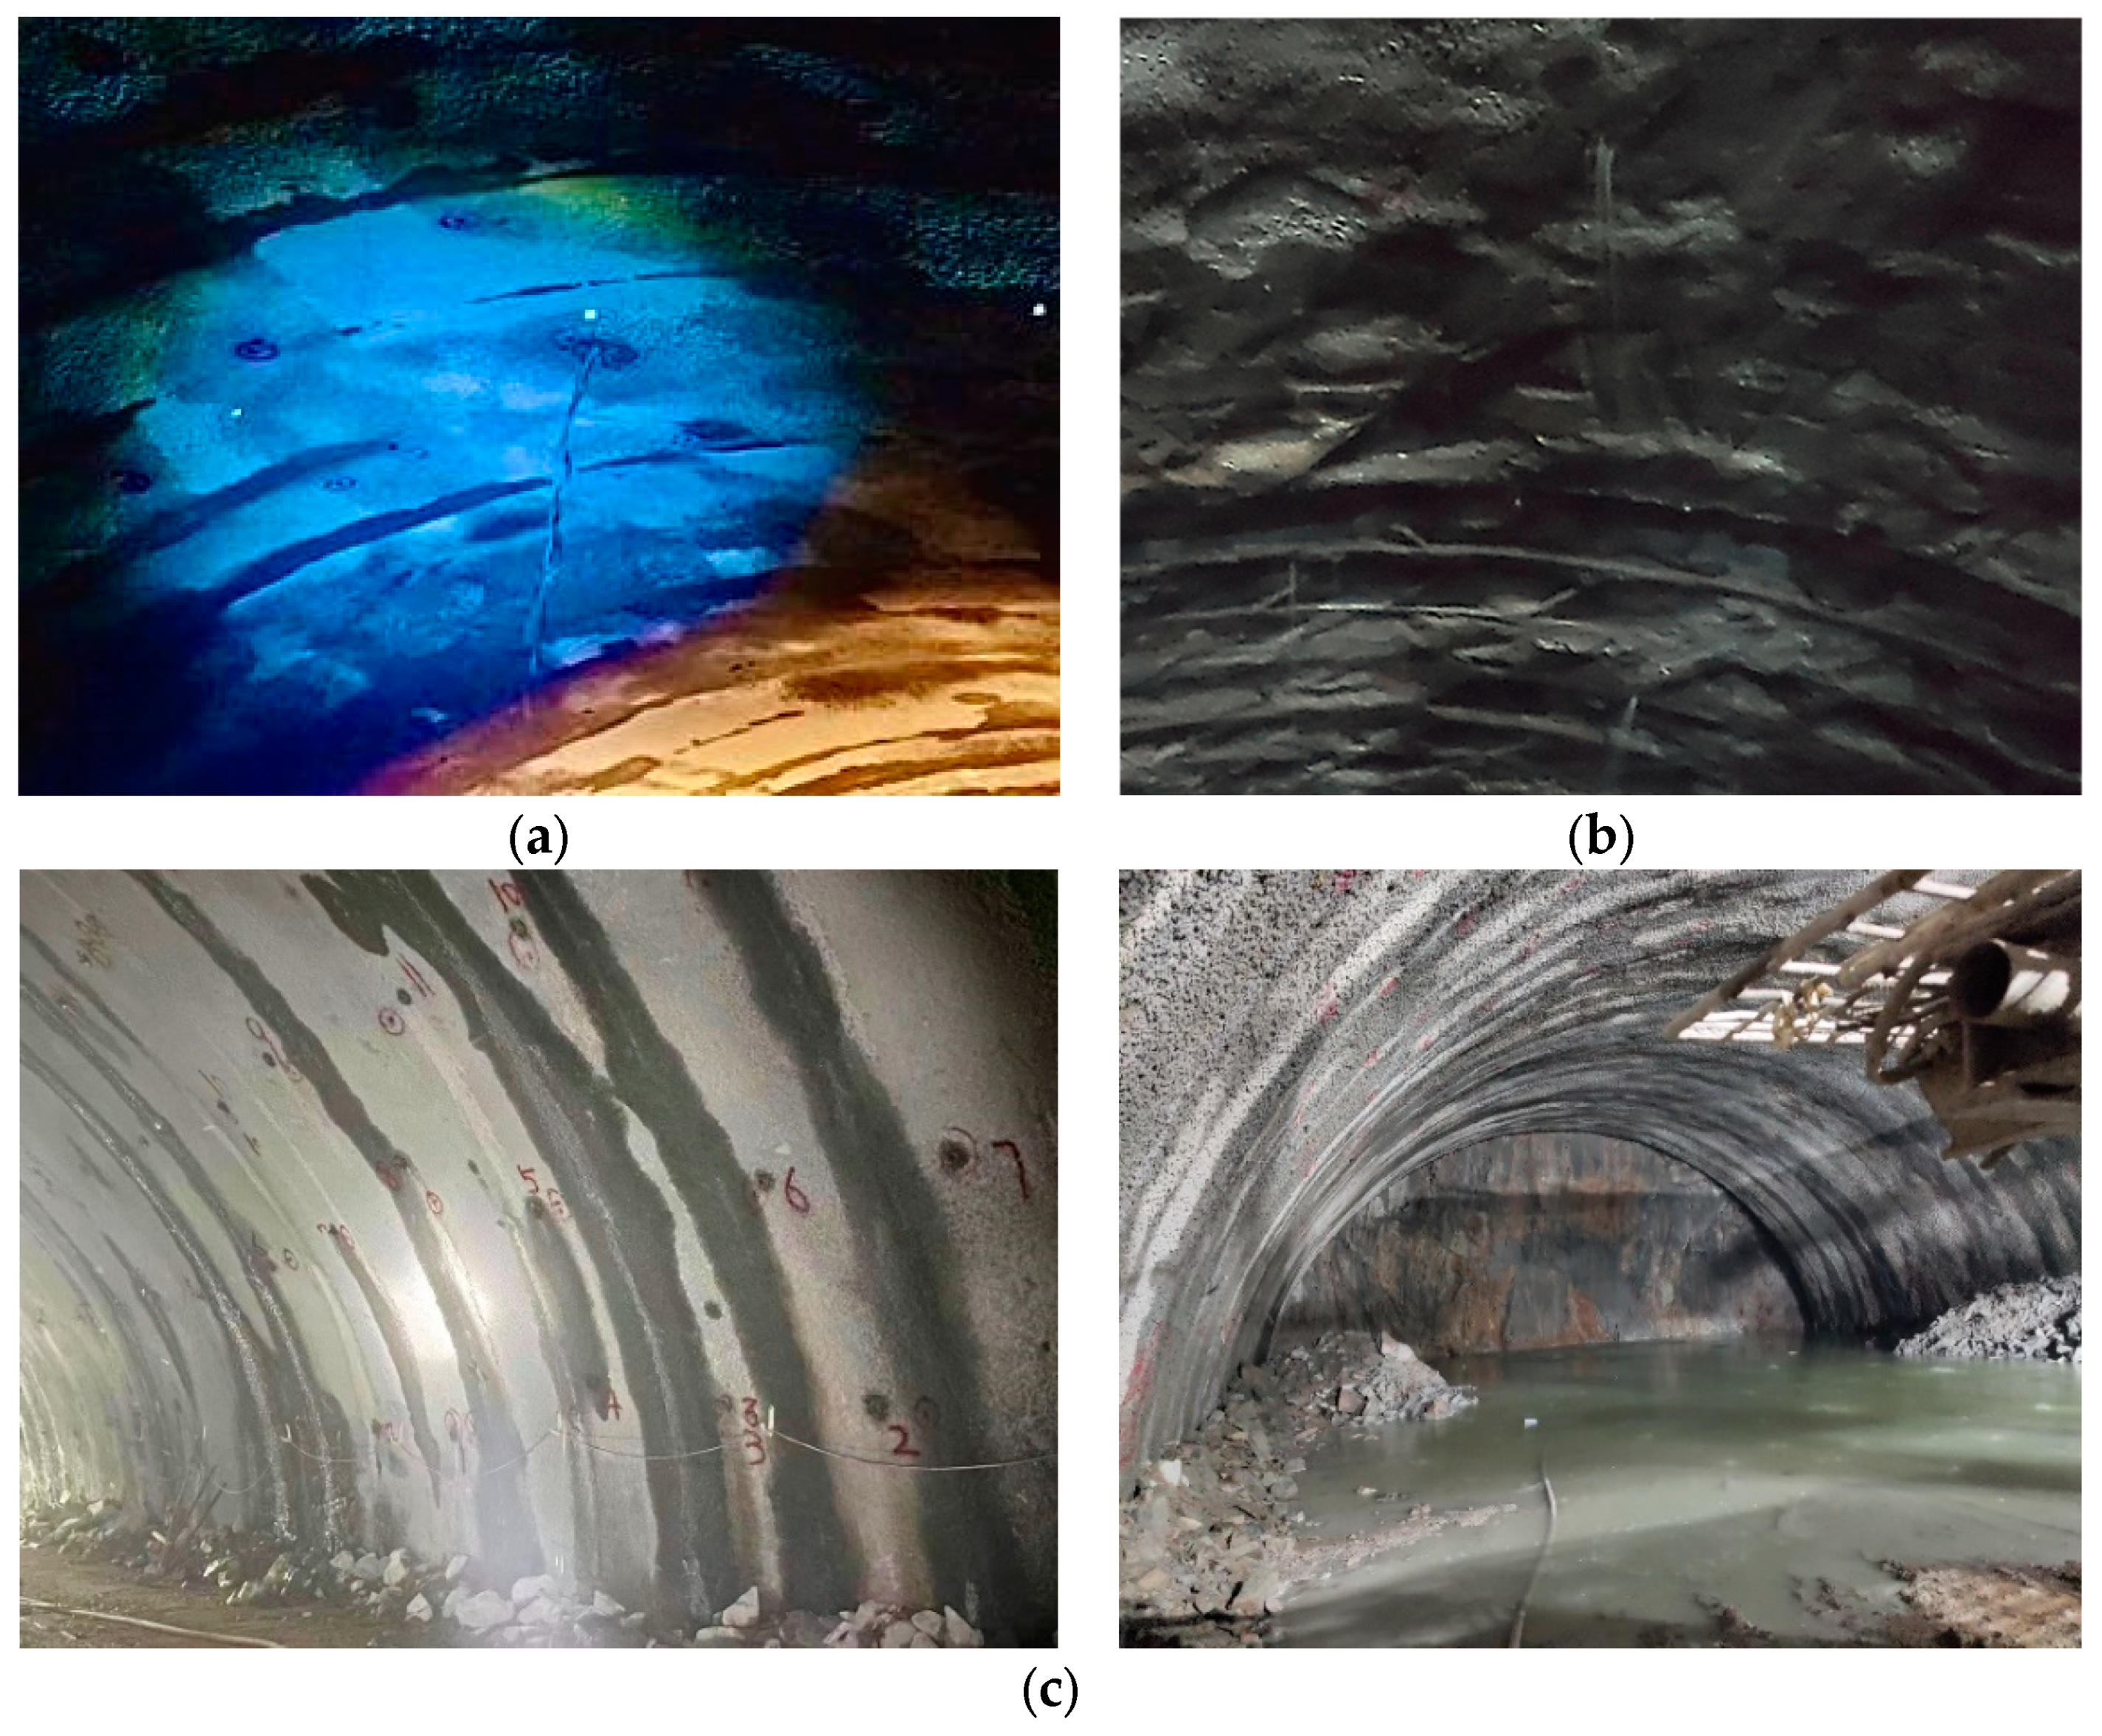
2. Overview of the Project

The Gudou Mountain Tunnel is located at the southern end of the Yinzhou Lake Expressway in Jiangmen, Guangdong Province. The tunnel spans 3293 m, featuring a bi-directional, six-lane design with each tunnel having a width of 15.5 m, a height of 5 m, and a 32 m gap between the two tunnels. The gully in the tunnel area is wide and slightly semi-enclosed, and the surface streams are perennial, so there are many water conservancy facilities in the reservoir. According to the hydrogeological report, the main reservoirs associated with the Gudou Mountain Tunnel are the Yau Kam Hang and Song Chai Hang Reservoirs. The spatial relationship between the tunnel and these reservoirs is detailed in Figure 1.
The engineering geological investigation of the Gudou Mountain Tunnel revealed that a fault crosses the tunnel at 20°∠75°. It intersects the tunnel at K51 + 610 m at an oblique angle of 61°, impacting the section from K51 + 590 to K51 + 640 m. The fault zone primarily consists of crushed and fragmented rock. Figure 2 illustrates that the tunnel site’s stratigraphic surface is of quaternary layers underlain by Yanshanian granites.
The Gudou Mountain Tunnel is situated adjacent to a reservoir and traverses a fault fracture zone. Developed joints and fissures in the fault zones may facilitate deep water conduction and create water-rich spaces, enabling a hydraulic connection between the tunnel and the reservoir. Following the completion of initial tunnel support, water gushing occurred at multiple points in the vault, with seepage at the arch waist and significant water flow at the inverted arch, as depicted in Figure 3.
During tunnel operation, increased rainy season precipitation raises both the groundwater level at the tunnel site and the reservoir water level. Considering water’s erosive effects on strata, new seepage channels may form in the surrounding rock with nodal fissures in the faults likely becoming conduits between the tunnel and reservoir. The Gudou Mountain Tunnel’s design specifications mandate regular monitoring of the tunnel lining’s deformation during operation to prevent seepage and leakage and ensure safe tunnel operation.
Using the K51 + 590~K51 + 640 tunnel section as a prototype, with steep mountains on either side conducive to rainfall accumulation, we examine the distribution of water pressure and deformation patterns in the tunnel lining across the fault zone during operation based on field test and numerical simulation. According to Chinese Highway Tunnel Design Standards, the quality levels of the peripheral and fault rock bodies in this section are classified as IV and V, respectively. Physical and mechanical parameters of the tunnel’s surrounding and fault rock were derived from geological data and an indoor test of the Gudou Mountain Tunnel, as detailed in Table 1.
The tunnel features anchoring and shotcrete support with a U-shaped lining design. Rock support for the tunnel vault and sidewalls consists of 22 mm diameter, 300 cm long resin bolts. Initial support is provided by 24 cm thick C25 shotcrete, which is reinforced with rock bolts, steel mesh, and steel arches. The secondary lining comprises 55 cm thick C30 concrete. Between the initial and secondary linings, a waterproof layer of EVA sheeting and non-woven fabric is installed, which is complemented by circular blind drains running longitudinally for drainage.

3. Field Test of Water Pressure around the Tunnel

Influenced by reservoirs, gully topography, and fault fracture zones, the Gudou Mountain Tunnel experiences increased groundwater levels and water pressure behind the lining during rainy seasons, leading to potential seepage and leakage during operation. To determine the water pressure distribution around the tunnel, a field test was conducted. Feedback from monitoring and measuring water pressure near the tunnel lining provides reliable data for subsequent numerical simulations.

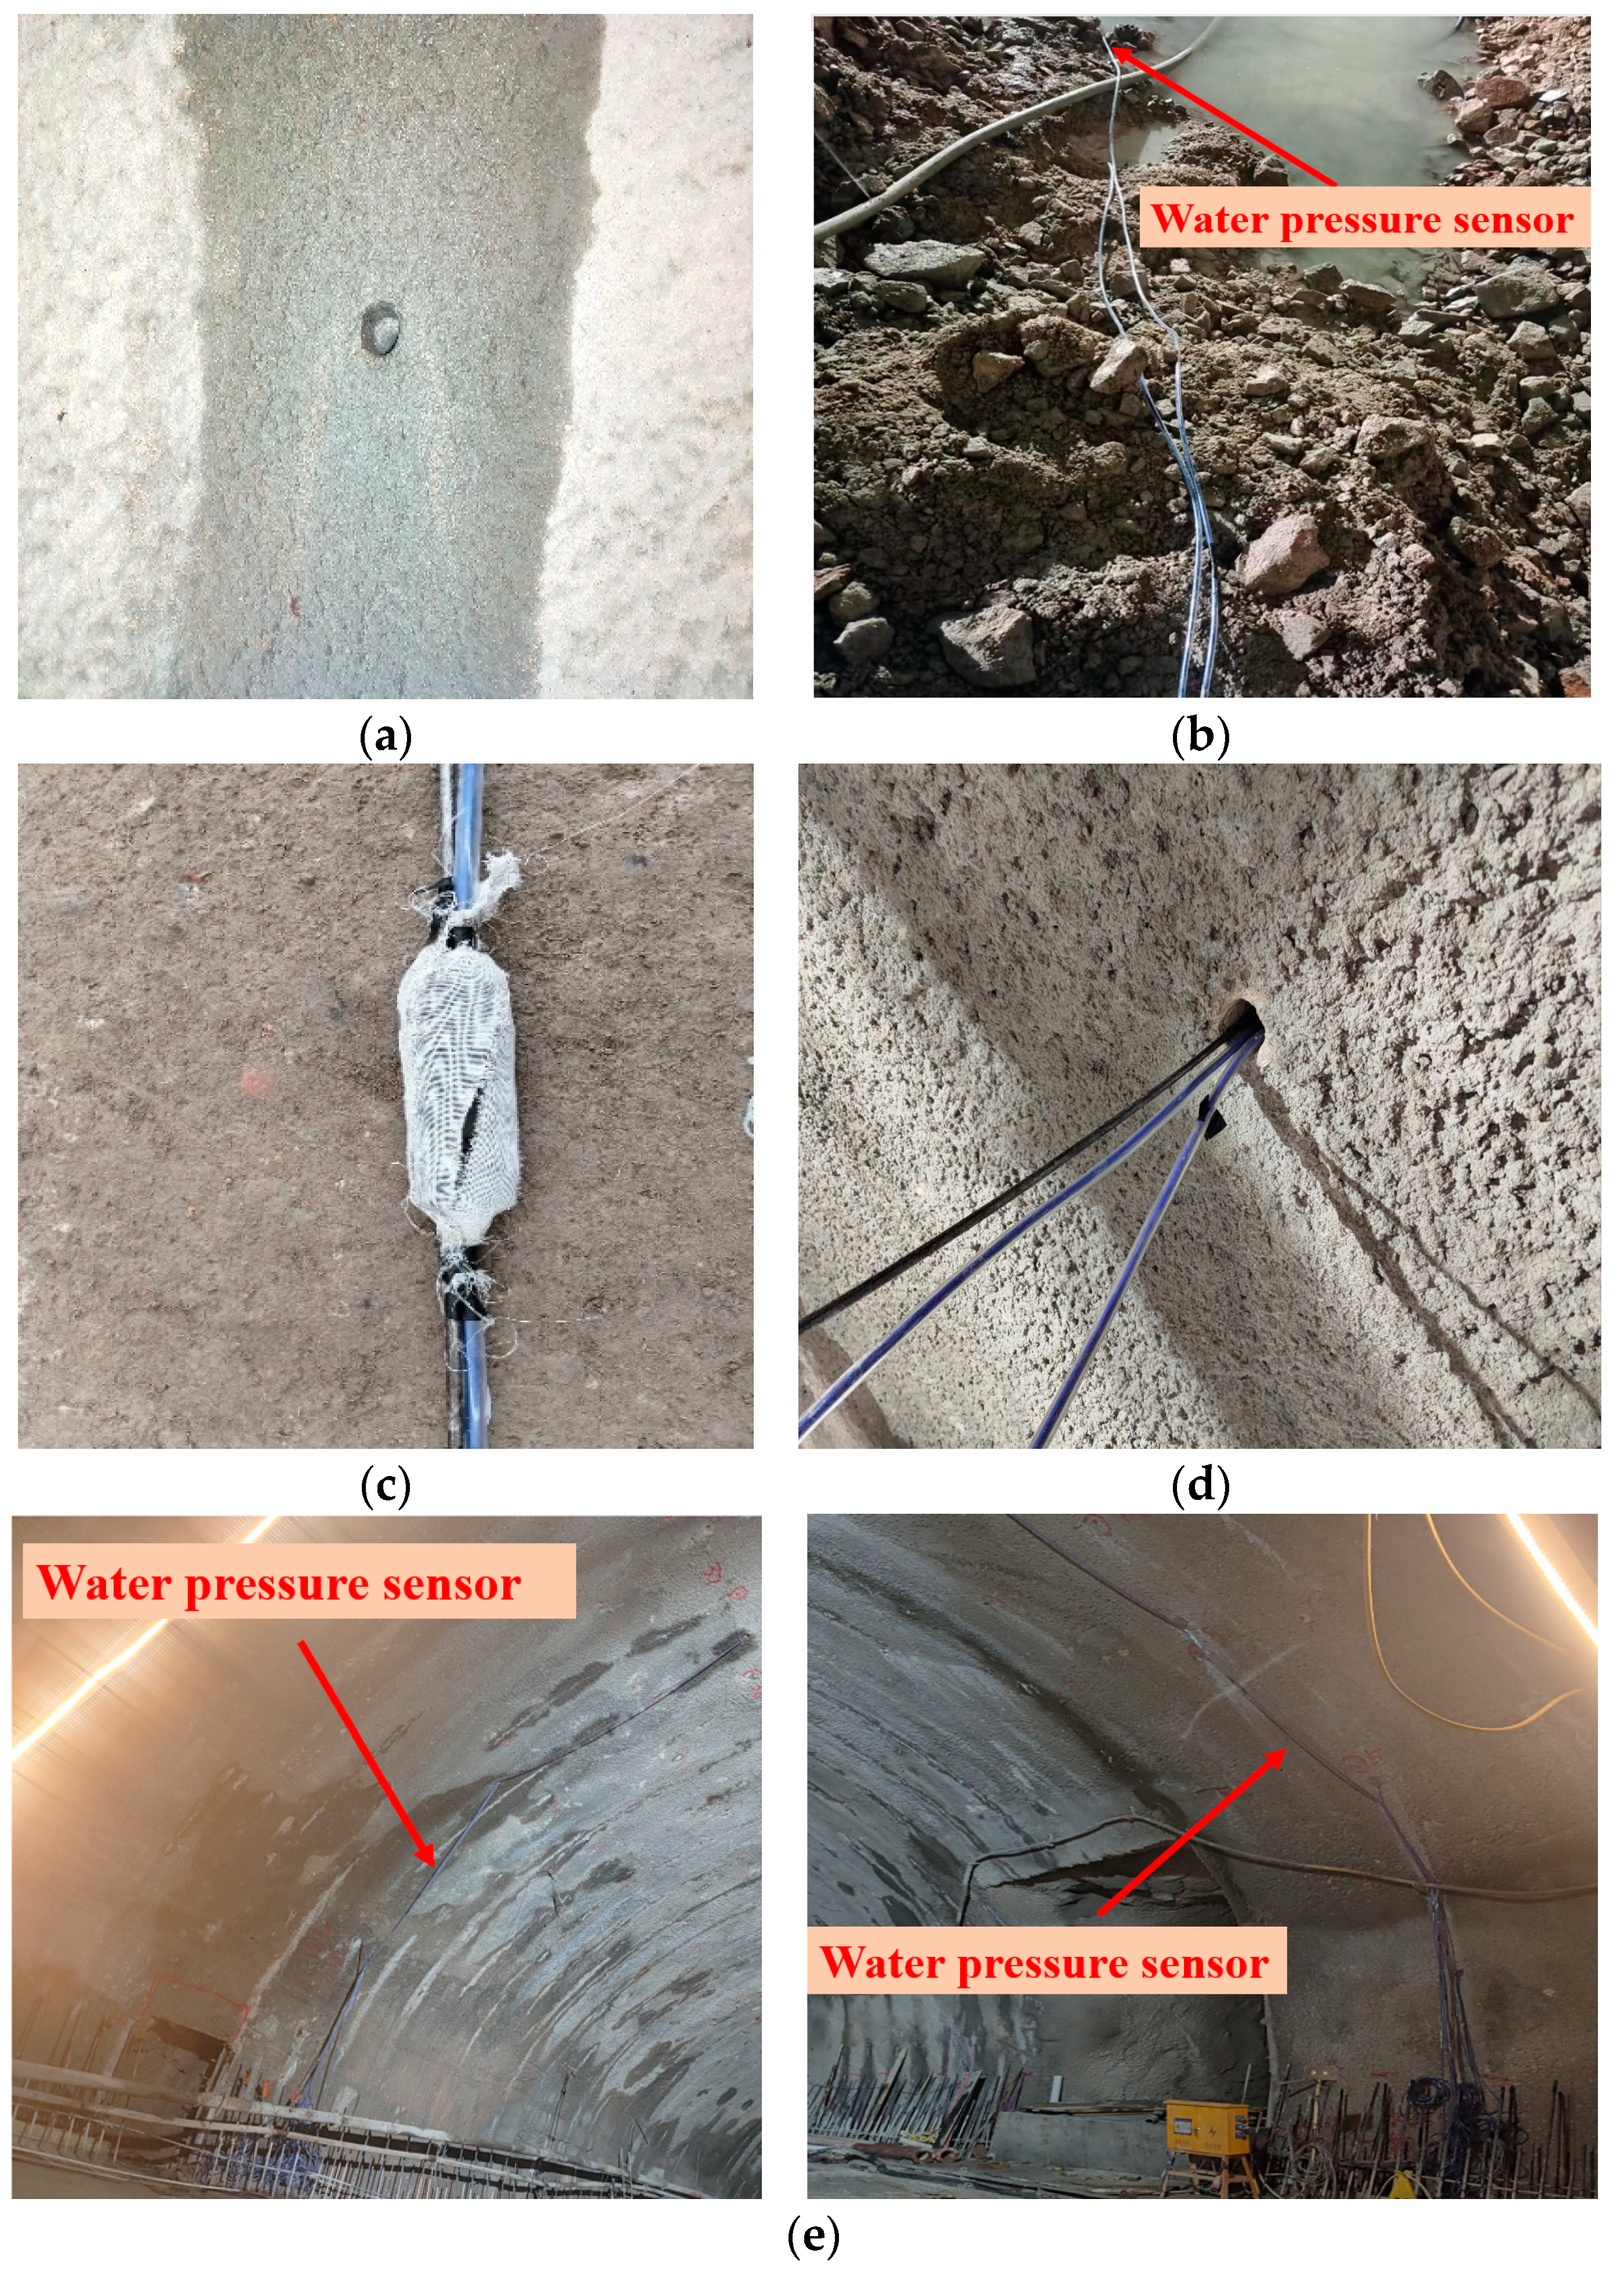
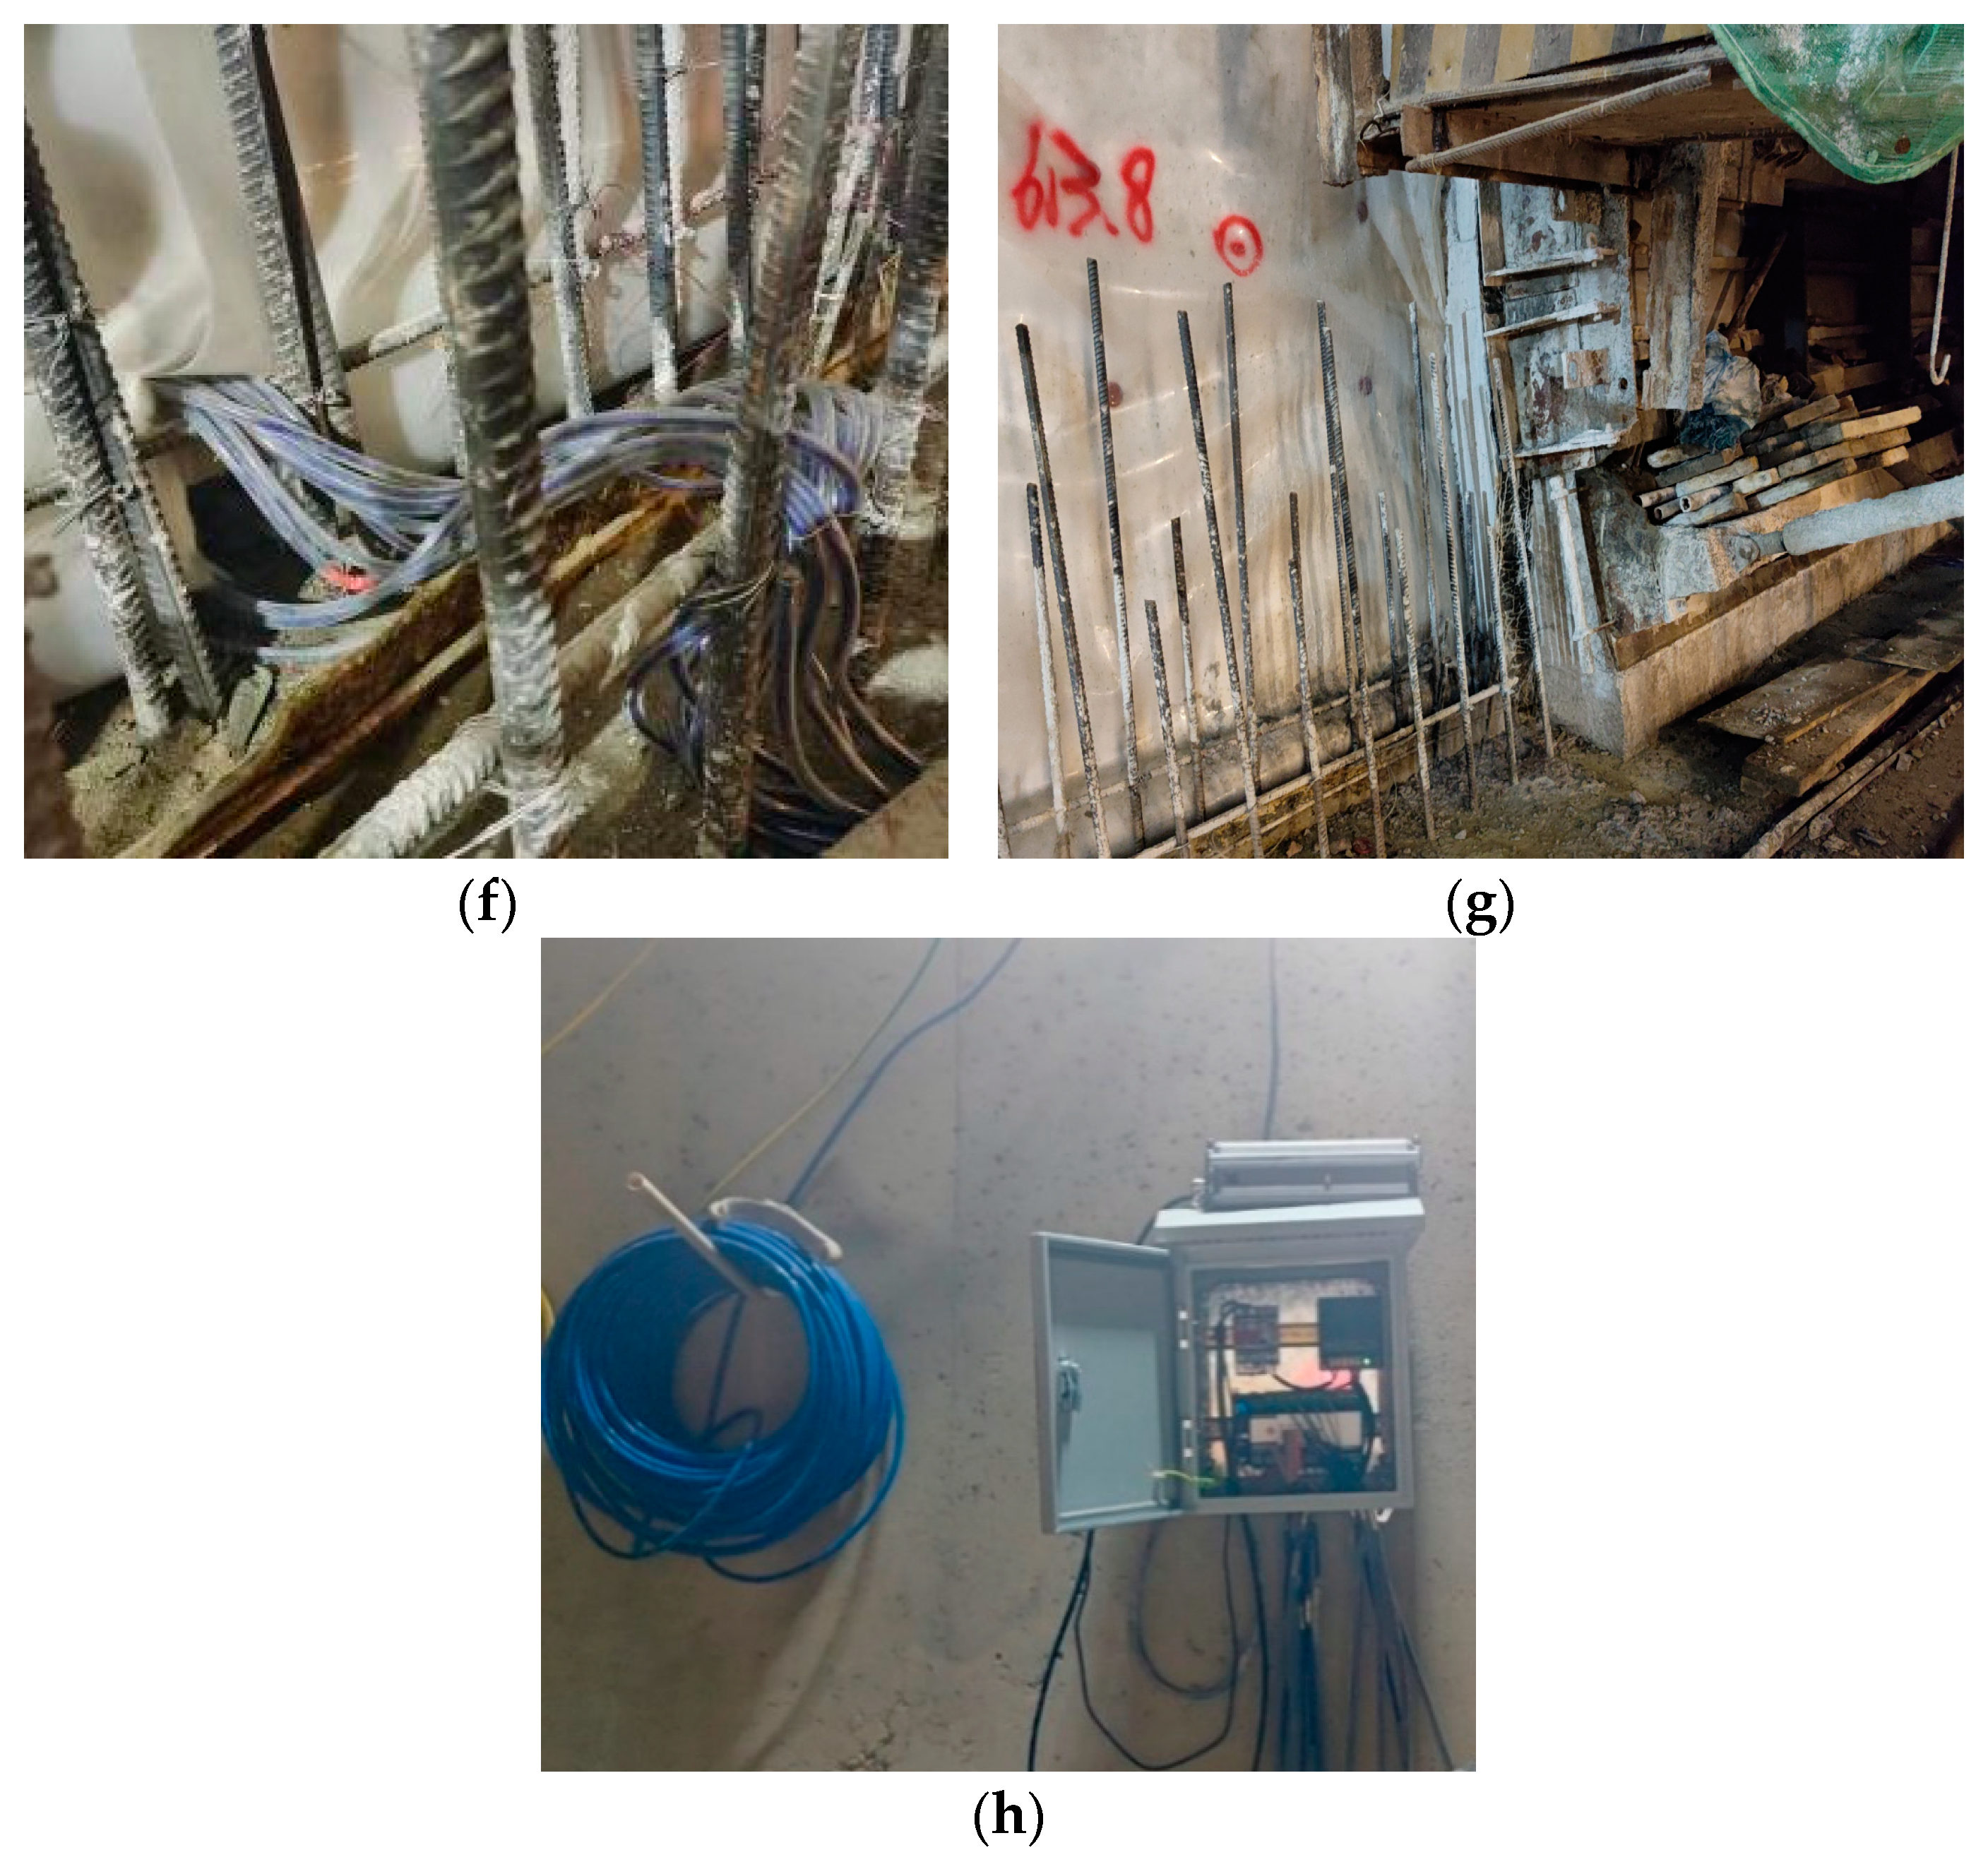
3.1. Test Equipment and Parameters

The test uses a digital water pressure sensor, and the instrument performance parameters are shown in Table 2.
The water pressure sensor, crafted from stainless steel, features high sensitivity and waterproof performance, and it is capable of measuring groundwater levels and pore water pressure in dams and soils. The water pressure sensor, along with the multi-channel vibrating string collector, is housed within a chassis. It records data to a memory card, and the entire setup is powered by an external power supply. This is illustrated in Figure 4.

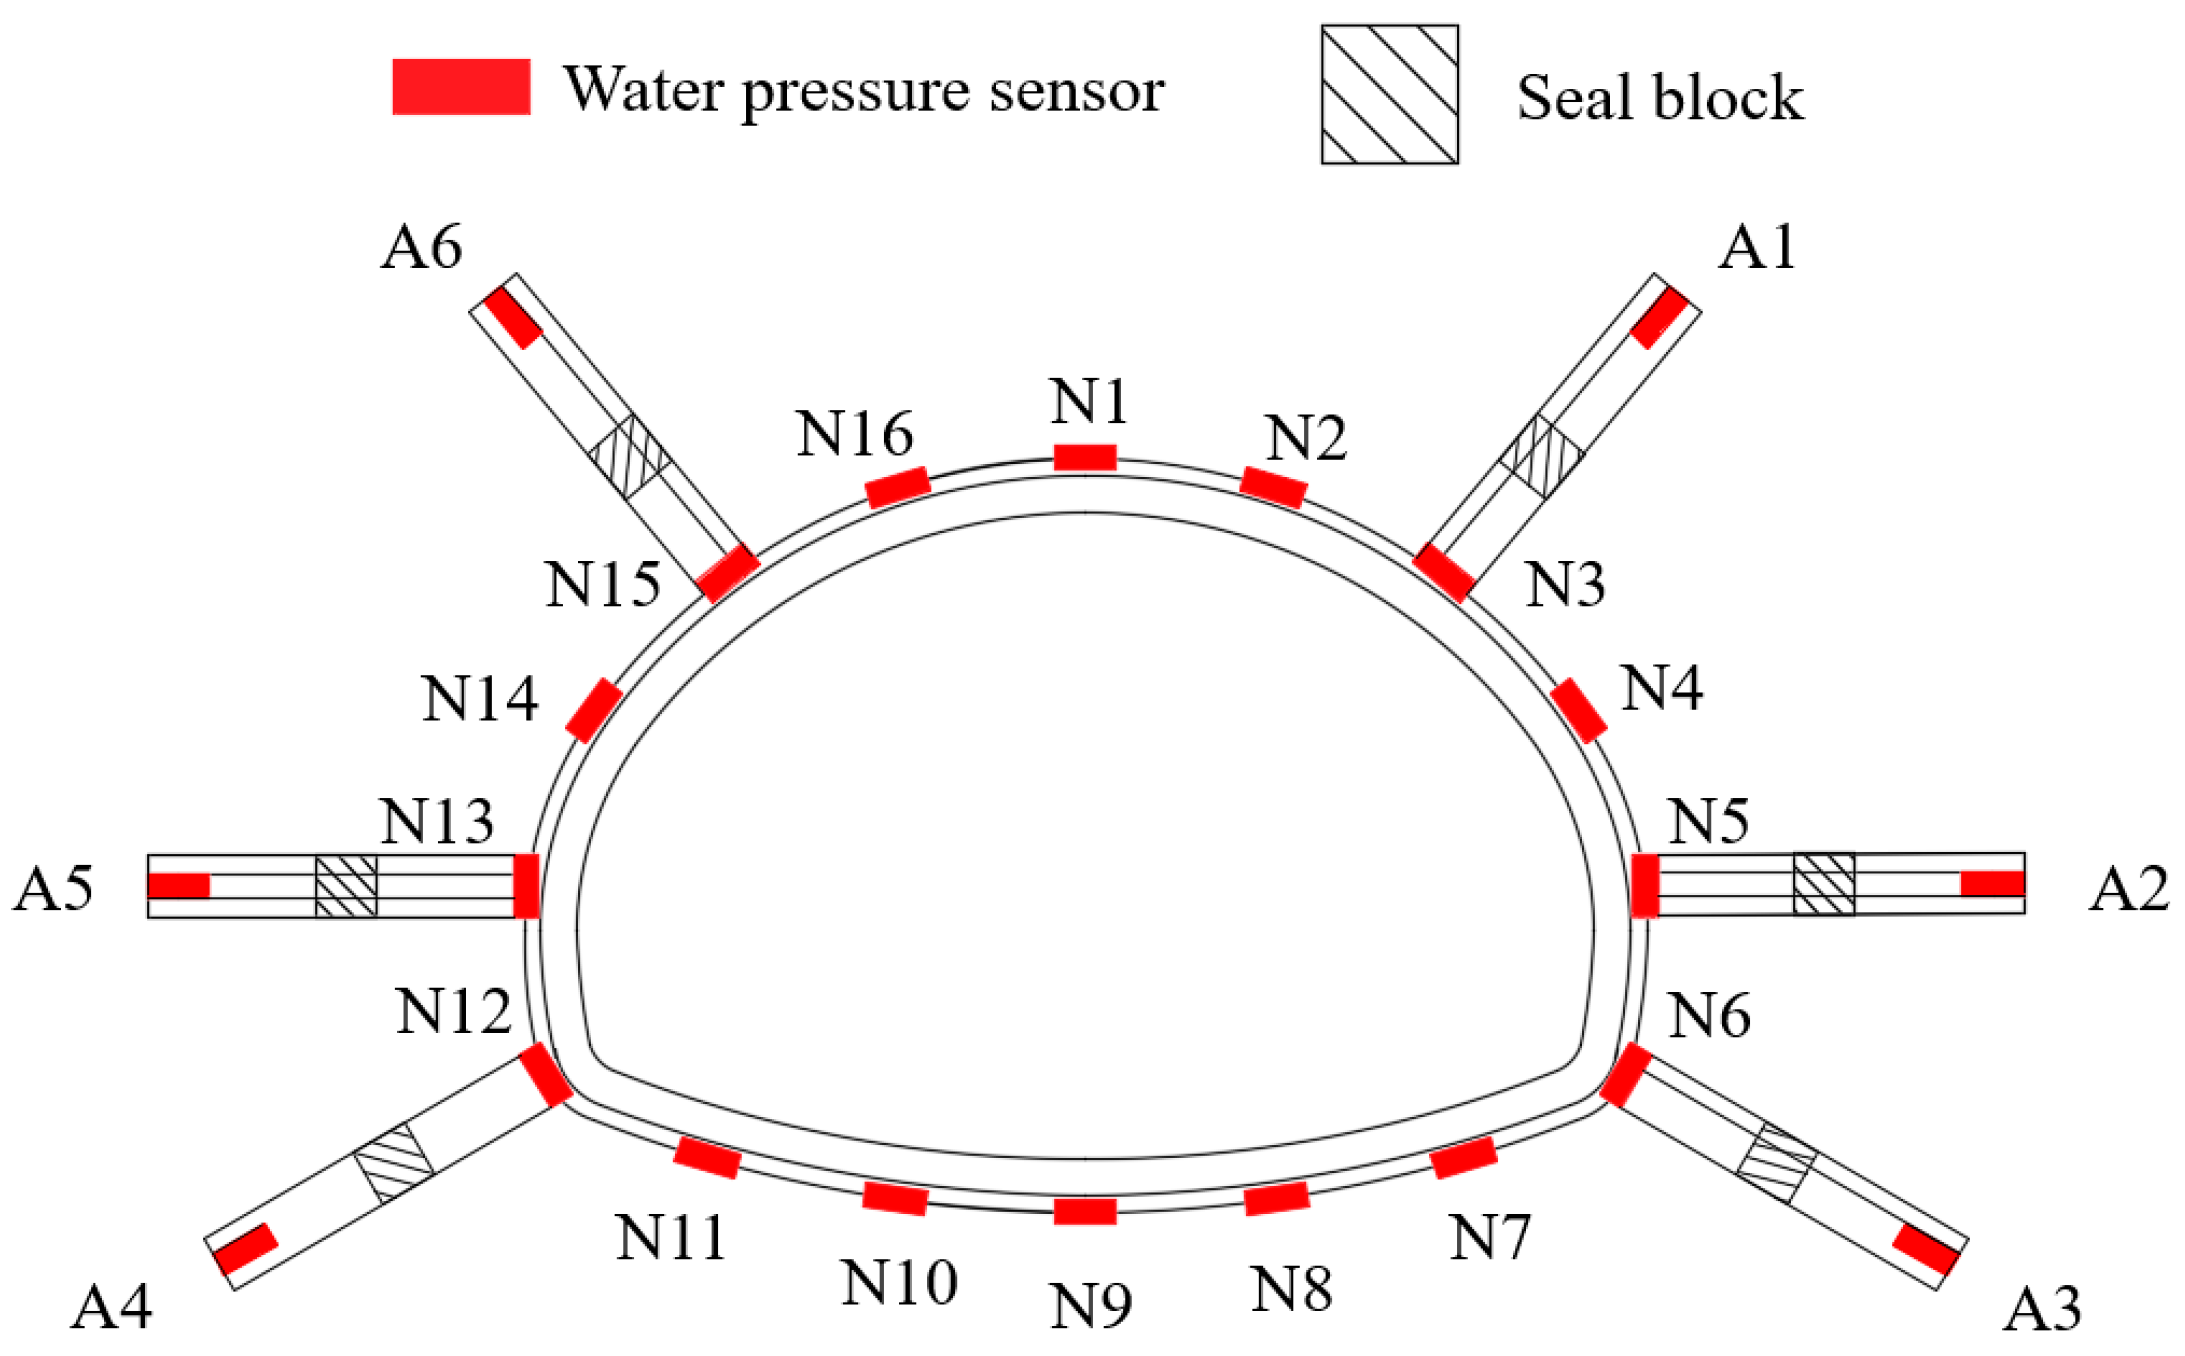
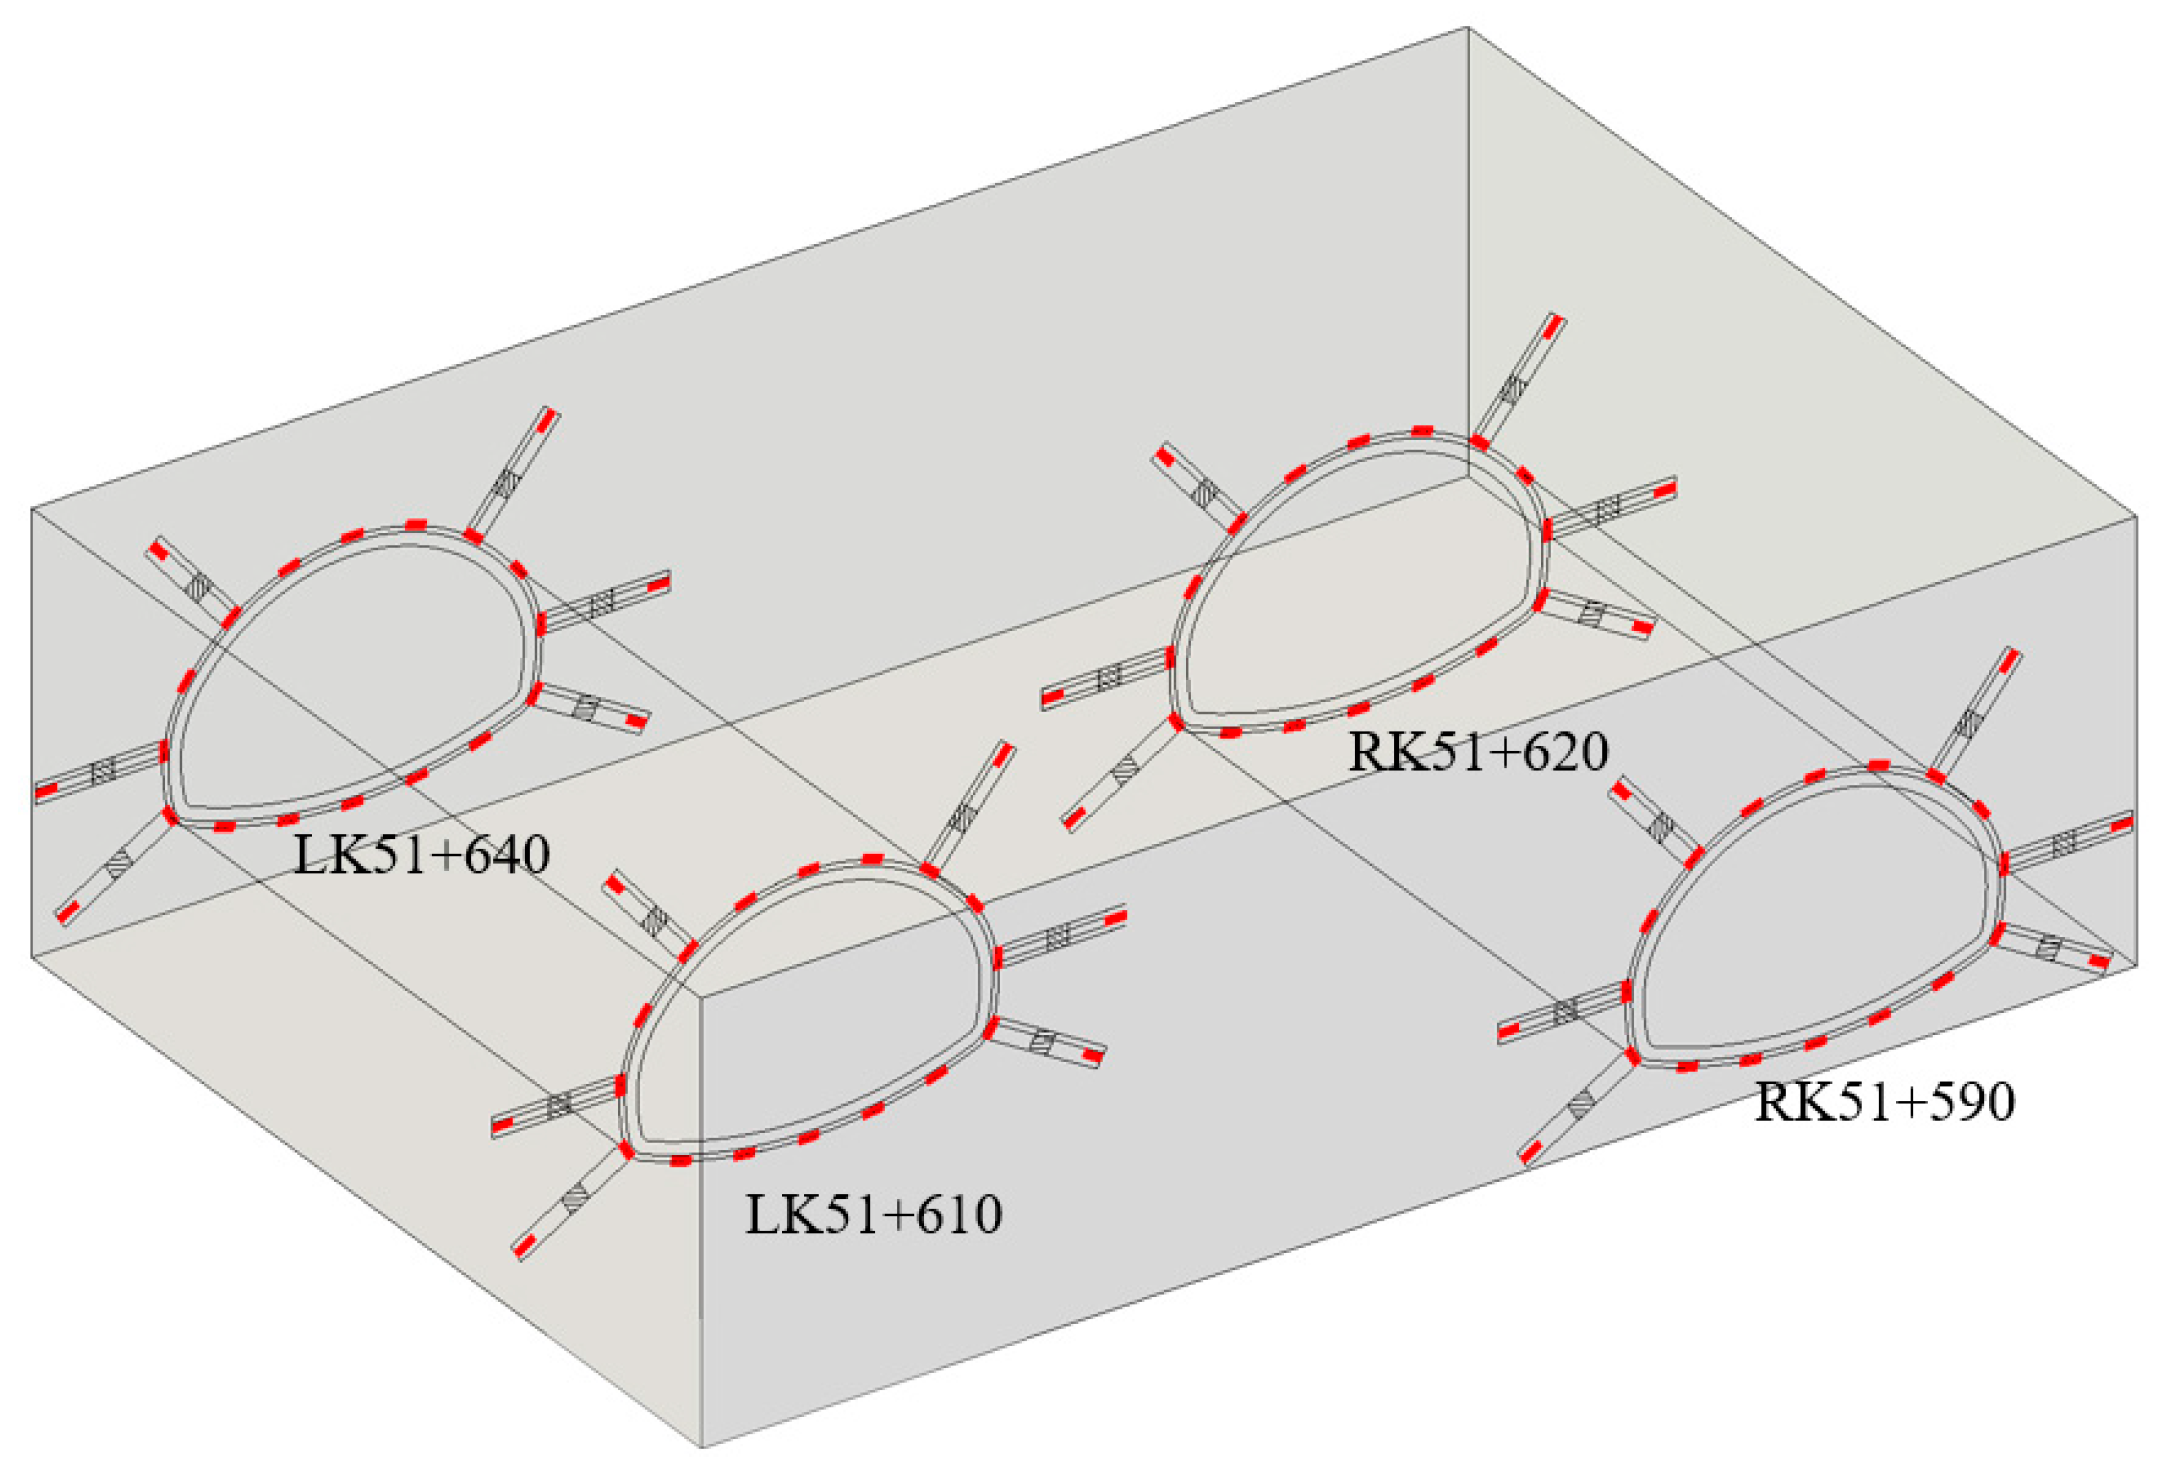
3.2. Test Section and Equipment Layout

Eight water pressure sensors, numbered N1 to N8, were deployed behind the initial support along the test section. Additionally, six sensors, numbered A1 to A6, were positioned in radial drillings extending 5 m at the spandrel, arch waist, and arch foot of the test section. Gauze was placed at the ends of the water pressure sensors to prevent mud clogging. Sealing blocks were also installed between sensors within the borehole to maintain independent hydraulic relationships between segments. The layout of the water pressure sensors is detailed in Figure 5.
The K51 + 590 to K51 + 640 section of the Gudou Mountain Tunnel was chosen for testing with test areas designated as LK51 + 610 and LK51 + 640 on the left and RK51 + 590 and RK51 + 620 on the right. Diagrams of these sections are displayed in Figure 6.

3.3. Test Process

The equipment was assembled and then entered the tunnel for deployment; the exact procedure of the test is shown in Figure 7.
The specific test process is as follows. (1) Drilling: Employ a dobby trolley and a horizontal drilling machine to drill holes at designated positions on the cave wall. (2) Inverted arch Sensor Installation: Drill holes at the specified positions of the inverted arch, install water pressure sensors, seal the holes with anchors, and route the data line to the arch foot. (3) Sensor Fixation: Attach water pressure sensors and data lines to rebar to facilitate placement at the bottom of the drilled holes. (4) Arch Foot and Spandrel Sensor Deployment: Insert the water pressure sensors, attached to rebar, into the holes, and seal with anchoring agent once in position. (5) Data Collection and Power Connection: After the tunnel’s secondary lining is completed, connect the equipment to the power supply to automatically save water pressure data to the memory card.

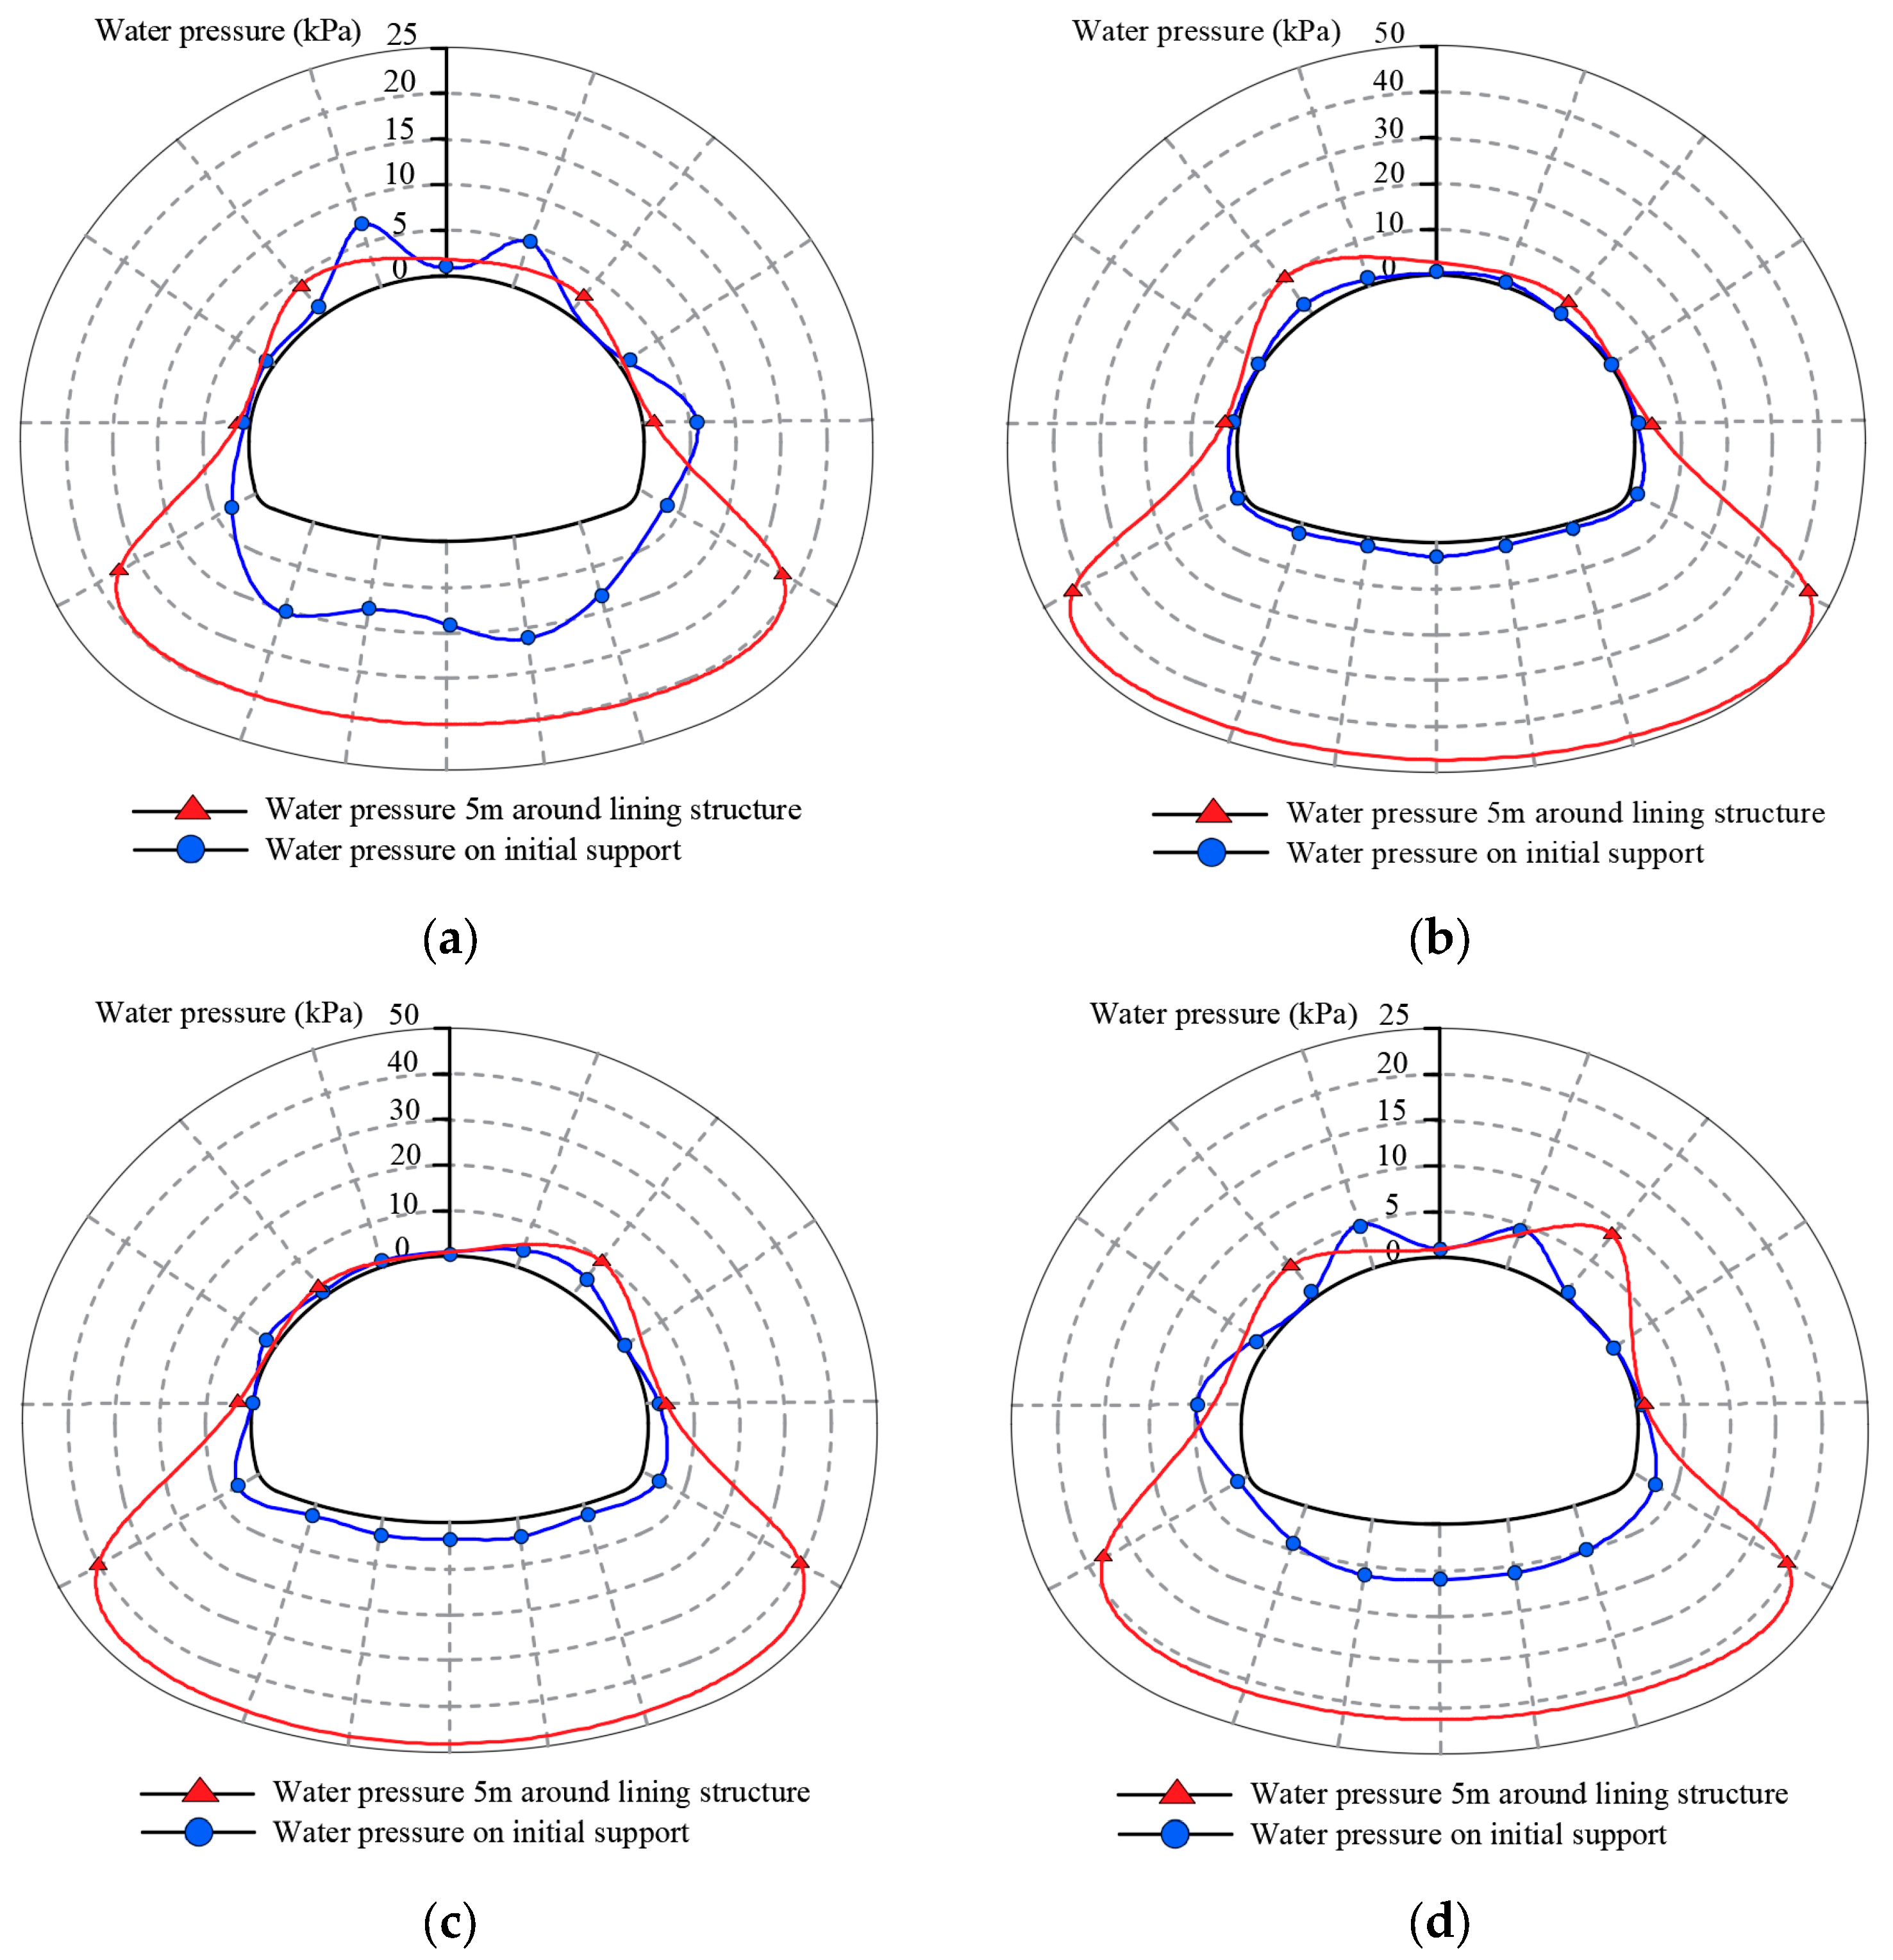
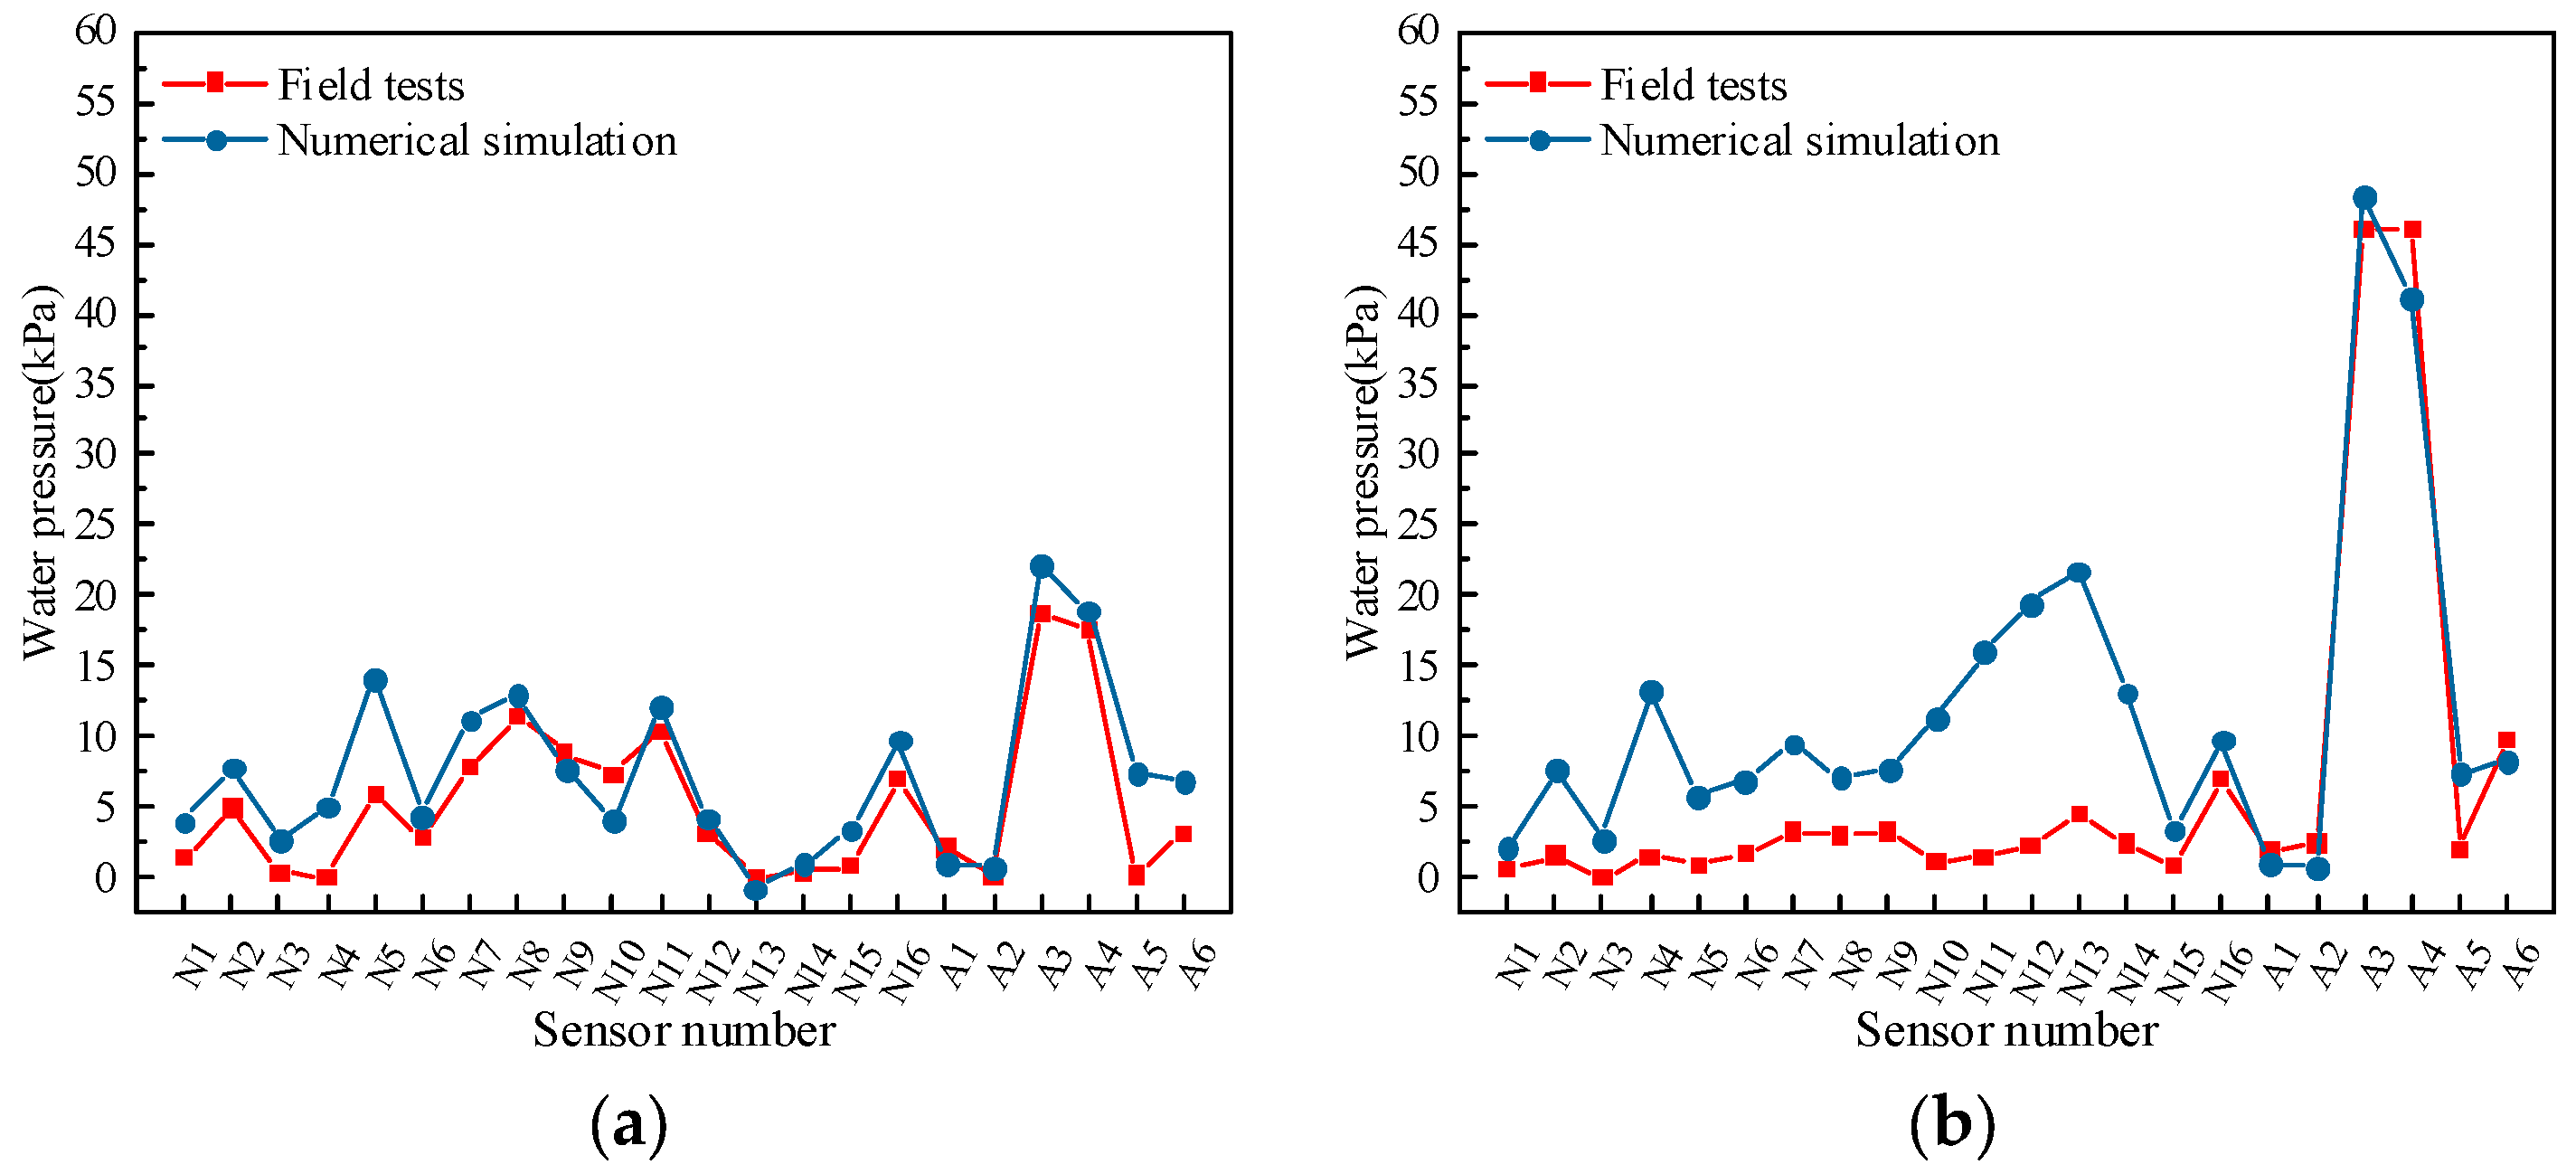
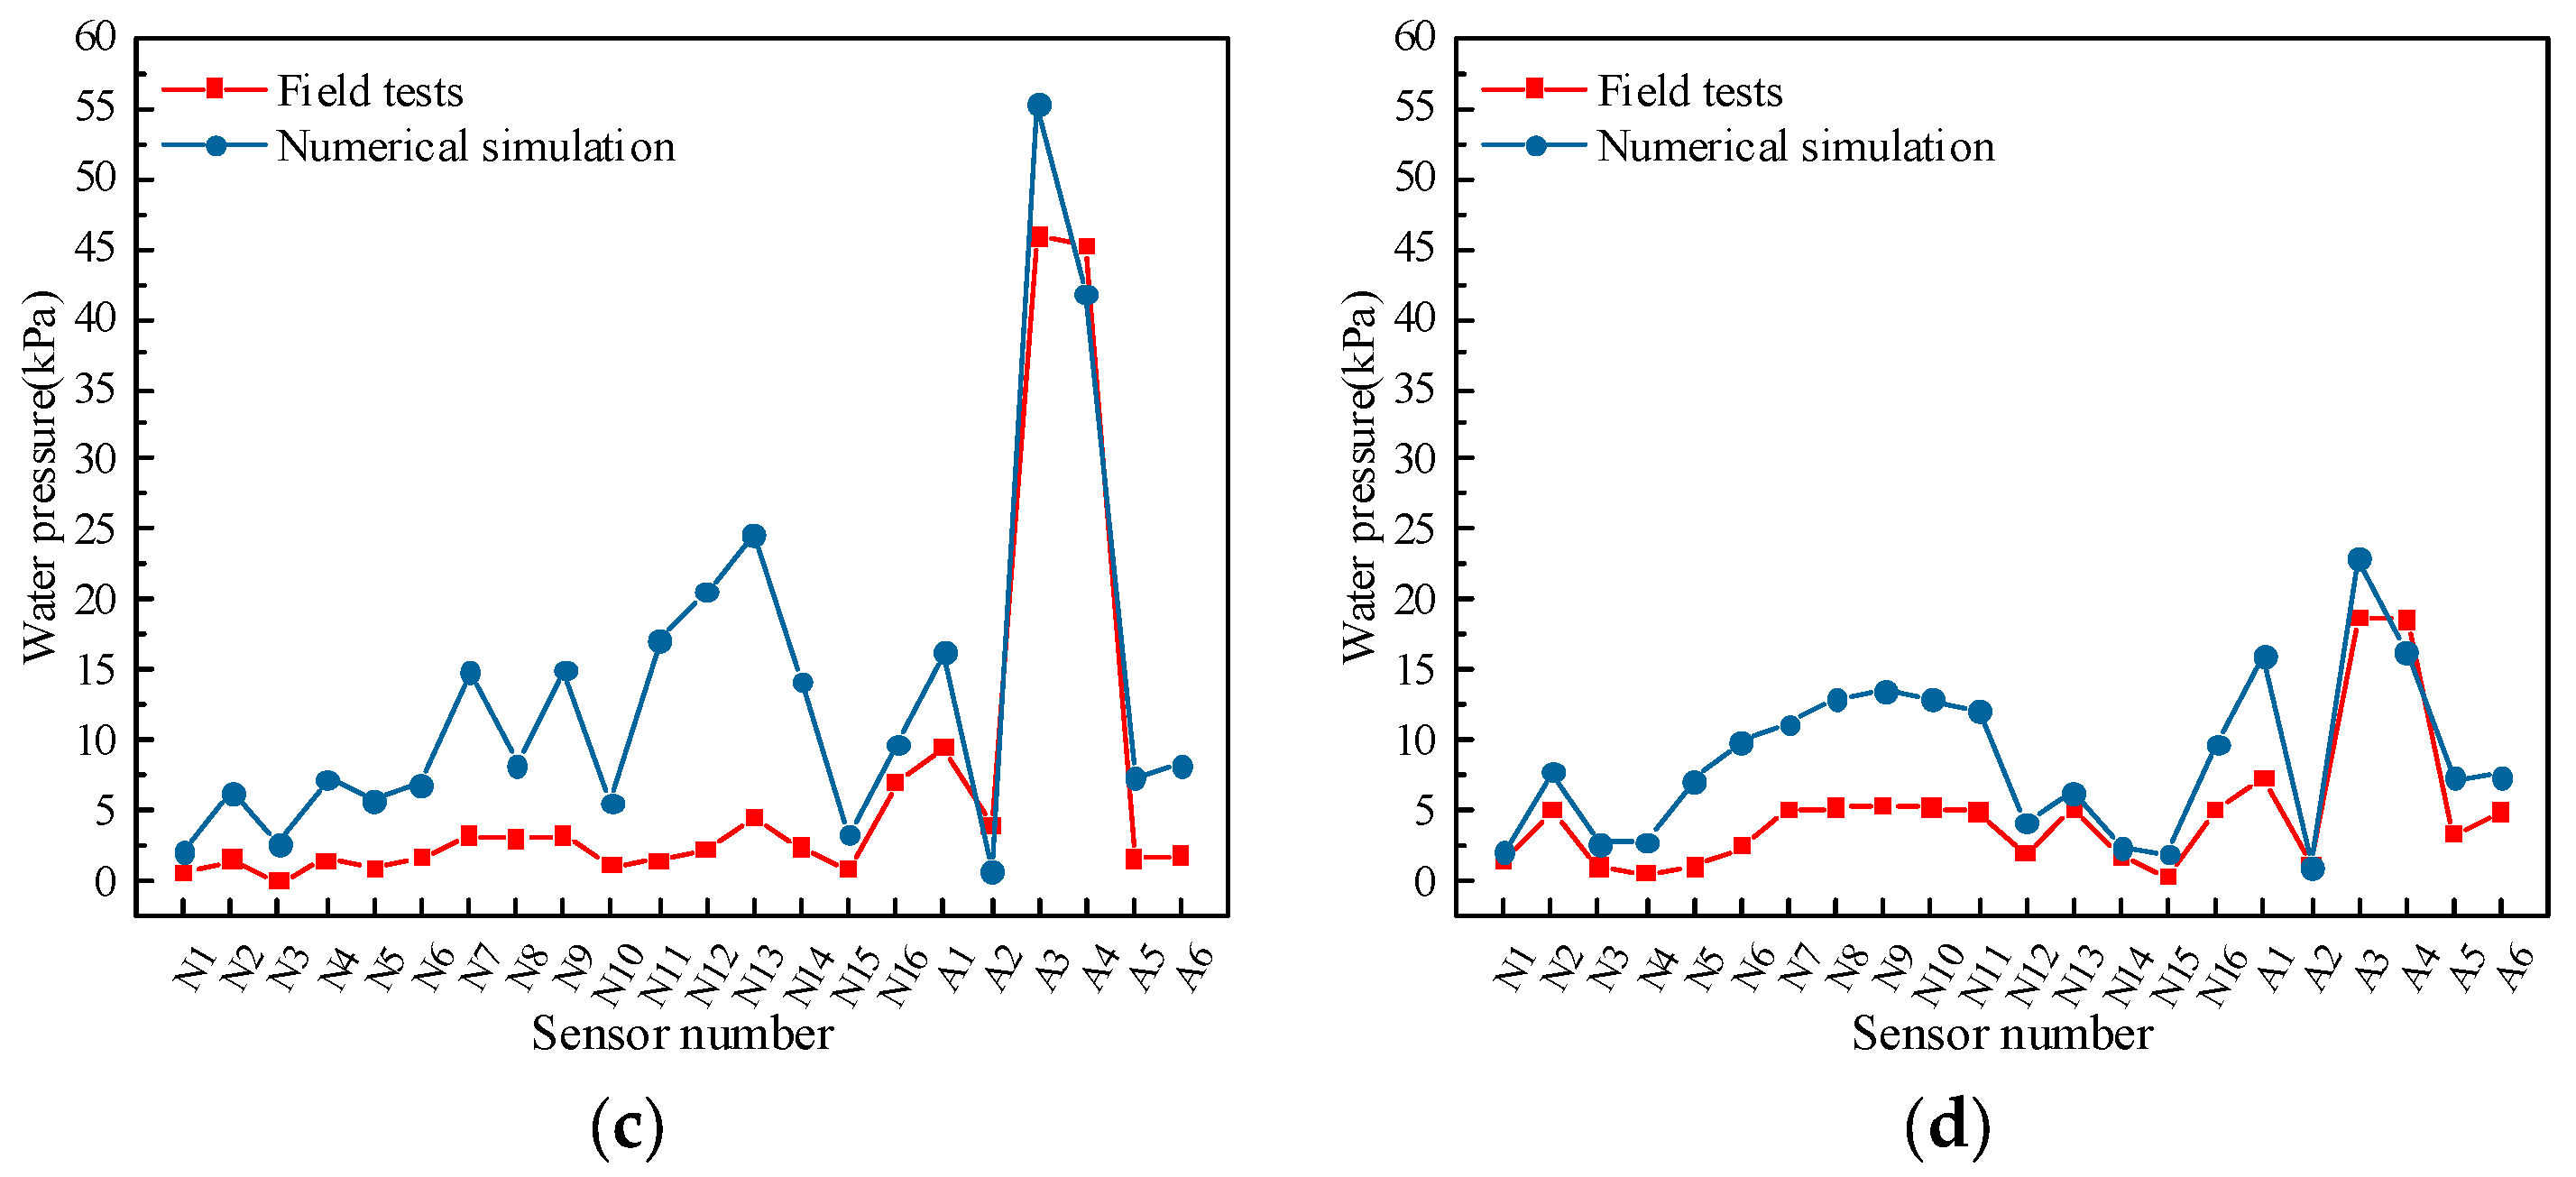
3.4. Analysis of Test Results

After completing the secondary lining, the water pressure sensors were connected to the power supply to monitor the water pressure around the lining structure. The water pressure distribution around the lining for test sections LK51 + 610 and LK51 + 640 in the left hole, and RK51 + 590 and RK51 + 620 in the right hole, is depicted in Figure 8.
As shown in Figure 8, the water pressure around the tunnel is highest at the inverted arch and arch foot, moderate at the vault and spandrel, and lowest at the arch waist. The water pressure at the inverted arch in sections LK51 + 640 and RK51 + 590 is significantly higher than in sections LK51 + 610 and RK51 + 620. The maximum water pressure at RK51 + 620 is 21 kPa, whereas at RK51 + 590, it reaches 49 kPa. This is because sections LK51 + 640 and RK51 + 590 are near the ends of the fault fracture zone. Groundwater from other locations collects at the inverted arch through rock fissures, resulting in high water pressure. Field research indicates that the initial support at the inverted arch is often inadequate. High water pressure during the rainy season can lead to seepage, leakage, or even water disasters. Therefore, timely reinforcement and improved water plugging and drainage measures are recommended based on monitored water pressure values. Additionally, the water pressure at the inverted arch behind the initial support in sections LK51 + 610 and RK51 + 620 is higher than at 5 m inside the borehole. In contrast, in sections LK51 + 640 and RK51 + 590, despite being at the fault zone ends with more developed fissures, the surrounding rock integrity near the arch is better, resulting in lower water pressure.
Contour plots of water pressure distribution around the tunnel lining, based on data from on-site measurements, were generated using Surfer 15 software, as illustrated in Figure 9.
Figure 9 illustrates a consistent water pressure distribution pattern across the four sections, showing that pore water pressure decreases toward the tunnel center with the highest pressures recorded at the inverted arch and arch foot. In sections LK51 + 610 and RK51 + 620, the water pressure at the vault and arch waist is notably high. Although the inverted arch in sections LK51 + 610 and RK51 + 620 shows lower water pressure, significant pressure impacts the tunnel lining at the vault and arch waist due to fissures in the surrounding rock. It is crucial to reinforce these areas based on the monitored water pressure values promptly.

4. Numerical Simulation

Measuring deformation of the Gudou Mountain Tunnel lining during construction is challenging due to the site’s conditions. The K51 + 590 to K51 + 640 section of the Gudou Mountain Tunnel, located in a ravine terrain, experiences increased precipitation during the rainy season. Joints and fissures within faults may act as seepage channels between the tunnel and nearby reservoirs, causing fluctuations in groundwater levels. Understanding the distribution of water pressure and deformation of the tunnel lining under these conditions is crucial for safe tunnel operation.
The finite difference software FLAC3D offers good performance in fluid–solid coupling simulations [26]. Using FLAC3D finite difference software to simulate field conditions, this study investigates how fluctuations in groundwater levels affect the peripheral water pressure distribution and deformation patterns of the tunnel lining.

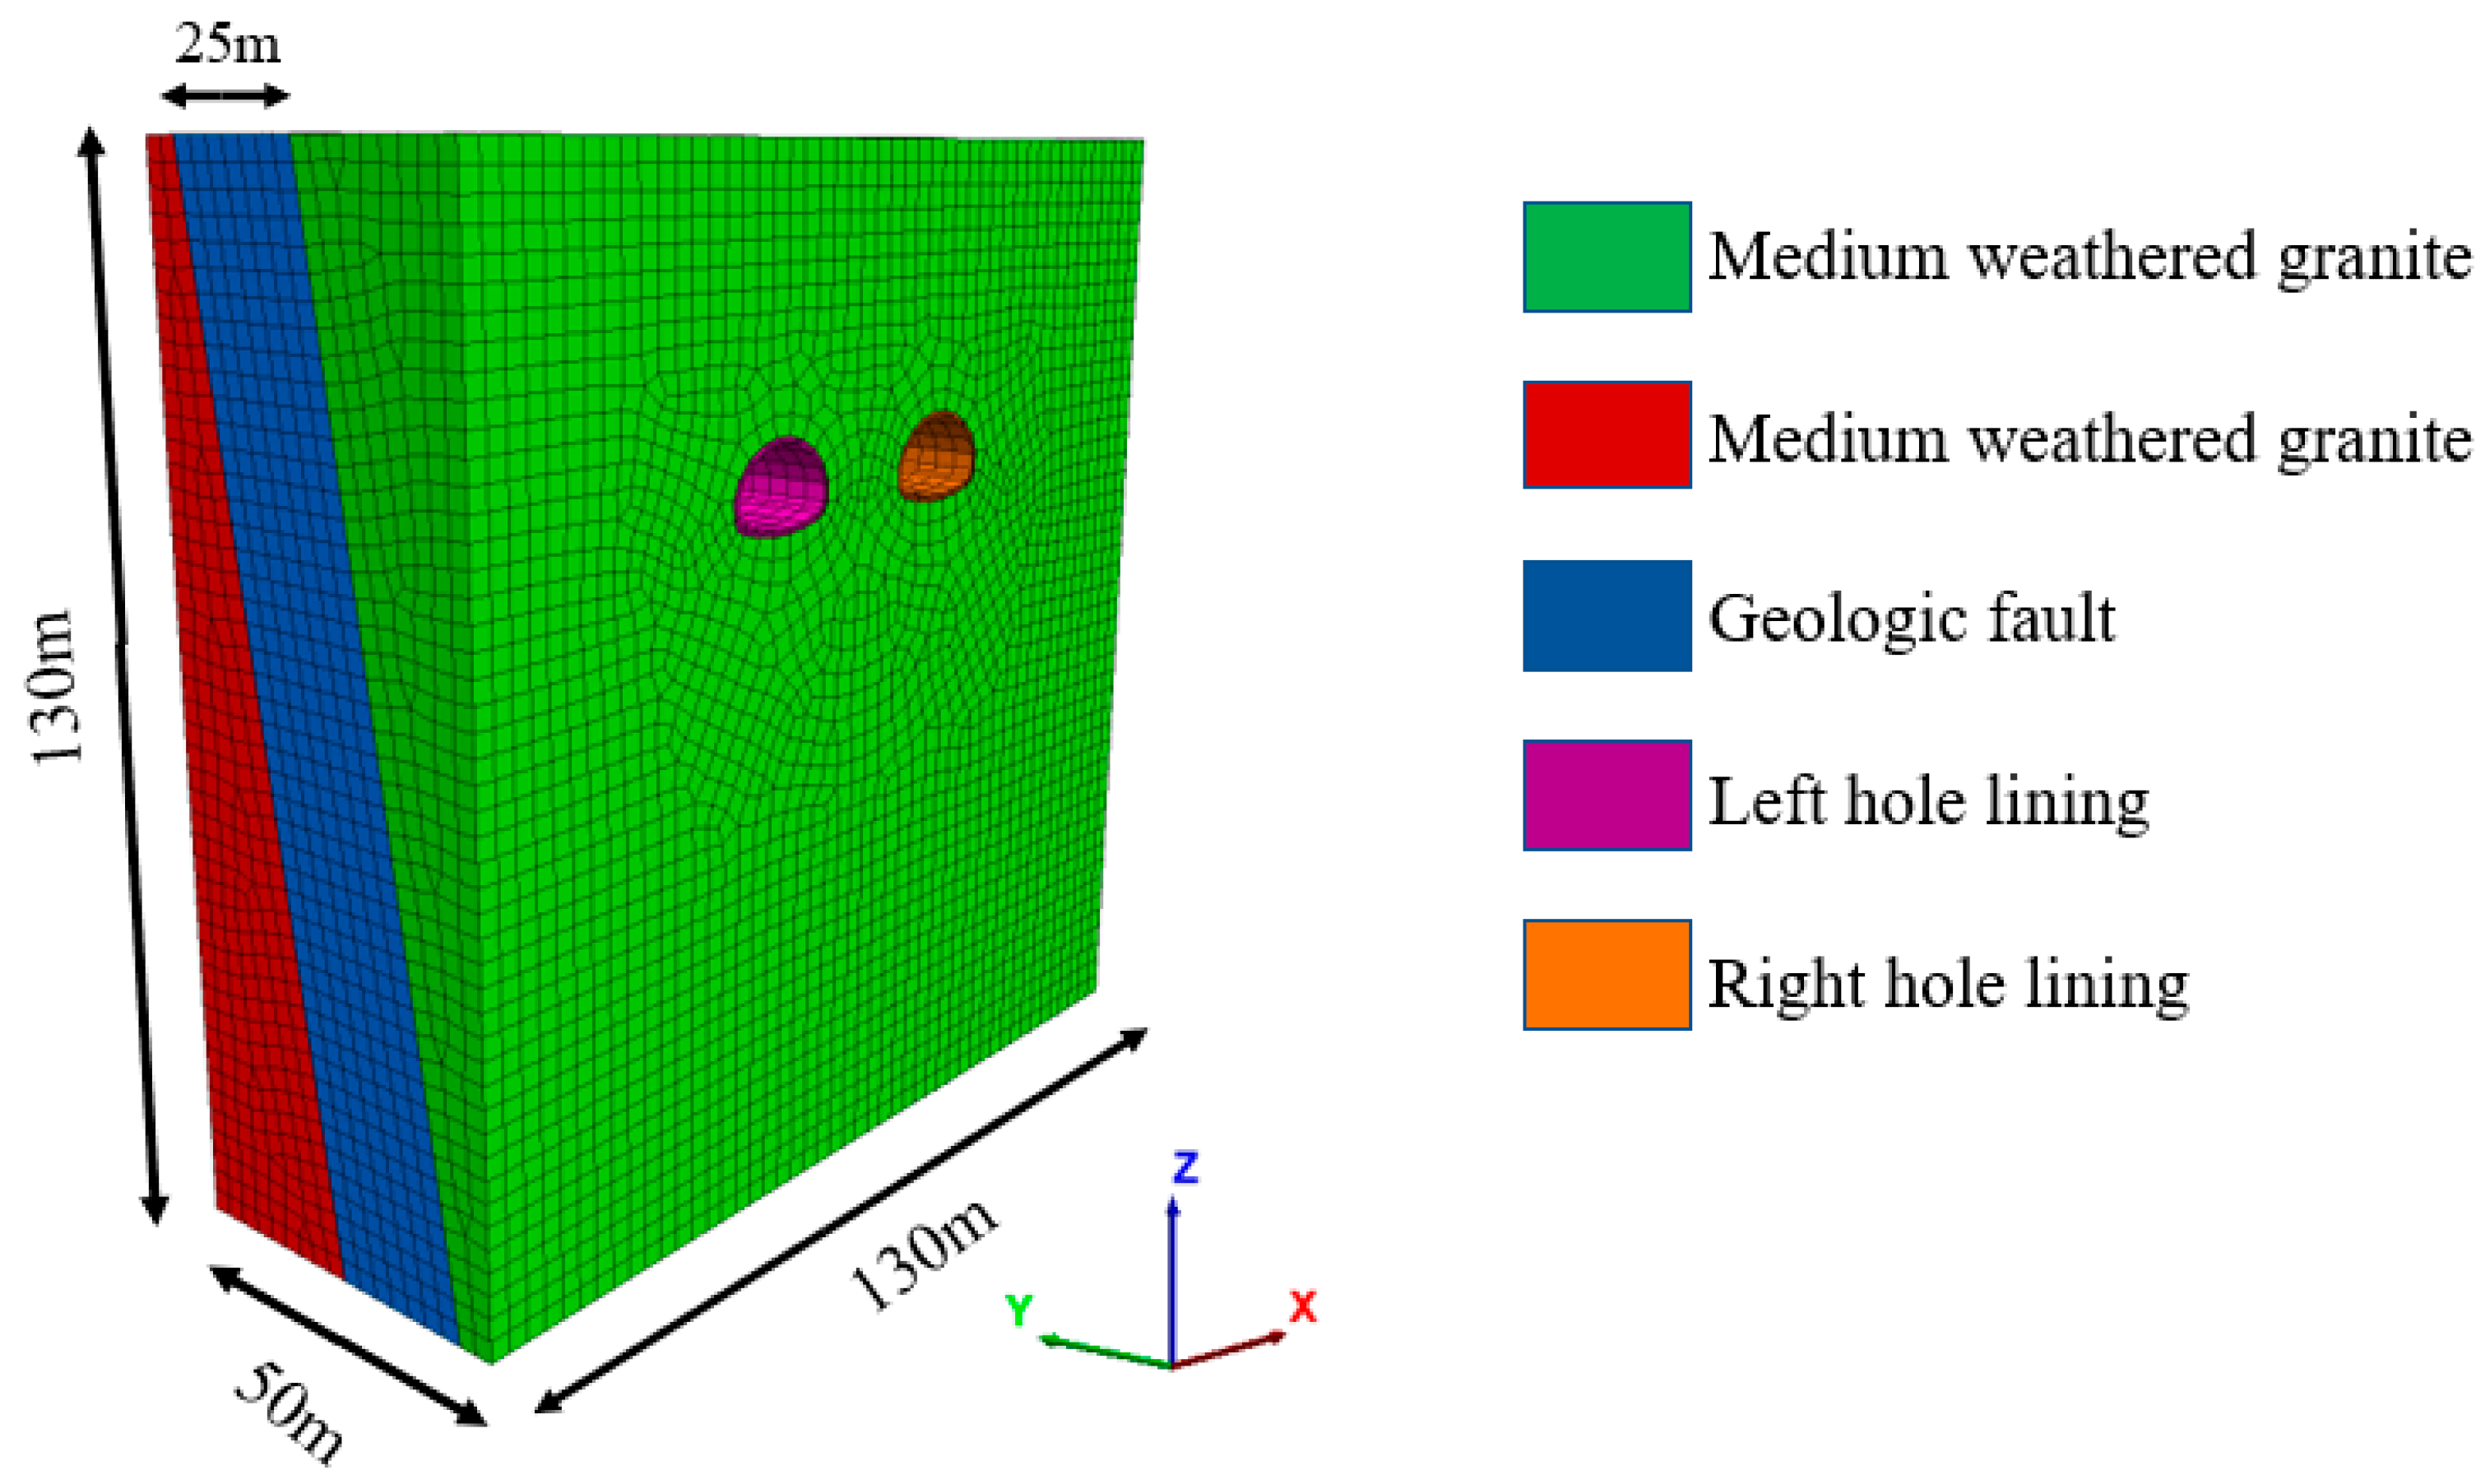
4.1. Numerical Model and Boundary Conditions

The section K51 + 590 to K51 + 640 of the Gudou Mountain Tunnel, replicating field geological conditions and dimensions, serves as the test section. The numerical model is depicted in Figure 10.
The model was initially created and meshed in Midas; then, it was converted to FLAC3D using the MIDAS TO FLAC3D tool. The numerical model comprises 54,180 hybrid grid cells and 45,626 nodes. The model dimensions are 130 m × 50 m × 130 m, and the fault width is 25 m. In the model, blue represents the fault, green and red represent the strata, and purple and yellow represent the lining structures of the left and right tunnels. The mesh size for the tunnel and nearby soil layers is 1 to 1.5 m, while the mesh size for strata farther from the tunnel is 3 to 4 m. The geotechnical body is simulated using the Mohr–Coulomb criterion, while the lining structure is modeled using a solid element elastic model. The lining structure in the numerical simulation uses C30 concrete. According to relevant standard [27], its elastic modulus is 30 GPa, Poisson’s ratio is 0.2, and the density is 2.5 × 10³ kg/m3. The surrounding rock adopts the same physical and mechanical parameters as those at the site, as shown in Table 1.
After establishing the numerical model, the bottom and side walls of the model are set as displacement boundaries, where no displacement components occur. However, the inner and outer surfaces of the lining structure are set as free surfaces, allowing deformation under the action of surrounding rock and water pressure. The bottom and side walls of the model are also impermeable boundaries, with no fluid exchange nodes with the external environment on these boundaries. Then, water level lines are set at different heights on the top of the model. The initial ground stress and initial water pressure distribution under the combined action of self-weight and water pressure are calculated when the tunnel is not excavated. When the initial ground stress and initial water pressure distribution reach equilibrium, the rock mass in the tunnel is set as empty units to simulate excavation. Simultaneously, the lining structure is assigned an elastic model to simulate the construction of the lining structure. Finally, the entire seepage process of the model is achieved by setting the pore water pressure on the outer surface of the lining structure to zero.
In the tunnel fluid–solid coupling simulation, the fluid calculation mode involving pore water pressure uses the seepage mode, and the seepage model for the elements is selected as the isotropic seepage model. In the seepage mode, a fully coupled fluid–solid calculation is performed. Changes in pore water pressure cause mechanical deformation, while volumetric strain also induces changes in pore water pressure.

4.2. Numerical Simulation Process and Working Conditions

To simulate the site’s seepage conditions accurately, the model’s initial ground stress under self-weight is first calculated. Stability is assessed by the maximum unbalance force to determine if the iterative calculation has reached equilibrium. An isotropic seepage model is used, setting varying water surface heights for tunnel excavation and support. The numerical simulation is then verified against on-site monitored water pressure distribution around the tunnel. Subsequently, the force and deformation behavior of the tunnel lining during operation are analyzed.
The engineering geological investigation report for the Gudou Mountain Tunnel indicates that the average groundwater level in the section from K51 + 590 to K51 + 640 is 126 m. Numerical simulations were set up with water surface heights at 126 m, 127 m, 128 m, and 129 m, respectively. Using this calculation scheme, fluid–solid coupling simulations were conducted for the tunnel at various groundwater levels.

4.3. Analysis of Simulation Results

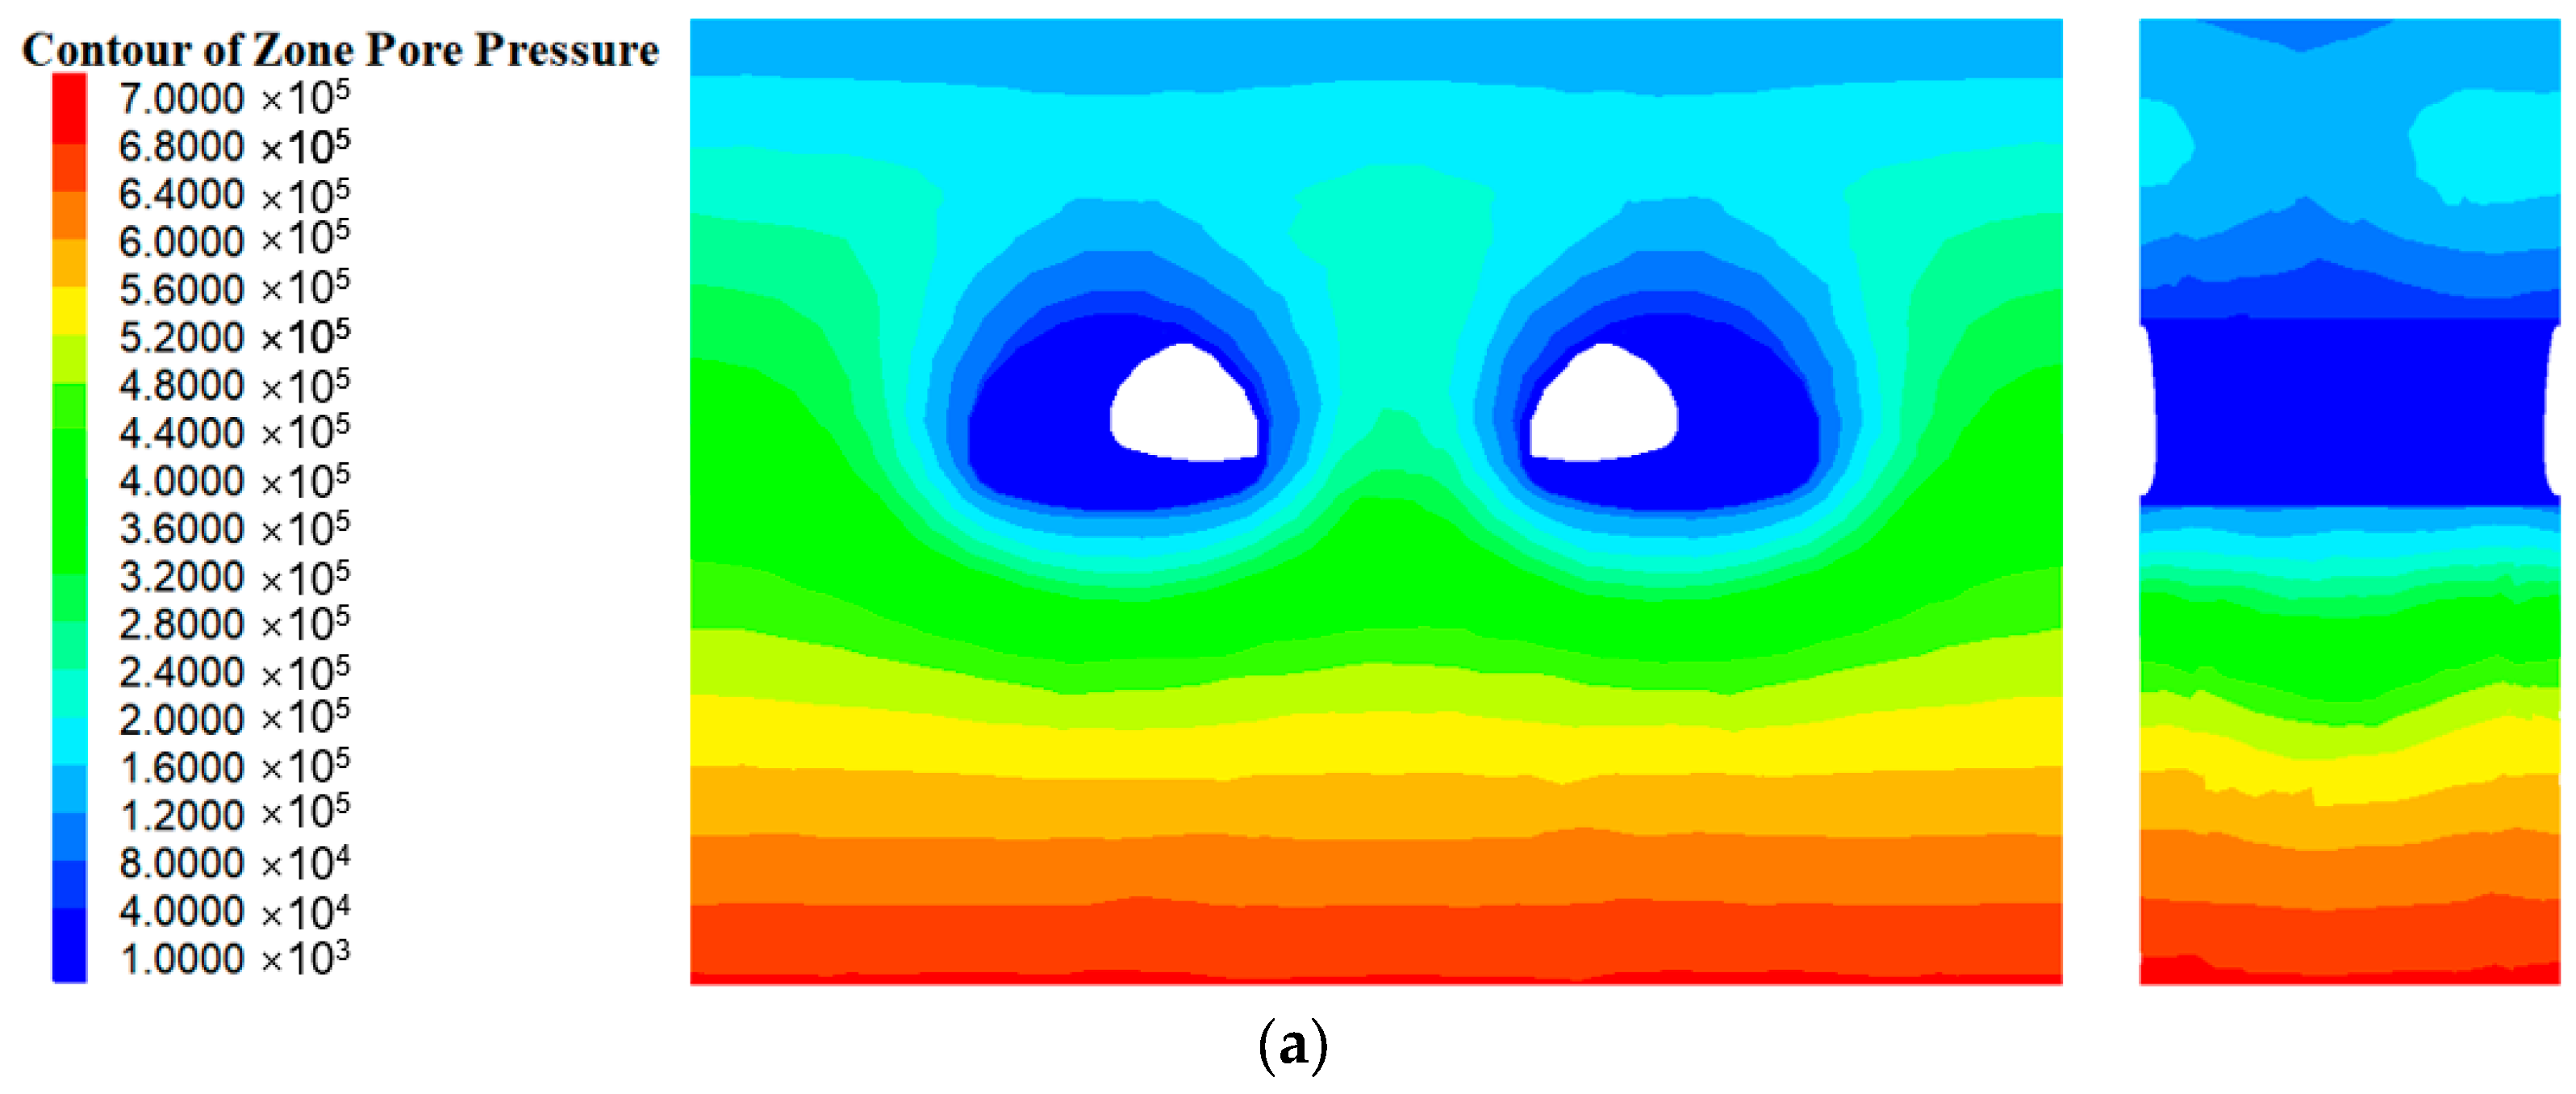
4.3.1. Water Pressure Distribution Patterns around the Tunnel

To ensure the reliability of the numerical simulation results, the simulated water pressure at a 126 m water level around the tunnel is compared with the water pressure changes at measurement points on the tunnel surfaces, as monitored on-site and depicted in Figure 11.
As shown in Figure 11, the pattern of the water pressure change law from numerical simulations aligns with the field test results. The water pressure at the inverted arch and arch foot is notably higher than above the arch waist. This is because sections RK51 + 590 and LK51 + 640 are at the edges of a fault fragmentation zone, where highly fractured peripheral rock allows atmospheric precipitation and reservoir water to accumulate through rock fissures. The convergence of atmospheric precipitation and reservoir water through rock fissures leads to significantly higher water pressures at sections RK51 + 590 and LK51 + 640 compared to sections RK51 + 620 and LK51 + 610. Field test data show that at section RK51 + 590, water pressure at position A3 (arch foot) is 42 kPa higher than at position A2 (arch waist), and it is 17 kPa higher than the same position at section RK51 + 620. Prolonged high water pressure increases the likelihood of cracking in the lining at the inverted arch and arch foot of sections RK51 + 590 and LK51 + 640, potentially leading to water seepage and leakage during tunnel operation. This necessitates further investigation into the deformation characteristics of the tunnel lining.
Figure 12 shows a cloud diagram of water pressure distribution around the tunnel at various groundwater levels, as obtained from numerical simulations.
Pressure decreases toward the tunnel with higher pressures at the inverted arch and arch foot compared to other areas. The tunnel structure experiences upward buoyancy; as water levels rise, so does the surrounding water pressure, emphasizing the need to monitor lining deformation near the inverted arch and arch foot. The side view of the water pressure contour map indicates that the water pressure contour lines directly below the tunnel outside the fault are nearly straight, while those influenced by the fault appear curved (see Figure 10 for the fault’s position in the model). Because the fault sections in the numerical model have higher hydraulic conductivity, the water pressure on both sides of the fault at the same elevation is higher than that within the fault.

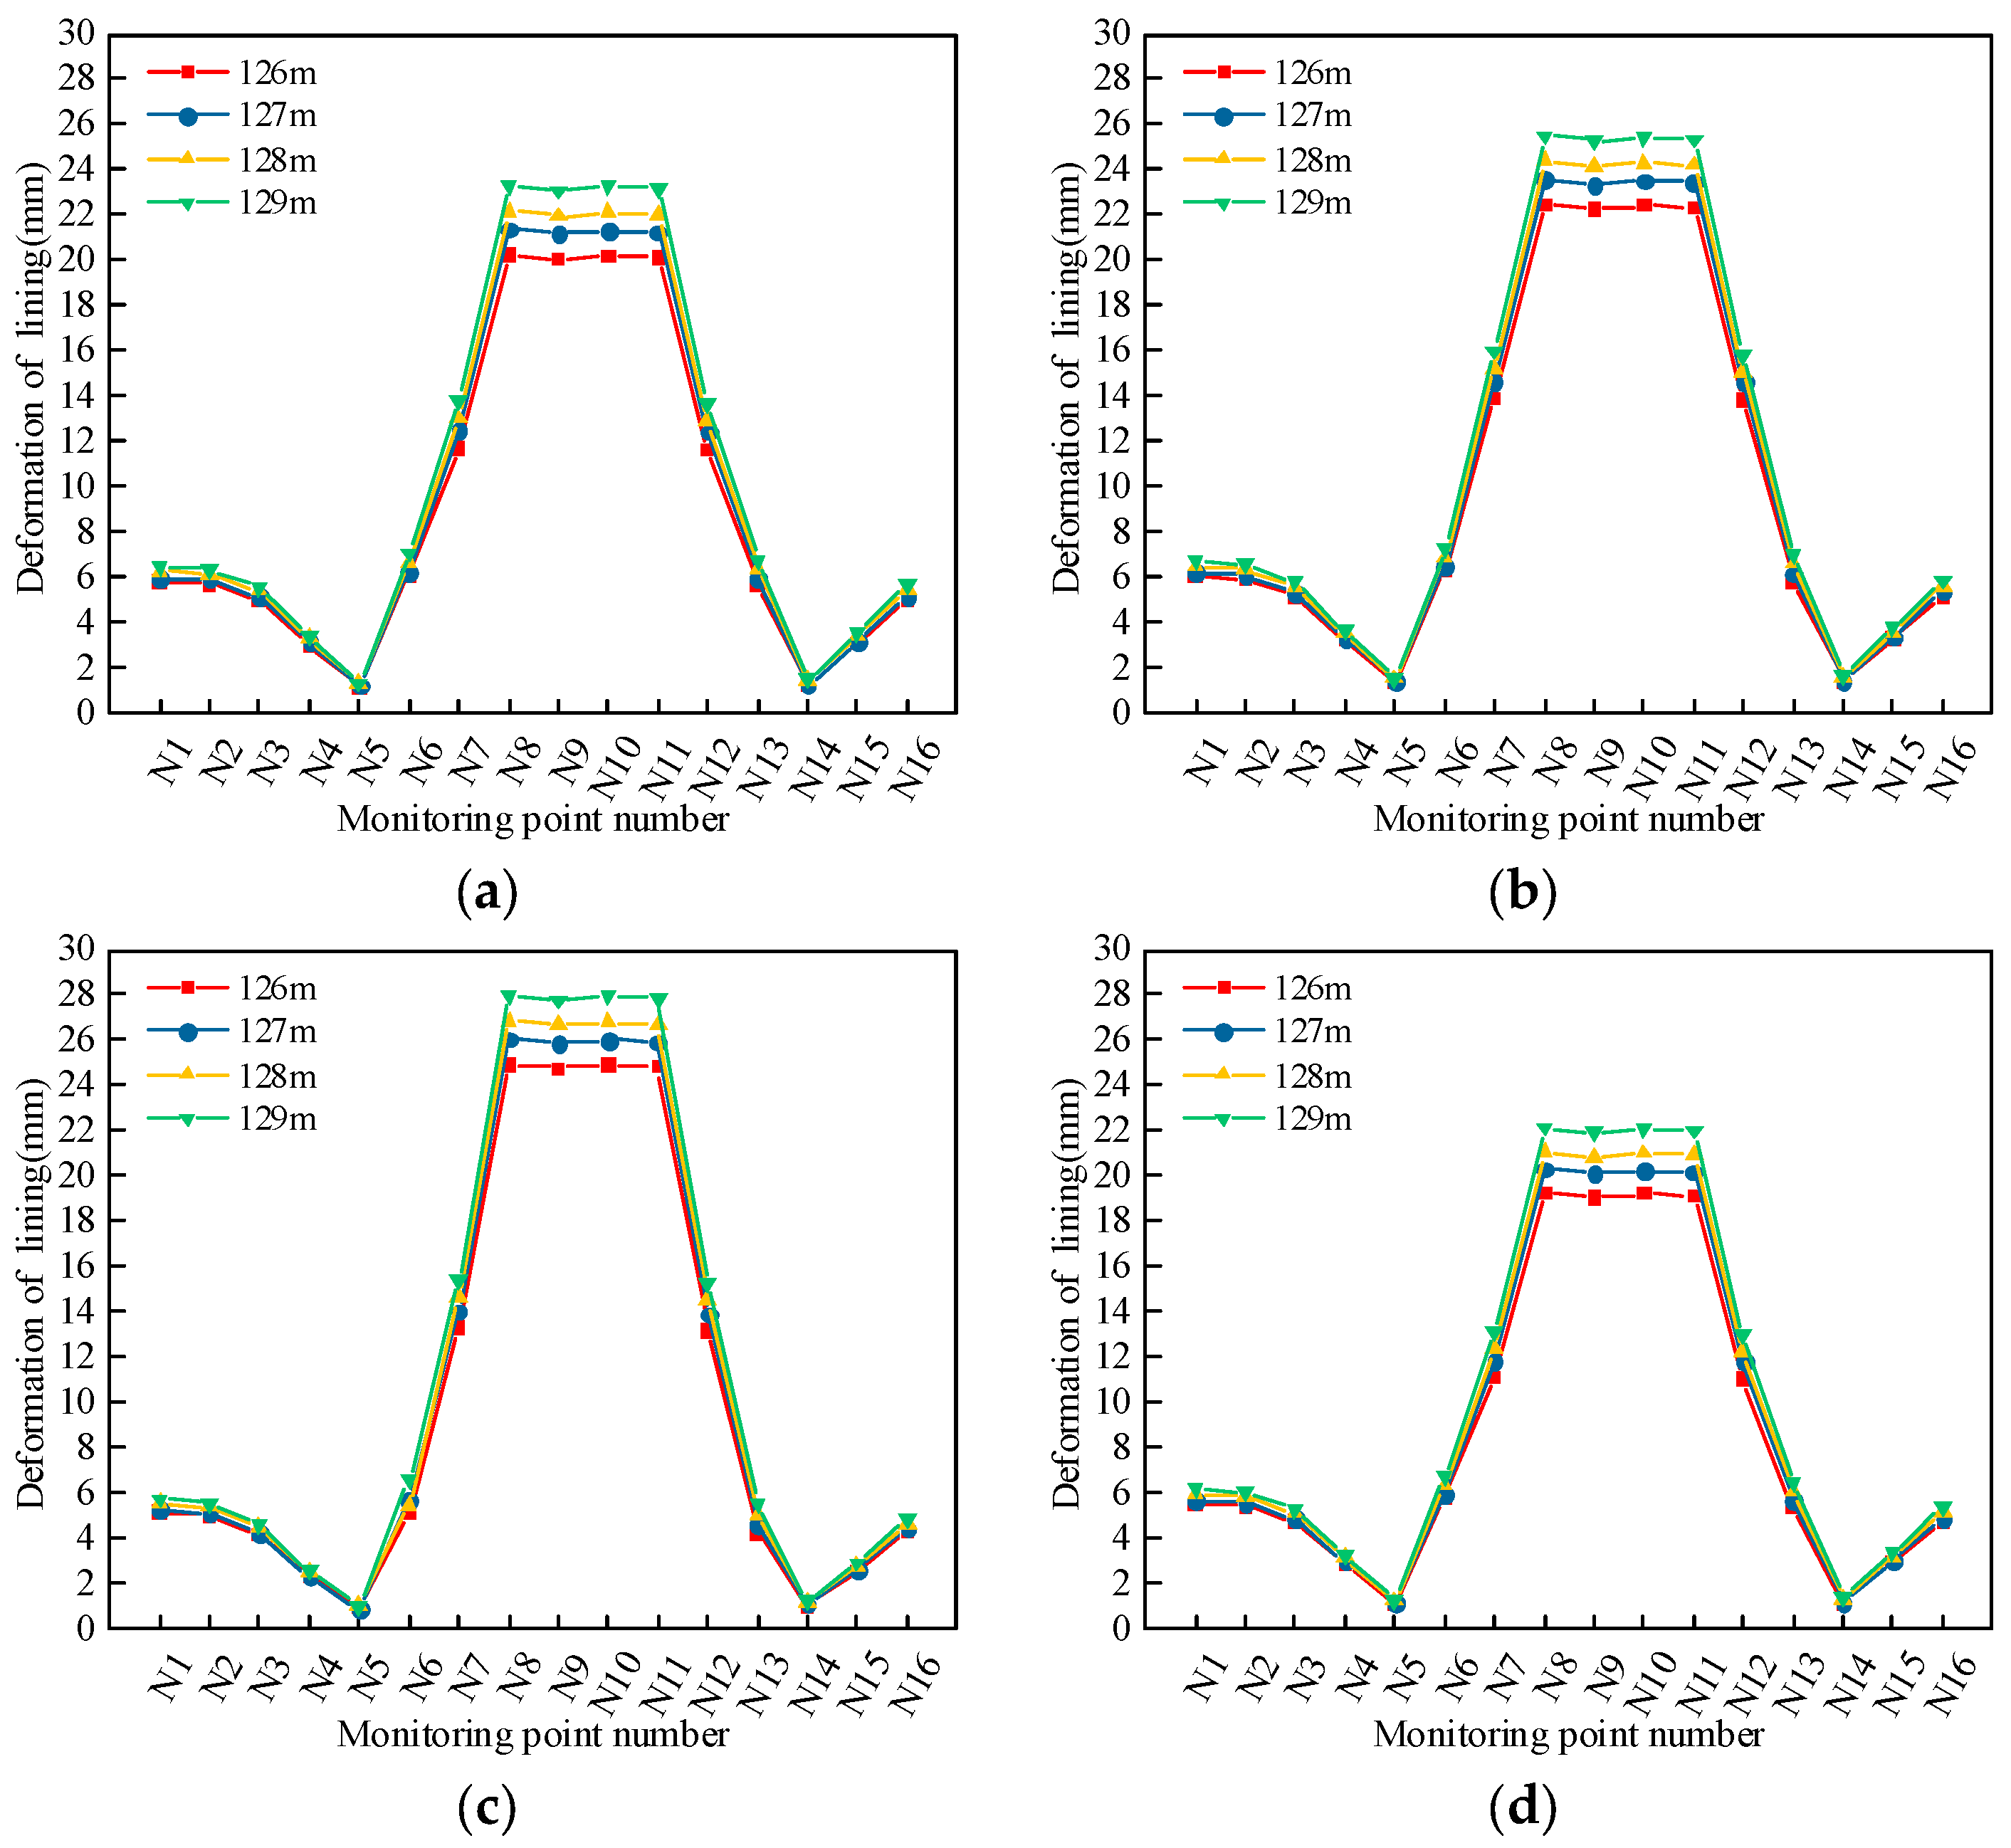
4.3.2. Deformation Patterns of Tunnel Lining Structures

To further investigate the deformation characteristics of the tunnel lining under water-rich conditions, deformations at various measurement points across different water levels were analyzed through numerical simulation, as depicted in Figure 13.
Figure 13 shows that the deformation patterns of the tunnel lining across the four sections are generally similar. As the water table rises, all sections of the lining deform more. The inverted arch experiences the most significant deformation, which is followed by the arch foot and the vault. The least deformation occurs at the arch waist and spandrel.
Due to their proximity to the fault fracture zone, the four sections experience enhanced fissure development in the surrounding rock, leading to groundwater accumulation at the inverted arch. This results in significant lining deformation from increased water and rock pressure with a notable deformation of 25.5 mm at the inverted arch (N8) in section LK51 + 640 at a 129 m water level. The inverted arch in sections LK51 + 640 and RK51 + 590 exhibits greater deformation due to higher water pressures compared to sections LK51 + 610 and RK51 + 620. Additionally, the tunnel vault, bearing the load from the overlying soil, experiences significant deformation due to high vertical and tensile stresses. The arch foot, a stress concentration point, undergoes substantial plastic deformation under water-rich conditions, slightly exceeding the deformation at the vault.
As the water table rises, the deformation of the inverted arch, arch foot, and vault intensifies. The appearance of macro-cracks in these critical areas allows groundwater behind the lining to seep into the tunnel, severely disrupting its normal operation. With the onset of the rainy season and rising groundwater levels, reinforcing the inverted arch, arch foot, and vault becomes essential to mitigate the risk of water seepage.

5. Conclusions and Prospects

Based on field test and numerical simulation, this paper investigates the water pressure distribution and lining deformation in a water-rich tunnel through a fault zone. The main conclusions are as follows:
(1) Overall, the greatest water pressure occurs at the inverted arch and arch foot, followed by the vault and spandrel, with the least pressure at the arch waist. Due to the RK51 + 590 and LK51 + 640 sections being located on either side of a fault crush zone with highly fractured surrounding rock, atmospheric precipitation and reservoir storage collect through rock fractures to these sections, resulting in higher water pressures at these locations.
(2) In the rainy season, increased rainfall activates fissures as seepage channels, elevating groundwater levels and subsequently increasing water pressure behind the lining. This results in significant deformation, particularly at the inverted arch positions of sections LK51 + 640 and RK51 + 590, where pressure is highest. The tunnel vault, subjected to heavy load and tensile stress from the surrounding rock, also shows substantial deformation, as does the arch foot, which experiences concentrated stress and larger plastic deformations than the vault.
(3) As groundwater levels rise, the deformation of the inverted arch, arch foot, and vault increases. The emergence of macro-cracks in these areas allows groundwater to seep into the tunnel, jeopardizing its operation. During the rainy season, reinforcing these areas is crucial to prevent water seepage and ensure structural integrity.
There are still certain limitations in this study. Currently, engineering recommendations to reduce the risk of tunnel leakage are proposed based only on the deformation characteristics of the lining structure. Future research will focus on the bending moments and axial forces on the tunnel lining structure to calculate the safety factor of the lining structure. Furthermore, FLAC3D does not consider the discontinuities between rock joints and blocks, whereas the 3DEC 7.0 discrete element software can simulate discrete systems like rock masses and fracture media. In the future, FLAC3D can be coupled with 3DEC to achieve accurate analysis of the seepage field characteristics around tunnels under complex geological conditions, such as fault fracture zones.

Author Contributions

Conceptualization, Z.F. and D.L.; methodology, Z.F. and D.L.; software, D.L. and S.W.; validation, D.L. and L.Z.; formal analysis, D.L. and L.Z.; investigation, F.W.; resources, Z.F.; data curation, D.L. and S.W.; writing—original draft preparation, D.L.; writing—review and editing, D.L. and L.Z.; supervision, Z.F. and F.W. All authors have read and agreed to the published version of the manuscript.

Funding

This research received no external funding.

Institutional Review Board Statement

Not applicable.

Informed Consent Statement

Not applicable.

Data Availability Statement

Data are available in a publicly accessible repository.

Acknowledgments

The authors extend their profound gratitude to Liang Tang and Yanchen Tan of Poly Changda Engineering Co., Ltd. in China. Their magnanimous provision of both funding and the test site was instrumental in the successful execution of the experiments detailed in this study.

Conflicts of Interest

The authors declare that this study received funding from Poly Changda Engineering Co., Ltd. in China. The funder was not involved in the study design, collection, analysis, interpretation of data, the writing of this article or the decision to submit it for publication.

References

  1. Peng, L. Existing Operational Railway Tunnel Water Leakage Causes and Remediation Technologies. Adv. Mater. Res. 2014, 1004–1005, 1444–1449. [Google Scholar] [CrossRef]
  2. Li, S.C.; Zhou, Z.Q.; Li, L.P.; Xu, Z.H.; Zhang, Q.Q.; Shi, S.S. Risk assessment of water inrush in karst tunnels based on attribute synthetic evaluation system. Tunn. Undergr. Space Technol. Inc. Trenchless Technol. Res. 2013, 38, 50–58. [Google Scholar] [CrossRef]
  3. Gao, C.L.; Zhou, Z.Q.; Yang, W.M.; Lin, C.J.; Lia, L.P.; Wang, J. Model test and numerical simulation research of water leakage in operating tunnels passing through intersecting faults. Tunn. Undergr. Space Technol. 2019, 94, 13. [Google Scholar] [CrossRef]
  4. Liu, T.J.; Zhu, H.H.; Xia, C.C.; Li, Z.H.; Li, G.F. Analysis of site investigation of cracking and leakage on arcade tunnel lining of Yunnan province. China J. Highw. Transp. 2004, 17, 64–67. (In Chinese) [Google Scholar]
  5. Zou, Y.L.; He, C.; Zhou, Y.; Zhang, Z.; Fu, J.K. Statistics and Cause Analysis of Leakage Diseases in Operating Expressway Tunnels in Chongqing. J. Highw. Transp. Res. Dev. 2013, 30, 86–93. (In Chinese) [Google Scholar]
  6. Zarei, H.R.; Uromeihy, A.; Sharifzadeh, M. Evaluation of high local groundwater inflow to a rock tunnel by characterization of geological features. Tunn. Undergr. Space Technol. 2011, 26, 364–373. [Google Scholar] [CrossRef]
  7. He, H.; Tang, X.; Lin, S.; Yan, Z.; Li, D. Field experiments and numerical simulations for two types of steel tube lining structures under high internal pressure. Tunn. Undergr. Space Technol. 2022, 120, 104272. [Google Scholar] [CrossRef]
  8. Chen, Z.Q.; Li, Z.; He, C.; Ma, C.C.; Li, X.; Chen, K.; Zhang, H.; Liu, M. Investigation on seepage field distribution and structural safety performance of small interval tunnel in water-rich region. Tunn. Undergr. Space Technol. 2023, 138, 105172. [Google Scholar] [CrossRef]
  9. Li, Z.; Chen, Z.Q.; He, C.; Chen, K.P.; Zhang, H.; Ma, C.C.; Li, X.; Liu, M.Y. Experimental simulation of seepage field distribution for small interval tunnel under varying-head infiltration. Transp. Geotech. 2023, 41, 22. [Google Scholar] [CrossRef]
  10. Li, Z.; He, C.; Chen, Z.Q.; Yang, S.Z.; Ding, J.J.; Pen, Y. Study of seepage field distribution and its influence on urban tunnels in water-rich regions. Bull. Eng. Geol. Environ. 2019, 78, 4035–4045. [Google Scholar] [CrossRef]
  11. Liang, Y.; Chen, X.Y.; Yang, J.S.; Zhang, J.; Huang, L.C. Analysis of ground collapse caused by shield tunnelling and the evaluation of the reinforcement effect on a sand stratum. Eng. Fail. Anal. 2020, 115, 13. [Google Scholar] [CrossRef]
  12. Li, D.; Cheng, S.; Liu, N.; Liu, Z.; Sun, Y. Numerical Simulation Study on the Distribution Characteristics of Precipitation Seepage Field in Water-Rich Ultra-Thick Sand and Gravel Layer. Water 2023, 15, 3720. [Google Scholar] [CrossRef]
  13. Li, Z.; Chen, Z.Q.; He, C.; Ma, C.C.; Duan, C.R. Seepage field distribution and water inflow laws of tunnels in water-rich regions. J. Mt. Sci. 2022, 19, 591–605. [Google Scholar] [CrossRef]
  14. Mei, Y.; Luo, Z.; Jiang, H.Y.; Gong, H.; Hou, Y.D.; Wang, X.F. Study on the Floating Law of Metro Segments in Water-Rich Sandy Silt and Silty Clay Strata. KSCE J. Civ. Eng. 2022, 26, 2979–2991. [Google Scholar] [CrossRef]
  15. Shi, J.K.; Wang, F.; Zhang, D.M.; Huang, H.W. Refined 3D modelling of spatial-temporal distribution of excess pore water pressure induced by large diameter slurry shield tunneling. Comput. Geotech. 2021, 137, 18. [Google Scholar] [CrossRef]
  16. He, B.G.; Xue, R.H.; Zhang, Z.Q.; Feng, X.T.; Wu, C. A novel method of imposing external water pressure to explore the failure behavior of railway tunnel linings. Tunn. Undergr. Space Technol. 2023, 133, 15. [Google Scholar] [CrossRef]
  17. Yang, F.J.; Zhou, H.; Zhang, C.Q.; Lu, J.J.; Lu, X.J.; Geng, Y.J. An analysis method for evaluating the safety of pressure water conveyance tunnel in argillaceous sandstone under water-weakening conditions. Tunn. Undergr. Space Technol. 2020, 97, 15. [Google Scholar] [CrossRef]
  18. Huang, M.; Huang, M.; Yang, Z. Large-Scale Model Test on Water Pressure Resistance of Lining Structure of Water-Rich Tunnel. Materials 2023, 16, 440. [Google Scholar] [CrossRef] [PubMed]
  19. Zhu, Y.M.; Yang, H.P.; Huang, M.Q.; Wang, L. External hydraulic pressure and invert uplift study in a non-circular shallow tunnel. Tunn. Undergr. Space Technol. 2022, 122, 13. [Google Scholar] [CrossRef]
  20. Wang, T.; Yan, C.Z. Investigating the influence of water on swelling deformation and mechanical behavior of mudstone considering water softening effect. Eng. Geol. 2023, 318, 20. [Google Scholar] [CrossRef]
  21. Zhang, W.J.; Wang, J.H.; Jin, M.M.; Koizumi, A. Numerical analysis of DRC segment under inner water pressure based on full-scale test verification for shield tunnel. Tunn. Undergr. Space Technol. 2016, 56, 157–167. [Google Scholar] [CrossRef]
  22. Xie, Q.; Cao, Z.L.; Sun, W.C.; Fumagalli, A.; Fu, X.; Wu, Z.H.; Wu, K. Numerical simulation of the fluid-solid coupling mechanism of water and mud inrush in a water-rich fault tunnel. Tunn. Undergr. Space Technol. 2023, 131, 22. [Google Scholar] [CrossRef]
  23. Luo, S.; Xu, M.; Kang, X.B.; Li, X.X.; Rao, L.F. Analytical solution of external water pressure on deep tunnel lining in horizontally layered hydrogeological structures. Bull. Eng. Geol. Environ. 2022, 81, 13. [Google Scholar] [CrossRef]
  24. Jiang, C.; Xie, H.S.; He, J.L.; Wu, W.Y.; Zhang, Z.C. Analytical Solution of Seepage Field in Karst Tunnel. Adv. Civ. Eng. 2018, 2018, 9. [Google Scholar] [CrossRef]
  25. Zhao, N.; Wang, Y.C.; Meng, B.; Luo, N. Numerical Simulation on the Seepage Properties of Soil-Rock Mixture. Adv. Mater. Sci. Eng. 2018, 2018, 10. [Google Scholar] [CrossRef]
  26. Li, S.; Liu, H.L.; Li, L.-P.; Zhang, Q.-Q.; Kai, W.; Wang, K. Large scale three-dimensional seepage analysis model test and numerical simulation research on undersea tunnel. Appl. Ocean. Res. 2016, 59, 510–520. [Google Scholar] [CrossRef]
  27. GB 50010-2010; Ministry of Housing and Urban-Rural Development of the People’s Republic of China. Code for Design of Concrete Structures. Chinese Standard: Beijing, China, 2011.
Figure 1. Location of the tunnel in relation to the reservoir.
Applsci 14 07110 g001
Figure 2. The geological profile of the tunnel site area (K51 + 260~K52 + 060).
Applsci 14 07110 g002
Figure 3. Water seepage and leakage in the Gudou Mountain tunnel. (a) Vault surge. (b) Water seepage at the arch waist. (c) Waterlogging in the inverted arch.
Applsci 14 07110 g003
Figure 4. Physical drawing of the equipment. (a) Digital water pressure sensors. (b) Multi-channel collector. (c) Equipment groups.
Applsci 14 07110 g004
Figure 5. Arrangement of test apparatus.
Applsci 14 07110 g005
Figure 6. Arrangement of test sections.
Applsci 14 07110 g006
Figure 7. Test process. (a) Boreholes. (b) Placement of water pressure sensors at the inverted arch. (c) Water pressure sensor fixation. (d) Placement of water pressure sensors in boreholes. (e) Completion of equipment deployment. (f) Installation of flashing. (g) Application of secondary lining. (h) Power on and read data.
Applsci 14 07110 g007aApplsci 14 07110 g007b
Figure 8. Water pressure test results of each section. (a) LK51 + 610. (b) LK51 + 640. (c) RK51 + 590. (d) RK51 + 620.
Applsci 14 07110 g008
Figure 9. Distribution of water pressure contours around each section. (a) LK51 + 610. (b) LK51 + 640. (c) RK51 + 590. (d) RK51 + 620.
Applsci 14 07110 g009
Figure 10. Numerical model.
Applsci 14 07110 g010
Figure 11. Comparison of water pressure at different locations in numerical simulation and field test. (a) LK51 + 610. (b) LK51 + 640. (c) RK51 + 590. (d) RK51 + 620.
Applsci 14 07110 g011aApplsci 14 07110 g011b
Figure 12. Water pressure cloud at various groundwater levels. (a) 126 m. (b) 127 m. (c) 128 m. (d) 129 m.
Applsci 14 07110 g012aApplsci 14 07110 g012b
Figure 13. Deformation of lining structure at different water level heights. (a) LK51 + 610. (b) LK51 + 640. (c) RK51 + 590. (d) RK51 + 620.
Applsci 14 07110 g013
Table 1. Physical and mechanical properties of the surrounding and faulted rock masses.
Physical–Mechanical ParameterSurrounding RockGeologic Fault
Hydraulic conductivity (10−5 cm/s)0.6128.06
Porosity (%)0.50.73
Modulus of elasticity (GPa)2511
Poisson’s ratio0.350.45
Internal friction angle (°)3029
Cohesion (MPa)0.250.01
Volumetric weight (kN/m3)2217.8
Table 2. Main technical specifications of water pressure sensor.
Water Pressure Sensor ParametersParameter Values
Maximum diameter (mm)28
Length (mm)135
Maximum pressure measurement range (MPa)1
Resolution (%F·S)0.008
Measurement accuracy (%F·S)±0.1
Output signalRS485, Modbus protocol
Protection classIP68
Disclaimer/Publisher’s Note: The statements, opinions and data contained in all publications are solely those of the individual author(s) and contributor(s) and not of MDPI and/or the editor(s). MDPI and/or the editor(s) disclaim responsibility for any injury to people or property resulting from any ideas, methods, instructions or products referred to in the content.

