Abstract
This study was conducted with the aim of protecting groundwater, which plays a crucial role in ensuring food quality in the market, preserving public health, and safeguarding the ecosystem, as many regions rely on clean natural groundwater for their population’s survival. The objective of this study was to use the Canadian Council of Ministers of the Environment Water Quality Index (CCME WQI) for groundwater at 12 stations in the Okhla Industrial Area, Nangloi, and Karol Bagh in the Delhi Region. CCME WQI is an effective tool for assessing groundwater quality and communicating water conditions to various users. The research methodology involved fieldwork from June to October 2020 for three different periods in the year: pre-monsoon, monsoon, and post-monsoon, to observe variations in water quality and differences in various physicochemical properties of water. The CCME WQI was applied using sixteen water quality parameters, fourteen of which were physicochemical parameters and two of which were microbiological parameters. Among the physicochemical parameters were color, odor, pH, turbidity, nitrate, total hardness, iron, chloride, fluoride, total dissolved solids, calcium, magnesium, sulfate, and alkalinity, while the microbiological parameters included the total coliform and Escherichia coli counts. Based on the results obtained from the water quality index, station A9 scored between 0 and 44, indicating the lowest water quality index due to wastewater discharges and industrial contamination. The water quality at other stations also requires attention to achieve excellent ratings. The study concludes that serious measures should be taken for proper management of the area to protect the population from hazardous diseases. The research results show that stations 1, 2, and 10 were rated as excellent, station 12 as good, stations 4, 5, and 8 as moderate, stations 3, 6, and 11 as marginal, and station 9 as the poorest in terms of water quality in the year 2020 during the pre-monsoon, monsoon, and post-monsoon periods. To improve the parameters and groundwater quality, it would be necessary to reduce the impact of industry, anthropogenic–geogenic activities, and domestic activities.
1. Introduction
Groundwater is a vital resource that sustains food quality, public health, and ecosystem integrity in many regions, serving as a lifeline for local populations. However, the alarming threat of groundwater pollution poses significant challenges not only to the environment but also to human well-being, as it can lead to shifts in critical water quality parameters. In response to these concerns, this study investigates the applicability of the Canadian Council of Ministers of the Environment Water Quality Index (CCME WQI) as a tool for monitoring and evaluating groundwater quality. Focusing on a case study from the Delhi Region, specifically within the Okhla Industrial Area, Nangloi, and Karol Bagh, the research endeavors to assess the effectiveness of CCME WQI in communicating groundwater conditions to a diverse range of stakeholders. The research methodology employed extensive fieldwork conducted from June to September 2020, covering three distinct seasonal periods: pre-monsoon, monsoon, and post-monsoon. This comprehensive approach aimed to capture variations in water quality and illuminate disparities in various physicochemical and microbiological properties of groundwater. To assess groundwater quality, the CCME WQI was employed utilizing sixteen key water quality parameters. Among these parameters, fourteen were physicochemical in nature, encompassing factors such as color, odor, pH, turbidity, nitrate levels, total hardness, iron content, chloride concentration, fluoride presence, total dissolved solids, calcium and magnesium levels, sulfate concentration, and alkalinity. Additionally, two microbiological parameters were examined, focusing on the total coliform and Escherichia coli counts. The study further utilized Geographic Information System (GIS) technology to visualize and elucidate the spatial distribution of these parameters within both groundwater and canal water at the sampling stations. This research seeks to provide valuable insights and recommendations to mitigate groundwater quality issues, underscoring the importance of proactive measures to protect this invaluable resource.
A water quality index (WQI) is a robust and efficient tool for evaluating the overall quality characteristics of water in any reservoir. It effectively communicates water quality trends to policymakers and the general public [1].
Specifically, a WQI consistently summarizes water quality data, offering a straightforward assessment of the drinking water quality from a water supply source [2].
A WQI is invaluable for assessing water quality at specific times and locations. It consolidates various water quality parameters into easily understandable information, benefiting state agencies and the public alike. In today’s world, access to safe freshwater sources, particularly groundwater reservoirs, is critical. However, these sources are being increasingly impacted by both natural processes and human activities [3,4,5,6].
Changes in the physicochemical characteristics of water quality result from a combination of anthropogenic factors and various natural processes. Human activities significantly affect water quality, with this trend escalating rapidly in developing countries worldwide.
To protect freshwater resources, it is essential to develop comprehensive water quality monitoring programs. These programs should be designed based on existing water quality standards, anthropogenic impacts, and ‘use’ criteria [7]. Water quality is a crucial concern in water resource management and environmental monitoring, encompassing three main categories (physical, chemical, and biological parameters), each with numerous specific indicators [8].
However, when dealing with a large number of samples and monitored parameters, evaluating and presenting water quality as a single unit becomes challenging [9]. This is where a water quality index (WQI) plays a crucial role. It condenses the measurements of selected parameters into a single dimensionless number, simplifying the representation of water quality [10]. There are several models of WQI that identify the level of water quality. Several of these models are presented in the study by authors [11] who provide new approaches and starting points for examining water quality.
In developing countries, where budget constraints often limit extensive water quality analysis, it is essential to focus on a few critical parameters when calculating a WQI [12].
Importance and advantages: The CCME WQI (Canadian Council of Ministers of the Environment Water Quality Index) serves as an effective tool for assessing groundwater quality and communicating water health to multiple stakeholders, including policy and decision makers. It provides precise results and easily understandable water quality reports [13]. The CCME WQI has been adopted globally for evaluating water quality in rivers, lakes, groundwater, and reservoirs. It was designed and developed by the Canadian Council of Ministers of the Environment (CCME) to study the impact of water degradation on various aspects, such as human health, aquatic life, livestock, agriculture, and suitability for different uses like drinking water and irrigation. Since 2001, the CCME WQI has been widely used worldwide to assess water quality and produce comprehensive reports, identifying areas with varying levels of contamination. [14,15,16]. Researchers often rely on the CCME WQI to assess water quality parameters over time. While it is currently used on a case-by-case basis for surface water sources and distribution systems, its full potential as a management tool for complete water supply systems (WSSs) has yet to be fully recognized on a global scale [17].
In one study conducted in Fort Lake, Belgaum, Karnataka, India, the CCME WQI was applied to assess its impact on aquatic life, livestock, and its suitability for recreation, irrigation, and drinking water [18].
The CCME WQI provides a versatile index template that can be tailored to the specific site and treatment considerations of drinking source water. By comparing measured water quality values to established guidelines, it generates a score from 0 (worst quality) to 100 (best quality). Practitioners can choose relevant parameters and guidelines to suit their needs, thus accommodating site-specific and treatment considerations when evaluating drinking source water. The CCME WQI has been applied to characterize water quality for various purposes, including agriculture, the protection of aquatic life, and treated drinking water [19]. The importance and necessity of monitoring and assessing water quality using the WQI have been underscored by numerous experts around the world, as demonstrated in several studies [20,21,22].
In this study, we employed the Canadian Council of Ministers of the Environment Water Quality Index 1.0 (CCME WQI), a widely accepted and universally applicable computer model for assessing water quality. This index effectively highlights relative differences in water quality between sites, even when the same objectives and variables are used [23].
Comparison of the CCME WQI with other methods: The CCME-WQI method provides several benefits compared to other water quality index (WQI) methods. Firstly, it simplifies the analysis by reducing the number of variables needed for index calculation, which streamlines the process and shortens analysis time. Secondly, it offers a detailed assessment of water quality characteristics, delivering a more accurate representation of river conditions [24].
Additionally, the CCME-WQI method has been effectively employed to evaluate groundwater quality for drinking purposes, demonstrating its capability of offering a thorough assessment of water suitability for human use [25].
Furthermore, this method has also been used to monitor reservoir water quality over time, allowing for the examination of interannual and seasonal variations and the prediction of future water quality trends [26].
2. Research Methodology
The study involved analyzing 12 water samples collected at three different times throughout the year in the study area, evaluating various water quality parameters. This included assessing the CCME WQI and its ratings for these samples, as well as monitoring groundwater quality at different intervals throughout the study period.
2.1. Hypotheses
Seasonal variations in groundwater quality are common and can be attributed to factors such as changes in precipitation patterns, temperature, and land use. Without specific data, we can anticipate that groundwater quality might show variations based on these factors. For example, during the monsoon season, increased rainfall can lead to more runoff and potential contamination from surface sources, affecting water quality parameters. In contrast, the post-monsoon period may see changes in groundwater quality as water levels stabilize.
Hypothesis 1:
Groundwater quality in the study area of the Delhi Region varies significantly across different seasons (pre-monsoon, monsoon, and post-monsoon).
This hypothesis is based on the common understanding that industrial areas often contribute to groundwater pollution due to the discharge of industrial effluents and chemicals. Also, the household settlement areas play a crucial role in contaminating the groundwater table by releasing the wastes in liquid and solid form.
Hypothesis 2:
The water quality in different locations of the Delhi Region varies significantly, with some areas displaying excellent quality while others exhibit fair to marginal to poor quality according to theCCME WQI techniques applied.
2.2. Study Area
Delhi, a vibrant cosmopolitan city with a rich and diverse culture, is the capital of the world’s largest democracy, India. Historically known as Indraprastha, Delhi spans an area of 1483 square kilometers along the banks of the River Yamuna. Geographically, Delhi is located at 28.38° N latitude and 77.13° E longitude in the northern part of India. The city features three major geographical regions: the Yamuna floodplain, the ridge, and the Gangetic Plains. The Yamuna floodplain, with its fertile soil, is ideal for agriculture but is susceptible to frequent flooding. The ridge, with an average elevation of 293 m above sea level, is the most prominent feature of the area. Delhi consists of 200 densely populated villages. It shares its borders with Haryana to the west and Uttar Pradesh to the east.
The area of Delhi is about 1484 sq. km. The rural area of Delhi is 783 sq. km. (302 sq. miles), and the urban area is 700 sq. km (270 sq. miles). Delhi’s length is approximately 51.9 km (32 miles), while its width is about 48.48 km (30 miles). Delhi lies between 28°24′15″ and 28°53′00″ north latitude and 76°50′ east longitude [World Energy Council 2010].
The study area in Delhi focuses on the Okhla Industrial Area, Nangloi, and Karol Bagh to assess water quality during the pre-monsoon, monsoon, and post-monsoon seasons. The base map of the study area was created using Survey of India topographic sheets and digitized with ArcGIS software (Figure 1). GPS technology was employed to pinpoint the location of each sampling site, and the coordinates were subsequently imported into the GIS platform for further analysis.

Figure 1.
Location map showing study sites of Delhi region.
The Okhla Industrial Area—Okhla is situated near the Okhla barrage in South Delhi. It is also known as the Okhla Industrial Area or the Okhla Industrial Estate. It is an industrial suburb divided into three phases, namely Okhla Industrial Area Phase 1, Phase 2, and Phase 3. The coordinates of the Okhla Industrial Area are 28.5317° N, 77.2766° E. It is the oldest village situated near the bank of the River Yamuna. The settlements of the Okhla Industrial Area Phase I and Phase II are mostly covered with slums, and the conditions in the area are characterized by a poor to very poor lifestyle under a huge number of industrial settlements. Tekhand is one of the oldest villages in the Okhla Industrial Area. The demography and economic profile are bleak, whereas the environmental and behavioral factors in the area suggest that the groundwater quality is very poor.
Karol Bagh—This area is situated in the central district of Delhi. It is mostly a settlement of commerce and residence where colonial neighborhood and shopping streets are situated, featuring a population of approximately 3.75 lakh persons. The residential areas in Karol Bagh are W.E.A, Beadon Pura, Reghar Pura, Dev Nagar, and Bapa Nagar. The coordinates of this area are 28.6550° N, 77.1888° E.
Nangloi—The coordinates of the Nangloi area are 28.6841° N, 77.0633° E. Nangloi is located in the western district of Delhi, surrounded by the Delhi Outer Ring Road, Bahadurgarh, Najafgarh, and Paschim Vihar. National Highway 10 (Rohtak Road) passes through Nangloi, and it is linked to the Green Line of the Delhi Metro. Nangloi, part of the Western District of Delhi, has a population of approximately sixteen lakh. The population density mainly consists of Jat and Muslim communities. A water treatment plant has also been established in Nangloi. However, due to small-scale industries such as battery manufacturing, plastic production, and iron processing, the groundwater is highly contaminated. The THM (Total Trihalomethanes) parameter is prominently visible in many areas of Nangloi, particularly in the water pipelines supplying households.
2.3. Data Sources
A data source is the initial location where data originate or where physical information is first digitized. However, even highly refined data can act as a source if accessed and utilized by another process. Data sources can include databases, flat files, live measurements from physical devices, scraped web data, or various static and streaming data services available online. There are two types of data sources: (a) primary data and (b) secondary data.
Primary data were collected by selecting 12 water sampling stations in the three study areas. With the help of GPS, the location of each sampling station was determined and the coordinates of the latitudes and longitudes were recorded. These coordinates were then imported into a GIS platform for further analysis. Twelve water samples (A1 to A12) were collected from the Okhla Industrial Area, Nangloi, and the Karol Bagh District of New Delhi (Table 1). The twelve sample stations were identified and fixed in the study area for water sampling.

Table 1.
Sample name and their location.
The four sample stations were identified and established in each study area for water sample collection. In Karol Bagh, water samples were collected from a hand pump on Padam Singh Road, a bore well in Hotel Southern, a bore well on Street 49 in Reghar Pura, and a bore well on Street 58 in Reghar Pura (Figure 2—Site B). In the Okhla Industrial Area, water samples were obtained from a bore well in Tehkhand Village, Indira Kalyan Vihar, Okhla Community Development Project, and J J Cluster in Sanjay Colony (Figure 2—Site C). In the last area, Nangloi, two water samples were collected from canal water for treatment at the Nangloi Treatment Plant, from the treated water supply at the Nangloi Treatment Plant, and two water samples were obtained from a hand pump near the Nangloi Treatment Plant (Figure 2—Site A).

Figure 2.
Site (A)—Location map showing water sample stations of the Nangloi District of Delhi; Site (B)—location map showing water sample stations of the Karol Bagh District of Delhi; Site (C)—location map showing water sample stations of Okhla of Delhi (author’s creation).
A comprehensive field survey was conducted within the study area during the pre-monsoon, monsoon, and post-monsoon periods to observe variations in water quality and differences in various physical properties of water. Interviews were conducted with the public at the stations to assess their knowledge of groundwater quality. Pictures, water samples, field observations, and public interview notes constituted the primary data. Secondary data included previous research papers, journals, and newspaper articles related to the study’s topic.
2.4. Sampling Techniques and Equipment
Research methodology is a systematic framework used to solve research problems by employing the best and most feasible methods to conduct research while aligning with the aims and objectives of your study. The research methodology involves addressing the ‘what’, ‘why’, and ‘how’ of your research [27].
Table 2 explains and tabulates the S.I. units of the parameters considered in this study. The table also highlights the standard values for these parameters, as provided by the Bureau of Indian Standards and the World Health Organization. These values have served as benchmarks for years in the analysis of water quality. Additionally, this table provides information on the weighting of these parameters in the calculations of the water quality index. Each parameter has been assigned an importance based on its impact on health and the environment.
Table 2.
Physiochemical and microbiological parameters, their units, and acceptable limits.
These weightages are standard values and have been utilized worldwide to present a unified picture of water quality.
Proper sampling procedures were followed at the 12 field stations during water sample collection. The date and time of sampling were recorded, and the sample quantity was observed. Temperature and humidity were measured, and the latitude and longitude of each station were recorded for map preparation. All the samples were collected in clean plastic containers, placed on deep ice in a dark box to maintain temperature, and transported to the laboratory for testing. Some samples arrived late at the laboratory, and, due to closing time, they were stored in a deep freezer box in the refrigerator. To prevent any sample deterioration, water samples were tested in the laboratory within 24 h of collection from the field to the lab.
To assess the quality of water samples, 16 water quality parameters were analyzed. These included the following 14 physio-chemical parameters: color, odor, pH, total hardness, calcium, magnesium, total alkalinity, chlorine, iron, sulfate, turbidity, fluoride, nitrate, and TDS values. There were also 2 microbiological parameters: coliform and Escherichia coli. The IS test method was used for testing these parameters.
Table 3 shows list of equipments which were used to analyze the different water quality parameters. pH was analyzed using a pH Meter, TDS was determined using a conductivity–TDS–Temperature Meter, and turbidity was monitored with a Nephelo/Turbidity Meter. Iron, fluoride, sulfate, and nitrate were tested using a Spectrophotometer. An Electronic Balance was used for weighing all the parameters, and a Hot Air Oven and Muffle Furnace were employed for drying. Water samples and chemicals were stored in a refrigerator and deep freezer. Temperature and humidity were monitored using a Thermos-Hygrometer. E. coli and total coliform were assessed through a Laminar Air Flow and Biosafety Cabinet. Color, odor, total hardness, chlorine, calcium, magnesium, and alkalinity were tested through chemical processes using the Titration Method.
Table 3.
List of equipments.
The range and accuracy of the equipment were always closely observed during testing. The data in Table 4, Table 5 and Table 6 suggest significant differences in various physiochemical properties, indicating that water quality varies from one location to another. In this study, we have determined the physiochemical and microbiological properties of water at various locations during the pre-monsoon, monsoon, and post-monsoon seasons to assess the extent of water contamination and the impact on physiochemical properties. The mean value for each parameter was calculated for the pre-monsoon, monsoon, and post-monsoon periods. These mean values represent the overall condition of each parameter across the different locations and provide a better understanding of the parameters that require collective attention.
Table 4.
Physiochemical and microbiological parameters of collected water samples of pre-monsoon.
Table 5.
Physiochemical and microbiological parameters of collected water samples during the monsoon season.
Table 6.
Physiochemical and microbiological parameters of collected water samples during the post-monsoon season.
In Table 4, the collection and testing period took place in the last week of June 2020, with the specific dates being as follows: Nangloi—June 13 to 18, Okhla Industrial Area—June 18 to 23, and Karol Bagh—June 17 to 22, signifying the pre-monsoon season.
The mean values for all parameters during the pre-monsoon period are as follows: pH—7.713333, nitrate—23.06667, total hardness—413.7, chloride—338.3083, fluoride—0.625, TDS—964.0917, calcium—70.8, magnesium—56.880833, sulphate—7777.16667, alkalinity—139.5333.
In Table 5, the collection and testing period occurred in July 2020. The mean values for all parameters during the monsoon period are as follows: pH—7.6275, nitrate—19.29167, total hardness—372.425, chloride—324.6583, fluoride—0.554545, TDS—808.90883, calcium—66.925, magnesium—49.225, sulphate—71.95, alkalinity—132.9167.
In Table 6, the collection and testing period took place in the 1st week of October 2020.
The mean values for all parameters during the post-monsoon period are as follows: pH—7.5767, nitrate—20.554, total hardness—350.525, chloride—297.491, fluoride—0.52, TDS—801.516, calcium—66, magnesium—44.525, sulphate—69.6, alkalinity—124.9.
The most concerning parameters revealed by this study are total hardness and the presence of bacteria. Immediate attention should be given to these issues as they can pose health hazards and related problems. Therefore, to assess the fitness and suitability of water for human use, the water quality index has been evaluated using the methodology proposed by [28].
2.5. Testing Methodlogy-CCME WQI
The CCME Water Quality Index (CCME WQI) offers a practical way to summarize complex water quality data and communicate them effectively to a general audience. This index includes three key components: Scope—indicating the number of parameters that do not meet water quality guidelines; Frequency—showing how often these guidelines are not met; and Amplitude—reflecting the degree to which the guidelines are exceeded. The index generates a score between 0 (worst water quality) and 100 (best water quality), which is categorized into five descriptive levels for easier interpretation. The specific parameters, guidelines, and timeframes used in the CCME WQI can vary depending on regional conditions, the purpose of the index, and local water quality issues. Endorsed in 2001, the CCME WQI has since been widely utilized in Canada and internationally to report on water quality status. Extensive testing and evaluations of the CCME WQI have been conducted over the years. The User’s Manual integrates the original development work with additional insights gained since 2001, updating the 2001 Technical Report and User’s Manual.
In our analysis, we adhered to CCME guidelines to calculate the water quality index for all twelve samples, considering data from the pre-monsoon, monsoon, and post-monsoon seasons. We calculated three variance measures from the selected water quality objectives: Scope, Frequency, and Amplitude. ‘Scope (F1)’ denotes the extent of non-compliance with water quality guidelines over the specified period; ‘Frequency (F2)’ represents the percentage of individual tests failing to meet the objectives; and ‘Amplitude (F3)’ reflects the magnitude by which the failed tests deviate from their objectives.
These factors are combined to produce a score between 0 and 100, representing the overall water quality. The WQI calculation follows the methodology outlined in the Canadian Water Quality Index 1.0 Technical Report (CCME 2001), where Scope is represented by F1, indicating the level of non-compliance with water quality guidelines over the relevant timeframe.
where the number of failed variables means the number of parameters that have failed and the total number of variables is the total number of parameters tested, which in our case is 14.
The measure for Frequency is F2. This will represent the percentage of individual tests that do not meet objectives (referred to as ‘failed tests’).
where the number of failed tests means the number of tests across all the data points that have failed and the total number of tests is the total number of tests, which in our case is 42 (14 × 3, as we have considered three seasons).
The measure for Amplitude is denoted as F3, representing the extent to which failed values deviate from their objectives. This is determined through a three-step process:
Step 1—Calculation of Excursion
Excursion refers to the number of times an individual concentration exceeds (or falls below) the objective, particularly when the objective is set as a minimum threshold. When the test value is required to stay below the objective, excursions are calculated based on instances where the concentration surpasses this limit.
Step 2—Calculation of Normalized Sum of Excursions
The normalized sum of excursions, referred to as ‘nse’, quantifies the overall extent of non-compliance across individual tests. It is calculated by summing the excursions of individual tests from their respective objectives and then dividing this total by the number of tests, which includes both those meeting the objectives and those failing to meet them.
Step 3—Calculation of F₃
F3 will be calculated using an asymptotic function that scales the normalized sum of excursions from objectives to produce a range from 0 to 100.
Finally, the WQI will be calculated as:
3. Results and Discussion
3.1. Results and Discussion Regarding Hypothesis 1
In the present study, we analyzed various water quality parameters for twelve samples collected from three different areas at four locations. This analysis was conducted during three distinct seasons: pre-monsoon, monsoon, and post-monsoon.
We selected Nangloi, Karol Bagh, and the Okhla Industrial Area as our study districts, where we established 12 water sampling stations. These stations were used for collecting samples three times each and conducting three rounds of testing in the laboratory during the pre-monsoon, monsoon, and post-monsoon seasons of the year 2020. The results have been highlighted through spatial distribution maps created with the assistance of ArcGIS.
The parameters for the 12 water samples from the four stations in the Nangloi district during the three monsoonal periods (pre-monsoon, monsoon, and post-monsoon) are shown in Figure 3, Figure 4 and Figure 5:

Figure 3.
Parameter’s pH, nitrate, total hardness and chloride of the Nangloi district for pre-monsoon, monsoon, and post-monsoon period (author’s creation).
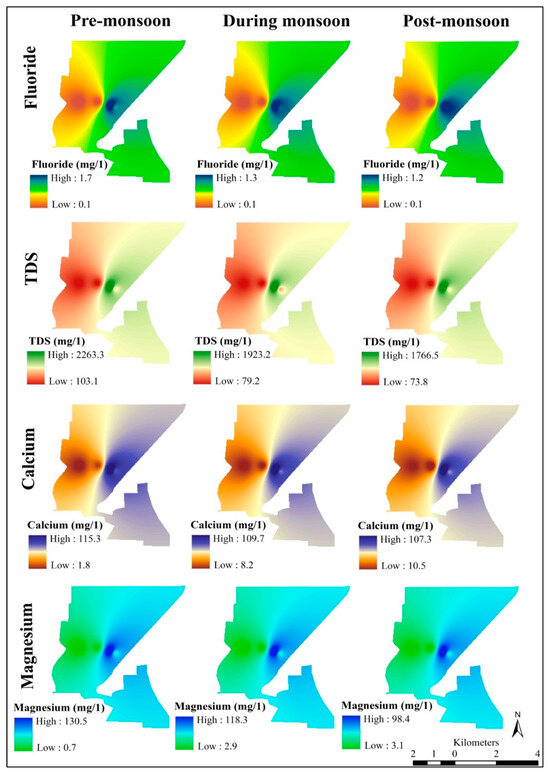
Figure 4.
Parameter’s fluoride, TDS, calcium and magnesium of Nangloi district for pre-monsoon, monsoon, and post-monsoon period (author’s creation).
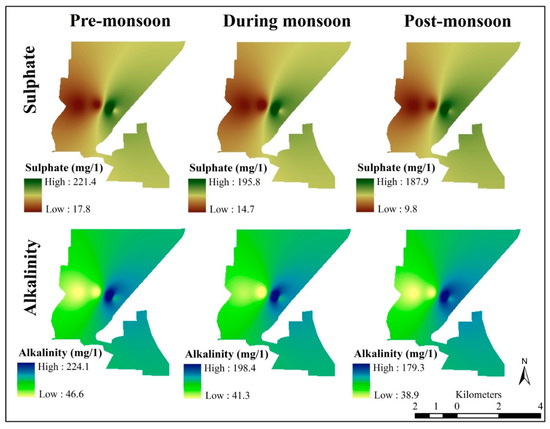
Figure 5.
Parameter’s sulphate, and alkalinity of the Nangloi district for pre-monsoon, monsoon, and post-monsoon period (author’s creation).
- pH—high 8.21 and low 7.4, high 8.11 and low 7.12, high 8.14 and low 7.09;
- Nitrate (mg/L)—high 67.0 and low 2.0, high 58.2 and low 2.0, high 58.2 and low 2.0;
- Total Hardness (mg/L)—832.0 and low 7.0, high 77.2 and low 35.6, high—678.3 and low 39.2;
- Chloride (mg/L)—high 831.2 and low 7.9, high 792.4 and low 7.5, high 657.9 and low 10.2;
- Fluoride (mg/L)—high 1.7 and low 0.1, high 1.3 and low 0.1, high 1.2 and low 0.1;
- TDS (mg/L)—high 2263.3 and low 103.1, high 1923.2 and low 79.2, high 1766.5 and low 773.8;
- Calcium (mg/L)—high 115.3 and low 1.8, high 109.7 and low 8.2, high 107.3 and low 10.5;
- Magnesium (mg/L))—high 130.5 and low 0.7, high 118.3 and low 2.9, high 98.4 and low 3.1;
- Sulphate (mg/L)—high 221.4 and low—17.8, high 195 and low 14.7, high 187.9 and low 9.8;
- Alkalinity (mg/L)—high 224.1 and low 46.6, high 198.4 and low 41.3, high 179.3 and low 38.9.
The pH levels at all stations in the Nangloi district during the three monsoonal periods fall within the acceptable limits. However, for most of the stations marked in bold, the rest of the parameters exceed the limits specified in the BIS standard for drinking water The Bureau of Indian Standards (BIS) has established IS 10500: 2012 as the official Indian standard for drinking water quality. This standard was first introduced in 1983 under the title "Indian Drinking Water Specification" and has undergone several revisions since then, with the most recent one occurring in 2012. [https://www.pureitwater.com/blog/post/standards-for-drinking-water-in-india (accessed on 6 July 2024)]
The parameters measured for the 12 water samples collected from the four stations in the Karol Bagh district during the three monsoonal periods (pre-monsoon, monsoon, and post-monsoon) are presented in Figure 6, Figure 7 and Figure 8.

Figure 6.
Parameter’s Ph, nitrate, total hardness and chloride of Karol Bagh district for pre-monsoon, monsoon, and post-monsoon period (author’s creation).

Figure 7.
Parameter’s fluoride, TDS, calcium and magnesium of the Karol Bagh district for the pre-monsoon, monsoon, and post-monsoon period (author’s creation).

Figure 8.
Parameter’s sulphate, and alkalinity of the Karol Bagh district for the pre-monsoon, monsoon, and post-monsoon period (author’s creation).
- pH—high 7.81 and low 7.11, high 7.59 and low 7.16, high 7.56 and low 7.32;
- Nitrate (mg/L)—high 18.9 and low 6.7, high 15.8 and low 6.5, high 15.8 and low 6.5;
- Total Hardness (mg/L)—high 616.8 and low 161.3, high 558.4 and low 142.1, high 492.9 and low 141.9;
- Chloride (mg/L)—high 519.8 and low 104.2, high 487.6 and low 98.7, high 395.3 and low 75.3;
- Fluoride (mg/L)—high 0.8 and low 0.4, high 0.7 and low 0.4, high 0.5 and low 0.3;
- TDS (mg/L)—high 1439.1 and low 338.0, high 1275.6 and low 312.4, high 1103.2 and low 217.2;
- Calcium (mg/L)—high 95.9 and low 34.7, high 98.7 and low 31.5, high 88.5 and low 32.4;
- Magnesium (mg/L)—high 90.5 and low 17.9, high 72.4 and low 12.8, high 65.2 and low 12.4;
- Sulfate (mg/L)—high 101.9 and low 15.9, high 95.2 and low 11.5, high 102.5 and low 15.2;
- Alkalinity (mg/L)—high 214.7 and low 9.1, high 187.8 and low 85.7, high 175.8 and low 779.4.
The pH levels at all stations in the Karol Bagh district during the three monsoonal periods are within the acceptable limits. However, for most of the stations marked in bold, the rest of the parameters exceed the limits specified in the BIS standard for drinking water (BIS standard 10500:2012).
The parameters for the 12 water samples collected from the four stations in the Okhla Industrial Area during the three monsoonal periods (pre-monsoon, monsoon, and post-monsoon) are displayed in Figure 9, Figure 10 and Figure 11.

Figure 9.
Parameter’s pH, nitrate, total hardness and chloride of the Okhla Industry Area for the pre-monsoon, monsoon, and post-monsoon period (author’s creation).

Figure 10.
Parameter’s fluoride, TDS, calcium and magnesium of the Okhla Industry Area for the pre-monsoon, monsoon, and post-monsoon period (author’s creation).
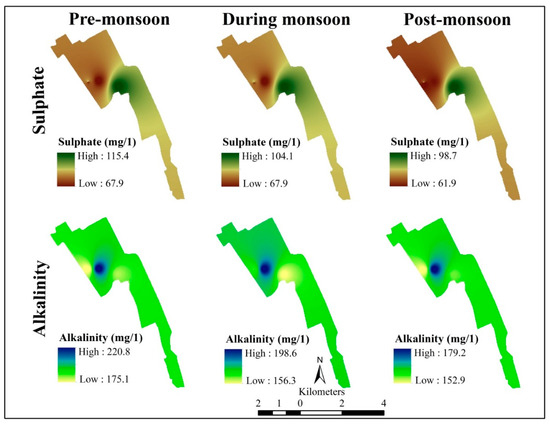
Figure 11.
Parameter’s sulphate, and alkalinity of the Okhla Industry Area for the pre-monsoon, monsoon, and post-monsoon period (author’s creation).
- pH—high 8.45 and low 7.84, high 8.21 and low 7. 67, high 7.92 and low 7.54;
- Nitrate (mg/L)—high 32.6 and low 12.9, high 28.1 and low 12.9, high 28.1 and low 9.5;
- Total Hardness (mg/L)—high 703.6 and low 469.9, high 586.8 and low 416.7, high 576.8 and low 384.0;
- Chloride (mg/L)—high 557.9 and low 341.3, high 541.5 and low 328.9, high 521.8 and low 342.1;
- Fluoride (mg/L)—high 0.7 and low 0.4, high 0.5 and low 0.3, high—0.5 and low 0.2;
- TDS (mg/L)—high 1500.4 and low 998.9, high 1295.3 and low 934.4, high 1320.6 and low 908.0;
- Calcium (mg/L)—high 117.6 and low 83.8, high 106.9 and low 75.5, high 109.4 and low 71.6;
- Magnesium (mg/L)—high 98.3 and low 60.1, high 77.3 and low 54.7, high 72.8 and low 49.2;
- Sulfate (mg/L)—high 115.4 and low 67.9, high 104.1 and 67.9, high 98.7 and low 61.9;
- Alkalinity (mg/L)—high 220.8 and low 175.1, high 198.6 and low 156.3, high 179.2 and low 152.9.
The pH, magnesium, TDS, and chloride levels at all stations in the Okhla Industrial Area during the three monsoonal periods are within the acceptable limits. However, for most of the stations marked in bold, the rest of the parameters exceed the limits specified in the BIS standard for drinking water (BIS standard 10500:2012).
pH Level: If the pH level in water is too high, it will generate calcium and magnesium carbonate in your pipelines and may cause dry skin, itching, and irritation. The taste of the water may also become bitter. Conversely, if the pH level is too low, the water becomes acidic and may leach toxic metal ions (such as lead, manganese, copper, and iron in large amounts) from pipes, wells, aquifers, and plumbing fixtures that deliver water to you. This can damage certain tissues and may lead to cardiovascular diseases, potentially resulting in a heart attack and even fatal outcomes [29].
Nitrate Presence: A high level of nitrate in groundwater, if consumed, can increase the risk of colon cancer, bladder cancer, breast cancer, neural tube defects, thyroid disease, methemoglobinemia (particularly in young children), birth defects, and an increased risk of miscarriage. Individuals with low stomach acid or those suffering from anemia, cardiovascular disease, lung disease, acidosis, sepsis, or specific enzyme deficiencies are at a higher risk of methemoglobinemia [30].
Total Hardness: Elevated total hardness in water can pose risks such as cardiovascular disease, growth retardation, reproductive failure, and other health problems. When used for bathing, hard water may lead to skin infections and hair loss. However, when ingested, it can have positive effects on health due to its calcium and magnesium content [31,32].
Chloride Levels: High chloride levels in water can corrode and weaken metallic piping and fixtures, giving the drinking water a “salty” taste, damaging household appliances and boilers, and inhibiting vegetation growth when used for irrigation. Chloride is generally not considered a health risk, but at relatively low concentrations, it can affect the taste of water. However, a high chloride intake can result in high levels of chloride in the bloodstream, a condition known as hyperchloremia [33].
Fluoride Contamination: Elevated levels of fluoride ions in drinking water can cause a range of health problems, including dental and skeletal fluorosis, arthritis, bone damage, osteoporosis, muscular damage, fatigue, joint issues, and chronic health conditions. In severe cases, excessive fluoride exposure can negatively impact the heart, arteries, kidneys, liver, endocrine glands, nervous system, and other sensitive organs [34].
TDS (Total Dissolved Solids): Harmful constituents of TDS present in water include aluminum, arsenic, barium, cadmium, chlorides, copper, fluoride, lead, nitrates, sodium, and sulfates. Beneficial constituents of TDS include zinc, magnesium, potassium, and calcium. High TDS levels in bathing water can lead to dry and rough skin, hair damage, dandruff, and hair loss. It can also give drinking water a bitter and salty taste. If the TDS level exceeds 500 ppm, drinking water may contain harmful impurities like arsenic, mercury, and fluoride [35]. Low TDS levels, around 100 ppm, may result in a flat or diluted taste, while high levels can lead to various health issues, including nausea, lung irritation, rashes, vomiting, and dizziness. Prolonged consumption of water with elevated TDS can expose the body to chemicals and toxins, potentially causing chronic health conditions, weakened immunity, and birth defects in newborns. Some studies suggest that consuming water with low TDS may cause mineral leaching from healthy tissues in the body [36].
Calcium and Magnesium Levels: Abnormal levels of calcium and magnesium in water can contribute to cardiovascular diseases, cerebrovascular diseases, bone mineral issues, growth problems, reproductive failure, gastric cancer, colon cancer, central nervous system malformations, Alzheimer’s disease, diabetes, childhood atopic dermatitis, kidney stones, digestive problems, and constipation. Excessive magnesium intake, particularly in the form of supplements rather than through dietary sources, may lead to bowel issues, including diarrhea, and carry potential health risks such as esophageal cancer and ovarian cancer [37].
Sulfate Concentrations: Consuming drinking water containing sulfate concentrations exceeding 600 mg/L may lead to cathartic effects, dehydration, and diarrhea. Diarrhea is the second leading cause of death in children under 5 years old, and a laxative effect has also been reported [38].
Alkalinity: Water with low alkalinity is prone to chemical corrosion of pipes and fixtures, potentially increasing the metal content in the water. This can lead to economic and practical issues, such as damage to plumbing, invalidation of appliance warranties, water leaks, aesthetic problems, and health risks if levels of lead, copper, or other corrosion-related metals surpass primary drinking water standards. Conversely, high alkalinity in water may result in an elevated pH, issues with chemical precipitates and coatings, soap scum, a salty taste, and higher concentrations of certain metals [39].
Some believe that alkaline water can help prevent diseases such as cancer and heart disease [40].
Drinking alkaline water within the prescribed limits can improve bone health, soothe acid reflux, reduce high blood pressure, blood sugar, and cholesterol, enhance hydration, and promote longevity.
Based on the provided data for the different parameters measured in the Nangloi, Karol Bagh, and Okhla Industrial Area for three different monsoonal periods (pre-monsoon, monsoon, and post-monsoon), we have determined the variations in groundwater quality across seasons in the Delhi Region.
pH Levels: pH levels remain relatively stable throughout the year in Nangloi, with values ranging from a high of 8.21 to a low of 7.09. These values are well within the acceptable range for drinking water quality, indicating that pH does not exhibit significant seasonal variation. Similarly, in Karol Bagh, pH levels show little variation across seasons, ranging from a high of 7.81 to a low of 7.11, which are also within the acceptable range. The pH levels in the Okhla Industrial Area remain consistent across seasons, with values ranging from a high of 8.45 to a low of 7.54. Like the other two regions, in this region these values also fall within the acceptable range for drinking water.
The rest of the other parameters (e.g., nitrate, total hardness, chloride, fluoride, TDS, calcium, magnesium, sulfate, alkalinity): In the two regions (Nangloi and Karol Bagh), the values for these parameters, which are indicated in bold letters, go outside the limits of the BIS standard for drinking water IS 10500:2012 for all three monsoonal periods; however, in the Okhla Industrial Area, the parameters of magnesium, TDS, and chloride are within the limit and the rest of the other parameters are outside the limit. This suggests that these parameters, which are in bold letters, exhibit significant seasonal variations that would cause them to exceed the regulatory limits. Apart from the data regarding the pH of the three study areas and the mg, TDS, and cl of Okhla, which are within the limits, the other parameters in the three study areas demonstrate that groundwater quality in these regions are relatively unstable throughout the year, with values consistently not meeting the regulatory standards for drinking water quality.
Based on the data, it mostly seems that the groundwater quality in the Delhi Region, as assessed by the mentioned parameters, undergoes significant variations across different seasons. Therefore, Hypothesis 1 (Groundwater quality in the Delhi Region varies significantly across different seasons (pre-monsoon, monsoon, and post-monsoon)) is confirmed.
3.2. Results and Discussion Regarding Hypothesis 2
Individual data (Table 7) have been analyzed and interpreted. To achieve a better understanding and interpretation of our data, we have applied the CCME equation. We proceeded in accordance with CCME guidelines and calculated the water quality index for all twelve samples, taking into consideration all three data points along with the three seasons: pre-monsoon, monsoon, and post-monsoon. For samples 1, 2, and 10, there were no failed tests or variables. Therefore, we have considered their WQI to be 100, which is the maximum.
Table 7.
Calculated values of F1, F2, F3 and CCME WQI.
Table 8 shows the WQI levels for each location. After considering all observations in each location, three samples were found to be of excellent quality, one of good quality, four of fair quality, three of marginal quality, and one of poor quality. In the Karol Bagh area, two samples exhibited excellent quality, one displayed fair quality, and one fell into the marginal quality category. In Okhla Industrial Area, 3 samples fell into fair quality, and one displayed marginal quality. In Nangloi area, one fell into poor quality, one fell into marginal quality, one fell into good quality and one fell into excellent quality.
Table 8.
Water quality rating as per CCMEWQI [41].
Figure 12 illustrates the water quality index of all twelve samples collected from three locations across three different seasons. Dark green bars represent an excellent WQI, blue indicates good quality, yellow represents fair quality, white signifies marginal quality, and red represents poor water quality.

Figure 12.
CCME WQI for different location (author’s creation).
Karol Bagh, being a residential area, had some water samples, specifically A1 and A2, that demonstrated excellent quality. However, it is concerning that A3 displayed marginal quality and A4 showed fair quality. This finding is somewhat alarming and warrants immediate attention, especially in residential areas, where water is primarily used for drinking and cooking, potentially posing significant health risks.
Moving on to the Okhla industrial area, three samples, namely A5, A7, and A8, were determined to be of fair quality, while A6 fell into the marginal quality category. Given the presence of numerous industries in and around Okhla, including mills and various scales of industrial operations, it is reasonable to infer that these factors contribute to groundwater contamination and pollution.
The samples collected from the Nangloi district provide a telling picture that aligns with our analysis. Notably, the untreated water sample from the canal, A9, exhibited the lowest water quality index due to sewage discharge and industrial contamination. Conversely, A10, the treated sample from the treatment plant, rightfully displayed the highest water quality index. Meanwhile, A11 samples raised concerns with their marginal quality, and A12 showed good water quality but deserves further scrutiny.
Authorities should take proactive measures to address the potential risks of TDS, nitrate, and fluoride poisoning, which can have severe health implications.
It is important to acknowledge that there are 14 variables and 42 tests that can be considered responsible for the low water quality index observed in some cases.
The data presented in Table 7 and Table 8, along with the analysis of water quality using CCMEWQI, reveals variations in water quality across different locations within the Delhi Region. The CCMEWQI ratings indicate that some locations have excellent water quality (WQI values in the range of 95–100) while others fall into the good, fair, marginal, or poor categories.
Figure 13 shows the pin water sample location of the CCME WQI map of the 3 study area. The Nangloi district presents a significant contrast, with sample A9 from the canal displaying poor water quality due to sewage discharge and industrial contamination. On the other hand, A10, the treated sample from the treatment plant, has excellent water quality. However, A11 raises concerns in terms of marginal quality, and A12, while considered good, requires further scrutiny.

Figure 13.
CCME WQI Map of the Nangloi district, Okhla Industrial Area, and the Karol Bagh district of the Delhi Region (author’s creation).
In the Okhla Industrial Area, samples A5, A7, and A8 are rated as fair quality, while A6 falls into the marginal category. This aligns with the expectation that the industrial activities in the area contribute to groundwater contamination and lower water quality.
In the Karol Bagh residential area, samples A1 and A2 exhibit excellent water quality, but A3 and A4 show marginal and fair quality, respectively. This suggests that, even in residential areas, there can be variations in water quality due to household activities and the release of waste water directly or indirectly into the sewerage or nala, causing groundwater pollution and contamination, which may have implications for public health.
Overall, these findings support Hypothesis 2, indicating that water quality in the Delhi Region varies significantly across different locations, with factors like household activities, industrial activities, and sewage discharge playing a crucial role in groundwater quality variations. Therefore, Hypothesis 2 is confirmed.
4. Conclusions
The study conducted a comprehensive assessment of groundwater quality in the Delhi Region using the Canadian Council of Ministers of the Environment Water Quality Index (CCME WQI). The results demonstrated the utility of CCME WQI as a robust tool for evaluating water quality in diverse settings. The assessment covered three districts of Delhi throughout the year 2020, including the pre-monsoon, monsoon, and post-monsoon seasons.
The findings revealed variations in water quality across monitoring stations, with some locations exhibiting excellent water quality while others displayed fair to poor quality. These variations underscore the importance of effective water quality management and treatment to ensure safe and clean water for various purposes, including drinking, cooking, and industrial applications.
Key parameters, such as pH level, turbidity, dissolved oxygen, etc., are important and crucial in determining water quality ratings, highlighting their significance in water quality assessment. To enhance these parameters and overall groundwater quality, it is essential to address factors such as industrialization, anthropogenic–geogenic activities, and domestic practices that can impact water quality negatively.
The study emphasized the pivotal role of CCME WQI as the gold standard for assessing drinking water quality, widely embraced by state authorities, water resource managers, laboratories, scientists, and researchers. Its continued application and vigilant monitoring are essential components of collective efforts to preserve and enhance water quality for present and future generations.
Limitations of the Study and Practical Implications
The study acknowledges that, while it provides valuable insights into groundwater quality, it is based on data collected in the year 2020. Continuous monitoring and data collection over multiple years would offer a more comprehensive understanding of seasonal variations and long-term trends in water quality. The assessment primarily focused on physicochemical parameters and did not extensively cover microbiological parameters. Future studies could benefit from including a broader range of water quality indicators to ensure a more comprehensive evaluation. However, it is important to note that these are general observations based on the data provided for these specific parameters. Further technical and statistical analysis and a broader range of water quality parameters may be necessary for a more comprehensive assessment of seasonal variations in groundwater quality.
Practical implications of the research include the need for proactive measures to address variations in water quality, particularly in areas exhibiting fair to poor quality. Public health and safety should be a priority, necessitating robust water treatment processes. Additionally, the study highlights the importance of regulating household and industrial activities and promoting sustainable practices to protect groundwater resources and ensure access to clean and safe drinking water for the community.
Author Contributions
Conceptualization, Z.Z.A., A.V., D.K., J.D. and D.D.; methodology, Z.Z.A., A.V., D.K., J.D. and D.D.; formal analysis, Z.Z.A., A.V., D.K., J.D. and D.D.; data curation, Z.Z.A., A.V., D.K., J.D. and D.D.; writing—original draft preparation, Z.Z.A. and D.D. All authors have read and agreed to the published version of the manuscript.
Funding
This research was supported by Scientific Grant Agency Ministry of Education, Science, Research and Sport of the Slovak Republic and Slovak Academy of Sciences, grant no. VEGA 1/0431/21 “Research of light-technical parameters in production hall using digital ergonomics tools” and by Cultural and Educational Grant Agency Ministry of Education, Science, Research and Sport of the Slovak Republic, grant no. KEGA 014TUKE-4/2024 “Innovation of practical education of industrial ergonomics with demand to increase students’ adaptability in study program Industrial Management”.
Institutional Review Board Statement
Not applicable.
Informed Consent Statement
Not applicable.
Data Availability Statement
The original contributions presented in the study are included in the article material; further inquiries can be directed to the corresponding author. “The water samples has been collected by the Research Scholar Z.Z.A from the study area sampling sites and these raw data were submitted to the water testing laboratory, New Delhi for testing the parameters of each samples. As the reports were prepared, we received the hard copy and soft copy of all the water samples”. The data is safe and secure which will not harm the national and international reputation. The raw data supporting the conclusions of this article will be made available by the authors on request.
Acknowledgments
We would like to express our profound appreciation for the invaluable contributions of numerous individuals who played a pivotal role in making this research possible. First and foremost, we extend our heartfelt gratitude to Giri, Gaurav, Ajit Roy a key member of the laboratory, who provided invaluable guidance in completing the water sampling work. His enthusiasm, extensive knowledge, and meticulous attention to detail have been a constant source of inspiration, ensuring the successful progression of our work. We would also like to extend our sincere thanks to our fellow researcher friends, whose kind suggestions and assistance, both in terms of scientific materials for this paper and general support, significantly enriched the quality and depth of our research. Furthermore, we deeply appreciate the insightful comments offered by the anonymous peer reviewers selected by the journal. Their expertise and feedback have played a pivotal role in refining our work, and we are genuinely grateful for their contributions. The collective generosity and expertise of all these individuals have undeniably enhanced our current research and will continue to positively influence our future endeavors. It is important to note that any errors that may occur should be attributed solely to us, and they should not in any way detract from the esteemed reputations of the individuals mentioned above.
Conflicts of Interest
The authors declare no conflicts of interest.
References
- Khan, M.; Uddin, G. Evaluation of Groundwater Quality Using CCME WQI in the Rooppur Nuclear Power Plant Area, Ishwardi, Pabna, Bangladesh. Am. J. Environ. Prot. 2017, 5, 33–43. [Google Scholar] [CrossRef]
- Government of Newfoundland and Labrador. Drinking Water Quality Index. Available online: https://www.gov.nl.ca/ecc/waterres/drinkingwater/dwqi (accessed on 24 April 2022).
- Aydin, A. The Microbiological and Physico-Chemical Quality of Groundwater in West Thrace, Turkey. Pol. J. Environ. Stud. 2007, 16, 377–383. [Google Scholar]
- Michalik, A. The Use of Chemical and Cluster Analysis for Studying Spring Water Quality in Świętokrzyski National Park. Pol. J. Environ. Stud. 2008, 17, 357–362. [Google Scholar]
- Nass, S.; Bayram, A.; Nas, E.; Bulut, V.N. Effects of Some Water Quality Parameters on the Dissolved Oxygen Balance of Streams. Pol. J. Environ. Stud. 2008, 17, 531–538. [Google Scholar]
- Reza, R.; Singh, G. Assessment of Ground Water Quality Status by Using Water Quality Index Method in Orissa, India. World Appl. Sci. J. 2010, 9, 1392–1397. [Google Scholar]
- Sharma, D.; Kansal, A. Water quality analysis of River Yamuna using water quality index in the national capital territory, India (2000–2009). Appl. Water Sci. 2011, 1, 147–157. [Google Scholar] [CrossRef]
- Tyagi, S.; Sharma, B.; Singh, P.; Dobhal, R. Water Quality Assessment in Terms of Water Quality Index. Am. J. Water Resour. 2013, 1, 34–38. [Google Scholar] [CrossRef]
- Chapman, D. Water Quality Assessment: A Guide to Use of Biota, Sediments and Water in Environmental Monitoring-Second Edition; UNESCO: London, UK; WHO: London, UK; UNEP: London, UK, 1996. [Google Scholar]
- Hossein Banejad, H.; Olyaie, E. Application of an Artificial Neural Network Model to Rivers Water Quality Indexes Prediction—A Case Study. J. Am. Sci. 2011, 7, 60–65. [Google Scholar]
- Patel, P.S.; Pandya, D.M.; Shah, M. A systematic and comparative study of Water Quality Index (WQI) for groundwater quality analysis and assessment. Environ. Sci. Pollut. Res. 2023, 30, 54303–54323. [Google Scholar] [CrossRef]
- Sutadian, A.D.; Muttil, N.; Yilmaz, A.G.; Perera, B.J.C. Development of river water quality indices—A review. Environ. Monit. Assess. 2016, 188, 2–29. [Google Scholar] [CrossRef]
- Ongley, E. Modernization of water quality programs in developing countries: Issues of relevancy and cost efficiency. Water Qual. Int. 1998, 3, 37–42. [Google Scholar]
- Choi, B.; Choi, S.S. Integrated hydraulic modelling, water quality modelling and habitat assessment for sustainable water management: A case study of the Anyang-Cheon stream, Korea. Sustainability 2021, 13, 4330. [Google Scholar] [CrossRef]
- Haider, H.; AlHetari, M.; Ghumman, A.R.; Al-Salamah, I.S.; Thabit, H.; Shafiquzzaman, M. Continuous performance improvement framework for sustainable wastewater treatment facilities in arid regions: Case of Wadi Rumah in Qassim, Saudi Arabia. Int. J. Environ. Res. Public Health 2021, 18, 6857. [Google Scholar] [CrossRef]
- Alexakis, D.E. Applying factor analysis and the CCME water quality index for assessing groundwater quality of an Aegean Island (Rhodes, Greece). Geosciences 2022, 12, 384. [Google Scholar] [CrossRef]
- Ongley, E.D.; Booty, W.G. Pollution remediation planning in developing countries: Conventional modeling versus knowledge-based prediction. Water Int. 1999, 24, 31–38. [Google Scholar] [CrossRef]
- Wagh, V.M.; Mulay, A.A. Groundwater Suitability Evaluation by CCME WQI Model for Kadava River Basin, Nashik, Maharashtra, India. Model. Earth Syst. Environ. 2017, 3, 557–565. [Google Scholar] [CrossRef]
- Giriyappanavar, B.S.; Patil, R.R. Application of CCME WQI in Assessisng Water Quality for Fort Lake of Belgaum, Karnataka. Indian J. Appl. Rese 2013, 3, 32–33. [Google Scholar] [CrossRef] [PubMed]
- Rabeiy, R.E. Assessment and modeling of groundwater quality using WQI and GIS in Upper Egypt area. Environ. Sci. Pollut. Res. 2018, 25, 30808–30817. [Google Scholar] [CrossRef] [PubMed]
- Şener, Ş.; Varol, S.; Şener, E. Evaluation of sustainable groundwater utilization using index methods (WQI and IWQI), multivariate analysis, and GIS: The case of Akşehir District (Konya/Turkey). Environ. Sci. Pollut. Res. 2021, 28, 47991–48010. [Google Scholar] [CrossRef] [PubMed]
- Şimşek, A.; Mutlu, E. Assessment of the water quality of Bartın Kışla (Kozcağız) Dam by using geographical information system (GIS) and water quality indices (WQI). Environ. Sci. Pollut. Res. 2023, 30, 58796–58812. [Google Scholar] [CrossRef]
- Haider, H.; Alharbi, F. Spatiotemporal water quality variations in smaller water supply systems: Using modified CCME WQI from groundwater source to distribution networks. Water 2019, 11, 1884. [Google Scholar] [CrossRef]
- Joe, D.C.; Kwon, G.H. Water quality assessment of the Nam River, Korea, using multivariate statistical analysis and WQI. Int. J. Environ. Sci. Technol. 2023, 20, 2487–2502. [Google Scholar] [CrossRef]
- Rupakumari, G.; Rao, G.V.R.; Kalyanaramu, B. CCME-WQI and TM-WQI based assessment for groundwater quality in Garividi region of Vizianagaram District, Andhra Pradesh, India. Res. J. Sci. Technol. 2022, 14, 1–12. [Google Scholar] [CrossRef]
- Hu, L.; Chen, L.; Li, Q.; Zou, K.; Li, J.; Ye, H. Water quality analysis using the CCME-WQI method with time series analysis in a water supply reservoir. Water Sci. Technol. Water Supply 2022, 22, 6281–6295. [Google Scholar] [CrossRef]
- Mind the Graph. What Is Methodology in Research? Available online: https://mindthegraph.com/blog/what-is-methodology-in-research/ (accessed on 24 May 2023).
- Canadian Council of Ministers of the Environment. Water Quality Index User Manual. Available online: https://ccme.ca/en/res/wqimanualen.pdf (accessed on 6 July 2024).
- UCLA Health. Ask the Doctors—Is Water with a High pH Safe to Drink? Available online: https://www.uclahealth.org/news/ask-the-doctors-is-water-with-a-high-ph-safe-to-drink (accessed on 31 August 2018).
- Jones, R.R.; Ward, H.M. Drinking Water Nitrate and Human Health: An Updated Review. Int. J. Environ. Res. Public Health 2018, 15, 1557. [Google Scholar] [CrossRef] [PubMed]
- Sengupta, P. Potential health impacts of hard water. Int. J. Prev. Med. 2013, 4, 866–875. [Google Scholar]
- McGill University Office for Science and Society (n.d.). Is Hard Water Dangerous to Drink? Available online: https://www.mcgill.ca/oss/article/health-you-asked/you-asked-hard-water-dangerous-drink (accessed on 11 January 2019).
- WHO. Chloride. 2003. Available online: https://www.who.int/teams/environment-climate-change-and-health/water-sanitation-and-health/chemical-hazards-in-drinking-water/chloride (accessed on 6 July 2024).
- Solanko, Y.S.; Agarwal, M.; Gupta, A.B.; Shukla, P. Fluoride Occurrences, health problems, detection, and remediation methods for drinking water: A comprehensive view. Sci. Total Environ. 2022, 807, 150601. [Google Scholar] [CrossRef] [PubMed]
- Best RO Water Purifier. What Is TDS Level in Water? 2023. Available online: https://www.bestrowaterpurifier.in/blog/what-is-tds-level-in-water/ (accessed on 29 January 2024).
- Netmeds. How Salts in Drinking Water Can Affect Health. 2018. Available online: https://www.netmeds.com/health-library/post/how-salts-in-drinking-water-can-affect-health (accessed on 9 October 2018).
- Escobedo-Monge, M.F.; Barrado, E.; Parodi-Román, J.; Escobedo-Monge, M.A.; Torres-Hinojal, M.C.; Marugán-Miguelsanz, J.M. Magnesium status and Ca/Mg ratios in a series of children and adolescents with chronic diseases. Nutrients 2022, 14, 2941. [Google Scholar] [CrossRef]
- WHO. Sulfate. 2004. Available online: https://www.who.int/teams/environment-climate-change-and-health/water-sanitation-and-health/chemical-hazards-in-drinking-water/sulfate (accessed on 6 July 2024).
- Know Your H2O. Chloride. 2023. Available online: https://www.knowyourh2o.com/indoor-6/chloride (accessed on 6 July 2024).
- Mayo Clinic. Alkaline Water: Beneficial or All Hype? 2022. Available online: https://www.mayoclinic.org/healthy-lifestyle/nutrition-and-healthy-eating/expert-answers/alkaline-water/faq-20058029 (accessed on 6 July 2024).
- Khan, H.; Khan, A.A.; Hall, S. The Canadian Water Quality Index: A Tool for Water Resources Management. In Proceedings of the MTERM International Conference, AIT, Pathum Thani, Thailand, 6–10 June 2005. [Google Scholar]


Disclaimer/Publisher’s Note: The statements, opinions and data contained in all publications are solely those of the individual author(s) and contributor(s) and not of MDPI and/or the editor(s). MDPI and/or the editor(s) disclaim responsibility for any injury to people or property resulting from any ideas, methods, instructions or products referred to in the content. |
© 2024 by the authors. Licensee MDPI, Basel, Switzerland. This article is an open access article distributed under the terms and conditions of the Creative Commons Attribution (CC BY) license (https://creativecommons.org/licenses/by/4.0/).