Review

PPG and Bioimpedance-Based Wearable Applications in Heart Rate Monitoring—A Comprehensive Review

by
Didzis Lapsa
1,*,†,
Rims Janeliukstis
1,†,
Margus Metshein
2,* and
Leo Selavo
1
1
Institute of Electronics and Computer Science, Dzerbenes Street 14, LV-1006 Riga, Latvia
2
Thomas Johann Seebeck Department of Electronics, Tallinn University of Technology, Ehitajate Tee 5, 19086 Tallinn, Estonia
*
Authors to whom correspondence should be addressed.
These authors contributed equally to this work.
Appl. Sci. 2024, 14(17), 7451; https://doi.org/10.3390/app14177451 (registering DOI)
Submission received: 11 July 2024 / Revised: 20 August 2024 / Accepted: 21 August 2024 / Published: 23 August 2024

Abstract

:
The monitoring of hemodynamic parameters, such as heart rate and blood pressure, provides valuable indications of overall cardiovascular health. It is preferable that such monitoring is non-invasive and in real time via an affordable, compact and small-scale device for maximum convenience. Numerous literature sources have exploited derivations of these parameters from photoplethysmogram (PPG) and electrical bioimpedance (EBI) signal measurements through the use of calculation algorithms of varying complexity. Compared to electrocardiogram (ECG), these measurement techniques have a merit of well-established practices of designing a wearable device that could conveniently be put on a wrist. The current paper provides a comprehensive review on the use of PPG and EBI measurement techniques in the context of hemodynamic parameter monitoring using a wearable device. A special emphasis is placed on the most basic hemodynamic parameter—heart rate—describing different algorithms of heart rate detection and monitoring. The last section provides an overview of commercially available and in-home wearable device technologies based on PPG and EBI measurements, their design challenges, and future prospects.

1. Introduction

Cardiovascular diseases (CVDs) are the primary cause of death worldwide, claiming approximately 17.9 million lives annually. The World Health Organization (WHO) estimated that approximately 18 million people worldwide died from cardiovascular diseases (CVD) in 2019 [1,2]. Wrist-worn wearable devices offer continuous, non-invasive monitoring, capturing vital health data that can signal the onset of conditions like hypertension, atrial fibrillation, and heart failure. The integration of a wearable device technology into everyday life offers a significant advancement of monitoring and management of cardiovascular health [3]. Wearable devices track a particular parameter which is directly associated with a cardiovascular condition as shown in Table 1. The critical cardiovascular parameters are heart rate variability, blood pressure and arterial stiffness. For example, monitoring of blood pressure and arterial stiffness can detect hypertension—a major risk factor for a heart attack and stroke—in a timely manner.
Multiple long-term studies have shown that a higher resting heart rate (HR) is linked to cardiovascular diseases [5]. Supplementary information on symptoms, such as stress, physical activity, eating, sleeping, etc., traditionally has been verbally obtained from patients. This additional information is crucial in medical decision making. However, the information obtained in such a way may be subjective and misleading especially in case of patients with memory or communication difficulties. On the other hand, data measured with a wearable device can provide objective information continuously in real time [6]. The integration of computing algorithms and communication functionalities within the wearable device allows patients to share important computed bioparameters, such as HR, blood pressure, glucose levels, and others with their doctor in an Internet of Things (IoT) framework [7] to aid the medical diagnosis [6]. Wireless connectivity such as WiFi permits the constant upload of data to cloud storage, enabling continuous and simultaneous monitoring of multiple parameters [6] (see Figure 1). A challenge for implementing wearable technology for applications in intelligent IoT devices for monitoring health conditions is the need for a reliable energy source that can ensure long-term operation [8].
Traditionally, the most popular non-invasive methods used to monitor HR have been electrocardiograms (ECGs) through electric signals and photoplethysmography (PPG) through optical measurements [9]. However, wearable ECG monitoring systems are difficult to design, despite offering means to detect irregularities in the cardiograms and being an overall gold-standard technique for cardiovascular diagnostics [9]. Compared to chest-strap electrodes that have traditionally been used in HR monitoring, PPG-based measurements from wrist-worn devices provide continuous monitoring with greater convenience. Moreover, the latest devices report HR detection error within five percent bounds compared to telemetry [10]. Another technique with a great potential for monitoring of cardiovascular bioparameters is bioimpedance. Even though it is still not completely established in clinical practice, its versatility, simplicity and low cost facilitate its integration into wearable systems for remote monitoring of physiological parameters [11], including HR.
This paper aims to bring about a comprehensive review on existing studies of PPG and bioimpedance-based vital bioparameter monitoring using wearable devices, both commercial and designed by different research groups. The following chapter discusses biological signals for a wearable-based HR devices. In the next chapter, a special emphasis is put on HR detection in the presence of noise and motion artifacts. State-of-the-art algorithms and methodologies of accurate HR detection and related signal processing are described. A chapter is devoted to wearable devices for HR monitoring, including a critical evaluation of the feasibility of integrating the existing HR detection methods into wearable devices that conform to such requirements as comfort of use, power consumption and reliability. The review is concluded with a summary of key findings and future directions.
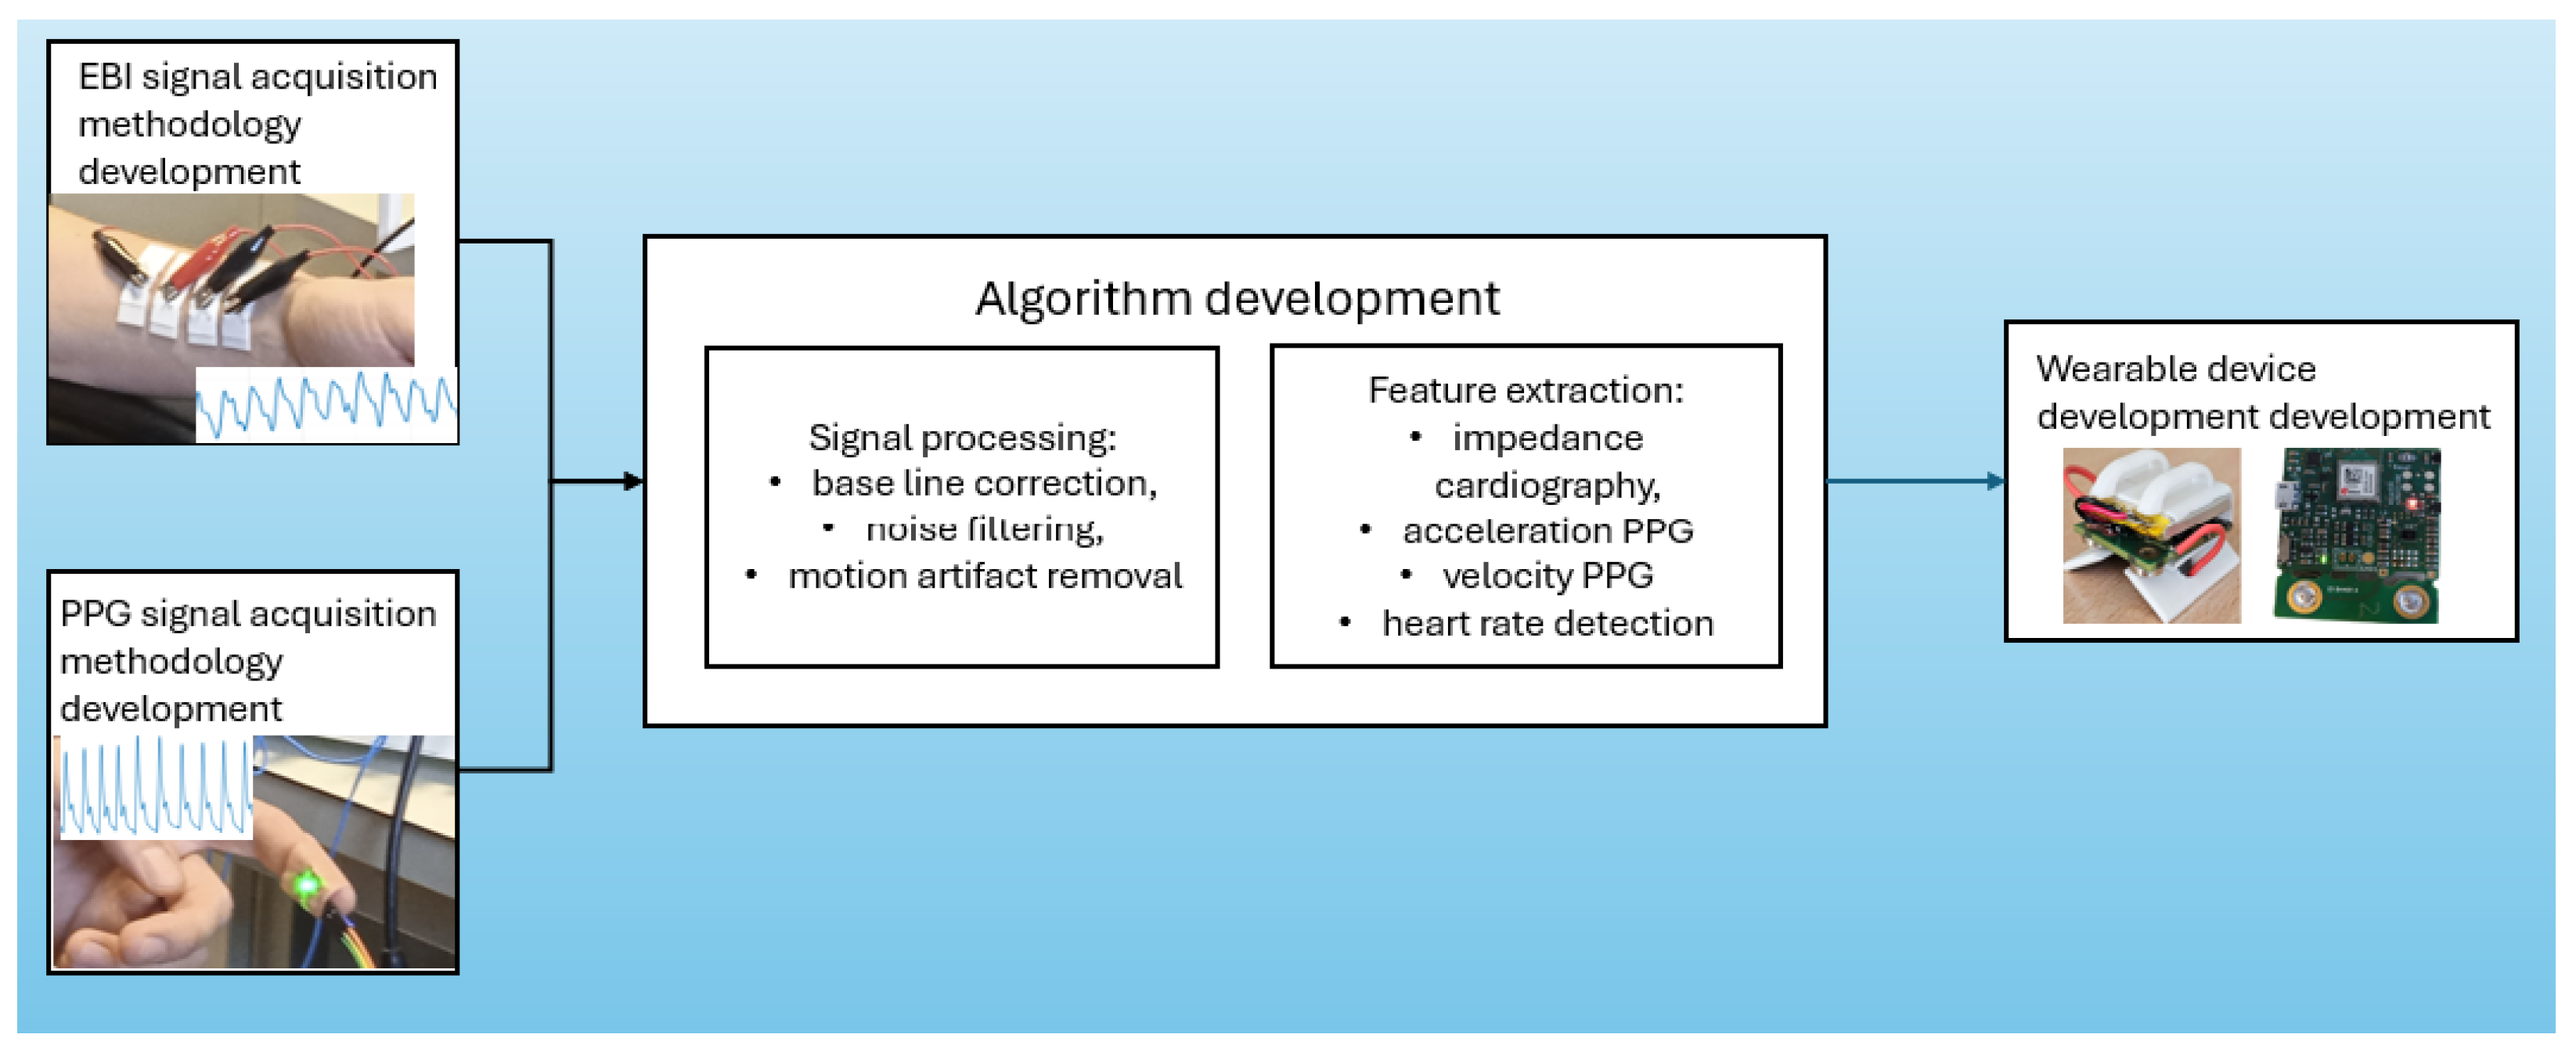
Figure 2 outlines the progression from initial signal acquisition methodology to algorithm refinement to final device implementation, conceptualizing a brief representation of the integral processes underlying this process through this paper. This illustration serves as a guide to understanding the interrelated activities that ensure the accuracy and efficiency of wearable health monitors.

2. Methodology

2.1. Paper Selection Criteria

The papers used in composing the current review article were selected in a systematic approach by searching based on the keywords:

2.2. PPG, Bioimpedance, Heart Rate, Wearable Device

The search was conducted in the following databases: sciencedirect.com, Google Scholar and Scopus. The paper inclusion criteria were as follows:
  • Type of signals: papers providing a detailed overview on bioimpedance and PPG measurement as well as features extractable form PPG and bioimpedance signals.
  • Signal processing: papers listing relevant signal pre-processing techniques, such as filtering and overall data cleaning were included.
  • Algorithms: papers describing heart rate detection and motion artifact removal algorithms.
  • Devices: wearable device technologies based on PPG and bioimpedance. Papers dealing with stationary bioimpedance analyzers were excluded from the selection of candidate papers.
The paper exclusion criteria were as follows:
  • Devices: papers focusing on bioimpedance measurement with stationary analyzers which, by nature, are not wearable devices. Also, papers describing PPG measurement through a finger clip and not an actual wearable device were not included.
  • Monitored parameter: papers with an emphasis on monitoring bioparameters other than the ones associated with heart rate were dismissed.
  • Experiments on animals: papers dealing with various experiments on animals were not included.

3. Results

The systematic review conducted for this study identified a total of 478 unique articles from various databases, including ScienceDirect, Google Scholar, and Scopus. These articles were thoroughly screened based on predefined inclusion and exclusion criteria outlined in the Section 2. The search and selection process spanned from 21 March 2024, to 4 June 2024.

3.1. Article Selection Process

Out of the 478 articles initially identified, 325 were excluded after a preliminary review because they did not meet the inclusion criteria, such as relevance to bioimpedance or PPG-based heart rate monitoring in wearable devices. Specifically, articles focusing on stationary devices, parameters unrelated to heart rate, or experiments conducted on animals were dismissed. This exclusion process left 153 articles that were deemed relevant for a more detailed analysis.

3.2. Analyzed Articles

The 153 selected articles were further reviewed to extract pertinent data related to the objectives of this study. Of these, 95 articles provided comprehensive insights into the use of photoplethysmography (PPG) and electrical bioimpedance (EBI) in wearable heart rate monitoring devices. These articles were published between 2010 and 2024, reflecting the most recent advancements and historical context of the technologies discussed.

3.3. Temporal Scope and Distribution

The majority of the reviewed articles (approximately 70 % ) were published within the last decade, with a noticeable increase in research activity between 2015 and 2024. This trend underscores the growing interest and rapid development in the field of wearable health monitoring technologies, particularly those utilizing PPG and EBI methods.
Finally, the synthesis of these articles has provided a comprehensive overview of the current state of wearable heart rate monitoring technologies, highlighting both the successes and the areas in need of further innovation. The next sections will delve deeper into the biological signals used in these devices, followed by an exploration of the algorithms and methodologies that address the identified challenges.

4. Biological Signals for Wearable-Based HR

4.1. Electrical Bioimpedance (EBI)

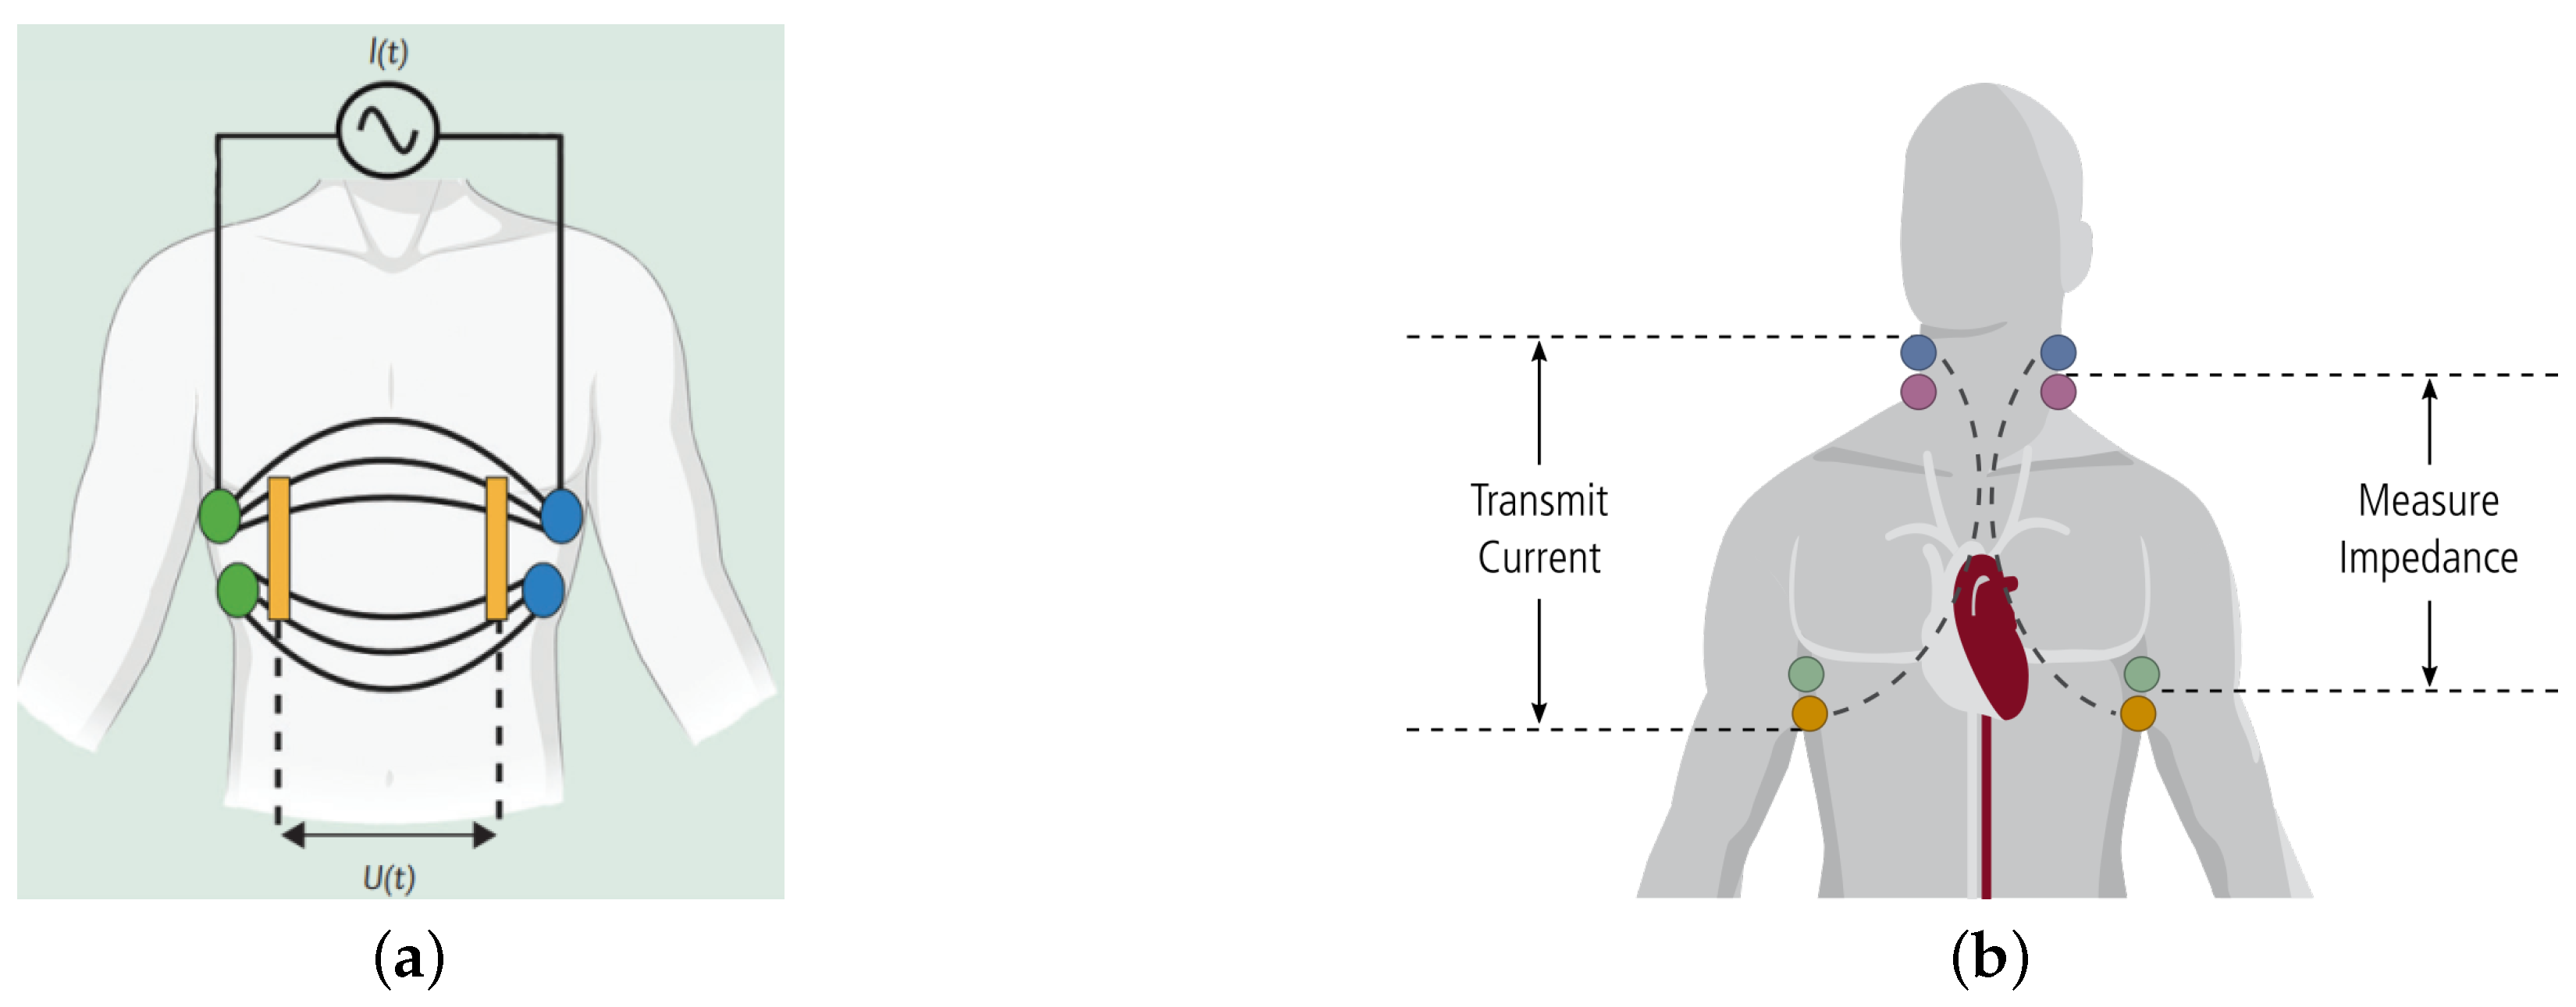
In relation to medical care, electrical bioimpedance (EBI) has been used to study small changes in the transthoracic impedance related to respiration or heartbeat non-invasively. EBI measurements can be conducted in two electrode configurations: bipolar and tetrapolar [12]. In the tetrapolar electrode configuration, the changes in transthoracic impedance are measured by injecting a fixed-amplitude sinusoidal alternate current I cos ( ω t ) inside the thorax via an electrode pair and calculating the electrical impedance by measuring the potential drop across the body or tissue segment by another pair [13,14]:
U ( t ) = M Z ( t ) · cos ( ω t + φ Z ( t ) )
where M Z (t) and φ Z (t) are the module and phase of the bioimpedance. In other words, the electrodes that measure voltage are separated from those sourcing the current. In a bipolar configuration, however, there are only two electrodes—simultaneously both for measuring and excitation current to the tissue. A tetrapolar electrode configuration reduces the effect of skin–electrode contact impedance [15]. This measurement principle is shown in Figure 3a, electrodes on both sides of the chest (green and blue) pass a constant current across the chest, I ( t ) , with an impedance detection circuit (yellow) measuring the voltage drop U ( t ) caused by intrathoracic blood volume. The total impedance of the thorax at rest consists of electrical resistances of the components of the thorax—adipose tissue, heart and skeletal muscles, lungs, vessels, bone and air [16]. The principle of impedance cardiography is shown in Figure 3b. The colored circles show the position of the electrodes on the body.
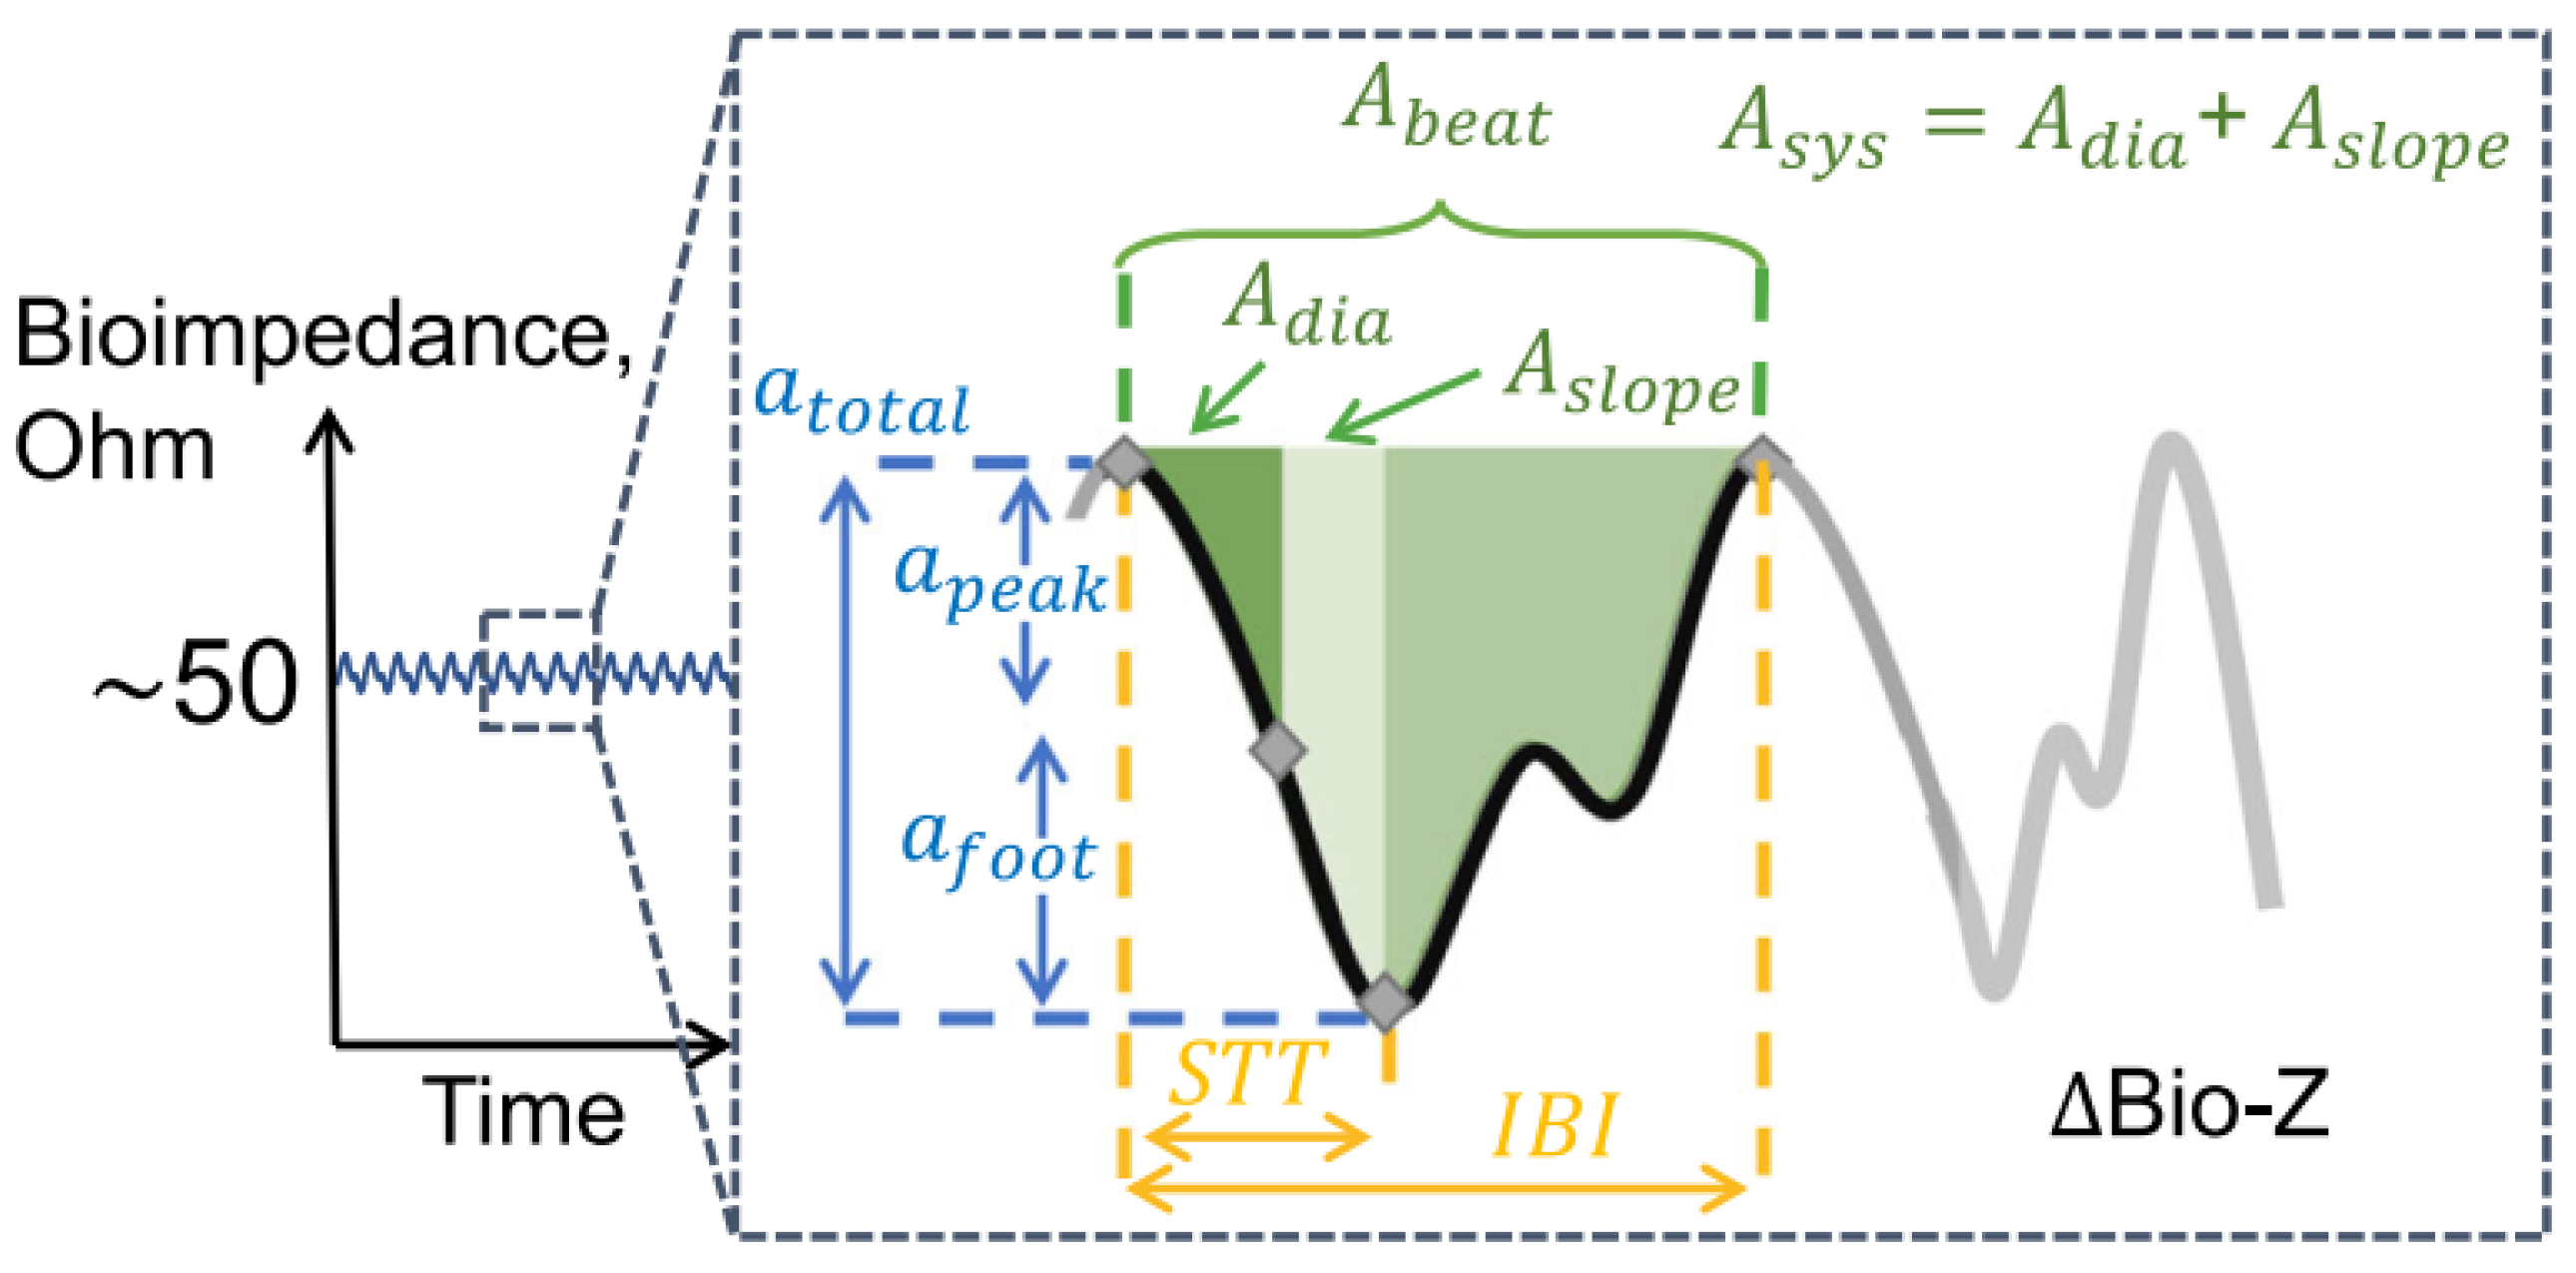
Bioimpedance signal is a quasi-periodic signal with four phases during a cardiac cycle (see Figure 4) [18]:
  • Systolic phase—the left ventricle of the heart beats to push blood through the arteries and blood volume increases. Initial decrease in impedance.
  • Diastolic phase—the heart rests between beats and blood volume leaves the sensing area. Impedance increases.
  • The second, smaller impedance decrease due the arrival of the reflection wave.
  • The final impedance increase as the reflected blood volume leaves the sensing area.
Hence, the change in impedance is inversely proportional to the change in blood volume [19]. EBI has been used in the following medical applications—electrical impedance tomography [20], body composition analysis [21], cardiac output monitoring [22], respiration activity monitoring [23], diagnosis of heart failure, myocardial infarction and ischemia [24], impedance plethysmography for continuous assessment of volume changes in the lungs [25,26], heart [27,28], veins and peripheral arteries [29,30] and blood pressure by measuring the pulse from two separate locations on the wrist [31].

EBI Waveform Features for Cardiovascular Monitoring

Figure 4 also shows several features that can be extracted and potentially used in the monitoring of various hemodynamic parameters, such as heart rate and blood pressure [18]. These features are grouped in three categories:
  • Amplitude features
  • The peak amplitude
    a p e a k = a d i a a s l o p e
  • The foot amplitude
    a f o o t = a s l o p e a s y s
  • The total EBI amplitude
    a t o t a l = a p e a k + a f o o t = a d i a a s y s
    where a d i a and a s y s are the amplitudes of a diastolic and systolic points, respectively, and a s l o p e is the amplitude of a point on the waveform corresponding to a maximum slope (further on referred to as a maximum slope point) between the diastolic and systolic peaks.
  • Area features
Area features correspond to the area under the bioimpedance curve in between two characteristic points. These features have shown to have a high correlation with total peripheral resistance, which is key to estimating blood pressure [18].
  • The area between the diastolic point and the maximum slope point
    A d i a = t d i a t s l o p e a · d t
  • The area between the maximum slope point and the systolic point
    A s l o p e = t s y s t s l o p e a · d t
  • The area between the diastolic and the systolic point
    A s y s = A d i a + A s l o p e
  • Time features
Time features provide a proxy to the pulse wave velocity as well as the duration of the systolic and diastolic phases of each cardiac cycle [18].
  • Slope transit time is the time difference between the systolic and diastolic points
    S T T = t s y s t d i a
  • Inter-beat interval is the time difference between two consecutive diastolic points
    I B I ( i ) = t d i a ( i + 1 ) t d i a ( i )
    where i denotes the i-th diastolic point.
  • EBI Signal derivatives
Finding of the time derivative of EBI signal (dZ/dt) is known as the impedance cardiography (ICG) method, enabling the determination of hemodynamic fiducial points [32]. The most important of these points are B, C and X (but also others—see Figure 5), denoting the opening of the aortic valve (B), maximum systolic flow (C) and closing of the aortic valve (X), respectively (including significant cardiac time intervals like left ventricular ejection time (LVET)).
ICG is known also as electrical velocimetry because it indicates the amplitude change velocity in the time domain. Other derivatives have not been used in clinical practice.

4.2. Photoplethysmography

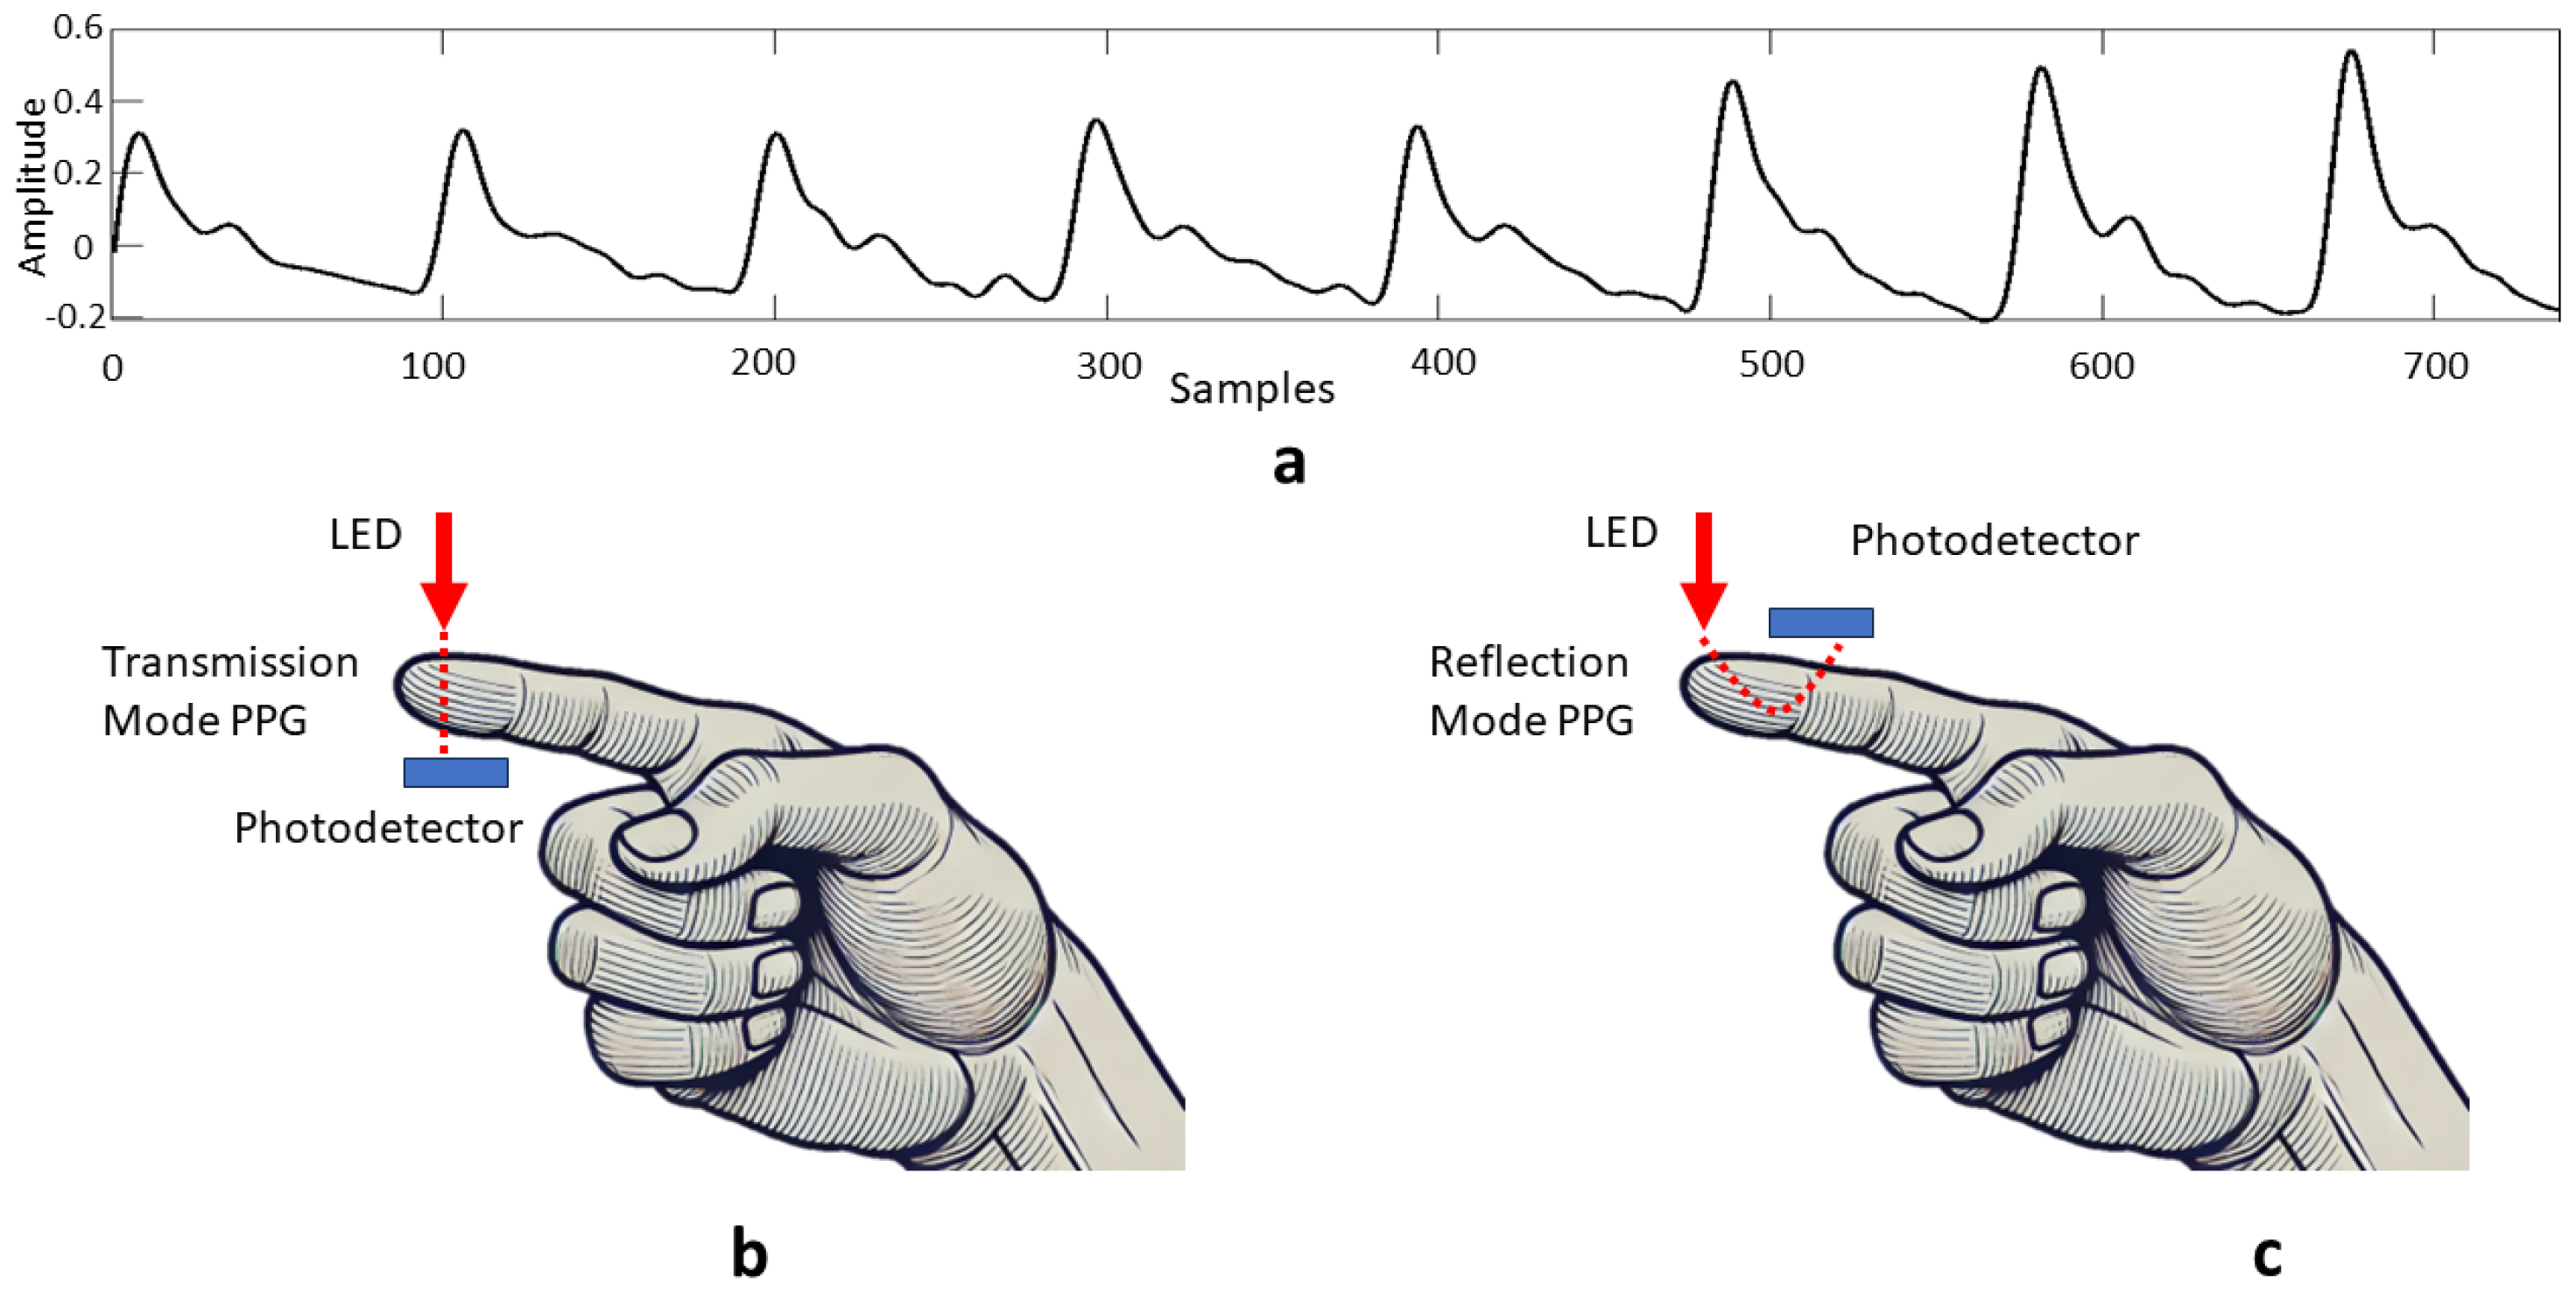
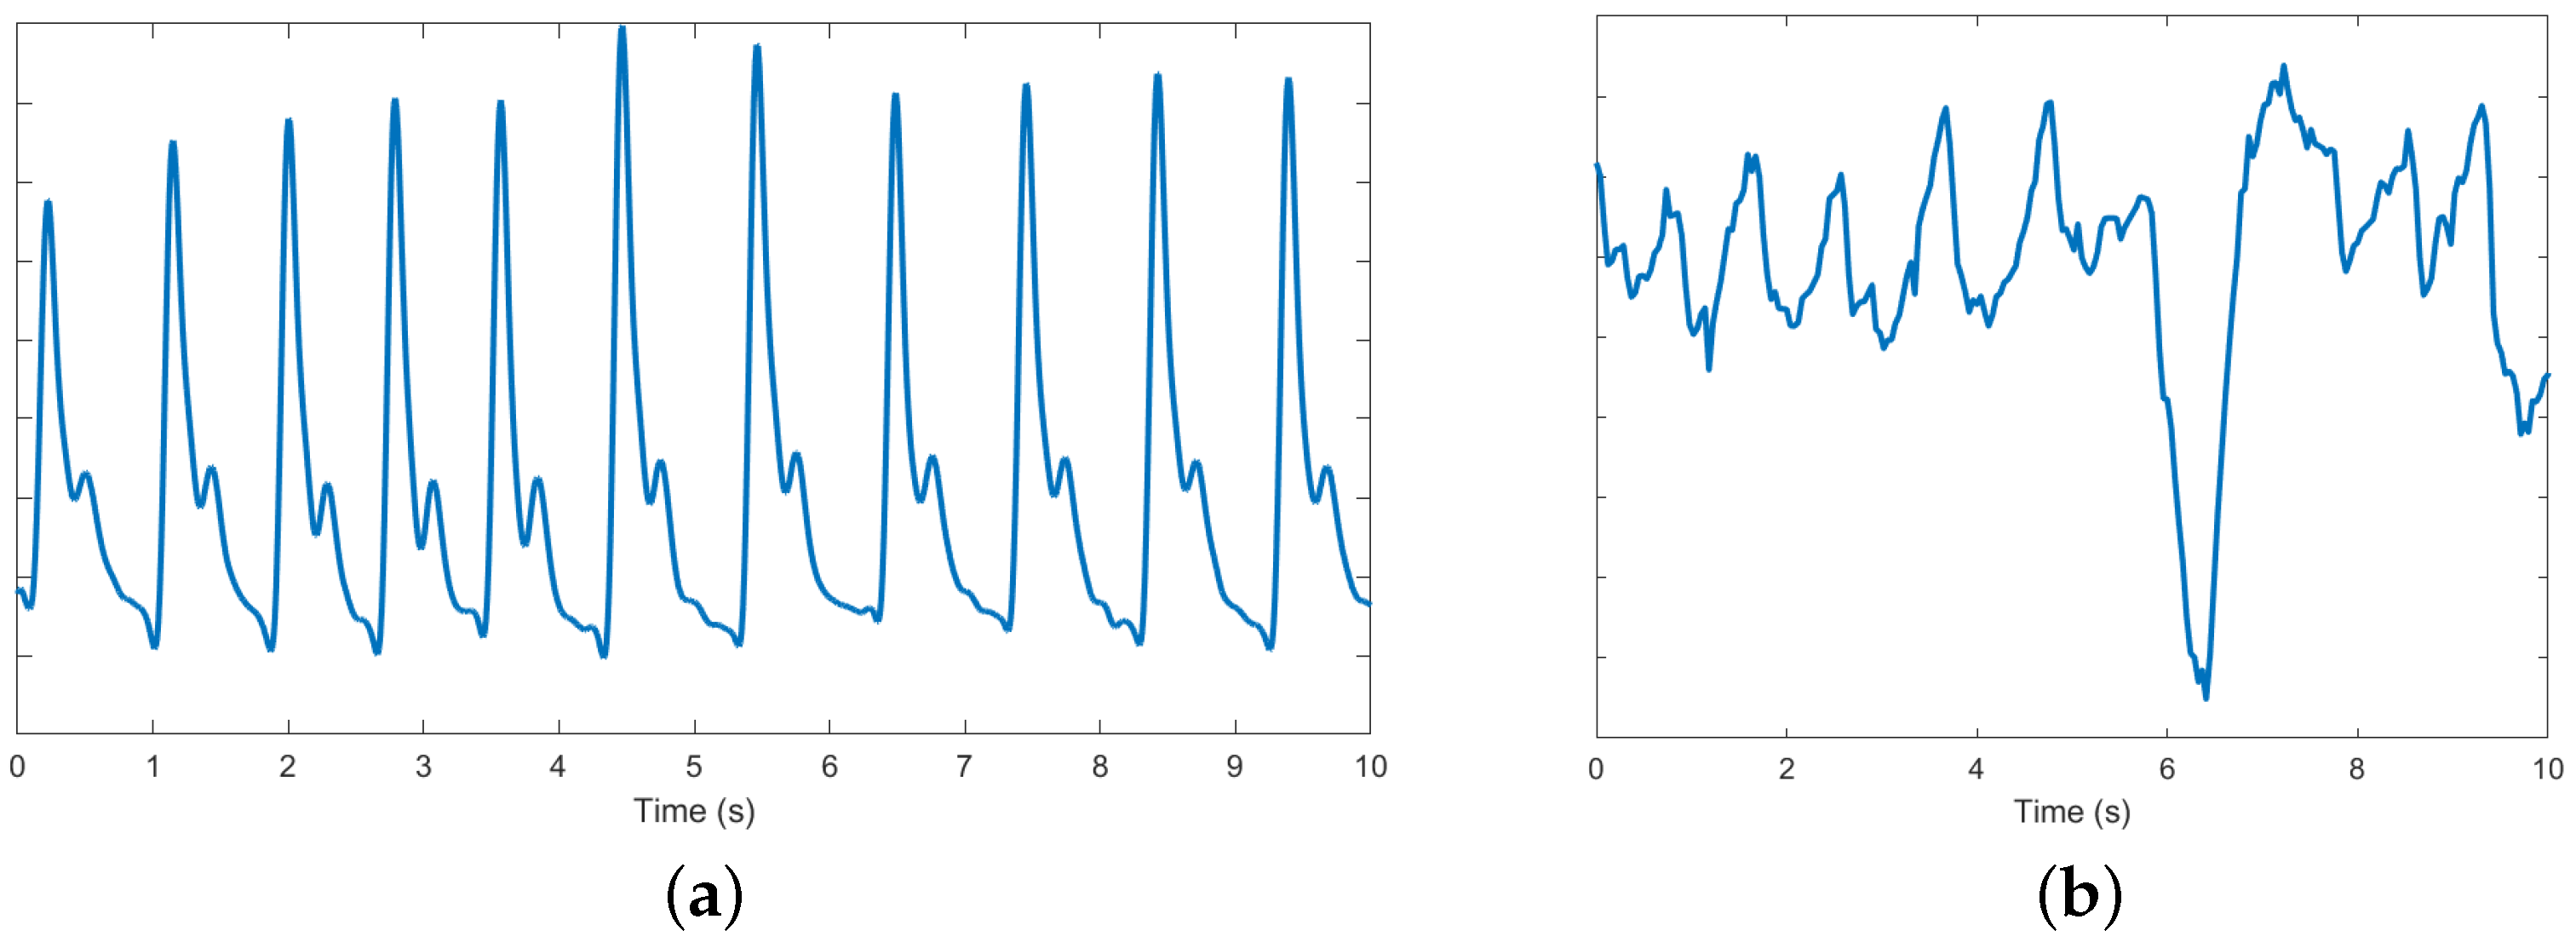
In most applications, photoplethysmography (PPG) is used in pulse oximetry to assess the oxygenation proportions of hemoglobin in order to derive oxygen saturation (SpO2) [34]. A PPG signal is non-stationary and quasi-periodic [9]. A typical PPG waveform is shown in Figure 6a. There are two components of a PPG signal [35]—the pulsatile AC component, synchronous with the blood flow during a heartbeat, and a slowly varying DC component which is associated with respiration and thermoregulation. It is often assumed that the major frequency component of PPG is based on average pulse rate around 1 Hz, and harmonic frequencies are added up to construct a PPG waveform. The low-frequency component (<0.5 Hz) generally reflects the respiration (0.15–0.4 Hz) and motion artifacts (<0.1 Hz) [36]. Here, as is also the case in EBI signals, each single cycle exhibits slight waveform differences due to the potential influence of external factors [37].
In PPG measurements, skin is illuminated with a light-emitting diode (LED) with either green, red, or infra-red (IR) light and a photodetector is used to detect changes in light intensity caused by a heartbeat. These changes are then converted to a voltage signal, called a PPG signal [35]. Since IR light is absorbed by the blood in vein vessels depending on levels of vasodilation, vasoconstriction, and oxygenation, both variations in blood volume pulse (BVP) due to the cardiac cycle [38], and oxygen saturation (SpO2) [39], can be measured by wearable devices exploiting the PPG measurement technology. Photodiodes can be positioned either in transmission or reflection PPG measurement modes (see Figure 6b,c). In transmission mode, the LED and photodetector are placed opposite to each other. The photodiode detects light passing through the respective body part. In reflection mode, both the photodetector and the LED are placed on the same side of the respective body part. The photodetector detects backscattered or reflected light from tissue and blood vessels. The transmission mode is limited to recording the PPG signal at body sites which are thin, such as fingers and earlobes [40,41]. In contrast, in the reflection mode, the PPG signal can be recorded at any body part [41,42,43]. Hence, a wrist-worn PPG sensor is usually a reflective type [44], which transmits light on a wrist and identifies the arterial blood volume change by the amount of reflected light during the systolic and diastolic phases of the cardiac cycle.
Apart from respiratory rate and monitoring of chronic respiratory conditions [45], analysis of the morphology of pulse waves measured with PPG sensors has been used to obtain parameters related to cardiovascular activity [46]; for example, HR in real time [47,48], heart rate variability (HRV), and blood pressure [49]. The quantities derived from PPG signals include the number of calories burned during physical exercise and the metabolic equivalent of task (MET) [50].

PPG Waveform Features

Features derived from PPG waveforms can effectively be used to provide a more complete cardiovascular profile of the patient than bioparameters alone. This approach has gained popularity in employing various machine learning algorithms to do the task. For example, patient classification based on various degrees of coronary artery obstruction in [37], and blood pressure estimation in [51].
  • Characteristic PPG waveform points
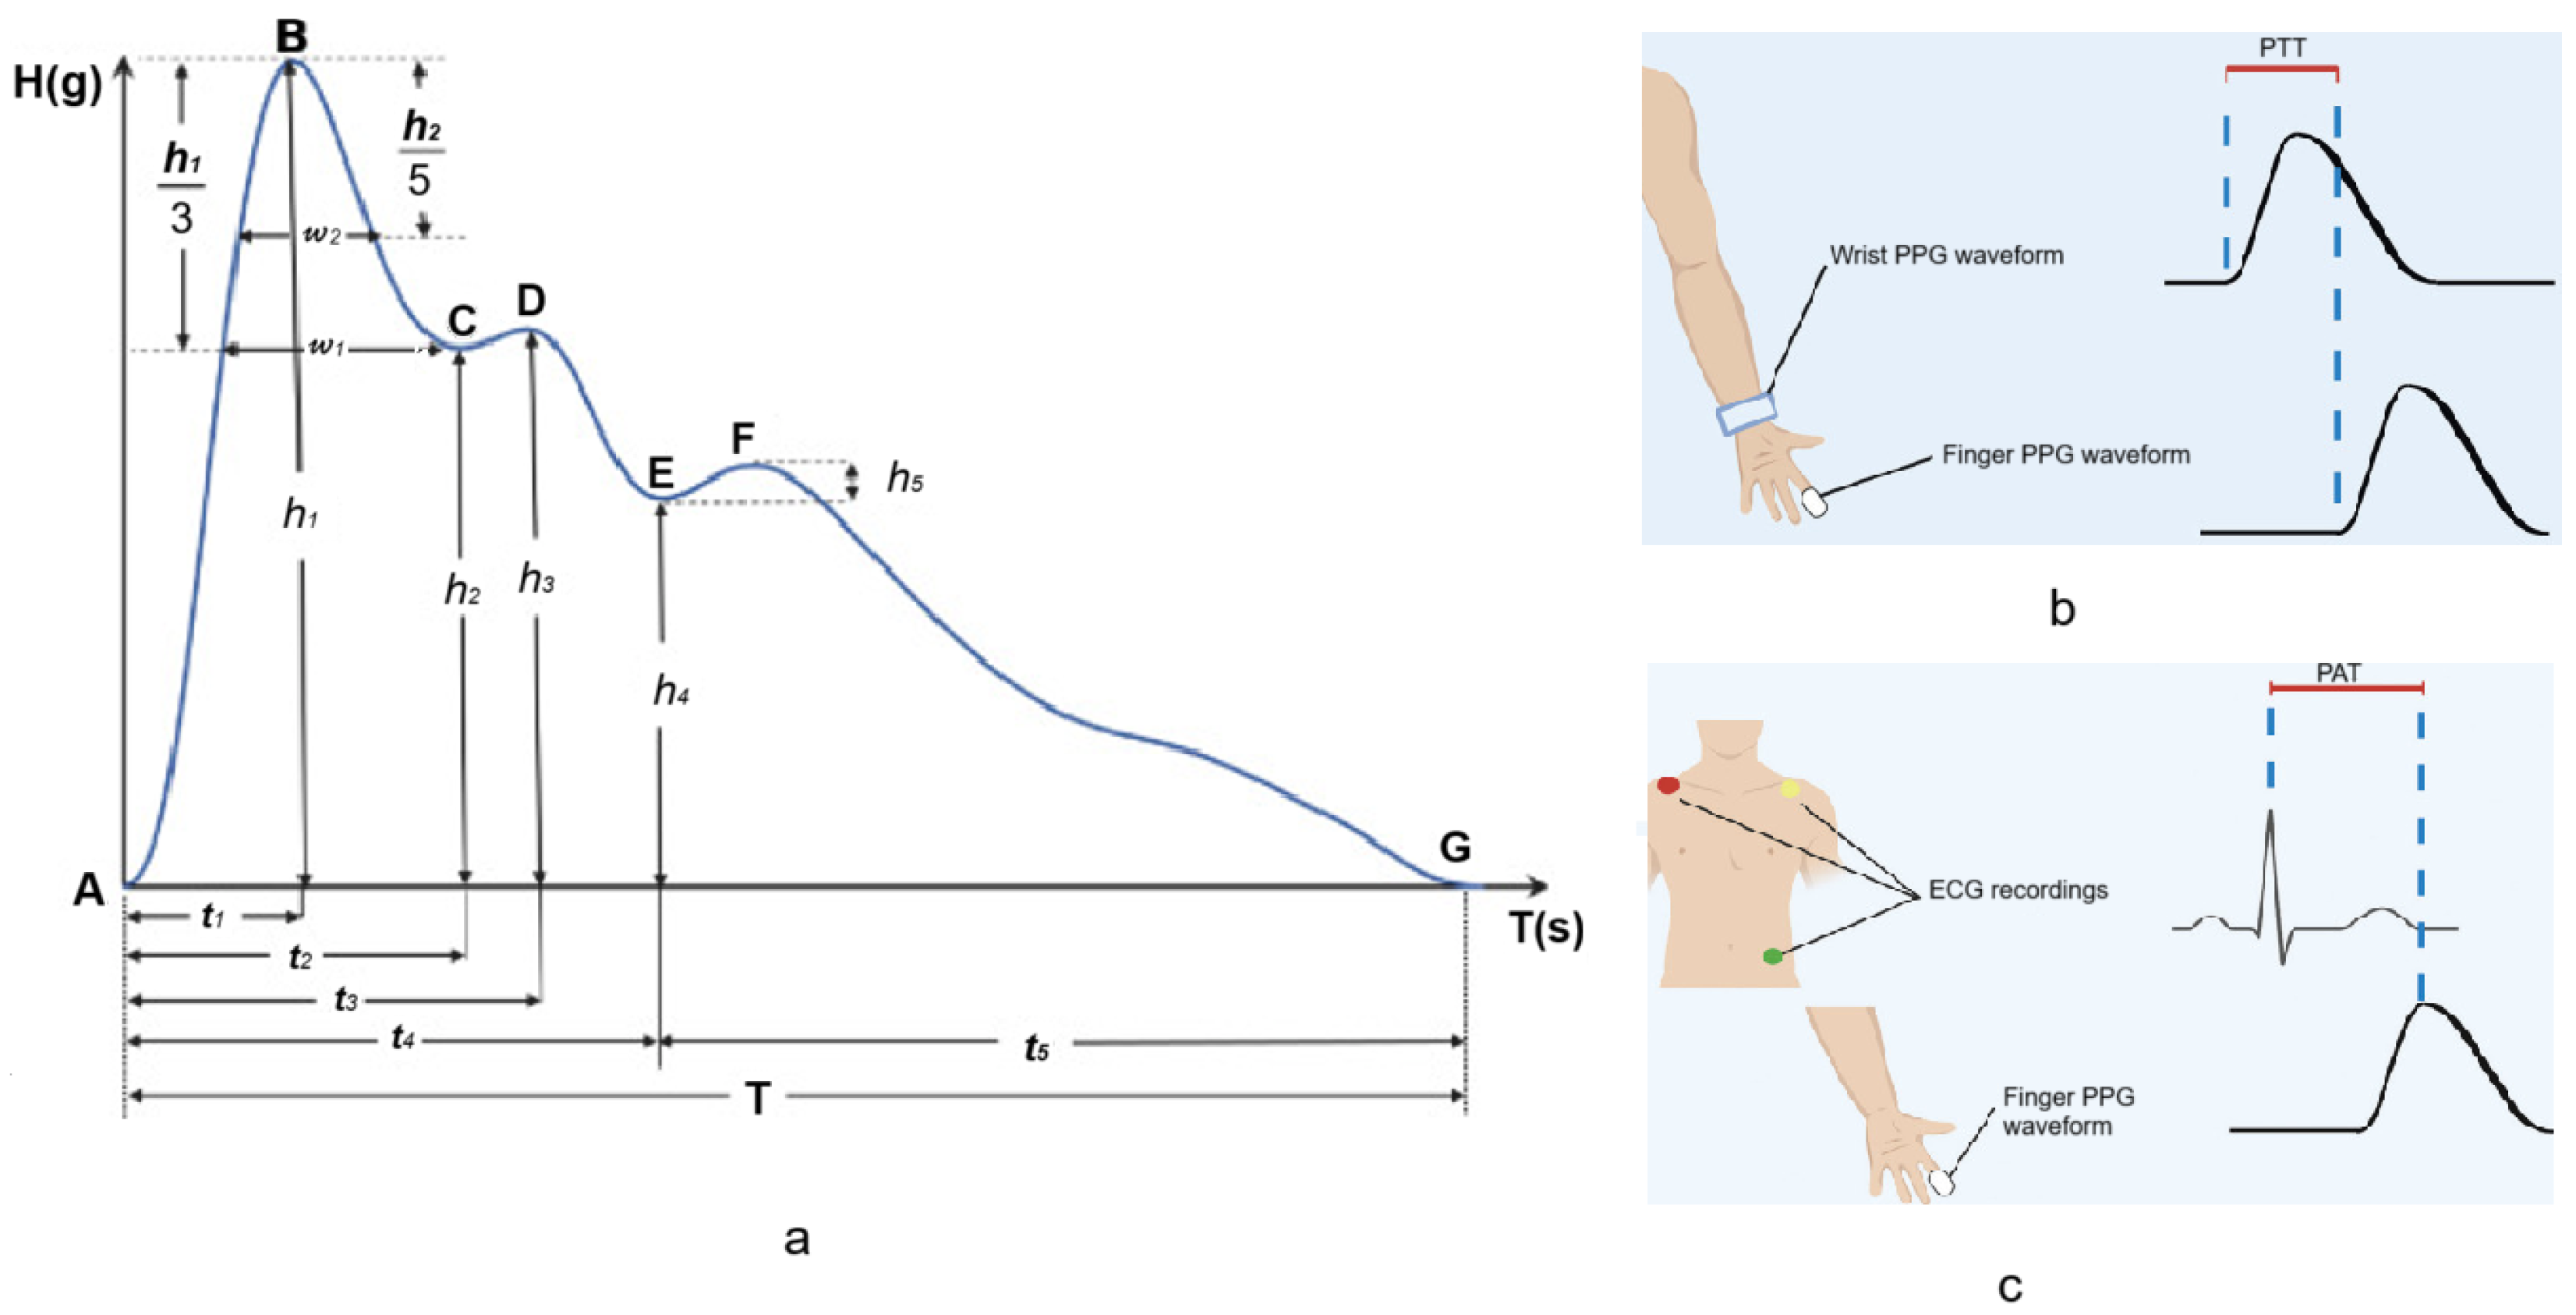
A close-up view of a single cardiac cycle is presented in Figure 7a. The authors of [37] have identified a total of seven characteristic feature points marked A through G that can be extracted, where A—start point, B—main wave crest, C—main wave gap, D—tidal wave peak, E—dicrotic notch, F—dicrotic wave peak, and G—end point. The authors used these along with other derived features as the inputs in a random forest algorithm for the classification of patients with various degrees of coronary artery obstruction.
  • Pulse wave transit time (PTT)
By combining PPG sensors from the wrist and finger it is possible to calculate pulse wave transit time (PTT) or the time required for a pulse wave to traverse the distance between two arterial sites within the human body [37] as shown in Figure 7b. PTT can also be derived by acquiring PPG from a single location and ICG P-point [52].
  • Pulse wave arrival time (PAT)
A combination of ECG recording with a PPG waveform from the finger allows for the estimation of pulse arrival time (PAT) or the time interval between the R wave and the PPG waveform [6] as illustrated in Figure 7c.
  • PPG Signal derivatives
The first and second derivatives of the PPG signal are shown in Figure 8. Time domain features related to peak amplitudes are marked. These features have been used in machine learning algorithms for blood pressure estimation in [51]. Analysis of the second derivative of the PPG signal allows one to identify characteristic features, such as peak latency, notch latency, notch relative amplitude, and peak-to-notch latency of the PPG signal. In [53], the authors have stated that these features are the best ones for the assessment of arterial stiffness.

5. Heart Rate Monitoring

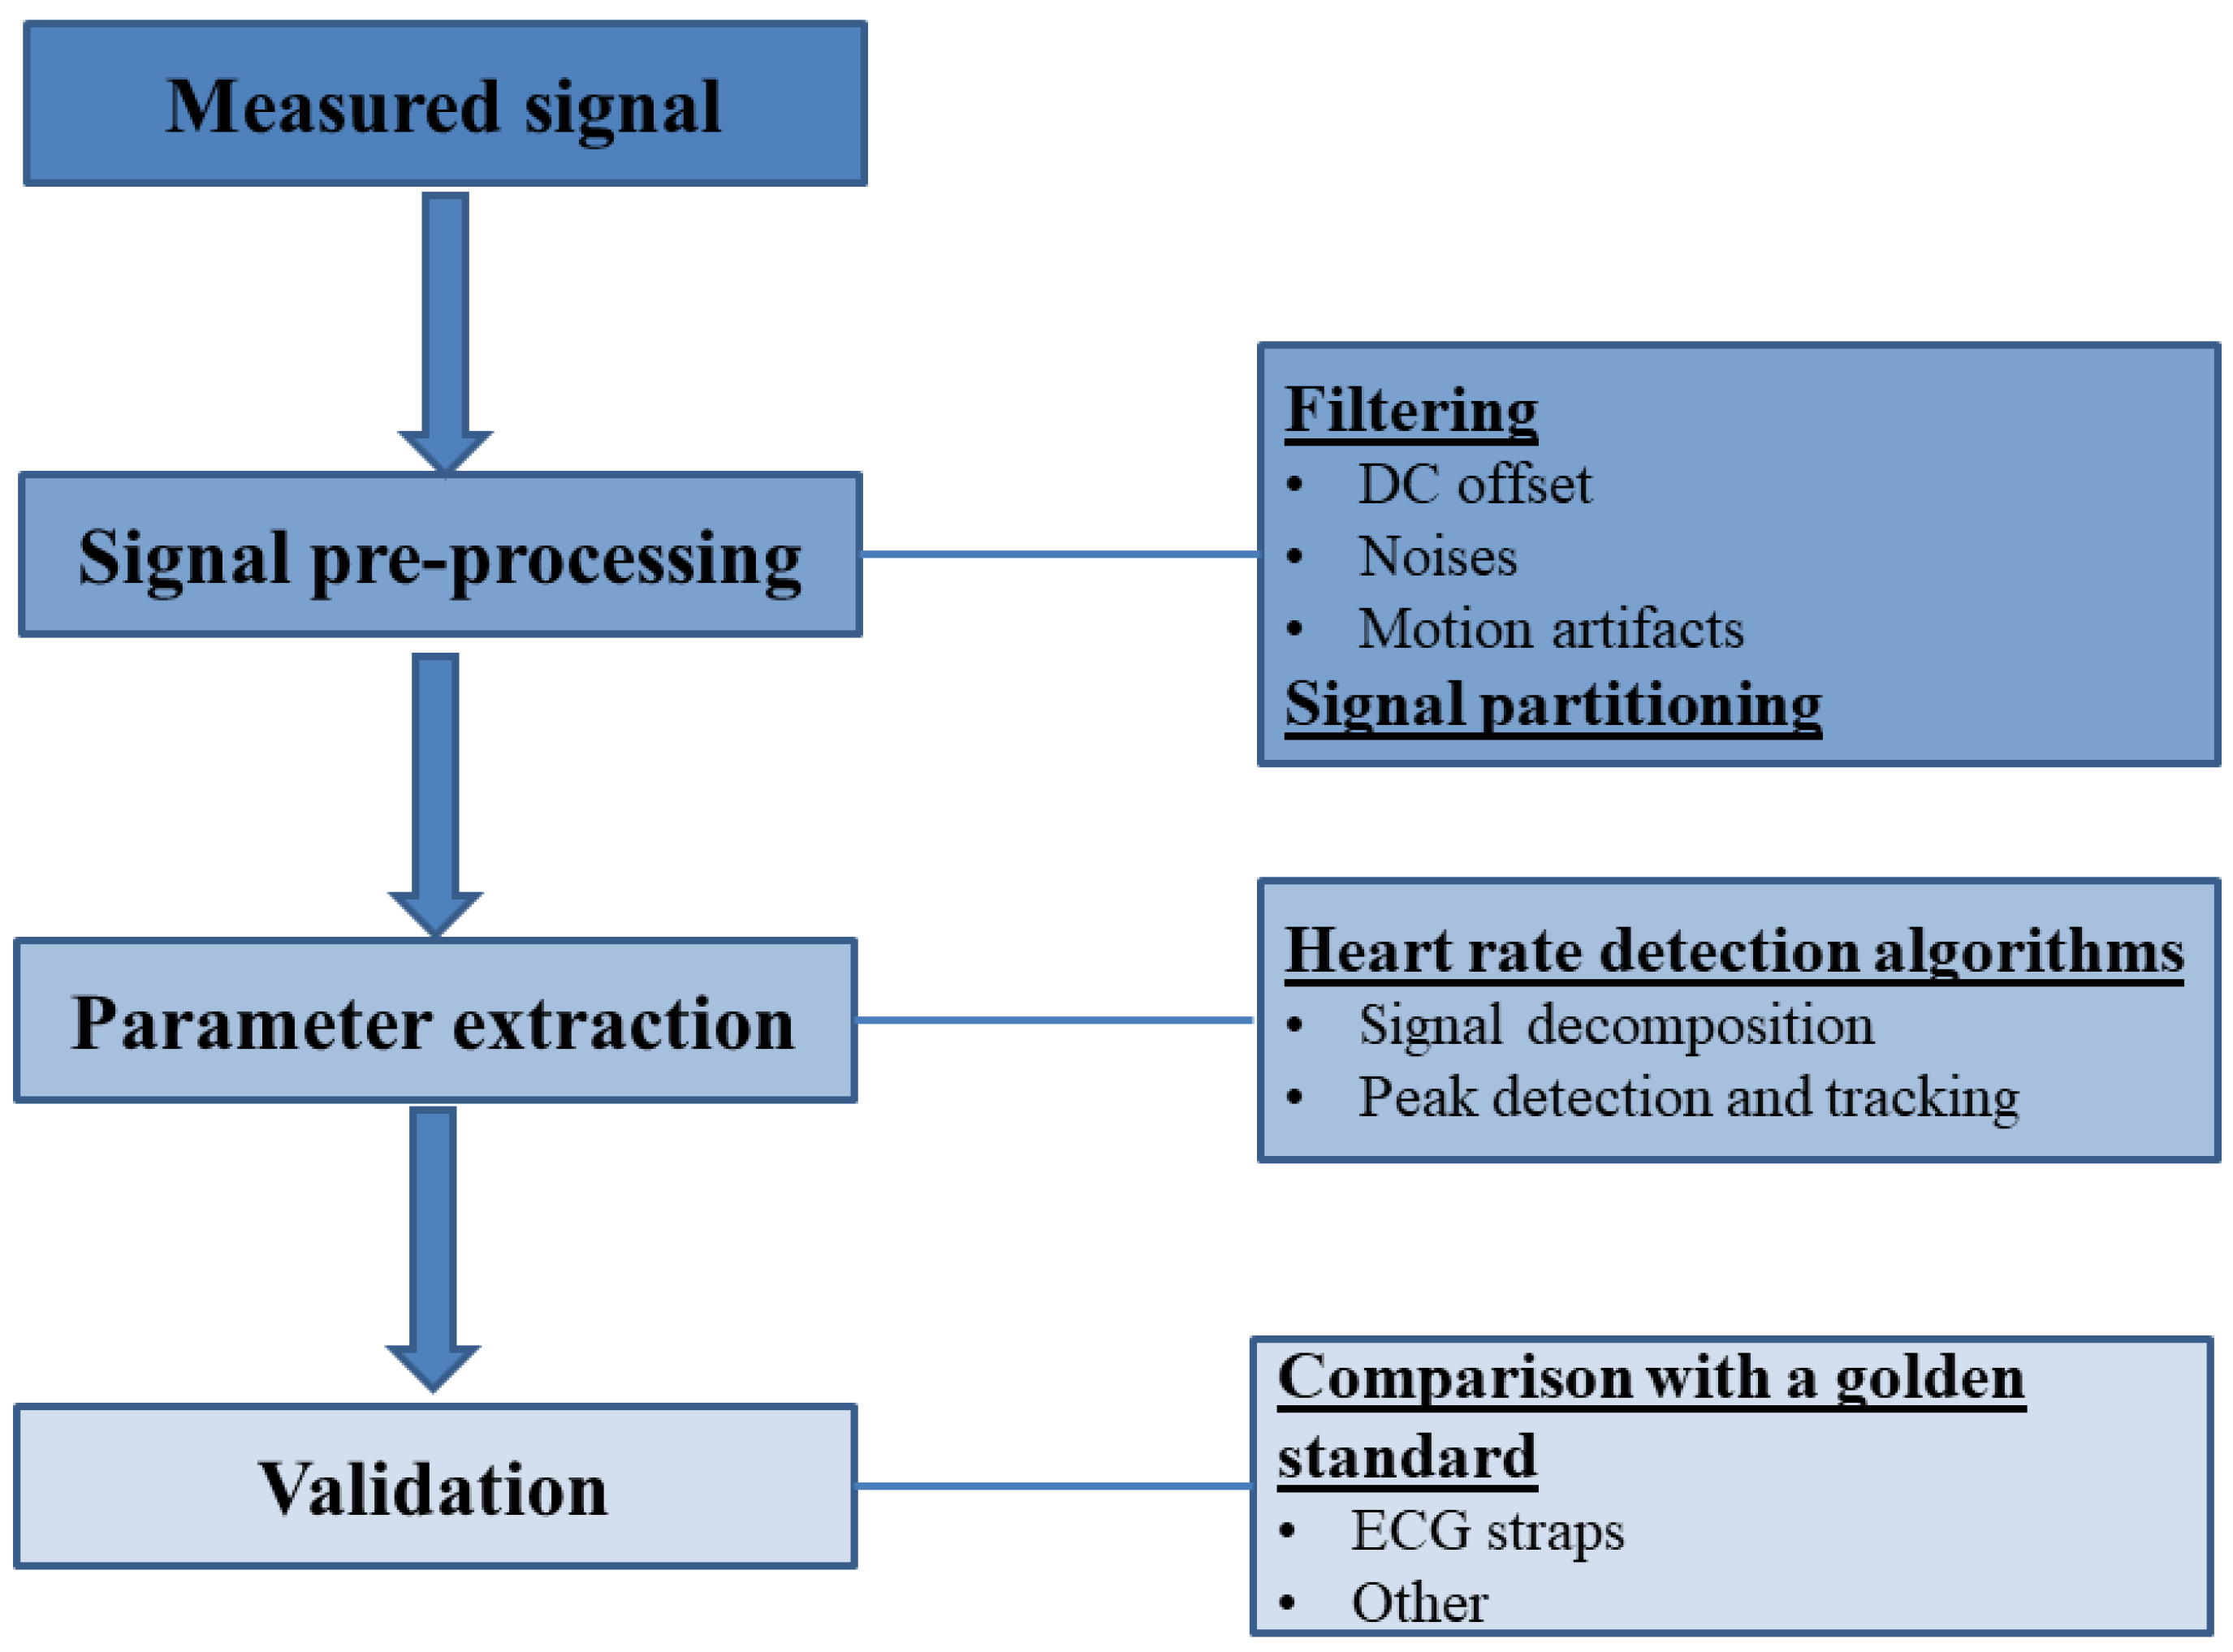
The typical processing pipeline of wearable heart rate estimation includes three stages—pre-processing, heart rate calculation and validation against a known standard, as illustrated schematically in Figure 9.
The pre-processing stage, for the most part, deals with signal filtering in order to, firstly, remove DC offset, slopes and wandering baselines and, secondly, remove noises in a specific frequency range using notch filters possibly followed by band-pass Butterworth filters. As reported in many sources, the presence of motion artifacts (MAs) in the measured signals is one of the most significant problems that may sabotage the efforts of heart rate estimation. Hence, specialized algorithms (see Section 5.1.3) are necessary to exclude the MAs from the measured signal. The cleaned signals are then commonly divided into overlapping frames, whose duration can either be fixed to a specific value or whose signal can be divided into individual cardiac cycles for further calculations [7].
However, the ability to reduce the effect of MA at the hardware level should not be underestimated. Such solutions may rely on multi-channel optical sensors with multiple wavelengths [54] or with a sensor array [55]. In EBI-based cardiac-related data acquisition, the MA reduction solutions rely on electrode design optimization like the support structure advancement [56] or enhanced contact area materials like carbon fibres [57]. An appropriate approach is to measure the skin–electrode contact impedance concurrently to the interesting signal of EBI [58], besides the classical approach of utilizing the high input impedance instrumentation amplifiers [59].

5.1. Signal Pre-Processing

5.1.1. Sources of Noise

The main sources of noise in EBI measurements are associated with an electrical contact between the sensor and the skin. This contact itself is affected by properties of skin, such as state of hydration and roughness [60], as well as properties of electrodes, for example, electrode area and material [61]. It is well-known that the smaller the area of electrodes, the higher the electrode-to-skin impedance and the lower the signal-to-noise ratio of the measured bioimpedance signal [62]. Sources in the literature explore self-adhesive materials (e.g., 2D layer graphene, ultra-thin gold electronic-tattoo) for bioelectronic measurements [63,64]. However, a major issue with these materials is establishing a suitable connection between the flexible substrates and electronics which are rigid, and the connection often becomes the source of failure [18]. The pressure with which the electrodes are pressed to the skin is also of importance. A faulty attachment of electrodes to the skin can be detected as a relatively high-frequency perturbation in the measured signal [65,66]. Moreover, if unsuitable or inappropriate electrode configuration relative to the artery is used, the result may be fully interfered or wrongly interpreted [67].
In the case of PPG signals, MAs, electromagnetic interference, spatial stray light interference, variations due to baseline drift, noise in the light signal due to variations in the sensor position [9], and local perfusion changes [34] are the most profound causes of noise. Out of these, the most challenging to deal with for accurate HR estimation are MAs if the frequency of the MA lies inside the permissible HR frequency band.

5.1.2. Noise Filtering

Band-pass filtering is commonly employed for baseline distortion removal. However, severe morphological distortions from the low perfusion and baseline drift in PPG signals are difficult to remove with frequency filtering. Additional filtering or feature extraction methods, such as moving average filter and wavelet decomposition, could be useful to regulate the signal. On the other hand, the filtering procedure should be minimized, since this process alters the positions of peaks and PPG and EBI waveform analysis for HR estimation is mostly based on exact peak position [36]. A sample routine of filtering noise from an EBI signal conducted in [16] is shown in Figure 10. The order of filters producing a smoothed signal Sm was as follows: high-pass cut-off = 0.5 Hz → low-pass cut-off = 50 Hz → notch 50 Hz → moving average window = 60 ms.
In [68], a two-stage noise filtering process was employed. In the first stage, a band-pass filter composed of infinite impulse response (IIR) with a frequency band of 0.1 Hz–1.5 Hz was chosen owing to the fact that the fundamental frequency of PPG signal is about 1 Hz. In the second stage, a 50 Hz notch filter was used. In [69], the raw PPG signal and the acceleration signal in a given time window were filtered with a band-pass filter from 0.4 Hz to 5 Hz using a second-order Butterworth filter. Source [70] reports utilizing a fourth-order Butterworth filter with cut-off frequencies 0.1 Hz to 1.2 Hz for filtering the EBI.

5.1.3. Motion Artifact Removal

Motion artifacts (MA) exist in the monitored signals as shown in Figure 11b, because of the motion-induced interface change between wearable sensors and human skin. Hence, MAs can theoretically be tracked by the change in contact pressure at the interface between human skin and wearable sensor [71]. MA removal is crucial in design of wrist-worn EBI and PPG-based measurement devices for accurate instantaneous HR estimation [71,72]. The algorithms of MA removal can loosely be classified into two categories—algorithms that require supplementary measured signals and algorithms that do not. Both these types of algorithms are described in the following paragraphs.
  • Without supplementary signals
Independent component analysis (ICA)-based decomposition techniques are commonly used to filter out MAs without the need for any supplementary signal in both the time domain [73] and the frequency domain [74]. Different variations of ICA or combinations with other techniques have also been used. For example, in [73], the ICA was combined together with a block interleaving with low-pass filtering, while in [75], a temporally constrained ICA (cICA) was used in a combination with adaptive filters. The downside of the ICA method is that the ICA provides reliable output only when noise and useful signals are uncorrelated, which in practice is not satisfied. Wavelet transform (WT) operates in the time-frequency domain. However, wavelet threshold along with a choice of the mother wavelet function have to be set, often empirically, limiting the usage of this method [9]. On the other hand, MA removal with adaptive thresholding was carried out in [76]. Authors performed stationary wavelet transform on all segments of the signal. The threshold for MA removal was selected by examining a statistical distribution of wavelet transform coefficients in each segment, which was modeled as a mixture of two Gaussians. An MA-free signal was obtained by applying an inverse wavelet transform of the thresholded wavelet transform coefficients. Empirical mode decomposition (EMD) is an adaptive and data-driven algorithm well-suited to non-stationary data that decomposes a time series into multiple intrinsic mode functions (IMFs) [77]. EMD has been used to remove MA from biomedical signals, such as ECG signals [78,79] and PPG signals [80,81,82]. In [81], the authors removed those IMFs whose mean instantaneous frequency was out of the frequency band of PPG. There are several drawbacks to EMD:
  • Sensitivity to noise in the recorded signals.
  • Mode mixing. This has been addressed with the ensemble empirical mode decomposition (EEMD) method [82], where the true IMF components are chosen as the mean of an ensemble of trials. Each trial consists of the signal plus an addition of white noise [83].
  • Aliasing [9].
  • Trend uncertainty [9].
  • The method and its variations are based on empirical and heuristic procedures; thus, interpretability is its weakness [84].
  • EMD and especially EEMD have a significant computational cost. A fast version of EEMD (FEEMD) was proposed in [85] lessening the computational burden of the original EEMD.
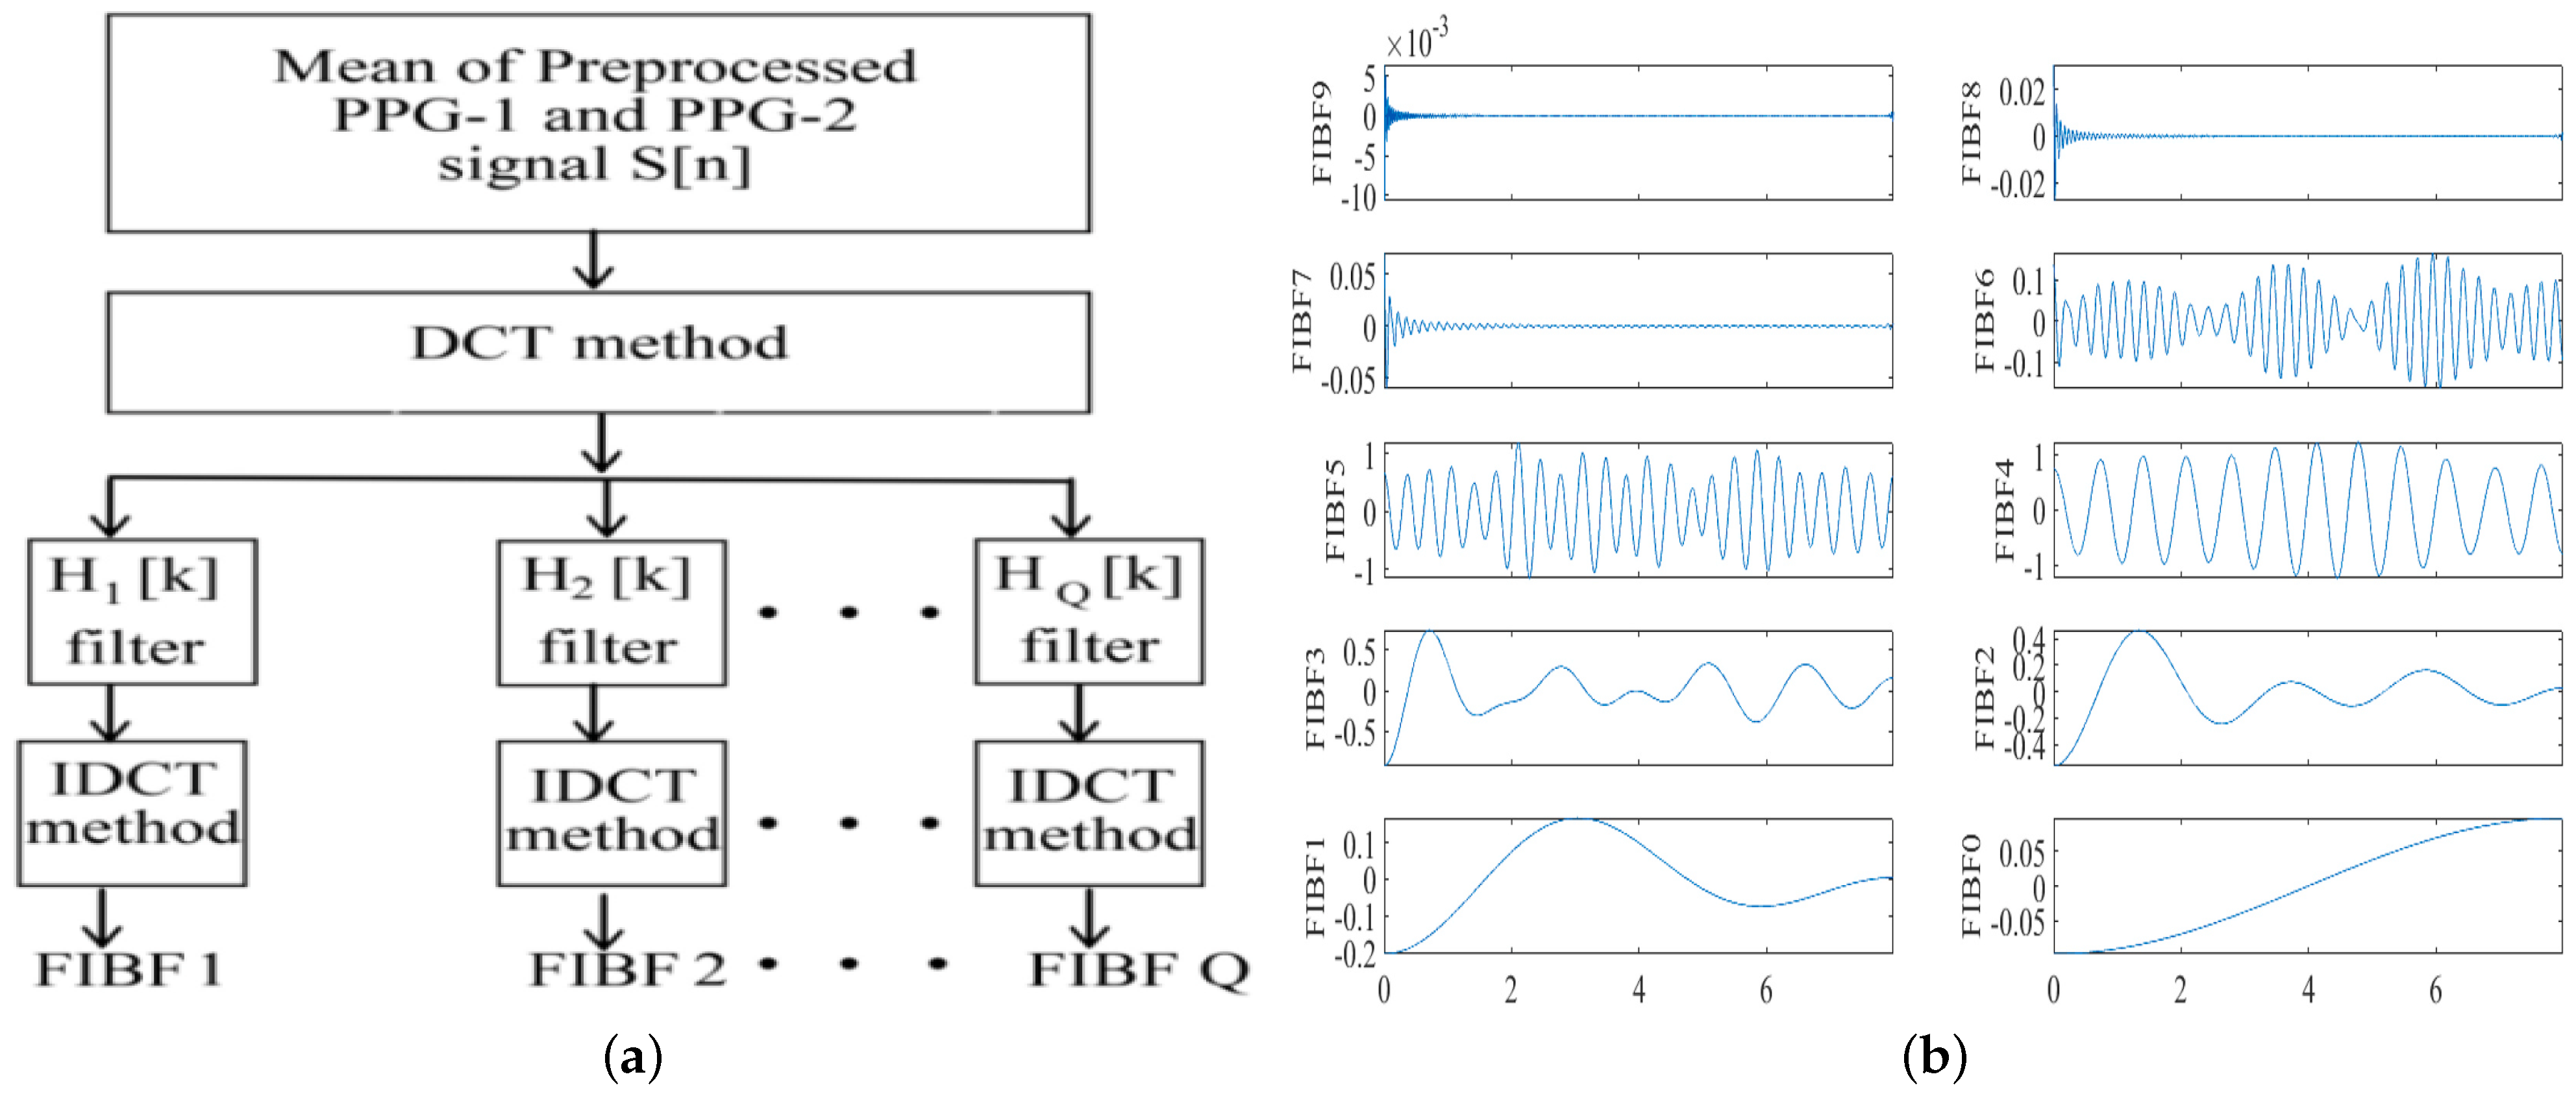
Another drawback of EMD (and its variations) is that no rigorous guidelines on the choice of relevant IMF exist as the whole EMD procedure is empirical in nature. An example of extracted IMFs from a PPG signal is shown in Figure 12. The authors of [69] speculated that the IMFs related to noise and MAs are of high frequency, while low-frequency IMFs are related to low oscillations, so the trend and both of these groups of IMFs should be removed. Although the EEM method can be used without supplementary signals, these authors used additional acceleration signals for MA removal. They proposed to execute the judgment on which IMFs to remove based on a correlation coefficient between the periodograms of PPG and acceleration signals. When the correlation coefficient was smaller than 0.5, the first two IMFs and the last two IMFs were removed. On the other hand, when the correlation coefficient was higher than 0.5, the first IMF and the last three IMFs of PPG and acceleration signals were removed. Afterwards, a noise-free PPG signal was reconstructed from the retained IMFs.
  • With supplementary acceleration signals
Several algorithms in the literature require reference accelerometer signals to remove MAs from a PPG signal. Other references in the form of a gyroscope [86], piezoelectric sensor [87] or LED/PD [88] signals have also been used. The adaptive filtering family of methods include different variations of the least squares algorithm, for example, least mean squares (LMS) [89], normalized least mean squares (NLMS) [90], and recursive least squares (RLS) [91]. A combination of the above-mentioned algorithms has been used in [92]. Frequency content of MAs can be found both inside and outside of the spectral range of human heart rate. In order to remove the outside spectral component of MA, a fourth-order Butterworth band-pass filter with a cut-off frequency band from 0.5 Hz to 3.5 Hz was applied in [71], while the range of 0.4 Hz to 4 Hz was used in [93,94]. The authors explained that this range translates to 0.6 Hz–3.3 Hz of heart rate, covering subjects of all ages at different intensities of physical activity. On the other hand, the in-band spectral component of MA was canceled by employing a fourth-order LMS filter with a step size of 0.01. The advantages are as follows [71]:
  • Low computation complexity allows for a real-time signal processing. The drawbacks are as follows [9]:
  • The correlation between the reference signal and the motion spectrum has to be sufficiently high, which is impossible in practice.
  • Very high computational requirements.
Another adaptive filtering method is Fourier decomposition (FD). FD decomposes the signal into a Q-number of orthogonal or linearly dependent and energy preserving Fourier intrinsic band functions (FIBFs) within the desired frequency band
S [ n ] = C 0 + l = 1 Q X l [ n ]
where C 0 is the mean of the signal S [ n ] , X l [ n ] denotes the Qth FIBF. FIBFS themselves are obtained from a the inverse discrete cosine transform (IDCT)-based zero-phase filter bank as depicted in Figure 13a.
F I B S l = 2 n k = 0 N = 1 σ k H l [ k ] X c 2 cos π k ( 2 n + 1 ) 2 N
where X c 2 [ k ] is the N-length DCT of the signal S [ n ] , H l [ k ] is the zero-phase filter and the normalization factor σ k is given by σ k = 1 2 if k = 0 and 1 if k 0 [9].
FIBFs are derived from the input data; thus, they are data-dependent. As the data changes, the FIBFs adapt to the transition and change their values accordingly. The FIBS obtained from a PPG signal are shown in Figure 13b. FIBF0 and FIBF1 contain low-frequency signal information, such as respiratory signals. FIBF2 through FIBF6 represent the MA components and FIBF7 and FIBF8 contain most of the information of the PPG signal which can be used for signal reconstruction without the MAs [9].
Even though the FD overcomes the drawbacks of EMD in terms of mathematical complexity, detrend uncertainty, and mode mixing [9], there are some drawbacks. Specifically, the drawbacks include the following [95,96]: the process is time-consuming; a large number of data samples for data processing are needed, making it unfeasible in mobile device applications. In case the frequency of the MA is close to that of the feature we are interested in (for example, heart rate), the MA cannot be suppressed [9]. The adaptive detection threshold method (ADT) uses a threshold that reacts to PPG waveform amplitude in order to detect peaks and valleys [97,98]. Compared to FD, ADT is more flexible, less time-consuming and not dependent on baseline drift. In addition, a peak correction technique was also used to ignore the unwanted diastolic peaks.
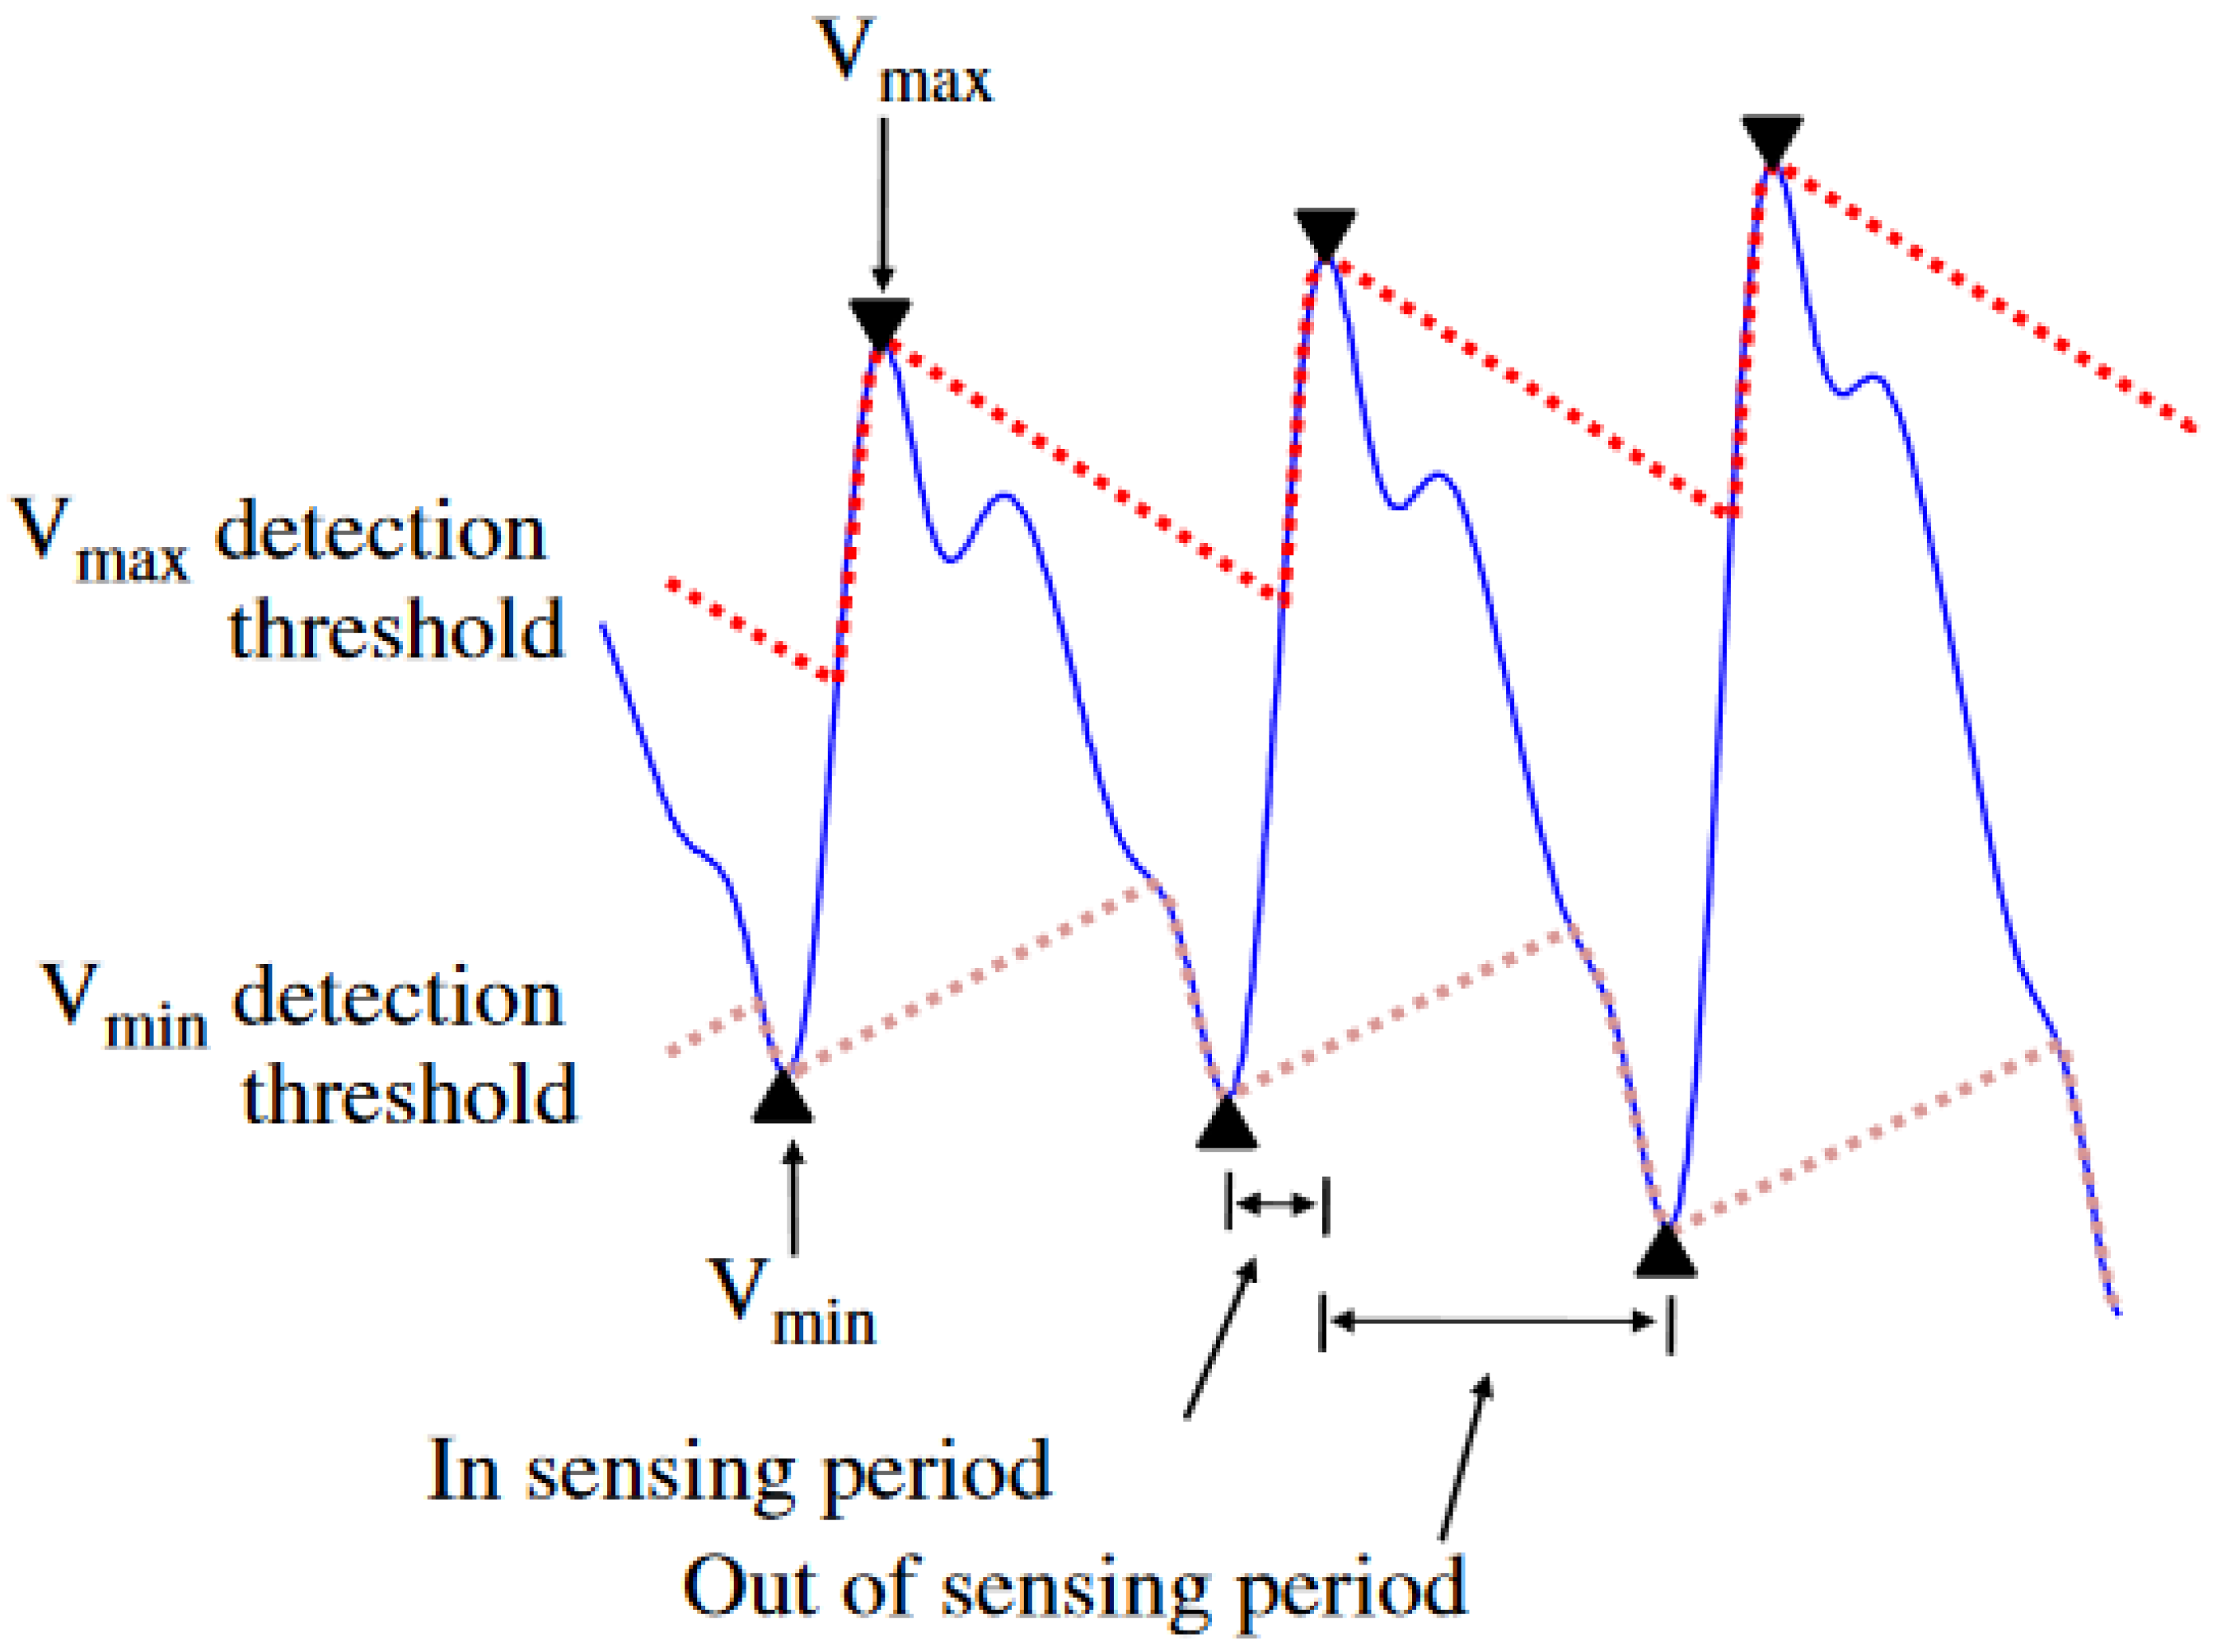
In the ADT method, two different adaptive thresholds are created to detect PPG peaks ( V m a x ) and PPG valleys ( V m i n ) . Starting from a peak of the signal, the upper threshold is decreased with a slope parameter until it crosses the PPG signal. Afterwards, this threshold follows the waveform of a signal until it reaches the inflection point ( V m a x ) . In case of valleys, the process is identical, except that the slope parameter acts to increase the value of threshold until the threshold crosses the PPG signal and V m i n is found. This process is repeated until all inflection points V m a x and V m i n are found. The initial and modified slope parameters are given by [36] s l o p e i n t = {0.2 × argmaxPPG in peak V m a x detection, 0.2 × argminPPG in valley V m i n detection} and s l o p e k = s l o p e k 1 + s r V n 1 + σ P P G f s , respectively.
Here, s l o p e k is the amplitude of the k-th slope, s r is the rate of slope change (empirically selected as −0.6 and 0.6 for V m a x and V m i n , respectively), V n 1 is the amplitude of the previous peak, σ P P G is the standard deviation of an entire PPG signal, and f s is the sampling frequency. The principle of the ADT method is illustrated in Figure 14. The period of a PPG signal is defined as an “in-sensing period” when the detection threshold conforms to the waveform of the signal, whereas in an “out-of-sensing period” the slope parameter of the threshold is fixed.
In the spectral subtraction (SS) method, a spectrum of a supplementary acceleration signal is subtracted from a spectrum of a signal [99]. The authors in [69] suggested computing the correlation coefficient between normalized magnitudes of acceleration and PPG periodograms. When the correlation coefficient was smaller than a threshold value (set to 0.5), SS was not performed, as MAs were not dominant in the PPG signal. Otherwise, both acceleration and PPG signals were used. In [100], the SS method was performed in an asymmetric least squares manner to improve the outcome of MA removal. The drawbacks are as follows [69]: SS is only effective when the spectral components are matched. Otherwise, the use of SS could potentially lead to false spectral peaks. In [72], the Wiener filter was used to filter a measured PPG signal in frequency domain by SS according to
P C ( i ) P S ( i ) P A / G ( i ) = P S ( i ) P A / G ( i ) P S ( i ) × P S ( i ) P C ( i ) P C ( i ) P A / G ( i ) × P S ( i )
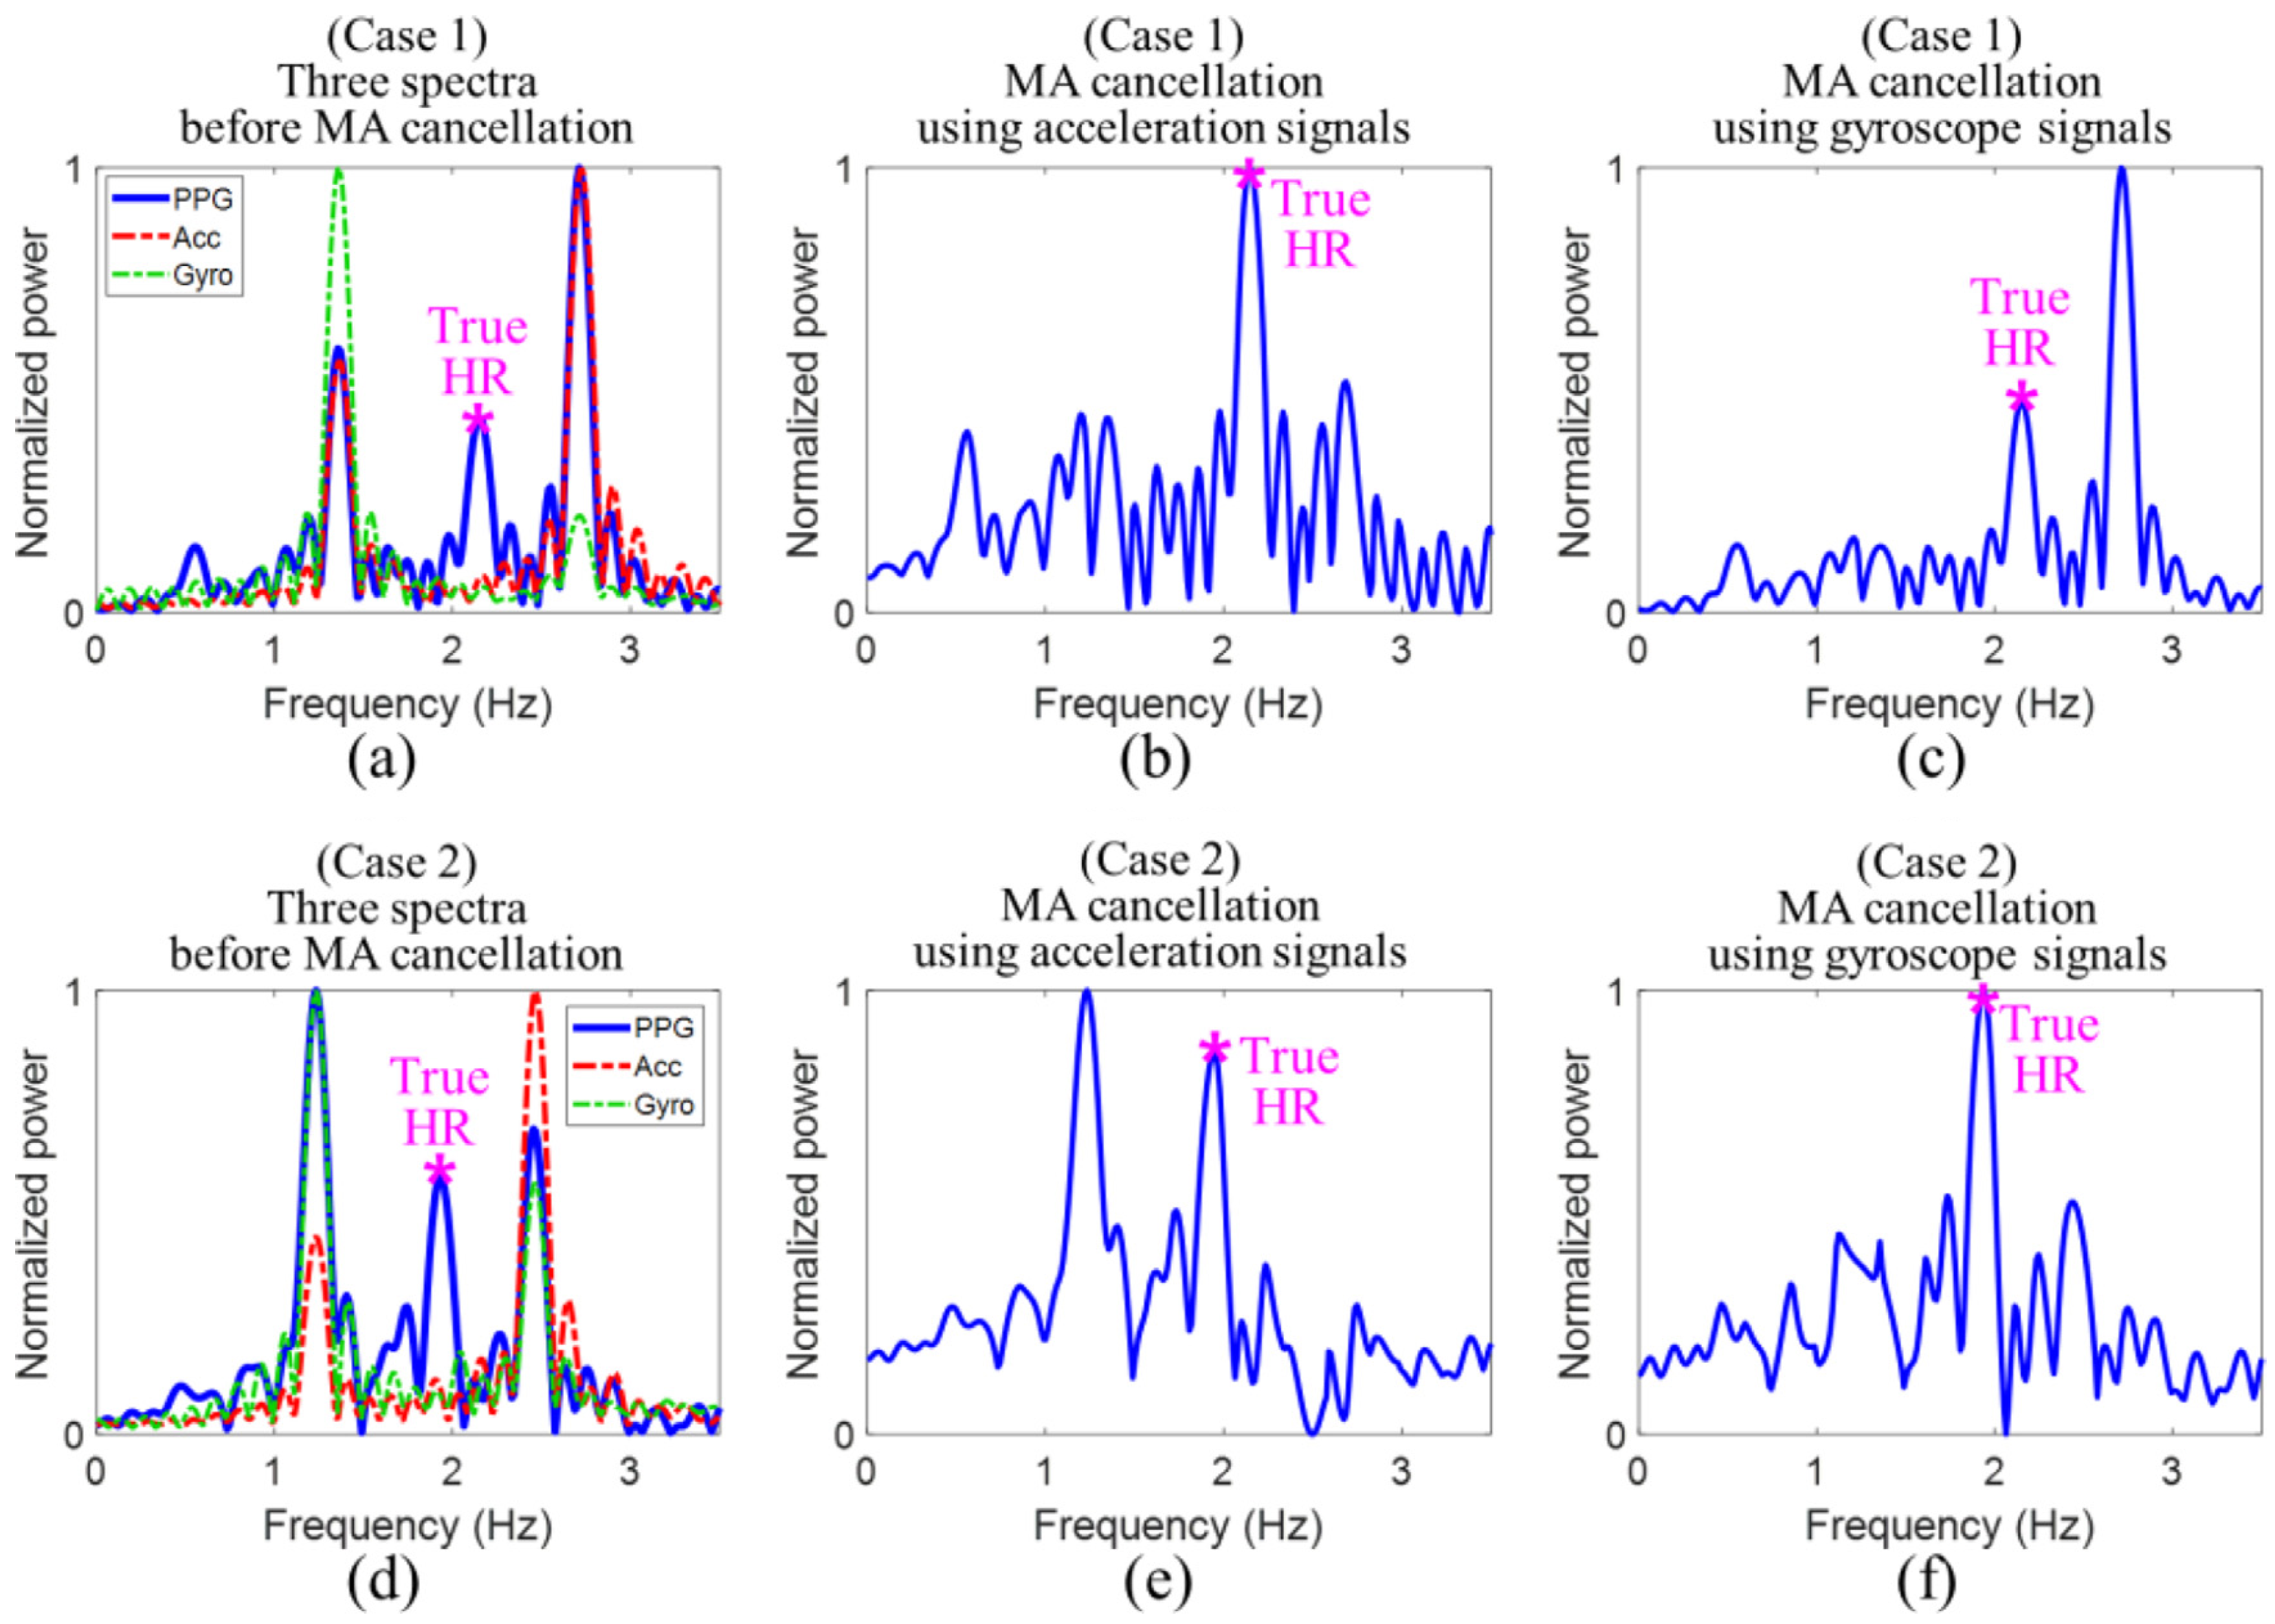
where P S ( i ) is the spectrum of the measured PPG signal containing MA, P C ( i ) is the spectrum of the MA-free PPG signal and P A / G ( i ) is the spectrum of acceleration or gyroscope signal. After the application of the Wiener filter, the MA removal results are as seen in Figure 15.
In case 1, the dominant frequency of P S ( i ) overlaps only with that of P A ( i ) . Then the acceleration signal provides the correct MA reference, since the realization of SS subtracts the dominant frequency peak corresponding to MA. In case 2, the dominant frequency of P S ( i ) overlaps only with that of P G ( i ) . Then, only the gyroscope signal provides the correct MA reference.
  • Limitations
Although numerous literature sources on MA removal exist, their reliability outside the laboratory conditions can be questioned. First of all, few cases of intensive movements of test subjects were considered in a majority of them. In [101], EEMD in conjunction with principal component analysis (PCA) was used. However, the algorithm was validated only on intensive care unit patients with little movement. Secondly, the implementation of MA reduction algorithms in wearable health monitoring devices during intense physical exercises is a challenging task owing to the highly dynamic nature of limb/trunk activities. Existing MA removal methods are ineffective in such cases. The reasons are as follows:
  • The methods are too reliant on expertly tuned multiple parameters and heuristic thresholds, which prevents generalization [102].
  • The commonly used acceleration signal in MA removal is not a direct MA source but is rather a superposition of movement of a body part and the gravitational acceleration [103]. Therefore, the recorded acceleration signals cannot be directly translated in to the movement of limbs during exercises.
A potential remedy is the improvement of the sensors themselves. For example, a heart sensor with strong adhesion and good conformity as reported in [104,105] or an improvement of electrode design for impedance measurements by adding a soft layer that reduces the effect of skin stretching [106].

5.2. Heart Rate Estimation

After the noise removal in the signal pre-processing step, many literature sources employ standardization of signal amplitudes to have zero mean and unit variance [9,69,72]
S i = 1 R R = 1 R S R i μ S R i σ S R i
where R—number of sensors, μ —mean value and σ —standard deviation. For multi-axial supplementary (acceleration or gyroscope) signals, an average of components in x, y and z directions is similarly standardized [72] according to
A n i = 1 3 × A x i μ A x i σ A x i + A y i μ A y i σ A y i + A z i μ A z i σ A z i
where A n i denotes the averaged acceleration signal at the i-th data point. Strictly speaking, standardization can only be performed when the values of a random variable follow a normal distribution. However, authors do not perform normality checks to validate such an approach. Hence, it is not supported by theory. In other sources [70], signal normalization has been conducted to the min-max range according to
S norm t = S t S min S max S min
Compared to standardization, this approach does not assume any particular distribution of signal amplitudes and, thus, is universal. The normalized signal S is divided into segments of size N. N=8 seconds is used in most literature sources [9,82,88,103,107,108,109,110,111,112,113,114,115,116]. From the second segment onwards, each consecutive segment is translated by a step size w to obtain an overlap (see Figure 16). Partitioning in the b-th segment is given by
S b = S b 1 × w + 1 S b 1 × w + N
A shift of, for example, w = 2 s leads to a 6 s overlap. In each of these segments, HR is calculated. Thus, HR value is estimated every 2 s.
In cases when the HR values obtained from each individual segment are not feasible, two strategies have been adopted. Firstly, a majority voting scheme where the final HR value is judged upon by considering a majority of segments may be employed [117,118]. Secondly, increasing frame length. In [119], frame lengths in the order of minutes have been used. The idea is that long frame rates possess enough discriminative information to perform recognition regardless the performed activity. It is convenient to estimate the HR itself in the frequency domain by performing a Fourier transform on each signal segment. A permissible frequency band in which a human heart rate may supposedly lie is established. In [9], 0.4–4 Hz corresponding to 24–240 BPM was used. The dominating peak is then extracted in each segment b. If it is outside the permissible frequency band, the signal is rejected altogether [9]. Otherwise, the HR in beats per minute (BPM) is calculated from this dominating frequency as
H R ( b ) = f r e q u e n c y × 60
HR values are then tracked in each segment. Some tolerance value of HR differences among segments must be chosen. For example, in [9], If H R ( b ) H R ( b 1 ) | 5 , then the H R e s t i m a t e d of the b-th segment was set to H R e s t i m a t e d ( b ) = H R ( b 1 ) + H R ( b 2 ) 2 . If this condition does not hold, the H R e s t i m a t e d is equal to HR(b). The authors of [9] remarked that a significant problem is the resolution of the signal at low frequencies after the Fourier transform. This problem can be circumvented by zero-padding the denoised signal up to the required length.

5.3. Algorithms

  • TROIKA
The TROIKA algorithm combines several steps to clean and enhance heart rate (HR) signals obtained from a wrist-worn PPG device. It utilizes sparse signal reconstruction (SSR) as one of the main processing components, specifically combined with the FOCUSS method, to capture heartbeat signals in a sparse spectrum. The process begins with band-pass filtering to isolate the relevant signal, followed by signal decomposition using singular spectrum analysis (SSA) for denoising, and temporal difference analysis to enhance the signal clarity. Finally, spectrum peak tracking (select and verify) ensures accurate heart rate estimation. This approach, as illustrated in Figure 17, effectively combines previous estimations to refine the current heart rate estimation, making it suitable for use during physical activity [103].
The following steps briefly describe the main components used by this algorithm:
  • Signal decomposition: This part aims to denoise and sparsify the spectra of PPG signals. SSA helps to remove motion artifacts (MA) frequency components and to sparsify the spectrum coefficients. The time series is decomposed into oscillatory components and noise as shown below:
    y = i = 1 Q y i ,
  • Sparse signal reconstruction (SSR): SSR aims at obtaining the sparsest high-resolution spectrum of the PPG signal, which is robust against noise, using FOCUSS algorithms. This process is essential for distinguishing the heart rate component from other dominant frequencies caused by MAs. The basic model of SSR can be written as follows:
    y = Φ x + v
    Here, Φ is a known basis matrix, the vector y is the observed signal, x is an unknown solution vector and v is an unknown noise vector. The goal is to find the sparsest vector x by minimizing the square of the l 2 norm of ( y Φ x ).
  • Spectral peak tracking: The final step involves selecting and verifying the correct spectral peak corresponding to the heart rate. This involves an initialization phase where users are required to minimize motion, followed by the selection of spectral peaks within certain ranges, and a verification process that employs decision mechanisms to ensure the correct peak is chosen despite potential motion artifact interference.
    N cur = N prev + τ , if N N ^ prev θ , N prev τ , if N N ^ prev < θ , N ^ , otherwise .
    where N ^ is the location of spectral peak selected by the user, N c u r is the modified value based on the previous observations and θ = 6 and τ = 2 [103].
  • JOSS
The JOSS [107] (joint sparse spectrum) algorithm is based on the TROIKA algorithm. The key difference, as shown in the Figure 18 is that it employs joint sparse signal recovery to estimate the spectra of multiple measurement vectors comprising of several PPG signals in addition to simultaneously recorded acceleration signals.
  • Joint sparse signal recovery: Using the MMV model (multiple measurement vector), the spectra of the PPG signal and acceleration signals are jointly estimated. The MMV model provides unique solutions and better error performance compared to the SMV model (single measurement vector).
  • Spectral subtraction: A simple spectral subtraction method is applied to remove the spectral peaks of MA from the PPG spectrum. The maximum values of spectral coefficients in the acceleration spectra are subtracted from the corresponding values in the PPG spectrum. Thresholding is then performed to zero out coefficients below a certain level.
  • Spectral peak tracking: Compared to the TROIKA algorithm, a new phase of peak discovery is introduced. After the initialization of the peak, it is refined and validated based on previous estimates and the expected range of heart rate changes.

6. Wearable Devices for Heart Rate Monitoring

Wearable healthcare devices that track physiological parameters are either non-invasive or minimally invasive—for example, blood glucose level monitoring [120]. Their design must conform to the needs of the user in terms of comfort and functionality and the output data must be informative and accurate to inform medical interventions when needed [34]. Recently, novel types of wearable devices have been developed; for example, a wearable device using triboelectric nanogenerator technology [121]. It is self-powered in a sense that it can harvest the energy released by the radial artery pulse in the wrist and its potential application is uninterrupted heart rate monitoring over prolonged periods. Nevertheless, technology readiness level for such exotic devices is relatively low and the following subsections will explore the existing solutions for wearable devices for heart rate monitoring based on PPG and bioimpedance signals whose nature is well-understood.

6.1. PPG-Based Devices

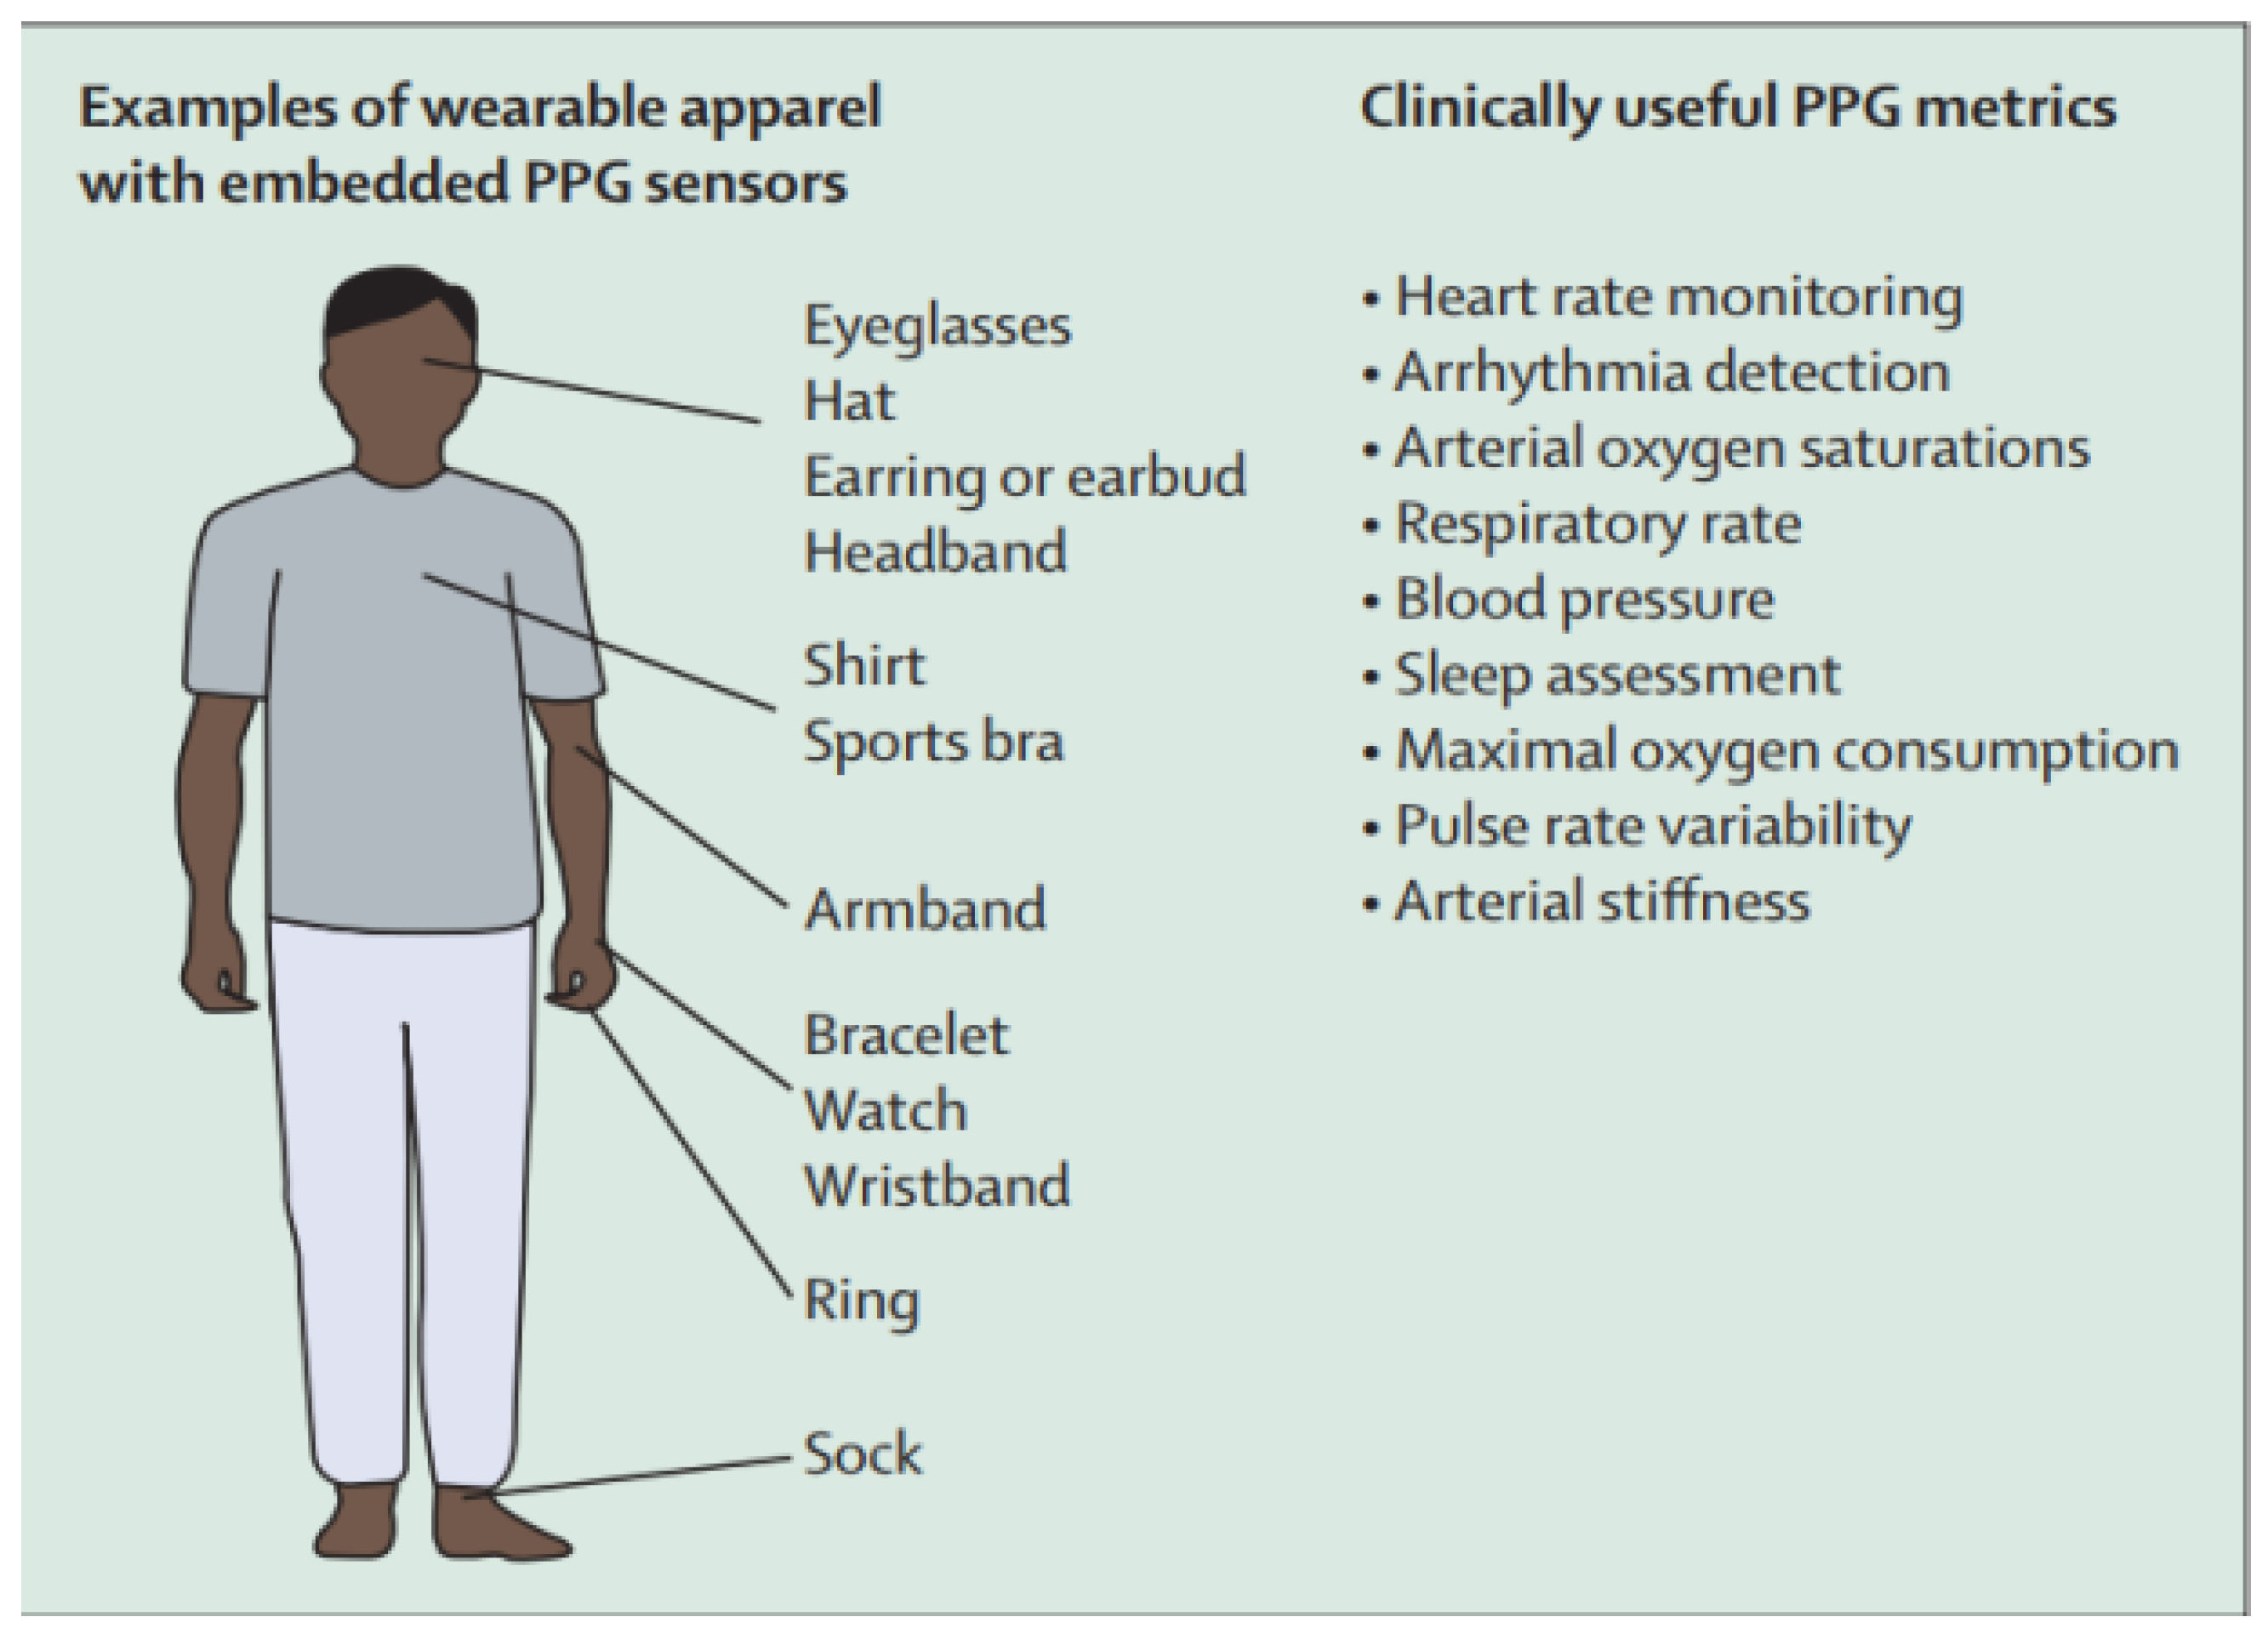
Owing to its simplicity, reflectance-type PPG is the most commonly used technique for monitoring different cardiovascular bioparameters—HR and blood pressure among others [35,71] through pulse oximeters embedded in wearable devices [49,122]. Modern wearable PPG-based options include smartphones, wristbands, watches, scales, shirts, rings, bracelets and eyeglasses (see Figure 19) [6]. Commercialized PPG-based wearable measurement systems include Withings Pulse O2, Fitbit Zip, Garmin vivofit, Moto 360, Huawei wear [123,124,125,126,127,128]. Healthcare wearable devices based on PPG are Everion (placed on the arm) [129], Empatica E4 (placed on the wrist) [130], ViSi Mobile (placed on the finger) [131].
Wrist-type wearable devices fabricated in a laboratory setting are presented in Table 2, while photos of the manufactured PPG wearable devices are shown in Figure 20. In [72], a heart rate detection algorithm performed via a microcontroller in real time was used with an average computational time of 141 ms per window. In [71], three additional thermoreceptor sensors designed to detect contact pressure between the device and the skin and also skin temperature were attached on the back surface of the wearable device. The purpose of the sensors is to detect the onset of loss of conformity between the wearable device and the skin, flagging the occurrence of the MAs.
Table 3 presents commercially available wearable devices, including brands such as Apple, Fitbit, Garmin and others, highlighting their technical details, such as sensors, MCUs, dimensions and measurement capabilities. The table lists the advanced health monitoring features of these devices, e.g., the monitoring of heart rate, sleep tracking and stress detection, among others. However, it should be taken into account that the parameter the device is designed to measure is not always represented as an actual output. The output parameters are often not calculated on the device itself, but rather using Android applications that analyze the measured data.
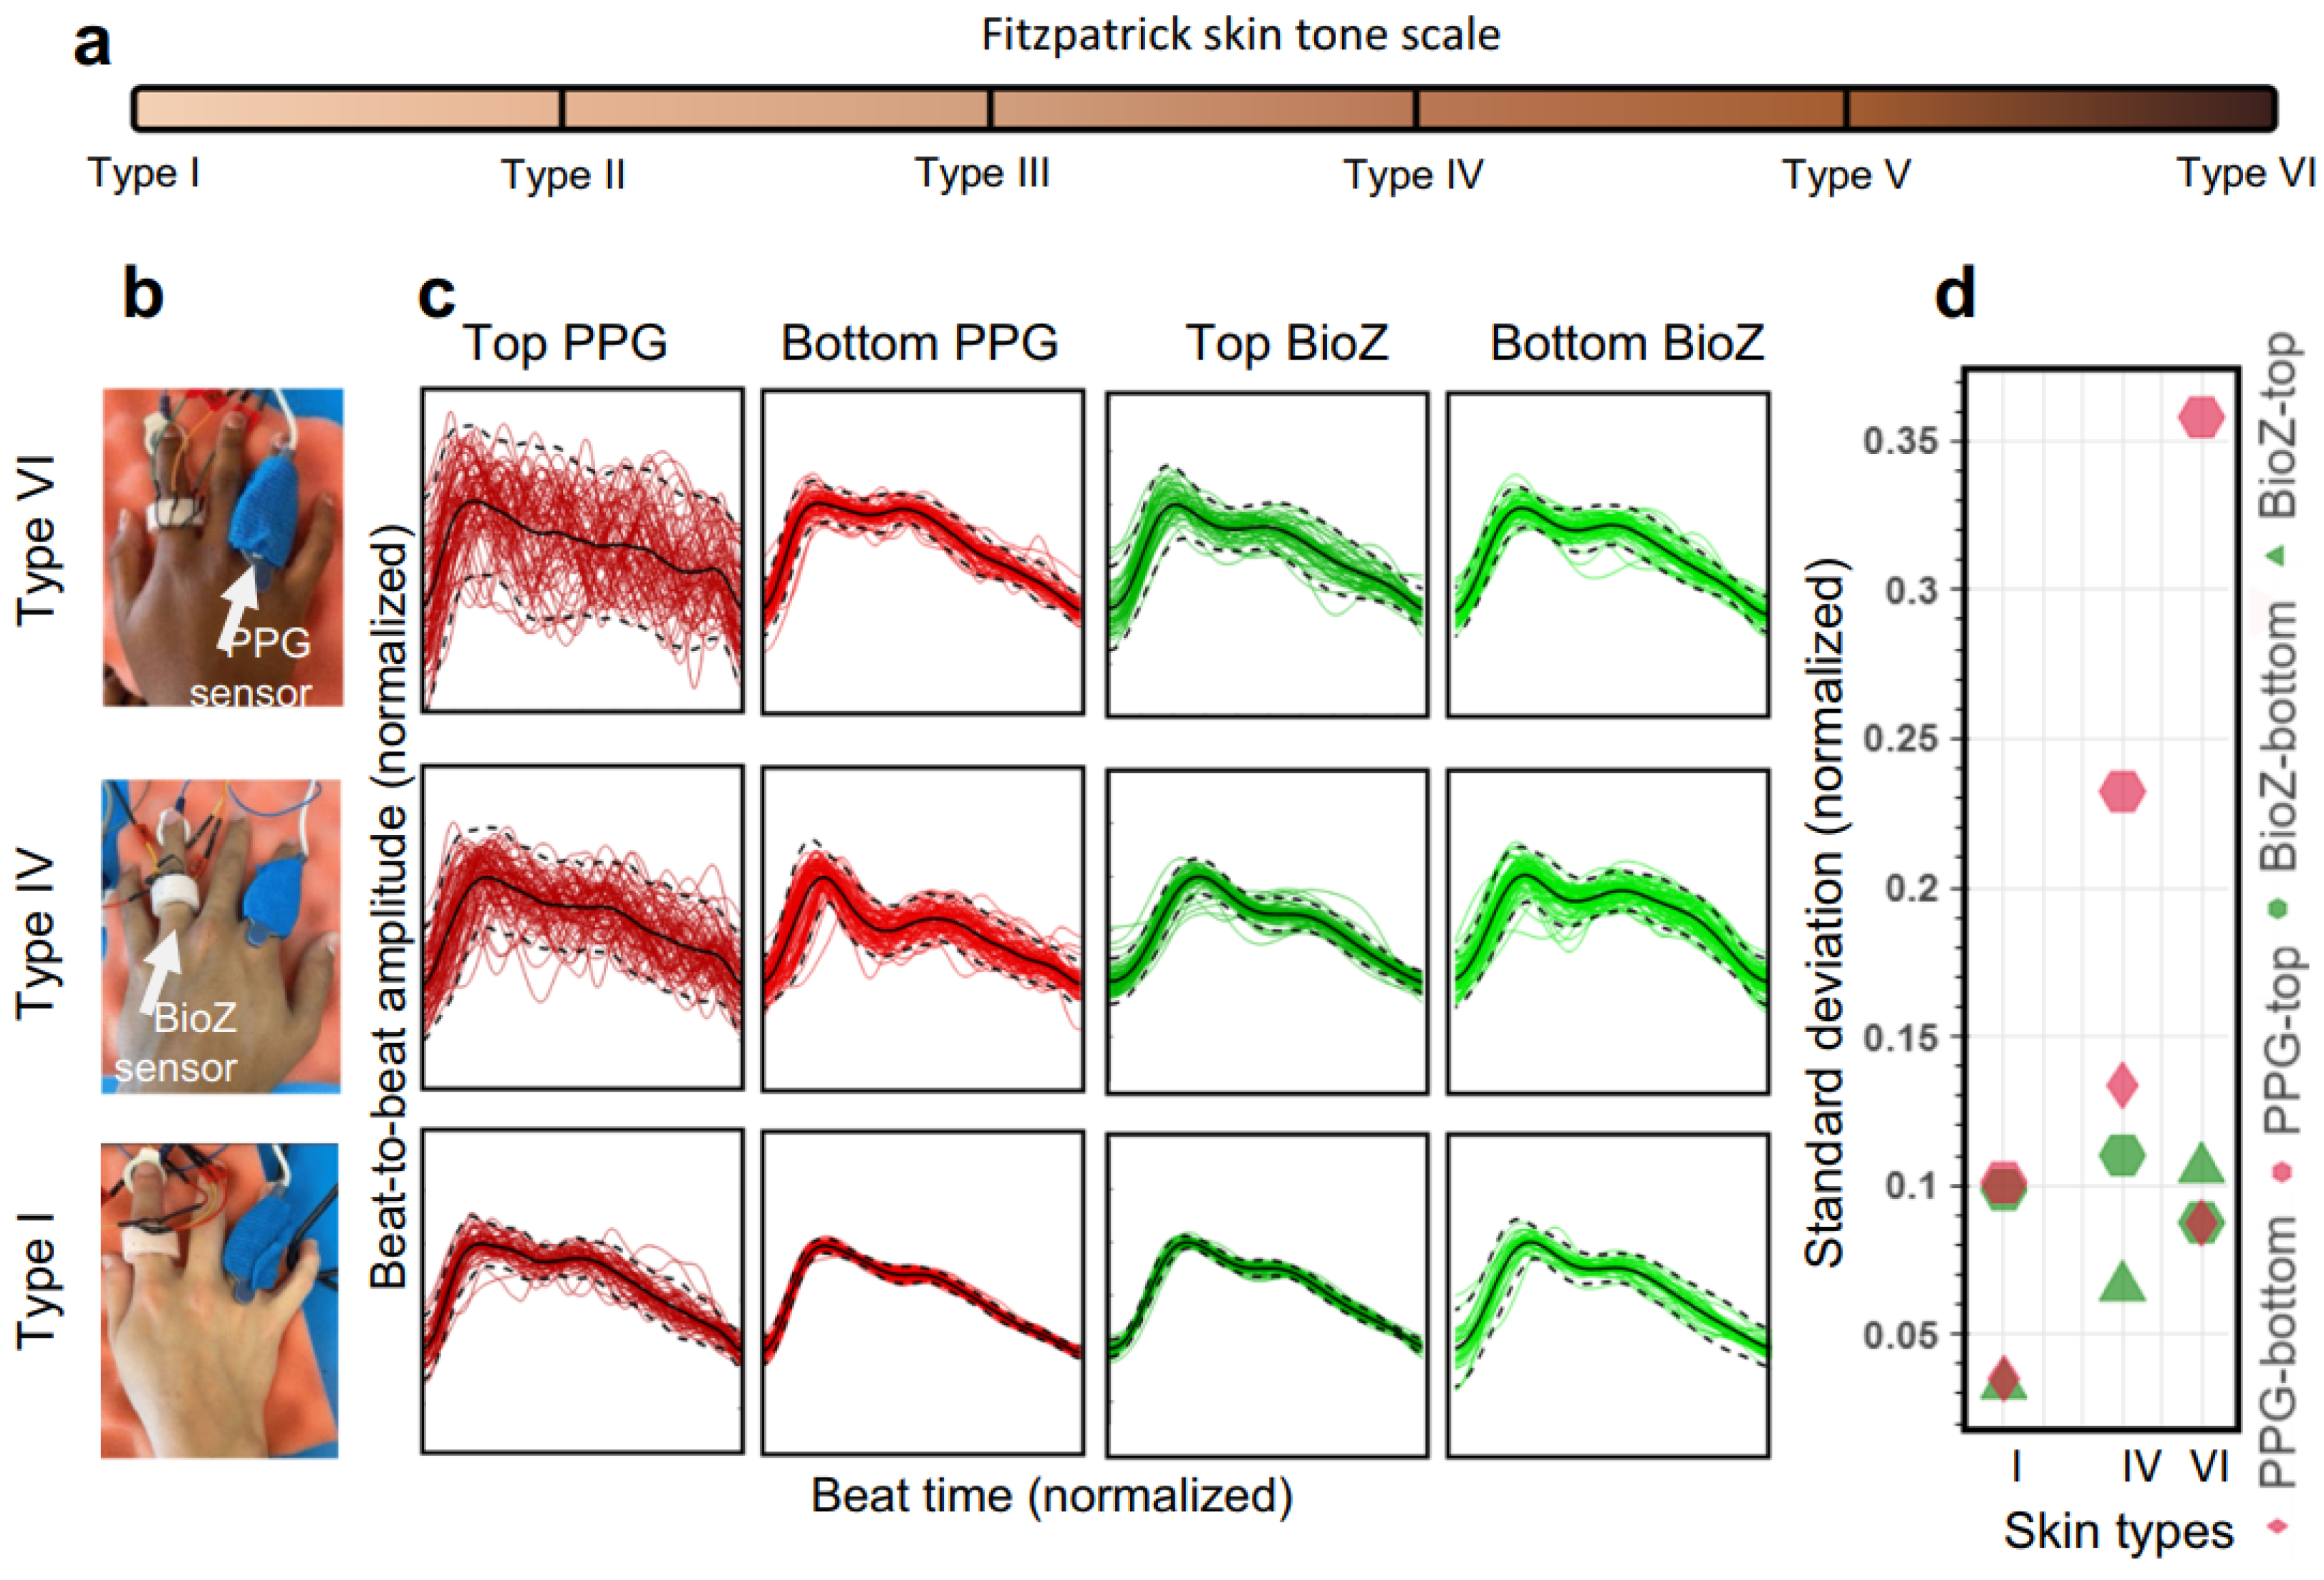
Even though the implementation of clinical wearable devices mentioned above was conducted in a controlled environment, thereby creating intrinsic biases in the results when compared to the real world implementation [34], the major limitation of the PPG-based systems is poor signal quality due to the shallow penetration of light [140] for people with varying skin-tones [141,142,143], body-mass index [144] and skin temperature [145]. The effect of skin tones on the measured blood volume changes using a PPG-based system is shown in Figure 21. As the skin becomes darker, scatter of beat-to-beat amplitude values increases, rendering the PPG system inaccurate. In comparison, the effect of skin color on EBI systems is minimal.
Lastly, the manufactured PPG wearable devices have been tested on a sample size exceeding one hundred only in a handful of studies [40,146]. Hence, until the sample size is increased, the reliability of these studies will remain questionable [7].

6.2. Bioimpedance-Based Devices

Sensing arterial blood flow via the bioimpedance is provided when electrodes are firmly attached to the skin and aligned with the underlying arteries [12]. On the other hand, other setups exist. For example, focused impedance measurements [147]. Compared to the bipolar electrode configuration, it is possible to capture and thus remove electrical impedance caused by the contact between the skin and the electrodes using the tetrapolar configuration [148]. Even though there are existing EBI wearable devices for measuring respiratory rate that are put on the chest, such as Sensium [149] and Equivital [150], the technology for wearable heart rate monitoring has not been developed. Despite the attempts of Jawbone to introduce a new activity tracker with a heart rate sensor [151], this project was discontinued presumably due to a unreliable performance caused by MAs. Nevertheless, some research efforts to design wearable EBI devices for bioparameter monitoring can be found. The main components of a wearable EBI measurement system are demodulation to extract the real and imaginary part of EBI modulus and phase components, analog/digital filtering to separate the static and time-dependent components of the EBI. These components are depicted in Figure 22a. A demodulation block can be implemented either with standard demodulators (as in Figure 22a) (cannot be used for a continuous monitoring), synchronous sampling [152] (guarantees very low power consumption at a high cost [14]) or gain and phase detection [153], but all these approaches require at least two channels, resulting in an increase in consumption, cost and size [14]. Another key component is instrumentation amplifier (IA). Its bandwidth has to be large, since typically the working frequency for EBI systems is in a range from tens of kilo-hertz to mega-hertz. High bandwidth implies an increase in power consumption and also in cost [14]. The same concept applies also to the current driver. In order to obtain small measurement errors, the output impedance has to be as high as possible—the higher the output impedance, the lower the dependence of the current amplitude on the load. Since the load is constituted by electrodes to tissue impedance, it can vary a lot with frequency, electrode size and type, contact quality, and so on. If the operational amplifier can be approximated as ideal, high output impedance of voltage-to-current converters (VI converters) can be achieved. However, this output impedance quickly decreases with the increase in frequency, because of the limited gain-bandwidth product (GBP) of the operational amplifier. Therefore, a very high GBP is needed also for a 50 kHz working frequency [154], resulting in high current consumption. To relax the requirements for the current driver output impedance, current sensing is sometimes used at the cost of two instrumentation amplifiers [14]. The authors of [14] proposed a new hardware architecture for EBI measurements as shown in Figure 22b. Here, a 50 kHz driving current with a square waveform is filtered into a sinusoidal waveform using a second-order low-pass filter. A VI converter is used to drive the current in the body. The demodulator is moved before the IA enabling IA to work on the baseband demodulated signal. This, in turn, dramatically reduces the bandwidth requirements reducing power consumption and cost. Analog filtering is used to separate and amplify the AC coupled component Δ Z of the EBI before the analog-to-digital conversion (ADC). For relatively low working frequencies ( f m a x 100 kHz) a commercial integrated circuit chip AD5933 is one of the preferred options for impedance measurement [60].
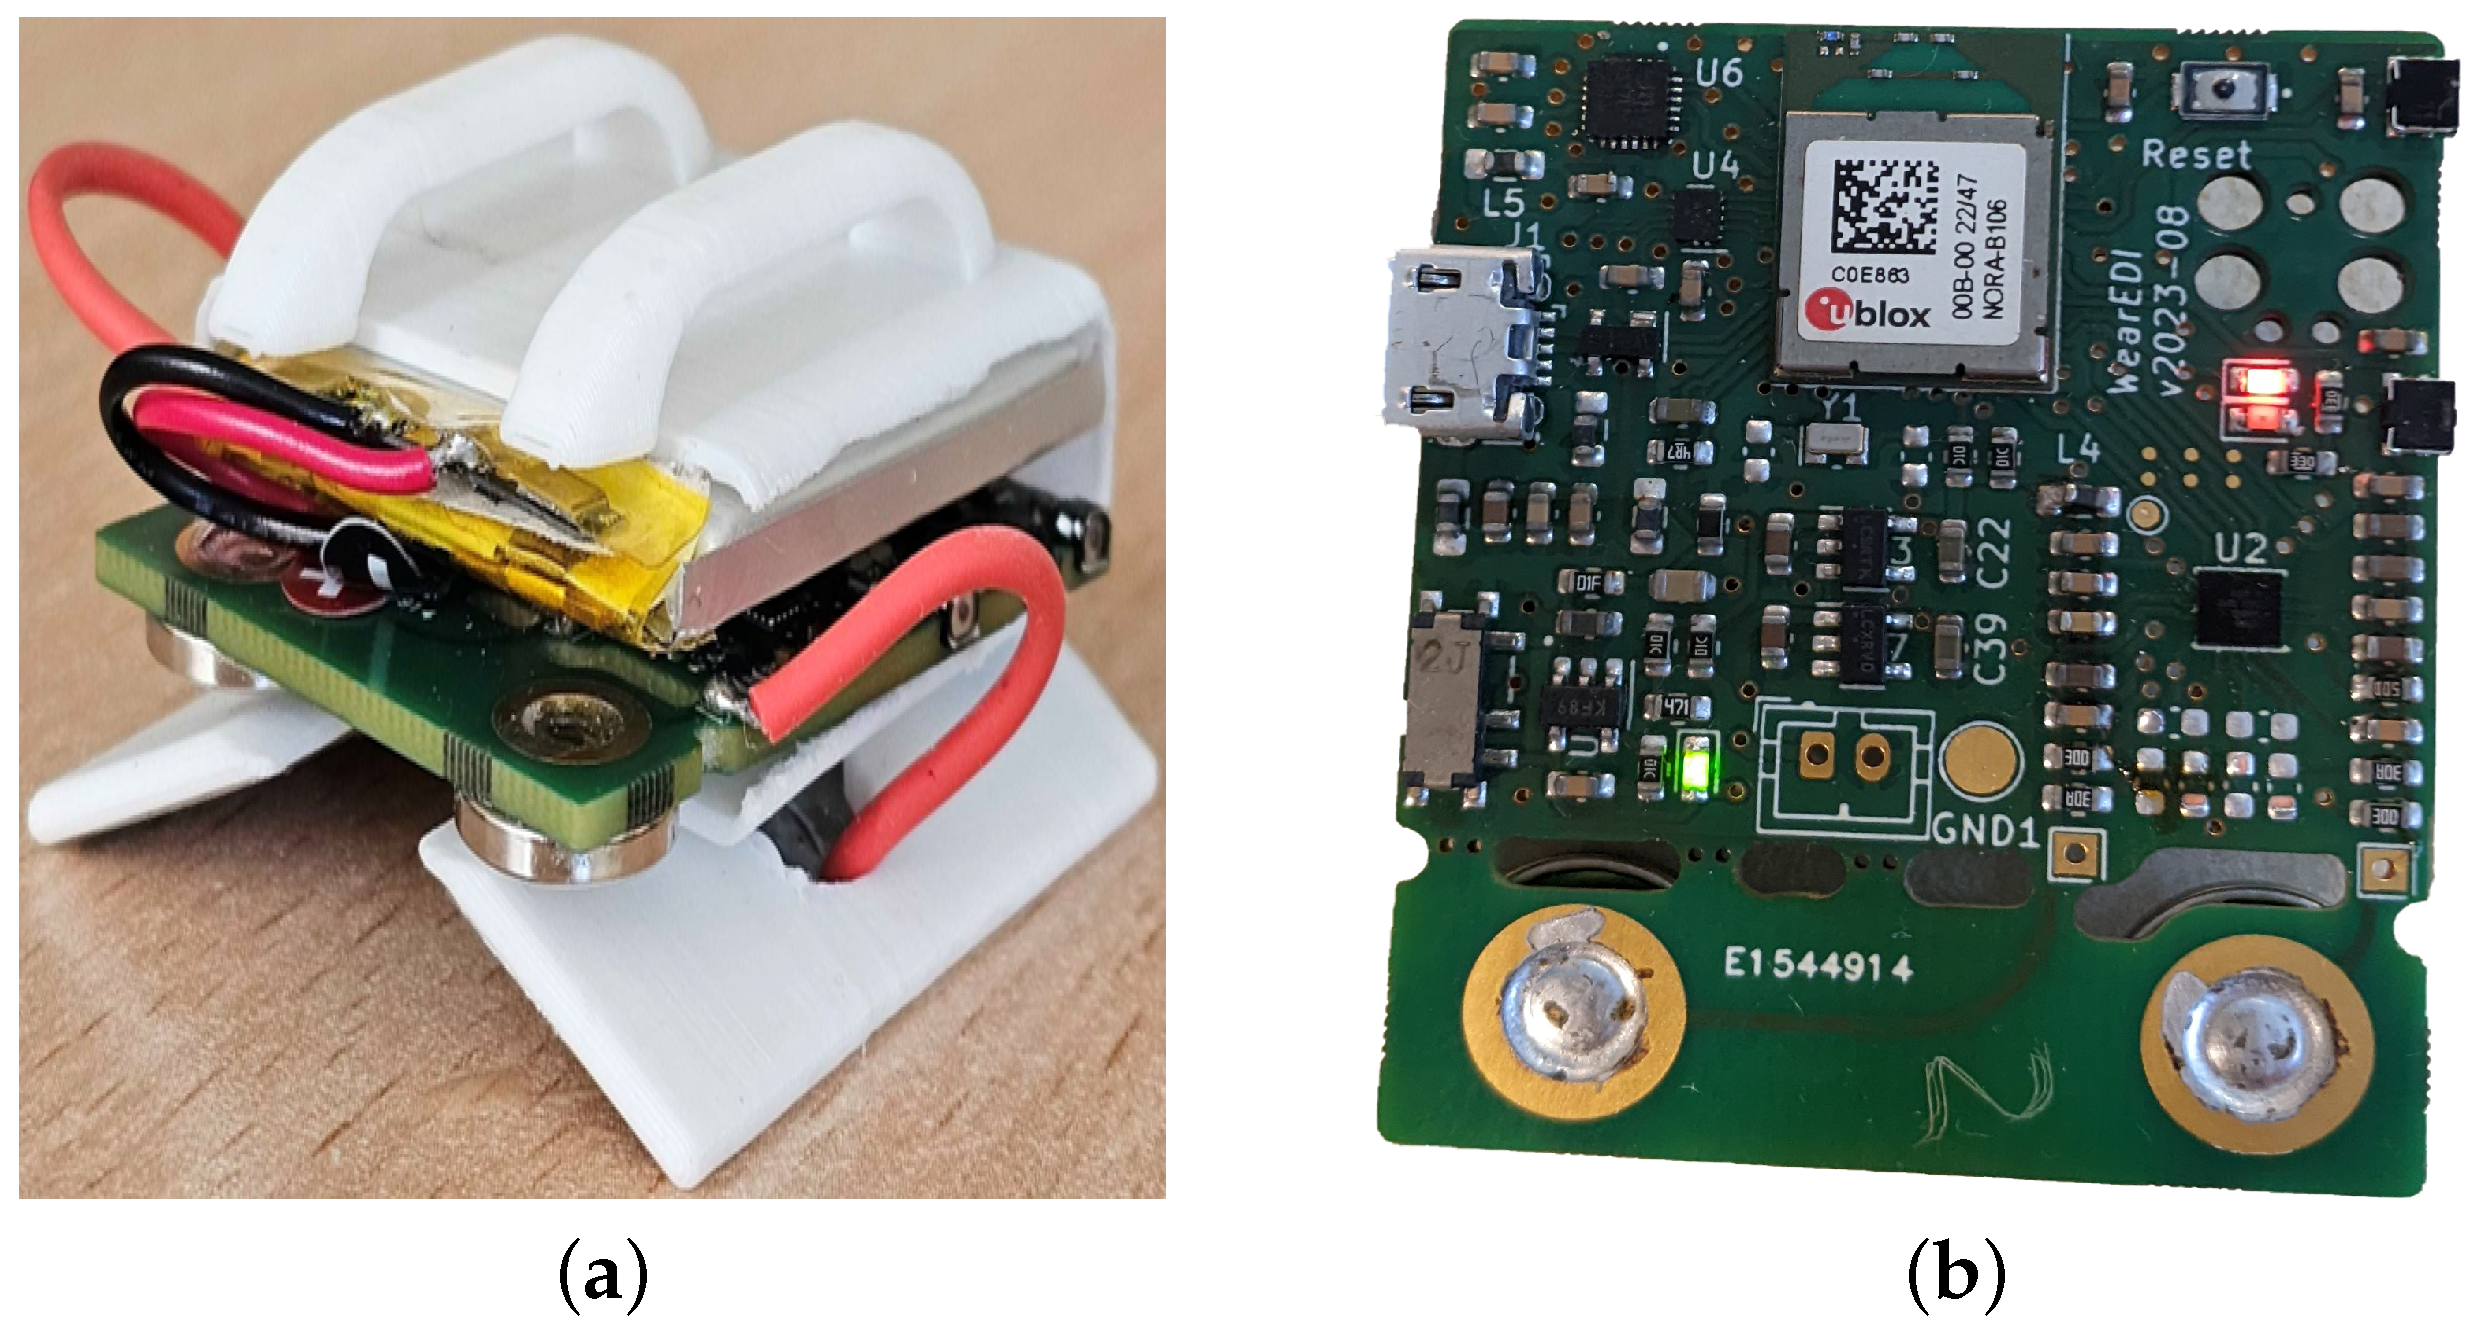
An in-house EBI measurement device designed in the Institute of Electronics and Computer Science in Latvia is a wrist-worn wearable device [155] with a functionality to evaluate physiological parameters such as body composition, hydration levels, heart rate, and breathing (see in Figure 23). In this device, EBI sensing is combined with a nine-axial inertial measurement unit (IMU) sensor. At its core, the device features the nRF5340 System-on-Chip (SoC), which is notable for its dual-core ARM Cortex-M33 architecture, offering robust performance for complex computational tasks. It also incorporates the MAX30001 bioimpedance chip for precise physiological parameter monitoring and the ICM-20994 nine-axial IMU chip, which includes accelerometer, gyroscope, and magnetometer sensors for detailed motion tracking. Power flexibility is ensured through a Li-ion battery, which can be recharged via USB, providing versatility in usage scenarios. For user interaction and feedback, the device is equipped with LEDs, enhancing the user experience through visual signals and tactile feedback. Additional on-board storage is made possible with external flash memory and a microSD card, allowing for extensive data collection and retention. Lastly, a user button facilitates easy interaction with the device, making it user-friendly and accessible for a wide range of applications.
Signals measured with the EBI technique are affected by three main factors:
  • Electrode–skin interface (see Section 5.1.1).
  • Characteristics of the alternating current of excitation. The important parameters are the frequency [156] and amplitude of excitation current.
  • The measured bioimpedance signal is affected by the type of tissues and the physiological and physiochemical variations that occur within the tissues [156].
The main challenges related to validity of using EBI-based wearable solutions for cardiac parameter monitoring and impeding the translation of this powerful technology to practice can be divided in two main categories:
  • The difficulty of acquiring a signal of high enough quality due to:
    1.1.
    Patient-related issues—spontaneous movements of the patient, micro-movements that are not controllable, disorders of heart rhythm [156]. Movement with an amplitude above a certain threshold may cause MAs severely degrading reliability of the estimated bioparameters.
    1.2.
    Inherently low signal-to-noise ratio of the technique [157] thereby establishing a reliable, long-lasting and firm contact interface between the electrodes and the skin is of prime importance [18]. On a hardware/software level, signal pre-processing steps involving noise filtration with filters and algorithms is necessary. One solution of obtaining a signal with strength above a background noise is performing measurements of the systolic and diastolic impedance variations close to the ascending thoracic aorta [157]. This approach, however, is limited by the empirical nature and sensitivity to electrode positioning and calibration inherent in the method [158].
  • Changes in the baseline impedance levels when direct comparisons to a healthy state are no longer valid due to physiologic and pathophysiologic conditions, such as pregnancy, obesity, gas or fluid pleural effusion, chronic congestive heart failure with pulmonary edema, or when there is severe aortic valve disease or modified mechanical properties of the arterial tree [157].
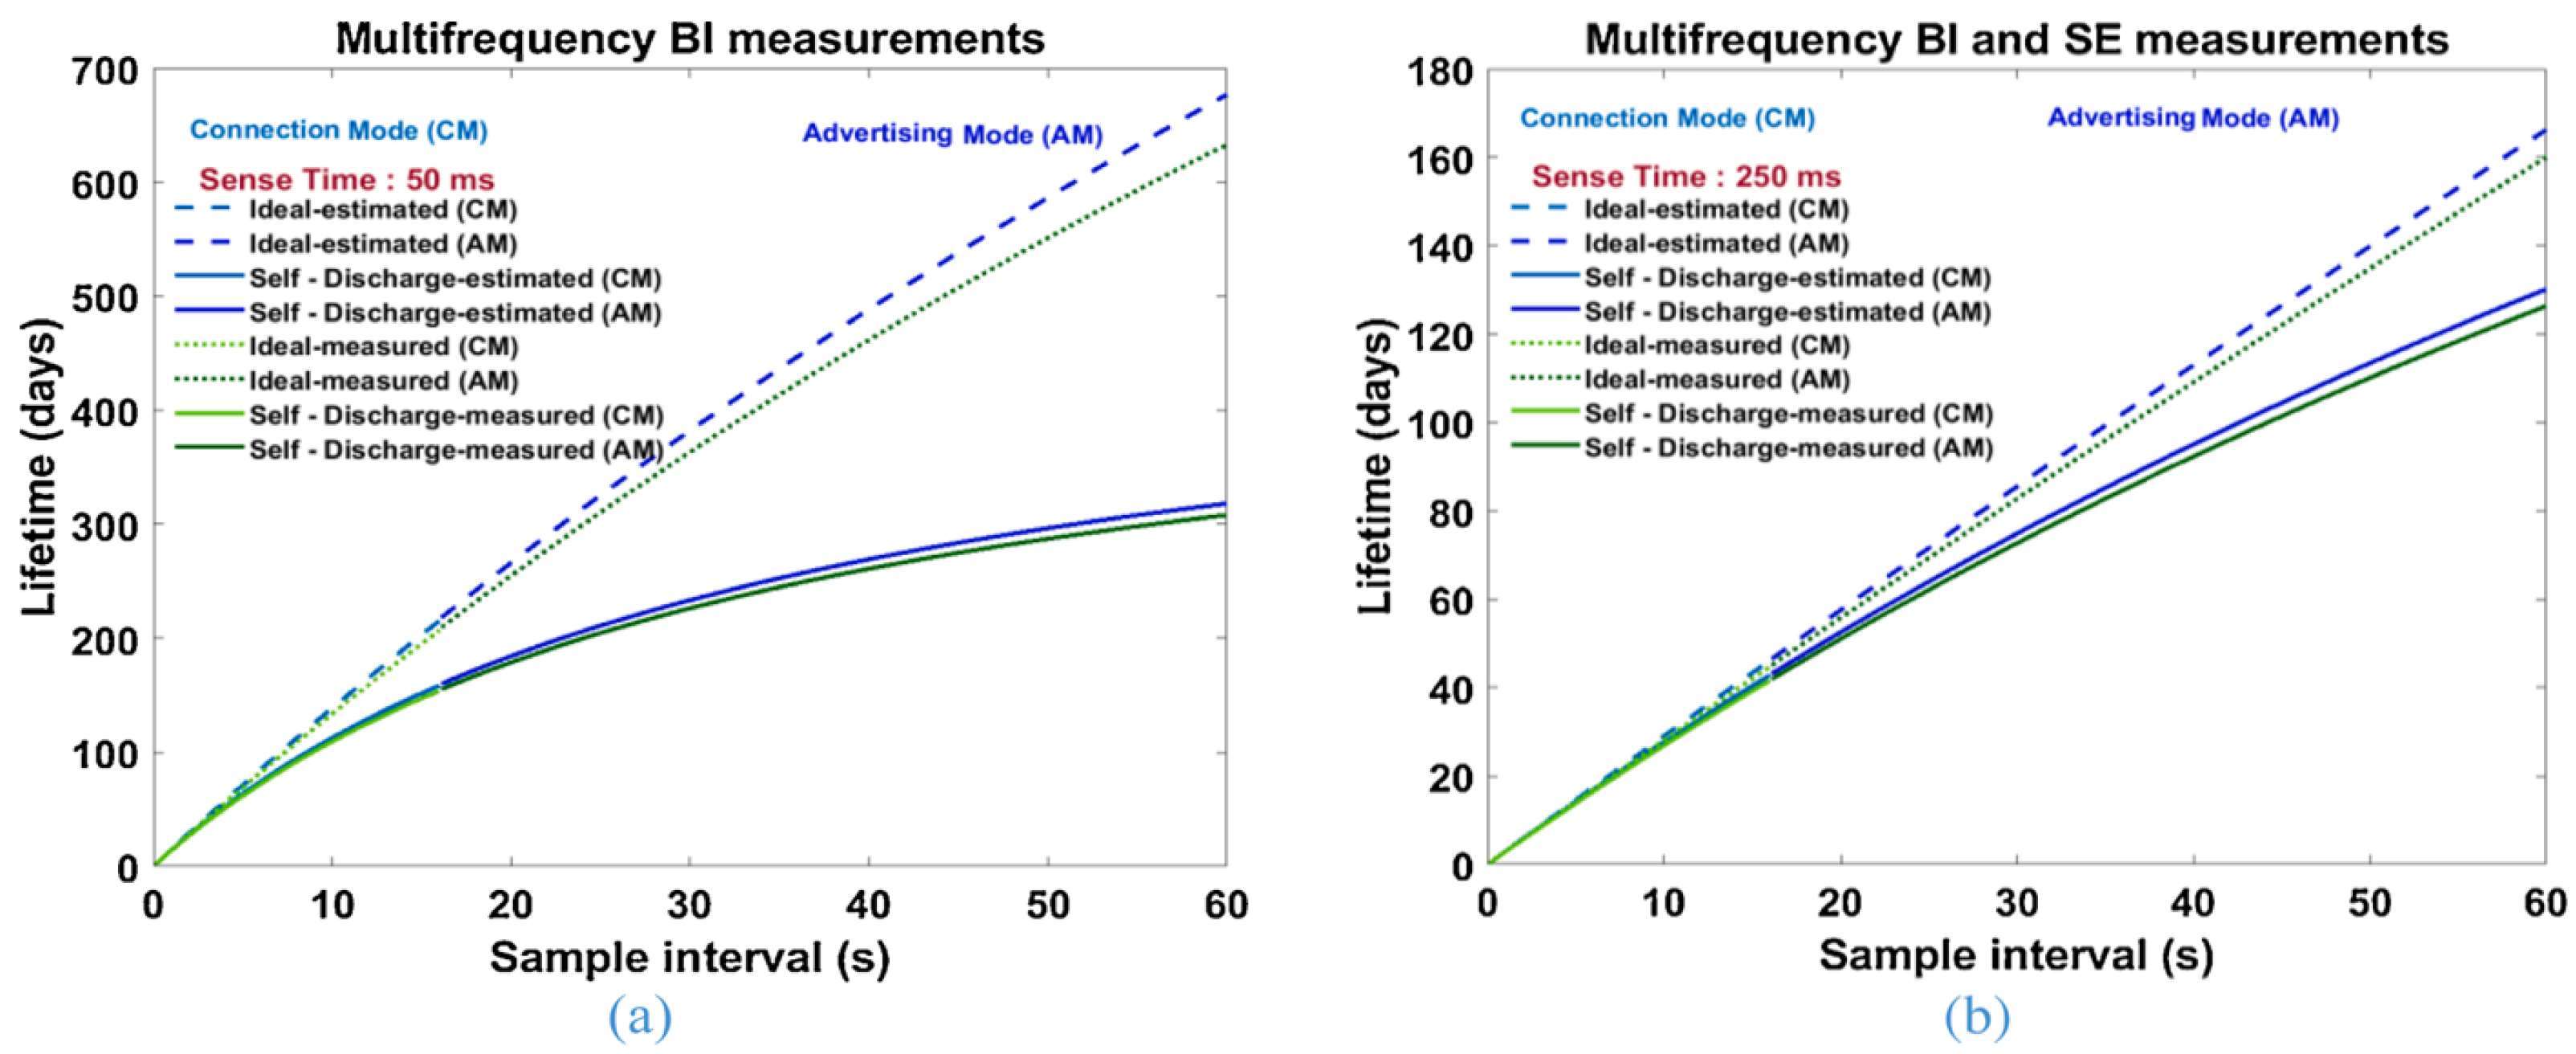
Another crucial factor to consider when designing a wearable device is choosing the power source. This is a major challenge in enabling a large-scale implementation of wearable EBI-based devices as these systems have higher power consumption requirements when compared to other wearable systems [13]. At present, most of these devices are powered with batteries which not only make the wearable design bulky but also necessitates regular battery replacement or periodic charging [159,160]. This leads to an interruption in normal usage, loss of potentially critical data and environmental pollution due to battery disposal [161]. Hence, EBI devices are not optimized for autonomous long-term operation. One of the reasons is high power consumption of the circuitry in active mode. A potential remedy is to design the front-end of the EBI sensors specifically for low power consumption, as well as to implement power management strategies that are able to increase the energy efficiency of the whole system, resulting in longer battery lifetime [13]. The reduction of power consumption can be obtained by reducing the power duty-cycle [162] (the time it takes to perform a single measurement set) of the measurements, or through application specific integrated circuit (ASIC) design [163]. The authors of [13] achieved a battery life (250 mAh Li-ion) of almost 1 year when measuring EBI only in multi-frequency mode (sense time: 50 ms) and of almost 4 months when measuring EBI in both multi-frequency mode and also skin–electrode impedance (sense time: 250 ms), respectively (see Figure 24). The authors concluded that battery life is mainly limited by the battery’s discharge model.
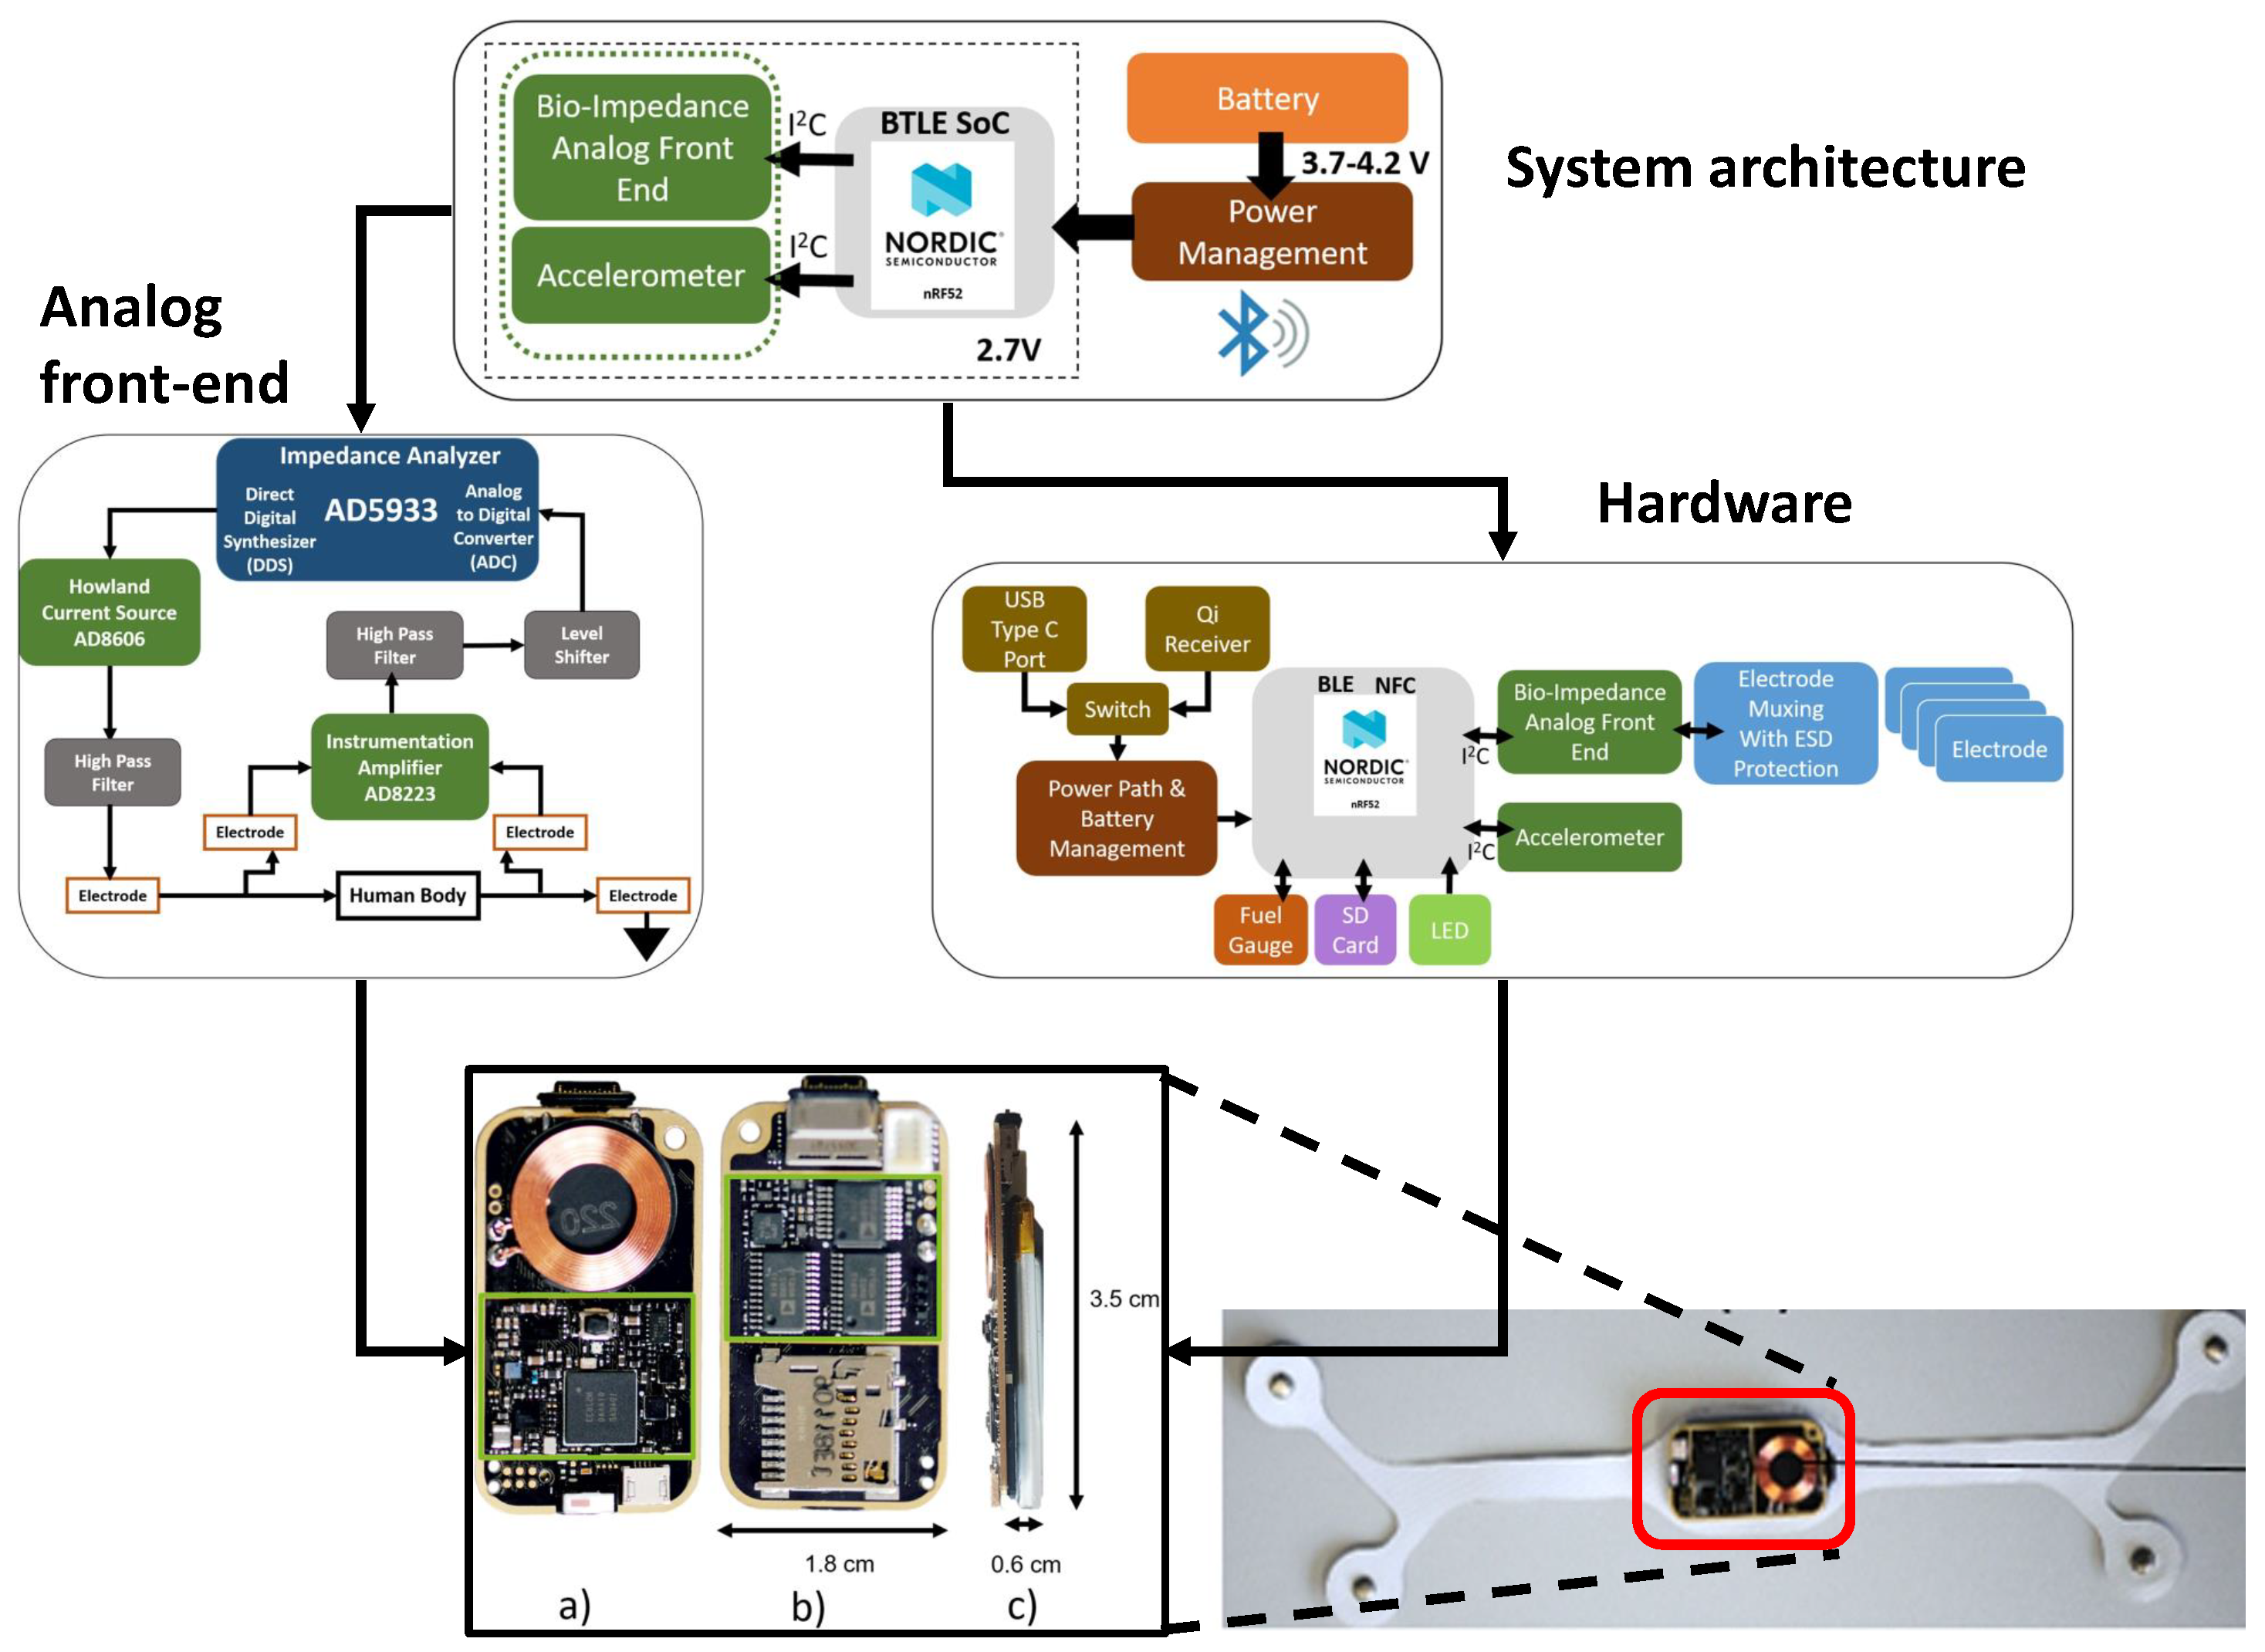
Several attempts of optimization of power consumption are reported in the literature. In [164], power reduction and stability improvement had been achieved by decreasing the excitation current tenfold compared to the normally used value. However, this led to a decrease in the SNR affecting the accuracy of impedance calculation. The authors of [165] reported 30 h of EBI measuring monitor operation with rechargeable Li-ion battery and a form factor of 4.8 cm × 3 cm × 2 cm. Power consumption was optimized by designing a narrow bandwidth low-power VI converter. In [166], an EBI system performing only single-frequency (50 kHz) measurements over loads of 0–120 Ω achieved a total current consumption of about 750 μ A at 2.8 V. However, the sustainability of this device including the power for processing, storing and streaming of the data was not reported; hence, the total operational life of the system is unknown. Table 4 lists the state-of-the-art in EBI sensing wearable devices. The downside of these devices is that they need battery replacement or frequent periodic charging. However, in [13], the authors claimed that their system can operate several months without charging and without compromising sensor performance (see Figure 24). The architecture of their sensor node is shown in Figure 25. It consists of a system on chip (SoC) that includes an ARM Cortex-M4F microcontroller and Bluetooth 5.0 RF front-end, bio-impedance sensor node, accelerometers for motion detection and a power management system supplied by a Li-ion battery (3.7 V). The voltage supply is ±2.7 V [13].

7. Discussion and Concluding Remarks

This review has highlighted the state-of-the-art and challenges associated with wearable devices for heart rate (HR) estimation using photoplethysmography (PPG) and electrical bioimpedance (EBI) technologies. The key findings of the review are as follows:
  • PPG vs EBI. PPG-based devices are a comparatively mature technology with some commercial brands, while very few attempts have been made to design a wearable device for HR estimation based on EBI. However, compared to the PPG technology, devices based on EBI have the potential to provide a more accurate HR estimation due to the fact that skin tone affects properties of light absorption and reflection diminishing the reliability of PPG-based devices. On the other hand, wearable devices based on EBI face challenges related to power consumption and signal noise originating from a variety of sources including electromagnetic interference from electric circuitry, electrode size and material, levels of skin hydration and quality of contact between skin and surface of electrodes. Advances in flexible, self-adhesive materials have shown potential in enhancing sensor–skin contact, thereby improving signal quality. However, the integration of flexible substrates with rigid electronic components poses significant challenges, often leading to connection failures. Therefore, ongoing research into material science and engineering is vital to overcoming these hurdles. All in all, EBI-based devices have the potential to become mainstream once the electrode properties are carefully tailored to the general user.
  • Design of wearable devices. The development of low-power consumption strategies, such as those employing multi-frequency EBI measurements and modifications in hardware design, for example, demodulation and current driver blocks, have been essential in extending the operational life of wearable devices. Despite these advancements, achieving a balance between power efficiency and high signal-to-noise ratio remains a critical area for further research and development. Until a breakthrough in power source development is achieved, the key question concerning wearable device progress is energy efficiency. The energy demand is primarily related to the computation complexity—a trade-off with edge computing, i.e., the speed of data representation and battery duration has to be considered. Solutions exist, in the form of analog edge computing-based machine learning [167], or relying on an analog circuit design [168].
  • Motion artifact removal. Accurate HR estimation can easily be sabotaged by motion artifacts (MA). Various noise filtering and MA removal techniques have been employed to mitigate these issues, including band-pass filters and advanced algorithms that utilize supplementary signals for more precise correction. The algorithms most commonly employed in the literature include the ones based on signal decomposition—wavelet transform, empirical mode decomposition and Fourier decomposition. Then the user discards the components that are not related to the signal itself. Another group of methods is based on signal subtraction in the frequency domain (spectral subtraction). This approach, however, requires an estimation of heart rate frequency and detects deviations from it. This may pose a problem, since the assumption of a normal heart rate to be 1 Hz may not be generalized over all cases.
  • Heart rate estimation. The mainstream algorithms for HR estimation are TROIKA and JOSS and others directly derived from these two. The reason is that these algorithms have proven to be fairly accurate and effective. Nonetheless, the implementation of TROIKA and JOSS into a wearable device is a challenging task, since these algorithms rely on heavy mathematical computations. Hence, the processing unit and, again, power consumption of the wearable device, pose challenges.
  • Potential for a more complete hemodynamic monitoring. Apart from the HR estimation, PPG and EBI techniques have remarkable potential to also provide information on numerous other hemodynamic parameters. Such data, including the hemodynamic feature points, denoting, e.g., left ventricular ejection time (LVET) or pulse transit time (PTT), can be utilized already in performing prognostic and diagnostic tasks. However, for such operations, where the differentiation of the signal is performed, the signal quality is of paramount importance. Indeed, up to four derivatives of the PPG signal [169] and first derivative of EBI signal [170] have been studied in order to evaluate the heart and cardiovascular health.
To conclude, the motivation behind the integration of the PPG and EBI technologies into wearable devices is that the status of cardiovascular health can be continuously monitored in a non-invasive manner. Today’s modalities of wearable devices, such as wrist-worn devices, bracelets, rings and even tattoos have made this process convenient to the user. This has substantial potential in transforming cardiovascular health monitoring. The development of energy-efficient, accurate, and robust wearable sensors is paramount in addressing the current limitations and enhancing the practical applications of these technologies. Future research should focus on optimizing power consumption without compromising measurement accuracy, improving noise filtering and MA removal techniques, and developing innovative materials that enhance sensor reliability and comfort. Collaborative efforts between material scientists, engineers, and healthcare professionals will be essential in driving the next generation of wearable health monitoring devices, ultimately contributing to improved health outcomes and patient care.

Author Contributions

Conceptualization, D.L. and R.J.; methodology, D.L. and R.J.; validation, D.L. and R.J. and M.M.; investigation, D.L. and R.J.; writing—original draft preparation, D.L. and R.J.; writing—review and editing, D.L., R.J., M.M. and L.S.; visualization, D.L. and R.J.; supervision, L.S.; project administration, L.S. All authors have read and agreed to the published version of the manuscript.

Funding

This research has been received funding in part by the European Union through the Project PRAESIIDIUM “Physics Informed Machine Learning-Based Prediction and Reversion of Impaired Fasting Glucose Management” (call HORIZON-HLTH-2022-STAYHLTH-02) under Grant 101095672, in part by the European Union, and in part by the Estonian Research Council grant PRG1483.

Acknowledgments

We wish to express our sincere thanks to Atis Elsts from Institute of Electronics and Computer Science for his pivotal guidance and expertise during the initial phases of our project.

Conflicts of Interest

The authors declare no conflicts of interest.

Abbreviations

The following abbreviations are used in this article:
ACCAccelerometer
ADCAnalog-to-Digital Converter
ADTAdaptive Detection Threshold
ASICApplication Specific Integrated Circuit
BioZBioimpedance
BLEBluetooth Low Energy
BVPBlood Volume Pulse
CVDCardiovascular disease
ECGElectrocardiogram
EBIElectrical Bioimpedance
EDAElectrodermal Activity Sensor
EEMDExtended Empirical Mode Decomposition
EMDEmpirical Mode Decomposition
FDFourier Decomposition
FIBFFourier Intrinsic Band Functions
GBPGain-Bandwidth Product
GyroGyroscope
HRHeart Rate
ICAIndependent Component Analysis
IMUInertial Measurement Unit
IoTInternet of Things
IRInfra Red
IIRInfinite Impulse Response
LCDLiquid Crystal Display
LEDLight-Emitting Diode
LSMLeast Mean Squares
LVETLeft Ventricular Ejection Time
MAMoving Artifacts
MCUMicrocontrol Unit
MMVMultiple Measurement Vector
NLSMNormalized Least Mean Squares
NTCNegative Temperature Coefficient Sensor
PCAPrincipal Component Analysis
PATPulse Arrival Time
PCBPrinted Circuit Board
PPGPhotoplethysmography
PTTPulse wave Transit Time
RLSRecursive Least Squares
SMVSingle Measurement Vector
SNRSignal-to-Noise Ratio
SoCSystem On Chip
SSSpectral Subtraction
SSRSparse Signal Reconstruction
TermThermometer
TempeTemperature
WTWavelet Transform

References

  1. Cardiovascular Diseases. 2021. Available online: https://www.who.int/health-topics/cardiovascular-diseases/#tab=tab_1 (accessed on 23 July 2024).
  2. Cardiovascular Diseases (CVDs). 2021. Available online: https://www.who.int/en/news-room/fact-sheets/detail/cardiovascular-diseases-(cvds) (accessed on 23 July 2024).
  3. Umer, M.; Aljrees, T.; Karamti, H.; Ishaq, A.; Alsubai, S.; Omar, M.; Bashir, A.K.; Ashraf, I. Heart failure patients monitoring using IoT-based remote monitoring system. Sci. Rep. 2023, 13, 19213. [Google Scholar] [CrossRef] [PubMed]
  4. Chatzopoulos, G.S.; Jiang, Z.; Marka, N.; Wolff, L.F. Periodontal disease, tooth loss, and systemic conditions: An exploratory study. Int. Dent. J. 2024, 74, 207–215. [Google Scholar] [CrossRef]
  5. Hershman, S.G.; Bot, B.M.; Shcherbina, A.; Doerr, M.; Moayedi, Y.; Pavlovic, A.; Waggott, D.; Cho, M.K.; Rosenberger, M.E.; Haskell, W.L.; et al. Physical activity, sleep and cardiovascular health data for 50,000 individuals from the MyHeart Counts Study. Sci. Data 2019, 6, 24. [Google Scholar] [CrossRef]
  6. Williams, G.J.; Al-Baraikan, A.; Rademakers, F.E.; Ciravegna, F.; van de Vosse, F.N.; Lawrie, A.; Rothman, A.; Ashley, E.A.; Wilkins, M.R.; Lawford, P.V.; et al. Wearable technology and the cardiovascular system: The future of patient assessment. Lancet Digit. Health 2023, 5, e467–e476. [Google Scholar] [CrossRef]
  7. Maiorana, E. A survey on biometric recognition using wearable devices. Pattern Recognit. Lett. 2022, 156, 29–37. [Google Scholar] [CrossRef]
  8. Babar, M.; Rahman, A.; Arif, F.; Jeon, G. Energy-harvesting based on internet of things and big data analytics for smart health monitoring. Sustain. Comput. Inform. Syst. 2018, 20, 155–164. [Google Scholar] [CrossRef]
  9. Kumar, A.; Komaragiri, R.; Kumar, M. Reference signal less Fourier analysis based motion artifact removal algorithm for wearable photoplethysmography devices to estimate heart rate during physical exercises. Comput. Biol. Med. 2022, 141, 105081. [Google Scholar]
  10. Shcherbina, A.; Mattsson, C.M.; Waggott, D.; Salisbury, H.; Christle, J.W.; Hastie, T.; Wheeler, M.T.; Ashley, E.A. Accuracy in wrist-worn, sensor-based measurements of heart rate and energy expenditure in a diverse cohort. J. Pers. Med. 2017, 7, 3. [Google Scholar] [CrossRef] [PubMed]
  11. Teng, X.F.; Zhang, Y.T.; Poon, C.C.; Bonato, P. Wearable medical systems for p-health. IEEE Rev. Biomed. Eng. 2008, 1, 62–74. [Google Scholar] [CrossRef]
  12. Martinsen, O.G.; Heiskanen, A. Bioimpedance and Bioelectricity Basics; Elsevier: Amsterdam, The Netherlands, 2023. [Google Scholar]
  13. Dheman, K.; Mayer, P.; Eggimann, M.; Schuerle, S.; Magno, M. ImpediSense: A long lasting wireless wearable bio-impedance sensor node. Sustain. Comput. Inform. Syst. 2021, 30, 100556. [Google Scholar]
  14. Rossi, S.; Pessione, M.; Radicioni, V.; Baglione, G.; Vatteroni, M.; Dario, P.; Della Torre, L. A low power bioimpedance module for wearable systems. Sensors Actuators A Phys. 2015, 232, 359–367. [Google Scholar] [CrossRef]
  15. Tronstad, C.; Elvebakk, O.; Staal, O.M.; Kalvøy, H.; Høgetveit, J.O.; Jenssen, T.G.; Birkeland, K.I.; Martinsen, Ø.G. Non-invasive prediction of blood glucose trends during hypoglycemia. Anal. Chim. Acta 2019, 1052, 37–48. [Google Scholar] [CrossRef]
  16. Alharbi, Y.; Alshrouf, A.; Mansouri, S. Heart rate monitoring using electrical impedance. In Proceedings of the 2021 Seventh International conference on Bio Signals, Images, and Instrumentation (ICBSII), Chennai, India, 25–27 March 2021; pp. 1–4. [Google Scholar]
  17. GmbH, M.M. Impedance Cardiography (ICG). Available online: https://www.medis.company/en/methods/impedance-cardiography (accessed on 13 July 2024).
  18. Sel, K.; Osman, D.; Huerta, N.; Edgar, A.; Pettigrew, R.I.; Jafari, R. Continuous cuffless blood pressure monitoring with a wearable ring bioimpedance device. Npj Digit. Med. 2023, 6, 59. [Google Scholar] [CrossRef]
  19. Redisch, W. Electrical impedance plethysmography. Chest 1971, 59, 36. [Google Scholar] [CrossRef]
  20. Cheney, M.; Isaacson, D.; Newell, J.C. Electrical impedance tomography. SIAM Rev. 1999, 41, 85–101. [Google Scholar] [CrossRef]
  21. Baumgartner, R.N.; Chumlea, W.C.; Roche, A.F. Bioelectric impedance phase angle and body composition. Am. J. Clin. Nutr. 1988, 48, 16–23. [Google Scholar] [CrossRef]
  22. Bernstein, D.P. Continuous noninvasive real-time monitoring of stroke volume and cardiac output by thoracic electrical bioimpedance. Crit. Care Med. 1986, 14, 898–901. [Google Scholar] [CrossRef]
  23. Poon, C.; Chung, Y.; Choy, T.; Pang, J. Evaluation of two noninvasive techniques for exercise ventilatory measurements. In Proceedings of the Annual International Conference of the IEEE Engineering in Medicine and Biology Society, New Orleans, LA, USA, 4–7 November 1988; pp. 823–824. [Google Scholar]
  24. Thangathurai, D.; Charbonnet, C.; Roessler, P.; Wo, C.C.; Mikhail, M.; Yoshida, R.; Shoemaker, W.C. Continuous intraoperative noninvasive cardiac output monitoring using a new thoracic bioimpedance device. J. Cardiothorac. Vasc. Anesth. 1997, 11, 440–444. [Google Scholar] [CrossRef]
  25. Wang, F.T.; Chan, H.L.; Wang, C.L.; Jian, H.M.; Lin, S.H. Instantaneous respiratory estimation from thoracic impedance by empirical mode decomposition. Sensors 2015, 15, 16372–16387. [Google Scholar] [CrossRef]
  26. Piuzzi, E.; Capuano, A.; Pisa, S.; Cappa, P.; Patané, F.; Rossi, S.; Giaquinto, N.; D’Aucelli, G.M. Impedance plethysmography system with inertial measurement units for motion artefact reduction: Application to continuous breath activity monitoring. In Proceedings of the 2015 IEEE International Symposium on Medical Measurements and Applications (MeMeA) Proceedings, Turin, Italy, 7–9 May 2015; pp. 386–390. [Google Scholar]
  27. Luna-Lozano, P.S.; García-Zetina, O.A.; Pérez-López, J.A.; Alvarado-Serrano, C. Portable device for heart rate monitoring based on impedance pletysmography. In Proceedings of the 2014 11th International Conference on Electrical Engineering, Computing Science and Automatic Control (CCE), Ciudad del Carmen, Mexico, 29 September–3 October 2014; pp. 1–4. [Google Scholar]
  28. Metshein, M. A device for measuring the electrical bioimpedance with variety of electrode placements for monitoring the breathing and heart rate. In Proceedings of the 2015 26th Irish Signals and Systems Conference (ISSC), Carlow, Ireland, 24–25 June 2015; pp. 1–4. [Google Scholar]
  29. Pittella, E.; Pisa, S.; Piuzzi, E.; Rizzuto, E.; Del Prete, Z. Combined impedance plethysmography and spectroscopy for the diagnosis of diseases of peripheral vascular system. In Proceedings of the 2017 IEEE International Symposium on Medical Measurements and Applications (MeMeA), Rochester, MN, USA, 7–10 May 2017; pp. 367–372. [Google Scholar]
  30. Irzmańska, E.; Padula, G.; Irzmański, R. Impedance plethysmography as a tool for assessing exertion-related blood flow changes in the lower limbs in healthy subjects. Measurement 2014, 47, 110–115. [Google Scholar] [CrossRef]
  31. Huynh, T.H.; Jafari, R.; Chung, W.Y. An accurate bioimpedance measurement system for blood pressure monitoring. Sensors 2018, 18, 2095. [Google Scholar] [CrossRef] [PubMed]
  32. Patterson, R. Fundamentals of impedance cardiography. IEEE Eng. Med. Biol. Mag. 1989, 8, 35–38. [Google Scholar] [CrossRef]
  33. Yazdanian, H.; Mahnam, A.; Edrisi, M.; Esfahani, M. Design and Implementation of a Portable Impedance Cardiography System for Noninvasive Stroke Volume Monitoring. J. Med. Signals Sens. 2016, 6, 47–56. [Google Scholar] [CrossRef]
  34. Ming, D.K.; Sangkaew, S.; Chanh, H.Q.; Nhat, P.T.; Yacoub, S.; Georgiou, P.; Holmes, A.H. Continuous physiological monitoring using wearable technology to inform individual management of infectious diseases, public health and outbreak responses. Int. J. Infect. Dis. 2020, 96, 648–654. [Google Scholar] [CrossRef] [PubMed]
  35. Tamura, T. Current progress of photoplethysmography and SPO2 for health monitoring. Biomed. Eng. Lett. 2019, 9, 21–36. [Google Scholar] [CrossRef]
  36. Shin, H.S.; Lee, C.; Lee, M. Adaptive threshold method for the peak detection of photoplethysmographic waveform. Comput. Biol. Med. 2009, 39, 1145–1152. [Google Scholar] [CrossRef]
  37. Xiaotian, M.; Guo, R.; Zhang, C.; Yan, J.; Zhu, G.; Wu, W.; Yan, H.; Hong, L. An innovative approach for assessing coronary artery lesions: Fusion of wrist pulse and photoplethysmography using a multi-sensor pulse diagnostic device. Heliyon 2024, 10. [Google Scholar] [CrossRef]
  38. Yadav, U.; Abbas, S.N.; Hatzinakos, D. Evaluation of PPG biometrics for authentication in different states. In Proceedings of the 2018 International Conference on Biometrics (ICB), Gold Coast, QLD, Australia, 20–23 February 2018; pp. 277–282. [Google Scholar]
  39. Donida Labati, R.; Piuri, V.; Rundo, F.; Scotti, F.; Spampinato, C. Biometric recognition of PPG cardiac signals using transformed spectrogram images. In Proceedings of the International Conference on Pattern Recognition, Virtual, 10–11 January 2021; Springer: Cham, Switzerland, 2021; pp. 244–257. [Google Scholar]
  40. Hwang, D.Y.; Taha, B.; Lee, D.S.; Hatzinakos, D. Evaluation of the time stability and uniqueness in PPG-based biometric system. IEEE Trans. Inf. Forensics Secur. 2020, 16, 116–130. [Google Scholar] [CrossRef]
  41. Moço, A.V.; Stuijk, S.; De Haan, G. New insights into the origin of remote PPG signals in visible light and infrared. Sci. Rep. 2018, 8, 8501. [Google Scholar] [CrossRef]
  42. Radha, M.; Fonseca, P.; Moreau, A.; Ross, M.; Cerny, A.; Anderer, P.; Long, X.; Aarts, R.M. A deep transfer learning approach for wearable sleep stage classification with photoplethysmography. NPJ Digit. Med. 2021, 4, 135. [Google Scholar] [CrossRef]
  43. Castaneda, D.; Esparza, A.; Ghamari, M.; Soltanpur, C.; Nazeran, H. A review on wearable photoplethysmography sensors and their potential future applications in health care. Int. J. Biosens. Bioelectron. 2018, 4, 195. [Google Scholar]
  44. Cao, Y.; Zhang, Q.; Li, F.; Yang, S.; Wang, Y. PPGPass: Nonintrusive and secure mobile two-factor authentication via wearables. In Proceedings of the IEEE INFOCOM 2020-IEEE Conference on Computer Communications, Toronto, ON, Canada, 6–9 July 2020; pp. 1917–1926. [Google Scholar]
  45. Buekers, J.; Theunis, J.; De Boever, P.; Vaes, A.W.; Koopman, M.; Janssen, E.V.; Wouters, E.F.; Spruit, M.A.; Aerts, J.M. Wearable finger pulse oximetry for continuous oxygen saturation measurements during daily home routines of patients with chronic obstructive pulmonary disease (COPD) over one week: Observational study. JMIR MHealth UHealth 2019, 7, e12866. [Google Scholar] [CrossRef]
  46. Ekiz, D.; Can, Y.S.; Dardağan, Y.C.; Aydar, F.; Köse, R.D.; Ersoy, C. End-to-end deep multi-modal physiological authentication with smartbands. IEEE Sens. J. 2021, 21, 14977–14986. [Google Scholar] [CrossRef]
  47. Davies, H.J.; Bachtiger, P.; Williams, I.; Molyneaux, P.L.; Peters, N.S.; Mandic, D.P. Wearable in-ear PPG: Detailed respiratory variations enable classification of COPD. IEEE Trans. Biomed. Eng. 2022, 69, 2390–2400. [Google Scholar] [CrossRef] [PubMed]
  48. Loh, H.W.; Xu, S.; Faust, O.; Ooi, C.P.; Barua, P.D.; Chakraborty, S.; Tan, R.S.; Molinari, F.; Acharya, U.R. Application of photoplethysmography signals for healthcare systems: An in-depth review. Comput. Methods Programs Biomed. 2022, 216, 106677. [Google Scholar] [CrossRef] [PubMed]
  49. Allen, J. Photoplethysmography and its application in clinical physiological measurement. Physiol. Meas. 2007, 28, R1. [Google Scholar] [CrossRef] [PubMed]
  50. Vhaduri, S.; Poellabauer, C. Summary: Multi-modal biometric-based implicit authentication of wearable device users. arXiv 2019, arXiv:1907.06563. [Google Scholar]
  51. Nishan, A.; Raju, S.T.U.; Hossain, M.I.; Dipto, S.A.; Uddin, S.T.; Sijan, A.; Chowdhury, M.A.S.; Ahmad, A.; Khan, M.M.H. A continuous cuffless blood pressure measurement from optimal PPG characteristic features using machine learning algorithms. Heliyon 2024, 10. [Google Scholar] [CrossRef]
  52. Ding, X.R.; Zhang, Y.T.; Liu, J.; Dai, W.X.; Tsang, H.K. Continuous cuffless blood pressure estimation using pulse transit time and photoplethysmogram intensity ratio. IEEE Trans. Biomed. Eng. 2015, 63, 964–972. [Google Scholar] [CrossRef]
  53. Mohanalakshmi, S.; Sivasubramanian, A.; Swarnalatha, A. Predicting arterial stiffness from physiological characteristics of photoplethysmography signals quantified through second derivative. Indian J. Sci. Technol. 2017, 10, 104111. [Google Scholar] [CrossRef]
  54. Lee, J.; Kim, M.; Park, H.K.; Kim, I.Y. Motion Artifact Reduction in Wearable Photoplethysmography Based on Multi-Channel Sensors with Multiple Wavelengths. Sensors 2020, 20, 1493. [Google Scholar] [CrossRef] [PubMed]
  55. Liu, Z.J.; Xiang, T.; Zhou, R.S.; Ji, N.; Zhang, Y.T. A Multi-Channel Photoplethysmography Array with Contact-Force Regulation for Tonoarteriographic Imaging. Connect. Health Telemed. 2024, 3, 300001. [Google Scholar] [CrossRef]
  56. Cömert, A.; Hyttinen, J. Investigating the Possible Effect of Electrode Support Structure on Motion Artifact in Wearable Bioelectric Signal Monitoring. BioMed Eng. OnLine 2015, 14, 44. [Google Scholar] [CrossRef]
  57. Kõiv, H.; Pesti, K.; Min, M.; Land, R.; Must, I. Comparison of the Carbon Nanofiber-/Fiber- and Silicone-Based Electrodes for Bioimpedance Measurements. IEEE Trans. Instrum. Meas. 2020, 69, 1455–1463. [Google Scholar] [CrossRef]
  58. Dheman, K.; Mayer, P.; Magno, M.; Schuerle, S. Wireless, Artefact Aware Impedance Sensor Node for Continuous Bio-Impedance Monitoring. IEEE Trans. Biomed. Circuits Syst. 2020, 14, 1122–1134. [Google Scholar] [CrossRef] [PubMed]
  59. McAdams, E.; Jossinet, J.; Lacketmeier, A.; Risacher, F. Factors Affecting Electrode-Gel-Skin Interface Impedance in Electrical Impedance Tomography. Med. Biol. Eng. Comput. 1996, 34, 397–408. [Google Scholar] [CrossRef]
  60. Huang, J.; Zhang, Y.; Wu, J. Review of non-invasive continuous glucose monitoring based on impedance spectroscopy. Sens. Actuators A Phys. 2020, 311, 112103. [Google Scholar] [CrossRef]
  61. Lapsa, D.; Janeliukštis, R.; Elsts, A. Electrode Comparison for Heart Rate Detection via Bioimpedance Measurements. In Proceedings of the 2022 Workshop on Microwave Theory and Techniques in Wireless Communications (MTTW), Riga, Latvia, 5–7 October 2022; pp. 41–46. [Google Scholar]
  62. Sel, K.; Kireev, D.; Brown, A.; Ibrahim, B.; Akinwande, D.; Jafari, R. Electrical characterization of graphene-based e-tattoos for bio-impedance-based physiological sensing. In Proceedings of the 2019 IEEE Biomedical Circuits and Systems Conference (BioCAS), Nara, Japan, 17–19 October 2019; pp. 1–4. [Google Scholar]
  63. Kabiri Ameri, S.; Ho, R.; Jang, H.; Tao, L.; Wang, Y.; Wang, L.; Schnyer, D.M.; Akinwande, D.; Lu, N. Graphene electronic tattoo sensors. ACS Nano 2017, 11, 7634–7641. [Google Scholar] [CrossRef]
  64. Sel, K.; Brown, A.; Jang, H.; Krumholz, H.M.; Lu, N.; Jafari, R. A wrist-worn respiration monitoring device using bio-impedance. In Proceedings of the 2020 42nd Annual International Conference of the IEEE Engineering in Medicine & Biology Society (EMBC), Montreal, QC, Canada, 20–24 July 2020; pp. 3989–3993. [Google Scholar]
  65. Campetelli, G.; Zumoffen, D.; Basualdo, M. Improvements on noninvasive blood glucose biosensors using wavelets for quick fault detection. J. Sens. 2011, 2011, 368015. [Google Scholar] [CrossRef]
  66. Metshein, M.; Annus, P.; Land, R.; Min, M.; Aabloo, A. Availability and variations of cardiac activity in the case of measuring the bioimpedance of wrist. In Proceedings of the 2018 IEEE International Instrumentation and Measurement Technology Conference (I2MTC), Houston, TX, USA, 14–17 May 2018; pp. 1–5. [Google Scholar]
  67. Metshein, M.; Pesti, K.; Lapsa, D.; Annus, P.; Janeliukstis, R.; Elsts, A.; Martens, O. Evaluation of Two-Electrode System Configurations for Forearm Arteries Bioimpedance Measurement. In Proceedings of the 2024 IEEE International Instrumentation and Measurement Technology Conference (I2MTC), Glasgow, UK, 20–23 May 2024; pp. 1–6. [Google Scholar] [CrossRef]
  68. Sun, B.; Wang, C.; Chen, X.; Zhang, Y.; Shao, H. PPG signal motion artifacts correction algorithm based on feature estimation. Optik 2019, 176, 337–349. [Google Scholar] [CrossRef]
  69. Zhang, Y.; Liu, B.; Zhang, Z. Combining ensemble empirical mode decomposition with spectrum subtraction technique for heart rate monitoring using wrist-type photoplethysmography. Biomed. Signal Process. Control 2015, 21, 119–125. [Google Scholar] [CrossRef]
  70. Albaba, A.; Castro, I.; Borzée, P.; Buyse, B.; Testelmans, D.; Varon, C.; Van Huffel, S.; Torfs, T. Automatic quality assessment of capacitively-coupled bioimpedance signals for respiratory activity monitoring. Biomed. Signal Process. Control 2021, 68, 102775. [Google Scholar] [CrossRef]
  71. Wang, L.; Liu, S.; Li, G.; Zhu, R. Interface sensors with skin piezo-thermic transduction enable motion artifact removal for wearable physiological monitoring. Biosens. Bioelectron. 2021, 188, 113325. [Google Scholar] [CrossRef] [PubMed]
  72. Lee, H.; Chung, H.; Ko, H.; Parisi, A.; Busacca, A.; Faes, L.; Pernice, R.; Lee, J. Adaptive scheduling of acceleration and gyroscope for motion artifact cancelation in photoplethysmography. Comput. Methods Programs Biomed. 2022, 226, 107126. [Google Scholar] [CrossRef]
  73. Kim, B.S.; Yoo, S.K. Motion artifact reduction in photoplethysmography using independent component analysis. IEEE Trans. Biomed. Eng. 2006, 53, 566–568. [Google Scholar] [CrossRef]
  74. Krishnan, R.; Natarajan, B.; Warren, S. Two-stage approach for detection and reduction of motion artifacts in photoplethysmographic data. IEEE Trans. Biomed. Eng. 2010, 57, 1867–1876. [Google Scholar] [CrossRef] [PubMed]
  75. Peng, F.; Zhang, Z.; Gou, X.; Liu, H.; Wang, W. Motion artifact removal from photoplethysmographic signals by combining temporally constrained independent component analysis and adaptive filter. Biomed. Eng. Online 2014, 13, 1–14. [Google Scholar] [CrossRef]
  76. Chen, W.; Jaques, N.; Taylor, S.; Sano, A.; Fedor, S.; Picard, R.W. Wavelet-based motion artifact removal for electrodermal activity. In Proceedings of the 2015 37th Annual International Conference of the IEEE Engineering in Medicine and Biology Society (EMBC), Milan, Italy, 25–29 August 2015; pp. 6223–6226. [Google Scholar]
  77. Huang, N.E.; Shen, Z.; Long, S.R.; Wu, M.C.; Shih, H.H.; Zheng, Q.; Yen, N.C.; Tung, C.C.; Liu, H.H. The empirical mode decomposition and the Hilbert spectrum for nonlinear and non-stationary time series analysis. Proc. R. Soc. Lond. Ser. A Math. Phys. Eng. Sci. 1998, 454, 903–995. [Google Scholar] [CrossRef]
  78. Lee, J.; McManus, D.D.; Merchant, S.; Chon, K.H. Automatic motion and noise artifact detection in Holter ECG data using empirical mode decomposition and statistical approaches. IEEE Trans. Biomed. Eng. 2011, 59, 1499–1506. [Google Scholar]
  79. Komaty, A.; Boudraa, A.O.; Augier, B.; Daré-Emzivat, D. EMD-based filtering using similarity measure between probability density functions of IMFs. IEEE Trans. Instrum. Meas. 2013, 63, 27–34. [Google Scholar] [CrossRef]
  80. Garde, A.; Karlen, W.; Dehkordi, P.; Ansermino, J.M.; Dumont, G.A. Empirical mode decomposition for respiratory and heart rate estimation from the photoplethysmogram. In Proceedings of the Computing in Cardiology 2013, Zaragoza, Spain, 22–25 September 2013; pp. 799–802. [Google Scholar]
  81. Wang, Q.; Yang, P.; Zhang, Y. Artifact reduction based on Empirical Mode Decomposition (EMD) in photoplethysmography for pulse rate detection. In Proceedings of the 2010 Annual International Conference of the IEEE Engineering in Medicine and Biology, Buenos Aires, Argentina, 31 August–4 September 2010; pp. 959–962. [Google Scholar]
  82. Khan, E.; Al Hossain, F.; Uddin, S.Z.; Alam, S.K.; Hasan, M.K. A robust heart rate monitoring scheme using photoplethysmographic signals corrupted by intense motion artifacts. IEEE Trans. Biomed. Eng. 2015, 63, 550–562. [Google Scholar] [CrossRef]
  83. Wu, Z.; Huang, N.E. Ensemble empirical mode decomposition: A noise-assisted data analysis method. Adv. Adapt. Data Anal. 2009, 1, 1–41. [Google Scholar] [CrossRef]
  84. Singh, P.; Joshi, S.D.; Patney, R.K.; Saha, K. The Fourier decomposition method for nonlinear and non-stationary time series analysis. Proc. R. Soc. A Math. Phys. Eng. Sci. 2017, 473, 20160871. [Google Scholar] [CrossRef]
  85. Wang, Y.H.; Yeh, C.H.; Young, H.W.V.; Hu, K.; Lo, M.T. On the computational complexity of the empirical mode decomposition algorithm. Phys. A Stat. Mech. Its Appl. 2014, 400, 159–167. [Google Scholar] [CrossRef]
  86. Lee, H.; Chung, H.; Lee, J. Motion artifact cancellation in wearable photoplethysmography using gyroscope. IEEE Sens. J. 2018, 19, 1166–1175. [Google Scholar] [CrossRef]
  87. Lee, H.; Chung, H.; Kim, J.W.; Lee, J. Motion artifact identification and removal from wearable reflectance photoplethysmography using piezoelectric transducer. IEEE Sens. J. 2019, 19, 3861–3870. [Google Scholar] [CrossRef]
  88. Lee, H.; Chung, H.; Ko, H.; Lee, J. Wearable multichannel photoplethysmography framework for heart rate monitoring during intensive exercise. IEEE Sens. J. 2018, 18, 2983–2993. [Google Scholar] [CrossRef]
  89. Poh, M.Z.; Swenson, N.C.; Picard, R.W. Motion-tolerant magnetic earring sensor and wireless earpiece for wearable photoplethysmography. IEEE Trans. Inf. Technol. Biomed. 2010, 14, 786–794. [Google Scholar] [CrossRef]
  90. Yousefi, R.; Nourani, M.; Ostadabbas, S.; Panahi, I. A motion-tolerant adaptive algorithm for wearable photoplethysmographic biosensors. IEEE J. Biomed. Health Inform. 2013, 18, 670–681. [Google Scholar] [CrossRef]
  91. Ye, Y.; Cheng, Y.; He, W.; Hou, M.; Zhang, Z. Combining nonlinear adaptive filtering and signal decomposition for motion artifact removal in wearable photoplethysmography. IEEE Sens. J. 2016, 16, 7133–7141. [Google Scholar] [CrossRef]
  92. Arunkumar, K.; Bhaskar, M. Heart rate estimation from photoplethysmography signal for wearable health monitoring devices. Biomed. Signal Process. Control 2019, 50, 1–9. [Google Scholar]
  93. Tanaka, H.; Monahan, K.D.; Seals, D.R. Age-predicted maximal heart rate revisited. J. Am. Coll. Cardiol. 2001, 37, 153–156. [Google Scholar] [CrossRef]
  94. Gellish, R.L.; Goslin, B.R.; Olson, R.E.; McDONALD, A.; Russi, G.D.; Moudgil, V.K. Longitudinal modeling of the relationship between age and maximal heart rate. Med. Sci. Sports Exerc. 2007, 39, 822–829. [Google Scholar] [CrossRef] [PubMed]
  95. Nitzan, M.; Faib, I.; Friedman, H. Respiration-induced changes in tissue blood volume distal to occluded artery, measured by photoplethysmography. J. Biomed. Opt. 2006, 11, 040506. [Google Scholar] [CrossRef] [PubMed]
  96. Yasuma, F.; Hayano, J.i. Respiratory sinus arrhythmia: Why does the heartbeat synchronize with respiratory rhythm? Chest 2004, 125, 683–690. [Google Scholar] [CrossRef]
  97. Xu, L.; Zhang, D.; Wang, K.; Li, N.; Wang, X. Baseline wander correction in pulse waveforms using wavelet-based cascaded adaptive filter. Comput. Biol. Med. 2007, 37, 716–731. [Google Scholar] [CrossRef]
  98. Lu, S.; Zhao, H.; Ju, K.; Shin, K.; Lee, M.; Shelley, K.; Chon, K.H. Can photoplethysmography variability serve as an alternative approach to obtain heart rate variability information? J. Clin. Monit. Comput. 2008, 22, 23–29. [Google Scholar] [CrossRef] [PubMed]
  99. Fukushima, H.; Kawanaka, H.; Bhuiyan, M.S.; Oguri, K. Estimating heart rate using wrist-type photoplethysmography and acceleration sensor while running. In Proceedings of the 2012 Annual International Conference of the IEEE Engineering in Medicine and Biology Society, San Diego, CA, USA, 28 August –1 September 2012; pp. 2901–2904. [Google Scholar]
  100. Sun, B.; Zhang, Z. Photoplethysmography-based heart rate monitoring using asymmetric least squares spectrum subtraction and bayesian decision theory. IEEE Sens. J. 2015, 15, 7161–7168. [Google Scholar] [CrossRef]
  101. Motin, M.A.; Karmakar, C.K.; Palaniswami, M. Ensemble empirical mode decomposition with principal component analysis: A novel approach for extracting respiratory rate and heart rate from photoplethysmographic signal. IEEE J. Biomed. Health Informatics 2017, 22, 766–774. [Google Scholar] [CrossRef]
  102. Biswas, D.; Everson, L.; Liu, M.; Panwar, M.; Verhoef, B.E.; Patki, S.; Kim, C.H.; Acharyya, A.; Van Hoof, C.; Konijnenburg, M.; et al. CorNET: Deep learning framework for PPG-based heart rate estimation and biometric identification in ambulant environment. IEEE Trans. Biomed. Circuits Syst. 2019, 13, 282–291. [Google Scholar] [CrossRef]
  103. Zhang, Z.; Pi, Z.; Liu, B. TROIKA: A general framework for heart rate monitoring using wrist-type photoplethysmographic signals during intensive physical exercise. IEEE Trans. Biomed. Eng. 2014, 62, 522–531. [Google Scholar] [CrossRef]
  104. Ershad, F.; Thukral, A.; Yue, J.; Comeaux, P.; Lu, Y.; Shim, H.; Sim, K.; Kim, N.I.; Rao, Z.; Guevara, R.; et al. Ultra-conformal drawn-on-skin electronics for multifunctional motion artifact-free sensing and point-of-care treatment. Nat. Commun. 2020, 11, 3823. [Google Scholar] [CrossRef] [PubMed]
  105. Kwon, S.; Kwon, Y.T.; Kim, Y.S.; Lim, H.R.; Mahmood, M.; Yeo, W.H. Skin-conformal, soft material-enabled bioelectronic system with minimized motion artifacts for reliable health and performance monitoring of athletes. Biosens. Bioelectron. 2020, 151, 111981. [Google Scholar] [CrossRef]
  106. Gruetzmann, A.; Hansen, S.; Müller, J. Novel dry electrodes for ECG monitoring. Physiol. Meas. 2007, 28, 1375. [Google Scholar] [CrossRef] [PubMed]
  107. Zhang, Z. Photoplethysmography-based heart rate monitoring in physical activities via joint sparse spectrum reconstruction. IEEE Trans. Biomed. Eng. 2015, 62, 1902–1910. [Google Scholar] [CrossRef] [PubMed]
  108. Temko, A. Accurate heart rate monitoring during physical exercises using PPG. IEEE Trans. Biomed. Eng. 2017, 64, 2016–2024. [Google Scholar] [CrossRef]
  109. Fujita, Y.; Hiromoto, M.; Sato, T. PARHELIA: Particle filter-based heart rate estimation from photoplethysmographic signals during physical exercise. IEEE Trans. Biomed. Eng. 2017, 65, 189–198. [Google Scholar] [CrossRef]
  110. Nathan, V.; Jafari, R. Particle filtering and sensor fusion for robust heart rate monitoring using wearable sensors. IEEE J. Biomed. Health Inform. 2017, 22, 1834–1846. [Google Scholar] [CrossRef]
  111. Lee, J.; Chung, H.; Lee, H. Multi-mode particle filtering methods for heart rate estimation from wearable photoplethysmography. IEEE Trans. Biomed. Eng. 2019, 66, 2789–2799. [Google Scholar] [CrossRef]
  112. Chung, H.; Lee, H.; Lee, J. Finite state machine framework for instantaneous heart rate validation using wearable photoplethysmography during intensive exercise. IEEE J. Biomed. Health Inform. 2018, 23, 1595–1606. [Google Scholar] [CrossRef]
  113. Reiss, A.; Indlekofer, I.; Schmidt, P.; Van Laerhoven, K. Deep PPG: Large-scale heart rate estimation with convolutional neural networks. Sensors 2019, 19, 3079. [Google Scholar] [CrossRef] [PubMed]
  114. Biswas, D.; Simões-Capela, N.; Van Hoof, C.; Van Helleputte, N. Heart rate estimation from wrist-worn photoplethysmography: A review. IEEE Sens. J. 2019, 19, 6560–6570. [Google Scholar] [CrossRef]
  115. Wójcikowski, M.; Pankiewicz, B. Photoplethysmographic time-domain heart rate measurement algorithm for resource-constrained wearable devices and its implementation. Sensors 2020, 20, 1783. [Google Scholar] [CrossRef] [PubMed]
  116. Chung, H.; Lee, H.; Lee, J. State-dependent Gaussian kernel-based power spectrum modification for accurate instantaneous heart rate estimation. PLoS ONE 2019, 14, e0215014. [Google Scholar] [CrossRef]
  117. Blasco, J.; Peris-Lopez, P. On the feasibility of low-cost wearable sensors for multi-modal biometric verification. Sensors 2018, 18, 2782. [Google Scholar] [CrossRef]
  118. Griswold-Steiner, I.; Matovu, R.; Serwadda, A. Wearables-driven freeform handwriting authentication. IEEE Trans. Biom. Behav. Identity Sci. 2019, 1, 152–164. [Google Scholar] [CrossRef]
  119. Retsinas, G.; Filntisis, P.P.; Efthymiou, N.; Theodosis, E.; Zlatintsi, A.; Maragos, P. Person identification using deep convolutional neural networks on short-term signals from wearable sensors. In Proceedings of the ICASSP 2020-2020 IEEE International Conference on Acoustics, Speech and Signal Processing (ICASSP), Barcelona, Spain, 4–8 May 2020; pp. 3657–3661. [Google Scholar]
  120. Oppel, E.; Kamann, S.; Reichl, F.X.; Högg, C. The Dexcom glucose monitoring system—An isobornyl acrylate-free alternative for diabetic patients. Contact Dermat. 2019, 81, 32–36. [Google Scholar] [CrossRef]
  121. Ouyang, H.; Tian, J.; Sun, G.; Zou, Y.; Liu, Z.; Li, H.; Zhao, L.; Shi, B.; Fan, Y.; Fan, Y.; et al. Self-powered pulse sensor for antidiastole of cardiovascular disease. Adv. Mater. 2017, 29, 1703456. [Google Scholar] [CrossRef]
  122. Schäfer, A.; Vagedes, J. How accurate is pulse rate variability as an estimate of heart rate variability?: A review on studies comparing photoplethysmographic technology with an electrocardiogram. Int. J. Cardiol. 2013, 166, 15–29. [Google Scholar] [CrossRef]
  123. Wang, W.F.; Yang, C.Y.; Wu, Y.F. SVM-based classification method to identify alcohol consumption using ECG and PPG monitoring. Pers. Ubiquitous Comput. 2018, 22, 275–287. [Google Scholar] [CrossRef]
  124. Hwang, S.; Seo, J.; Jebelli, H.; Lee, S. Feasibility analysis of heart rate monitoring of construction workers using a photoplethysmography (PPG) sensor embedded in a wristband-type activity tracker. Autom. Constr. 2016, 71, 372–381. [Google Scholar] [CrossRef]
  125. Kim, Y.J.; Jang, H.S.; Byun, C.S.; Choi, B.S. Development of u-health monitoring system using PPG sensor. In Proceedings of the 2018 International Conference on Electronics, Information, and Communication (ICEIC), Honolulu, HI, USA, 24–27 January 2018; pp. 1–2. [Google Scholar]
  126. Wannenburg, J.; Malekian, R. Body sensor network for mobile health monitoring, a diagnosis and anticipating system. IEEE Sens. J. 2015, 15, 6839–6852. [Google Scholar] [CrossRef]
  127. Carek, A.M.; Inan, O.T. Robust sensing of distal pulse waveforms on a modified weighing scale for ubiquitous pulse transit time measurement. IEEE Trans. Biomed. Circuits Syst. 2017, 11, 765–772. [Google Scholar] [CrossRef]
  128. Wu, H.T.; Lin, B.Y.; Yang, C.C.; Ou, Y.N.; Sun, C.K. Assessment of vascular health with photoplethysmographic waveforms from the fingertip. IEEE J. Biomed. Health Inform. 2016, 21, 382–386. [Google Scholar] [CrossRef] [PubMed]
  129. Beeler, N.; Roos, L.; Delves, S.K.; Veenstra, B.J.; Friedl, K.; Buller, M.J.; Wyss, T. The wearing comfort and acceptability of ambulatory physical activity monitoring devices in soldiers. IISE Trans. Occup. Ergon. Hum. Factors 2018, 6, 1–10. [Google Scholar] [CrossRef]
  130. Onorati, F.; Regalia, G.; Caborni, C.; Migliorini, M.; Bender, D.; Poh, M.Z.; Frazier, C.; Kovitch Thropp, E.; Mynatt, E.D.; Bidwell, J.; et al. Multicenter clinical assessment of improved wearable multimodal convulsive seizure detectors. Epilepsia 2017, 58, 1870–1879. [Google Scholar] [CrossRef] [PubMed]
  131. Weenk, M.; van Goor, H.; Frietman, B.; Engelen, L.J.; van Laarhoven, C.J.; Smit, J.; Bredie, S.J.; van de Belt, T.H. Continuous monitoring of vital signs using wearable devices on the general ward: Pilot study. JMIR MHealth UHealth 2017, 5, e7208. [Google Scholar]
  132. Apple Watch. Available online: https://www.apple.com/apple-watch-series-9/specs/ (accessed on 27 July 2024).
  133. Fitbit. Available online: https://help.fitbit.com/manuals/sense/Content/manuals/Topics/General%20Info%20and%20Specifications/Wristband%20size.htm (accessed on 27 July 2024).
  134. Garmin. Available online: https://www.garmin.com/en-US/p/641479#specs (accessed on 27 July 2024).
  135. Aura Ring. Available online: https://ouraring.com/product/rings (accessed on 27 July 2024).
  136. Whoop Band. Available online: https://www.whoop.com/us/en/press-center/introducing-4-0-whoop-body-any-wear-technology/ (accessed on 27 July 2024).
  137. Polar H10. Available online: https://www.polar.com/en/accessories-straps (accessed on 27 July 2024).
  138. Firstbeat Sport Sensor. Available online: https://shop.firstbeatsports.global/products/firstbeat-sports-sensor (accessed on 27 July 2024).
  139. Zephyr Bioharness 3. Available online: https://www.habdirect.com/product/zephyr-bioharness-btle-echo-module-gen-3/ (accessed on 27 July 2024).
  140. Spigulis, J.; Gailite, L.; Lihachev, A.; Erts, R. Simultaneous recording of skin blood pulsations at different vascular depths by multiwavelength photoplethysmography. Appl. Opt. 2007, 46, 1754–1759. [Google Scholar] [CrossRef]
  141. Fallow, B.A.; Tarumi, T.; Tanaka, H. Influence of skin type and wavelength on light wave reflectance. J. Clin. Monit. Comput. 2013, 27, 313–317. [Google Scholar] [CrossRef]
  142. Fine, J.; Branan, K.L.; Rodriguez, A.J.; Boonya-Ananta, T.; Ajmal; Ramella-Roman, J.C.; McShane, M.J.; Cote, G.L. Sources of inaccuracy in photoplethysmography for continuous cardiovascular monitoring. Biosensors 2021, 11, 126. [Google Scholar] [CrossRef]
  143. Bent, B.; Goldstein, B.A.; Kibbe, W.A.; Dunn, J.P. Investigating sources of inaccuracy in wearable optical heart rate sensors. NPJ Digit. Med. 2020, 3, 18. [Google Scholar] [CrossRef]
  144. Boonya-ananta, T.; Rodriguez, A.J.; Hansen, A.K.; Hutcheson, J.D.; Ramella-Roman, J.C. Monte Carlo modeling of a photoplethysmographic (PPG) in individuals with obesity. In Optics and the Brain; Optica Publishing Group: Washington, DC, USA, 2020; p. JTu3A-39. [Google Scholar]
  145. Ray, D.; Collins, T.; Woolley, S.I.; Ponnapalli, P.V. A review of wearable multi-wavelength photoplethysmography. IEEE Rev. Biomed. Eng. 2021, 16, 136–151. [Google Scholar] [CrossRef] [PubMed]
  146. Vhaduri, S.; Poellabauer, C. Multi-modal biometric-based implicit authentication of wearable device users. IEEE Trans. Inf. Forensics Secur. 2019, 14, 3116–3125. [Google Scholar] [CrossRef]
  147. Pesti, K.; Metshein, M.; Annus, P.; Kõiv, H.; Min, M. Electrode placement strategies for the measurement of radial artery bioimpedance: Simulations and experiments. IEEE Trans. Instrum. Meas. 2020, 70, 1–10. [Google Scholar] [CrossRef]
  148. Margo, C.; Katrib, J.; Nadi, M.; Rouane, A. A four-electrode low frequency impedance spectroscopy measurement system using the AD5933 measurement chip. Physiol. Meas. 2013, 34, 391. [Google Scholar] [CrossRef]
  149. Hernandez-Silveira, M.; Ahmed, K.; Ang, S.S.; Zandari, F.; Mehta, T.; Weir, R.; Burdett, A.; Toumazou, C.; Brett, S.J. Assessment of the feasibility of an ultra-low power, wireless digital patch for the continuous ambulatory monitoring of vital signs. BMJ Open 2015, 5, e006606. [Google Scholar] [CrossRef]
  150. Akintola, A.A.; Van de Pol, V.; Bimmel, D.; Maan, A.C.; Van Heemst, D. Comparative analysis of the equivital EQ02 lifemonitor with holter ambulatory ECG device for continuous measurement of ECG, heart rate, and heart rate variability: A validation study for precision and accuracy. Front. Physiol. 2016, 7, 213365. [Google Scholar] [CrossRef]
  151. Comstock, J. Jawbone Adds Heart Rate Sensor for UP3, Takes on Misfit with Jawbone Move. 2014. Available online: https://www.mobihealthnews.com/37936/jawbone-adds-heart-rate-sensor-for-up3-takes-on-misfit-with-jawbone-move (accessed on 13 July 2024).
  152. Pallas-Areny, R.; Webster, J.G. Bioelectric impedance measurements using synchronous sampling. IEEE Trans. Biomed. Eng. 1993, 40, 824–829. [Google Scholar] [CrossRef]
  153. Yang, Y.; Wang, J.; Yu, G.; Niu, F.; He, P. Design and preliminary evaluation of a portable device for the measurement of bioimpedance spectroscopy. Physiol. Meas. 2006, 27, 1293. [Google Scholar] [CrossRef]
  154. Tucker, A.S.; Fox, R.M.; Sadleir, R.J. Biocompatible, high precision, wideband, improved Howland current source with lead-lag compensation. IEEE Trans. Biomed. Circuits Syst. 2012, 7, 63–70. [Google Scholar] [CrossRef]
  155. Lapsa, D.; Janeliukstis, R.; Elsts, A. Adaptive Signal-to-Noise Ratio Indicator for Wearable Bioimpedance Monitoring. Sensors 2023, 23, 8532. [Google Scholar] [CrossRef]
  156. Pittella, E.; Piuzzi, E.; Rizzuto, E.; Pisa, S.; Del Prete, Z. Metrological characterization of a combined bio-impedance plethysmograph and spectrometer. Measurement 2018, 120, 221–229. [Google Scholar] [CrossRef]
  157. Fellahi, J.L.; Fischer, M.O. Electrical bioimpedance cardiography: An old technology with new hopes for the future. J. Cardiothorac. Vasc. Anesth. 2014, 28, 755–760. [Google Scholar] [CrossRef]
  158. Vedru, J. Electrical impedance methods for the measurement of stroke volume in man: State of art. Acta Comm. Univ. Tartu. 1994, 974, 110–129. [Google Scholar]
  159. Magno, M.; Wang, X.; Eggimann, M.; Cavigelli, L.; Benini, L. InfiniWolf: Energy efficient smart bracelet for edge computing with dual source energy harvesting. In Proceedings of the 2020 Design, Automation & Test in Europe Conference & Exhibition (DATE), Grenoble, France, 9–13 March 2020; pp. 342–345. [Google Scholar]
  160. Magno, M.; Porcarelli, D.; Brunelli, D.; Benini, L. Infinitime: A multi-sensor energy neutral wearable bracelet. In Proceedings of the International Green Computing Conference, Dallas, TX, USA, 3–5 November 2014; pp. 1–8. [Google Scholar]
  161. Vankecke, C.; Assouère, L.; Wang, A.; Durand-Estèbe, P.; Caignet, F.; Dilhac, J.M.; Bafleur, M. Multisource and battery-free energy harvesting architecture for aeronautics applications. IEEE Trans. Power Electron. 2014, 30, 3215–3227. [Google Scholar] [CrossRef]
  162. Bogónez-Franco, P.; Nescolarde, L.; Gálvez-Montón, C.; Bragós, R.; Rosell-Ferrer, J. An implantable bioimpedance monitor using 2.45 GHz band for telemetry. Physiol. Meas. 2012, 34, 1. [Google Scholar] [CrossRef] [PubMed]
  163. Min, M.; Parve, T.; Kukk, V.; Kuhlberg, A. An implantable analyzer of bio-impedance dynamics: Mixed signal approach. In Proceedings of the IMTC 2001. Proceedings of the 18th IEEE Instrumentation and Measurement Technology Conference. Rediscovering Measurement in the Age of Informatics (Cat. No. 01CH 37188), Budapest, Hungary, 21–23 May 2001; Volume 1, pp. 013718821–23200138. [Google Scholar]
  164. Menolotto, M.; Rossi, S.; Dario, P.; Della Torre, L. Towards the development of a wearable electrical impedance tomography system: A study about the suitability of a low power bioimpedance front-end. In Proceedings of the 2015 37th Annual International Conference of the IEEE Engineering in Medicine and Biology Society (EMBC), Milan, Italy, 25–29 August 2015; pp. 3133–3136. [Google Scholar]
  165. Lee, S.; Polito, S.; Agell, C.; Mitra, S.; Yazicioglu, R.F.; Riistama, J.; Habetha, J.; Penders, J. A low-power and compact-sized wearable bio-impedance monitor with wireless connectivity. J. Phys. Conf. Ser. 2013, 434, 012013. [Google Scholar] [CrossRef]
  166. Rossi, S.; Mancarella, C.; Mocenni, C.; Della Torre, L. Bioimpedance sensing in wearable systems: From hardware integration to model development. In Proceedings of the 2017 IEEE 3rd International Forum on Research and Technologies for Society and Industry (RTSI), Modena, Italy, 11–13 September 2017; pp. 1–6. [Google Scholar]
  167. Liu, S.C.; Strachan, J.P.; Basu, A. Prospects for Analog Circuits in Deep Networks. In Analog Circuits for Machine Learning, Current/Voltage/Temperature Sensors, and High-Speed Communication: Advances in Analog Circuit Design 2021; Harpe, P., Makinwa, K.A., Baschirotto, A., Eds.; Springer International Publishing: Cham, Switzerland, 2022; pp. 49–61. [Google Scholar] [CrossRef]
  168. Martens, O.; Metshein, M.; Abdullayev, A.; Larras, B.; Frappe, A.; Gautier, A.; Saeed, M.; John, D.; Cardiff, B.; Krivošei, A.; et al. Fiducial Point Estimation Solution for Impedance Cardiography Measurements. In Proceedings of the 2022 IEEE International Instrumentation and Measurement Technology Conference (I2MTC), Ottawa, ON, Canada, 16–19 May 2022; pp. 1–6. [Google Scholar] [CrossRef]
  169. Suboh, M.Z.; Jaafar, R.; Nayan, N.A.; Harun, N.H.; Mohamad, M.S.F. Analysis on Four Derivative Waveforms of Photoplethysmogram (PPG) for Fiducial Point Detection. Front. Public Health 2022, 10, 920946. [Google Scholar] [CrossRef] [PubMed]
  170. Cybulski, G.; Strasz, A.; Niewiadomski, W.; Gąsiorowska, A. Impedance cardiography: Recent advancements. Cardiol. J. 2012, 19, 550–556. [Google Scholar] [CrossRef]
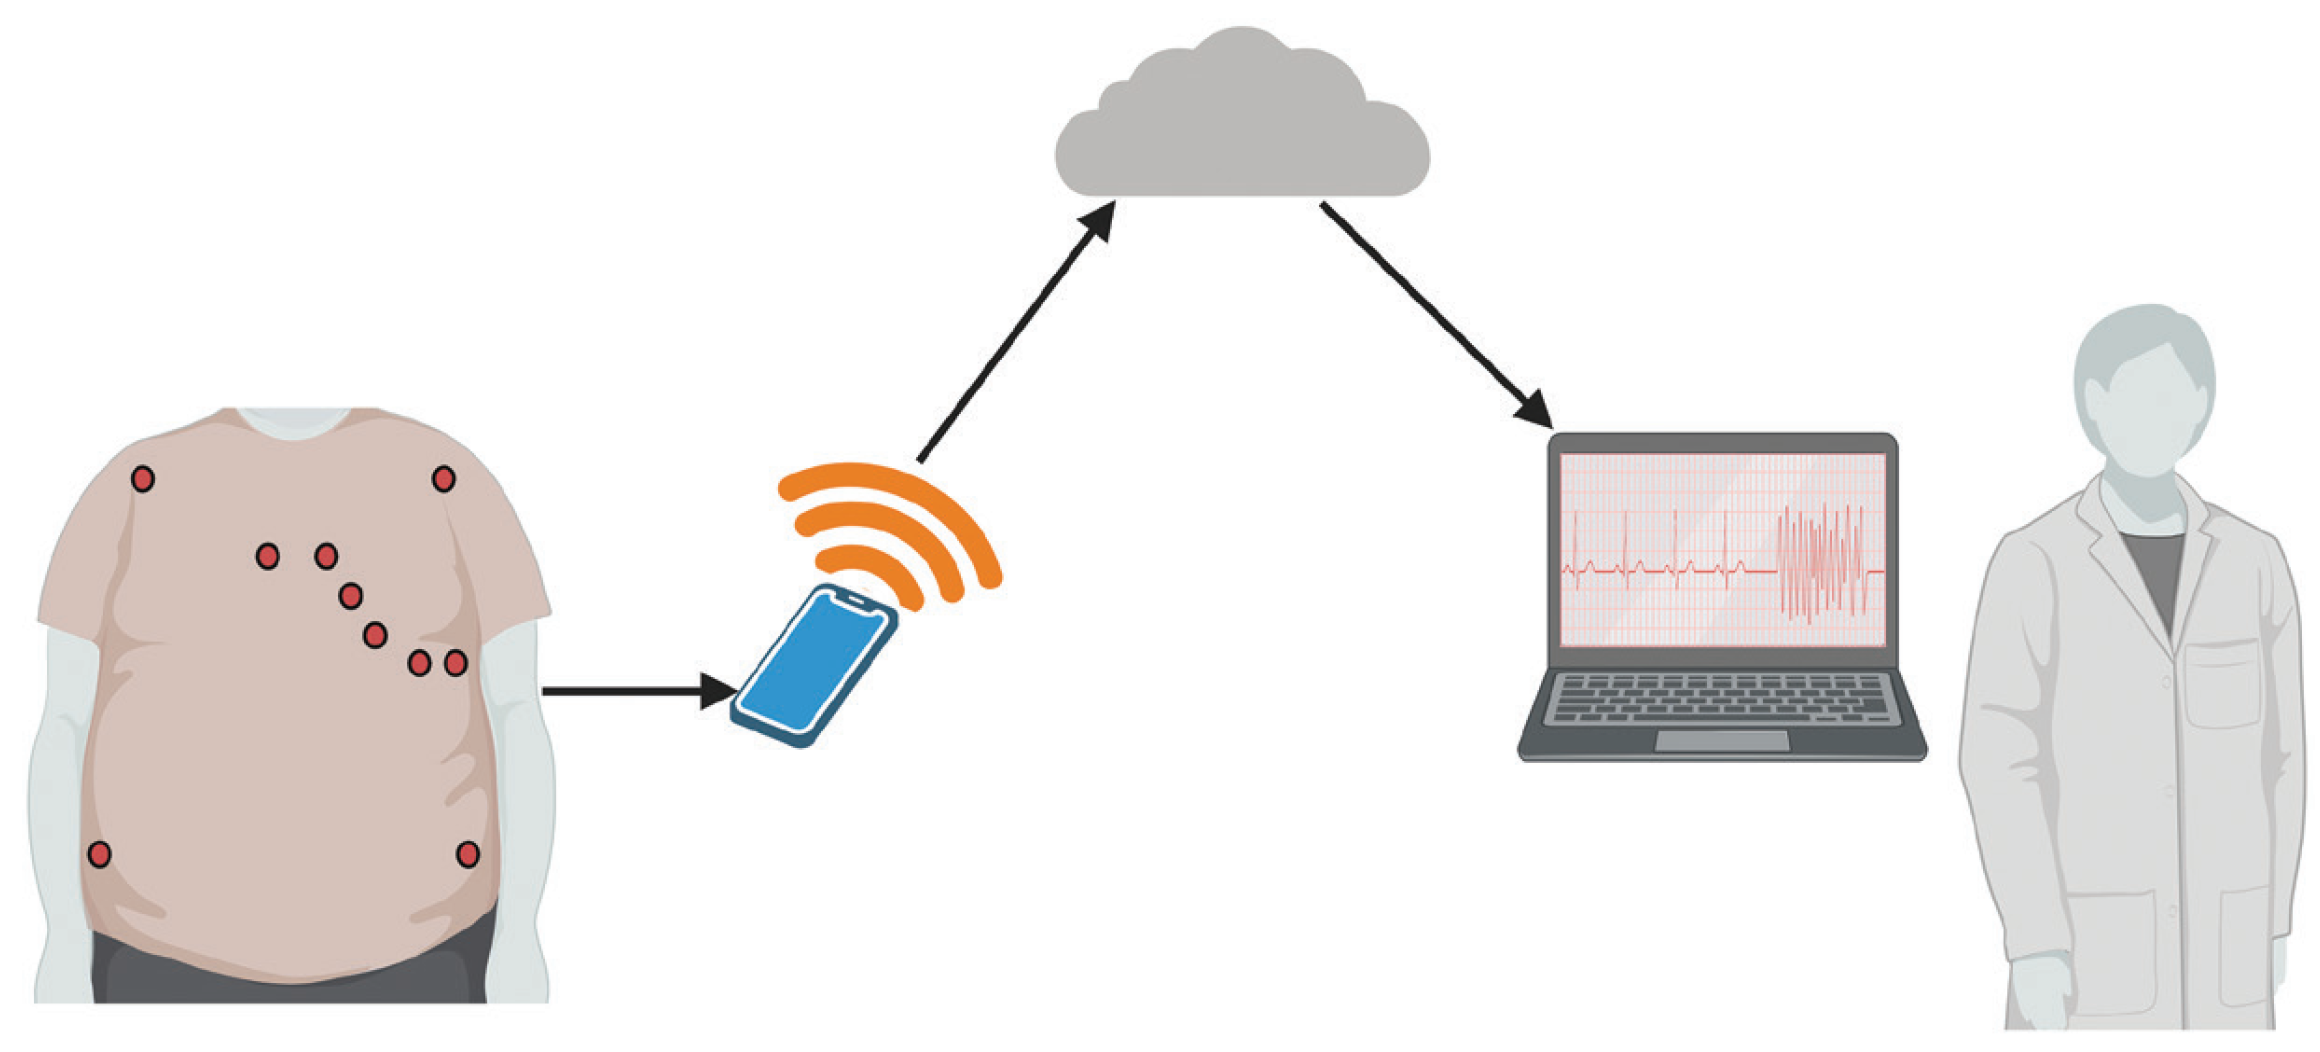
Figure 1. WiFi transmission of the monitored bioparameters to a cloud later accessible by medical personnel [6].
Applsci 14 07451 g001
Figure 2. Development process of wearable devices for heart rate monitoring: from signal acquisition to device implementation.
Applsci 14 07451 g002
Figure 3. Bioimpedance measurement based on electrode placement. (a) Intrathoracic impedance measurement technique [6] and (b) impedance cardiography [17].
Applsci 14 07451 g003
Figure 4. Bioimpedance signal during a single cardiac cycle and derived features for hemodynamic analysis. Amplitude features are in blue, timing features (STT: slope transit time, IBI: inter-beat intervals) are in yellow and area features are in green. A d i a is an area between the diastolic point and the maximum slope point, A s l o p e is the area between the maximum slope point and the systolic point, A s y s is the area between the diastolic and the systolic point [18].
Applsci 14 07451 g004
Figure 5. Electrocardiography (ECG), electrical bioimpedance (IMP) and impedance cardiography (ICG) signals (the first derivative of the IMP signal) with the defined cardiac fiducial points (cardiac events) [33].
Applsci 14 07451 g005
Figure 6. Measurement of PPG signals—(a) typical PPG waveform; (b) transmission PPG measurement mode; (c) reflection PPG measurement mode.
Applsci 14 07451 g006
Figure 7. Features extracted from PPG signals—(a) one cardiac cycle of a PPG pulse wave with seven characteristic points [37]; (b) estimation of pulse wave transit time (PTT) requires two PPG measurement systems [6]; (c) estimation of pulse wave arrival times (PAT) requires a PPG system and a reference ECG measurement [6].
Applsci 14 07451 g007
Figure 8. Features extracted from time derivatives of PPG signal—(a) the first-order derivative; (b) the second-order derivative [51].
Applsci 14 07451 g008
Figure 9. Workflow of heart rate estimation form the measured biological signals.
Applsci 14 07451 g009
Figure 10. Sequence of noise filtering in EBI signals—(a) EBI signal as measured; (b) high-pass filter with a cut-off of 0.05 Hz; (c) low-pass filter with a cut-off of 50 Hz; (d) 50 Hz notch filter; (e) moving average filter with a sliding window of 60 ms.
Applsci 14 07451 g010
Figure 11. The PPG signal: (a) normal; (b) disrupted by motion artifacts.
Applsci 14 07451 g011
Figure 12. Application of ensemble empirical mode decomposition (EEMD) for the extraction of intrinsic mode functions as oscillatory components of a PPG signal [69].
Applsci 14 07451 g012
Figure 13. Fourier decomposition of a PPG signal into Fourier intrinsic band functions (FIBS)—(a) zero-phase filter bank into (b) a set of ten FIBFs obtained after decomposition [9].
Applsci 14 07451 g013
Figure 14. Adaptive detection threshold method for detection of peaks of PPG signal and MA removal [36].
Applsci 14 07451 g014
Figure 15. Cancellation of motion artifacts (MAs) using acceleration and gyroscope signals—Case 1 (ac) when acceleration signal correctly cancels out MA; Case 2 (df) when gyroscope signal correctly cancels out MA [72].
Applsci 14 07451 g015
Figure 16. Partition of the PPG signal into windows for further calculation [9].
Applsci 14 07451 g016
Figure 17. The TROIKA framework for HR estimation: The three main steps are signal decomposition, sparse signal reconstruction and spectral peak tracking.
Applsci 14 07451 g017
Figure 18. The flowchart of JOSS final steps in peak tracking and selection.
Applsci 14 07451 g018
Figure 19. Types of PPG wearable devices and the monitored parameters [6].
Applsci 14 07451 g019
Figure 20. PPG-based wearable devices developed by different research teams—(ac) bottom view of a device showing the thermoreceptors for MA detection, composition of the device and signal flow diagram [71]; (d) wrist-worn device showing a PPG sensor and real-time heart rate detection [72].
Applsci 14 07451 g020
Figure 21. Comparison of arterial pulse wave captured with bioimpedance and PPG sensors for varying skin tones—(a) Fitzpatrick skin tone scale of skin colors partitioned into six types; (b) bioimpedance (BioZ) ring sensor and PPG sensor (660 nm–red) placed at index and ring fingers, respectively, for people with skin color of type I, IV and VI; (c) normalized waveforms of beat-to-beat amplitude captured on top of the hand (darker) and on the bottom of the hand (lighter); (d) standard deviation values for measurements in (c). There is a clear degradation in signal consistency for PPG sensor for darker skin, but no significant impact of skin color is observed for bioimpedance sensor [18].
Applsci 14 07451 g021
Figure 22. Block diagram of a typical bioimpedance device—(a) using analog demodulators [14]; (b) new architecture proposing hardware solutions for demodulation and current driver [14]. Δ Z and Z 0 denote time-dependent and static EBI components, respectively.
Applsci 14 07451 g022
Figure 23. An in-house wrist-worn bioimpedance wearable device designed in EDI. (a) Custom 3D-printed body; (b) PCB from the same device.
Applsci 14 07451 g023
Figure 24. Design estimated and measured battery life using a 250 mA h Li-ion battery for different sensing times with (a) only multi-frequency EBI measurements; (b) multi-frequency EBI measurements and skin–electrode (SE) contact impedance measurements [13].
Applsci 14 07451 g024
Figure 25. Designed EBI wearable sensor node showing its system architecture, front-end, hardware and the finished product [13].
Applsci 14 07451 g025
Table 1. Different cardiovascular conditions whose timely discovery is enabled by monitoring a particular cardiovascular parameter through a wearable device [4].
Monitoring parameterHeart rate variabilityBlood pressureArterial stiffness
Cardiovascular risk factorArrhythmiaHypertension causing heart attack and strokeHypertension, diabetes
Table 2. Wearable PPG devices manufactured in a laboratory setting.
SourceSpecifications
[71]PPG sensor—Reflective, Maxim MAX30101 + photodetector + 525 nm LED, sample rate 125 Hz;
MIMU sensor—STMicroelectronics LSM9DS1, sample rate 125 Hz;
Microcontroller—MCU: STMicroelectronics STM32L476;
Analog-digital conversion—Analog Devices 7606 CE;
Case dimensions—4.5 mm × 4.0 mm, 1.5 mm (resin, 3D printed);
Circuit system—digital + analog for signal amplification and filtering;
Signal transmission—wireless (2.4 GHz, Ashining: AS69-T20)
[72]PPG sensor—Reflective, SFH 7070, Osram opto-semiconductors, Regensburg, Germany;
IMU sensor—LSM6DSMTR, STMicroelectronics, Geneva, Switzerland;
Analog-digital conversion—analog frontend MAX86141 (Maxim integrated, San Jose, CA, USA);
Microcontroller—STM32F413CGU6, STMicroelectronics, Geneva, Swiss, clock rate 25 MHz;
User interface—switch, 1.3 inch liquid crystal display (LCD, KWH013ST03-F01, FORMIKE, Shenzhen, China)
Table 3. Commercially available wearable devices, highlighting some technical details, e.g., the sensors, microcontroller units (MCU), dimensions, and key health monitoring features. The abbreviations used in the table can be found in the abbreviations section.
DeviceSensorsMCUDimensions (mm)Apps
Apple Watch series 9 [132]Electric Heat; PPG; Temp; Compass; Altimeter; ACC; Gyro; Ambient light;S9-SiP-64-bit 4-core45 × 38 × 10.7ECG; Cycle Tracking with retrospective ovulation estimates; Heart Rate; High and low HR notifications; Irregular rhythm notifications; Medications; Mindfulness; Noise; Sleep, including sleep stages
Fitbit charge 5 [133]3-axis ACC; PPG; vibration motor;relative SpO2; ECG; EDAArm 32-bit Cortex M-436.7 × 22.7 × 11.2ECG; HR Monitoring: Continuously tracks HR; including irregular heart rhythm notifications and high and low HR notifications; Stress Detection: EDA-measure stress; Sleep Tracking; SpO2; Skin Temp; Health Metrics Dashboard; Exercise Tracking
Garmin fenix 6 pro [134]PPG; BAROMETRIC ALTIMETER; GPS; COMPASS; Gyro; ACC; TermNXP Kinetis47 × 47 × 14.7Wrist-based HR and Pulse Ox; Advanced Sleep Monitoring; Stress Tracking; Body Battery Energy Monitoring; Respiration Tracking; Hydration Tracking; Women’s Health Tracking; Performance Metrics;
Oura Ring gen3 [135]IR, Green, Red LEDs; ACCs; NTC; GyroPSoC 6 BLE-Nighttime resting HR; HR variability; skin Temp; respiratory rate; Detailed sleep analysis; 24/7 HR tracking (Daytime, Nighttime, Workout); Integration with third-party health and wellness apps like Strava; Advanced Temp monitoring; SpO2; Cycle Insights; Pregnancy Insights; Daytime Stress; Resilience; Dynamic activity goals with Automatic Activity Detection; Weekly, monthly, quarterly, yearly, and anniversary reports
Whoop Band 4.0 [136]ACC and Gyro; PPG; SpO2; TempNordic nRF52840 SoC43 × 28 × 10Live HR; skin Temp; blood oxygen saturation; resting heart rate; HR variability; respiratory rate
Polar H10 Strip [137]ECG; ACCBLE34 × 65 × 10Full ECG chart; HR (HR), Average HR, Lowest HR, Peak HR; R - R; Calories
Firstbeat Sport Sensor [138]ECG; ACCBLE54 × 38 × 7.7HR (HR), Average HR, Lowest HR, Peak HR; Time in Highest Zone; Excess Post-Exercise Oxygen Consumption (EPOC); Training Impulse (TRIMP), TRIMP/min; Training Effect (aerobic, anaerobic)
Zephyr Bioharness 3 [139]ECG; ACC; Temp;BLE28 (Diam) × 7HR in beats per minute (BPM); Breathing Rate; Posture; Activity Level; Skin Temp; Peak Acceleration; Breathing Wave Amplitude; ECG Amplitude and Noise; HR RR Values
Table 4. Comparison of EBI wearable systems [13]. SF—single frequency, MF—multi-frequency.
SourceMeasurement ModeAccuracyRange ( Ω )Power ActivePower SleepSize (cm)Sense Time (s)
[13]MF1.5 %100–100053 mW15.7 μ W3 × 1.8 × 0.60.05
[165]MF0.5 Ω R < 54; 0.7< X c < 514.4 mW0.9 mW4.8 × 3 × 2-
[166]SF0.1 %0–120750 μ A at 2.8 V---
[155]MF4.5 %0–10,0003 mA at 1.8 V8 μ A at 1.8 V4 × 4.6 × 1.3-
Disclaimer/Publisher’s Note: The statements, opinions and data contained in all publications are solely those of the individual author(s) and contributor(s) and not of MDPI and/or the editor(s). MDPI and/or the editor(s) disclaim responsibility for any injury to people or property resulting from any ideas, methods, instructions or products referred to in the content.