

Enhancing Space Management through Digital Twin: A Case Study of the Lazio Region Headquarters


Abstract
:1. Introduction
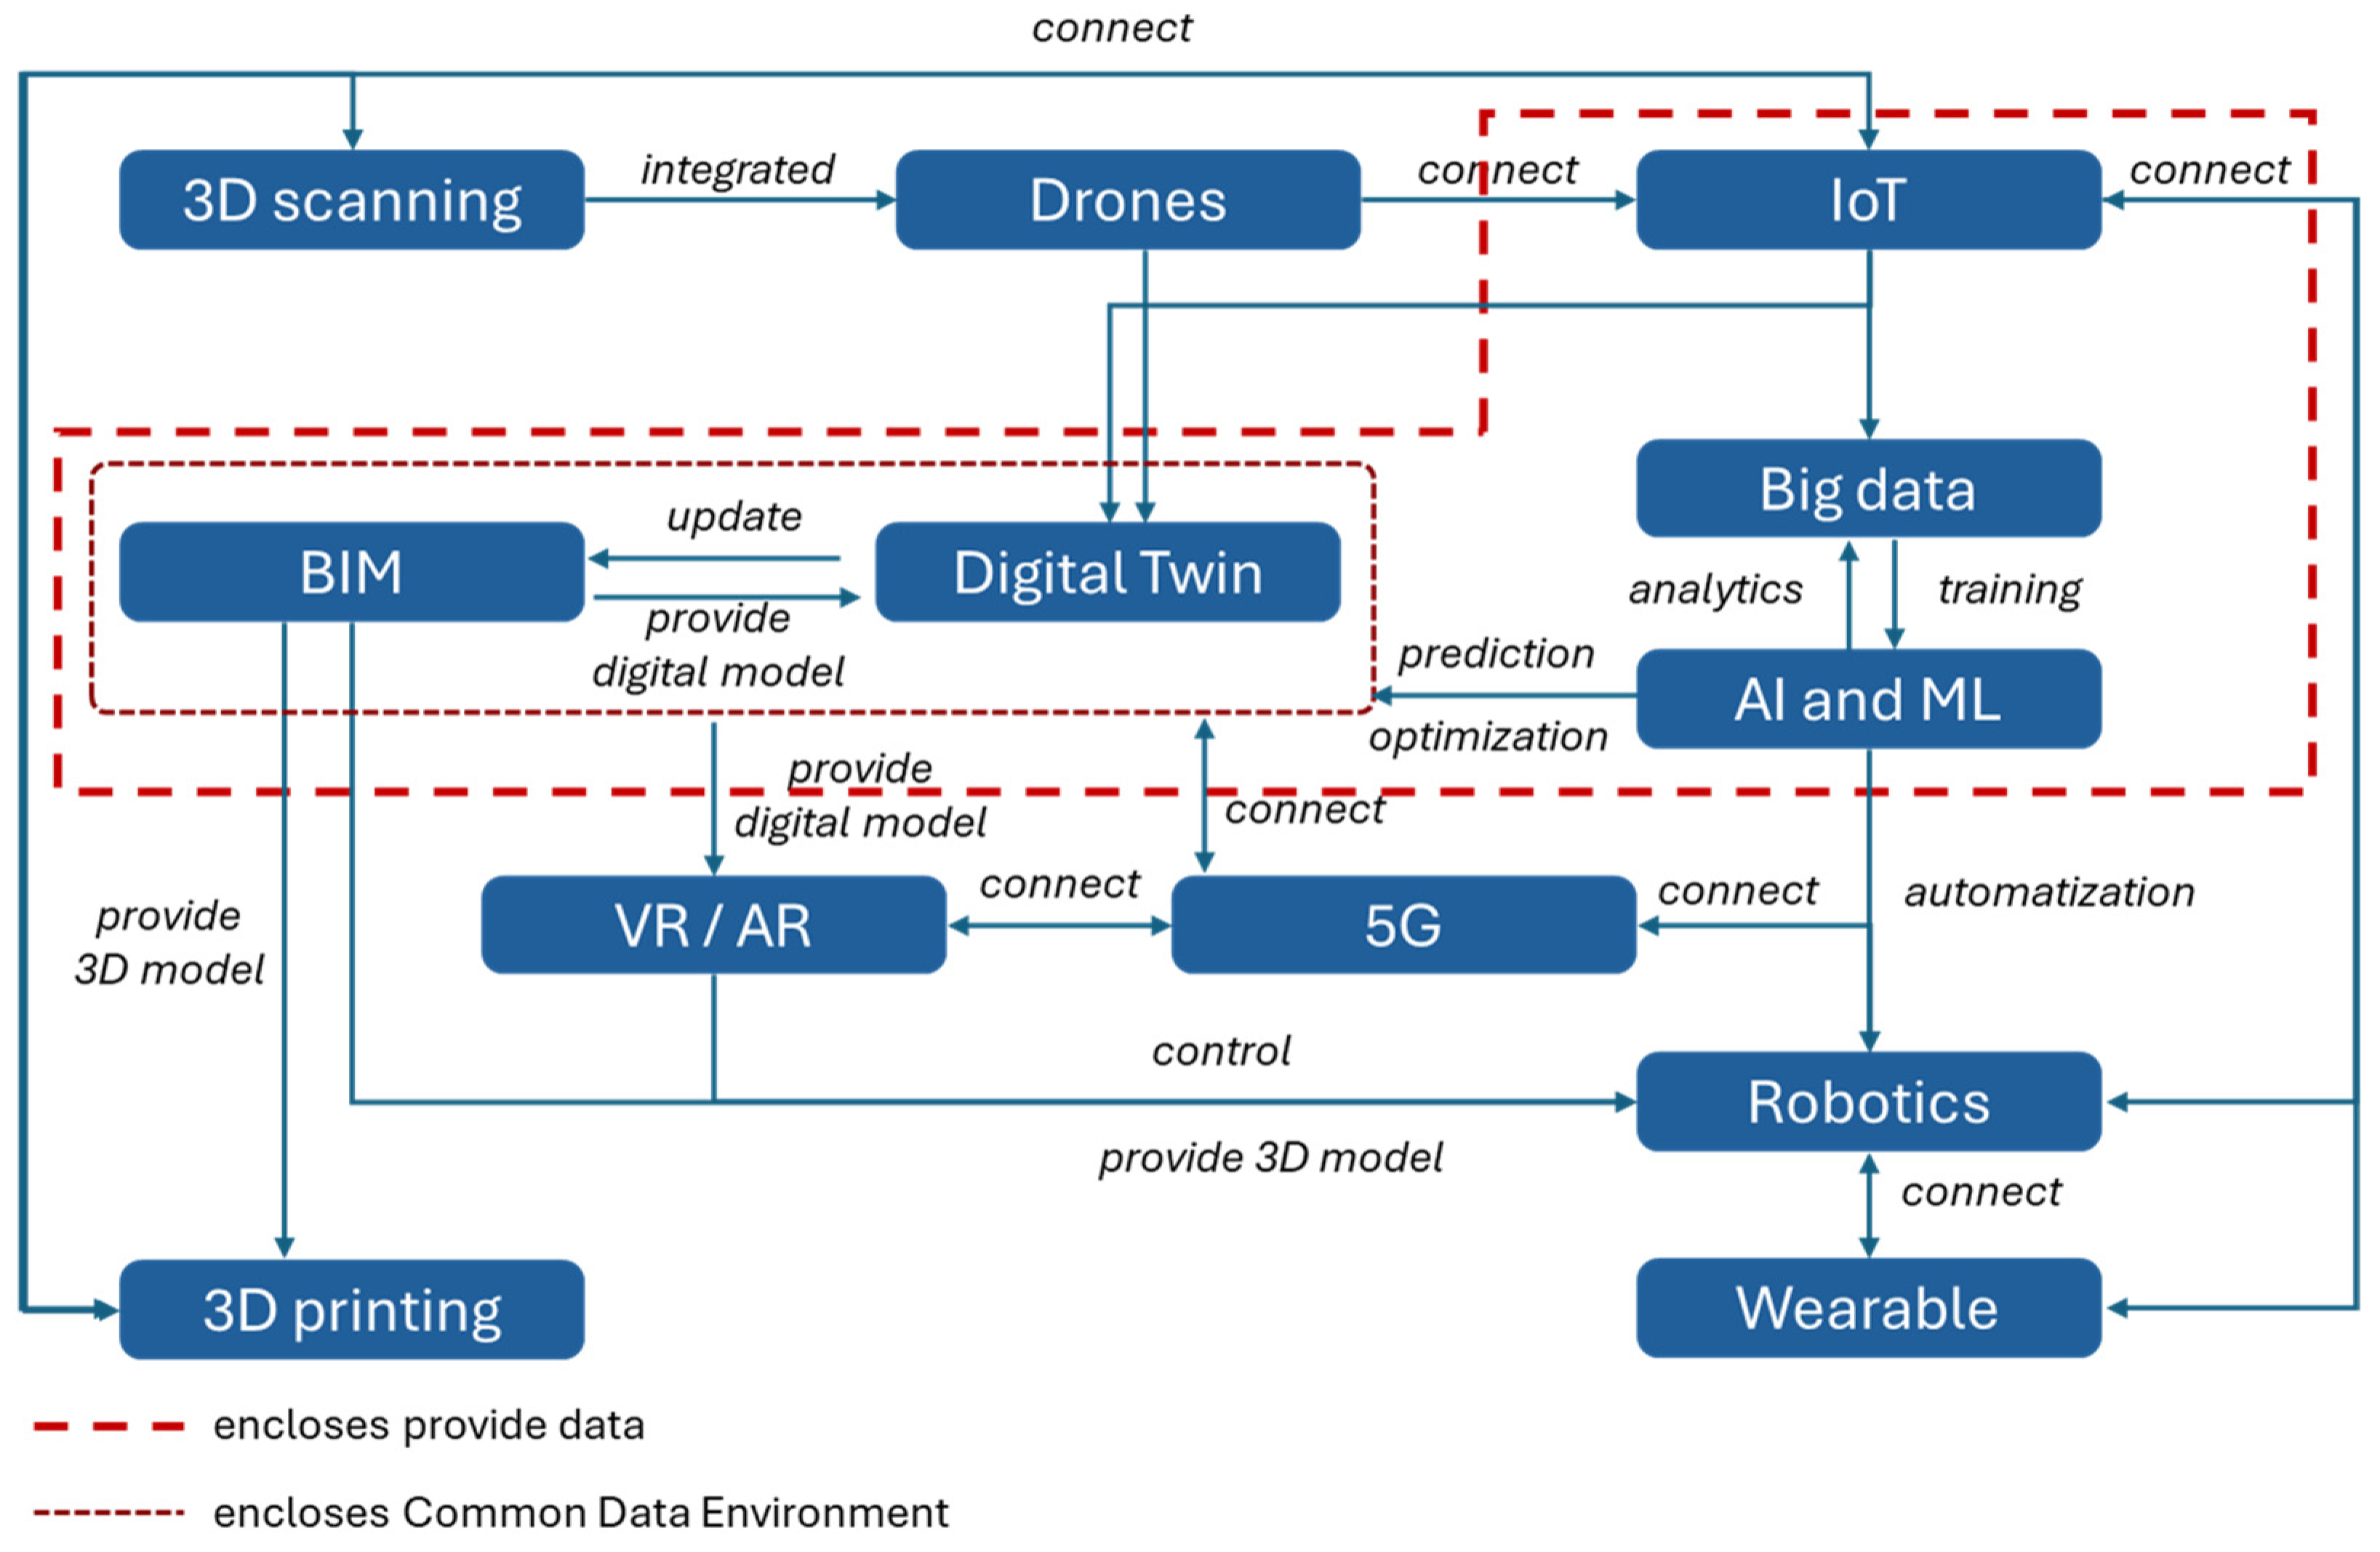
1.1. Advanced Digital Technologies
1.2. Space Management in Smart Working Adoption
2. Materials and Methods
- -
- Strategy 1: Office first. The majority of employees work in the office, with the option of working remotely for a few days a week (e.g., 3–4 days in the office and 1–2 remotely).
- -
- Strategy 2: Virtual first. The majority of employees work remotely, with the option of travelling to the office for specific purposes, such as internal meetings or client-facing activities.
- -
- Strategy 3: Total hybrid. Employees are afforded the autonomy to determine the extent of their work in the office or remotely, according to their individual needs. This approach is the most flexible, yet also the most complex to manage in terms of infrastructure and methodology.
- -
- Enable interoperability with room reservation systems, shared calendars, and room edge systems to monitor reservations.
- -
- Enable real-time monitoring of occupancy by tracking occupancy flows. The facility manager can not only plan the reconfiguration of rooms, but also set up customized cleaning and disinfection systems for individual areas.
- -
- Provide real-time monitoring of environmental quality in terms of health and comfort conditions (temperature, humidity, lighting, and IAQ).
- -
- Provide data correlation analysis through business intelligence (BI) systems to define occupancy strategies aimed at correct space allocation and reducing energy and service costs.
- -
- Climate;
- -
- Building envelope;
- -
- M&E systems;
- -
- Interior design criteria and operation;
- -
- Maintenance of building energy use;
- -
- Occupant behavior.
- Variations due to the active interaction of occupants with building systems. The active interaction of occupants with building energy systems is a complex mechanism, where numerous parameters, including the number of occupants, occupant behavior, type of space, type of work, day, and time, exert a significant influence. The aforementioned parameters can be classified into three distinct groups: temporal, spatial, and occupancy. Temporal parameters indicate the time scale, while spatial parameters indicate spatial information. Occupancy parameters, on the other hand, indicate occupant behavior. It can be reasonably argued that psychological and sociological aspects exert a considerable influence on occupant behavior. Given the inherent unpredictability of occupants’ behavior, it remains challenging to identify any specific circumstances that may influence the consumption of energy. This uncertainty has a significant impact on the indoor environment, which in turn contributes to the observed variations in energy consumption. Other factors that influence occupants’ behavior include temperature, humidity, illuminance factor, and several others, which collectively affect the building’s energy consumption. The most common forms of occupant behavior are adjusting the thermostat, dimming the lighting, switching off lights, and using electronic devices.
- Variations due to the passive interaction of occupants with building systems. Passive interaction depends on the presence of occupants, reported as hours of occupancy in the building, and the absence of occupants, reported as hours of unoccupied building operation. It is possible that there is inefficient operation of the electrical and mechanical systems, which would result in high energy wastage during the unoccupied/occupied hours; this issue was further investigated to estimate the amount of energy wasted during unoccupied hours, with between 26% and 65% of energy being used during unoccupied/occupied hours, compared to working hours between 7.30 a.m. and 5 p.m. Of the total consumption, between 19% and 28% (mainly electricity and HVAC) is used during the weekend when the building is unoccupied [44].
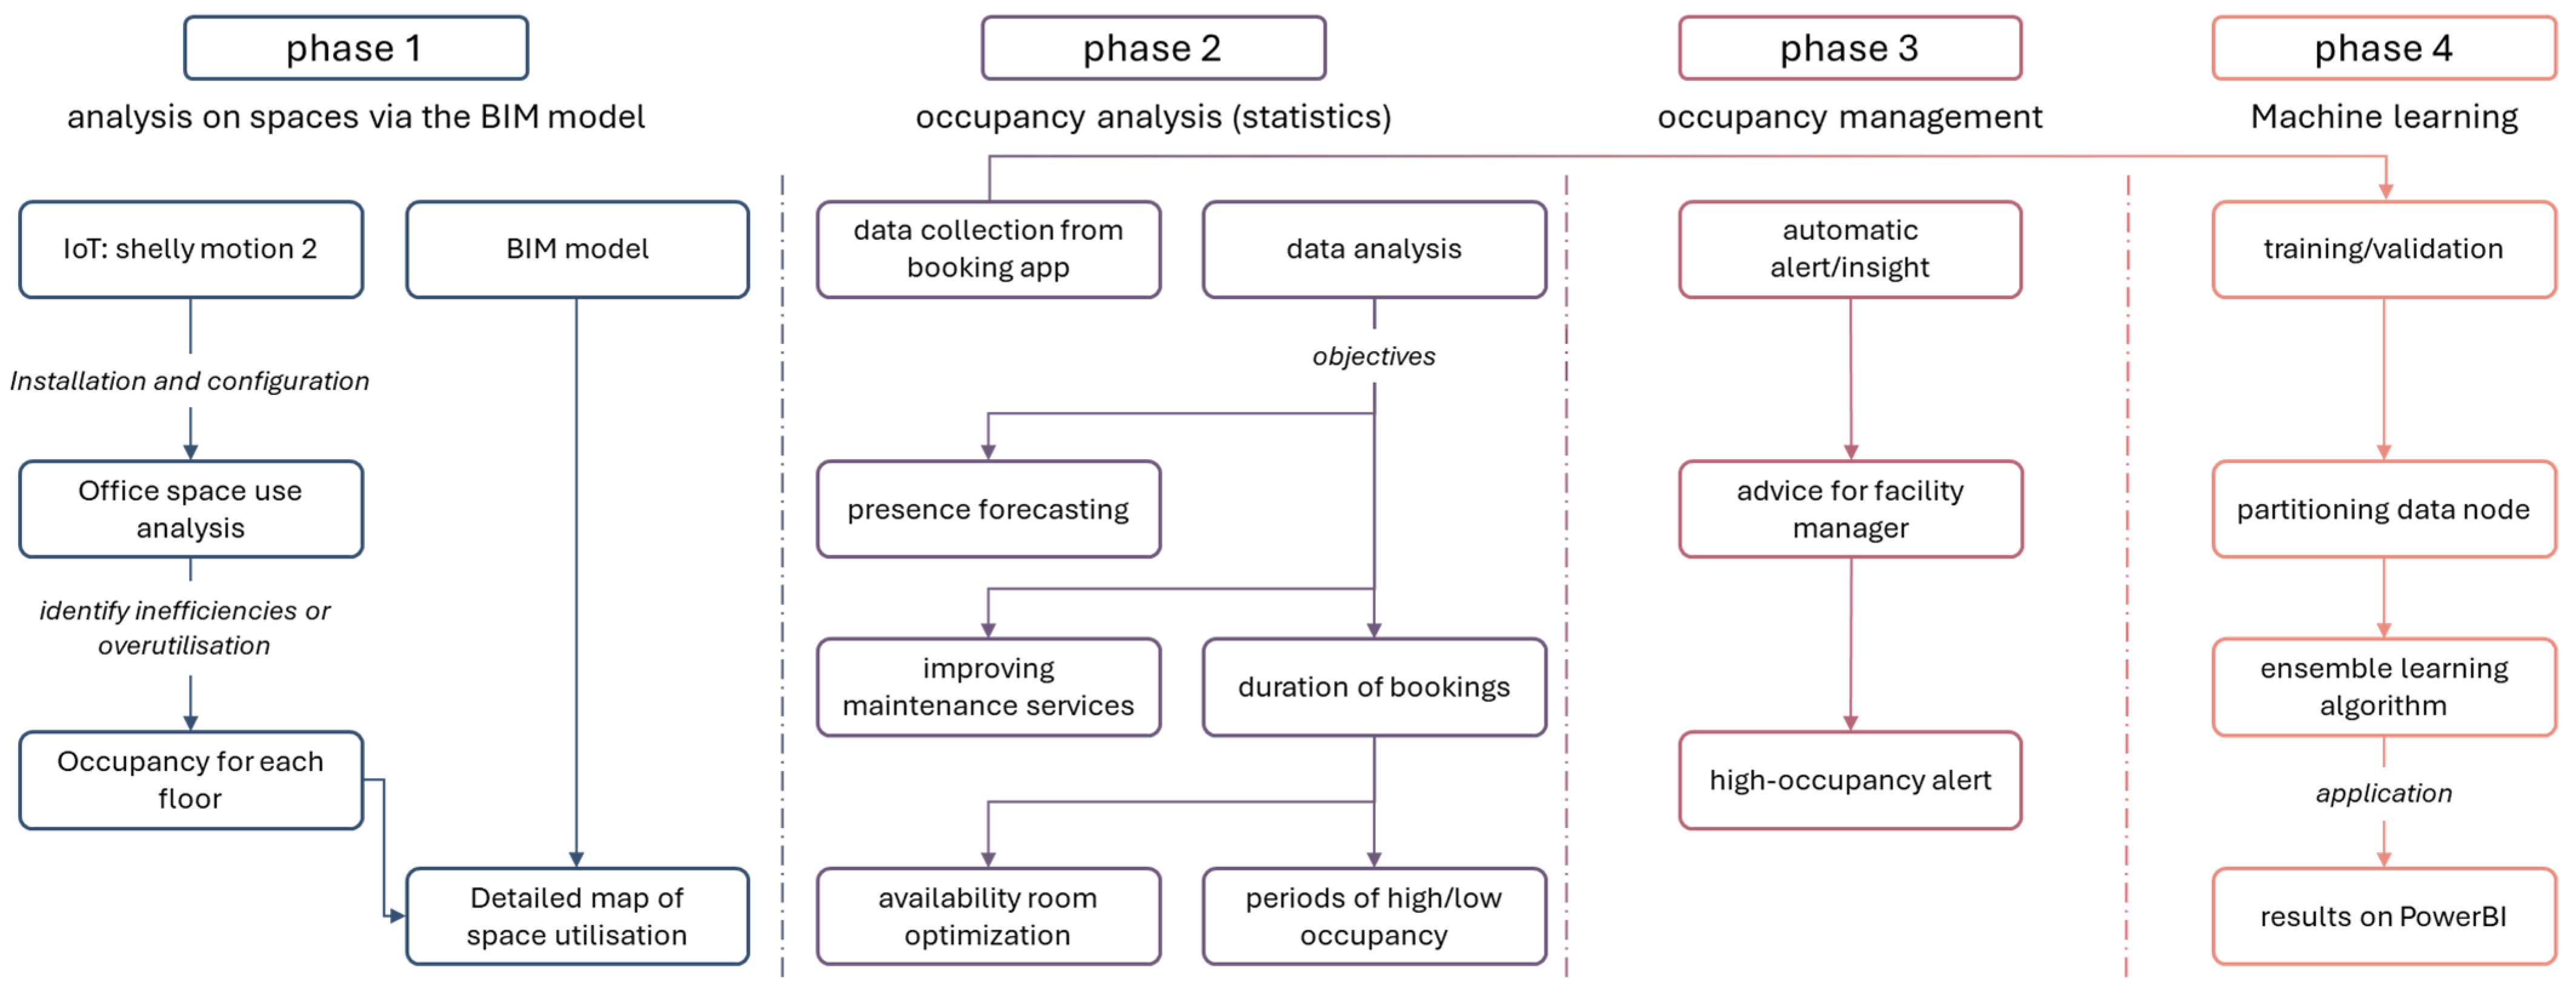
2.1. Methodology
- Space analysis via the BIM model: Through the use of IoT sensors, which can be easily installed and configured, it is possible to start the occupancy assessment process.
- -
- Use analysis: Evaluation of office space use to identify inefficiencies or cases of overutilization.
- -
- Occupancy measurement: Determine the occupancy percentage for each floor, with a detailed map of space use.
- Space analysis and management (statistics): Using data obtained from a dedicated booking application, through the utilization of BIM-integrated software, facilitates the examination of the actual use of workspaces, with the objective of optimizing their management. The specific objectives are as follows:
- -
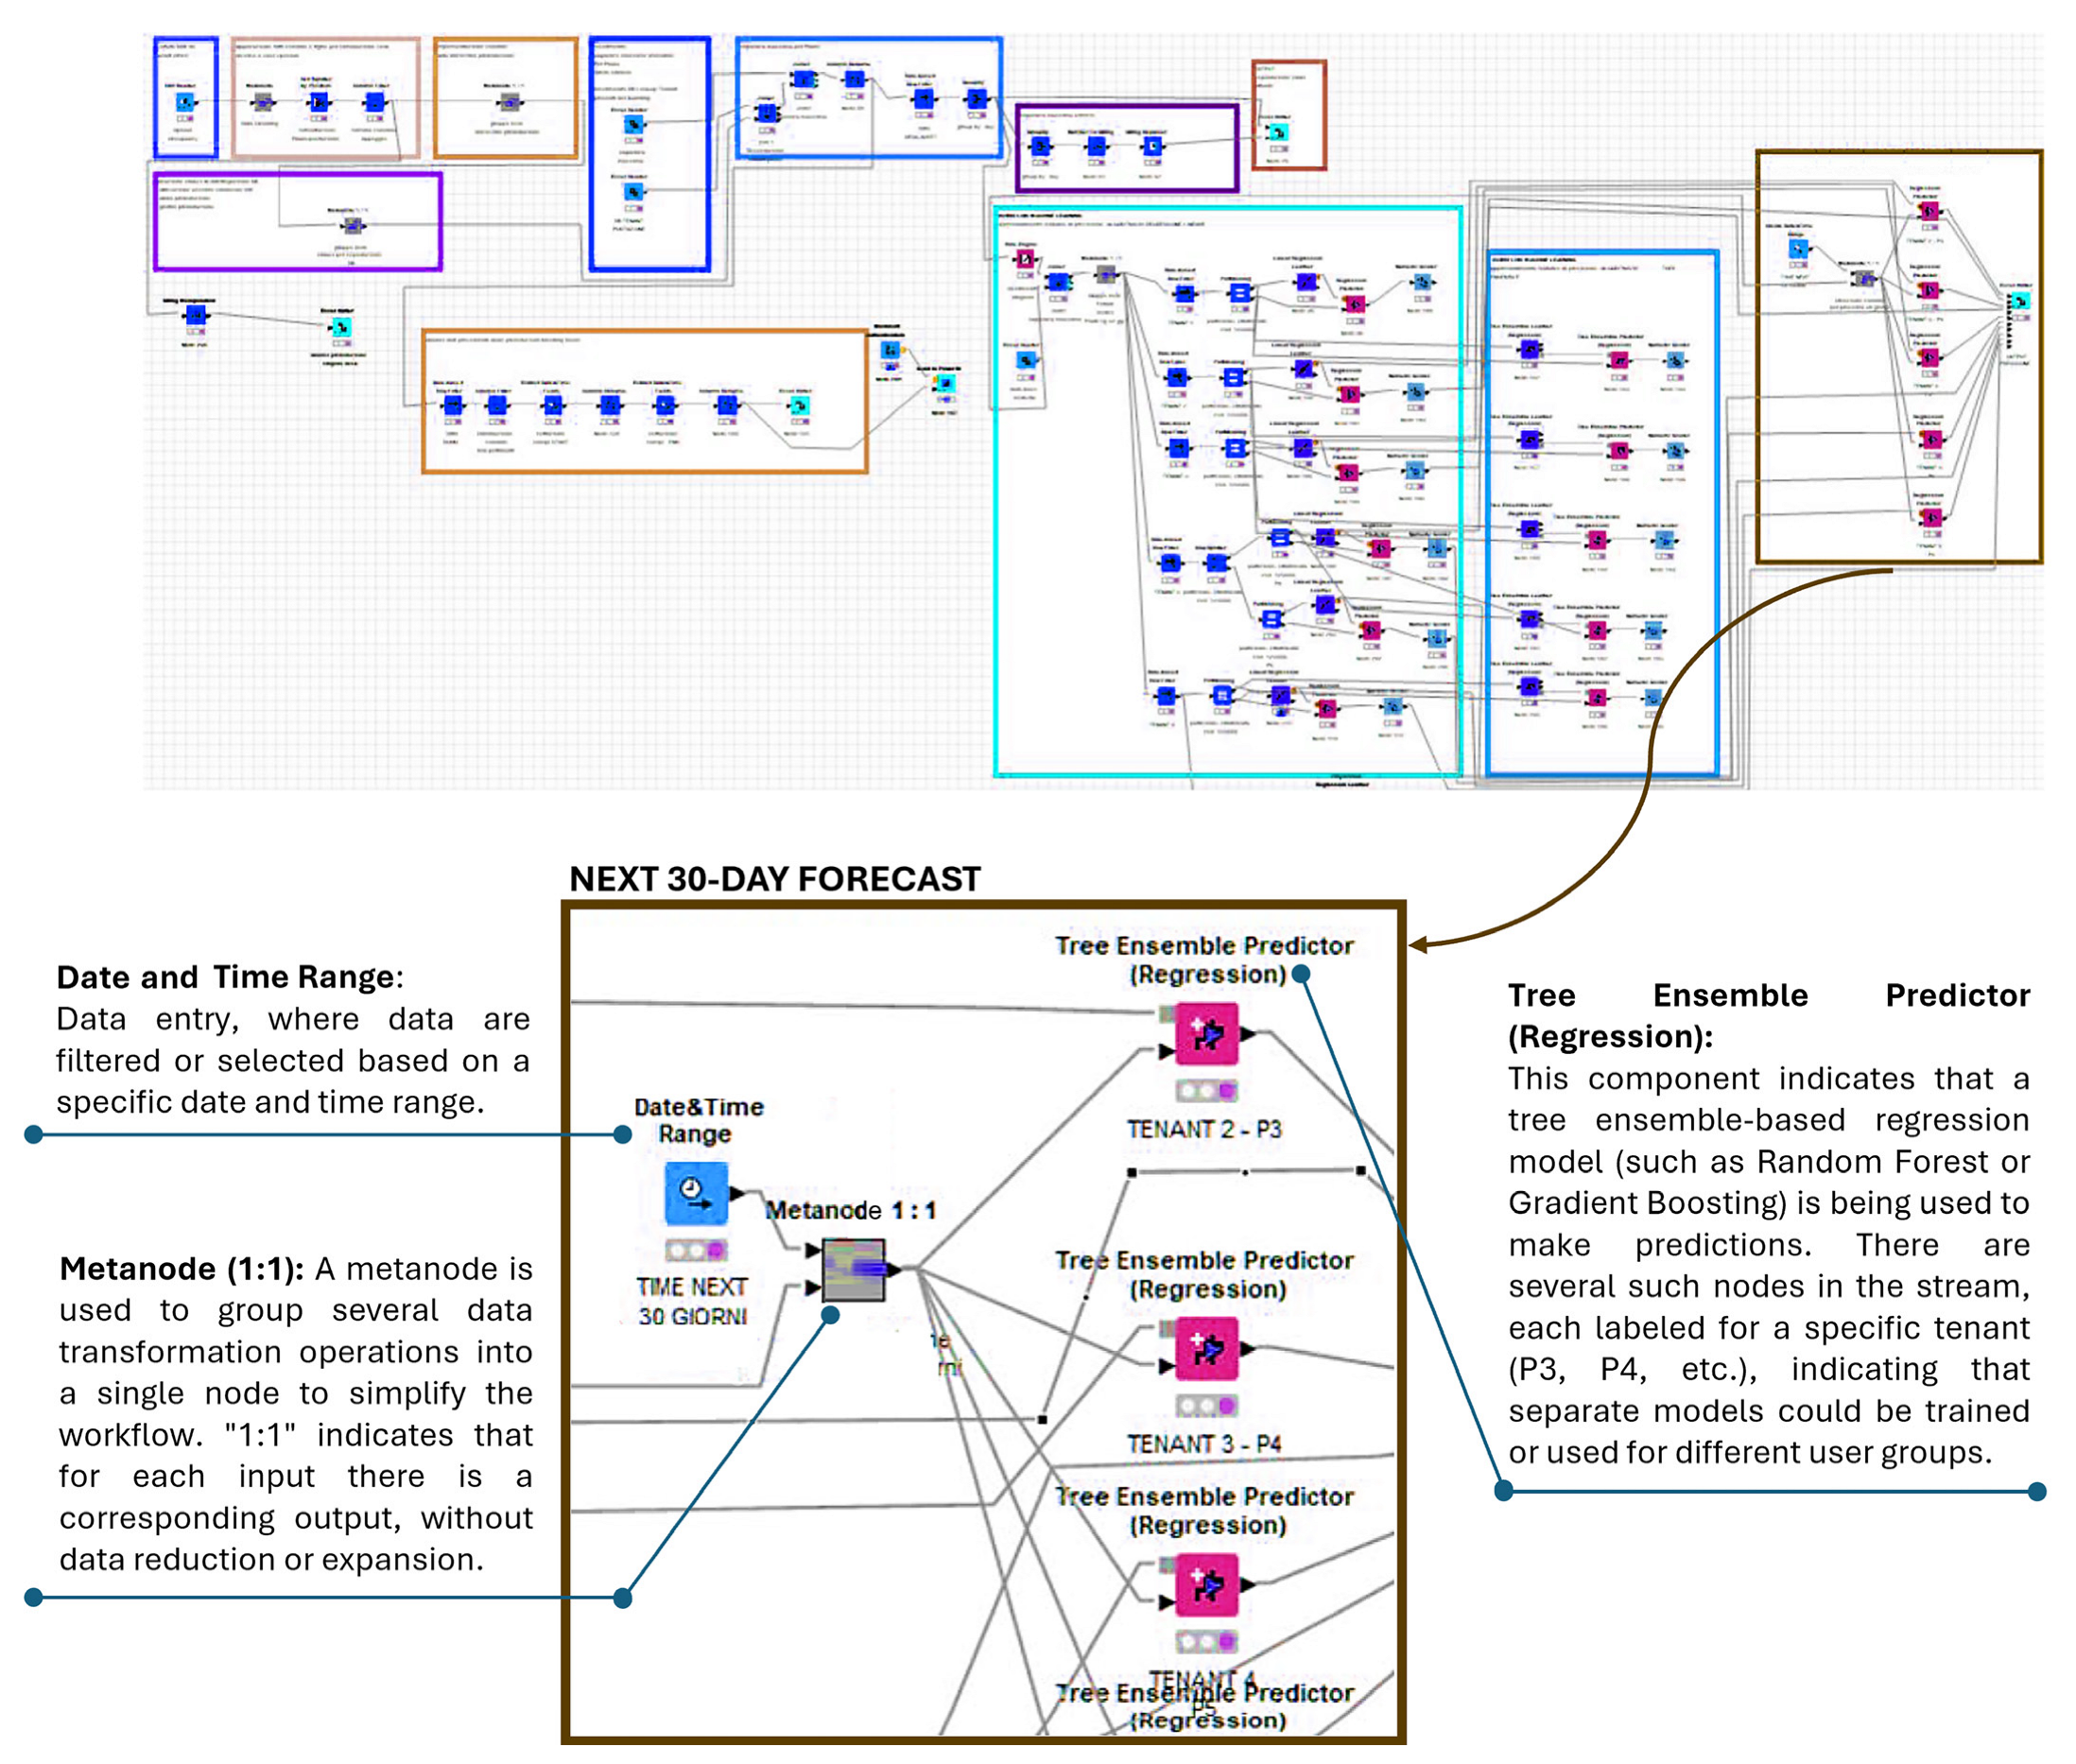
- Presence forecasting: Estimating building occupancy over the next 30 days based on historical booking data, allowing better maintenance services and the anticipation of space and resource requirements.
- -
- Savings analysis: Quantification of potential maintenance cost savings through appropriate operational downsizing. By analyzing space utilization, it is possible to identify areas that can be consolidated or downsized, thus reducing operating costs.
- -
- Duration of bookings: Calculation of the average duration of room bookings to optimize space availability. Knowing the typical duration of bookings allows you to better plan the use of meeting rooms, avoiding overlaps and improving efficiency in resource allocation.
- -
- Temporal assessment of room use: Examination of meeting room usage by time of day and day of the week and the identification of high- and low-occupancy periods. This provides a better understanding of space utilization patterns, allowing for more flexible and adaptive management.
- Insight and automated alerts: Provide automatic alerts to the building manager [55] to improve space management [56]. These alerts signal when there is a high probability that a particular floor or the entire building will reach 100% occupancy on a particular day or period, allowing for more efficient planning of the necessary resources.
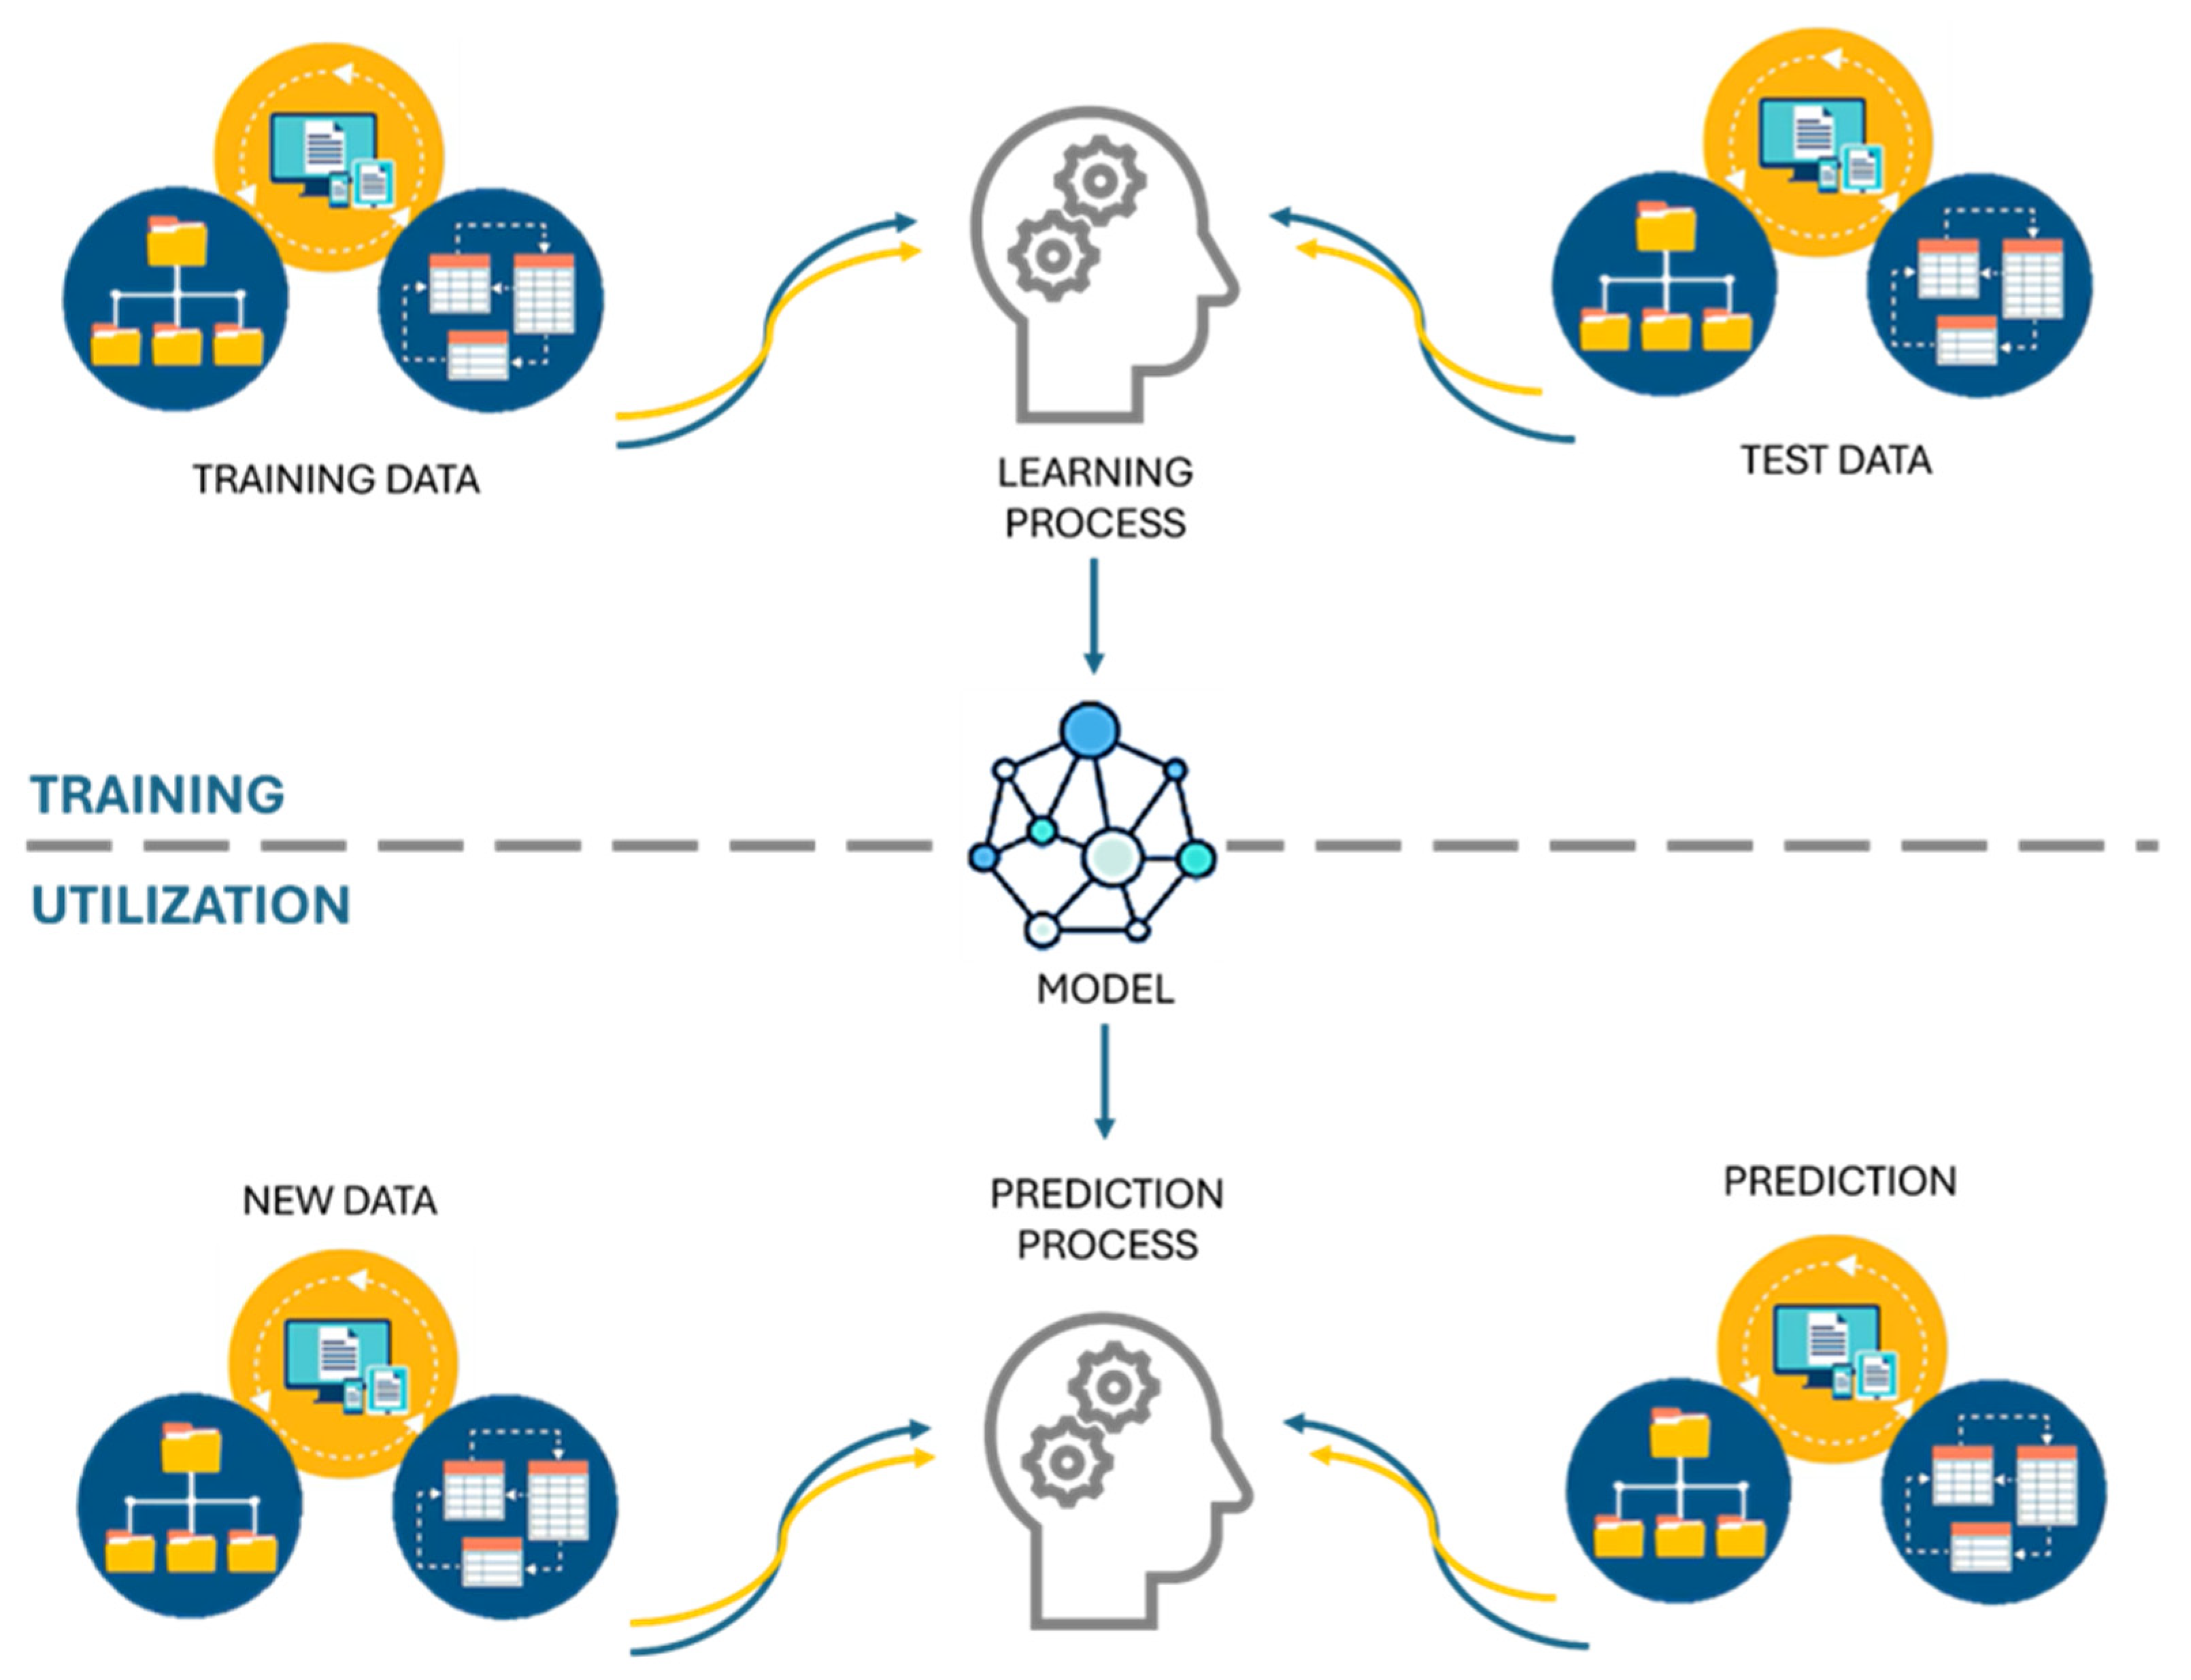
- Machine learning: This stage uses ML to make reliable predictions and generate insights [57], going beyond the traditional programming approach [58]. The system learns from the relationships between data and outcomes, identifying patterns and connections that may not be obvious to human intelligence [59]. This ‘knowledge discovery’ process not only provides useful results, but can also reveal new, previously unknown/ignored/unexpected information.
2.1.1. Analysis of Spaces via the BIM Model—Phase 1
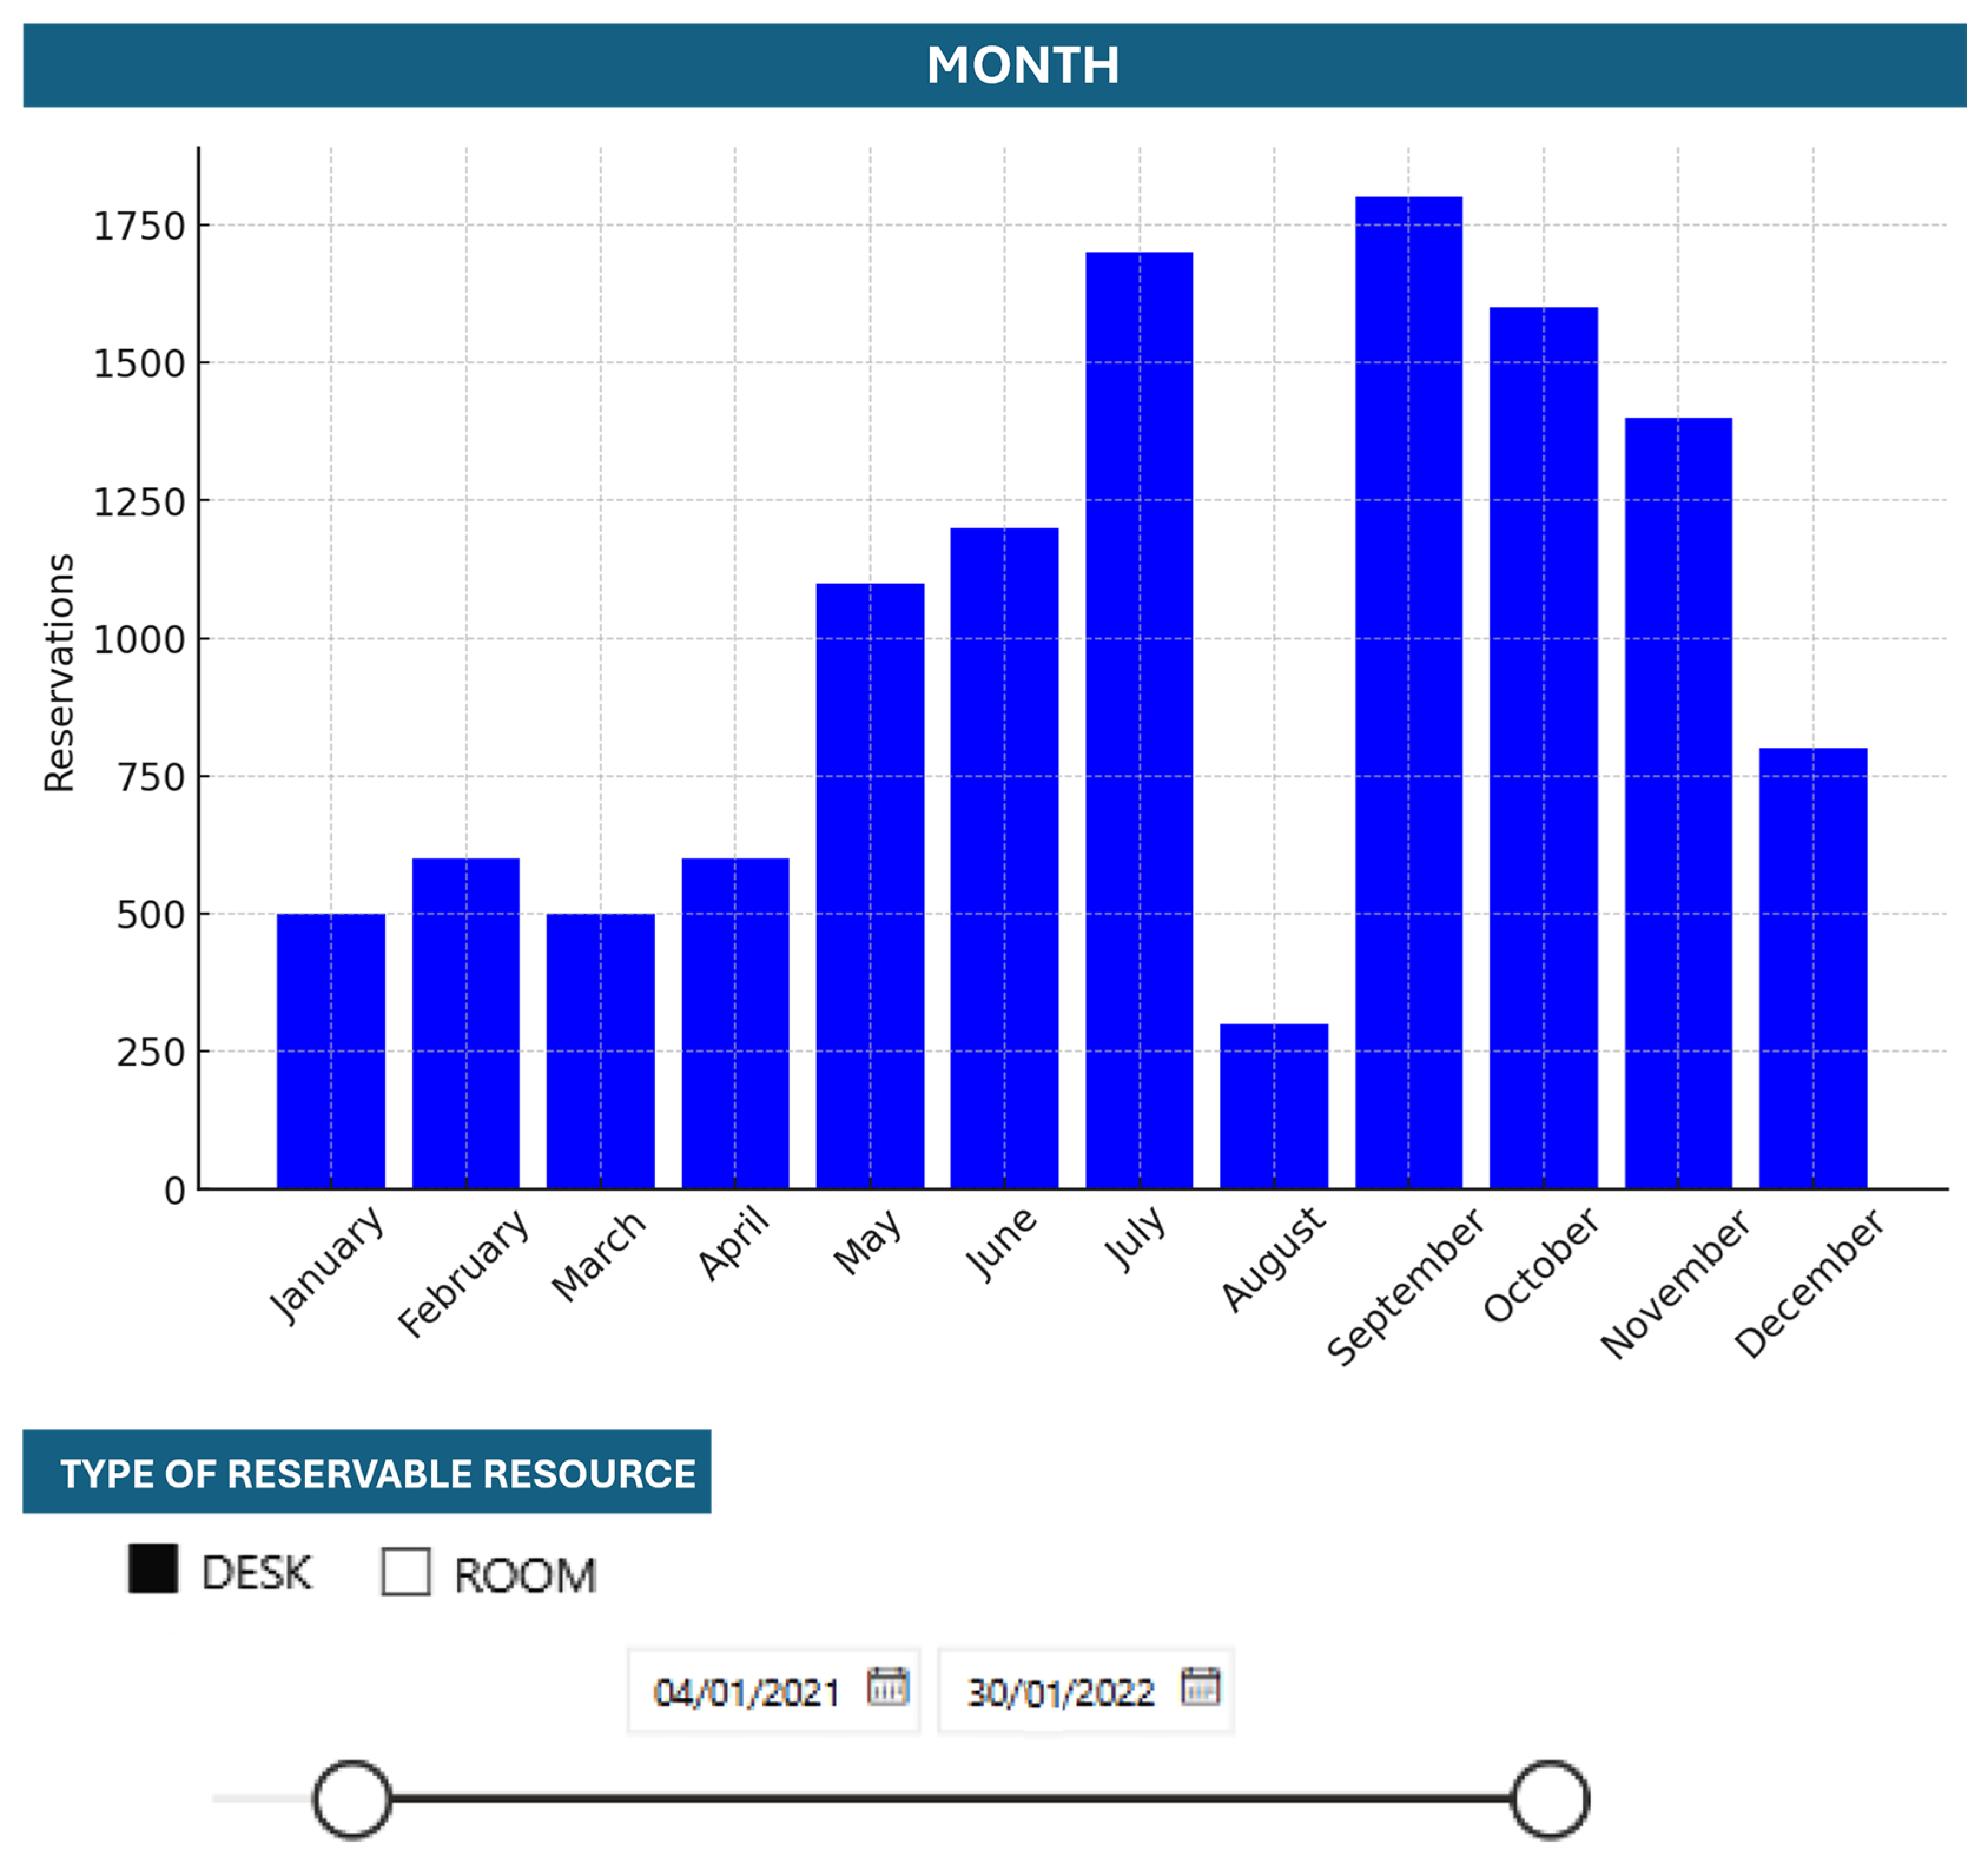
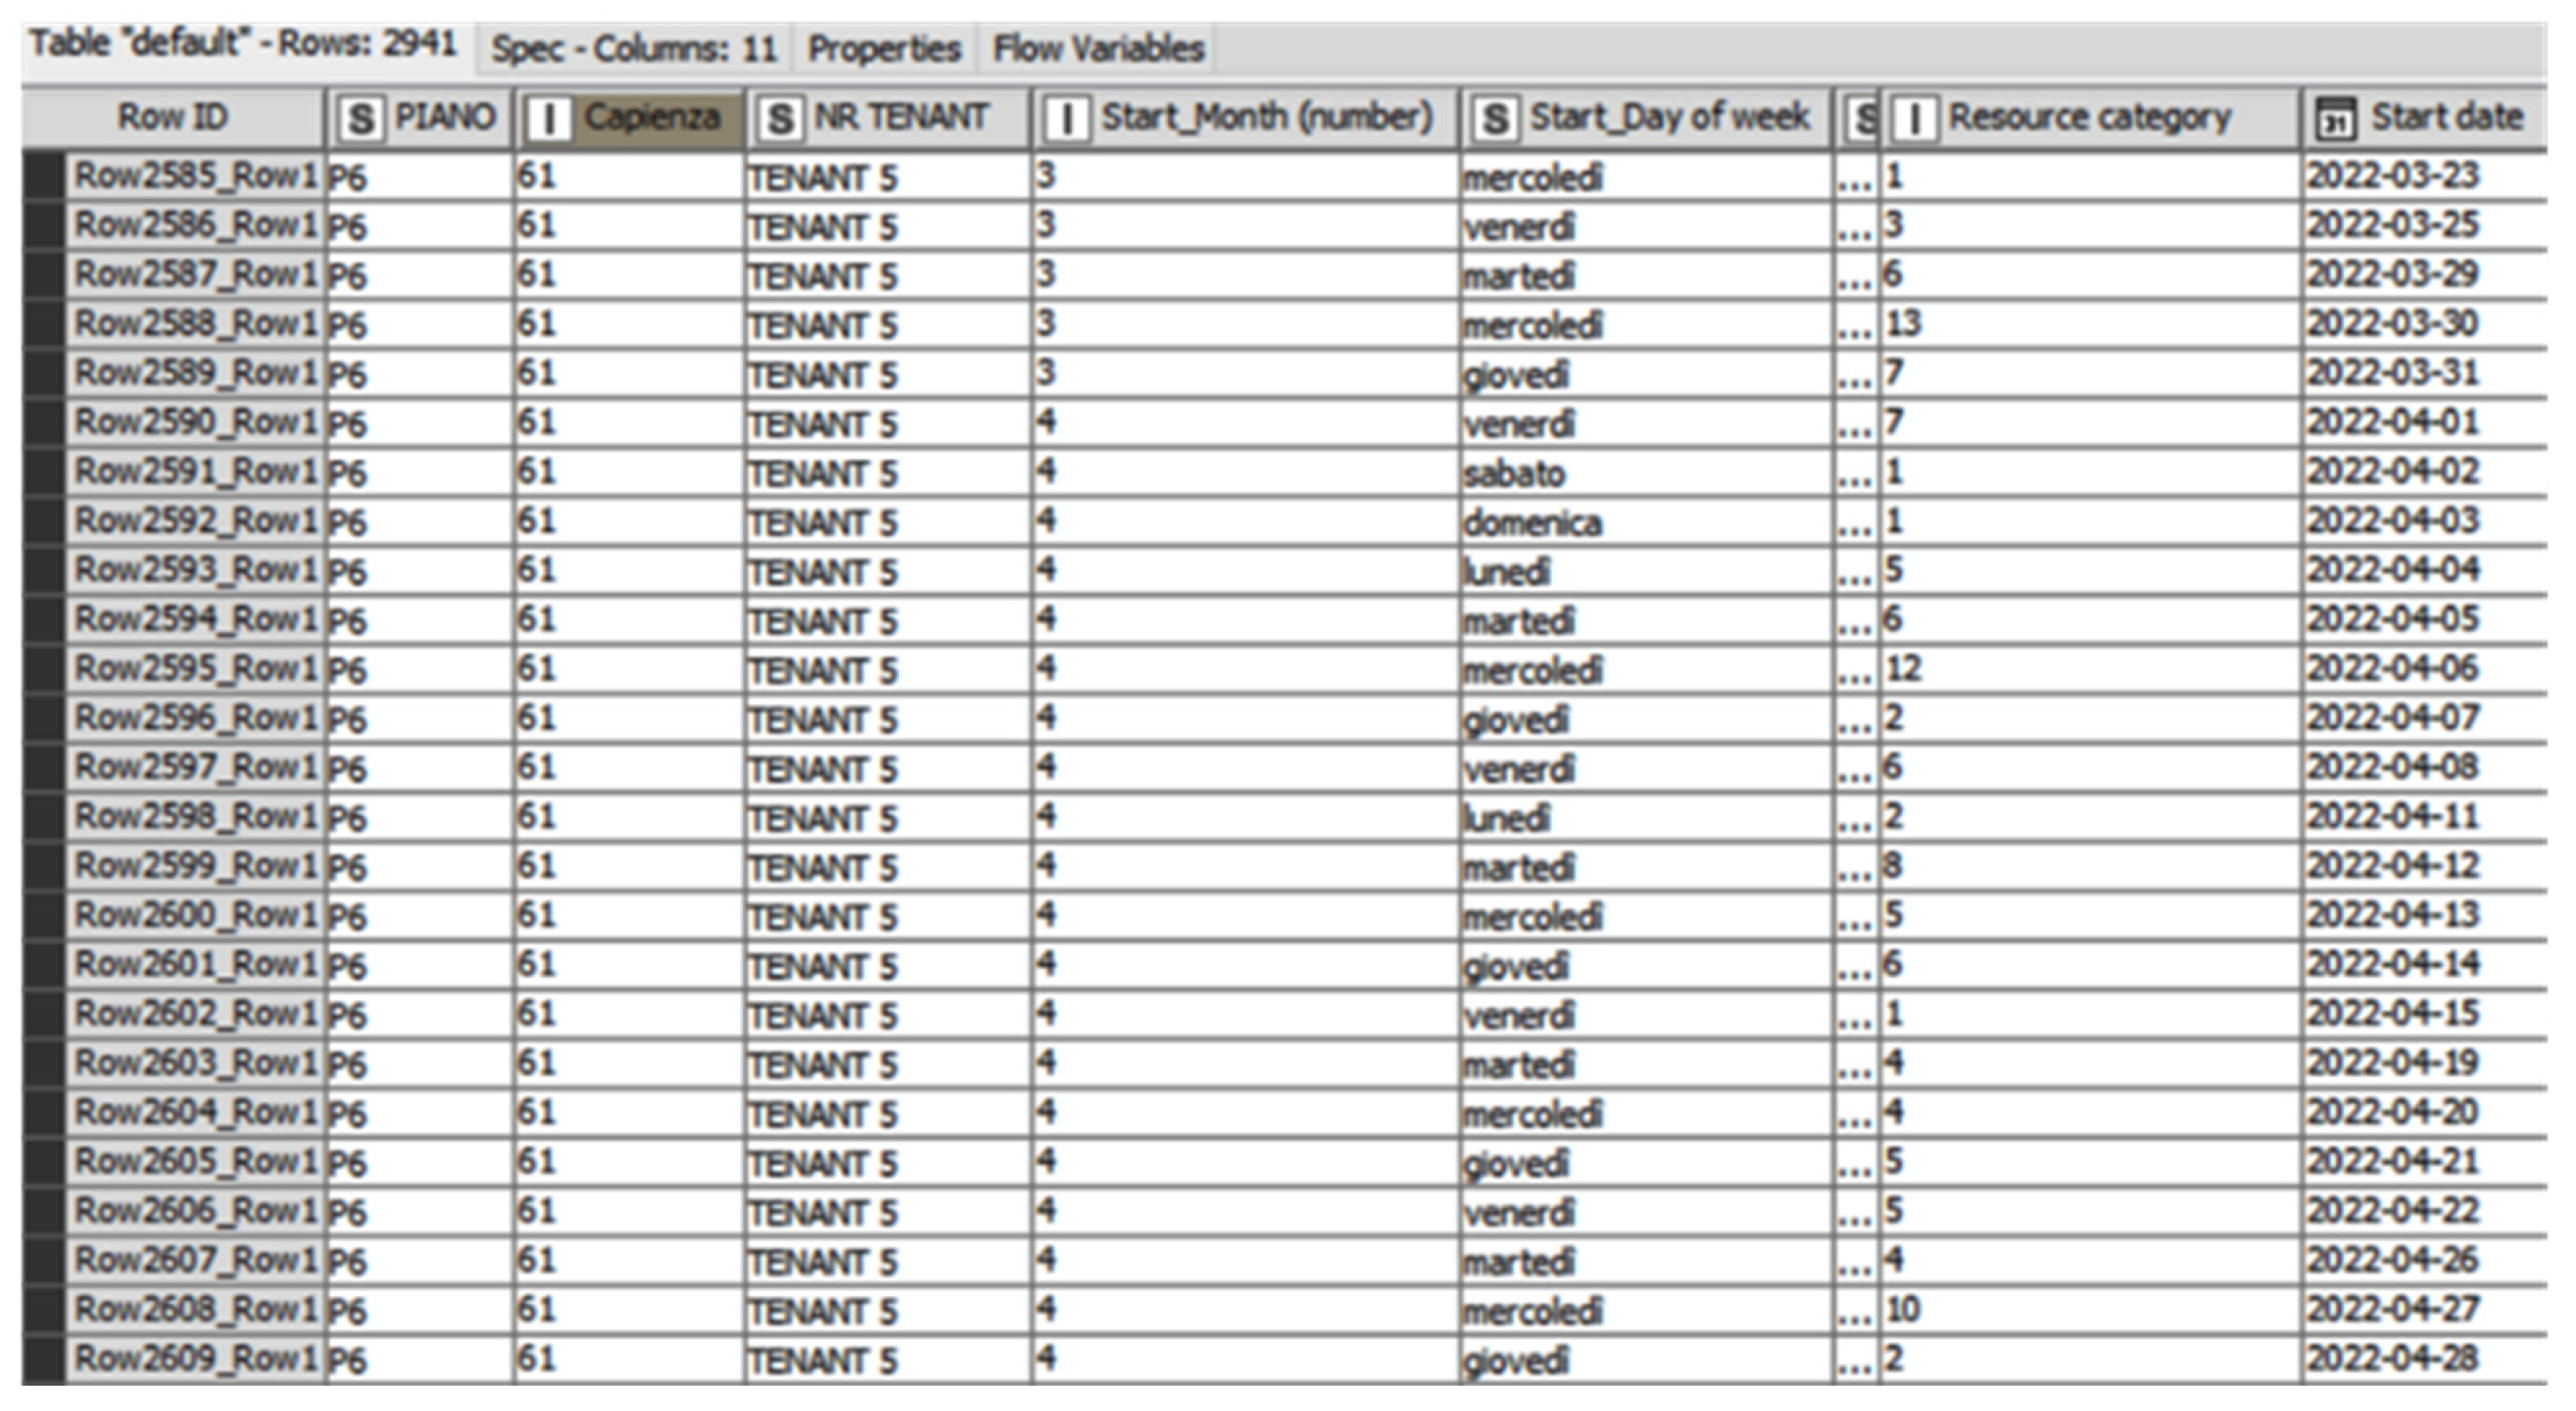
2.1.2. Optimizing Space Management through Data Analysis (Statistics)—Phase 2
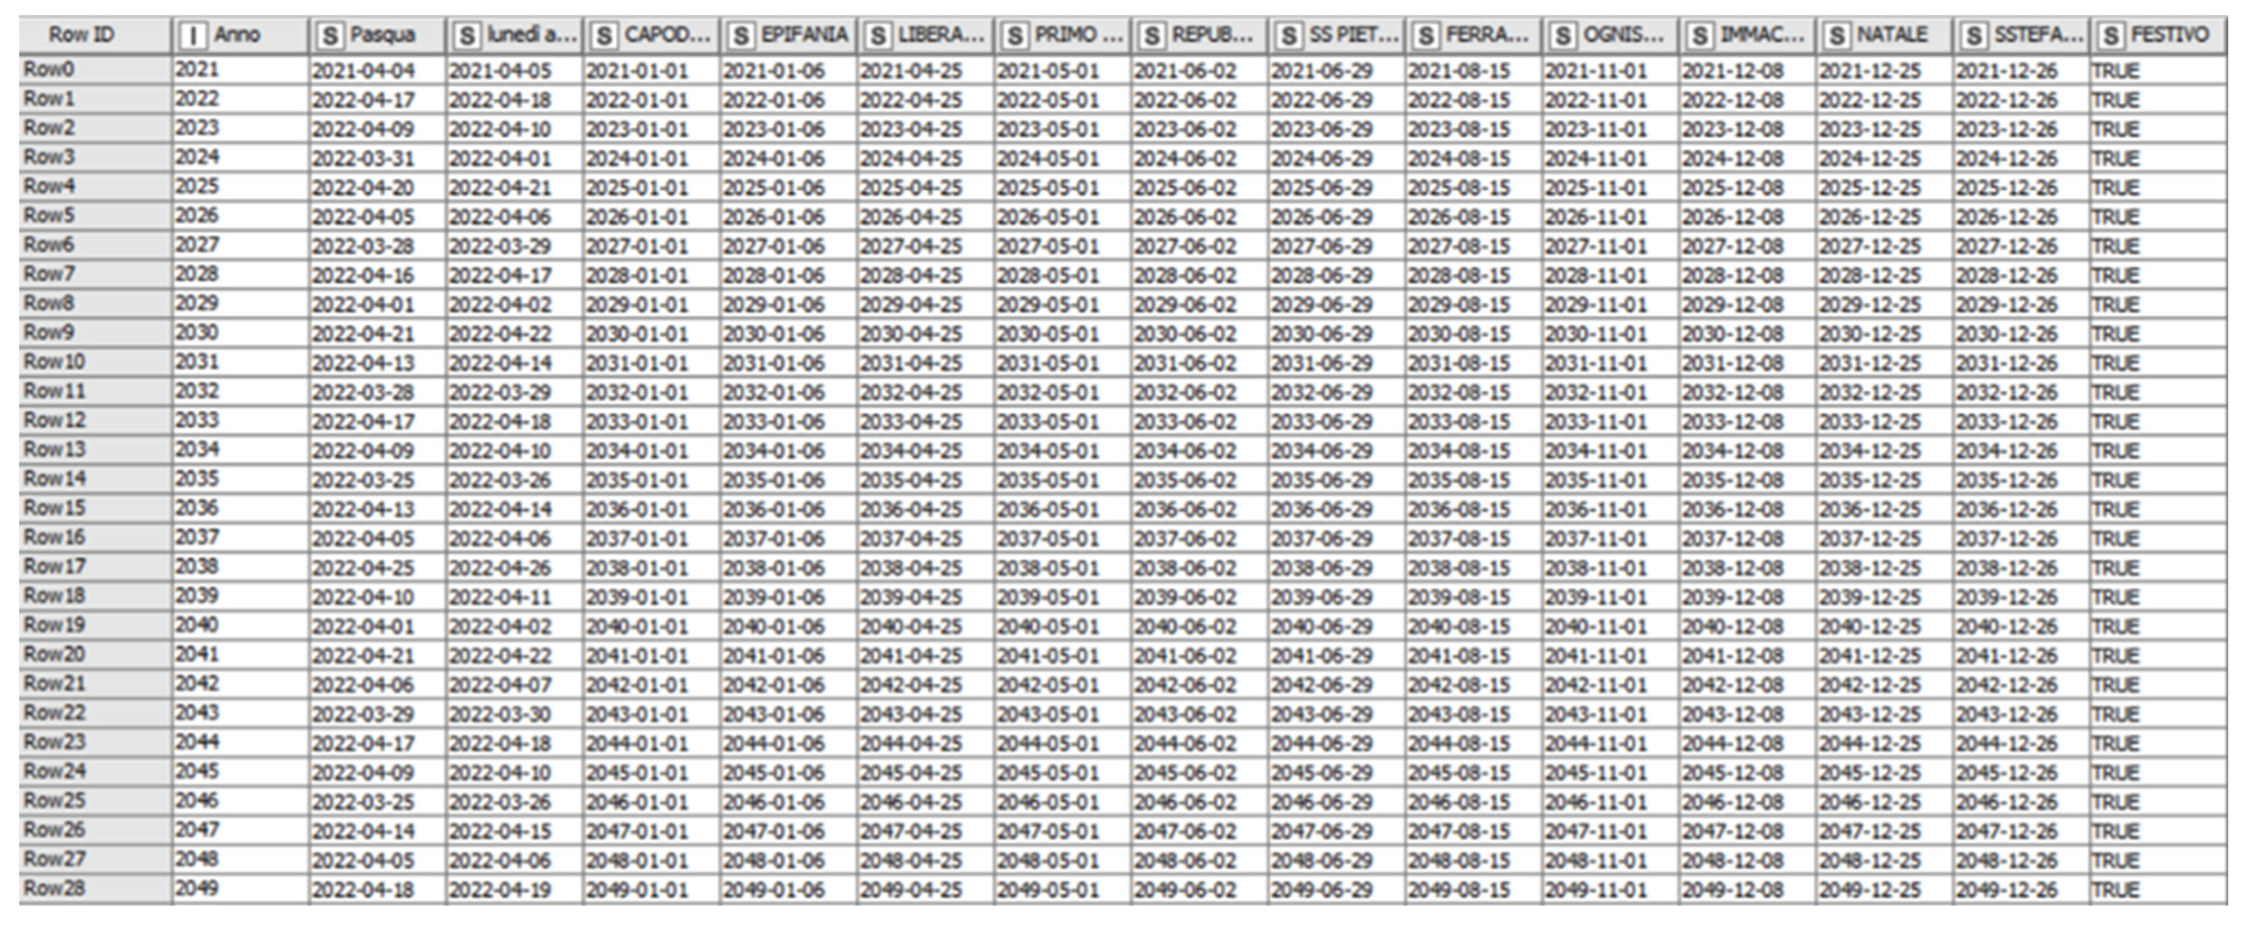
- -
- A dataset of Italian holidays up to the year 2100 (Figure 9);
- -
- Maximum capacity of each floor of the building;
- -
- Detailed links between location codes, floors, and tenants.
2.1.3. Insight and Automatic Alarms—Phase 3
- -
- Season (winter, spring, summer, autumn);
- -
- Reference month;
- -
- Bank holidays, weekdays, 1-day bank holidays, and 2-day bank holidays;
- -
- Days of the week.
2.1.4. Machine Learning for Enhanced Predictive Insights—Phase 4
3. Results and Discussion
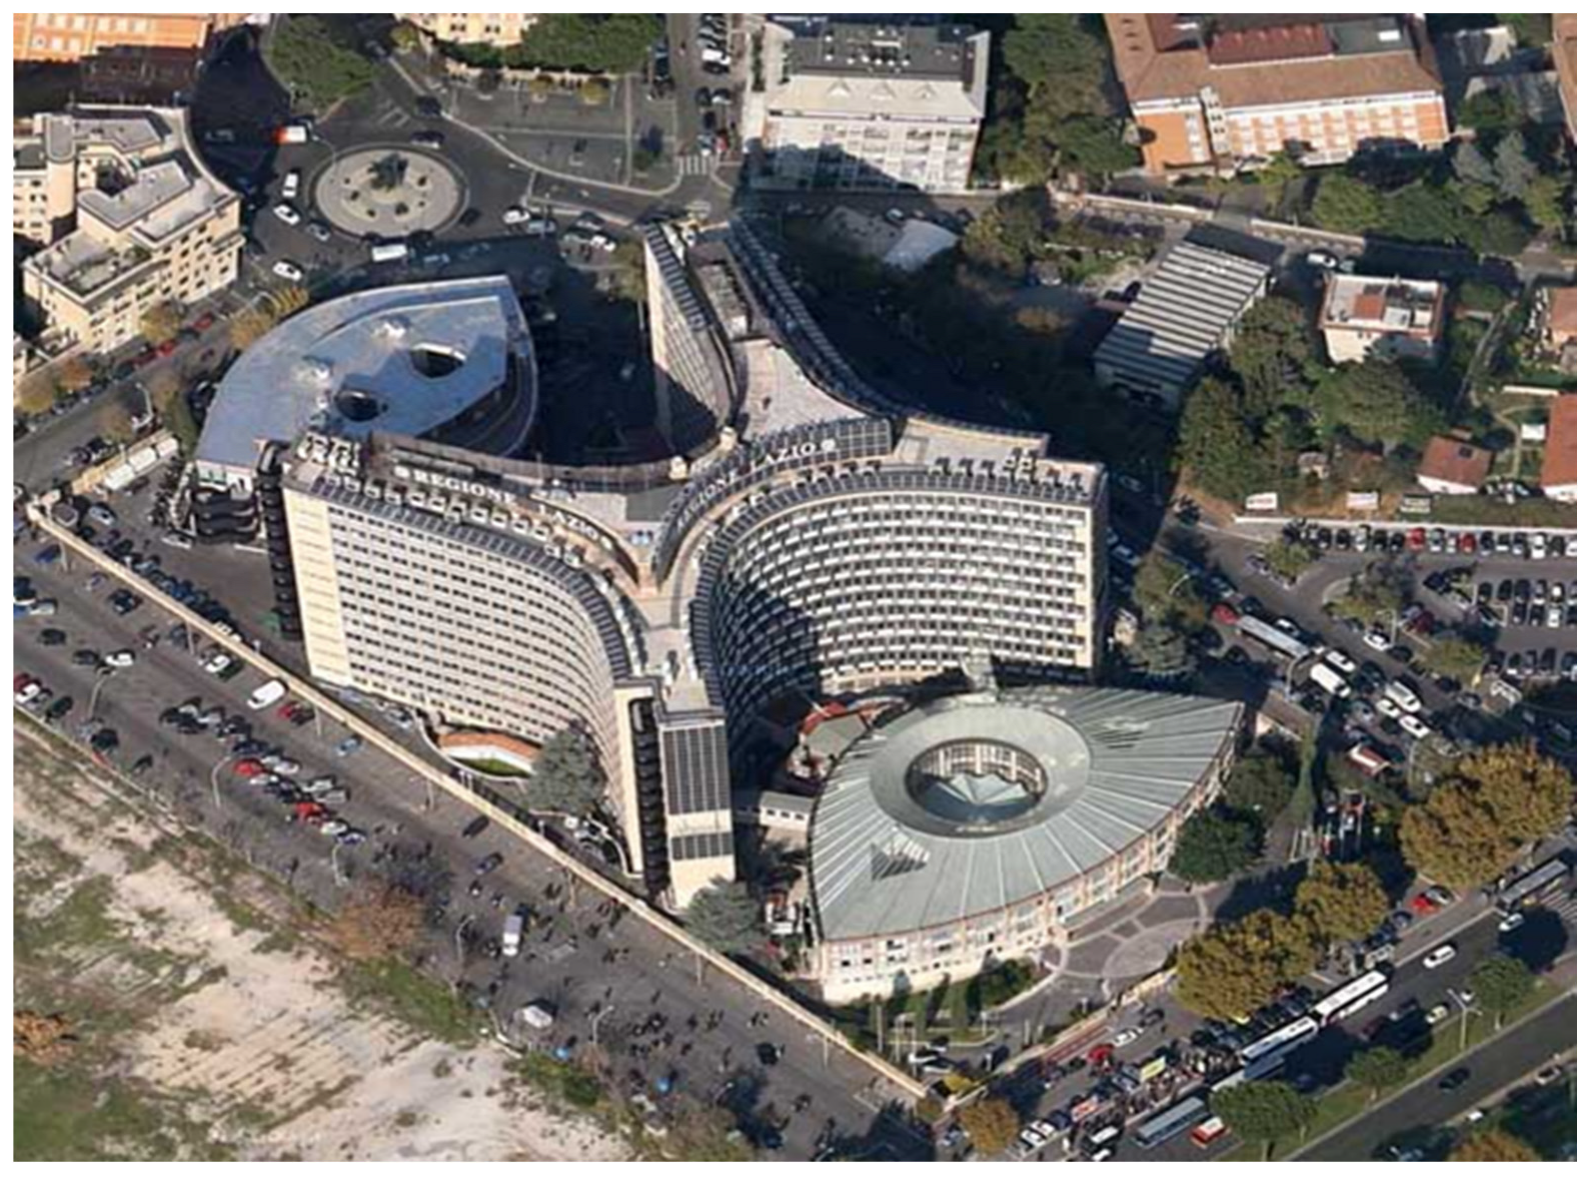
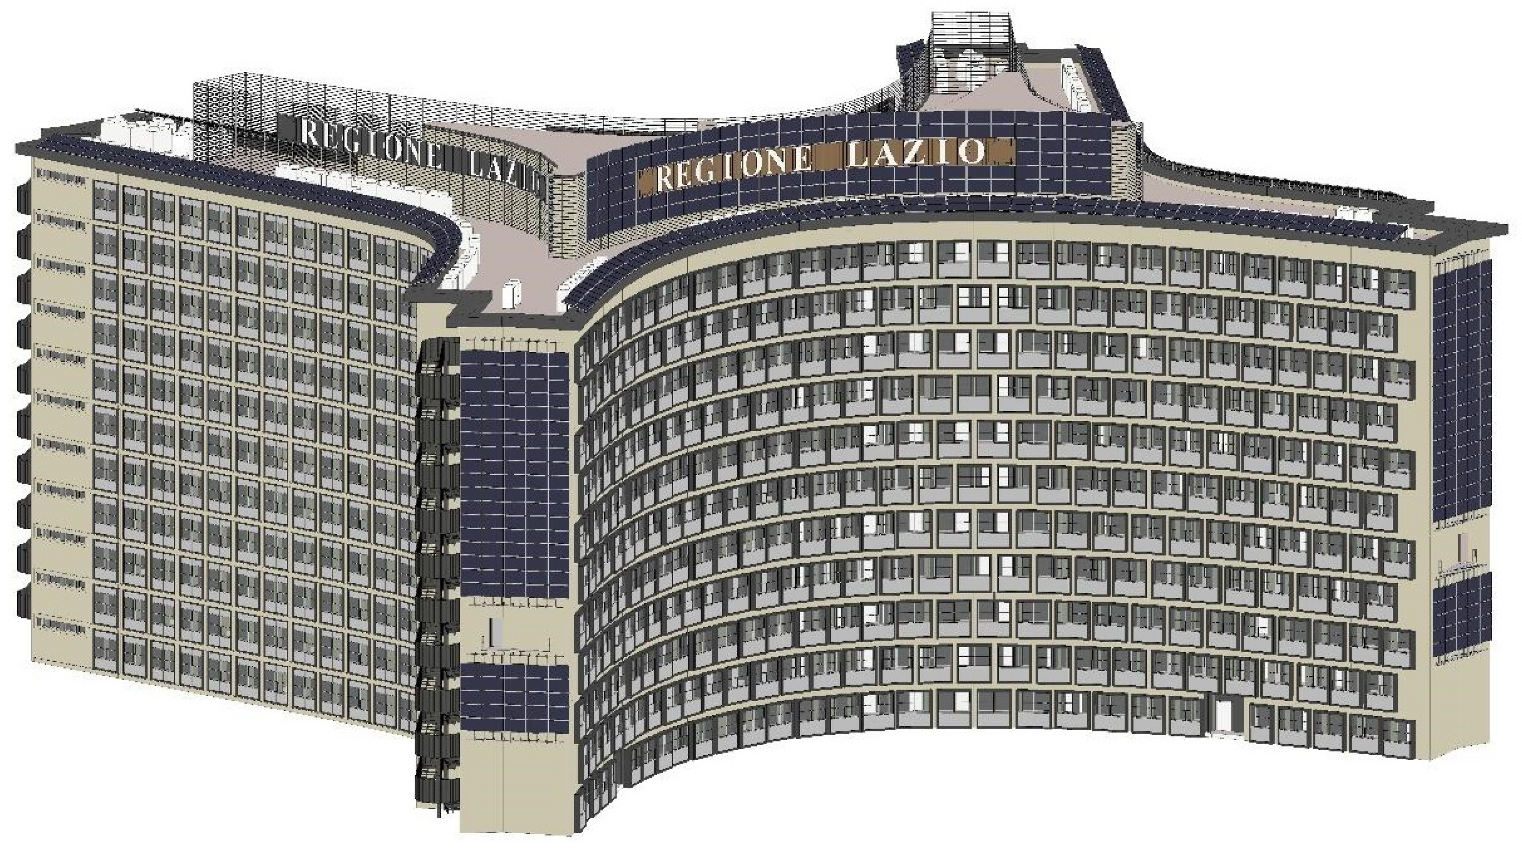
3.1. Case Study: Lazio Region Headquarters
3.2. Digital Transformation in Modern Work Environments
4. Conclusions
Author Contributions
Funding
Institutional Review Board Statement
Informed Consent Statement
Data Availability Statement
Conflicts of Interest
References
- Cumo, F. Innovation for the Digitization Process of the AECO Sector. In Proceedings of the Technological Imagination in the Green and Digital Transition (CONF.ITECH 2022), Rome, Italy, 30 June–1 July 2022; The Urban Book Series. Springer: Cham, Switzerland, 2023. [Google Scholar] [CrossRef]
- Piras, G.; Agostinelli, S.; Muzi, F. Digital Twin Framework for Built Environment: A Review of Key Enablers. Energies 2024, 17, 436. [Google Scholar] [CrossRef]
- Lamagna, M.; Groppi, D.; Nezhad, M.M.; Piras, G. A comprehensive review on Digital twins for Smart energy management system. Int. J. Energy Prod. Manag. 2021, 6, 323–334. [Google Scholar] [CrossRef]
- Grieves, M. Digital Twin: Manufacturing Excellence through Virtual Factory Replication. White Paper. 2014. Available online: https://www.researchgate.net/publication/275211047_Digital_Twin_Manufacturing_Excellence_through_Virtual_Factory_Replication (accessed on 15 April 2024).
- Research and Markets. Digital Twin Market Research Report: By Type, Technology, Enterprise, Application, Industry—Global Industry Analysis and Growth Forecast to 2030. Available online: https://www.researchandmarkets.com/reports/5128896/digital-twin-market-research-report-by-type (accessed on 11 March 2024).
- Muzi, F.; Marzo, R.; Nardi, F. Digital Information Management in the Built Environment: Data-Driven Approaches for Building Process Optimization. In Proceedings of the International Conference on Technological Imagination in the Green and Digital Transition, Rome, Italy, 30 June–2 July 2022; Springer International Publishing: Cham, Switzerland, 2023; pp. 123–132. [Google Scholar] [CrossRef]
- Orsini, G.; Piras, G. Digital Construction and Management the Public’s Infrastructures. In Proceedings of the Technological Imagination in the Green and Digital Transition (CONF.ITECH 2022), Rome, Italy, 30 June–1 July 2022; The Urban Book Series. Springer: Cham, Switzerland, 2023. [Google Scholar] [CrossRef]
- IFC. Available online: https://www.buildingsmart.org/standards/bsi-standards/industry-foundation-classes/ (accessed on 29 April 2024).
- Matarneh, S.; Elghaish, F.; Rahimian, F.P.; Dawood, N.; Edwards, D. Automated and interconnected facility management system: An open IFC cloud-based BIM solution. Autom. Constr. 2022, 143, 104569. [Google Scholar] [CrossRef]
- Cespedes-Cubides, A.S.; Jradi, M. A review of building digital twins to improve energy efficiency in the building operational stage. Energy Inf. 2024, 7, 11. [Google Scholar] [CrossRef]
- Alankarage, S.; Chileshe, N.; Rameezdeen, R.; Edwards, D.J.; Samaraweera, A. Exploring BIM-triggered organisational and professional culture change: A systematic literature review. Constr. Innov. 2023, 23, 229–247. [Google Scholar] [CrossRef]
- Tu, B.; Zuo, J.; Chang, R.-D.; Webber, R.J.; Xiong, F.; Dong, N. A system dynamic model for assessing the level of BIM implementation in construction phase: A China case study. Eng. Constr. Archit. Manag. 2023, 30, 1321–1343. [Google Scholar] [CrossRef]
- Sun, J.; Paasch, J.M.; Paulsson, J.; Tarandi, V.; Harrie, L. A BIM-based approach to design a lifecycle 3D property formation process: A Swedish case study. Land Use Policy 2023, 131, 106712. [Google Scholar] [CrossRef]
- Piras, G.; Muzi, F. Energy Transition: Semi-Automatic BIM Tool Approach for Elevating Sustainability in the Maputo Natural History Museum. Energies 2024, 17, 775. [Google Scholar] [CrossRef]
- Sakr, M.; Sadhu, A. Visualization of structural health monitoring information using Internet-of-Things integrated with building information modeling. J. Infrastruct. Intell. Resil. 2023, 2, 100053. [Google Scholar] [CrossRef]
- Pan, Y.; Zhang, L. A BIM-data mining integrated digital twin framework for advanced project management. Autom. Constr. 2021, 124, 103564. [Google Scholar] [CrossRef]
- Blut, C.; Becker, R.; Kinnen, T.; Schluetter, D.; Emunds, C.; Frisch, J.; Heidermann, D.; Wenthe, M.; Rettig, T.; Baranski, M.; et al. Optimizing Building Energy Systems through BIM-enabled georeferenced Digital Twins. Int. Arch. Photogramm. Remote Sens. Spat. Inf. Sci. 2024, 48, 1–8. [Google Scholar] [CrossRef]
- Ngamakeur, K.; Yongchareon, S.; Yu, J.; Islam, S. Passive infrared sensor dataset and deep learning models for device-free indoor localization and tracking. Pervasive Mob. Comput. 2023, 88, 101721. [Google Scholar] [CrossRef]
- Wu, Y.; Chen, S.; Jin, Y.; Xu, H.; Zhou, X.; Wang, X.; Chong, A.; Li, J.; Yan, D. Novel occupancy detection method based on convolutional neural network model using PIR sensor and smart meter data. Adv. Eng. Inform. 2024, 62, 102589. [Google Scholar] [CrossRef]
- Futagami, T. Experimental evaluation for occupancy lighting control using combination of PIR and image-based sensors. SICE J. Control. Meas. Syst. Integr. 2024, 17, 32–42. [Google Scholar] [CrossRef]
- Romero, D.A.V.; Laureano, E.V.; Betancourt, R.O.J.; Álvarez, E.N. An open source IoT edge-computing system for monitoring energy consumption in buildings. Results Eng. 2024, 21, 101875. [Google Scholar] [CrossRef]
- Cumo, F.; Piras, G.; Pennacchia, E.; Cinquepalmi, F. Optimization of design and management of a hydroponic greenhouse by using BIM application software. Int. J. Sustain. Dev. Plan. 2020, 15, 157–163. [Google Scholar] [CrossRef]
- Cumo, F.; Pennacchia, E.; Zylka, C. Energy-Efficient Solutions: A Multi-Criteria Decision Aid Tool to Achieve the Targets of the European EPDB Directive. Energies 2023, 16, 6245. [Google Scholar] [CrossRef]
- Cumo, F.; Giustini, F.; Pennacchia, E.; Romeo, C. The “D2P” Approach: Digitalization, Production and Performance in the Standardised Sustainable Deep Renovation of Buildings. Energies 2022, 15, 6689. [Google Scholar] [CrossRef]
- Piras, G.; Muzi, F.; Tiburcio, V.A. Digital Management Methodology for Building Production Optimization through Digital Twin and Artificial Intelligence Integration. Buildings 2024, 14, 2110. [Google Scholar] [CrossRef]
- Mckinsey Tech Trends 2022 Report. Available online: https://www.mckinsey.com/~/media/mckinsey/business%20functions/mckinsey%20digital/our%20insights/the%20top%20trends%20in%20tech%202022/mckinsey-tech-trends-outlook-2022-full-report.pdf (accessed on 10 June 2024).
- Heydari, A.; Nezhad, M.M.; Keynia, F.; Fekih, A.; Shahsavari-Pour, N.; Garcia, D.A.; Piras, G. A combined multi-objective intelligent optimization approach considering techno-economic and reliability factors for hybrid-renewable microgrid systems. J. Clean. Prod. 2023, 383, 135249. [Google Scholar] [CrossRef]
- Adhikary, A.; Halder, S.; Bose, R.; Panja, S.; Halder, S.; Pratihar, J.; Dey, A. Design and Implementation of an IOT-based Smart Home Automation System in Real World Scenario. EAI Endorsed Trans. Internet Things 2024, 10. [Google Scholar] [CrossRef]
- Nivedha, M.; Titus, S. IoT-based monitoring of smart grid using high-gain converter with optimized maximum power point tracking. Electr. Eng. 2024, 106, 2297–2311. [Google Scholar] [CrossRef]
- Sujith, M.; Prabu, R.T.; Kumar AT, A.; Kumar, A. Performance analysis of CsPbI3-based solar cells under light emitting diode illumination as an energy harvester for IoT and indoor photovoltaics. J. Comput. Electron. 2024, 23, 866–873. [Google Scholar] [CrossRef]
- Krishna Rao, C.; Sahoo, S.K.; Yanine, F.F. An IoT-based intelligent smart energy monitoring system for solar PV power generation. Energy Harvest. Syst. 2024, 11, 20230015. [Google Scholar] [CrossRef]
- Rosa, R.L.; Boulebnane, L.; Pagano, A.; Giuliano, F.; Croce, D. Towards Mass-Scale IoT with Energy-Autonomous LoRaWAN Sensor Nodes. Sensors 2024, 24, 4279. [Google Scholar] [CrossRef] [PubMed]
- Cinquepalmi, F.; Piras, G. Earth Observation Technologies for Mitigating Urban Climate Changes. In Proceedings of the Technological Imagination in the Green and Digital Transition (CONF.ITECH 2022), Rome, Italy, 30 Jun–1 July 2022; The Urban Book Series. Springer: Cham, Switzerland, 2023. [Google Scholar] [CrossRef]
- Rewired and Running Ahead: Digital and AI Leaders Are Leaving the Rest Behind. Available online: https://www.mckinsey.com/capabilities/mckinsey-digital/our-insights/rewired-and-running-ahead-digital-and-ai-leaders-are-leaving-the-rest-behind (accessed on 18 June 2024).
- Regona, M.; Yigitcanlar, T.; Hon, C.; Teo, M. Artificial intelligence and sustainable development goals: Systematic literature review of the construction industry. Sustain. Cities Soc. 2024, 108, 105499. [Google Scholar] [CrossRef]
- Rajkumar, N.; Viji, C.; Latha, P.M.; Vennila, V.B.; Shanmugam, S.K.; Pillai, N.B. The power of AI, IoT, and advanced quantum based optical systems in smart cities. Opt. Quantum Electron. 2024, 56, 450. [Google Scholar] [CrossRef]
- Asif, M.; Naeem, G.; Khalid, M. Digitalization for sustainable buildings: Technologies, applications, potential, and challenges. J. Clean. Prod. 2024, 450, 141814. [Google Scholar] [CrossRef]
- La Gestione BIM della Classificazione di Ponti Esistenti, Harpaceas. 2021. Available online: https://www.harpaceas.it/blog/pontisicuri-la-gestione-bim-della-classificazione-di-ponti-esistenti (accessed on 16 June 2024).
- Osservatori Digital PoliMi. Available online: https://www.osservatori.net/it/ricerche/comunicati-stampa/smart-working-emergenza-covid19-new-normal (accessed on 14 March 2024).
- International Data Corporations. Available online: https://www.idc.com/getdoc.jsp?containerId=IDC_P44469 (accessed on 14 March 2024).
- Marketers State of Remote Sensing. Available online: https://wearemarketers.net/remote-working-2021/ (accessed on 15 March 2024).
- Mao, Y.; Chen, J.; Liu, X.; Dang, J.; Schiöth, H.B. Social support predicted subsequent subjective well-being during the COVID-19 pandemic: A prospective study. BMC Public Health 2024, 24, 943. [Google Scholar] [CrossRef]
- Gourabpasi, A.H.; Nik-Bakht, M. BIM-based automated fault detection and diagnostics of HVAC systems in commercial buildings. J. Build. Eng. 2024, 87, 109022. [Google Scholar] [CrossRef]
- Li, B.; Tavakoli, A.; Heydarian, A. Occupant privacy perception, awareness, and preferences in smart office environments. Sci Rep. 2023, 13, 4073. [Google Scholar] [CrossRef]
- Marikyan, D.; Papagiannidis, S.; FRana, O.; Ranjan, R. Working in a smart home environment: Examining the impact on productivity, well-being and future use intention. Internet Res. 2024, 34, 447–473. [Google Scholar] [CrossRef]
- Edwardson, C.L.; Maylor, B.D.; Biddle, S.J.H.; Clarke-Cornwell, A.M.; Clemes, S.A.; Davies, M.J.; Dunstan, D.W.; Granat, M.H.; Gray, L.J.; Hadjiconstantinou, M.; et al. Participant and workplace champion experiences of an intervention designed to reduce sitting time in desk-based workers: SMART work & life. Int. J. Behav. Nutr. Phys. Act. 2023, 20, 142. [Google Scholar] [CrossRef]
- Direttiva EU PE 102 2023 REV 1. Available online: https://eur-lex.europa.eu/legal-content/IT/TXT/?uri=CONSIL%3APE_102_2023_REV_1&qid=1714658803749 (accessed on 22 March 2024).
- Smart Working Analysis on Worker. Available online: https://www.osservatori.net/it/ricerche/comunicati-stampa/smart-working-italia-numeri-trend (accessed on 10 May 2024).
- Li, J.; Herdem, M.S.; Nathwani, J.; Wen, J.Z. Methods and applications for Artificial Intelligence, Big Data, Internet of Things, and Blockchain in smart energy management. Energy AI 2023, 11, 100208. [Google Scholar] [CrossRef]
- IEA. Energy Efficiency of Buildings as One of the Main Criteria for Limiting CO2 Emissions. Available online: https://www.iea.org/energy-system/buildings (accessed on 25 July 2024).
- Smart Working Effects on Companies. Available online: https://codacons.it/bollette-codacons-prezzi-record-di-energia-e-benzina-incentivano-smartworking-lavoratore-risparmia-fino-a-5-100-euro-allanno-per-aziende-costi-si-abbattono-del-30/ (accessed on 15 May 2024).
- Di Girolamo, P.; Piras, G.; Pini, F. The effect of COVID-19 on the distribution of PM10 pollution classes of vehicles: Comparison between 2020 and 2018. Sci. Total Environ. 2022, 811, 152036. [Google Scholar] [CrossRef]
- Wang, C. Refined intelligent manufacturing enterprise human management based on IoT and machine learning technology. Int. J. Adv. Manuf. Technol. 2024, 1–12. [Google Scholar] [CrossRef]
- Palupiningtyas, D.; Maria, A.D.; Wijoyo, T.A.; Alyka, A.P.; Brawarso, K.Z.P. Application of Rapid Application Development Method in Designing Knowledge Management System to Improve Employee Knowledge and Performance at Ministry of Agriculture. J. Inf. Dan Teknol. 2024, 29–35. [Google Scholar] [CrossRef]
- Congiu, E.; Quaquero, E.; Rubiu, G.; Vacca, G. Building Information Modeling e Sistema Informativo Territoriale: Framework Integrato a Supporto del Facility Management (FM). Edifici 2024, 14, 610. [Google Scholar]
- Chaudhari, P.; Xiao, Y.; Cheng MM, C.; Li, T. Fondamenti, algoritmi e tecnologie di rilevamento dell’occupazione per edifici intelligenti che utilizzano sensori IoT. Sensors 2024, 24, 2123. [Google Scholar] [CrossRef]
- Westergaard, G.; Erden, U.; Mateo, O.A.; Lampo, S.M.; Akinci, T.C.; Topsakal, O. Time Series Forecasting Utilizing Automated Machine Learning (AutoML): A Comparative Analysis Study on Diverse Datasets. Information 2024, 15, 39. [Google Scholar] [CrossRef]
- Adeoye, I. Unlocking Potential: A Holistic Approach to Predicting Employee Performance with Business Analytics and Machine Learning. Available at SSRN 4729240 2024. [Google Scholar] [CrossRef]
- Hasan, M.R.; Ray, R.K.; Chowdhury, F.R. Employee Performance Prediction: An Integrated Approach of Business Analytics and Machine Learning. J. Bus. Manag. Stud. 2024, 6, 215–219. [Google Scholar] [CrossRef]
- Latiffi, A.A.; Brahim, J.; Mohd, S.; Fathi, M.S. Building information modeling (BIM): Exploring level of development (LOD) in construction projects. Appl. Mech. Mater. 2015, 773, 933–937. [Google Scholar] [CrossRef]
- Dias, P.; Ergan, S. The need for representing facility information with customized LOD for specific FM tasks. In Proceedings of the Construction Research Congress 2016, San Juan, Puerto Rico, 31 May–2 June 2016; pp. 2563–2572. [Google Scholar] [CrossRef]
- Alavi, S.H.; Forcada, N. BIM LOD for facility management tasks. In Proceedings of the EC3 Conference 2019, Crete, Greece, 10–12 July 2019; European Council on Computing in Construction: Creta, Greece, 2019; Volume 1, pp. 154–163. [Google Scholar]
- Ordenes, F.V.; Silipo, R. Machine learning for marketing on the KNIME Hub: The development of a live repository for marketing applications. J. Bus. Res. 2021, 137, 393–410. [Google Scholar] [CrossRef]
- Powell, B. Mastering Microsoft Power BI: Expert Techniques for Effective Data Analytics and Business Intelligence; Packt Publishing Ltd.: Birmingham, UK, 2018. [Google Scholar]
- Bruce, P.; Bruce, A.; Gedeck, P. Practical Statistics for Data Scientists: 50+ Essential Concepts Using R and Python; O’Reilly Media: Sebastopol, CA, USA, 2020. [Google Scholar]
- Ferrari, A.; Russo, M. Introducing Microsoft Power BI; Microsoft Press: Washington, DC, USA, 2016; p. 367. ISBN 9781509302765. [Google Scholar]
- Sim, E. Workplace repositioning post-pandemic: Hybrid working. In Routledge Companion to Creativity and the Built Environment; Routledge: London, UK, 2024; pp. 84–92. [Google Scholar]
- Lauesen, L.M.; Green, M. The future of work: Marx, Illich, Gorz–are we heading in their directions in post-COVID-19? In The Routledge Companion to the Future of Management Research; Routledge: London, UK, 2024; pp. 117–135. [Google Scholar]
- Cooper, P.B.; Maraslis, K.; Tryfonas, T.; Oikonomou, G. An intelligent hot-desking model harnessing the power of occupancy sensing data. Facilities 2017, 35, 766–786. [Google Scholar] [CrossRef]
- Millward, L.J.; Haslam, S.A.; Postmes, T. Putting employees in their place: The impact of hot desking on organizational and team identification. Organ. Sci. 2007, 18, 547–559. [Google Scholar] [CrossRef]
- Brand, J.L. Health and Productivity Effects of Hot Desks, Just-in-Time Work Spaces, and Other Flexible Workplace Arrangements. Ergon. Workplace Des. Health Wellness Product. 2017, 341–353. [Google Scholar] [CrossRef]
- Cui, W.; Chen, Y.; Xu, B. Application research of intelligent system based on BIM and sensors monitoring technology in construction management. Phys. Chem. Earth Parts A/B/C 2024, 134, 103546. [Google Scholar] [CrossRef]
- Silipo, R.; Mazanetz, M.P. The KNIME Cookbook; KNIME Press: Zürich, Switzerland, 2012. [Google Scholar]
- Microsoft PowerBI Architecture. Available online: https://learn.microsoft.com/it-it/power-bi/guidance/center-of-excellence-business-intelligence-solution-architecture (accessed on 19 June 2024).
- Dietterich, T.G. Ensemble methods in machine learning. In International Workshop on Multiple Classifier Systems; Springer: Berlin/Heidelberg, Germany, 2000; pp. 1–15. [Google Scholar] [CrossRef]
- Seyedzadeh, S.; Rahimian, F.P.; Glesk, I.; Roper, M. Machine learning for estimation of building energy consumption and performance: A review. Vis. Eng. 2018, 6, 5. [Google Scholar] [CrossRef]
- Gulati, K.; Tiwari, S.; Basandrai, K.; Kamat, P. Predictive maintenance of bearing machinery using matlab. In Proceedings of the Congress on Intelligent Systems (CIS), Bengaluru, India, 4–5 September 2021; Springer Nature: Singapore, 2022; Volume 2, pp. 107–136. [Google Scholar]
- Che, D.; Liu, Q.; Rasheed, K.; Tao, X. Decision tree and ensemble learning algorithms with their applications in bioinformatics. In Software Tools and Algorithms for Biological Systems; Springer: Berlin/Heidelberg, Germany, 2011; pp. 191–199. [Google Scholar]
- Ampomah, E.K.; Qin, Z.; Nyame, G. Evaluation of tree-based ensemble machine learning models in predicting stock price direction of movement. Information 2020, 11, 332. [Google Scholar] [CrossRef]
- De Mauro, A. Big Data Analytics: Analizzare e Interpretare Dati con il Machine Learning; Apogeo Editore: Milan, Italy, 2019. [Google Scholar]
- Quiñonero-Candela, J.; Sugiyama, M.; Schwaighofer, A.; Lawrence, N.D. (Eds.) Dataset Shift in Machine Learning; MIT Press: Cambridge, MA, USA, 2022. [Google Scholar]
- Studocu. Machine Learning. University of Nairobi. 2024. Available online: https://www.studocu.com/row/document/university-of-nairobi/machine-learning-algorithms-programming/machine-learning/69662783 (accessed on 2 July 2024).
- Banfield, R.E.; Hall, L.O.; Bowyer, K.W.; Kegelmeyer, W.P. A comparison of decision tree ensemble creation techniques. IEEE Trans. Pattern Anal. Mach. Intell. 2006, 29, 173–180. [Google Scholar] [CrossRef] [PubMed]
- Deng, H. Interpreting tree ensembles with intrees. Int. J. Data Sci. Anal. 2019, 7, 277–287. [Google Scholar] [CrossRef]
- IEA. Emissions Factors 2023. Available online: https://www.iea.org/data-and-statistics/data-product/emissions-factors-2023 (accessed on 17 August 2024).
- Huawei Academy, Ensemble Learning Diagram. Available online: https://forum.huawei.com/enterprise/en/machine-learning-algorithms-unsupervised-learning/thread/667243990275211264-667213860488228864 (accessed on 2 July 2024).
- Mahon, J.; Quille, K.; Mac Namee, B.; Becker, B.A. A novel machine learning and artificial intelligence course for secondary school students. In Proceedings of the 53rd ACM Technical Symposium on Computer Science Education V. 2, Providence, RI, USA, 3–5 March 2022; p. 1155. [Google Scholar]
- Bharadwaj, A.; Sawy, O.A.E.; Pavlou, P.A.; Venkatraman, N. Digital business strategy: Toward a next generation of insights. MIS Q. 2013, 37, 471–482. [Google Scholar] [CrossRef]
- Sambamurthy, V.; Bharadwaj, A.; Grover, V. Shaping agility through digital options: Reconceptualizing the role of information technology in contemporary firm. MIS Q. 2003, 27, 237–264. [Google Scholar] [CrossRef]
- Rodrigues, M.; Franco, M.; Sousa, N.; Silva, R. COVID 19 and the Business Management Crisis: An Empirical Study in SMEs. Sustainability 2021, 13, 5912. [Google Scholar] [CrossRef]
- Amankwah-Amoah, J.; Khan, Z.; Wood, G.; Knight, G. COVID-19 and digitalization: The great acceleration. J. Bus. Res. 2021, 136, 602–611. [Google Scholar] [CrossRef] [PubMed]
- Seetharaman, P. Business models shifts: Impact of COVID-19. Int. J. Inf. Manag. 2020, 54, 102173. [Google Scholar] [CrossRef] [PubMed]
- Teece, D.J.; Pisano, G.; Shuen, A. Dynamic capabilities and strategic management. Strateg. Manag. J. 1997, 18, 509–533. [Google Scholar] [CrossRef]
- LaBerge, L.; O’Toole, C.; Schneider, J.; Smaje, K. How COVID-19 Has Pushed Companies over the Technology Tipping Point and Transformed Business Forever. 2020. Available online: https://www.mckinsey.com/capabilities/strategy-and-corporate-finance/our-insights/how-covid-19-has-pushed-companies-over-the-technology-tipping-point-and-transformed-business-forever (accessed on 21 May 2024).
- Galvin, J.; LaBerge, L. The New Digital Edge: Rethinking Strategy for the Postpandemic Era. 2021. Available online: https://www.mckinsey.com/capabilities/mckinsey-digital/our-insights/the-new-digital-edge-rethinking-strategy-for-the-postpandemic-era (accessed on 11 May 2024).
- Verhoef, P.C.; Broekhuizen, T.; Bart, Y.; Bhattacharya, A.; Dong, J.Q.; Fabian, N.; Haenlein, M. Digital transformation: A multidisciplinary reflection and research agenda. J. Bus. Res. 2021, 122, 889–901. [Google Scholar] [CrossRef]
- Lam, P.-D.; Gu, B.-H.; Lam, H.-K.; Ok, S.-Y.; Lee, S.-H. Digital Twin Smart City: Integrating IFC and CityGML with Semantic Graph for Advanced 3D City Model Visualization. Sensors 2024, 24, 3761. [Google Scholar] [CrossRef]
- Priyono, A.; Moin, A.; Putri, V.N.A.O. Identifying digital transformation paths in the business model of SMEs during the COVID-19 Pandemic. J. Open Innov. Technol. Mark. Complex. 2020, 6, 104. [Google Scholar] [CrossRef]
- Münch, C.; Hartmann, E. Transforming resilience in the context of a pandemic: Results from a cross-industry case study exploring supply chain viability. Int. J. Prod. Res. 2022, 61, 2544–2562. [Google Scholar] [CrossRef]
- Thukral, E. COVID-19: Small and medium enterprises challenges and responses with creativity, innovation, and entrepreneurship. Strateg. Change 2021, 30, 153–158. [Google Scholar] [CrossRef]
- De Lucas Ancillo, A.; Gavrila Gavrila, S.; Fernández del Castillo Díez, J.R.; Corro Beseler, J. LATAM and Spanish SME barriers to Industry 4.0. Acad. Rev. Latinoam. Adm. 2022, 35, 204–222. [Google Scholar] [CrossRef]
- Tamvada, J.P.; Narula, S.; Audretsch, D.; Puppala, H.; Kumar, A. Adopting new technology is a distant dream? The risks of implementing Industry 4.0 in emerging economy SMEs. Technol. Forecast. Soc. Change 2022, 185, 122088. [Google Scholar] [CrossRef]


| Floor | Available Stations | Maximum Detected | Unused Stations |
|---|---|---|---|
| 0 | 50 | 36 | 14 |
| 1 | 120 | 104 | 16 |
| 2 | 120 | 105 | 15 |
| 3 | 120 | 97 | 23 |
| 4 | 120 | 102 | 18 |
| 5 | 120 | 88 | 32 |
| 6 | 120 | 91 | 29 |
| 7 | 120 | 106 | 14 |
| 8 | 120 | 78 | 42 |
| 9 | 120 | 58 | 62 |
| 10 | 120 | 66 | 54 |
| 11 | 120 | 60 | 60 |
| Total | 1370 | 991 | 379 |
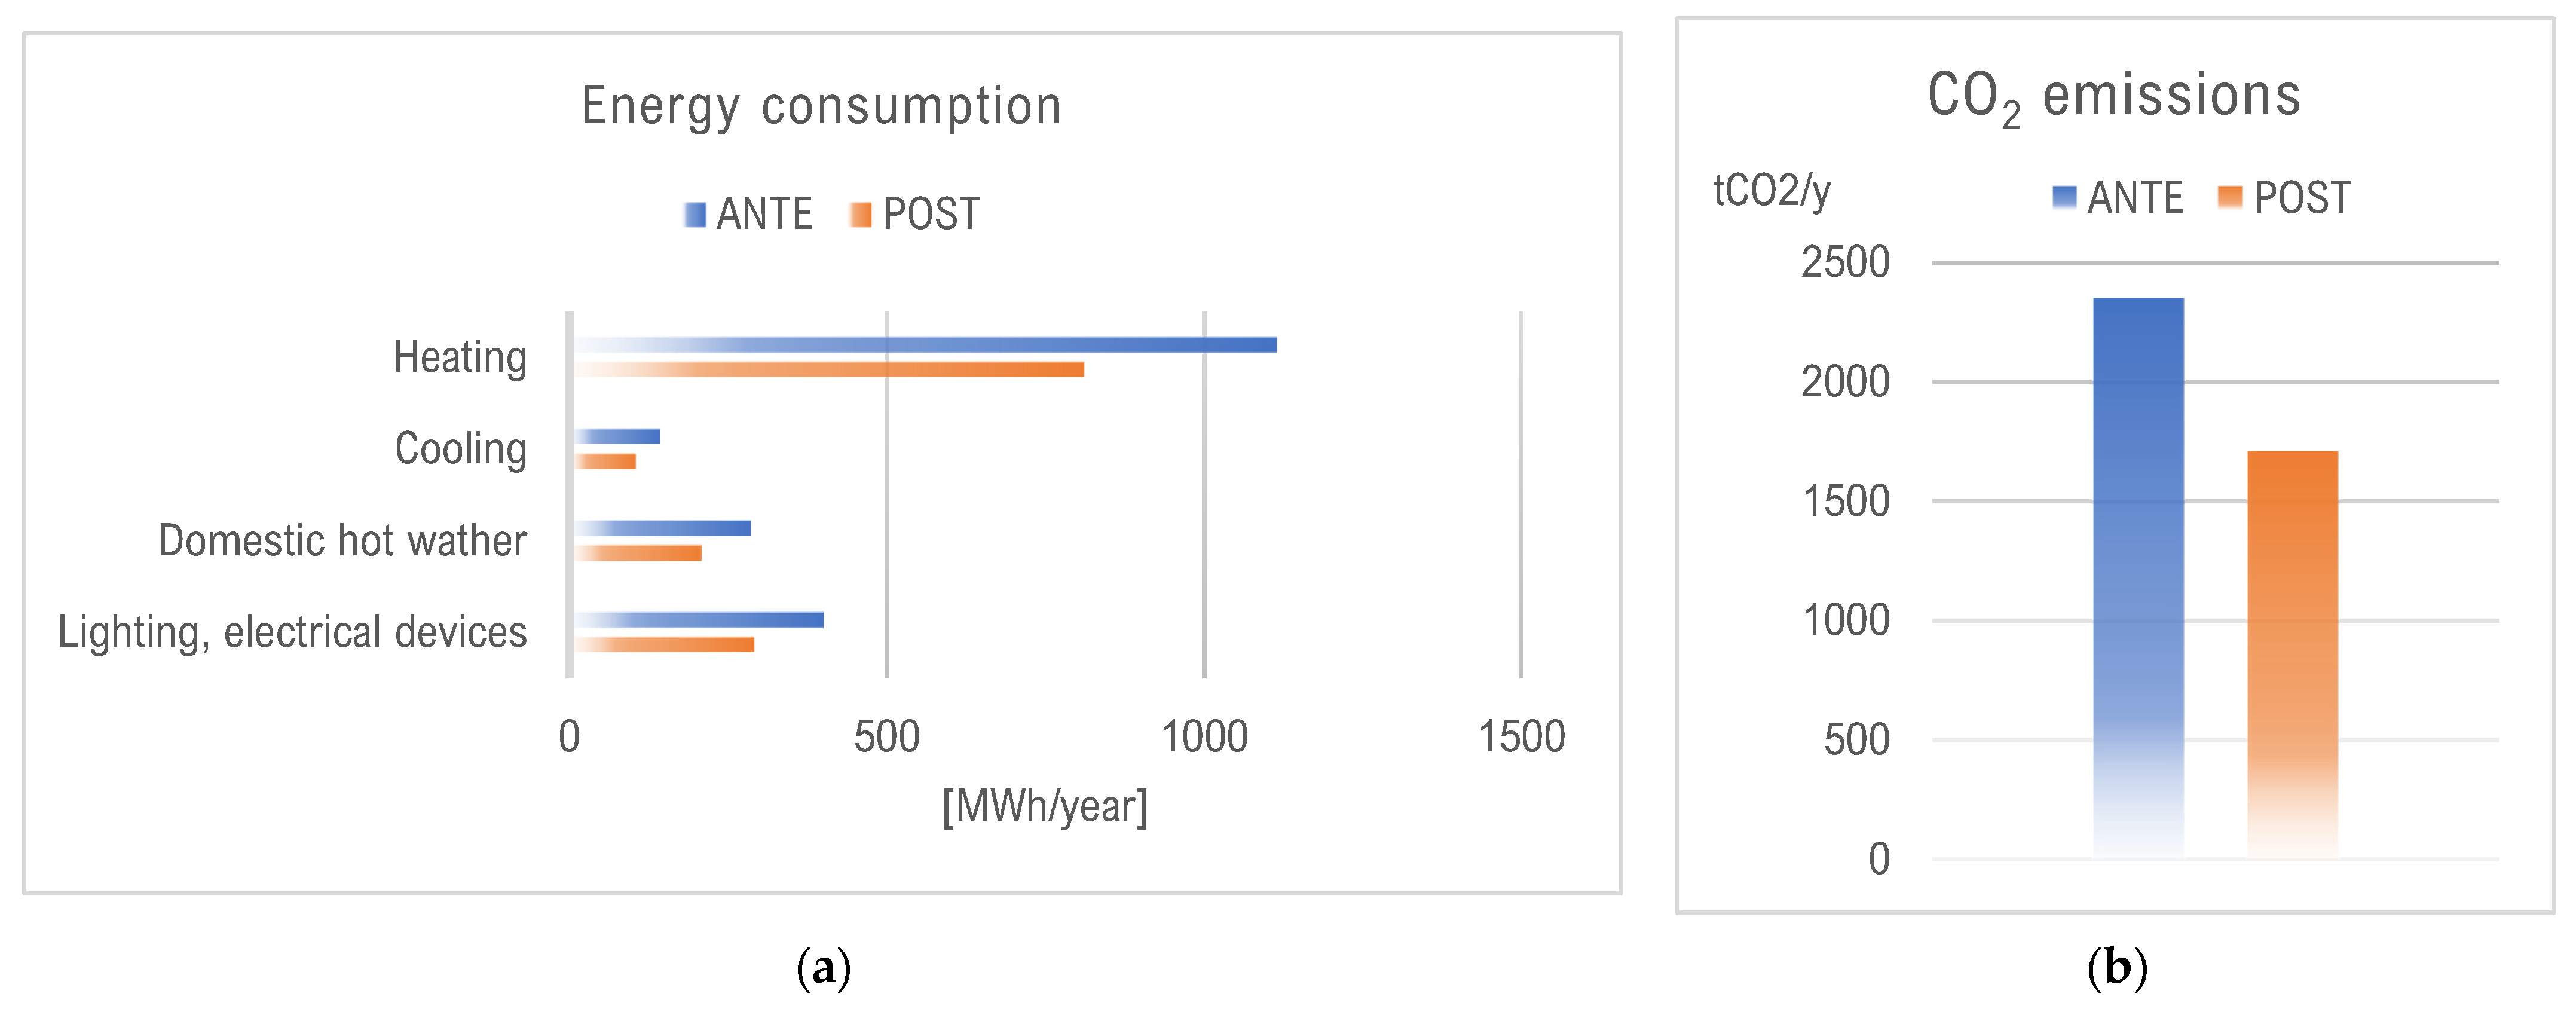
| ANTE, 28.600 m2 | POST, 20.800 m2 | |||||||
|---|---|---|---|---|---|---|---|---|
| kWh/Year | MWh/Year | Costs [EUR/Year] | t CO2/Year | kWh/Year | MWh/Year | Costs [EUR/Year] | t CO2/Year | |
| Lighting, electrical devices | 400,400.00 | 400.40 | 100,100.00 | 774.77 | 291,200.00 | 291.20 | 72,800.00 | 563.47 |
| Domestic hot water | 286,000,00 | 286.00 | 100,100.00 | 27.17 | 208,000.00 | 208.00 | 72,800.00 | 19.76 |
| Cooling | 143,000,00 | 143.00 | 35,750.00 | 774.77 | 104,000.00 | 104.00 | 26,000.00 | 563.47 |
| Heating | 1,115,400.00 | 1115.40 | 278,850.00 | 774.77 | 811,200.00 | 811.20 | 202,800.00 | 563.47 |
| Total | 1,944,800.00 | 1944.80 | 514,800.00 | 2351.49 | 1,414,400.00 | 1414.40 | 374,400.00 | 1710.18 |
Disclaimer/Publisher’s Note: The statements, opinions and data contained in all publications are solely those of the individual author(s) and contributor(s) and not of MDPI and/or the editor(s). MDPI and/or the editor(s) disclaim responsibility for any injury to people or property resulting from any ideas, methods, instructions or products referred to in the content. |
© 2024 by the authors. Licensee MDPI, Basel, Switzerland. This article is an open access article distributed under the terms and conditions of the Creative Commons Attribution (CC BY) license (https://creativecommons.org/licenses/by/4.0/).
Share and Cite
Piras, G.; Muzi, F.; Tiburcio, V.A. Enhancing Space Management through Digital Twin: A Case Study of the Lazio Region Headquarters. Appl. Sci. 2024, 14, 7463. https://doi.org/10.3390/app14177463
Piras G, Muzi F, Tiburcio VA. Enhancing Space Management through Digital Twin: A Case Study of the Lazio Region Headquarters. Applied Sciences. 2024; 14(17):7463. https://doi.org/10.3390/app14177463
Chicago/Turabian StylePiras, Giuseppe, Francesco Muzi, and Virginia Adele Tiburcio. 2024. "Enhancing Space Management through Digital Twin: A Case Study of the Lazio Region Headquarters" Applied Sciences 14, no. 17: 7463. https://doi.org/10.3390/app14177463