Article

Construction and Evaluation of Pepper Core Collection Based on Phenotypic Traits and SSR Markers

1
Key Laboratory for Quality Regulation of Tropical Horticultural Crops of Hainan Province, School of Tropical Agriculture and Forestry, Hainan University, Haikou 570228, China
2
School of Breeding and Multiplication, Sanya Institute of Breeding and Multiplication, Hainan University, Sanya 572024, China
*
Author to whom correspondence should be addressed.
Appl. Sci. 2024, 14(17), 7473; https://doi.org/10.3390/app14177473 (registering DOI)
Submission received: 12 June 2024 / Revised: 24 July 2024 / Accepted: 25 July 2024 / Published: 23 August 2024

Abstract

:
To streamline germplasm preservation, enhance resource utilization, and improve breeding efficiency, a core germplasm bank was established using 24 phenotypic traits and DNP markers from 155 pepper resources across various regions. Selection of the optimal core germplasm was based on intra-group retention ratio, overall retention scale, and intra-group stepwise clustering retention. Evaluation of phenotypic trait data for the core germplasm utilized mean, variance, range, and coefficient of variation, with principal component analysis confirming the selection. For molecular evaluation, the core germplasm pre-selection plan was based on SSR clustering, allele retention ratio, and Shannon-Weaver diversity index. This approach resulted in a core germplasm of 41 resources, including 6 var. fasciculatum, 7 var. grossum, 3 var. cerasiorme, 6 var. conoides, and 19 var. longum, representing the maximum phenotypic retention and genetic diversity of the 155 pepper resources. Additionally, a core germplasm of 32 resources was generated based on SSR markers, retaining all 54 polymorphic loci. By integrating phenotypic and molecular core collections, a combined core collection of 57 varieties was developed. This collection achieved a 92.55% phenotype retention ratio and a 100% polymorphism site retention ratio. With a 90% compression ratio, it encapsulates the broad genetic diversity of the original germplasm, serving as a comprehensive resource for further research and breeding applications.

1. Introduction

Peppers (Capsicum L.), originating from Central and South America, belong to the Solanaceae family and include both herbaceous and semi-shrubby plants. Globally significant as a vegetable, pepper fruits are primarily consumed fresh or as condiments [1]. The Capsicum genus includes key species such as C. annuum, C. frutescens, C. pubescens, C. chinense, C. baccatum, and C. assamicum, along with 32 wild species. C. annuum is extensively cultivated and holds economic importance in countries such as China, India, South Korea, Spain, Thailand, and Mexico. Meanwhile, C. frutescens and C. chinense are commercially grown in select areas of Central America, West Africa, Central Africa, Oceania, and Asia [2,3]. C. pubescens and C. baccatum are limited to Central and South America and the Caribbean [4]. Recently, C. assamicum, a domesticated species identified in northeastern India, has gained attention for its extreme spiciness, prolific branching, yellow-green corollas, pale blue anthers, and sunken epidermal fruits [5].
Pepper fruits are rich in vitamins C and E, carotenoids, flavonoids, essential nutrients, and bioactive compounds such as capsaicin and phenols, providing significant health benefits and broad market potential [1]. Given their economic and nutritional importance, breeders have focused on enhancing agronomic traits such as yield, fruit type, pungency, and resistance to biotic and abiotic stresses. Advances in genetic engineering and gene editing, as well as efforts to address male infertility, have played crucial roles in these improvements. However, these breeding efforts have also reduced the genetic diversity of local resources, leading to the loss of valuable genes. Therefore, the comprehensive collection, identification, protection, and sustainable use of pepper genetic resources are vital for further advancements [6,7].
In recent decades, significant global progress has been made in collecting and protecting pepper germplasm resources. Notable contributions include the Asian Vegetable Research and Development Center (AVRDC, Tainan, China) with 5100 accessions, the United States with 4700, the Hunan Province of China with 3600, and Russia with 2300 [8]. Brazil’s Amombra Horticultural Research Institute (AHRI, Sao Paulo, Brazil) has curated 1220 accessions, categorizing 654 based on IPGRI traits. Despite its relatively low pepper consumption, France has amassed over 1150 accessions [9]. A major milestone is the establishment of the world’s first pepper botanical garden in the United States, preserving wild peppers and diverse germplasm resources as vital genetic reservoirs for future breeding. However, the introduction of peppers from various global breeding and research institutions has obscured the genetic background of these resources. This increase in quantity does not fully reflect the genetic richness available in breeding institutions.
Establishing core germplasm banks is vital for conserving genetic resources and advancing research. These banks preserve the genetic diversity of entire populations, minimize duplication, reduce management costs, streamline germplasm screening, and enhance breeding potential [6,7,8,9,10]. Over 100 primary core collections have been developed worldwide, including those for major crops such as rice [11], wheat [12], maize [13], soybeans [14], and rapeseed [15]. Core collections also exist for fruits such as apples [16,17], apricots [18], pomegranates [19], chestnuts [20], and litchi [21], as well as vegetables including Chinese cabbage [22], potatoes [23], tomatoes [24], garlic [25], eggplants [26], amaranth [27] and carrots [28]. Additionally, diverse phenotypes and genetic variations of pepper core collections have been established for research purposes [29,30,31,32,33,34]. For example, Zewdie et al. developed a chili core germplasm bank with 100% morphological variation using a clustering method of 21 phenotypic traits, achieving selection rates of 10% (CA), 16% (CC), and 16% (CB) [34]. Similarly, Lee et al. created a core germplasm bank by selecting 5.2% (240) of 3821 materials based on variations in 48 SNP markers and 32 morphological traits, resulting in a genetic diversity index of 0.95 and a wide range of phenotypic variations [6]. The variability in storage rates and genetic variation coverage among institutions underscores the diverse methods of constructing core libraries, reflecting the genetic diversity of pepper germplasm and differing breeding objectives.
In our preliminary work, we collected 155 chili pepper resources from various domestic and international sources. However, their phenotypic and molecular characteristics remain unknown. This study aimed to build a core library using phenotype data and SSR information of these resources to address issues of genetic duplication, extensive land use, and high management costs in protecting chili germplasm accessions. Constructing this core library will also provide a foundation for in-depth research, gene exploration, and breeding applications in peppers.

2. Materials and Methods

2.1. Plant Accessions and Field Evaluation

A comprehensive examination was performed on 155 pepper germplasms, sourced as follows: 35 from China, 1 from South Korea, 31 from former Yugoslavia, 84 from the Saint Denis Germplasm Bank, 1 from Sri Lanka, and 3 from South America (Table S1). The study was conducted at the Agricultural Experimental Base of Hainan University between July 2021 and May 2022, employing a randomized block design. Each plot was planted with 10 systematically arranged plants, spaced 35 × 60 cm apart, and replicated three times. Cultivation adhered to the established field planting techniques for Hainan pepper, as detailed by Jiang et al. (2004) [34].

2.2. Phenotypic Trait Determination

Phenotypic traits in pepper germplasms were evaluated, encompassing 12 qualitative and 12 quantitative traits. The qualitative traits assessed were stem color, internode length in the lower sections, presence of axillary buds, leaf shape and color, flower morphology, inflorescence initiation, fruit shape and bearing status, and the colors and surface texture of green and mature fruit. The quantitative traits measured included plant height, width, main stem diameter, number of fruits per axil, leaf length and width, flesh thickness, fruit longitudinal and transverse diameters, fruit shape index (ratio of longitudinal to transverse diameter), fruit size, and number of ventricles. Trait values were determined and assigned according to the “Specifications and Data Standards for the Description of Chili Germplasm Resources” [35]. Detailed values for each qualitative trait are provided in Table S2.

2.3. Construction and Evaluation of Pepper Core Germplasm Bank Based on Phenotype Data

Based on the methods previously selected for core germplasm construction, an optimal construction plan was determined by evaluating three criteria: intra-group retention ratio, overall sample size, and intra-group stepwise clustering retention [36,37,38]. The intra-group retention ratio methods include four types: simple ratio (B), logarithmic ratio (L), square root ratio (S), and diversity ratio (G). The formulas for these ratios are
B = X i i X i S = S q r t X i i S q r t X i G = H i i H i H i = ( i j P i j ln P i j ) n
where Xi represents the number of pepper varieties in the i-th group of the original population, Hi is the genetic diversity coefficient for the i-th group, Pij denotes the frequency of the j-th phenotype of the i-th trait, and n is the number of phenotypes.
Overall sample size was categorized into six levels: 5%, 10%, 15%, 20%, 25%, and 30%. Intra-group stepwise clustering was executed using average linkage, with genetic distance assessed by Mahalanobis Distance, resulting in 24 sample retention schemes (Figure 1). To ensure the representation of all chili pepper types, at least one variety of each type was preserved. Fractional sample sizes were adjusted using rounding methods. During the gradual clustering and sample retention process, one individual at the lowest classification level was removed per clustering round, allowing the remaining individual to advance. Rounding methods were applied to maintain at least one variety per type when the theoretical number of retained samples was fractional.
Four indicators were employed to evaluate the core germplasm formed by the 24 retention schemes: ratio of phenotypes retained (RPR), index of genetic diversity (Hi), coefficient of variation (CVR), and coincidence rate of range (CR). These indicators facilitate the selection of the appropriate intra-group retention ratio method and overall retention scale. The formulas for these indicators are
C V R = i = 1 n C V c ( i ) C V o ( i ) n × 100 % R P R = i M i i M i o × 100 % C R = i = 1 n R c ( i ) R o ( i ) n × 100 %
where Mi is the number of phenotypes of the i-th trait in the core sample, Mio is the number of phenotypes of the i-th trait in the original sample, CVc(i) and CVo(i) are the coefficients of variation for the i-th trait in the core and original germplasm, respectively. Rc(i) and Ro(i) represent the range of the i-th trait in the core and original germplasm, respectively, and n is the number of phenotypes.
After the preliminary evaluation of the core collection, additional comparisons were conducted between the core collection and original samples. These comparisons focused on Hi, CR, RPR, principal component characteristic values, cumulative contribution rate, and basic genetic parameters (mean and variation) to assess the effectiveness of the core collection [39].

2.4. Construction of Pepper Core Germplasm Bank Based on SSR Molecular Markers

Resh, healthy tender leaves from plants at the 8–10 leaf stage were selected, with samples randomly obtained from three distinct plots. DNA was extracted using the CTAB method. The integrity of the DNA was evaluated by 0.8% agarose gel electrophoresis, while quality and concentration were measured with a UV spectrophotometer. DNA meeting the specified quality criteria was stored at −20 °C for further analysis.
A total of 200 SSR primer pairs, supplied by Professor Hu Kailin from South China Agricultural University, were systematically tested [40]. Among these, 8 primer pairs demonstrating significant polymorphism were identified and are detailed in Table 1.

2.5. Construction of Core Collection Based on SSR Markers

The peaks and allele lengths of the SSR-PCR products were analyzed using GeneMarker 2.2.0 software (SoftGenetics, State College, PA, USA). Polymorphic loci were recorded in a binary “1, 0” database, with bands coded as “1” for presence and “0” for absence. Cluster analysis and calculation of genetic diversity parameters were conducted using Popgene software1.32.
A stepwise clustering approach was employed for sample retention. In each iteration, one individual from the lowest classification level was systematically removed, allowing the remaining individual to proceed to the next round of clustering.
SSR marker data from 155 germplasm samples were analyzed with compression standards ranging from 10% to 90%, resulting in the identification of nine compressed populations. RAR, RPR, Ii, and phenotype genetic diversity index were calculated using the following formulas:
I i = i j P i j ln P i j R A R = i N i i N i o × 100 %
where Pij represents the frequency of the j-th allele at the i-th locus, Ni denotes the number of allelic variations in the compressed population, and Nio is the number of allelic variations in the original population.
A comprehensive comparison of these parameters was conducted to optimize the representation of the original germplasm population while minimizing genetic diversity loss. Consequently, the most suitable molecularly pre-selected core germplasm was selected from the nine compressed populations.

2.6. Evaluation, Validation, and Improvement of Core Collection Based on SSR Molecular Markers

The pre-selected core collection, defined using SSR molecular markers, was categorized into five groups: C. var. fasciculatum, C. var. grossum, C. var. cerasiforme, C. var. conoides, and C. var. longum. A comparison was then conducted between the core collection and the original germplasm to evaluate molecular-level diversity. To ensure the preservation of genetic diversity in Capsicum, all polymorphic sites were included in the core collection.

2.7. Integrated Construction of Phenotypic and Molecular Core Collection

The phenotype and molecular core collections were re-integrated with compression standards set at 40.00%, 50.00%, 60.00%, 70.00%, 80.00%, and 90.00%. Clustering analysis of 63 varieties was conducted using SAS 19.0 software (SAS Institute Inc., Cary, NC, USA), and the germplasm group with the greatest genetic diversity among the six compression ratios were selected.

3. Results

3.1. Genetic Diversity Analysis of Pepper Germplasm

The 155 tested materials were categorized into five groups: var. fasciculatum (5.81%), var. grossum Bailey (10.32%), var. cerasiorme Bailey (1.94%), var. conoides Bailey (7.1%), and var. longum Bailey (74.84%) (Table 2 and Table S1). In terms of genetic diversity, var. conoides exhibited the highest index at 0.8294, followed by var. longum (0.7729), var. grossum (0.6905), var. fasciculatum (0.6699), and var. cerasiorme (0.3833). The diversity index of the original germplasm was 0.7954, with var. cerasiorme having the smallest proportion and lowest diversity index (Table 2). Comparative analysis revealed that the diversity index of the original germplasm was higher than those of var. longum, var. grossum, var. fasciculatum, and var. cerasiforme but lower than that of var. conoides. The diversity index depends on the number of trait phenotypes and their distribution uniformity. The higher diversity index of var. conoides compared to the original germplasm indicates a more uniform distribution of pepper phenotypes in this group.

3.2. Determination of Overall Sample Retention Ratio

The optimal retention scheme for peppers was identified by evaluating the RPR, CR, CVR, and Hi across 24 schemes. Analysis showed a positive correlation between RPR and sample size, with a gradual increase (Table 3). Using an RPR threshold of >90%, the retention ratios for the simple ratio, logarithmic ratio, square root ratio, and diversity ratio schemes were 20%, 15%, 15%, and 20%, respectively. CR values also increased gradually, with retention ratios of 20%, 15%, 15%, and 15% based on a CR standard of >85%. An increase in CVR indicated a better representation of genetic diversity in the core collection. All 24 schemes had a CVR exceeding 100%, demonstrating their effectiveness in preserving the original population’s diversity while eliminating samples with complex traits. The Hi, which reflects phenotypic diversity and uniformity, showed a non-linear correlation with sample size. With a Hi threshold of >0.9, the 5% logarithmic, 5% square root, and 5% diversity retention samples did not meet the criterion, while the remaining 21 schemes exceeded it. Thus, the new germplasm group effectively preserved the phenotypic traits of the original pepper variety, increased the coefficient of variation, and reduced genetic redundancy with an overall sample size of 25%.

3.3. Determination of Intragroup Sampling Ratio Method and Construction of Core Collection

The RPR is notably higher for square root and logarithmic samples compared to simple and diverse samples when the overall sample size is 20% or more. The CR shows similar trends. The CVR exceeds 100%, following the order: diversity retention > square root retention > logarithmic retention > simple retention. The Hi varies irregularly; however, between 15% and 25% overall sample size, the Hi is highest for square root samples compared to logarithmic and diversity samples. When the sample size is above 5%, the Hi consistently exceeds 0.9 (Table 4). Thus, the square root ratio method is most effective for intra-group sample retention.
In summary, using a 25% overall sample size with the square root ratio method is optimal for retaining the phenotypic core germplasm. As a result, a core collection of 41 germplasms was selected (Table S3), comprising 6 accessions of var. fasciculatum, 7 accessions of var. grossum, 3 accessions of var. cerasiforme, 6 accessions of var. conoides, and 19 accessions of var. longum.

3.4. Evaluation of Pepper Core Collection Based on Phenotypic Data

3.4.1. Evaluation of Core Collection Based on Basic Genetic Parameters

This study evaluated 24 phenotypic traits to compare genetic parameters between a core germplasm collection and the original population (Table 5). Except for leaf color and length, the minimum values for all traits were the same in both sets. Maximum values and ranges for the remaining 22 traits also matched. Although the mean values for all traits and the standard deviation of leaf length were similar in both groups, the core collection generally had lower mean values than the original germplasm. However, for 23 traits, the core collection had higher mean values. The coefficient of variation for the number of ventricles was similar between the two sets but lower in the core collection. For the other 23 traits, the core collection showed greater variation than the original germplasm. These findings demonstrate that the 41 selected germplasm specimens capture the genetic diversity of the original pepper population effectively.

3.4.2. Evaluation of Core Collection Based on Principal Component Analysis

Principal component analysis (PCA) is crucial for evaluating the representativeness of phenotypic core collections compared to the original germplasm. This study analyzed the principal components of both collections, as detailed in Table 6. When the eigenvalues exceed 1, seven principal components are identified for both the original and pre-selected core germplasm. The total characteristic values, principal component contribution rates, and cumulative contribution rates were similar, with the core collection consistently outperforming the original germplasm. Eigenvalues for the seven components ranged from 0.0161 to 0.6794, with contribution rates varying from 0.07% to 3.09%. The cumulative contribution rates were 64.82% for the core collection and 73.32% for the original germplasm. Overall, the core collection showed a notable increase in cumulative contribution rates for the first seven components, highlighting its effectiveness in preserving the genetic diversity of the original pepper germplasm.

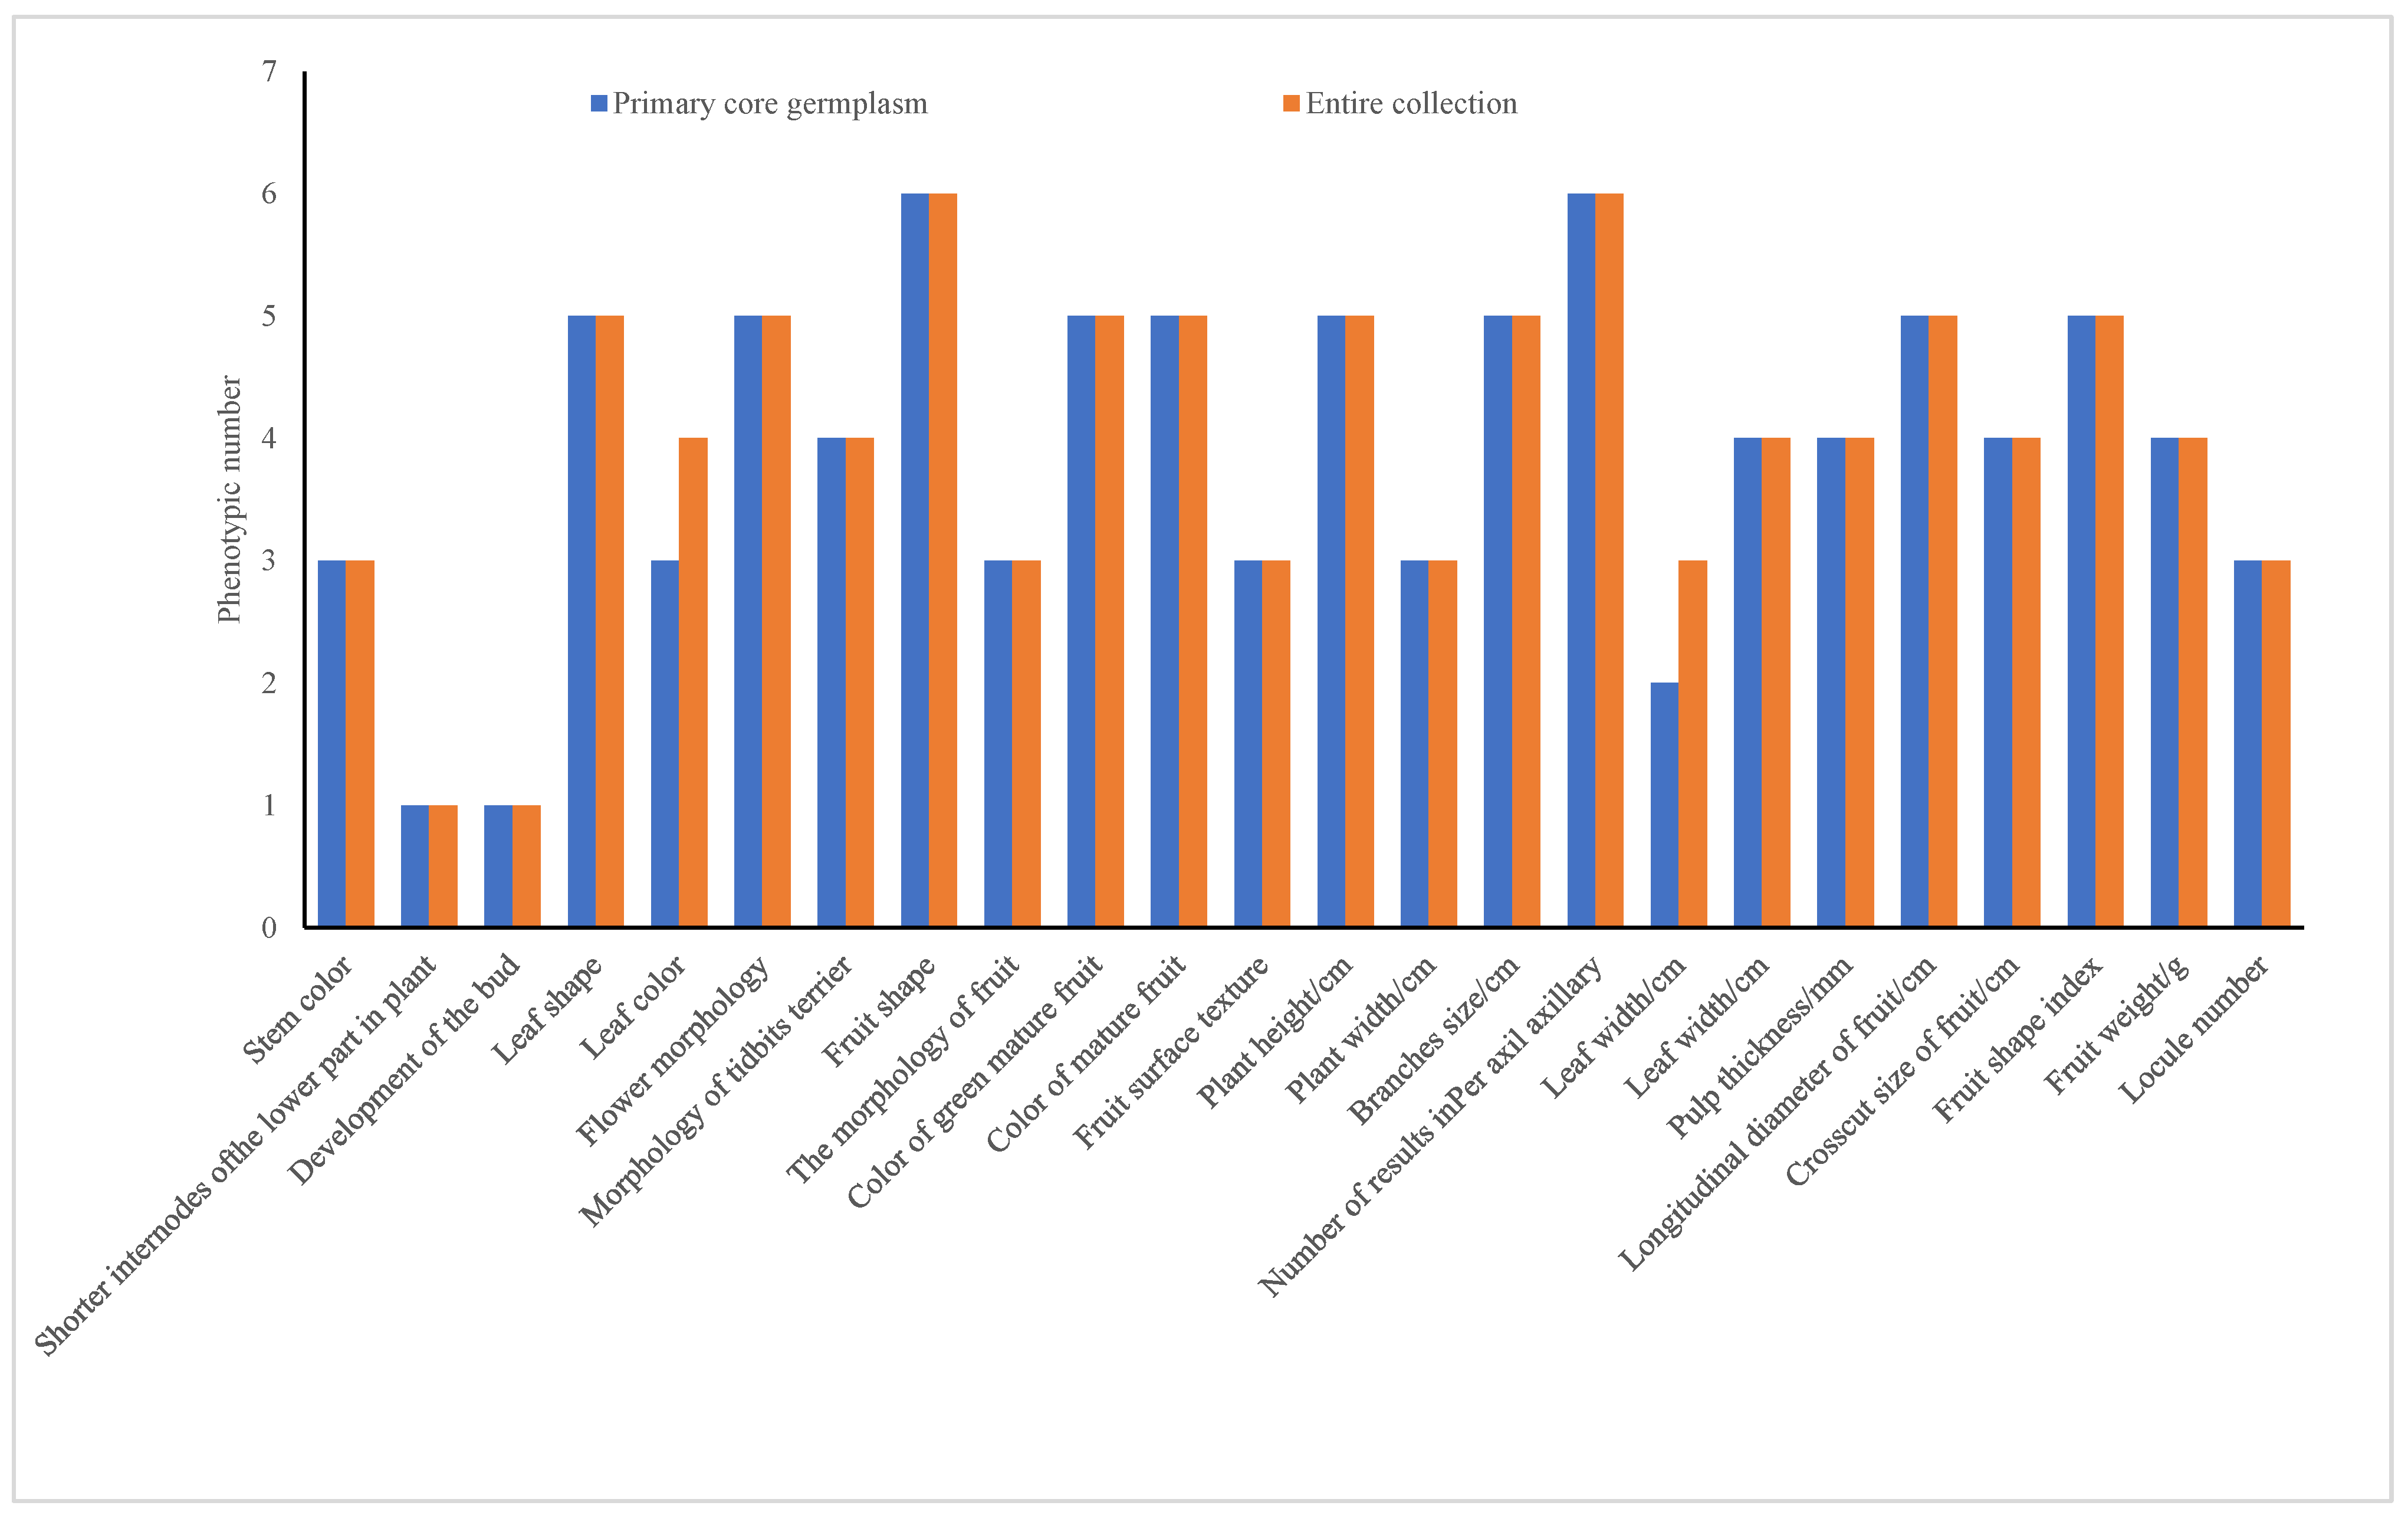
3.4.3. Evaluation of Pre-Selected Core Germplasm Based on Phenotypic Retention Number

The experiment analyzed 12 quality traits (represented in bar charts for groups 1–12) and 12 quantitative traits (shown in bar charts for groups 13–24), as illustrated in Figure 2. The pre-selected core germplasm and the original germplasm exhibited identical quantities for all 12 quality traits, achieving a 100% phenotype retention ratio. Although two quantitative traits, “leaf length > 10 cm” and “leaf purple,” were excluded, the remaining 10 quantitative traits also maintained a 100% phenotype retention ratio.

3.5. Construction and Evaluation of Chili Core Collection Based on SSR Markers

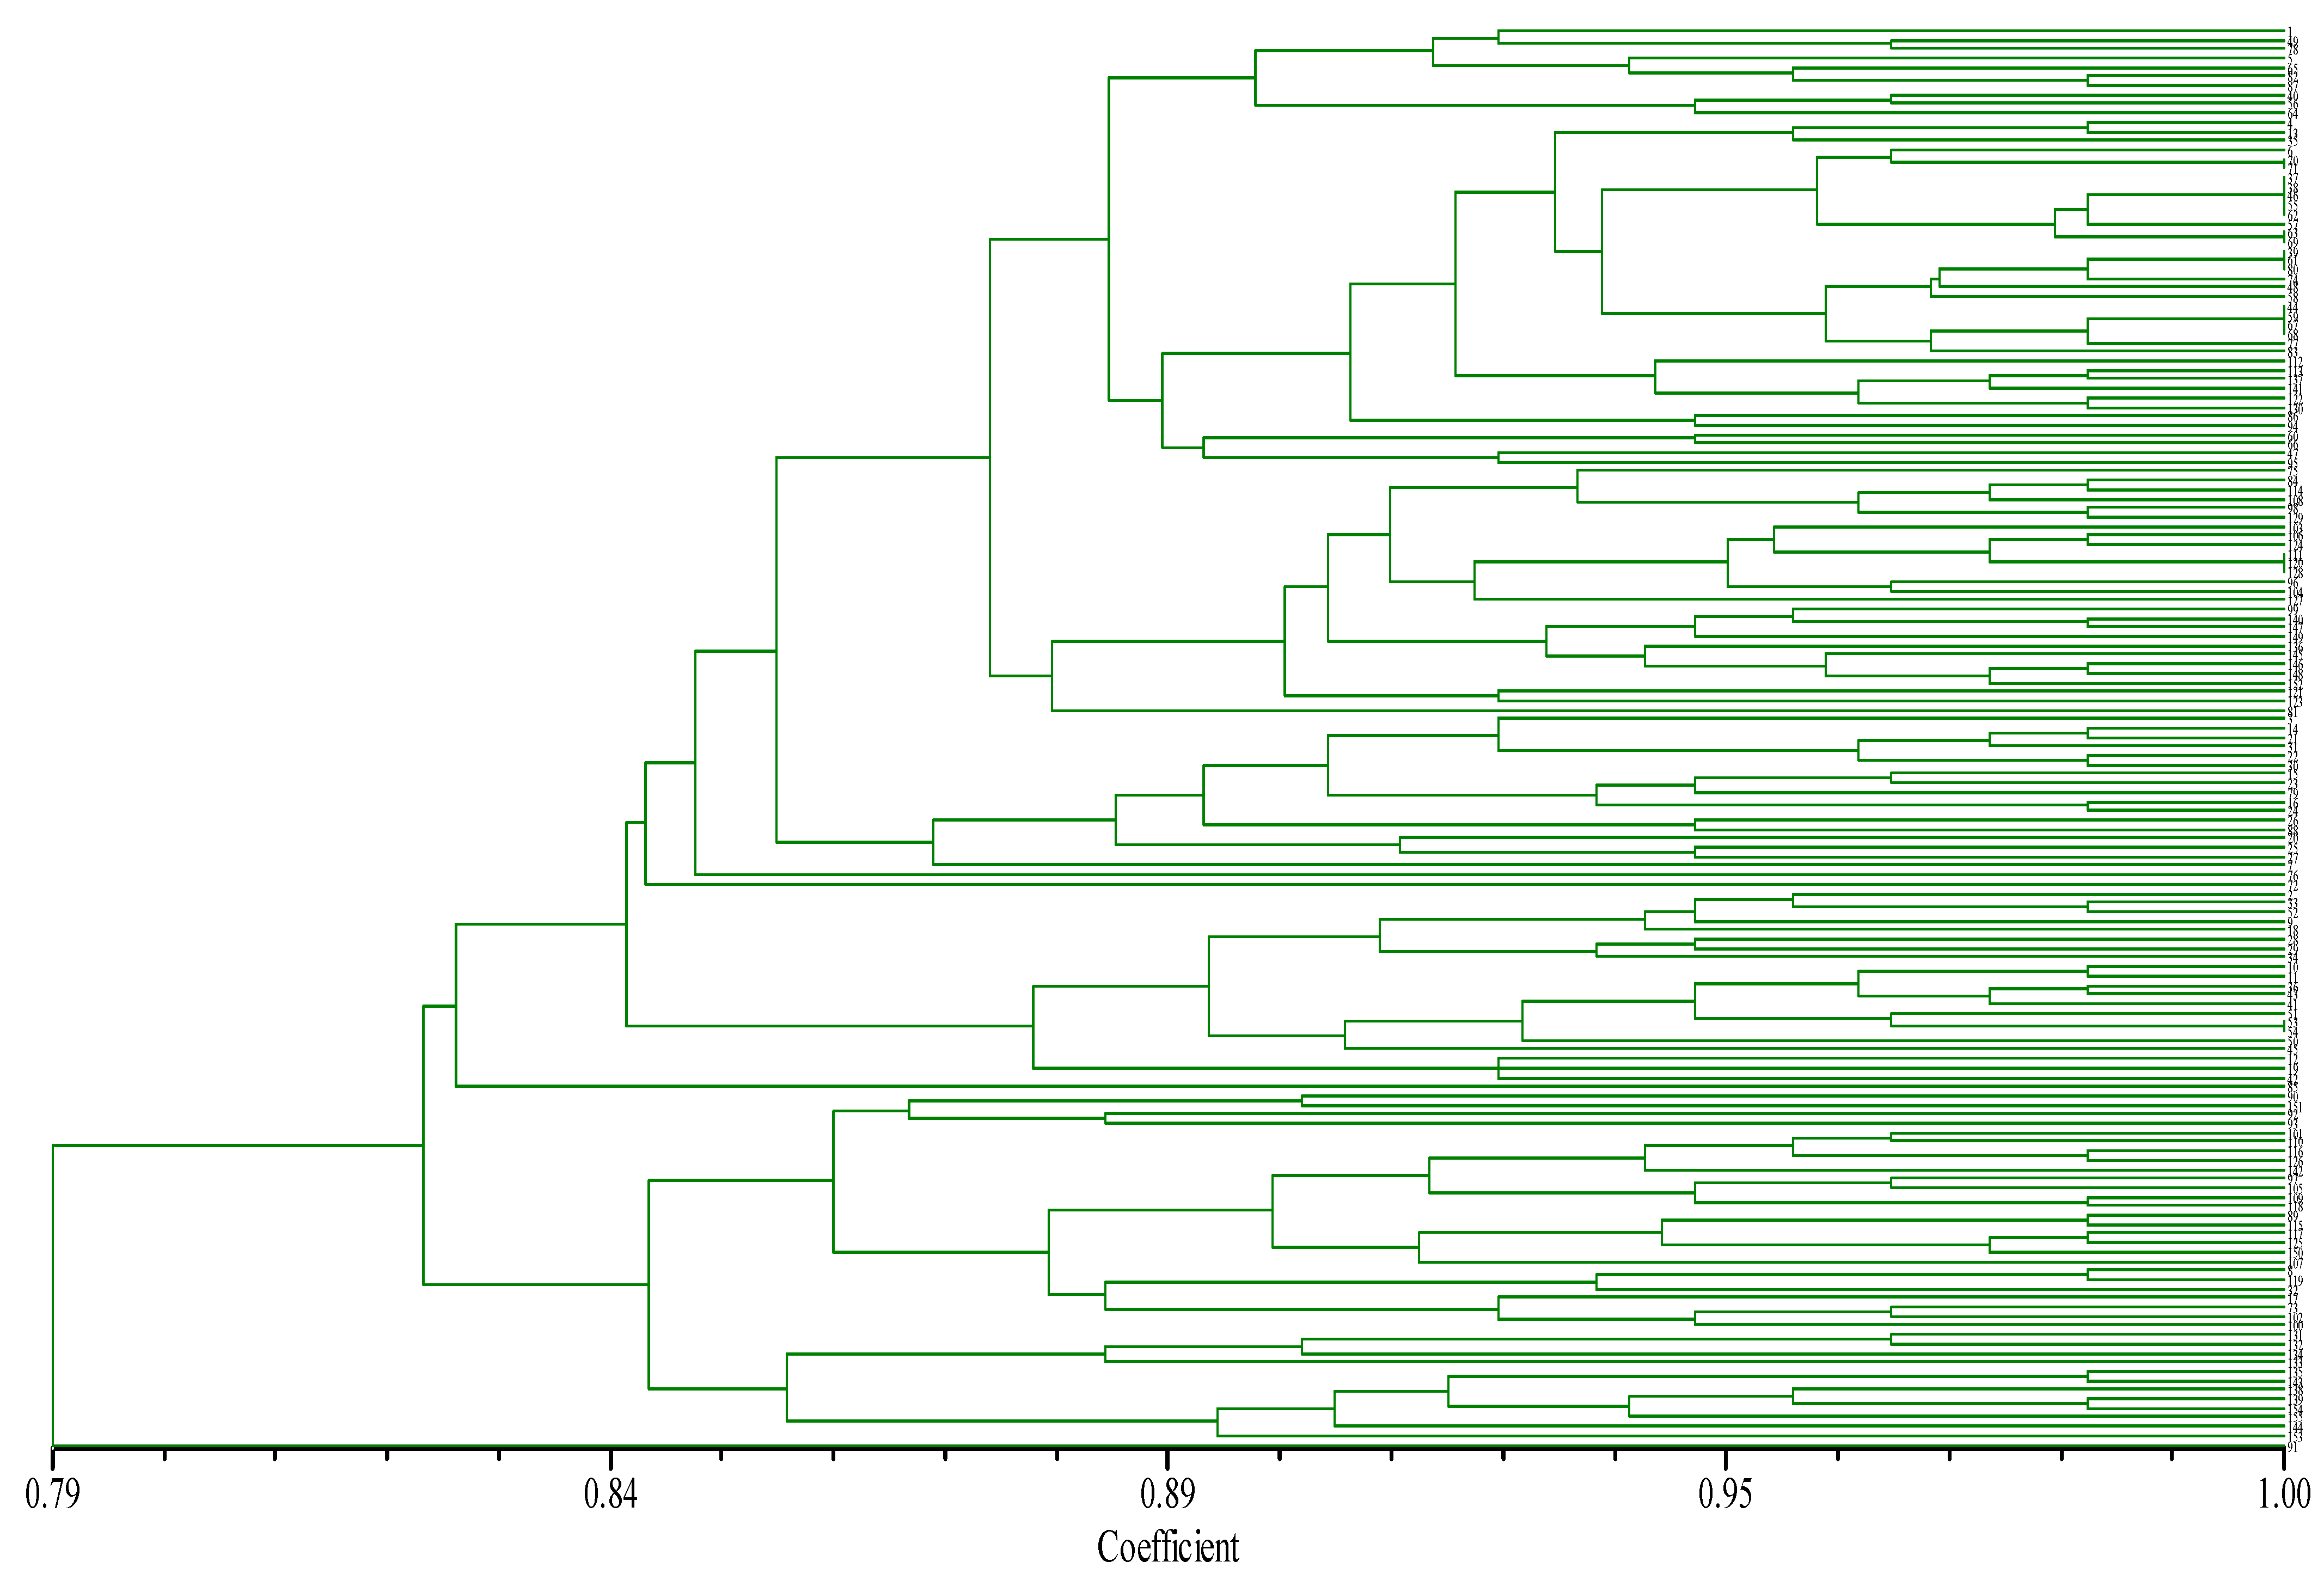
3.5.1. Cluster Analysis of Chili Germplasm Based on SSR Markers and Reserve Ratio Analysis of Pre-Selected Core Collection

Figure S1 displays the amplification results for 155 pepper varieties using eight pairs of SSR primers. These primers exhibited strong polymorphism, with distinct peaks and amplification fragments ranging from 122 to 352 bp. Using GeneMarker 2.2.0 software, 54 polymorphic fragments were identified. Primers CIDAM-7, CIDAM-2, CIDAM-8, CIDAM-6, CIDAM-3, CIDAM-1, CIDAM-4, and CIDAM-5 generated 14, 11, 7, 6, 5, 4, 4, and 3 polymorphic fragments, respectively (Table 7). The average number of polymorphic bands per primer was 6.75, achieving a 100% polymorphism rate.
Cluster analysis, using the “0, 1” matrix from NYSY software, organized the 155 chili germplasms into 11 levels: 10.97%, 14.19%, 18.06%, 24.52%, 30.32%, 40.65%, 52.90%, 58.71%, 69.68%, 74.19%, and 90.32% (Figure 3). For compression percentages of the pre-selected core germplasm from 10.97% to 52.90%, allelic variation retention (RVA) increased with higher compression, reaching 100% at ≥52.9% compression. In this range, allelic retention was 94.44% at 30.32% compression and 96.30% at 40.65%. In contrast, at compression levels ≤24.52%, RVA fell below 90% (Table 8). Additionally, for compression percentages between 10.97% and 30.32%, RPR significantly increased with compression. As the compression ratio rose from 40.65% to 69.68%, the RPR reached 97.85%, and at 74.19% to 100% compression, the RPR achieved 100%.

3.5.2. Shannon-Weaver Index Analysis of Pre-Selected Core Collection of Peppers Obtained with Different Clustering Compression Ratios

In the compression spectrum of 10.97% to 100%, the Shannon-Weaver diversity index decreases as the proportion of compressed samples increases, accompanied by a rise in genetic repetition and allele omissions (Table 9). Notably, the Shannon index for phenotypes fluctuates irregularly within this range. Specifically, from 14.19% to 58.71% compression, the Shannon index consistently exceeds 80%, while it falls below this threshold outside these ratios. The Shannon index shows minimal variation across all retention schemes, with a range of 4.26%.
When the CR exceeds 24.52%, the RPR surpasses 91.40%. Similarly, CR values above 30.32% result in an allele retention ratio exceeding 94.44%. In the 14.19% to 24.52% compression range, the allele retention ratio fluctuates between 83.33% and 87.04%. Consistently, within the 14.19% to 58.71% compression range, the phenotype Shannon index remains above 80%, while it drops below 80% at other compression ratios. The minimal variation in the phenotype Shannon index across different compression ratios highlights its limited variability. Specifically, when the CR is between 10.97% and 18.06%, the Shannon-Weaver index exceeds 0.2837; outside this range, it falls below this threshold. Consequently, a compression percentage of 14.19% was selected for the predetermined molecular core collection, encompassing 22 preserved germplasms and accounting for 10 allelic variations that were not retained.

3.5.3. Evaluation of Pre-Selected Core Collection by Molecular Markers

Table 10 presents a comparative analysis of molecular genetic diversity between the original germplasm and the pre-selected core collection. The molecular core collection, with at least 22 resources, effectively preserved the original diversity while reducing genetic repetition. However, the new cluster lost nine allelic polymorphisms, resulting in an 83.33% polymorphism site percentage. Simultaneously, the Shannon-Weaver index increased to 121.66%, indicating enhanced phenotypic diversity. Additionally, the average number of alleles increased to 2.0455.

3.5.4. Improvement of Molecular Marker Pre-Selection of Core Collection

To address the loss of 10 polymorphic loci in the reserved germplasm of 22 varieties, a strategic approach was implemented. The selection process from the pre-selected core collection was enhanced with phenotype data to reintroduce the lost polymorphic loci. This refinement resulted in an SSR molecular core collection of 32 pepper varieties, successfully retaining all 54 polymorphic loci with a 100% retention rate (Table 11). The Shannon-Weaver index increased by 25.68% compared to the original germplasm, and the average number of alleles also rose significantly. This refined collection eliminated redundant germplasm and accurately represented the original genetic diversity.

3.5.5. Integrating Phenotypic and Molecular Core Germplasm to Construct the Final Pepper Core Collection

The phenotypic and molecular core germplasm of 63 varieties underwent further compression at ratios of 40%, 50%, 60%, 70%, 80%, and 90% (Table 12). At a 90% compression ratio, all polymorphic loci from the original germplasm were retained, achieving a phenotype retention ratio of 92.55%. As a result, the final core collection consists of 57 varieties, effectively preserving the genetic diversity of the original germplasm (Table S4).

4. Discussion

The preservation of crop resources relies on the establishment of core germplasm collections, where effective sampling ratios and retention strategies are essential. Brown [41] suggested retaining 5% to 10% of the original sample size, capping at 3000 samples. In contrast, Yonezawa et al. [42] recommended a 20–30% sampling ratio for populations with genetic distances (DR) between 0.2 and 0.9. Generally, the sampling ratio depends on the genetic structure and diversity of the species, often decreasing with larger population sizes. Sampling ratios for core germplasm collections in various plant species range from 5% to 40% [43]. Our study identified the overall retention scale and square root ratio method as the most effective for phenotypic core germplasm. Accordingly, we established a phenotypic core collection of 41 pepper varieties with retention ratios of 25% to 30%, consistent with the ratios seen in most populations.
Essential for constructing core germplasm collections are accurate evaluation data and detailed characteristic and identification information. Morphological and agronomic traits are critical for species definition and core germplasm evaluation [33,34,35,36,37,38], serving a key role in initial collection efforts. For example, Zewdie et al. (2004) [33] established a core collection of 137 accessions from 1202 chili germplasms at the USDA by using 21 phenotypic traits, stratified grouping, and representative sampling. Similarly, Lei et al. analyzed 21 qualitative and 7 quantitative traits from 603 chili peppers to create a core collection of 91 accessions. Liu et al. (2015) [44] developed a core collection of 43 accessions from 146 Huang-denglong pepper varieties based on 10 phenotypic traits. Despite their importance, phenotypic traits may not always reflect genotypic differences accurately due to environmental variability. Molecular markers, such as chloroplast trnH-psbA sequences, SSR, RAPD, SRAP, AFLP, and SNP, have become increasingly valuable because they are unaffected by environmental factors and provide benefits such as high abundance, broad distribution, stability, and rapid detection [39,40,45,46,47]. Among these, second-generation markers like SSR are favored for their cost-effectiveness, precision, and standardized procedures. Nicola et al. (2013) [30] used 28 SSR markers to develop a core collection of 332 chili germplasms from 1352 samples across 11 species in 89 countries. Mongkolporn et al. (2015) [48] selected 28 core collections from 230 chili peppers using 10 SSR loci. He et al. (2015) [49] examined genetic variation in 90 local chili germplasms from Guizhou and 7 from elsewhere, resulting in a core collection of 9 peppers. Lee et al. (2016) [6] analyzed genetic diversity and population structure with 48 SNPs from 4652 pepper samples across 11 species in 97 countries, establishing the ‘CC240’ core collection of 240 germplasms. In 2016, the Vegetable and Flower Research Institute of the Chinese Academy of Agricultural Sciences (CAAS) utilized 29 SSR markers to analyze 1904 pepper germplasms from China’s vegetable germplasm bank, resulting in a core collection of 334 germplasms. Wu (2017) [50] analyzed 512 pepper germplasms with 21 SRAP primer pairs, initially creating a core collection of 288 samples, which was further refined to 200 samples using 65 SSR markers. In our study, we first established a phenotype-based core collection. We then used SSR molecular markers to create a molecular core collection of 22 materials, achieving a compression ratio of 14.19%. The two collections were integrated and further compressed. At a final compression ratio of 90%, the germplasm bank preserved all polymorphic loci from the original samples, with a phenotype retention ratio of 92.6%. This core collection comprehensively represents the original germplasm.
The core germplasm strategy optimizes the use of original germplasm resources by minimizing redundancy and preserving genetic diversity and geographical variation with minimal material. This method streamlines the collection, evaluation, and utilization of germplasm resources. In this study, a core germplasm collection of 57 accessions was developed, including 36 var. longum Bailey, 10 var. grossum Bailey, 4 var. fasciculatum Bailey, 10 var. conoides Bailey, and 1 var. cerasiforme Bailey (Table S4). The collection encompasses both domestic and foreign resources, showing significant diversity in key traits such as flower organ structure, mature fruit color, fruit shape, and spiciness (Table 5). This diversity provides a robust foundation for gene mining and improves breeding efficiency.

Supplementary Materials

The following supporting information can be downloaded at https://www.mdpi.com/article/10.3390/app14177473/s1, Tables S1–S4 and Figure S1. Table S1. Information of pepper germplasm used in this study. Table S2. Assignment of values for quality traits in pepper germplasm resources. Table S3. Construction of core germplasm. Table S4. The final core germplasm. Figure S1. Visualization of Polyacrylamide gel electrophoresis PCR products in some pepper germplasms using SSR primers.

Author Contributions

Q.D. and S.Z.: software, methodology, data curation, investigation, writing-original draft, and writing—review and editing. C.G., G.F., S.Y. and X.L.: methodology and software. H.F.: English writing polishing. Z.W.: supervision, investigation, and visualization. S.C. and S.L.: conceptualization, supervision, funding acquisition, validation, resources, and writing—review and editing. All authors have read and approved the final version of the manuscript. All authors have read and agreed to the published version of the manuscript.

Funding

This study was funded by the Hainan Provincial Natural Science Foundation of China (grant number: 320RC474) and Key R&D Projects in Hainan Province (grant number: ZDYF2022XDNY159).

Institutional Review Board Statement

Not applicable.

Informed Consent Statement

Not applicable.

Data Availability Statement

The datasets presented in this study can be found in online repositories of the National Center for Biotechnology Information (NCBI). The accession number is PRJNA932246.

Acknowledgments

We would like to thank all the students for assisting with the collection and processing of data. We are grateful to the reviewers for their helpful suggestions.

Conflicts of Interest

The authors declare no conflicts of interest.

References

  1. Ou, L.; Li, D.; Lv, J.; Chen, W.; Zhang, Z.; Li, X.; Yang, B.; Zhou, S.; Yang, S.; Li, W. Pan-genome of cultivated pepper (Capsicum) and its use in gene presence-absence variation analyses. New Phytol. 2018, 220, 360. [Google Scholar] [CrossRef]
  2. Kumar, S.; Kumar, R.; Singh, J. Cayenne/American pepper. In Handbook of Herbs and Spices; Peter, K.V., Ed.; Woodhead Publishing Limited: Cambridge, UK, 2006; pp. 12–54. [Google Scholar]
  3. Ramchiary, N.; Kole, C. The Capsicum Genome; Springer International Publishing: Cham, Switzerland, 2019; pp. 102–112. [Google Scholar]
  4. Kenyon, L.; Kumar, S.; Tsai, W.S.; Hughes, J.D.A. Virus diseases of peppers (Capsicum spp.) and their control. In Advances in Virus Research; Loebenstein, G., Katis, N., Eds.; Academic Press: Burlington, ON, Canada, 2014; Volume 90, pp. 5–43. [Google Scholar]
  5. Duranova, H.; Valkova, V.; Gabriny, L. Chili peppers (Capsicum spp.): The spice not only for cuisine purposes: An update on current knowledge. Phytochem. Rev. 2022, 21, 1379–1413. [Google Scholar] [CrossRef]
  6. Lee, H.Y.; Ro, N.Y.; Jeong, H.J.; Kwon, J.K.; Jo, J.; Ha, Y.; Jung, A.; Han, J.W.; Venkatesh, J.; Kang, B.C. Genetic diversity and population structure analysis to construct a core collection from a large Capsicum germplasm. BMC Genet. 2016, 17, 142. [Google Scholar] [CrossRef]
  7. Luitel, B.P.; Ro, N.Y.; Ko, H.C.; Sung, J.S.; Rhee, J.H.; Hur, O.S. Phenotypic variation in a germplasm collection of pepper (Capsicum chinense Jacq.) from Korea. J. Crop Sci. Biotech. 2018, 21, 499–506. [Google Scholar] [CrossRef]
  8. Ramchiary, N.; Kehie, M.; Brahma, V.; Kumaria, S.; Tandon, P. Application of genetics and genomics towards Capsicum translational research. Plant Biotechnol. Rep. 2014, 8, 101–123. [Google Scholar] [CrossRef]
  9. Oliveira, M.F.; Nelson, R.L.; Geraldi, I.; Cruz, C.D.; Toledo, J.F. Establishing a soybean germplasm core collection. Field Crops Res. 2010, 119, 277–289. [Google Scholar] [CrossRef]
  10. Frankel, O.H.; Brown, A.H.D. Plant genetic resources today: A critical appraisal. In Crop Genetic Resources: Conservation and Evaluation; Holden, J.H.W., Williams, J.T., Eds.; George Allen and Unwin: London, UK, 1984; pp. 249–257. [Google Scholar]
  11. Sandhu, N.; Singh, J.; Singh, G.; Sethi, M.; Singh, M.P.; Pruthi, G.; Raigar, O.P.; Kaur, R.; Singh Sarao, P.; Singh Lore, J.; et al. Development and validation of a novel core set of KASP markers for the traits improving grain yield and adaptability of rice under direct-seeded cultivation conditions. Genomics 2022, 114, 110269. [Google Scholar] [CrossRef]
  12. Ambati, D.; Phuke, R.M.; Vani, V.; Sai Prasad, S.V.; Singh, J.B.; Patidar, C.P.; Malviya, P.; Gautam, A.; Dubey, V.G. Assessment of genetic diversity and development of core germplasm in durum wheat using agronomic and grain quality traits. Cereal Res. Commun. 2020, 48, 375–382. [Google Scholar] [CrossRef]
  13. Yao, Q.; Fan, P.; Zou, S. Constructing a core collection for maize (Zea mays L.) landrace from Wuling Mountain region in China. Agric. Sci. China 2008, 7, 1423–1432. [Google Scholar] [CrossRef]
  14. Guo, Y.; Kuang, L.; Xu, Y.; Yan, T.; Jiang, L.; Dong, J.; Wu, D. Construction of a worldwide core collection of rapeseed and association analysis for waterlogging tolerance. Plant Growth Regul. 2022, 98, 321–328. [Google Scholar] [CrossRef]
  15. Lassois, L.; Denancé, C.; Ravon, E.; Guyader, A.; Guisnel, R.; Hibrand-Saint-Oyant, L.; Poncet, C.; Lasserre-Zuber, P.; Feugey, L.; Durel, C. Genetic diversity, population structure, parentage analysis, and construction of core collections in the French apple germplasm based on SSR Markers. Plant Mol. Biol. Rep. 2016, 34, 827–844. [Google Scholar] [CrossRef]
  16. Liang, W.; Dondini, L.; De Franceschi, P.; Paris, R.; Sansavini, S.; Tartarini, S. Genetic diversity, population structure and construction of a core collection of apple cultivars from Italian germplasm. Plant Mol. Biol. Rep. 2015, 33, 458–473. [Google Scholar] [CrossRef]
  17. Wang, Y.; Zhang, J.; Sun, H.; Ning, N.; Yang, L. Construction and evaluation of a primary core collection of apricot germplasm in China. Sci. Hortic. 2011, 128, 311–329. [Google Scholar] [CrossRef]
  18. Wang, R.; Zhong, Y.; Hong, W.; Luo, H.; Li, D.; Zhao, L.; Zhang, H.; Wang, J. Genetic diversity evaluation and core collection construction of pomegranate (Punica granatum L.) using genomic SSR markers. Sci. Hortic. 2023, 319, 112192. [Google Scholar] [CrossRef]
  19. Nie, X.; Wang, Z.; Liu, N.; Song, L.; Yan, B.; Xing, Y.; Zhang, Q.; Fang, K.; Zhao, Y.; Chen, X.; et al. Fingerprinting 146 Chinese chestnut (Castanea mollissima Blume) accessions and selecting a core collection using SSR markers. J. Integr. Agric. 2021, 20, 1277–1286. [Google Scholar] [CrossRef]
  20. Sun, Q.; Bai, L.; Ke, L.; Xiang, X.; Zhao, J.; Ou, L. Developing a core collection of litchi (Litchi chinensis Sonn.) based on EST-SSRgenotype data and agronomic traits. Sci. Hortic. 2012, 146, 29–38. [Google Scholar] [CrossRef]
  21. Li, P.; Su, T.; Yu, S.; Wang, H.; Wang, W.; Yu, Y.; Zhang, D.; Zhao, X.; Wen, C.; Zhang, F. Identifcation and development of a core set of informative genic SNP markers for assaying genetic diversity in Chinese cabbage. Hortic. Environ. Biotechnol. 2019, 60, 411–425. [Google Scholar] [CrossRef]
  22. Gopal, J.; Kumar, V.; Kumar, R.; Mathur, P. Comparison of different approaches to establish a core collection of andigena (Solanum tuberosum Group Andigena) Potatoes. Potato Res. 2013, 56, 85–98. [Google Scholar] [CrossRef]
  23. Corradoa, G.; Caramantea, M.; Piffanelli, P.; Rao, R. Genetic diversity in Italian tomato landraces: Implications for the development of a core collection. Sci. Hortic. 2014, 168, 138–144. [Google Scholar] [CrossRef]
  24. Benke, A.P.; Krishna, R.; Mahajan, V.; Ansari, W.A.; Gupta, A.J.; Khar, A.; Shelke, P.; Thangasamy, A. Genetic diversity of Indian garlic core germplasm using agrobiochemical traits and SRAP markers. Saudi J. Biol. Sci. 2021, 28, 4833–4844. [Google Scholar] [CrossRef]
  25. Wang, W.; Miyatake, K.; Saito, T.; Harada, Y.; Yamaguchi, S.; Koyama, M.; Nakamura, K. Acetylcholine content in 100 accessions from the worldwide eggplant (Solanum melongena L.) core collection. J. Food Compos. Anal. 2023, 119, 105233. [Google Scholar] [CrossRef]
  26. Hoshikawa, K.; Lin, Y.P.; Schafleitner, R.; Shirasawa, K.; Isobe, S.; Nguyen, D.; Ohsawa, R.; Yoshioka, Y. Genetic diversity analysis and core collection construction for Amaranthus tricolor germplasm based on genome wide single nucleotide polymorphisms. Sci. Hortic. 2023, 307, 111428. [Google Scholar] [CrossRef]
  27. Zhuang, F.; Zhao, Z.; Li, X.; Hu, H.; Fang, Z. A core collection of chinese traditional carrot germplasm. Acta Hortic. Sin. 2006, 33, 46–51. [Google Scholar]
  28. Fan, M.; Chen, S.; Engle, L.M. The study on genetic diversity of the core collection for Capsicum using random amplified. J. Agric. Res. China 2004, 53, 165–178. [Google Scholar]
  29. Hanson, P.M.; Yang, R.-Y.; Lin, S.; Tsou, S.C.S.; Lee, T.-C.; Wu, J.; Shieh, J.; Gniffke, P.; Ledesma, D. Variation for antioxidant activity and antioxidants in a subset of AVRDC-the World Vegetable Center Capsicum core collection. Plant Genet. Resour. 2004, 2, 153–166. [Google Scholar] [CrossRef]
  30. Nicolaï, M.; Cantet, M.; Lefebvre, V.; Sage-Palloix, A.M.; Palloix, A. Genotyping a large collection of pepper (Capsicum spp.) with SSR loci brings new evidence for the wild origin of cultivated C. annuum and the structuring of genetic diversity by human selection of cultivar types. Genet. Resour. Crop Evol. 2013, 60, 2375–2390. [Google Scholar] [CrossRef]
  31. Quenouille, J.; Saint-Felix, L.; Moury, B.; Palloix, A. Diversity of genetic backgrounds modulating the durability of a major resistance gene. Analysis of a core collection of pepper landraces resistant to Potato virus Y. Mol. Plant Pathol. 2016, 17, 296–302. [Google Scholar] [CrossRef]
  32. Thies, J.A.; Fery, R.L. Evaluation of a core of the U.S. Capsicum germplasm collection for reaction to the northern root-knot nematode. HortScience 2002, 37, 805–810. [Google Scholar] [CrossRef]
  33. Zewdie, Y.; Tong, N.; Bosland, P. Establishing a core collection of Capsicum using a cluster analysis with enlightened selection of accessions. Genet. Resour. Crop Evol. 2004, 51, 147–151. [Google Scholar] [CrossRef]
  34. Jiang, D.F.; Li, J.D.; Hong, Y. Techniques for chili pepper cultivation in the open field in Hainan island, China. J. China Capsicum 2004, 2, 17–18. [Google Scholar]
  35. Li, X.; Zhang, B.X. Specification and Data Standards for Describing Chili Germplasm Resources; China Agricultural Publishing House: Beijing, China, 2006; pp. 47–98. [Google Scholar]
  36. Liu, M.X.; Liu, C.H.; Fan, X.C.; Guo, D.L.; Zhang, G.H.; Sun, H.S. Construction of primary core collection of grape genetic resources. J. Plant Genet. Resour. 2012, 13, 72–76. [Google Scholar]
  37. Shen, Z.J.; Ma, R.J.; Yu, M.L.; Cai, Z.X.; Xu, J.L. Establishment of peach primary core collection based on accessions conserved in national fruit germplasm repository of Nanjing. Acta Hortic. Sin. 2013, 40, 125–134. [Google Scholar]
  38. Zhang, W. SPSS Statistical Analysis Fundamentals Tutorial; Higher Education Press: Beijing, China, 2017; pp. 6–102. [Google Scholar]
  39. Wu, Z.; Liu, W.; Tang, X.; Cui, J.; Cheng, J.; Hu, K. Development and application of EST-SSR markers for chili peppers. J. South China Agric. Univ. 2012, 33, 171–174. [Google Scholar]
  40. Brown, A.H.D. The core collection at the crossroads. In Core Collection of Plant Genetic Resources; Hodgkin, T., Brwon, A.H., van Hintum, T.H.L., Eds.; IPGRI, A Wiley-Sayce Publication: Hoboken, NJ, USA, 1995; Volume 3–20, pp. 1163–1168. [Google Scholar]
  41. Yonezawa, K.; Nomura, T.; Morishima, H. Sampling strategies for use in stratified germplasm collections. In Core Collection of Plant Genetics Resources; Hodgkin, T., Brown, A.H.D., van Hintum, T.H.L., Eds.; IPGRI, A Wiley-Sayce Publication: Hoboken, NJ, USA, 1995; Volume 90, pp. 35–54. [Google Scholar]
  42. Frankel, O.H. Genetic perspectives of germplasm conservation. In Genetic Manipulation: Impact on Man and Society; Arber, W., Llimensee, K., Peacock, W.J., Starlinger, P., Eds.; Cambridge University Press: Cambridge, UK, 1984. [Google Scholar]
  43. Bar-Hen, A.; Charcosset, A.; Bourgoin, M.; Guiard, J. Relationship between genetic markers and morphological traits in maize inbred lines collection. Euphytica 1995, 84, 145–154. [Google Scholar] [CrossRef]
  44. Liu, Z.J.; Sun, J.H.; Yang, Y.; Cao, Z.M. Comparative study on the construction of Capsicum chinense Jacquin Core Collection. Chin. J. Trop. Crops 2015, 36, 2155–2160. [Google Scholar]
  45. Gu, X.Z. The Research of Genetic Diversity of Pepper (Capsicum spp.) Germplasms of China and Core Collection Construction; Chinese Academy of Agricultural Sciences: Beijing, China, 2016; pp. 34–37. [Google Scholar]
  46. Li, Y.X.; Gao, Q.J.; Li, T.H. Sampling strategy based on fruit characteristics for a primary core collection of peach cultivars. J. Fruit Sci. 2006, 3, 359–364. [Google Scholar]
  47. Miyatake, K.; Shinmura, Y.; Matsunaga, H.; Fukuoka, H.; Saito, T. Construction of a core collection of eggplant (Solanum melongena L.) based on genome-wide SNP and SSR genotypes. Breed. Sci. 2019, 69, 498–502. [Google Scholar] [CrossRef]
  48. Mongkolporn, O.; Hanyong, S.; Chunwongse, J.; Wasee, S. Establishment of a core collection of chilli germplasm using microsatellite analysis. Plant Genet. Resour. 2015, 13, 104–110. [Google Scholar] [CrossRef]
  49. He, J.W.; Han, S.Y. Construction of Core Capsicum Germplasm Bank Based on Different Distance Clustering and Sampling Method of SSR Marker. Southwest China J. Ayicultural Sci. 2015, 28, 2199–2204. [Google Scholar]
  50. Wu, Q. Genetic Diverstiy Analysis and Estalishment of the Core Collcetion of Pepper Germplasm Resources Based on SRAP, SSR Makers; Jiangxi Agriculture University: Nanchang, China, 2015; pp. 46–49. [Google Scholar]
Figure 1. Diagram of sampling.
Applsci 14 07473 g001
Figure 2. Phenotypic comparison between pre-selected core and entire collections.
Applsci 14 07473 g002
Figure 3. The dendrogram of cluster analysis of pepper based on SSR-PCR products. Note: From top to bottom, the variety numbers in the tree chart are: 1, 49, 78, 5, 65, 82, 87, 40, 56, 64, 4, 13, 35, 6, 70, 71, 37, 38, 46, 55, 62, 57, 63, 69, 39, 61, 80, 74, 48, 58, 44, 59, 67, 68, 77, 83, 112, 113, 137, 141, 122, 130, 86, 94, 60, 66, 47, 95, 75, 84, 114, 108, 98, 129, 103, 106, 124, 111, 120, 128, 96, 104, 127, 99, 140, 147, 149, 136, 145, 146, 148, 152, 121, 123, 81, 3, 14, 21, 31, 22, 30, 15, 23, 79, 16, 24, 26, 88, 20, 25, 27, 7, 76, 72, 2, 33, 52, 9, 18, 28, 29, 34, 10, 11, 36, 43, 41, 51, 53, 54, 50, 45, 12, 19, 42, 85, 90, 151, 92, 93, 101, 110, 116, 126, 142, 97, 105, 109, 118, 89, 115, 117, 125, 150, 107, 8, 119, 32, 17, 73, 102,100, 131,132, 134, 133, 135, 143, 138, 139,154, 155, 144, 153, 91.
Applsci 14 07473 g003
Table 1. SSR-PCR primer pairs used in the study.
Primer NameSequence (5′ to 3′)
CIDAM-1FCTTTCAGCGACACAACCAGG
CIDAM-1RACAACGTCTGAAATTAGTCCCAAA
CIDAM-2FACATGAATTGTGACCGAGGAAGT
CIDAM-2RAGGGGTTGTTTGGTAGCTAGC
CIDAM-3FTGTGAGACACAAGTGTTGCAG
CIDAM-3RAGACGCTTTTTCCCTCTGGT
CIDAM-4FGGCAGAGGAATAAATTGGCCA
CIDAM-4RACGTGACGCATTCTAAGACCT
CIDAM-5FTGGAGGCCCAGAGTCAACAT
CIDAM-5RGCTATTTGTGTGTGCCGCTC
CIDAM-6FACACATCATTGTCCAACCAAGT
CIDAM-6RACTGGATGATGGGTAGTTTGTGA
CIDAM-7FTCCCATGGTTGTAACTTTGATTTCC
CIDAM-7RTGCTAAAGGTGGTGAGCGTT
CIDAM-8FGAGTACATAAGTCCCCGCCC
CIDAM-8RTATCTTTGCGGCCTTCGTGT
Note: The fluorescence-labeled 5′ ends of the upstream primers are labeled in red and blue.
Table 2. Grouping of ecology and genetic diversity analysis in primary germplasm.
GroupingNumber of Resource SharesSimple Sample Retention Ratio (%)Diversity Index (Hi)
var. fasciculatum Bailey95.81%0.6699
var. grossum Bailey1610.32%0.6905
var. cerasiorme Bailey31.94%0.3833
var. conoides Bailey117.10%0.8294
var. longum Bailey11674.84%0.7729
Total155100.00%0.7954 *
* Diversity index of original germplasm.
Table 3. Evaluation parameters for 24 pre-core subsets.
Intragroup Retention Ratio MethodOverall Sample Retention RatioRatio of Phenotypic Retention (RPR)Coincidence Rate of Range (CR)Change Rate of Coefficient of Variation CVRGenetic Diversity Index (Hi)
Simple sample retention5%79.80%75.76%122.82%0.9466
10%82.83%77.64%122.42%0.9118
15%88.89%82.15%129.47%0.9521
20%92.93%85.07%130.53%0.9589
25%94.95%86.11%133.15%0.9582
30%94.95%86.11%134.62%0.9284
Logarithmic retention sample5%74.75%74.51%116.81%0.8728
10%88.89%84.03%148.98%0.9364
15%91.92%85.07%151.50%0.9545
20%94.95%86.11%149.65%0.9378
25%95.96%87.15%152.83%0.9383
30%96.97%89.24%156.15%0.9397
Square root retention sample5%76.77%74.51%171.23%0.8793
10%86.87%82.99%173.85%0.9286
15%91.92%85.07%175.95%0.9491
20%93.94%86.11%177.62%0.9537
25%96.97%87.15%181.75%0.9517
30%96.97%88.19%183.05%0.9336
Diversity retention sample5%67.68%72.43%196.68%0.8121
10%87.88%82.99%197.19%0.9291
15%90.91%85.07%197.92%0.9316
20%92.93%85.07%198.26%0.9257
25%92.93%85.07%201.20%0.9217
30%94.95%89.24%204.81%0.9286
original sample100%100%100%100%0.7954
Table 4. Accessions of selected germplasm from each group to corresponding pre-core germplasm under different sampling strategies.
Overall Sample Retention RatioGermplasm CategoryIntragroup Retention Ratio Method
Simple Sample RetentionLogarithmic Retention SampleSquare Root Retention SampleDiversity Retention Sample
5%var. fasciculatum Bailey1222
var. grossum Bailey1222
var. cerasiforme Bailey1111
var. conoides Bailey1222
var. longum Bailey6342
Number of pre-selected core germplasm1010119
10%var. fasciculatum Bailey1334
var. grossum Bailey2434
var. cerasiforme Bailey1222
var. conoides Bailey2334
var. longum Bailey12684
Number of pre-selected core germplasm18181918
15%var. fasciculatum Bailey2445
var. grossum Bailey3545
var. cerasiforme Bailey1223
var. conoides Bailey2546
var. longum Bailey189116
Number of pre-selected core germplasm26252525
20%var. fasciculatum Bailey2657
var. grossum Bailey4767
var. cerasiforme Bailey1333
var. conoides Bailey3658
var. longum Bailey2412158
Number of pre-selected core germplasm34343433
25%var. fasciculatum Bailey3768
var. grossum Bailey4978
var. cerasiforme Bailey1333
var. conoides Bailey38610
var. longum Bailey2914199
Number of pre-selected core germplasm40414138
30%var. fasciculatum Bailey3879
var. grossum Bailey510910
var. cerasiforme Bailey1333
var. conoides Bailey49711
var. longum Bailey35172211
Number of pre-selected core germplasm48474844
Table 5. Basic genetic parameters of 41 core collections and primary germplasms.
TraitsMinMaxRangeMeanSDCV/%
Stem color1133221.511.250.840.6455.57%51.18%
Shorter internodes of the lower part
in plant
lower part in plant
9999009.009.000.000.000.00%0.00%
Development of the bud5555005.005.000.000.000.00%0.00%
Leaf shape1133221.381.350.530.4538.72%33.51%
Leaf color1157462.953.181.261.0942.83%34.27%
Flower blooming form3377443.373.170.970.6628.77%20.67%
The attached morphology of flower stalks 3399665.244.592.012.0038.33%43.51%
Fruit shape1177665.105.632.301.9345.12%34.22%
Fruit growth state3377446.326.641.150.8718.20%13.06%
Color of green mature fruit1166554.104.151.040.8425.48%20.15%
Color of mature fruit1155443.783.890.690.4618.24%11.92%
Fruit surface texture1133221.391.120.740.4353.05%38.14%
Plant height/cm1199884.713.812.181.6046.36%42.14%
Plant width/cm3377444.414.381.281.0829.09%24.72%
Branches size/cm1155442.171.921.050.8948.21%46.12%
Number of results in Per axil axillary1144331.381.150.730.5152.93%44.02%
Leaf width/cm3357243.934.121.011.0525.71%25.39%
Leaf width/cm3377443.713.701.151.0130.90%27.21%
Pulp thickness/mm 3399665.445.771.981.6236.32%28.02%
Longitudinal diameter of fruit/cm1199885.245.591.801.2934.32%23.11%
Crosscut size of fruit/cm3399665.155.131.641.5231.80%29.70%
Fruit shape index1199884.024.251.961.6648.59%39.08%
Fruit weight/g3399665.345.611.731.5032.32%26.77%
Locule number1133222.021.940.570.5528.13%28.65%
Note: The left values represent the corresponding core germplasm; the right-side values correspond to the original germplasm.
Table 6. Principal component analysis of core collection and primary germplasm.
ComponentEntire CollectionPre-Core CollectionDifference Between Entire Collection and Pre-Core Collection
EigenvaluesProportionCumulativeEigenvaluesProportionCumulativeDifference of EigenvaluesDifference of ProportionDifference of Cumulative
PC13.886917.67%17.67%4.272319.42%19.42%0.38541.75%1.75%
PC23.161614.37%32.04%3.84117.46%36.88%0.67943.09%4.84%
PC32.13189.69%41.73%2.14799.76%46.64%0.01610.07%4.91%
PC41.65037.50%49.23%1.96458.93%55.57%0.31421.43%6.34%
PC51.24075.64%54.87%1.47936.72%62.30%0.23861.08%7.43%
PC61.1465.21%60.08%1.25385.70%68.00%0.10780.49%7.92%
PC71.04394.74%64.82%1.17175.33%73.32%0.12780.59%8.50%
Table 7. Number of bands amplified by eight pairs of primers on 155 pepper germplasm DNA.
Primer NameTotal Amplified BandsPolymorphic BandsProportion of Polymorphic Bands
CIDAM-144100.00%
CIDAM-21111100.00%
CIDAM-3546100.00%
CIDAM-4447100.00%
CIDAM-5351100.00%
CIDAM-6652100.00%
CIDAM-71454100.00%
CIDAM-81754100.00%
Table 8. Ratio of allele variation retained in candidate core germplasms.
Compression RatioNumber of Pre-Selected Core GermplasmNumber of Polymorphic LociAllelic Variation Retention RatioNumber of Phenotypic ReservationsPhenotypic Retention Ratio
10.97%174379.63%7176.34%
14.19%224483.33%7883.87%
18.06%284685.19%8086.02%
24.52%384787.04%8591.40%
30.32%475194.44%8793.55%
40.65%635296.30%9197.85%
52.90%8254100.00%9197.85%
58.71%9154100.00%9197.85%
69.68%10854100.00%9197.85%
74.19%11454100.00%93100.00%
90.32%14054100.00%93100.00%
Table 9. Genetic diversity index of molecular and phenotypic traits in the core collection.
Compression RatioNumber of Pre-Selected Core GermplasmNumber of Missing AllelesShannon–Weaver Diversity IndexPhenotypic Shannon Index
10.97%17110.295677.99%
14.19%22100.290981.27%
18.06%2880.284081.09%
24.52%3870.283781.46%
30.32%4730.275982.25%
40.65%6320.273781.08%
52.90%8200.266780.09%
58.71%9100.263880.29%
69.68%10800.254678.36%
74.19%11500.252379.62%
90.32%14000.244979.52%
100.00%15500.239179.54%
Table 10. Comparison of genetic diversity parameters between core and primary germplasm.
Germplasm GroupNumber of GermplasmsNumber of Polymorphic LociPercentage of Polymorphic LociShannon Weaver Diversity IndexAverage Number of Alleles
core collection224583.33%121.66%2.0455
Primitive germplasm15554100.00%100.00%0.3484
Table 11. Comparison of genetic diversity parameters between core and primary germplasm.
Germplasm GroupNumber of GermplasmNumber of polymorphic LociPercentage of Polymorphic LociShannon Weaver Diversity IndexShannon Weaver Index Change RateAverage Number of Alleles
core collection3254100.00%0.3005125.68%1.6875
Primitive germplasm15554100.00%0.2391100%0.3484
Table 12. Ratio of phenotype and number of polymorphic loci between the core and recompressed primary germplasm.
Compression RatioGermplasm NumberNumber of Phenotypic ReservationsPhenotypic Retention RatioNumber of Polymorphic Loci RetainedPolymorphic Site Retention Ratio
40.00%268388.30%3870.37%
50.00%328388.30%4277.78%
60.00%388489.36%4583.33%
70.00%458691.49%4685.19%
80.00%518691.49%5092.59%
90.00%578792.55%54100.00%
100.00%638792.55%54100.00%
Disclaimer/Publisher’s Note: The statements, opinions and data contained in all publications are solely those of the individual author(s) and contributor(s) and not of MDPI and/or the editor(s). MDPI and/or the editor(s) disclaim responsibility for any injury to people or property resulting from any ideas, methods, instructions or products referred to in the content.

