Abstract
This research aims to evaluate the efficacy of Mouromtseff’s numbers in assessing the thermal transfer performance of titanium oxide (TiO2) nanosized dispersions in convective heat transfer through a pipe. New experimental coefficients of convective heat transfer, thermophysical and rheological characterisation are carried out for TiO2-based nanodispersions in an aqueous propylene glycol 30 vol% mixture at various nanoadditive mass loadings (from 0.25 to 2.0 wt%). Different Mouromtseff’s number formulations, including the Dittus–Boelter and Simons expressions, were obtained from experimental data of thermophysical properties, enabling concise analyses on the prospective improvement of heat transfer in cooling and heating systems. The morphology, particle size, and crystallinity of the anatase TiO2 nanopowder were confirmed, and the stability of the nanofluids with various surfactants was evaluated, with PSS at a 1:4 mass ratio being optimal. Slight increments in thermal conductivity (up to 1.5%) and density (up to 1.3%) with nanoparticle loading were observed, while isobaric heat capacity presents a decreasing trend (less than 13%). Dynamic viscosity increases with higher nanoadditive concentrations, 8.8% for the 2.0 wt% A-TiO2/PG:W 30:70 + PSS 1:4 nanofluid. The employed Dittus–Boelter and Simons expressions correctly predict a worsening of the convective heat transfer, but the percentages diverge slightly from experimental data.
1. Introduction
Nanofluids have been broadly studied for the last decades, especially concerning their colloidal stability, thermophysical characteristics, flow behaviour, and their efficiency of heat transfer [1]. However, the establishment of appropriate and reliable comparative analyses becomes critical to evaluate these nanodispersions’ improvement compared to the corresponding base fluid. This allows the design of the optimal working fluid for each specific application. Different thermal transfer approaches have been proposed in the literature based on theoretical studies or experimental results. In the case of laminar flow that is fully developed both hydrodynamically and thermally, thermal conductivity is widely understood to be proportional to the coefficient of convective heat transfer [2]. Instead, for turbulent flow, there are numerous correlations depending on the flow characteristics, geometry, or thermophysical properties, the classical Dittus–Boelter correlation [3] being one of the most widely spread and popular.
Figures-of-merit (FOMs) and dimensionless numbers are commonly employed to assess the thermal transfer performance of different nanofluids. Despite the Nusselt number (Nu) allowing the analysis of heat transfer mechanisms by comparing convective to conductive heat transfer, it is inappropriate to compare fluids (or nanofluids) with different thermal conductivities [4]. In fact, the use of Mouromtseff numbers (Mo), first introduced by Mouromtseff in 1942 [5], is widely extended in nanofluids literature since they allow to evaluate the influence of the combined thermophysical profile of the fluid on the convective heat transfer coefficient. Indeed, it is common to evaluate the thermal transfer potential of a nanofluid in terms of its Mo number (Monf) in comparison to the base fluid’s Mo number (Mobf). In this sense, the ratio is identified as a performance index for the relative nanofluid thermal transfer performance.
Several examples of the utilisation of Mo number for the assessment of the potential convective heat transfer capability of nanosized dispersions can be found in the literature. Vajjha and Das [2] analysed how changes in thermophysical properties with temperature and nanoadditive concentration impact the thermal transfer capability of three sets of nanofluids based on aluminum oxide (Al2O3), silicon dioxide (SiO2), and copper oxide (CuO) suspended in ethylene glycol:water mixture 60:40 wt% (EG:W 60:40). They found greater than 1 for all the studied dispersions, indicating superior performance of the nanofluids compared to the EG:W 60:40 base fluid. Vallejo et al. [6] compared the base fluid Mouromtseff numbers to those of the nanofluids obtained by means of the Dittus–Boelter [3] and Pak and Cho [7] equations for functionalized graphene nanoplatelets suspended in an aqueous propylene glycol mixture at 30:70 wt%. They reported improvements of Mo ranging from 16% to 36%, observing that these enhancements increase with the lower temperatures and lower concentration of dispersed nanoadditive.
Despite the number of studies on how variables such as temperature and nanoparticle concentration affect Mo numbers, there is no clarity on the suitability of the Mo criterion for evaluating the nanofluid’s convective heat transfer efficacy. Contradictory results can be found in the available literature. A strong correlation between the experimental heat transfer coefficients and those predicted from the Mouromtseff number ratio was reported by Yu et al. [8], who investigated Therminol 59-based nanofluids containing suspended copper (Cu) nanoparticles of 50–100 nm (mass concentrations of 0.50 wt%, 0.75 wt%, and 2 wt%) under turbulent conditions. Conversely, Cabaleiro et al. [9] presented the Mouromtseff number ratios for nanofluids of quasi-spherical zirconium oxide (ZnO) nanoparticles suspended in an aqueous ethylene glycol mixture at 50 vol% at three nanoparticle concentrations up to 5 wt%. The sample at 1 wt% showed the highest Mo number ratio, indicating that it should exhibit the best thermal performance. However, they found no improvement in the heat transfer coefficient at 1 wt% with regard to the base fluid. Moreover, Elcioglu et al. [10] found differentiated conclusions depending on the flow regime. They compared the ratio to the thermal efficiency of water-based nanofluids with different suspended nanomaterials (Al2O3, TiO2, SiO2, polystyrene, graphene nanoplatelets, and single-wall carbon nanotubes). For laminar flow, results from the Mo ratio totally agree with the experimental thermal efficiencies, whilst for turbulent flow, they did not fully correspond. They concluded that the Mo number criterion is more representative of FOM than the thermal efficiency for flat plate solar collectors.
It is indeed clear that the use of Mo numbers to evaluate nanofluids for heat transfer applications is widespread in the literature. Nevertheless, no further discussions on the causes for the controversy between the analysis based on Mo numbers and based on heat transfer coefficients and Nu numbers can be found.
Several authors have reported better heat transfer performance of common base fluids than the derived nanofluids in turbulent forced convection. Sahoo and Sarkar [11] analysed the pressure drop ratio, h/∆P, and convective heat transfer coefficients of various nanofluids (PCM, Al2O3, CNT, Al2O3+CNT, and Al2O3+PCM) at two concentrations (0.01 and 0.1 vol%) in a shell-and-tube heat exchanger, comparing them to distilled water. At low flow rates, 0.01 vol.% Al2O3, CNT, Al2O3/PCM, and Al2O3/CNT exhibited lower h/∆P values than distilled water, suggesting that the pressure drop increase precedes the coefficient of convective heat transfer. Hao et al. [12] evaluated the effect of various mass loadings (0.002, 0.005, 0.01, and 0.015 wt%) of multiwall carbon nanotubes acetone nanofluids on a flat plate heat pipe thermal performance. It was evidenced that an optimal mass concentration of 0.005 wt% decreased the convective thermal resistance and improved the heat transfer performance, whereas 0.01 and 0.015 wt% multiwall carbon nanotube nanofluids evidenced lower heat transfer performance than the base fluid. Azmi et al. [13] investigated the convective efficiency of SiO2/water nanofluids at several volume concentrations (from 1 to 4 vol%) in a cylindrical tube exposed to a constant heat flux. It was observed that convective heat transfer coefficients increased with volume concentration up to 3 vol% and then decreased in comparison to the water. Pandey et al. [14] analysed Al2O3/water nanodispersions heat transfer characteristics with volume fractions of 2, 3, and 4 vol%) as coolants in counter-flow corrugated plate heat exchangers at various flows. Their findings indicated a decrease in the heat transfer rate with increasing particle concentration above the optimal volume fraction of 2 vol%. Nguyen et al. [15] evaluated the Al2O3/water nanofluids heat transfer performance in a confined and submerged impinging jet on a flat, horizontal, and circular heated surface. They considered three distinct nozzle-heated surface distances (from 2 to 10 mm) as well as various volume concentrations (0, 2.8, and 6%). For the case of 2 mm, nanofluids showed no enhancement in coefficients of convective heat transfer with regard to water. However, at a distance of 5 mm, the 2.8% Al2O3/water nanosized dispersion showed superior thermal performance.
Among the wide variety of nanoadditives, titanium oxide nanoparticles have shown potential thermophysical properties for convective heat transfer applications. Khanlari et al. [16] showed that for TiO2/W nanofluids, heat transfer coefficient enhancements were up to 10% at a nanoparticle mass fraction of 2 wt% for a plate heat exchanger. Ulhakim et al. [17] prepared stable rutile TiO2/EG:W 40:60 at a nanoadditive volume fraction of 3 vol%, obtaining a thermal conductivity improvement of 17%. Zhang et al. [18] explored the stability of nanofluids based on γ-glycidoxypropyltrimethoxysilane (GPTMS)-modified TiO2 nanoparticles dispersed in water, as well as their thermal conductivity. They reported a 53.18 mV zeta potential value and 55.21 nm average particle size for 49 days, with a 20% thermal conductivity enhancement at 2 vol%. Satti et al. [19] obtained a thermal conductivity enhancement of 1% for the 0.5 vol% concentration of TiO2/PG:W 60:40 wt% nanofluid. In a separate investigation, Satti et al. [20] compared the specific heat capacity of five suspensions of metallic oxides in PG:W 60:40 wt%. While reductions were negligible at low concentrations, they became significant at higher concentrations, impacting heat transfer negatively. Leena and Srinivasan [21] found a maximum density increment of 5.8% at 0.8 vol% of TiO2/PG:W 30:70 wt% nanofluids. They also reported improvements of the thermal conductivity, ranging from 7.57–48.84%, at 0.8 vol% and viscosity increases of 2.8%, 5.5%, and 11.5% for 0.1, 0.4, and 0.8 vol% concentrations, respectively. Despite the good perspective for the use of TiO2-based nanofluids, there are no comprehensive studies that critically analyse their heat transfer performance under turbulent forced convection.
In this study, we assess the benefits of using Mo number ratios to predict nanofluids’ convective heat transfer performance by comparing experimental results. Therefore, the ratio obtained from the experimental thermophysical properties is compared with the ratio of the experimental coefficients of convective heat transfer. For this analysis, we designed and characterised novel nanofluids consisting of anatase titanium oxide nanoparticles suspended in an aqueous propylene glycol mixture. Their thermophysical properties and rheological behaviour were also determined experimentally.
2. Materials and Methods
2.1. Materials
Anatase titanium oxide nanopowder (A-TiO2), of average particle size less than 25 nm and a purity of 99.7% based on trace metals, was provided by Sigma-Aldrich (St. Louis, MO, USA) and dispersed in a propylene glycol:water 30:70 vol% mixture (PG:W 30:70). A 99.5% commercial purity propylene glycol was procured from Sigma-Aldrich (St. Louis, MO, USA). Additionally, water was sourced from an Ultramatic GR from Wasser lab (Navarra, Spain) possessing 18.2 MΩ·cm resistivity at the temperature of 298 K. Polyethyleneimine (PEI), 50% (w/v) in water solution, poly(sodium 4-styrenesulfonate) solution (PSS), 30 wt% in water with molecular weight of ~70,000, and cetyltrimethylammonium bromide (CTAB), ≥96.0%, were supplied by Sigma-Aldrich (MO, USA). Polyvinylpyrrolidone (PVP), with a molecular weight of ~40,000 and a K-Value of 28-34, was provided by BioShop (Burlington, ON, Canada). PEI, PSS, CTAB, and PVP were employed as surfactants to improve dispersion stability. Samples were weighed with an accuracy of 1 × 10⁻⁵ g on an analytical balance Sartorius CPA225 (Sartorius AG, Götitingen, Germany). They were then dispersed using a Bandelin Sonoplus HD 2200 ultrasonic homogenizer (Merck KGaA, Berlin, Germany) for 30 min of sonication time.
2.2. Methodology
Several experimental techniques were employed to characterise the nanoparticles, as well as the thermophysical characteristics and the rheological behaviour of the glycol-water mixture and the derived nanodispersions. Based on these experimental data, well-known Figures-of-merit (FOMs) were obtained to analyse the nanofluids’ thermal performance. Additionally, heat transfer tests through an experimental test rig were executed, and the results were compared with those obtained from the Dittus–Boelter and Simons equations.
2.2.1. Characterisation of Nanopowder and Nanofluid Stability
Firstly, Transmission Electron Microscopy (TEM) was employed for the analysis of the morphological nature and the apparent size distribution of the A-TiO2 nanosized particles on a JEOL JEM 1010 microscope (JEOL Ltd., Tokyo, Japan) operating at an accelerator voltage of 100 kV. For these measurements, a dispersion of A-TiO2 in analytical grade 1-butanol was elaborated and subsequently deposited onto a 400-mesh copper grid, which was coated with a Formvar film and a conductive carbon layer.
X-ray diffraction (XRD) tests were conducted to study the phase and purity of titania nanoparticles using a Malvern diffractometer, model XPERT-PRO (Malvern Panalytical Ltd., Malvern, UK), that operates at a current of 30 mA and 40 kV voltage and employs Cu Kα monochromatic radiation (λ = 1.5406 Å). Scherrer equation [22] was used to determine the crystalline domain size, D, of A-TiO2:
where λ represents the X-ray wavelength, K represents the Scherrer constant––commonly taken to be 0.9 in the case of spherical crystals, β denotes the diffraction peak width measured at half its maximum height, and θ indicates the specific peak diffraction angle.
The stability of the A-TiO2/PG:W 30:70 nanofluids was examined using the Dynamic Light Scattering (DLS) method with a Malvern Zetasizer Nano ZS (Malvern Panalytical Ltd., Malvern, UK) at a 173° scattering angle. Specimens containing various surfactants at several surfactant-to-nanoadditive mass ratios were stored in standard cuvettes for 25 days to observe changes in their size distribution over time under both static and shaken conditions. The results were used to determine the ideal surfactant and the optimal mass ratio of surfactant to nanoadditive.
2.2.2. Thermophysical and Rheological Properties
Thermal conductivities () of PG:W 30:70 and proposed nanofluids over the temperature range of 283 to 333 K were obtained by means of a Decagon Devices KD2 Pro thermal analyzer (Decagon Devices, Inc., Pullman, WA, USA) based on the transient hot wire (THW) technique with a KS-1 probe and uncertainty (k = 2) of 5%. The Polyscience 9510 thermostatic bath (Polyscience, Niles, IL, USA) was employed to ensure the temperature stability of the samples in the course of the measurements. Rheological characterisations of the analysed nanofluids and base fluid were conducted using an Anton Paar rheometer, model Physica MCR 101 (Anton Paar GmbH, Graz, Austria), featuring a CP50-1 cone-plate geometry (50 mm plate diameter and 1° cone angle) along with a Peltier plate system. A consistent 102 μm gap between the Peltier and the CP50-1 was kept throughout the experiments. Initially, non-linear viscoelastic tests at 283 K were executed to evaluate the dependency of shear viscosity (η) on shear rate () over a range from 10 to 1000 s−1. Afterward, the dynamic viscosity of all proposed samples was inferred from shear rate tests at a constant of 100 s−1 at various temperatures from 283 to 323 K with an increment of 10 K. An uncertainty (k = 2) estimation of 5% was selected for viscosity values. Density (ρ) measurements from 288 to 313 K were carried out using the oscillating U-tube method with an Anton Paar density meter DMA 501 (Graz, Austria), achieving 0.1% uncertainty (k = 2). Lastly, isobaric heat capacities () for the base fluid and proposed nanofluids were determined using a TA Instruments Q2000 heat-flux differential scanning calorimeter (TA Instruments, New Castle, DE, USA) equipped with a RSC90 cooling system. The analysis was conducted using the quasi-isothermal temperature-modulated differential scanning calorimetry method (TMDSC). Samples were enclosed in Tzero aluminum pans, which are hermetically sealed, and tests were performed up to 333 K. The uncertainty (k = 2) is estimated to be 3%.
2.2.3. Figures-of-Merit Determination
As previously commented, Mouromtseff number (Mo), introduced in 1942 by Mouromtseff [5], is considered as a Figure-of-merit for discussing the heat transfer fluids thermal performance and can be estimated using the following expression:
in which constants a, b, c, and d vary based on the mode of heat transfer (natural or forced convection), the flow regime (laminar or turbulent), and boundary conditions (constant heat flux or constant wall temperature). For all the heat transfer modes, the impact of thermal conductivity on Mo is more significant than that of the viscosity; therefore, b > d [10,23].
The Mo ratio for nanofluids and base fluid () is used to assess the overall performance of the proposed nanodispersion against its base fluid in terms of convective heat transfer and is equivalent to the ratio of nanofluid coefficients of convective heat transfer to that of the base fluid () at constant velocity and heat flux [4]. For hydrodynamically and thermally fully developed laminar flow, Simons [24] stated that the coefficient of heat transfer is only affected by thermal conductivity. Therefore, in such conditions, the Mo ratio can be considered as the nanofluid-base fluid thermal conductivity ratio (). In the scenario of fully developed internal turbulent flow within a pipe, the values reported in the literature for the constants a, b, c, and d in Equation (2) differ across various authors in the literature. Applying the exponents procured from the Dittus–Boelter equation [3] for heating and cooling under turbulent flow conditions, the Mo ratio is defined as follows.
Simons [24] also used the concept of the Mouromtseff number to show the effectiveness of various refrigerants, and the resultant Mo ratio can be obtained through the following expression.
Equations (3)–(5) are utilised to compare the proposed nanofluids with the base fluid at the temperatures defined in the previous section. The experimentally measured thermophysical properties of both the base fluid and the nanofluids are employed to calculate the different Mo ratios.
2.2.4. Experimental Heat Transfer Analysis
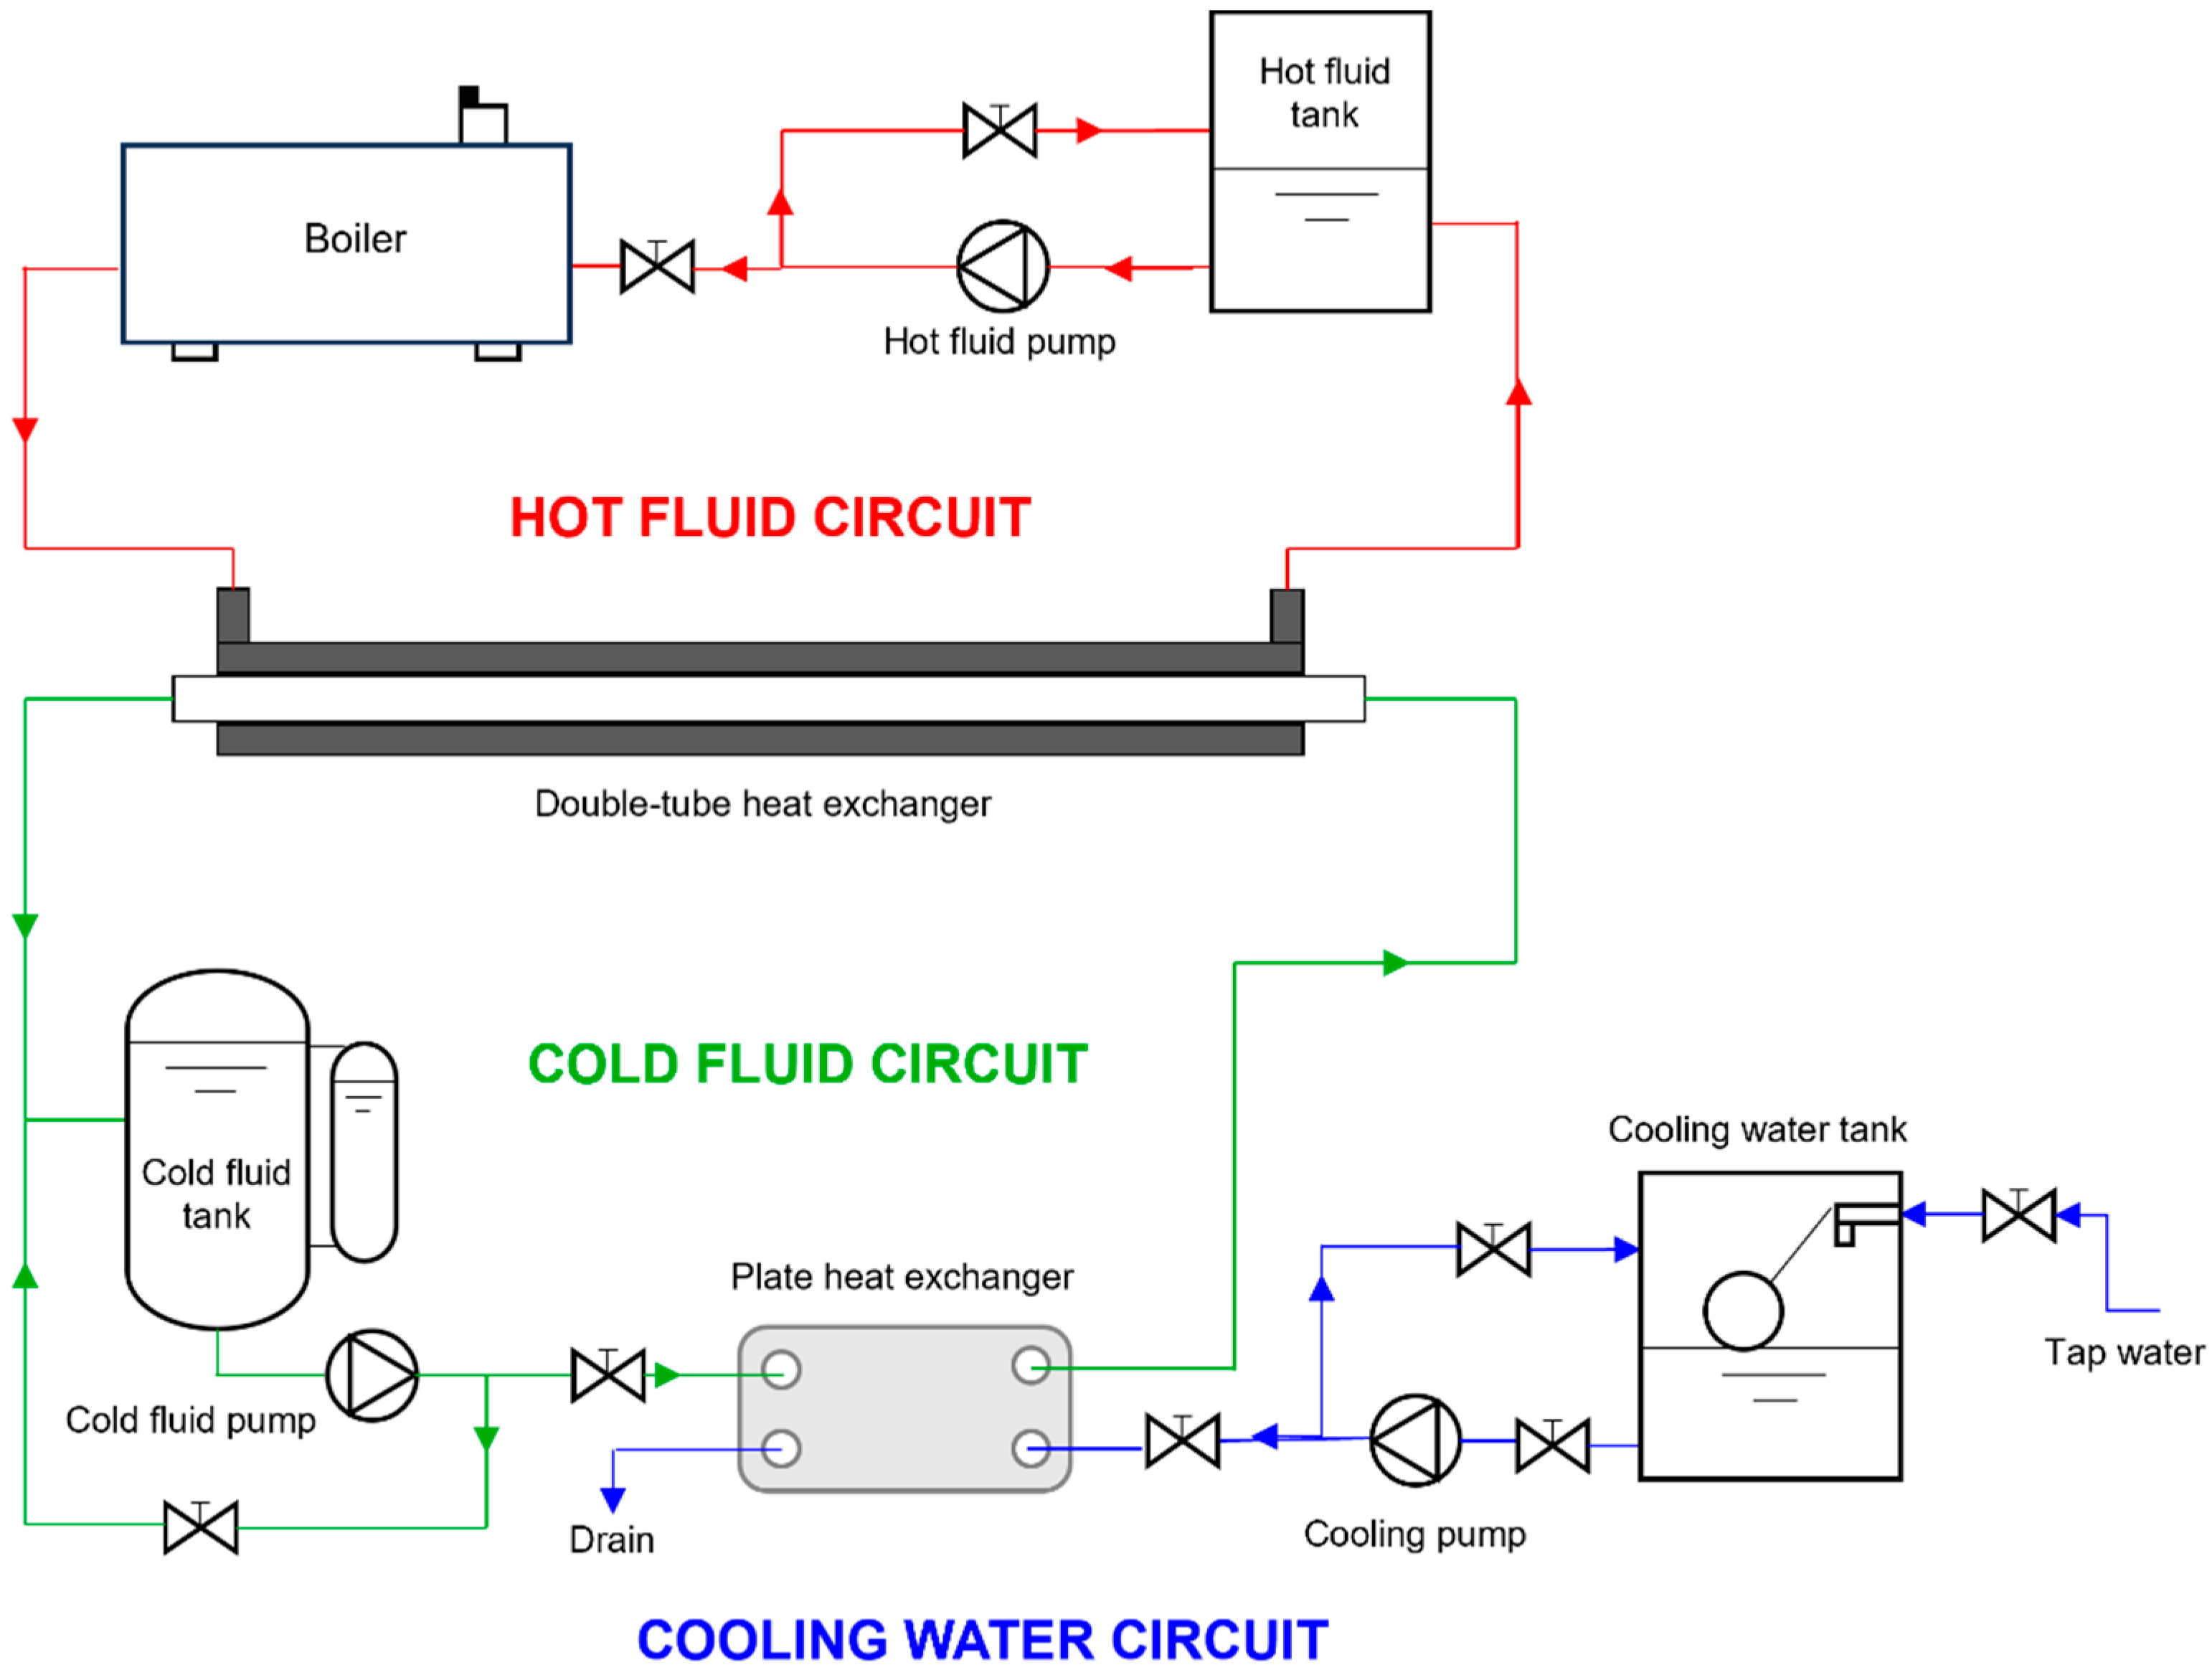
Figure 1 illustrates the layout of the experimental facility where the nanofluids’ heat transfer performance of convection was experimentally determined. A detailed description of the experimental facility is reported in previous works [25]. Tests were conducted at three cold fluid average temperatures (base fluid or nanofluid), cf, specifically 298, 308, and 318 K. The temperature of the hot fluid (water), hf, was kept 15 K higher than these values. The cold fluid flow rate was adjusted between 0.3 and 0.7 m3·h−1, in increments of 0.1 m3·h−1, while the flow rate of the hot fluid remained constant at 0.7 m3·h−1 for all experiments. The following hypotheses were considered for the experimental heat transfer coefficients determination: steady-state conditions; no heat losses to the surroundings; unidirectional flow through the heat exchanger with the fluids velocity perpendicular to the cross-section; constant and uniform thermophysical properties throughout the heat exchanger; and the thermal resistances associated with fouling being ignored.
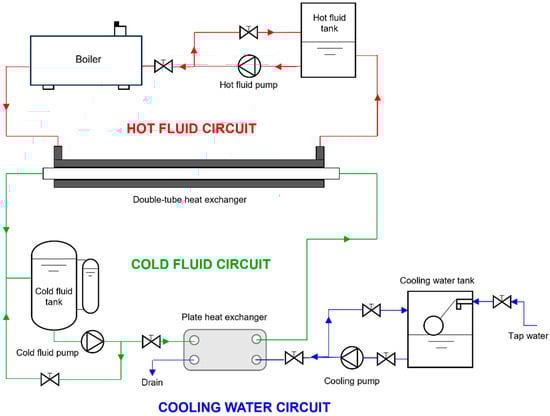
Figure 1.
Diagram of the experimental test rig utilised for obtaining the convective heat transfer coefficients.
Convective heat transfer coefficients (h) were determined for the base fluid and three of the analysed nanofluids (0.25, 1.0, and 2.0 wt%) by means of the thermal resistances method, which accounts for the heat transferred from the hot fluid to the steel wall by convection, the heat conduction through the steel wall, and the transferred heat from the wall to the cold fluid by convection,
where and are the internal and outer diameters of the inside pipe within the double-tube heat exchanger, respectively, represents the heat exchange effective length, and denotes the thermal conductivity of the steel. The overall thermal resistance, , is equal to the sum of the three abovementioned thermal resistances, which can also be obtained as:
where is the heat exchanger logarithmic mean temperature difference and is the exchanged heat flux [26]. The hot fluid coefficients of convective heat transfer through the annular section, were calculated by means of Gnielinski correlations applicable to fully developed turbulent flow in annular ducts [27]:
with
where is the friction factor for annular pipes, is the Reynolds number of the hot fluid, is the Prandtl number of the hot fluid, is the annular section hydraulic diameter, , is the boundary condition factor, , and is the internal diameter of the outside pipe of the double-tube heat exchanger.
3. Results
3.1. Nanopowder Characterisation
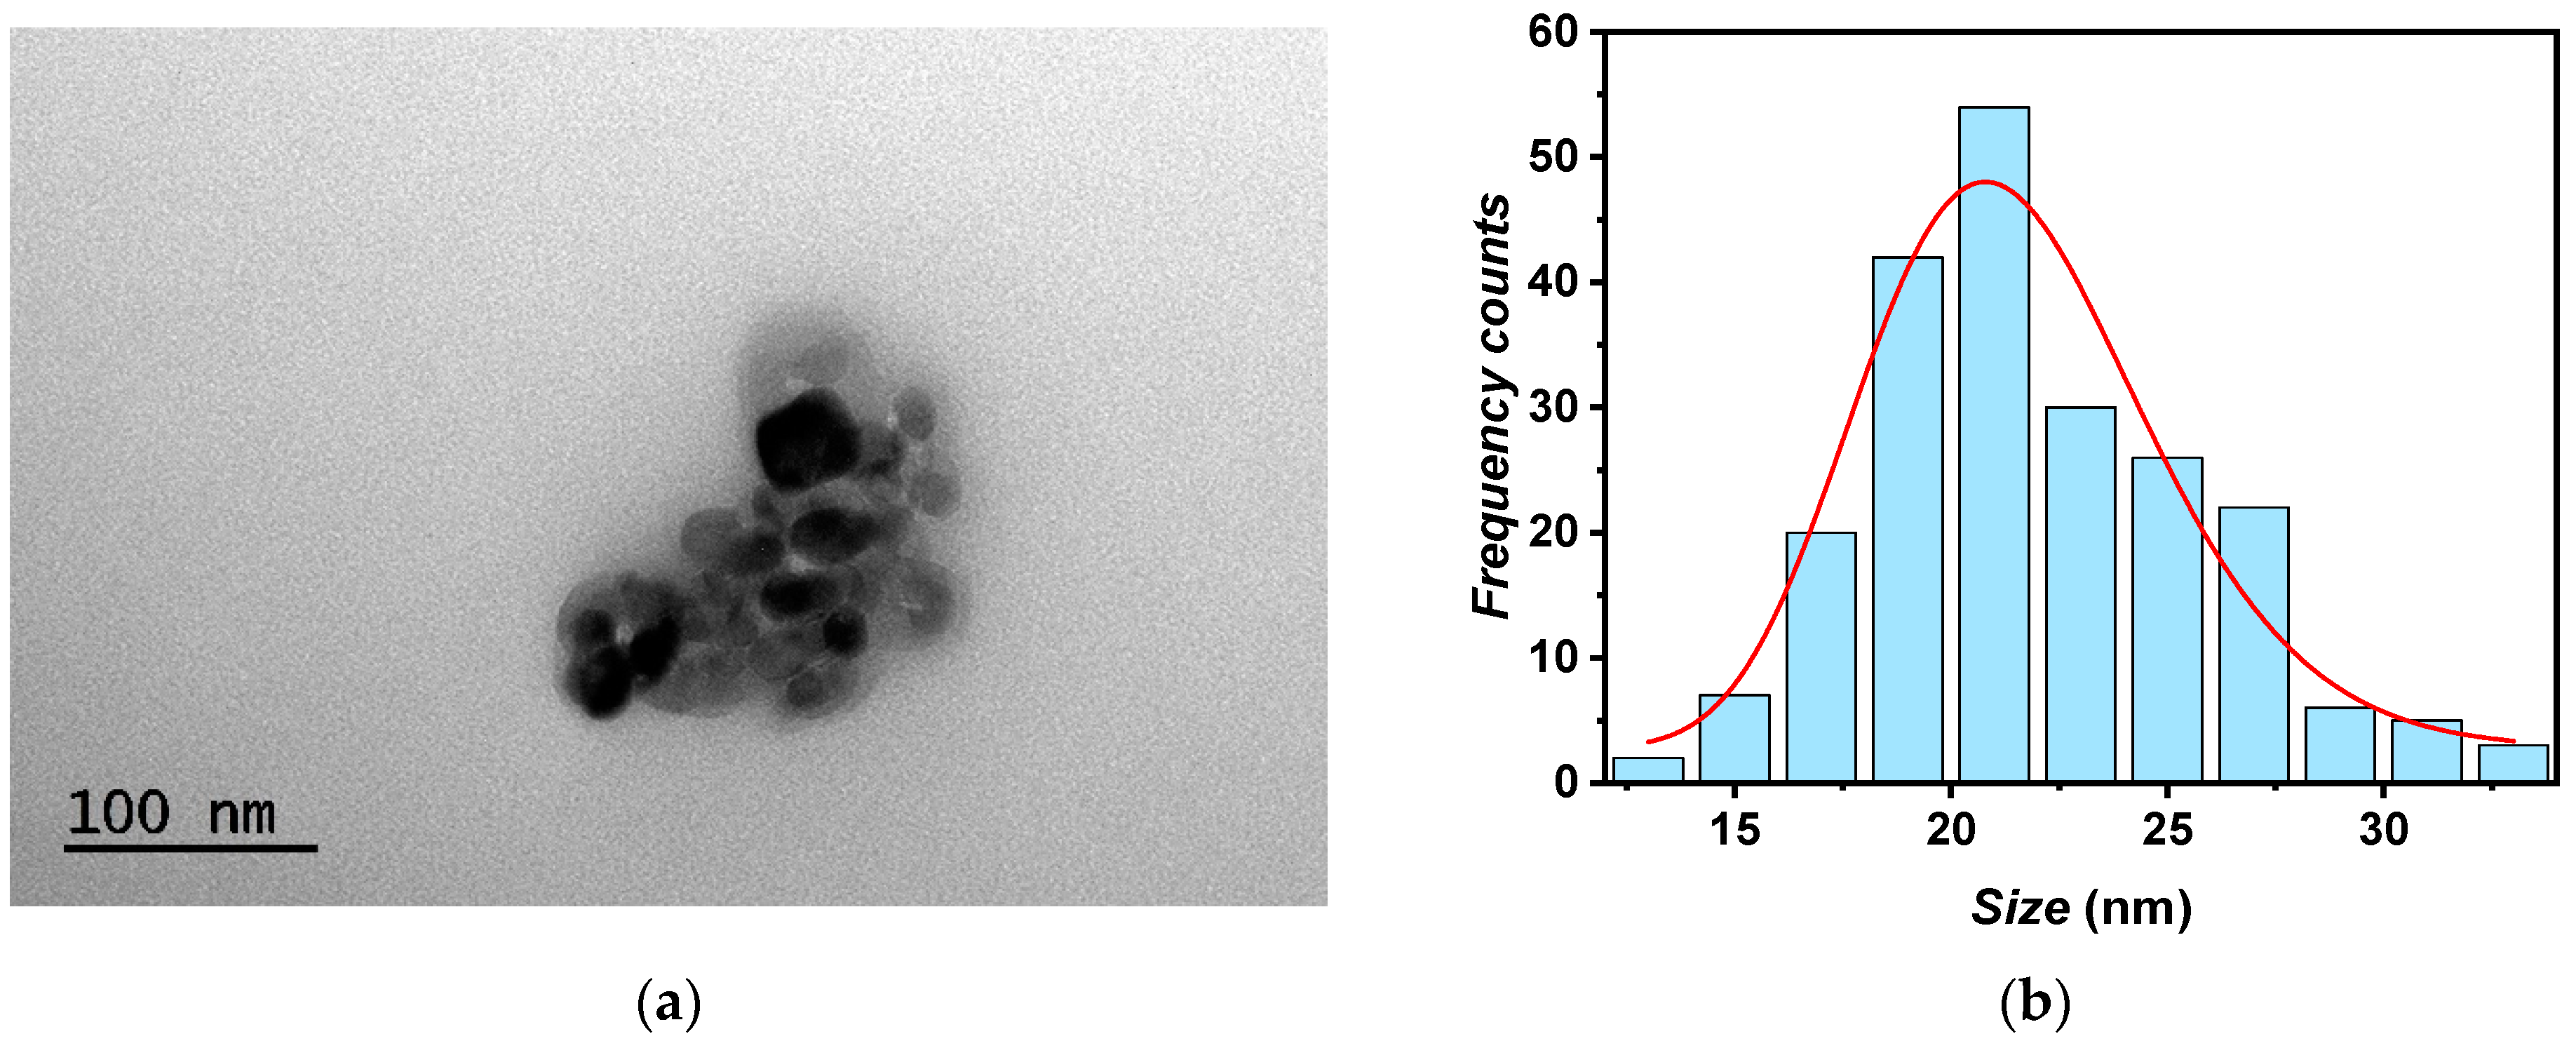
The morphological nature of the A-TiO2 nanoparticles was examined using TEM, which revealed a pseudo-spherical structure of the nanoparticles, as shown in Figure 2. The sizes of over 200 nanosized particles were measured using TEM images, revealing a 21*/2 nm mean particle size, according to the manufacturer (<25 nm). Additionally, assuming a log-normal function [28], a polydispersity index of 0.16 was assessed.

Figure 2.
(a) TEM image of A-TiO2 nanopowder and (b) size distribution of A-TiO2 nanoparticles.
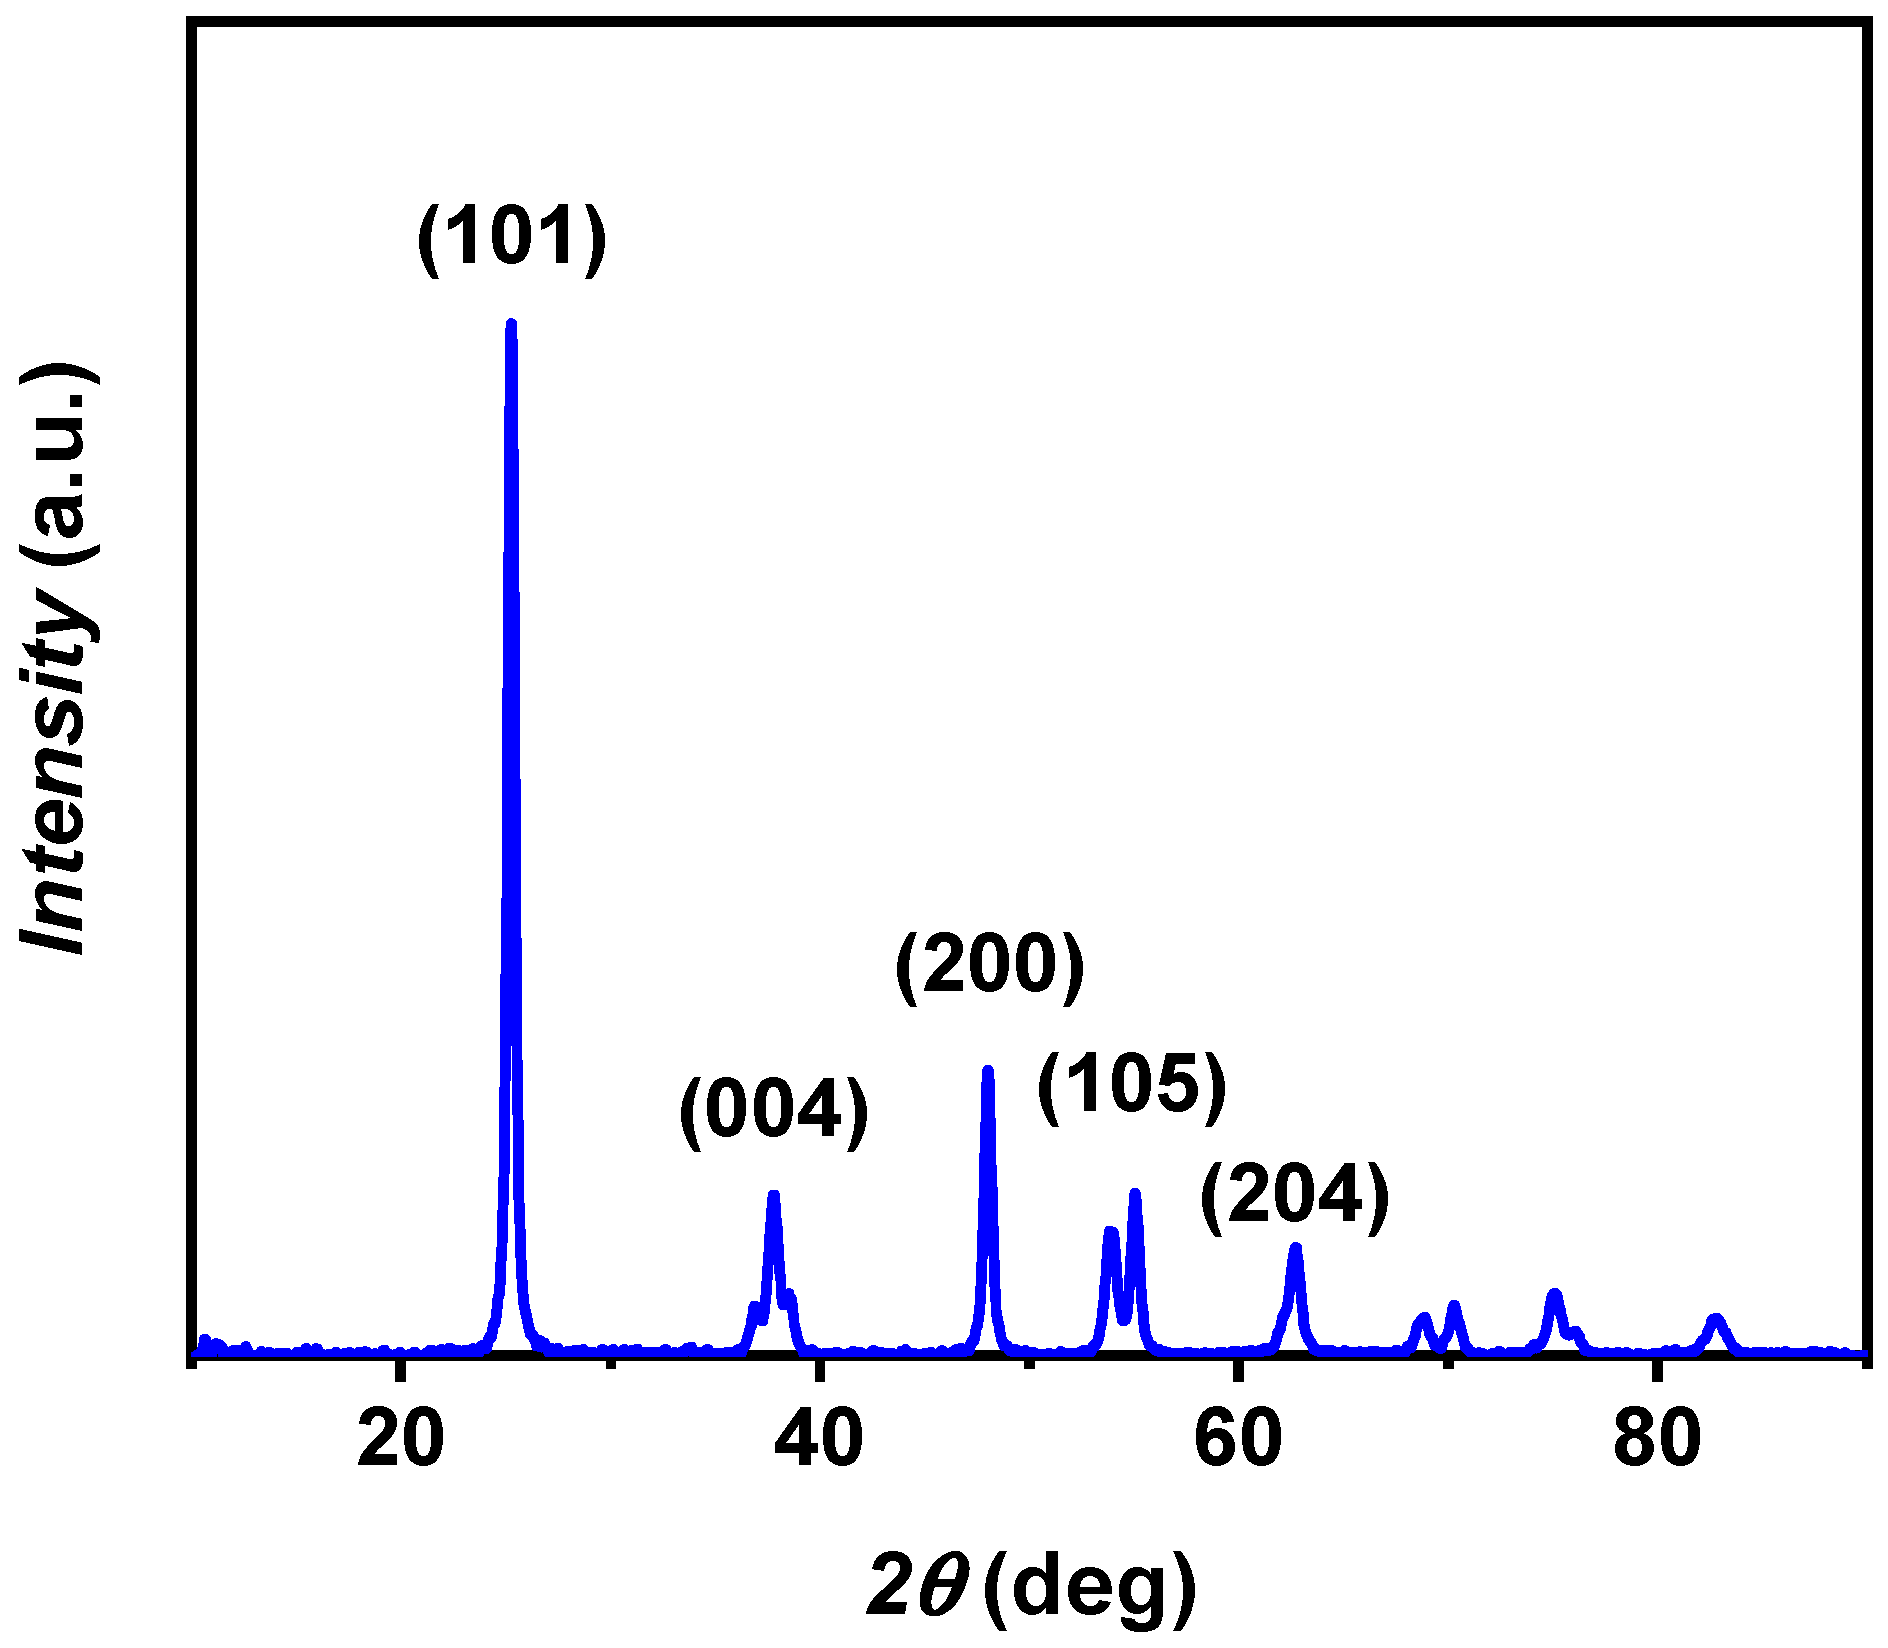
The crystalline characteristics of the nanosized particles were determined through the XRD technique, and the obtained XRD pattern is depicted in Figure 3. The experimental pattern corresponds with JCPDS card no. 21-1272 for anatase TiO2 [29] displaying diffraction peaks at 2θ values of 25.3°, 37.8°, 48.0°, 55.0°, and 62.8°, corresponding to (101), (004), (200), (105), and (204) planes, respectively. The 24.5 nm crystalline domain size was calculated from the (101) reflection, which represents the most prominent peak in the XRD pattern, using Equation (1).
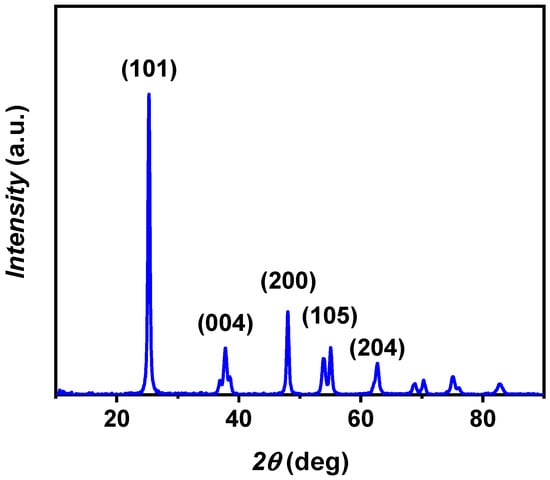
Figure 3.
XRD pattern of A-TiO2 nanopowder, with the most representative crystalline planes for the identified space group I4l/amd.
The pseudo-spherical shape and particle size observed through TEM align with the findings of other studies from the literature [17,18], which reported good prospects in terms of thermophysical properties’ improvements for using TiO2 nanoparticles in nanofluids design.
3.2. Nanofluid Stability
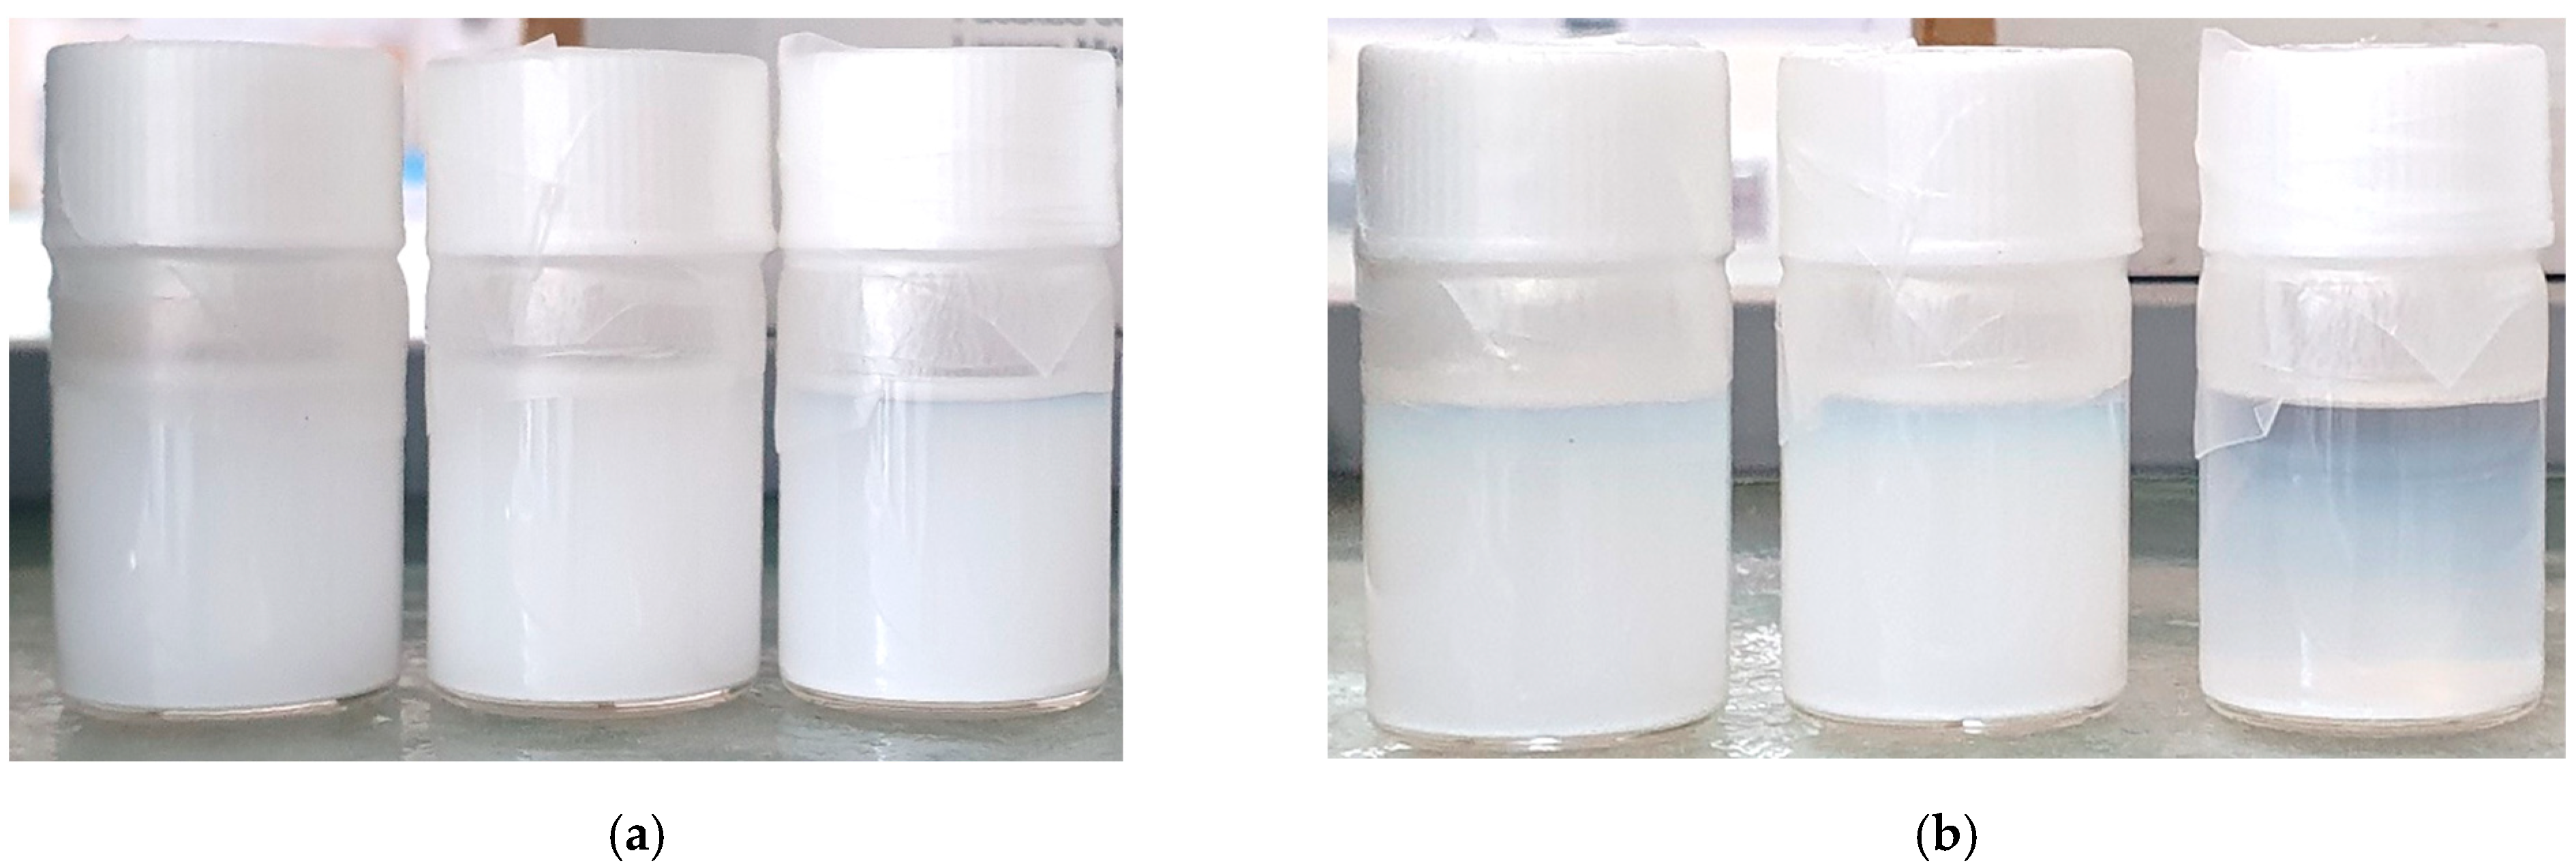
Despite the good prospects of TiO2-based nanofluids reported in the literature to enhance the thermal properties of the base fluid, these nanoparticles tend to agglomerate probably due to their strong van der Waals and gravity [30]. Thus, the effect of one anionic surfactant (PSS), two cationic surfactants (PEI, CTAB), and one non-ionic surfactant (PVP) on the stability of a 0.50 wt% A-TiO2/PG:W 30:70 nanofluid at a 1:2 surfactant-to-nanoadditive mass ratio was observed. The nanoadditives with PVP in the 0.50 wt% A-TiO2/PG:W 30:70 nanofluid precipitated almost immediately after preparation, leading to the exclusion of this surfactant for the proposed nanofluids. The remaining nanosized dispersions stabilized with PEI, PSS, and CTAB were observed over 7 days under static conditions. Figure 4 represents the three different nanofluids just after preparation and after the 7-day observation period. It was noted that the nanoadditives with CTAB in the 0.50 wt% A-TiO2/PG:W 30:70 nanofluid precipitated during the observation period, while the PEI and PSS surfactants maintained the particles in suspension.
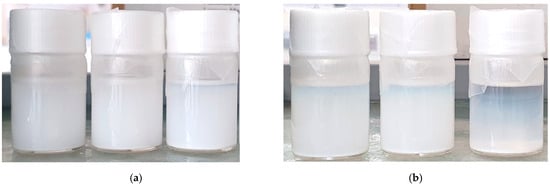
Figure 4.
From left to right, A-TiO2/PG: W 30:70 + PEI, A-TiO2/PG:W 30:70 + PSS, and A-TiO2/PG:W 30:70 + CTAB nanofluids (a) just after preparation and (b) in static conditions over 7 days.
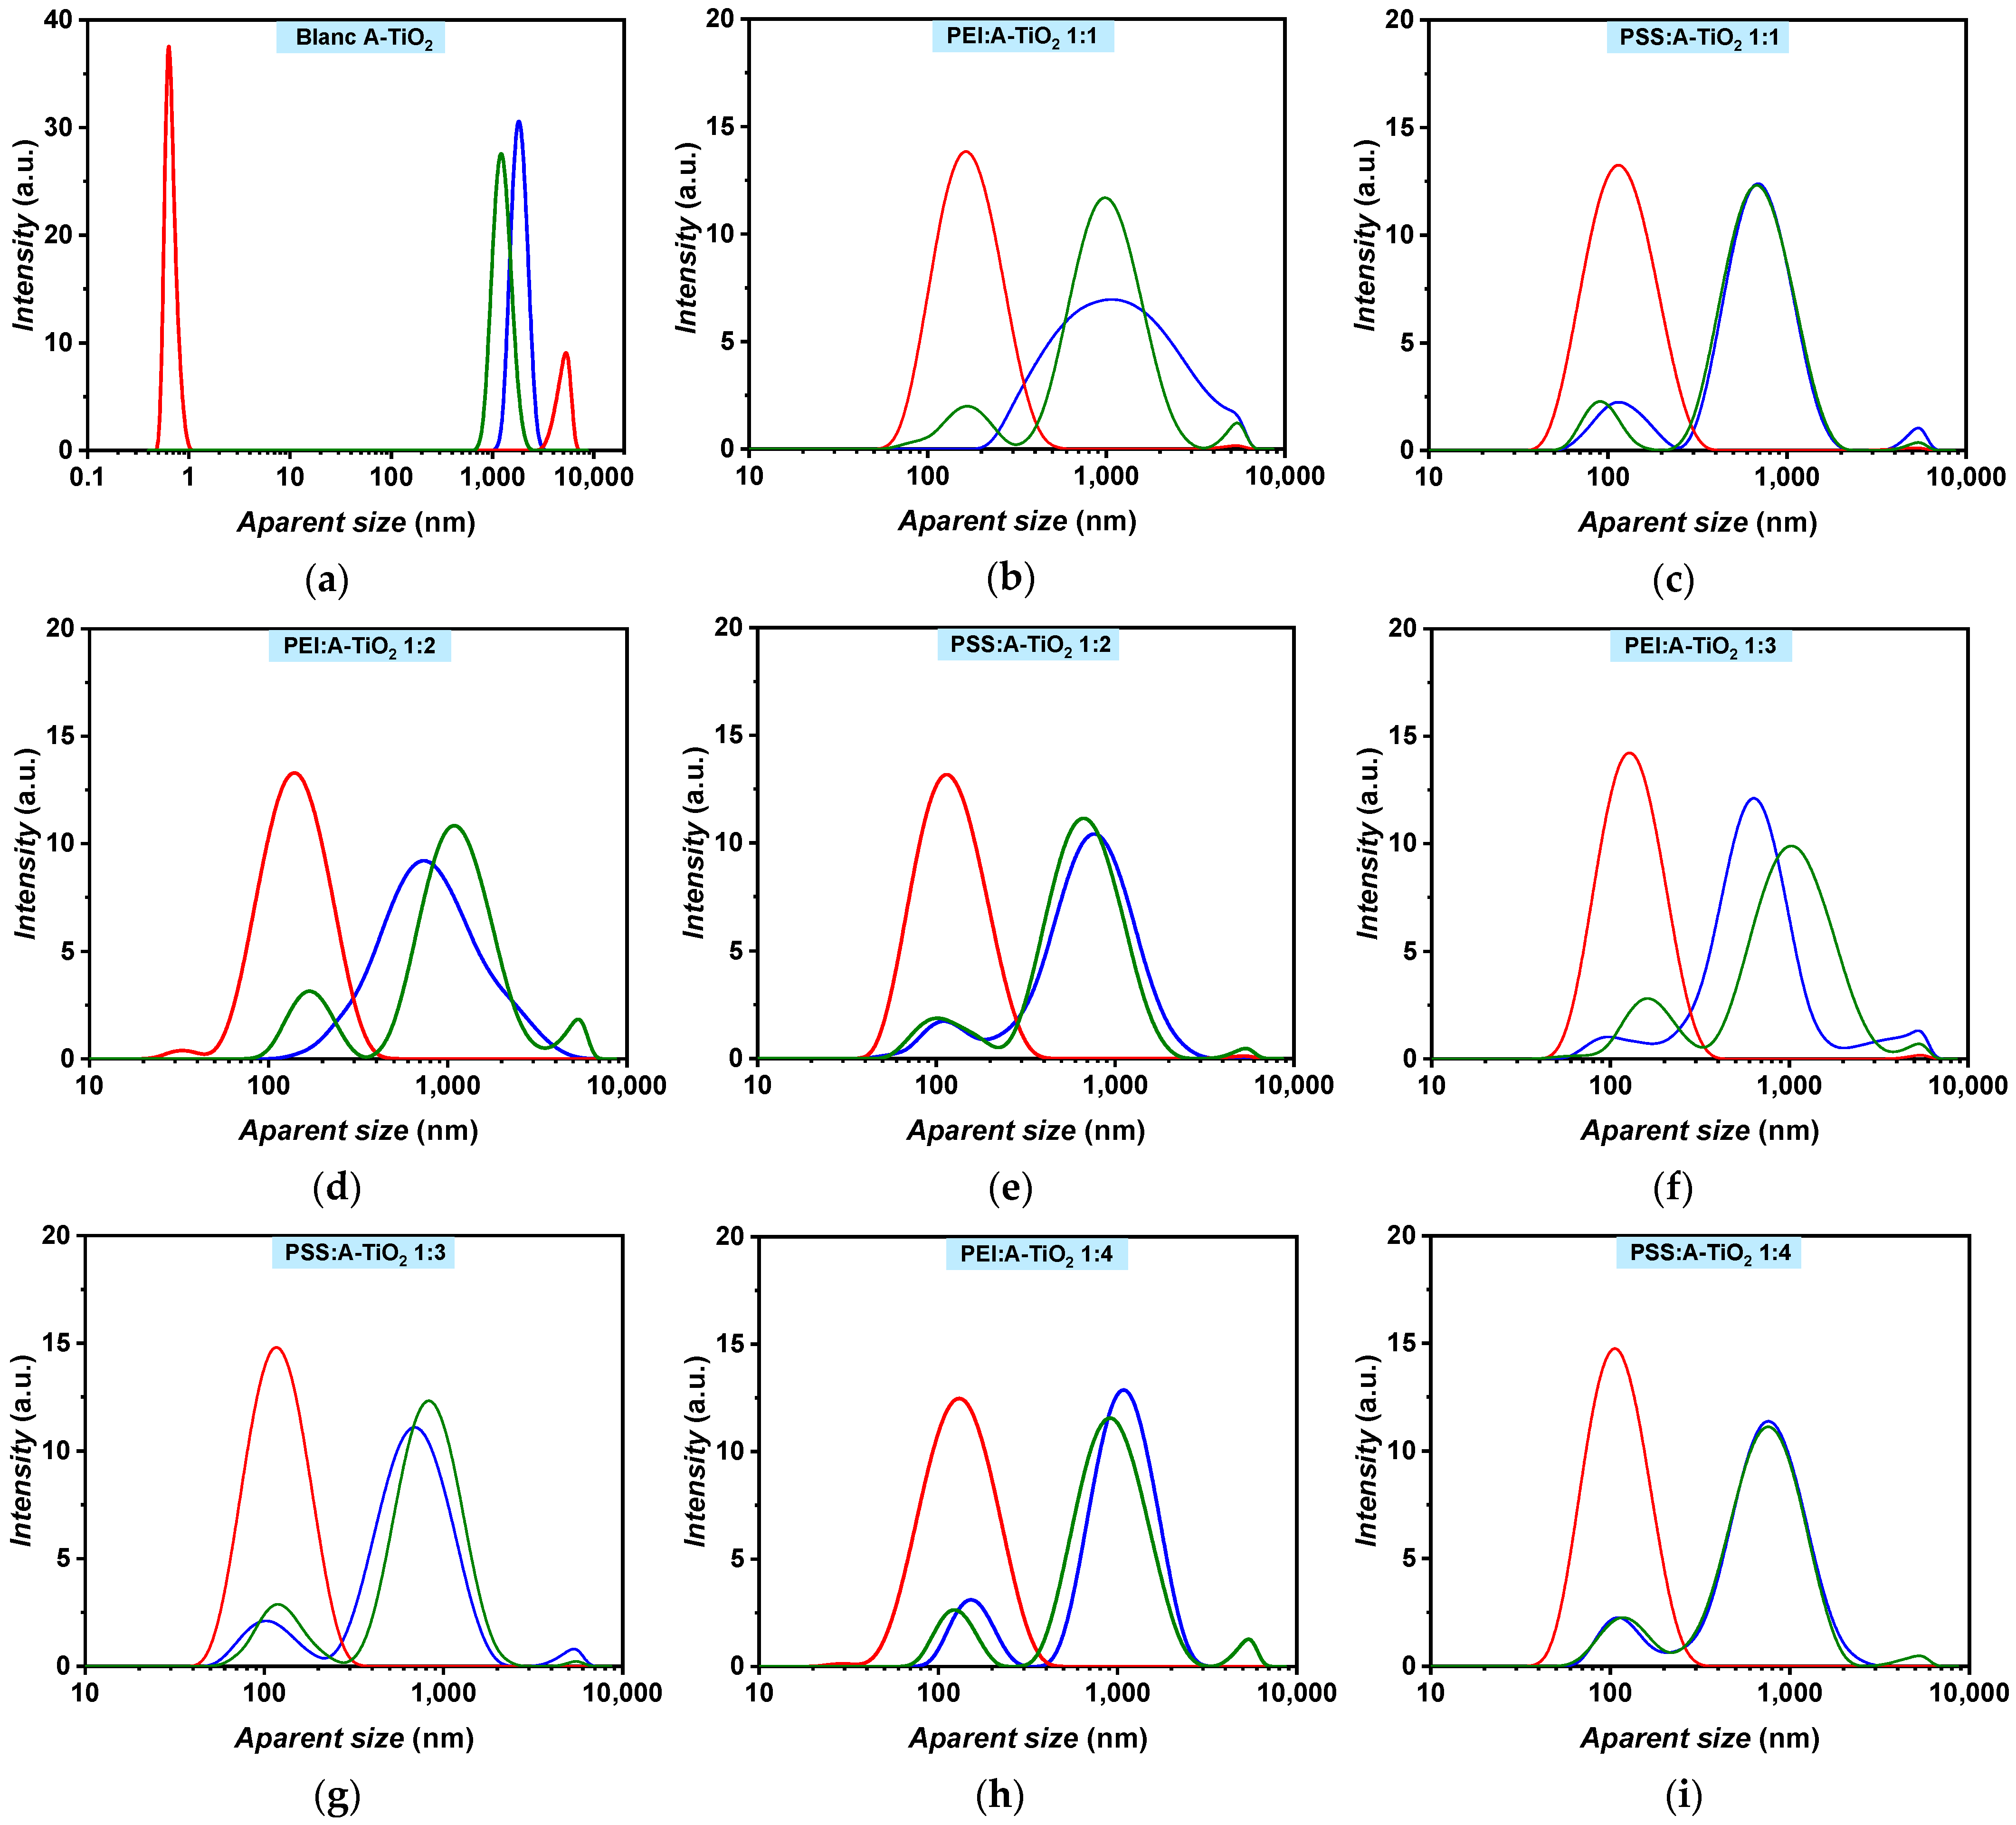
Thus, the stability of A-TiO2/PG:W 30:70 + PEI and A-TiO2/PG:W 30:70 + PSS nanofluids was evaluated by analysing the changes in their apparent size distribution through DLS during 25 days under both static and shaken conditions for different surfactant–nanoadditive mass ratios namely 1:1, 1:2, 1:3, and 1:4, as depicted in Figure 5. A-TiO2/PG:W 30:70 nanofluids without surfactant were monodisperse (one single narrow peak) after the preparation (Figure 5a). In contrast, the addition of surfactants caused the samples to become polydisperse, evolving to bimodal and trimodal distributions after preparation, except for the PEI:nanoadditive mass ratios of 1:1 and 1:2 (Figure 5b,d). A shift in the main peak from ~1860 nm to smaller apparent sizes (between ~1024 and ~633 nm for PEI and between ~771 and ~689 nm for PSS) was also observed (Figure 5b–i), which may indicate a reduction in the agglomeration of the A-TiO2 nanoparticles. After 25 days, the sample without surfactant decreased in apparent size and showed a bimodal distribution with one narrow peak around ~0.6 nm and another peak around ~5400 nm in static conditions, which indicates complete sedimentation of the nanopowder. Likewise, the samples with PEI and PSS revealed lower apparent sizes in static conditions but only up to ~140 nm and ~120 nm, respectively. All A-TiO2/PG:W 30:70 + PEI nanofluids at the analysed surfactant–nanoadditive mass ratios evolved to trimodal distributions in shaken conditions (Figure 5b,d,f,h), whereas A-TiO2/PG:W 30:70 + PSS nanofluids showed bimodal and trimodal distributions after 25 days. These results suggest that the addition of PSS provides a more consistent distribution of the nanoparticles suspended in the base fluid compared to PEI and would indirectly provide information about the potential positive charge of the nanoparticle surfaces. Likewise, it is important to note that surface charge densities depend on both the particle size and the pH value, as stated by Holmberg et al. [31] for TiO2 nanoparticles, who report that determining size-dependent surface charging is challenging.
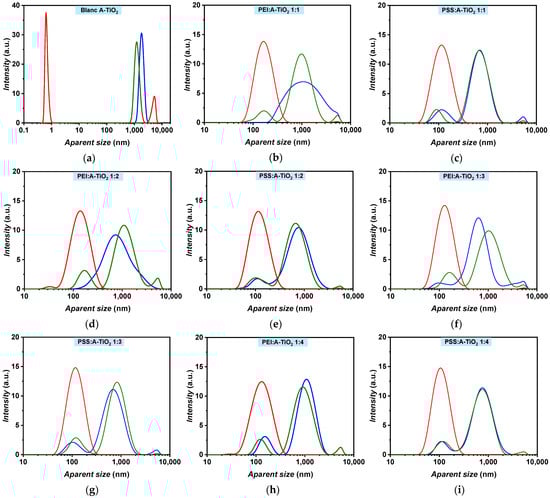
Figure 5.
A-TiO2/PG:W 30:70 nanofluids apparent size distribution in terms of intensity containing no surfactant (a), PEI (b,d,f,h), and PSS (c,g,e,i) with surfactant to nanoadditive mass ratios of 1:1 (b,c), 1:2 (d,e), 1:3 (f,g), and 1:4 (h,i). Measurements are shown for the 1st (blue) and 25th day under static (red) and shaken (green) conditions.
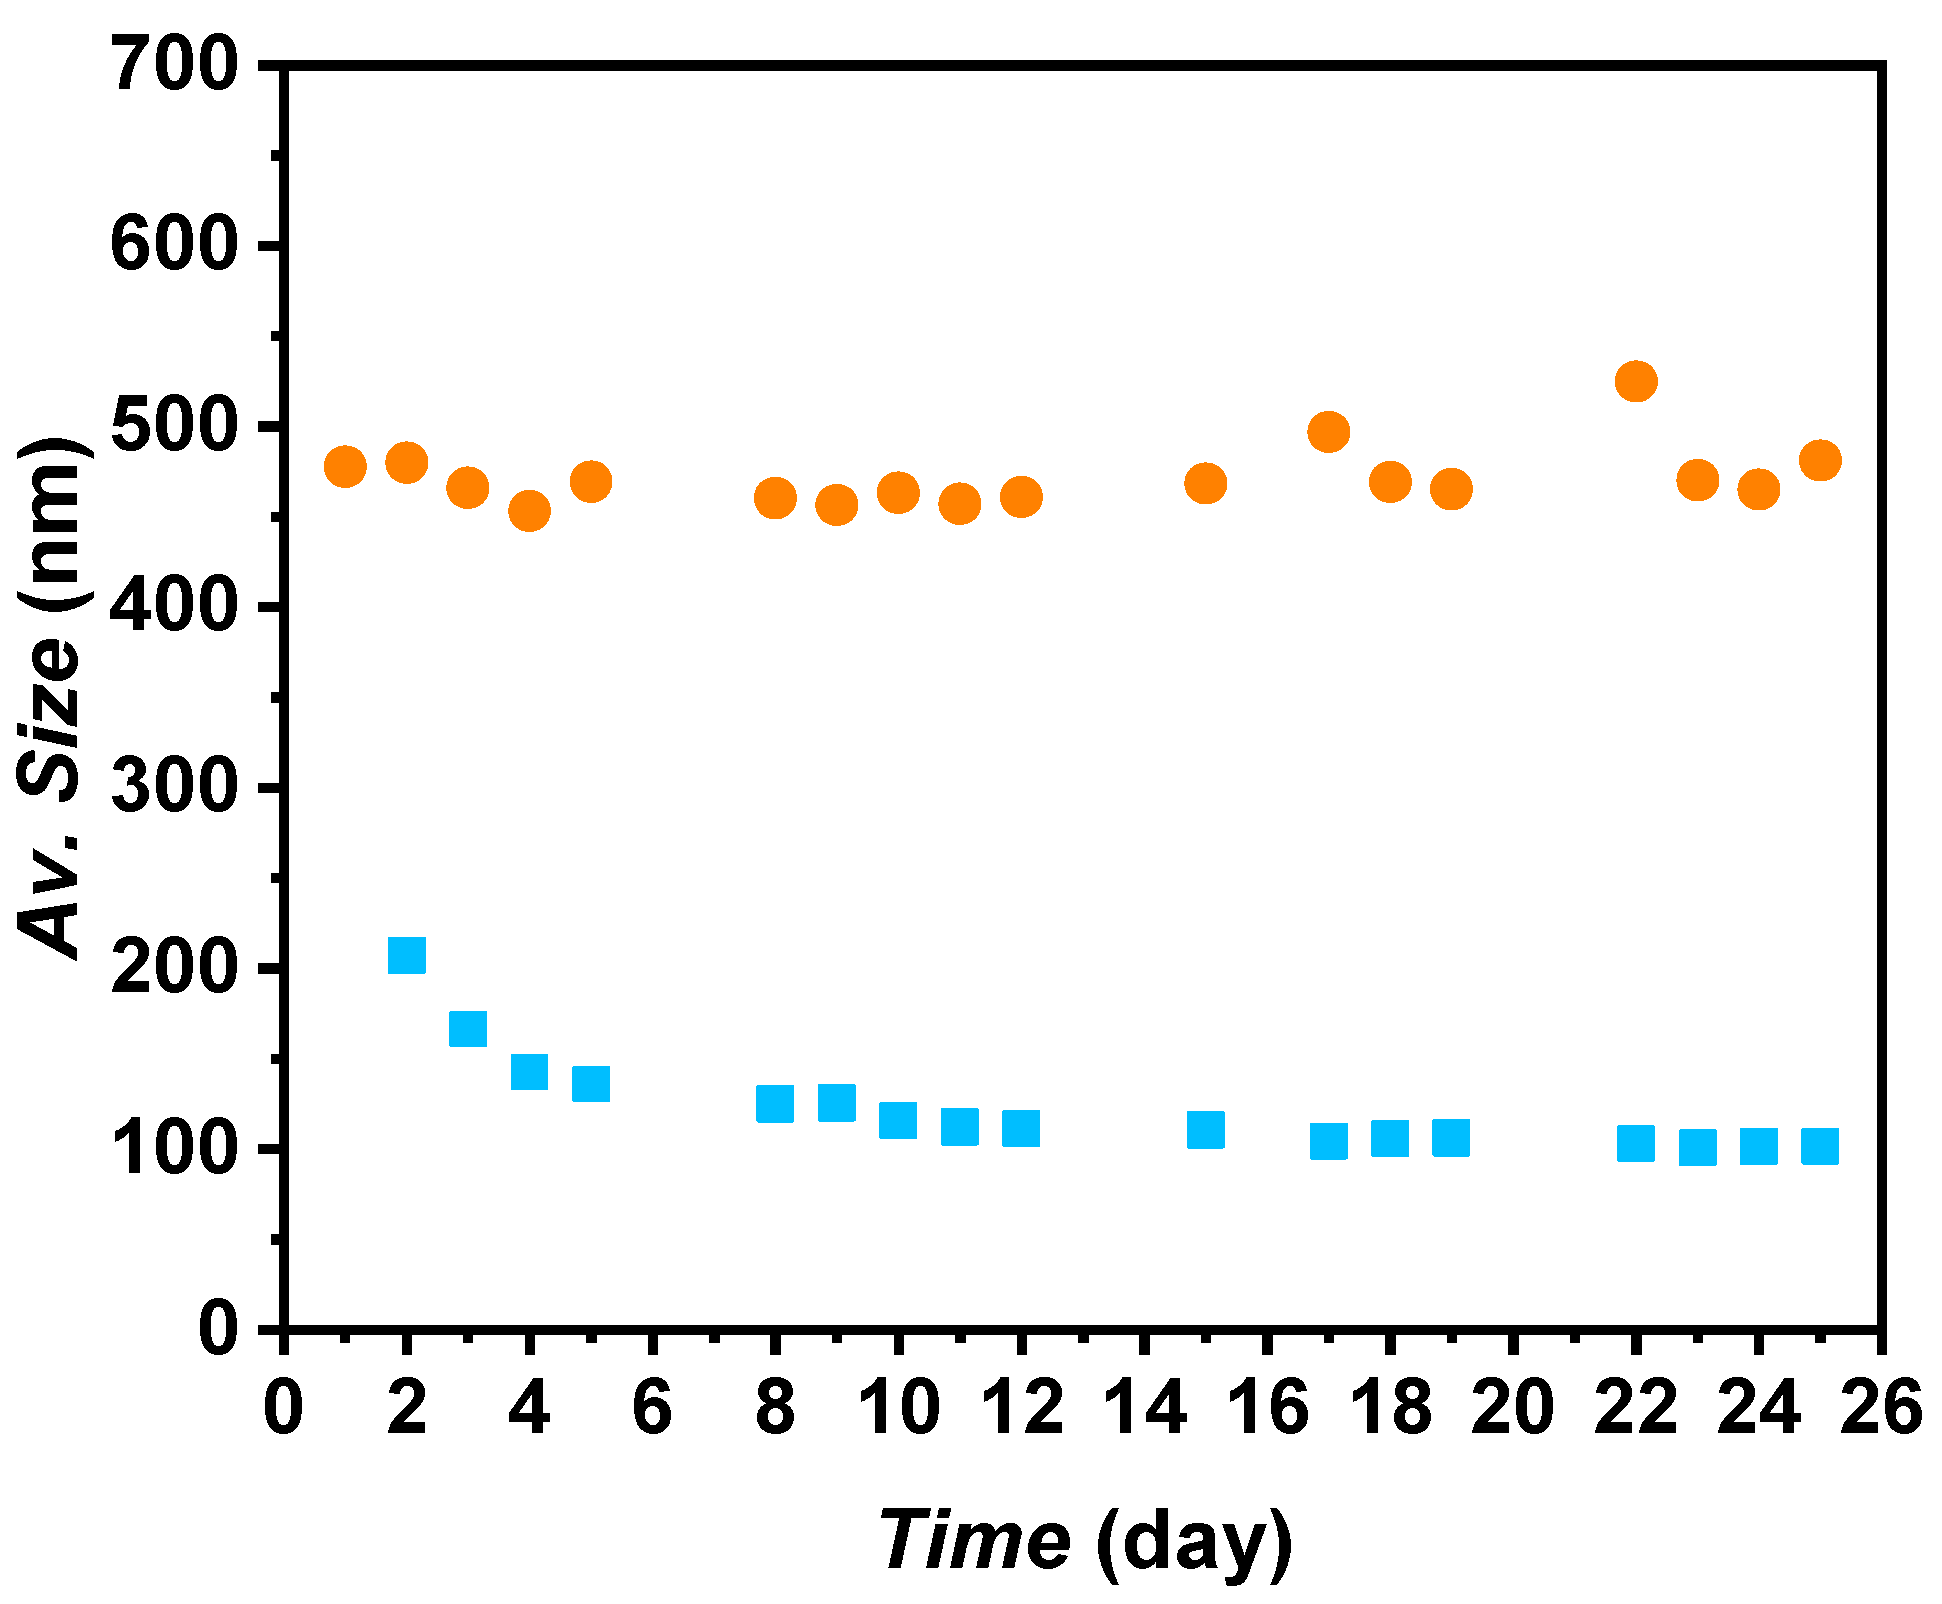
It was observed that the main peak of the PSS 1:3 mass ratio evolved to higher apparent sizes under shaken conditions after 25 days, suggesting agglomeration of the nanoparticles. Consequently, this mass ratio was disregarded. Regarding PSS 1:2 under shaken conditions, a 12% decrease in the apparent size of the main peak was observed after 25 days compared to the first day. In contrast, PSS 1:1 and PSS 1:4 maintained the same apparent size of ~689 and ~771 nm, respectively, after 25 days in shaken conditions. Although PSS 1:2 showed the smallest apparent sizes for the A-TiO2/PG:W 30:70 nanofluid, the decrease was not significant enough to make a substantial difference. Since PSS 1:4 maintained the same distribution under shaken conditions after 25 days, then after preparation, and to minimize the quantity of surfactant, this surfactant–nanoadditive mass ratio was selected. Using the proposed nanofluids in real thermal transfer applications in turbulent conditions, the formation of foam derived from the addition of surfactant can be prevented or reduced. The average size evolution of A-TiO2/PG:W 30:70 + PSS 1:4 nanofluid over time is depicted in Figure 6. A constant average size of ~471 nm was obtained in shaken conditions over 25 days, with average deviations under 2.5%. Regarding the sample in static conditions, a higher decrease from the first to the third day can be noted (from 207.2 to 125.6 nm); afterward, the nanofluid maintained an average size of ~107 nm, with average deviations under 4%.
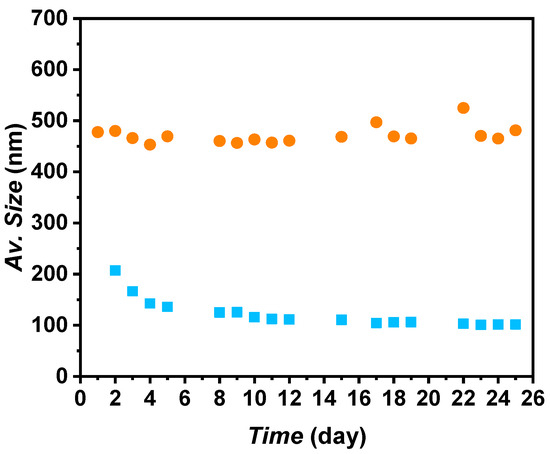
Figure 6.
Average size evolution of A-TiO2/PG:W 30:70 + PSS nanofluids at a 1:4 surfactant–nanoadditive mass ratio under (■) static and (●) shaken conditions.
3.3. Thermophysical and Rheological Profiles
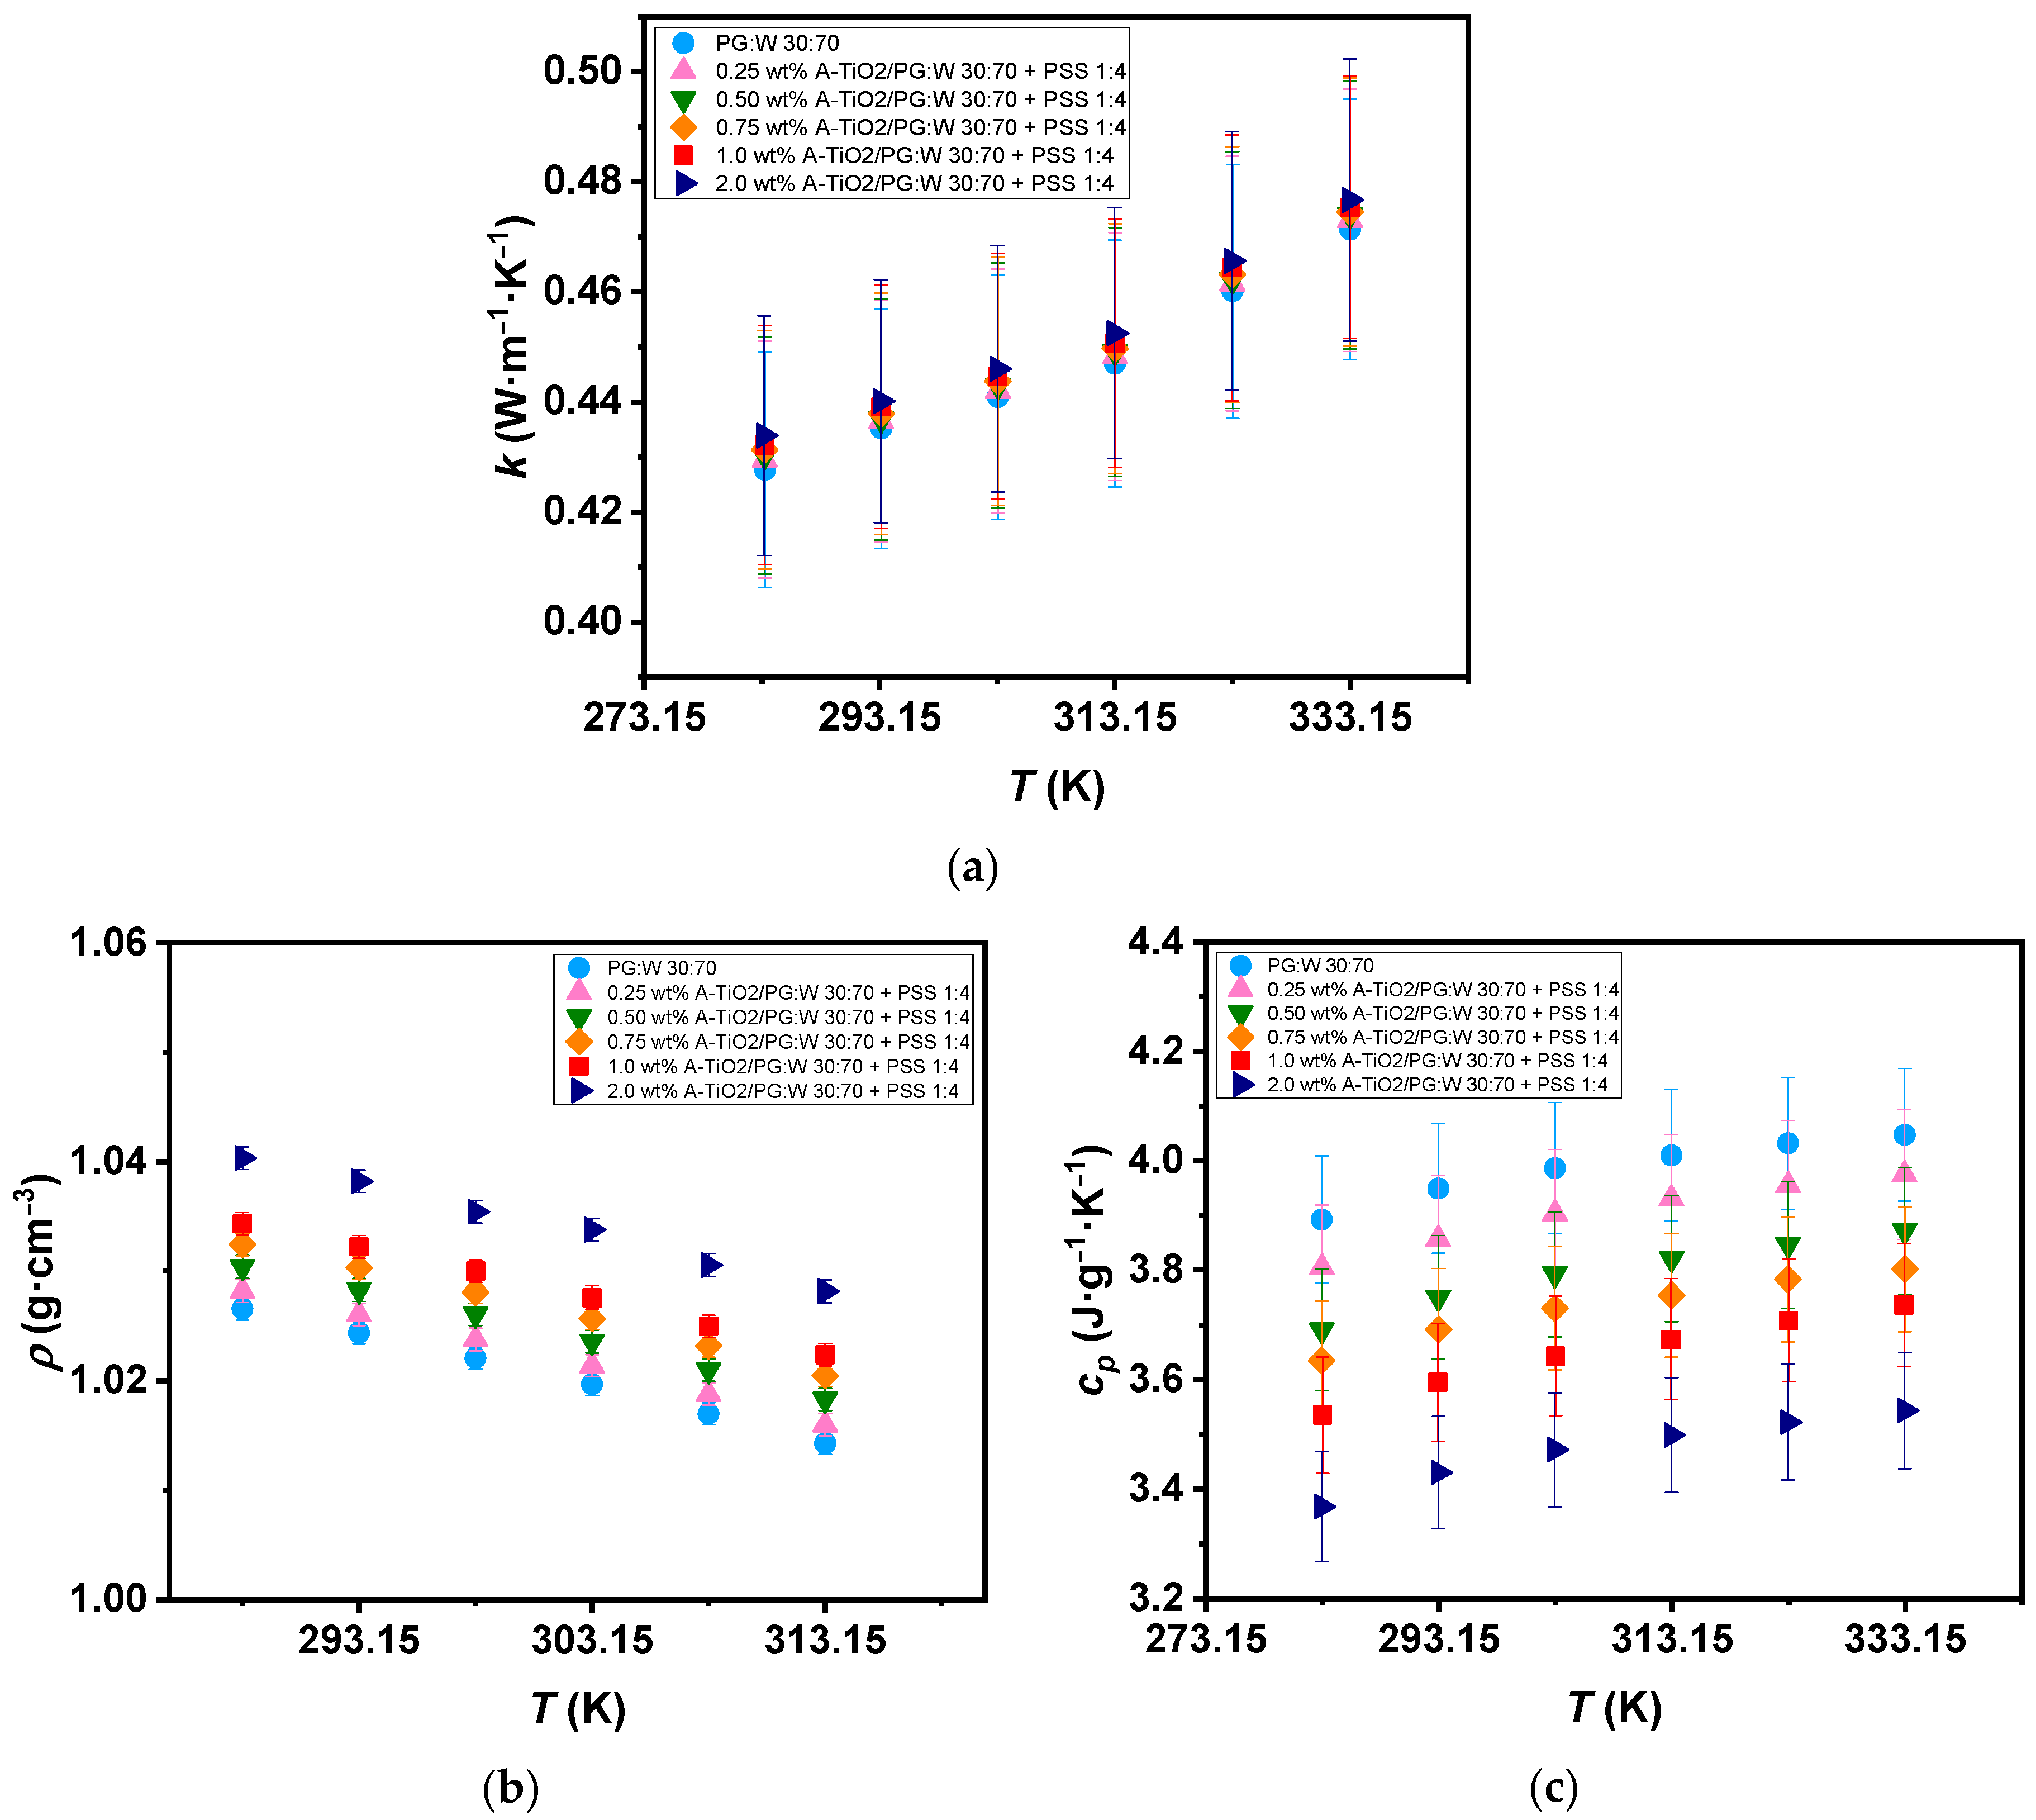
The A-TiO2/PG:W 30:70 + PSS 1:4 nanofluids and base fluid thermal conductivity () were experimentally determined from 283 to 333 K in increments of 10 K, as depicted in Figure 7a. All samples show an upward trend in thermal conductivity as the temperature rises, reaching up to 10% increases within the temperature range. The 2.0 wt% A-TiO2/PG:W 30:70 + PSS 1:4 nanofluid showed the highest enhancement in thermal conductivity compared to the base fluid, with increments reaching up to 1.5%. These increases are 0.5% higher than those reported by Satti et al. [19] for TiO2/PG:W 60:40 wt% nanofluids, who obtained increases of 1% for the 0.5 vol% concentration of TiO2/PG:W 60:40 wt% nanofluid. Regarding the experimental density (ρ), values were measured for both the nanofluids and PG:W 30:70 at various temperatures starting at 288 and up to 313 K with a 5 K temperature step, as shown in Figure 7b. Density decreases of 1.2% were observed for both the PG:W 30:70 and nanofluids when the temperature increased. Average increments ranging from 0.17% to 1.3% were found with the dispersion of A-TiO2 nanoparticles. These increases are 4.5% lower than those reported by Leena and Srinivasan [21] for TiO2/PG:W 30:70 wt% nanofluids (up to 5.8% for 0.8vol% TiO2). The experimental A-TiO2/PG:W 30:70 + PSS 1:4 nanofluids isobaric heat capacities compared to those of the glycolated mixture are displayed in Figure 7c over the temperature range of 283 to 333 K with increments of 10 K. An increasing trend of the isobaric heat capacity can be observed with increasing temperature, reaching up to 4% higher values for PG:W 30:70 and up to 5.7% higher values for the 1.0 wt% A-TiO2/PG:W 30:70 + PSS 1:4 nanofluid at 333 K with regard to those at 283 K. Maximum average decreases of 13% with the dispersion of nanoparticles were found for the 2.0 wt% A-TiO2/PG:W 30:70 + PSS 1:4 nanofluid compared to the base fluid. This decrease is expected as a result of the reduced isobaric heat capacity of the A-TiO2 (= ~0.687 J g−1 K−1 [32]) compared to PG:W 30:70 (= ~3.986 J g−1 K−1 based on measurements conducted in the present study). These decreases are 14% and 9% less significant than those reported by Satti et al. [20] for TiO2/PG:W 60:40 wt% nanofluids (27% and 19% at 243 K and 363 K, respectively).
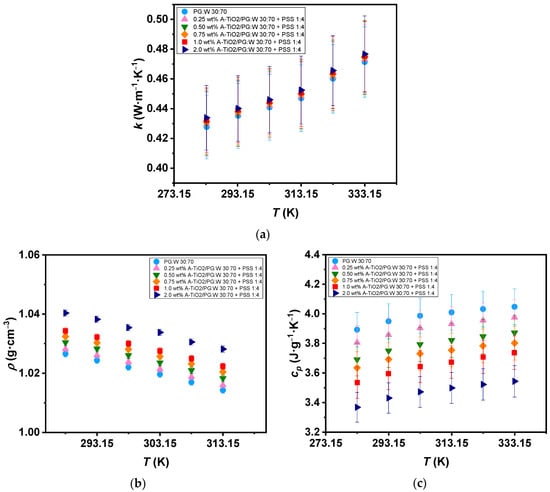
Figure 7.
(a) Experimental thermal conductivity, (b) density, and (c) isobaric heat capacity of the base fluid and A-TiO2/PG:W 30:70 + PSS 1:4 nanofluids as a function of temperature. Error bars indicate expanded uncertainty (k = 2).
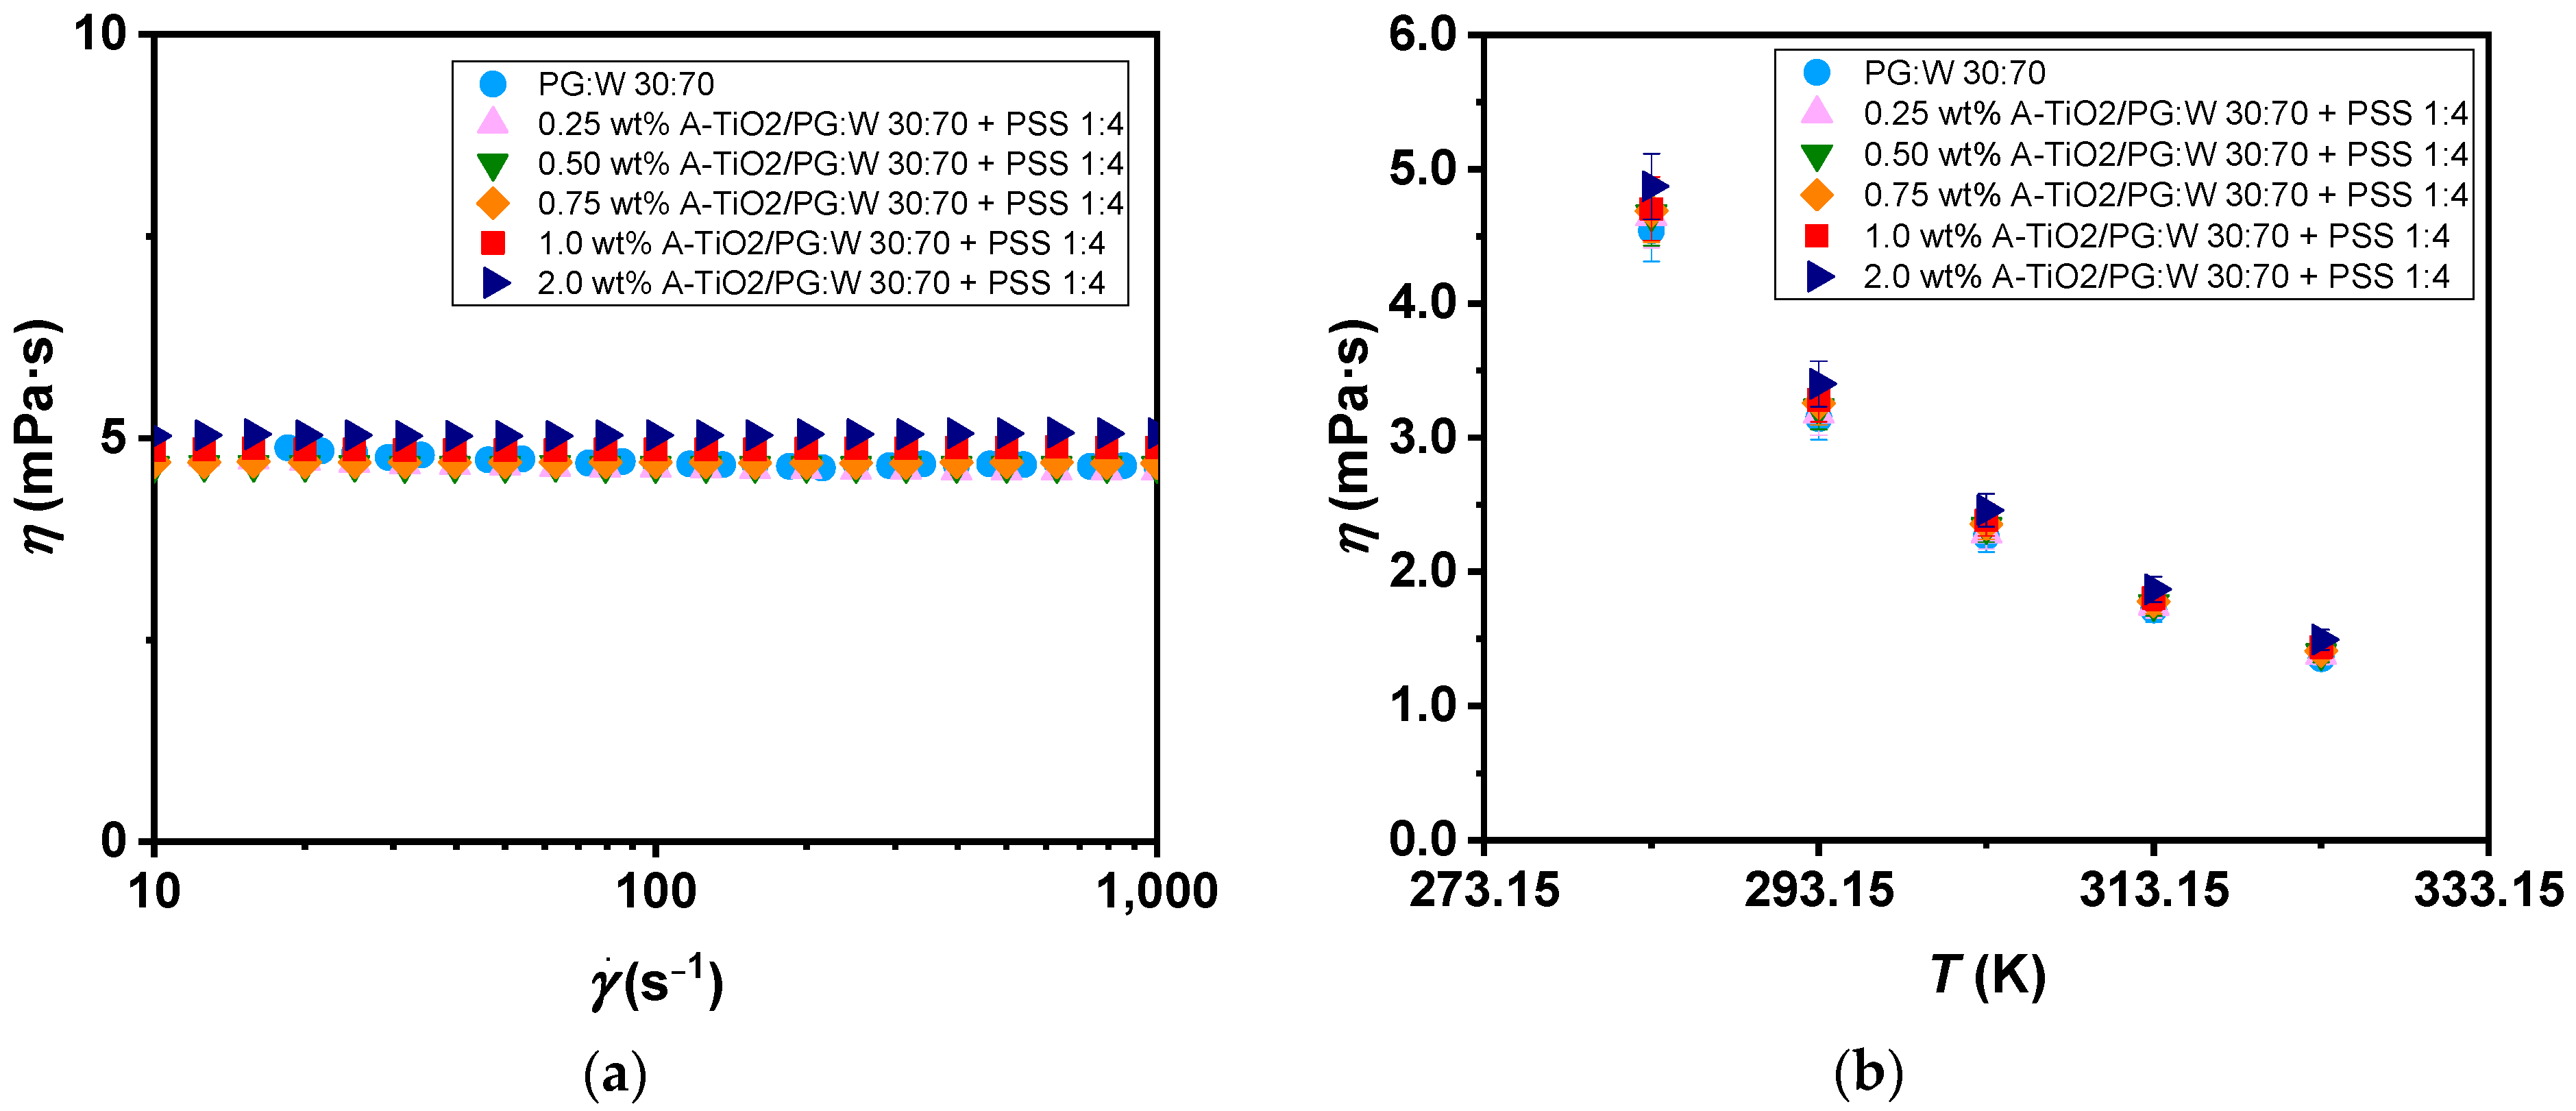
Concerning the rheological characteristics of the proposed nanofluids and base fluid, non-linear viscoelastic tests were carried out to evaluate the relationship between the shear stress and the shear rate. The resulting flow curves for the studied nanofluids, as well as the selected base fluid at 283 K within a shear rate range from 10 to 1000 s−1, are depicted in Figure 8a and confirm the samples’ Newtonian behaviour. Afterward, tests at a 100 s−1 constant shear rate were performed to ascertain the dynamic viscosity values, as shown in Figure 8b, across the temperature range of 283 to 323 K. A diminishing trend in viscosity can be observed with the increasing temperature, reaching average decreases of 70% in dynamic viscosity values for all analysed samples. Increases in viscosity of up to 8.8% were found for the highest mass concentration of A-TiO2 compared to the base fluid. The observed increases are in accordance with those reported by Leena and Srinivasan [21] for TiO2/PG:W 30:70 wt% nanofluids (2.8%, 5.5%, and 11.5% for 0.1, 0.4, and 0.8 vol% concentrations, respectively), indicating minimal influence of surfactant addition on dynamic viscosity data.
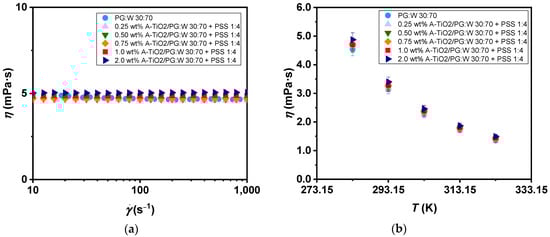
Figure 8.
(a) Flow curves with regard to the shear rate and (b) experimental dynamic viscosity (η) of the A-TiO2/PG:W 30:70 + PSS 1:4 nanofluids and base fluid with regard to the temperature (T). Error bars indicate dynamic viscosity expanded uncertainty (k = 2).
It was noted that thermal conductivity increases are not as high as those obtained in the literature. Nevertheless, dynamic viscosity increments significantly decreased, making it advantageous for heat transfer fluids to be used in thermal applications. It has been found in the literature that even with slight increases in thermal conductivity of up to 1.2%, convective heat transfer coefficient enhancements of 8.3% were obtained since the mixing phenomenon within the dispersion in turbulent flow conditions has a greater impact on convective heat transfer efficiency than the inherent properties of the nanofluid [33].
3.4. Heat Transfer Efficiency Evaluation with Mouromtseff Number
The effectiveness of well-known Figures-of-merit, such as the Mo ratio, was evaluated to assess the proposed nanofluids’ convective heat transfer performance. Mo ratios through the Dittus–Boelter and Simons equations were obtained from the measured experimental data and compared to the coefficient of convective heat transfer ratio.
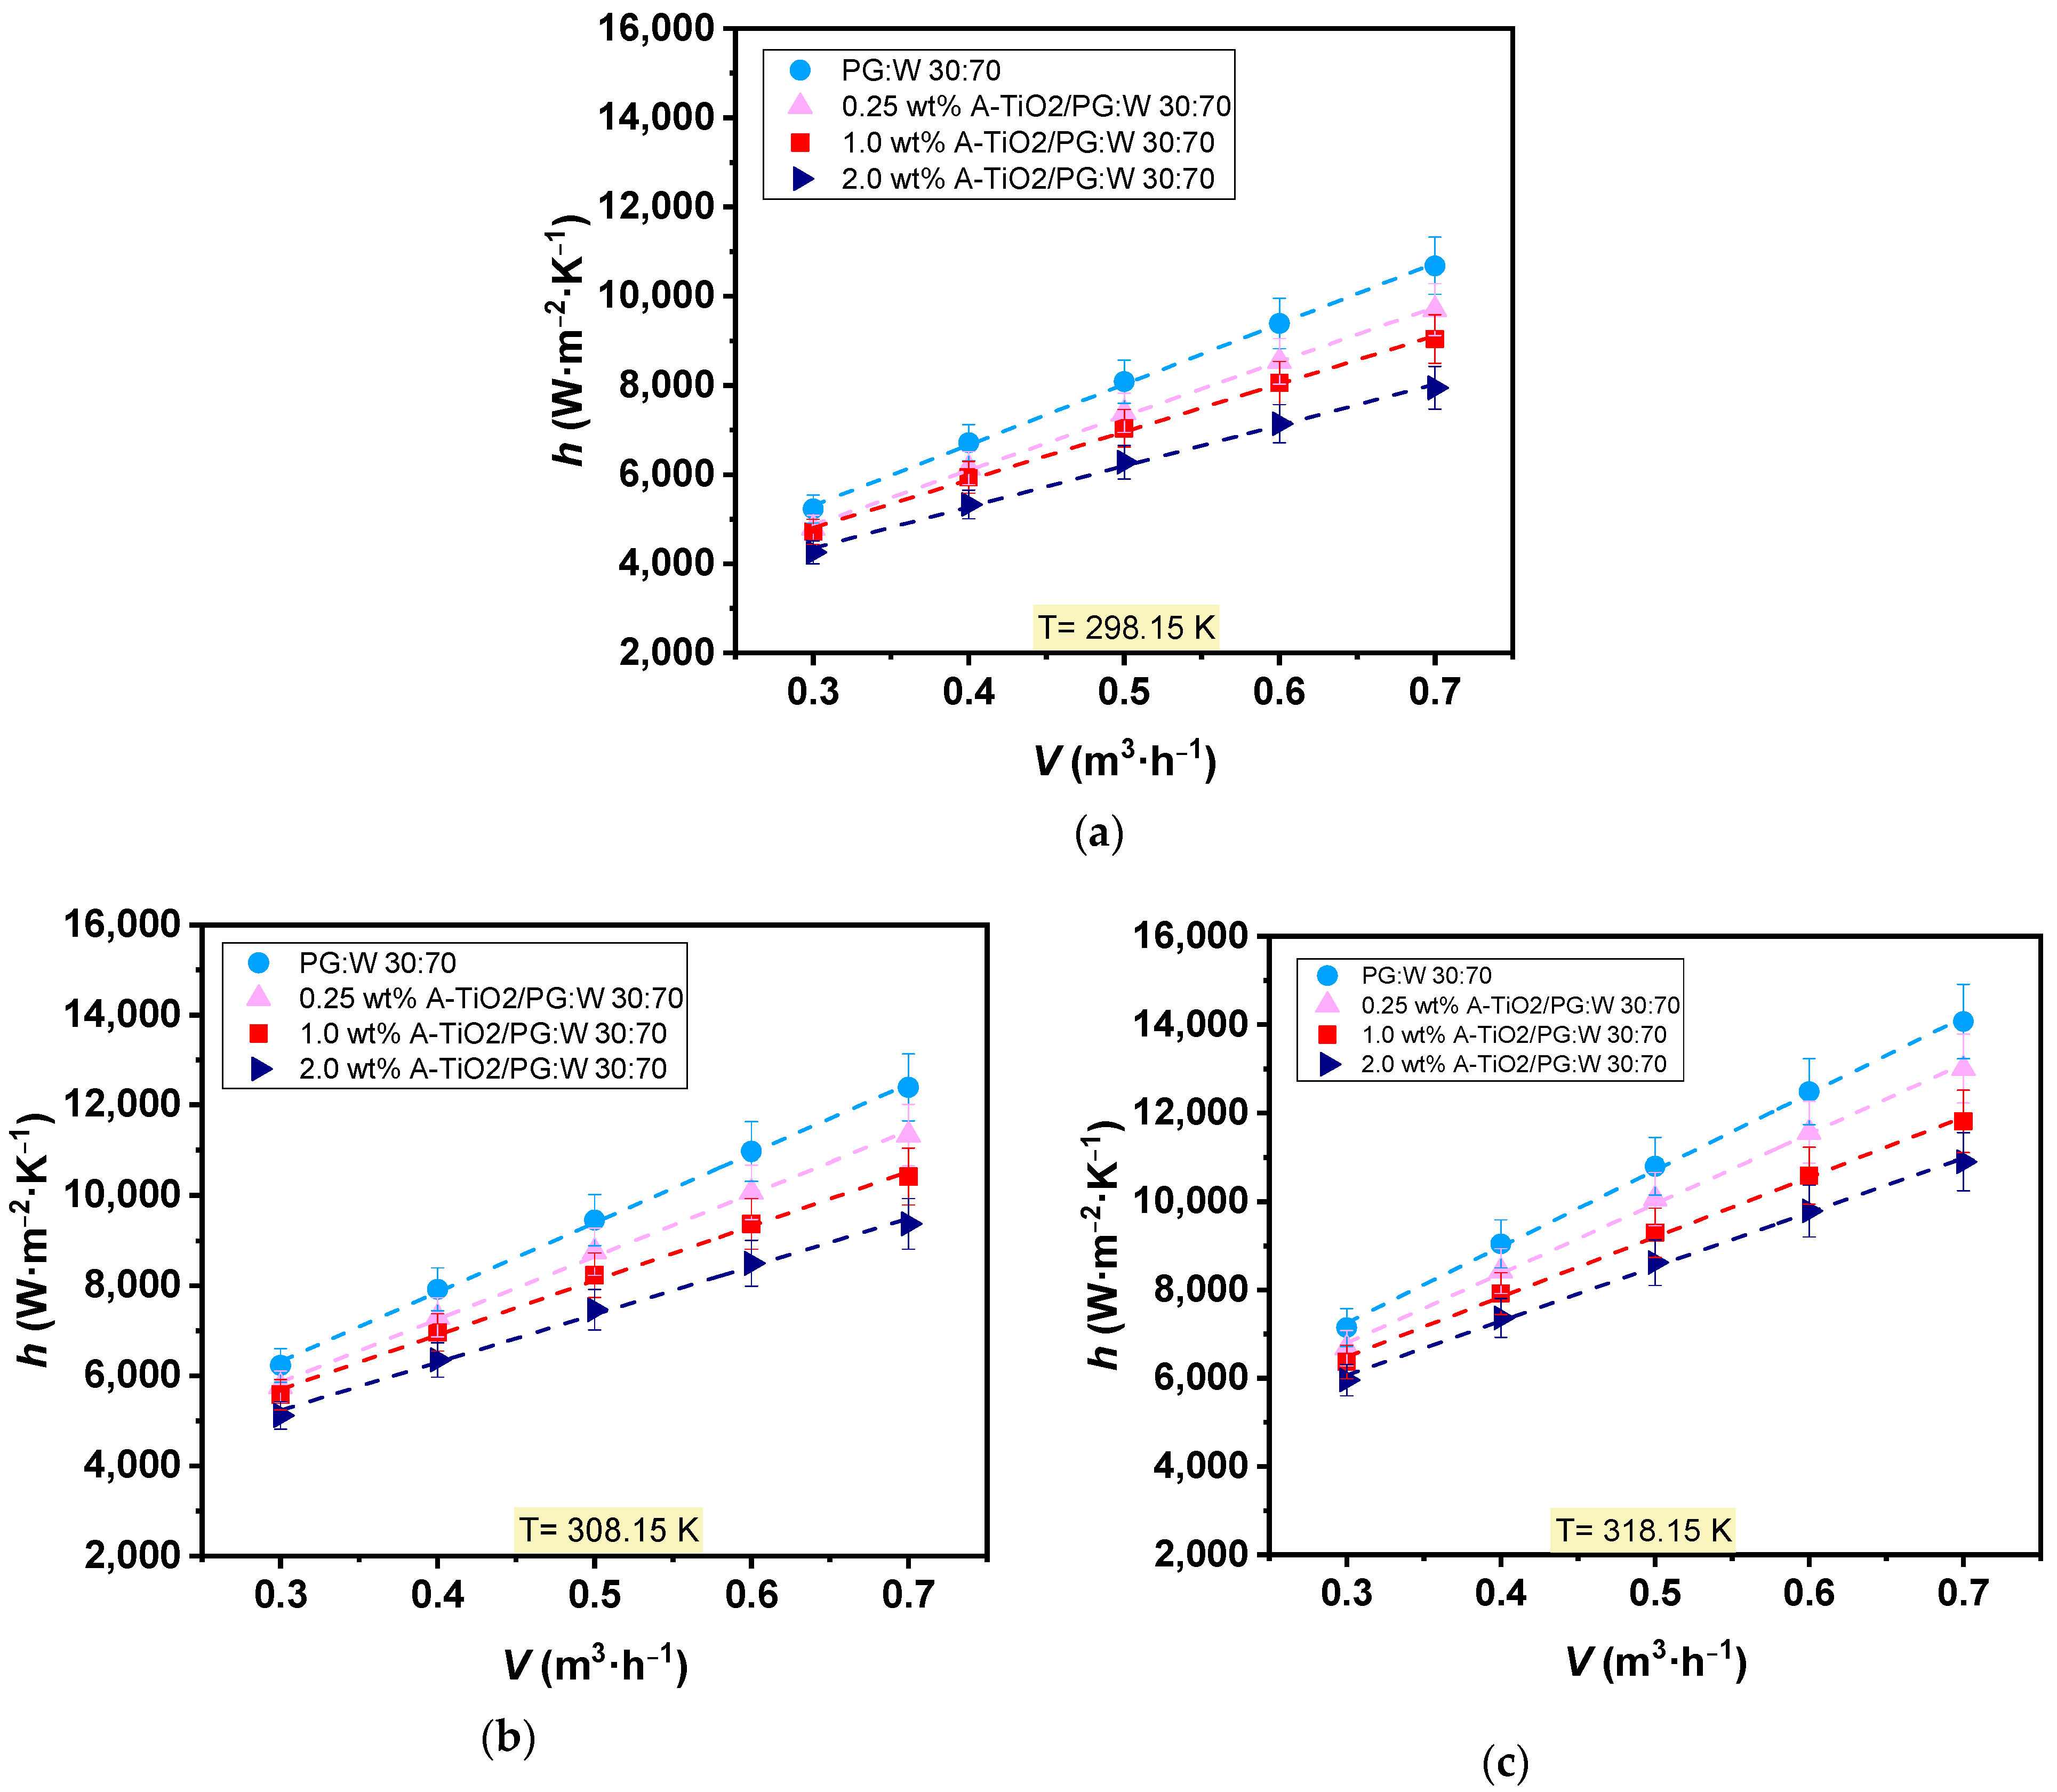
Experimental heat transfer tests were performed for the three proposed nanofluids (0.25, 1.0, and 2.0 wt%) and also the base fluid at 298, 308, and 318 K, varying the flow rate from 0.3 to 0.7 m3·h−1. Base fluid and nanofluids coefficients of convective heat transfer were inferred from the measured data and are depicted in Figure 9. Both the base fluid and nanofluids exhibited increased convective heat transfer coefficients with rising temperature and flow rate. Average increments of 33% and 92% were observed with temperature increases from 298 to 318 K and flow rate increases from 0.3 to 0.7 m3·h−1, respectively. However, as the nanoparticle loading increases, the convective heat transfer coefficients decreased compared to those of PG:W 30:70. Maximum average decreases of around 20% were observed for 2.0 wt% A-TiO2/PG:W 30:70 + PSS 1:4 nanofluid at 298 (Figure 9a), 308 (Figure 9b), and 318 K (Figure 9c). This is caused by a disproportionate balance between thermal conductivity and dynamic viscosity, which increases with the dispersion of the nanoparticles. Higher viscosity values, along with the turbulent mixing phenomena, boost pressure drops and hinder the thermal performance of the nanofluid.
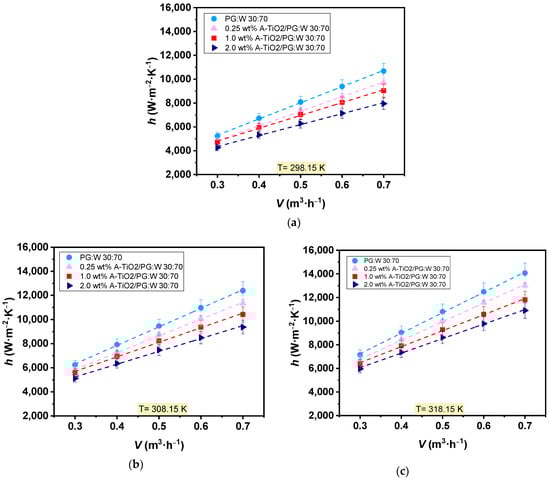
Figure 9.
Experimental heat transfer coefficients, h, of the base fluid, PG:W 30:70 (●), and A-TiO2 nanofluids at concentrations of 0.25 wt% (▲), 1.0 wt% (■), and 2.0 wt% (►)at (a) 298.15K, (b) 308.15 K, and (c) 318.15 K as a function of the flow rate, . Error bars indicate expanded uncertainty (k = 2).
Well-known FOMs, such as the Mo ratio, have been employed in the literature to investigate the prospective heat transfer behaviour of nanofluids without performing experimental heat transfer tests. However, for turbulent flow conditions, the reported Mo ratios in the literature did not fully correspond to the experimental convective heat transfer results. Thus, a comparison between the obtained and the equivalent experimental should be done. Since the Mo ratio of the studied nanofluids corresponds to the ratio of their convective heat transfer coefficients for fully developed internal turbulent flow over a pipe at constant velocity and heat flux [4], the experimental ratio was estimated and compared to the ratio, applying the criteria that > 1 and > 1 indicate a better performance for the nanofluids than for the base fluid.
Results of the experimental ratio and the ratio obtained by using the Dittus–Boelter or Simons expressions—Equations (3)–(5)—are presented in Table 1. The ratios correctly expect the decrease in the nanofluid coefficients of convective heat transfer with regard to those of the base fluid, with average discrepancies of 4–15% with regard to the experimental ratio. Both and ratios are lower than 1, indicating that the dispersion of A-TiO2 nanoparticles worsens the heat transfer performance of the base fluid in this case. The ratios obtained through the Dittus–Boelter and Simons expressions report a decrease of up to 7% for the 2.0 wt% A-TiO2/PG:W 30:70 + PSS 1:4 nanofluid, while the experimental ratio presented a maximum decrease of 24% for the same nanofluid. There is an agreement between both experimental and FOM values in reporting a worsening of the thermal performance of the nanofluid in comparison to the base fluid. This serves to confirm that the Mouromtseff number ratio can be used to envisage the convective heat transfer performance of nanofluids. However, there is a deviation between the FOMs and the experimental values. The mixing process within the dispersion is more crucial for convective heat transfer performance than the inherent properties of the nanofluid under turbulent flow conditions. This effect, along with the uncertainties related to the experimental measurements, can be the cause of these discrepancies.

Table 1.
ratios obtained through Equations (3)–(5) and experimental ratio at 298.15, 308.15, and 318.15 K within the studied flow rate for the three analysed nanofluids at 0.25, 1.0, and 2.0 wt%.
Thus, the heat transfer performance of A-TiO2 in a PG:W 30:70 vol% nanofluids was evaluated by determining both the experimental convective heat transfer coefficients and the Mouromtseff number ratios. The benefit of the Mo ratio to assess the nanofluid performance was evidenced and supported by the experimental results, but with maximum deviations between and of 15% related to the experimental uncertainties and the effect of the mixing phenomena. This implies that experimental heat transfer tests are still needed to accurately determine the convective heat transfer performance of nanofluids in heat exchangers.
4. Conclusions
This study is focused on evaluating the effectiveness of the Mouromtseff number to predict the thermal performance of nanofluids by comparing Mo ratios with experimental coefficients of convective heat transfer of new dispersions based on A-TiO2 in a PG: W 30:70 vol% binary mixture.
The A-TiO2 nanoparticles were carefully designed and characterised by means of TEM and XRD, finding the pseudo-spherical shape, tetragonal crystalline structure (anatase), and a mean particle size of 21 nm. The effect of different surfactants, namely PEI, PSS, CTAB, and PVP, on the stability of A-TiO2 nanofluids at different surfactant–nanoadditive mass ratios was analysed by DLS. These results clarified that the optimum surfactant for the proposed nanofluids is PSS at the 1:4 surfactant–nanoadditive mass ratio.
The thermophysical and rheological profile of the A-TiO2/PG:W 30:70 + PSS 1:4 nanofluids were experimentally obtained. Slight enhancements in thermal conductivity of 1.5% were found for the 2.0 wt% A-TiO2/PG:W 30:70 + PSS 1:4 nanofluid. Density increases with nanoparticle loading, reaching 1.3% maximum average increments, whereas average decreases up to 12.9% of isobaric heat capacity values were observed for the highest nanoparticle mass concentration. Regarding the rheological profile, increases in dynamic viscosity with increasing nanoadditive content were noticed, assessing increments of 8.8% for the 2.0 wt% A-TiO2/PG:W 30:70 + PSS 1:4 nanofluid while average decreases of 69.9% were found for all analysed samples as the temperature increased.
The thermal performance of the 0.25, 1.0, and 2.0 wt% A-TiO2/PG:W 30:70 + PSS 1:4 nanofluids was evaluated experimentally by determining the experimental hnf/hbf ratio through a tubular heat exchanger and through the ratio obtained by using the Dittus–Boelter and Simons expression. Decreases up to 24% and 7% of the and ratios, respectively, were obtained for 2.0 wt% A-TiO2/PG:W 30:70 + PSS 1:4 nanofluid. Both ratios were in agreement, suggesting that the designed nanofluids do not improve the thermal performance of the base fluid. Nevertheless, the effect of the mixing phenomenon in the convective heat transfer performance of nanofluids in turbulent flow, along with the uncertainties derived from the experimental measurements, might cause deviations between the Figures-of-merit, the experimental convective heat transfer coefficients, and the pressure drop values. Hence, this work demonstrates that the Mouromtseff number ratio criteria can be a useful tool for discerning the potential advantages or disadvantages of using TiO2 nanofluids. However, experimental tests like the one presented here are still needed to accurately determine the performance magnitude in tubular flow.
Author Contributions
U.C.: conceptualization, methodology, investigation, data curation, formal analysis, writing—original draft, writing—review and editing. J.I.P.: investigation, writing—original draft, writing—review and editing. J.P.V.: conceptualization, supervision, writing—review and editing. L.L.: conceptualization, project administration, validation, supervision, resources, writing—review and editing. All authors have read and agreed to the published version of the manuscript.
Funding
This research was funded with Grant PID2020-112846RB-C21 by MCIN/AEI/10.13039/501100011033 and Grant PDC2021-121225-C21 by MCIN/AEI/10.13039/501100011033 and by “European Union NextGenerationEU/PRTR”.
Institutional Review Board Statement
Not applicable.
Informed Consent Statement
Not applicable.
Data Availability Statement
The data presented in this study are available on request from the corresponding author.
Acknowledgments
U.C. acknowledges the financial support from “Agencia Estatal de Investigación” under predoctoral grant PRE2021-097589. J.I.P. and J.P.V. thank the Defense University Center at the Spanish Naval Academy (CUD-ENM) for all the support provided for this research.
Conflicts of Interest
The authors declare no conflicts of interest.
References
- Said, Z.; Sundar, L.S.; Tiwari, A.K.; Ali, H.M.; Sheikholeslami, M.; Bellos, E.; Babar, H. Recent advances on the fundamental physical phenomena behind stability, dynamic motion, thermophysical properties, heat transport, applications, and challenges of nanofluids. Phys. Rep. 2022, 946, 1–94. [Google Scholar] [CrossRef]
- Vajjha, R.S.; Das, D.K. A review and analysis on influence of temperature and concentration of nanofluids on thermophysical properties, heat transfer and pumping power. Int. J. Heat Mass Transf. 2012, 55, 4063–4078. [Google Scholar] [CrossRef]
- Dittus, F.W.; Boelter, L.M.K. Heat transfer in automobile radiators of the tubular type. Int. Commun. Heat Mass Transf. 1985, 12, 3–22. [Google Scholar] [CrossRef]
- Yu, W.; France, D.M.; Timofeeva, E.V.; Singh, D.; Routbort, J.L. Comparative review of turbulent heat transfer of nanofluids. Int. J. Heat Mass Transf. 2012, 55, 5380–5396. [Google Scholar] [CrossRef]
- Mouromtseff, I.E. Water and Forced-Air Cooling of Vacuum Tubes Nonelectronic Problems in Electronic Tubes. Proc. IRE 1942, 30, 190–205. [Google Scholar] [CrossRef]
- Vallejo, J.P.; Pérez-Tavernier, J.; Cabaleiro, D.; Fernández-Seara, J.; Lugo, L. Potential heat transfer enhancement of functionalized graphene nanoplatelet dispersions in a propylene glycol-water mixture. Thermophysical profile. J. Chem. Thermodyn. 2018, 123, 174–184. [Google Scholar] [CrossRef]
- Ashrae, A.H.F.; Atlanta, G. American Society of Heating, 2009 ASHRAE Handbook: Fundamentals, SI ed.; American Society of Heating, Refrigeration and Air-Conditioning Engineers: Atlanta, GA, USA, 2009; Available online: http://app.knovel.com/hotlink/toc/id:kpASHRAE37/2009-ashrae-handbook (accessed on 6 November 2023).
- Yu, W.; Timofeeva, E.V.; Singh, D.; France, D.M.; Smith, R.K. Investigations of heat transfer of copper-in-Therminol 59 nanofluids. Int. J. Heat Mass Transf. 2013, 64, 1196–1204. [Google Scholar] [CrossRef]
- Cabaleiro, D.; Colla, L.; Agresti, F.; Lugo, L.; Fedele, L. Transport properties and heat transfer coefficients of ZnO/(ethylene glycol+water) nanofluids. Int. J. Heat Mass Transf. 2015, 89, 433–443. [Google Scholar] [CrossRef]
- Elcioglu, E.B.; Genc, A.M.; Karadeniz, Z.H.; Ezan, M.A.; Turgut, A. Nanofluid figure-of-merits to assess thermal efficiency of a flat plate solar collector. Energy Convers. Manag. 2020, 204, 112292. [Google Scholar] [CrossRef]
- Sahoo, R.R.; Sarkar, J. Experimental study on hydrothermal characteristics of shell and tube heat exchanger using phase change material-based hybrid nanofluid. Heat Mass Transf. 2024, 60, 519–533. [Google Scholar] [CrossRef]
- Hao, X.; Peng, B.; Chen, Y.; Xie, G. Experimental Investigation on Heat Transfer Performance of a Flat Plate Heat Pipe With MWCNTS-Acetone Nanofluid. ASME J. Heat Mass Transf. 2017, 139, 062001. [Google Scholar] [CrossRef]
- Azmi, W.H.; Sharma, K.V.; Sarma, P.K.; Mamat, R.; Anuar, S.; Rao, V.D. Experimental determination of turbulent forced convection heat transfer and friction factor with SiO2 nanofluid. Exp. Therm. Fluid Sci. 2013, 51, 103–111. [Google Scholar] [CrossRef]
- Pandey, S.D.; Nema, V.K. Experimental analysis of heat transfer and friction factor of nanofluid as a coolant in a corrugated plate heat exchanger. Exp. Therm. Fluid Sci. 2012, 38, 248–256. [Google Scholar] [CrossRef]
- Nguyen, C.T.; Galanis, N.; Polidori, G.; Fohanno, S.; Popa, C.V.; Le Bechec, A. An experimental study of a confined and submerged impinging jet heat transfer using Al2O3-water nanofluid. Int. J. Therm. Sci. 2009, 48, 401–411. [Google Scholar] [CrossRef]
- Khanlari, A.; Sözen, A.; Variyenli, H.İ. Simulation and experimental analysis of heat transfer characteristics in the plate type heat exchangers using TiO2/water nanofluid. Int. J. Numer. Methods Heat Fluid Flow 2019, 29, 1343–1362. [Google Scholar] [CrossRef]
- Ulhakim, M.T.; Sukarman; Khoirudin; Fazrin, N.; Irfani, T.; Abdulah, A. Qualitative Stability and Thermal Properties Investigation of TiO2-EG/W Nanofluids Through Experimental Validation. J. Asiimetrik 2023, 6, 143–152. [Google Scholar]
- Zhang, H.; Qing, S.; Xu, J.; Zhang, X.; Zhang, A. Stability and thermal conductivity of TiO2/water nanofluids: A comparison of the effects of surfactants and surface modification. Colloids Surf. A Physicochem. Eng. Asp. 2022, 641, 128492. [Google Scholar] [CrossRef]
- Satti, J.R.; Das, D.K.; Ray, D. Investigation of the thermal conductivity of propylene glycol nanofluids and comparison with correlations. Int. J. Heat Mass Transf. 2017, 107, 871–881. [Google Scholar] [CrossRef]
- Satti, J.R.; Das, D.K.; Ray, D. Specific heat measurements of five different propylene glycol based nanofluids and development of a new correlation. Int. J. Heat Mass Transf. 2016, 94, 343–353. [Google Scholar] [CrossRef]
- Leena, M.; Srinivasan, S. Experimental Investigation of the Thermophysical Properties of TiO2/Propylene Glycol–Water Nanofluids for Heat-Transfer Applications. J. Eng. Phys. Thermophys. 2018, 91, 498–506. [Google Scholar] [CrossRef]
- Scherrer, P. Bestimmung der inneren Struktur und der Größe von Kolloidteilchen mittels Röntgenstrahlen. In Kolloidchemie Ein Lehrbuch. Chemische Technologie in Einzeldarstellungen; Springer: Berlin/Heidelberg, Germany, 1912. [Google Scholar] [CrossRef]
- Suganthi, K.S.; Rajan, K.S. Metal oxide nanofluids: Review of formulation, thermo-physical properties, mechanisms, and heat transfer performance. Renew. Sustain. Energy Rev. 2017, 76, 226–255. [Google Scholar] [CrossRef]
- Simons, R.E. Calculation corner: Comparing heat transfer rates of liquid coolants using the Mouromtseff number. Electronics Cool. 2006, 12, 10. [Google Scholar]
- Vallejo, J.P.; Calviño, U.; Freire, I.; Fernández-Seara, J.; Lugo, L. Convective heat transfer in pipe flow for glycolated water-based carbon nanofluids. A thorough analysis. J. Mol. Liq. 2020, 301, 112370. [Google Scholar] [CrossRef]
- Lienhard, J.H. A Heat Transfer Textbook; Phlogistron: Cambridge, MA, USA, 2005. [Google Scholar]
- Gnielinski, V. G2 Heat Transfer in Concentric Annular and Parallel Plate Ducts. In VDI Heat Atlas; Springer: Berlin/Heidelberg, Germany, 2010; pp. 701–708. [Google Scholar] [CrossRef]
- Song, N.W.; Park, K.M.; Lee, I.H.; Huh, H. Uncertainty estimation of nanoparticle size distribution from a finite number of data obtained by microscopic analysis. Metrologia 2009, 46, 480. [Google Scholar] [CrossRef]
- Antić, Ž.; Krsmanović, R.M.; Nikolić, M.G.; Marinović-Cincović, M.; Mitrić, M.; Polizzi, S.; Dramićanin, M.D. Multisite luminescence of rare earth doped TiO2 anatase nanoparticles. Mater. Chem. Phys. 2012, 135, 1064–1069. [Google Scholar] [CrossRef]
- Rehman, A.; Yaqub, S.; Ali, M.; Nazir, H.; Shahzad, N.; Shakir, S.; Liaquat, R.; Said, Z. Effect of surfactants on the stability and thermophysical properties of Al2O3+TiO2 hybrid nanofluids. J. Mol. Liq. 2023, 391, 123350. [Google Scholar] [CrossRef]
- Holmberg, J.P.; Ahlberg, E.; Bergenholtz, J.; Hassellöv, M.; Abbas, Z. Surface charge and interfacial potential of titanium dioxide nanoparticles: Experimental and theoretical investigations. J. Colloid. Interface Sci. 2013, 407, 168–176. [Google Scholar] [CrossRef] [PubMed]
- Feng, T.; Li, L.; Shi, Q.; Zhang, Y.; Li, G. Heat capacity and thermodynamic functions of TiO2(H). J. Chem. Thermodyn. 2020, 145, 106040. [Google Scholar] [CrossRef]
- Calviño, U.; Montenegro, I.; Murshed, S.M.S.; Fernández-Seara, J.; Vallejo, J.P.; Lugo, L. Heat transfer and hydrodynamic performance of ZrO2 geothermal nanofluids through tubular and plate heat exchangers. Appl. Therm. Eng. 2024, 253, 123770. [Google Scholar] [CrossRef]
Disclaimer/Publisher’s Note: The statements, opinions and data contained in all publications are solely those of the individual author(s) and contributor(s) and not of MDPI and/or the editor(s). MDPI and/or the editor(s) disclaim responsibility for any injury to people or property resulting from any ideas, methods, instructions or products referred to in the content. |
© 2024 by the authors. Licensee MDPI, Basel, Switzerland. This article is an open access article distributed under the terms and conditions of the Creative Commons Attribution (CC BY) license (https://creativecommons.org/licenses/by/4.0/).