Article

Experimental Study of the Influence of Occupants on Speech Intelligibility in an Automotive Cabin

by
Linda Liang
1,*,
Miao Ren
1,
Linghui Liao
1,
Ye Zhao
1,
Wei Xiong
1,* and
Liuying Ou
2
1
College of Civil Engineering and Architecture, Guangxi University, Nanning 530004, China
2
Headmaster’s Office, Guangxi Vocational University of Agriculture, Nanning 530004, China
*
Authors to whom correspondence should be addressed.
Appl. Sci. 2024, 14(17), 7942; https://doi.org/10.3390/app14177942
Submission received: 25 July 2024 / Revised: 26 August 2024 / Accepted: 4 September 2024 / Published: 5 September 2024
(This article belongs to the Section Acoustics and Vibrations)

Abstract

:
Adding occupants to an enclosed space often leads to perceptible changes in the sound field and, therefore, speech intelligibility; however, this issue has not yet been examined in automotive cabins. This study investigated the effect of occupants in an automotive cabin on SI. Binaural room impulse responses (BRIRs) were measured in an automotive cabin with an artificial mouth and dummy head under different speaker–listener position configurations and occupancy modes. Based on the measured BRIRs, the speech transmission index (STI) was determined, and subjective speech–reception thresholds (SRTs) in Mandarin Chinese were assessed. The results indicate that speech intelligibility mostly decreased slightly after adding additional occupants. In most cases, the occupants did not significantly affect speech intelligibility, with STI variations of no more than the just-noticeable difference and SRT variation within 1 dB. When the listener was in the back-right seat, the effect of the occupants on speech intelligibility could not be ignored, with STI variations of up to 0.07 and an SRT variation of 2 dB under different occupancy modes. In addition, the influence of front-row passengers on the speech intelligibility of rear-row listeners was extremely small, and vice versa. Furthermore, altering the distribution of occupants had an effect comparable to changing the number of occupants.

1. Introduction

In recent years, the interior spaces of cabins have become an essential component of individuals’ daily lives. The concept of an cabin has evolved from a basic mode of transportation to an integral part of people’s lifestyles, and it is sometimes referred to as a “third space”. With increasing consumer demand, acoustic comfort has become a significant concern. As a example, the acoustic comfort inside ships has attracted a great deal of attention [1,2,3]. However, studies on the acoustic comfort inside an automotive cabin is limited. Speech intelligibility in an automotive cabin is closely related to the level of acoustic comfort experienced by the passengers, and this can directly affect the safety of driving and the overall ride experience. However, when compared to traditional indoor spaces, the acoustical environments within automotive cabins exhibit unique characteristics [4], meaning that understanding speech intelligibility in these environments is a particular challenge.
In general, speech intelligibility is primarily affected by the acoustical conditions of a space—such as its reverberation time—and the signal-to-noise ratio (SNR) [5,6]. Due to the much smaller spatial volume of an automotive cabin when compared to building interiors and the large number of absorbing boundaries (such as seats, carpets, and the roof) in close proximity to a listener, the sound field exhibits significant low-frequency modal phenomena and a rapid attenuation of high-frequency sound waves [7,8,9]. The density of sound resonance modes inside an automotive cabin is much lower than that in a traditional interior, and this results in low-frequency sound fields having significantly uneven distributions in both the frequency and spatial domains. Furthermore, the rapid attenuation of sound waves by absorbing the boundaries inside an automotive cabin result in an early decay time that is generally within 0.15 s [7,9,10]; this essentially means that there is no “reverberation” process, and even the concept of reverberation time is not applicable. Almost all reflected sounds in an automotive cabin arrive within 50 ms, meaning that they are early reflected sounds, and many indeed arrive within 1 ms [9,10]. These early reflected sounds can be combined with direct sound [11,12], thereby significantly improving speech intelligibility. As such, speech intelligibility in an automotive cabin is almost unrelated to the time-domain attenuation characteristics of the transfer function (i.e., the reverberation) [13,14,15,16] and mainly depends on the SNR.
Many factors influence passengers’ speech intelligibility in an automotive cabin. Previous studies have shown that, in this context, background noise—such as that from the engine, tires, air conditioning, and turbulent air—significantly affects speech intelligibility because it is unique and fluctuates depending on speed, operating conditions, and road conditions, unlike in traditional indoor environments [15,16,17,18,19,20]. Furthermore, seat backs have a significant role in absorbing sound within an automobile, effectively separating the cabin into two compartments [17,21]. Consequently, seat occlusions reduce the speech energy transmitted from a speaker to a listener, and this greatly reduces speech intelligibility, particularly when a front-row passenger is listening to a passenger in the back [22,23]. Furthermore, due to the extremely small dimensions of an automotive cabin, both the speaker and listener are within the near-field region (i.e., separated by a distance of no more than 1 m), and the near-field acoustic transmission properties further complicate the variations in speech intelligibility within a cabin [24,25,26]. For instance, speech intelligibility may be more sensitive to the directivity or orientation of the sound source in an automotive cabin than in a traditional indoor space [27,28,29,30]. Additionally, binaural listening phenomena such as binaural interactions [31] and the head shadow effect [22,23,32] will produce an “effective” SNR that is greater in one ear than the other, and this will have a direct effect on the speech intelligibility in automobiles. The speech intelligibility in an automotive cabin is strongly influenced by the speaker’s direction in relation to or distance from the listener’s ears [22,25]. The near-field acoustic conditions exacerbate the head shadow effect, and the special acoustic conditions, such as the sound–field nonuniformity, distribute early reflections and seat-back occlusions, further complicating the sound field. These factors make speech intelligibility under binaural listening in an automobile cabin more complex than that in a traditional room [22,25].
From the perspective of indoor acoustics, occupants, being an integral part of the indoor environment, are also regarded as a significant variable affecting acoustic conditions. The addition of occupants to a space leads to a decrease in its effective volume and an increase in sound absorption [33,34]. Hence, careful consideration of the effect of occupancy on acoustic environments is crucial during the initial stages of acoustic design for building spaces. Research has shown that the acoustic effect of occupancy varies with factors such as the occupation density and distribution [35,36], the surface area of the body exposed [37], standing or sitting [33], height and weight [38], clothing [39], and the room itself [35]. Due to the “edge effect” in auditoria, assessing the sound absorbing properties of occupants using a typical reverberation chamber may not yield precise outcomes [33,40]. Consequently, previous studies have focused on experimental measurements and modeling of the sound absorption characteristics of occupants, chairs, and occupied pews [34,37,40,41] using methods such as that based on perimeter-to-area ratios [41,42]. The additional sound absorption provided by occupants is expected to absorb more reflected sounds and reduce room reverberation [35,36,43,44]. Furthermore, sound absorption by occupants can eliminate the possibility of a flutter echo between the ceiling and floor (known as the seat-dip effect), thus reducing sound-focusing phenomena [43,45].
However, the effect of occupancy on acoustic conditions is contingent upon the fundamental acoustic features of the space, such as the total sound absorption. As an example, Choi [35] demonstrated that adding occupants to more absorbing classrooms led to smaller fractional increases in the total sound absorption and smaller incremental changes in the room acoustic parameters. More specifically, the sound absorption provided by the occupants resulted in reduced reverberation times and late-arriving reflected sounds, with the largest effects observed in highly reflective spaces, but minor effects were also observed in absorptive classrooms [35]. Thus, occupants are typically observed as the principal sound absorption component, significantly influencing the acoustic properties of the space, particularly in spaces with many rigid or reflective boundaries [33,35].
Speech intelligibility is primarily affected by the acoustic conditions of a space, which are mainly determined by the SNR and reverberation time [22,31]. Consequently, occupancy can also affect speech intelligibility. On the one hand, the presence of occupants can increase the background noise level and weaken the sound level with distance within the crowd, leading to a decrease in the SNR and a subsequent decrease in speech intelligibility [35,43]. Choi [35] found that, while adding absorption can reduce late-arriving speech sounds, too much absorption can also reduce useful early-arriving speech sounds, thereby decreasing speech intelligibility. On the other hand, additional sound absorption by occupants reduces the reverberation time, increasing speech intelligibility [35,36,46,47]. Hodgson [46] found that decreasing occupancy leads to decreased acoustic quality in terms of the room-averaged speech intelligibility in classrooms. Desarnaulds [43] demonstrated that occupancy, based on measurements in six churches, induces a mean speech transmission index (STI) increase of 0.05 with the use of a public address system and 0.035 without a public address system. Choi [35] reported that occupancy causes a mean increase of 0.05 in STI values in six reflective classrooms but a smaller decrease of 0.02 in STI values for six absorptive classrooms. Therefore, the effect of occupancy on speech intelligibility is dependent on the acoustic conditions of the room and can either increase or decrease speech intelligibility.
It can be seen that the acoustic effects of occupancy on acoustic conditions and speech intelligibility are dependent on the primitive acoustic properties of the space [35,43]. However, previous studies have paid more attention to how occupancy affects acoustic conditions and speech intelligibility in large spaces, such as classrooms [35,36,46,47], churches [37,43,48,49], and theaters [33,34,40,41,50]. Given the unique acoustic conditions in automotive cabins, the effects of occupants (or passengers) on speech intelligibility may differ from those in larger spaces. The physical volume occupied by passengers is comparable to the overall volume of the automotive cabin, and this is a fundamental difference from traditional large spaces. Thus, occupants can disrupt geometric symmetry in an automotive cabin, further altering modal behavior; human activities also generate sound waves that interact with the room acoustics, potentially changing the sound field and its decay characteristics [8,9]. Furthermore, an automotive cabin contains substantial sound-absorbing materials, particularly the seats, and the presence of occupants will also modify the sound absorption of the seats. Hence, the sound absorption caused by occupants could be different from that occurring in larger spaces, making the effect of occupancy more complex. Despite these important differences, to the best of our knowledge, the effect of occupants on speech intelligibility in an automotive cabin has not been studied. While internal noise is the primary factor reducing speech intelligibility in an automotive cabin, it is also important to discuss other aspects of speech intelligibility in specific noise conditions from the perspective of room acoustics. These factors motivate us to systematically explore the ways through which occupants affect speech intelligibility in an automotive cabin.
Based on the above, this study comprehensively investigated the effects of adding occupants on the speech intelligibility in an automotive cabin. In practice, previous studies have mostly used percentage occupancy [36] and the perimeter-to-area ratio [42] to discuss the impact of occupants on the sound field and speech intelligibility; however, while these variables are suitable for large spaces, they are not appropriate in the special sound field inside an automotive cabin. Therefore, this study specifically considered the differences in speech intelligibility between different occupancy modes. First, binaural room impulse responses (BRIRs) were measured in an automotive cabin with different speaker–listener position configurations, with an artificial mouth regarded as the speaker and a dummy head designed to represent the typical physiological characteristics of a Chinese adult male, who was regarded as the receiver. Different occupancy modes were considered for a fixed speaker–listener position configuration. Then, the magnitude spectra of BRIRs were analyzed, and the corresponding STIs were experimentally examined based on the measured BRIRs in the same manner as the approach demonstrated in [51,52]. Finally, the subjective speech–reception thresholds (SRTs, i.e., the SNR required for 50% intelligibility) in Mandarin Chinese were assessed via headphones based on the measured BRIRs.
The remainder of this paper is structured as follows. Section 2 describes the experimental setup for the BRIR measurements, the method for STI calculation, and the procedure used for the subjective experiments. Section 3 presents the reverberation time, magnitude spectrum, STI, and subjective SRT results under different speaker–listener position configurations and occupancy modes. Finally, Section 4 summarizes the conclusions of the present study.

2. Materials and Methods

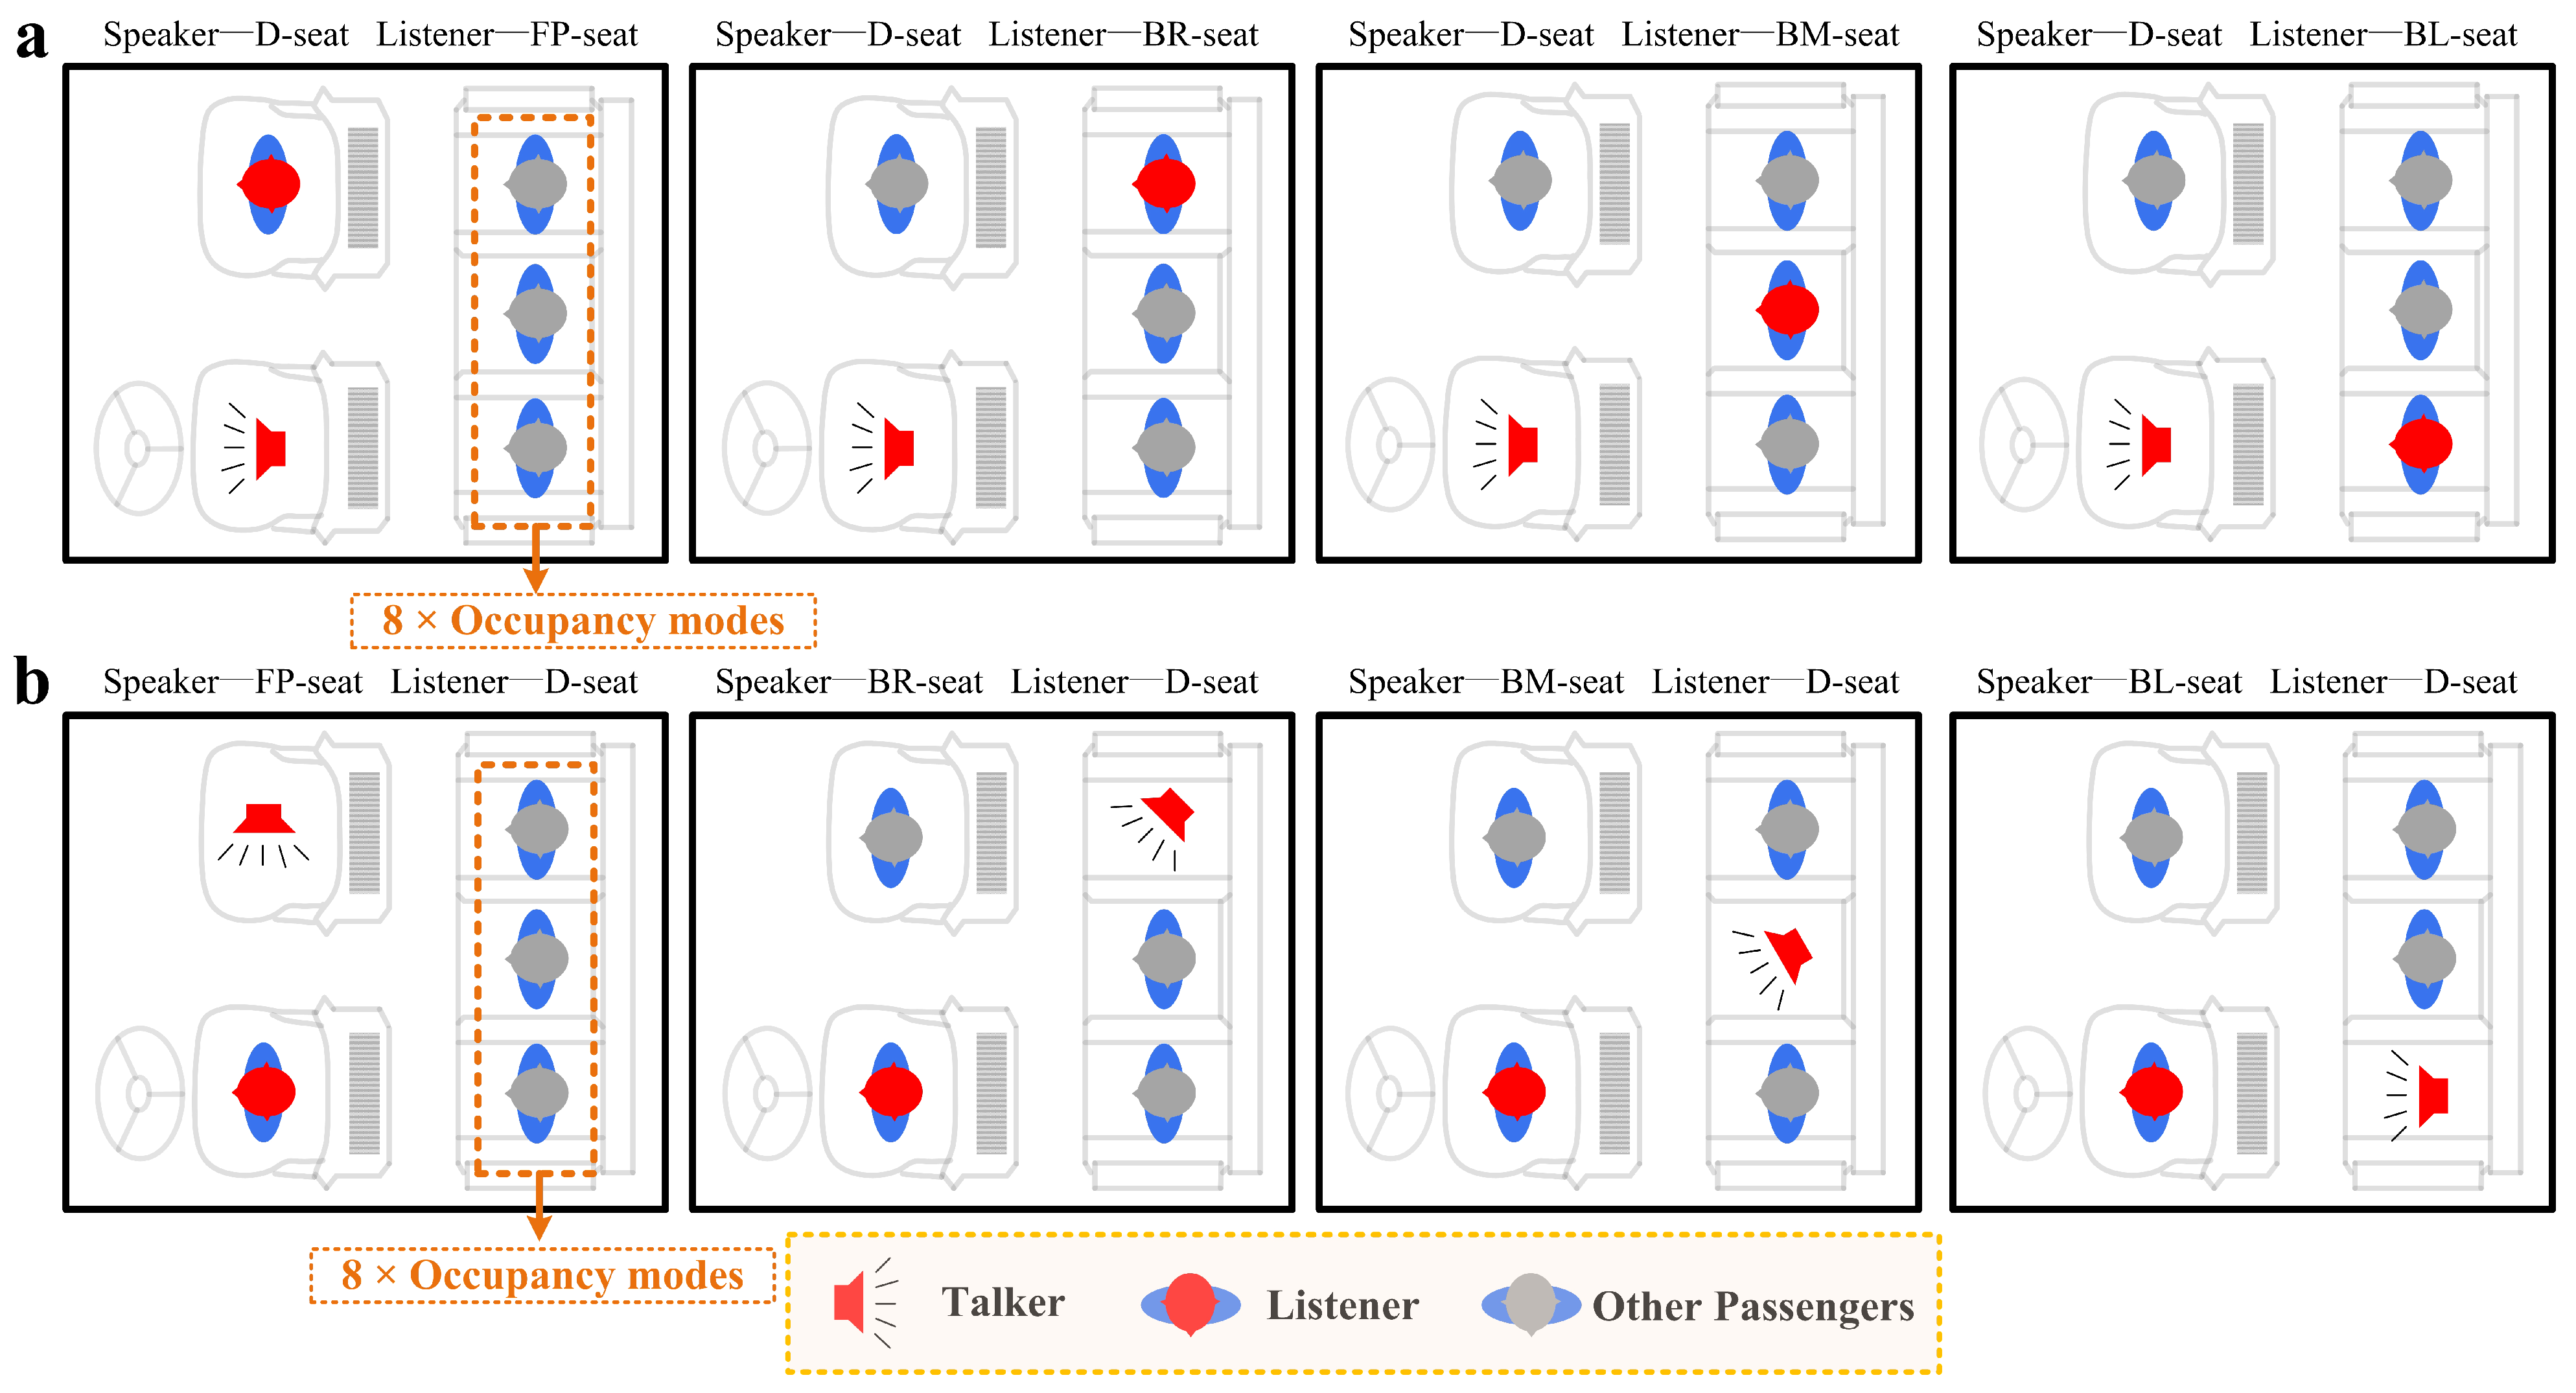
2.1. Experimental Measurements

In this study, measurements were conducted in a quiet underground parking lot on a university campus in a left-hand-drive automobile, with dimensions of 4733 mm × 1839 mm × 1673 mm (length × width × height).
To represent real-life usage scenarios, eight speaker–listener position configurations were chosen for this study, and these can be divided into two groups (Figure 1). Group 1 (see Figure 1a) represents the situations in which the speaker is located in the driver’s seat (D seat) while the listener is seated in one of the four passenger seats, i.e., the front passenger seat (FP seat), back-right seat (BR seat), back-middle seat (BM seat), or back-left seat (BL seat). In each case, both the speaker and listener were facing forward. Group 2 (see Figure 1b) represents situations in which the listener is located in the driver’s seat and facing forward while the speaker is seated in one of the four passenger seats (FP, BR, BM, or BL), with the front of the speaker always facing toward the listener. When the speaker/listener was positioned in the FP seat, they were 0.70 m away from and directly behind the listener/speaker. When the speaker/listener was positioned in the BR seat, the distance between them was 1.15 m, and the angle to the right of the listener/speaker was roughly 53°. When the speaker/listener was positioned in the BM seat, the distance from the speaker to the listener was 0.97 m, and the angle to the right of the listener/speaker was roughly 69°. When the speaker/listener was positioned in the BL seat, which was directly behind the listener/speaker, the distance from the speaker to the listener was 0.85 m.
In practice, the acoustic effects of adding occupants will also be affected by their arrangement [36]; thus, each group included eight occupancy modes that were arranged and combined into eight permutations for no passengers (one case), one passenger (three cases), two passengers (three cases), and three passengers (one case), as listed in Table 1. For instance, when the speaker is located in the driver’s seat and the listener is in the FP seat, there will be eight permutations including situations for no other passengers (None), one other passenger in one of three seats (BR, BM, or BL), two other passengers in two of three seats (BM+BL, BR+BL, or BR+BM), and three other passengers (BR+BM+BL) filling all of the occupiable area. The occupants were recruited from the students at Guangxi University. To simplify the analysis, factors such as each passenger’s body size, height, and clothing were not considered in the present study. Most of the occupants had similar body-shape characteristics, with an average weight of 62 ± 2.9 kg. Each was wearing a thin summer T-shirt.
As noted above, the listener was represented using a dummy head designed to represent the typical physiological characteristics of a Chinese adult male [53]. The speaker used in the measurements was an artificial mouth (GRAS 44AB, GRAS Sound and Vibration, Holte, Denmark), which had dimensions of 0.104 m × 0.104 m × 0.114 m (length × width × height). The artificial mouth was chosen because it had a directivity and radiation pattern that were comparable to those of an average human mouth, and it had an effective frequency range of 100 Hz to 16 kHz. The speaker and the mouth of the dummy head were aligned on a single plane situated at a height of 0.889 m from the floor of the automobile. The ear-canal entrance height of the dummy head was 0.942 m. These values were determined based on measurements of the ear-canal entrance height of a representative group of Chinese males with an average height of 1.7 m.
To prevent extra noise, all the windows and doors of the automobile were closed and the air-conditioning system was switched off during the measurement procedure. The excitation was initiated by employing a logarithmic sweep signal with a sampling frequency of 44.1 kHz and 24-bit quantization. This excitation lasted for a duration of 3 s and covered a frequency range up to 20 kHz. The audio signal was transmitted to the artificial mouth after its conversion from digital to analog format using an audio interface (Roland STUDIO-CAPTURE UA-161, Roland DG Corporation, Hamamatsu, Japan). The binaural signals were captured using a pair of miniature microphones (DPA 4060, DPA Microphones, Kokkedal, Denmark) that were carefully positioned within the blocked entrances of the ear canals for the dummy head. The binaural recordings of the logarithmic sweep signals were processed by deconvolution using the inverse of the original logarithmic sweep signal to acquire BRIRs devoid of noise [54].

2.2. STI Measurements

In the context of the STI, the interference to intelligibility related to a reduction in temporal modulation caused by the transmission system can be represented by the modulation transfer function [52,55]. The modulation transfer function was distributed in 14 modulation frequencies F l , ranging from 0.63 to 12.5 Hz, and seven octave bands, with center frequencies f k ranging from 125 Hz to 8 kHz. To reduce the measurement time and improve repeatability, an indirect single-impulse-response measurement approach was developed by Schroeder [56] and then improved by Rife [57]. In the indirect method, the modulation transfer function m T ( f k , F l ) calculated from the reverberation can be expressed as follows:
m T ( f k , F l ) = 0 h 2 ( f k , t ) exp ( j 2 π F l t ) d t 0 h 2 ( f k , t ) d t ,
where k is the sequence number of the octave band, l is the sequence number of the modulation frequency, and t is time in seconds. The transmission function h ( f k , t ) was obtained from the BRIR h ( t ) through octave filtering at the center frequencies f k .
Because the influence of noise on intelligibility is not normally included in the BRIR, an additional modulation transfer function m N ( f k , F l ) that is independent of the modulation frequency F l was used:
m N ( f k , F l ) = 1 1 + 10 S N R ( f k ) / 10 ,
where S N R ( f k ) is the SNR at the frequency f k of the octave band. Usually, the levels of the noise and speech signal must be measured separately [52]. Binaural speech signals were indirectly obtained by auralization technology [22], and a stationary noise source, specifically pink noise, was taken into consideration as the background noise with the same sound pressure level in each frequency band. First, a pink-noise signal was created, and the spectrum was filtered and adjusted in accordance with GB/T 7347–1987 [58] to generate a monaural speech sample. Next, by convolving the monaural speech sample E 0 with the corresponding BRIRs obtained, as described in Section 2.1, the binaural speech signals were obtained. The SNRs can be indirectly derived for different conditions using the stationary noise and binaural speech signals. Then, S N R ( f k ) was computed as
S N R ( f k ) = 10 lg ( 1 T 0 0 T 0 ( E 0 ( t ) h ( f k , t ) ) 2 d t ) L n o i s e ( f k ) ,
where T 0 is the length of the speech signal and L n o i s e is the sound pressure level of the noise at frequency f k of the octave band. In this way, the combined modulation transfer function m ( f k , F l ) can be calculated as the product of m T ( f k , F l ) and m N ( f k , F l ) . It includes the combined effects of background noise and the transfer function.
The M T F ( f k , F l ) for each condition was produced as a 7 × 14 matrix, which was subsequently transformed into the apparent SNR as follows:
X f k , F l = 10 × log 10 m f k , F l 1 m f k , F l .
After being cropped into the range from 15 to + 15 dB, each apparent SNR will correlate linearly with the STI, which ranges from 0 to 1. Consequently, the transmission index T I f k , F l can be expressed as
T I f k , F l = 0 , if X f k , F l < 15 X f k , F l + 15 30 , 1 , if X f k , F l > 15
which means that if the SNR is less than –15 dB, then the STI in the cabin is deemed absolutely unacceptable, and vice versa. In this way, the modulation transfer index M T I ( f k , F l ) at each octave can be obtained as the average value at different modulation frequencies:
M T I f k = 1 14 l = 1 14 T I f k , F l .
Then, we calculated the overall STI from a weighted sum:
S T I = k = 1 7 λ k M T I f k ,
where λ k are the weighting coefficients for the octave bands from 125 Hz to 8 kHz [52]. STI is essentially a monaural model; according to the IEC 60268-16 standard [52], while conducting binaural STI measurements, it is recommended that the higher value from a pair of STIs for ears (i.e., the best-ear STI) is selected. As such, the best-ear STIs were employed as the binaural STI value.

2.3. Subjective Experiments

An additional set of subjective experiments was conducted to determine the SRTs (i.e., the SNR values required for 50% intelligibility) for various speaker–listener position configurations and occupancy modes. These experiments considered a total of 64 conditions, comprising 8 speaker–listener position configurations with 8 subject-occupancy modes for each (see Table 1).

2.3.1. Participants

Eleven volunteer participants were used for this study: seven males and five females. They were aged between 19 and 25 years, with an average age of 21.5 ± 1.8 years. The Pearson correlation coefficient between the experimental results for Participant #8 and the other participants was less than 0.8; the results from this participant were thus excluded. The participants, who were all Mandarin-speaking Chinese natives with a range of geographic backgrounds, were selected from a group of undergraduate and graduate students at Guangxi University; each self-reported having normal hearing. Certain conversation tests were conducted before the experiment to further ensure that the participants’ listening and language comprehension abilities were normal. Every participant completed the experiment under all the condition permutations, and they all received compensation for their participation.

2.3.2. Stimuli

The Mandarin Chinese matrix sentence test (CMNmatrix) provided the sentences that made up the target speech [59]. Each sentence in the corpus adhered to a predetermined syntactic framework consisting of five words (name-verb-number-adjective-object), such as ‘李锐 (Li Rui) + 借来 (borrowed) + 两个 (Two) + 大号的 (Large) + 茶杯 (Tea Cup)’. This structure is both grammatically accurate and semantically unpredictable. A set of 20-sentence lists was employed, comprising 40 lists overall.
Using auralization technology, the binaural speech signals for various speaker–listener position configurations were obtained by convolving the target speech sample with the relevant BRIR. The interferer was generated from pink noise, and its spectrum was filtered and adjusted by GB/T 7347–1987 [58]. This was decorrelated to eliminate spatial auditory information because the noise field within an automobile is usually considered to be diffuse [4,19]. The localization of the sound source in the center of the head, or the creation of a sound image in front of the listener, occurs when identical signals are sent directly to both ears. Nevertheless, spatial unmasking phenomena may arise due to the interference of spatial auditory information, making it difficult to examine the impact of individual measurements on speech intelligibility alone. As a result, it is imperative to minimize the spatial auditory effects of the interferer. The audio-signal decorrelation method [60,61,62] was used to obtain a decorrelated binaural interferer through the convolution of a single-channel interferer with a pair of reciprocal maximum-length-sequence signals. More information is available in a previous report [25]. For comfort, the interferer’s level was set at near to 60 dB(A) for each ear. Before convolution with a BRIR, the level of the target speech was adjusted to produce different SNR values. The decorrelated binaural interferer was used with the convolved binaural target speech to generate binaural signals.

2.3.3. Procedure

The experiments were carried out in a room with ambient noise levels below 30 dB(A). Using an initial SNR of 10 dB, an adaptive up–down method was employed to measure the SRTs [63]. Here, the SNR represents the difference between the level of the interferer and the level of the target speech before convolution instead of the actual SNR at the listener’s ear. Stimuli were produced using Sennheiser HD650 headphones (Sennheiser Electronics, Wennebostel, Germany) powered by a Roland STUDIO-CAPTURE UA-161 audio interface (Roland DG Corporation, Hamamatsu, Japan). In the closed-set response format assessments, participants were asked to independently mark terms they heard and understood on a MATLAB R2020agraphical user interface.
A total of 64 runs was made for each participant across the 64 test conditions that were considered. Given the number of runs (64) compared to the number of lists (40), certain lists were used twice. This had no impact on the outcomes because the corpus is intended to be semantically surprising and fit for two uses by the listener [59]. The listeners were given random lists and test conditions in different sequences. To minimize listener fatigue, the 64 runs, which lasted 4–5 min each, were split into two sessions spaced at least 12 h apart, with a 15 min break after every eight runs. Each session began with training.

3. Results and Discussion

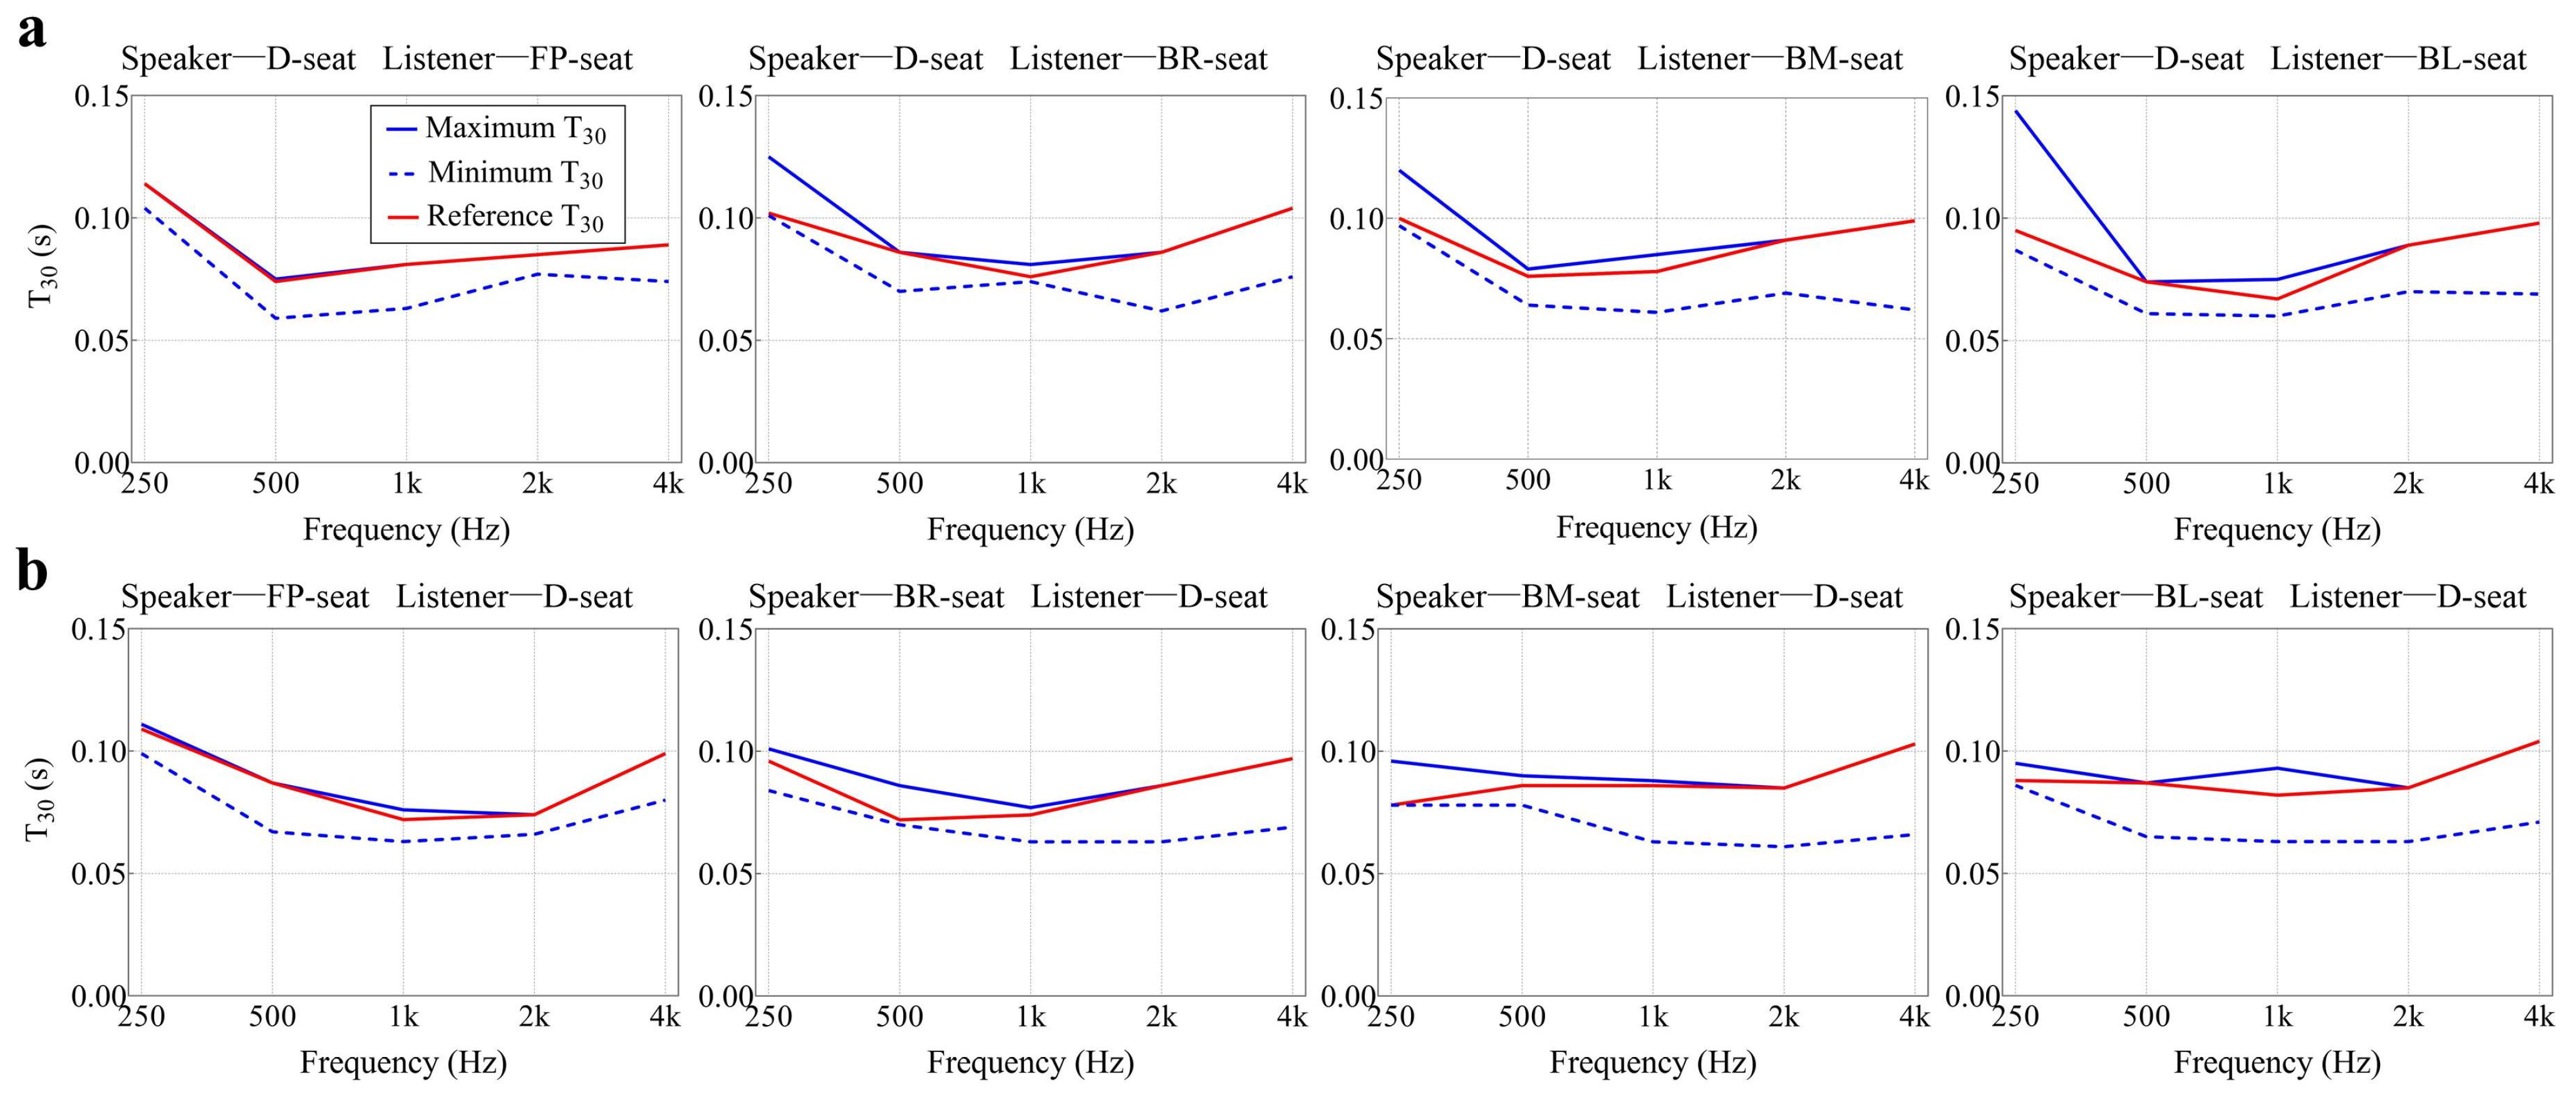
3.1. Effect of Occupants on RT

Previous studies [35,36,43,46] have clearly shown that occupants can provide additional sound absorption to a space, thus reducing its reverberation time; however, this contribution depends strongly on the primitive acoustic conditions of the space, such as the initial amount of sound absorption. To investigate the influence of occupants on the reverberation time inside the automotive cabin, the reverberation times in 250–4000 Hz octave bands under different occupancy modes for eight speaker–listener position configurations were first analyzed. This study employed the T 30 as an indicator of reverberation time, which is twice the duration for the decay curves was from 5 dB to 35 dB below the steady state (or initial) level [64], as shown in Figure 2.
Note that, aside from for the 250–500 Hz octave bands, adding occupants leads to a reduction in the reverberation time value because of the additional sound absorption provided by the occupants (see Figure 2). These trends are mostly consistent with the findings of previous studies [35,38,46,49]. It is worth mentioning that adding occupants produces larger decreases in reverberation time values in the 2 and 4 kHz bands than in the other bands (see Figure 2); this is due to the larger increase in sound absorption provided by occupants in these octave bands [35,38,44]. Furthermore, the reverberation time values in the 250 and 500 Hz octave bands were increased after adding occupants in some cases. Moreover, the reverberation time values in the 250 Hz band were higher than in the higher octave bands for the automotive cabin. These should correspond to the low-frequency modal behavior and the modal reverberation [8]. In practice, increasing the low-frequency reverberation time has been confirmed to be adverse to speech intelligibility [65].
In general, the percentage changes in the reverberation time value after occupants are added are mostly larger than the just-noticeable differences (JND, i.e., 5%) in the reverberation time [64] (aside from some cases in the 250 and 500 Hz octave bands). However, this does not indicate that the addition of occupants will lead to perceptible changes in reverberation because the reverberation time values are already very small (less than 0.15 s). In addition, the variations in reverberation time after adding occupants are much smaller than the results of the existing literature, such as in church [43], theater [34], and classrooms [35]. These confirm what was seen in refs. [35,49,50], that is, the addition of occupants to a more absorptive space leads to smaller incremental changes in the reverberation time.

3.2. Effect of the Occupants on Magnitude Spectrum

There could be considerable variations in the speech levels at different target ears for the various different speaker–listener position configurations and occupancy modes due to the additional sound absorption provided by the occupants. Figure 3 shows the relative magnitudes of the BRIRs for various speaker–listener position configurations and occupancy modes, including the result at both ears. As noted above, the definition of the STI [52] states that the SNR values from 15 to + 15 dB are directly proportional to the STI, which ranges from 0 to 1. The conversion from SNR to STI is linear, meaning that a 3 dB increase in SNR corresponds to a 0.1 rise in STI. The JND of 0.03 for the STI [66] is roughly equivalent to a JND of 0.9 dB for SNR. Table 2 lists the variation ranges in magnitude among different occupancy modes under various speaker–listener position configurations; values greater than 1 JND (0.9 dB) are displayed in bold.
As can be seen in Figure 3b, when the listener is in the driver’s seat and the speaker is in one of the passenger seats, the magnitudes at the right ear are always larger than those at the left ear, especially for the FP seat. It seems that the level at the ipsilateral ear is always larger than that at the contralateral ear, which is in line with expectations based on binaural effects [24]; however, this was not the case when the speaker was located in the driver’s seat (Figure 3a) or BL seat (Figure 3b). This was mainly because, in these cases, due to the directivity of the speaker or the influence of seat occlusion, the direct sound received by both ears was weak and mainly comprises the reflected sound from multiple random directions, so the ipsilateral and contralateral ears defined by the relative direction of the speaker to the listener were meaningless. Conversely, the direct sound was relatively strong when the listener was in the driver’s seat and the speaker was in one of the passenger seats facing toward the listener. It is also worth mentioning that, in all cases, the level at 2 kHz was always underestimated; this was mainly due to the lower-frequency response of the artificial mouth near 2 kHz, which is similar to the characteristic of human voice production, as shown in ref. [26].
As can be seen in Figure 3, the magnitude levels in the 1–8 kHz bands mostly decreased after occupants were added, and these differences were mostly greater than 1 JND (i.e., 0.9 dB), as listed in Table 2. This trend is mostly consistent with the findings in previous studies [35]. However, this was sometimes not the case, such as for lower-frequency bands, which may be influenced by resonance effects in the automotive cabin. Furthermore, the magnitude levels not only varied with the number of occupants, but also with their distribution. The fluctuation in levels across different occupant distributions at a fixed number of occupants appeared to be comparable to the fluctuation across different numbers of occupants. For instance, when the speaker was in the driver’s seat and the listener was in the BM seat (Figure 3a), the level difference between no occupants (None) and one occupant in the FP seat was lower than the differences among one occupant in different passenger seats (FP, BM, and BL). These observed phenomena differed considerably from the results of previous research in traditional indoor environments such as classrooms [36].
There were significant differences in the impact of the occupants on magnitude levels under the different speaker–listener position configurations. When both the speaker and listener were in the front-row seats—i.e., the front-to-front scenarios—the differences in magnitude level caused by the additional occupants were smaller (no more than 1.7 dB) than in other speaker–listener position configurations, especially for the right ear (no more than 1 JND), as listed in Table 2. For the front-to-back scenarios—i.e., the situations in which the speaker was in the driver’s seat and the listener was in a rear-row seat—the differences in magnitude level caused by additional occupants were relatively larger, mostly close to or greater than 2 dB, with values that sometimes even exceeded 7 dB (see Figure 3a and Table 2). In comparison to the front-to-back scenarios, the variation range of the magnitude under different occupancy modes was smaller (mostly no more than 2.5 dB) when the listener was in the driver’s seat and the speaker was in a rear-row seat, i.e., the back-to-front scenarios (see Figure 3b and Table 2). Overall, when the listener was in less favorable acoustic conditions, the addition of occupants had a greater impact on sound levels. This was mainly because when the direct sound received by the listener was weak, the gain of the early reflected sound became more important. The other passengers sitting in the automotive cabin greatly obstructed the propagation of sound, particularly obstructing the sound from reaching strong reflective surfaces (e.g., glass windows) or obstructing the paths for the reflected sound to reach the listener.
Choi [35] reported that, after adding occupants, a larger variation of sound strength G occurs in rooms that are more reflective. Their study reported average decreases in the mean 500–4000 Hz G values by 2.5 dB in the six reflective Classrooms #1 to #6 and by 1.3 dB in the six absorptive Classrooms #7 to #12. However, the magnitude difference in this study was even greater than the results of the six reflective classroom in ref. [35], even though the automotive cabin can be regarded as a very highly absorptive space. This phenomenon was precisely caused by the particularity of the acoustic conditions in the extremely small space of the automotive cabin. The distance between the passenger (occupants) and the interior boundaries of the cabin was particularly short, and the multiple reflections greatly amplified their effect on sound absorption and occlusion.

3.3. Effect of the Occupants on STI Results

Figure 4 gives the STI values for various speaker–listener position configurations and occupancy modes. Note that the values for the front-to-front scenarios are considerably larger (greater than 0.7, in the speech intelligibility rating of “Good”) than for the front-to-back and back-to-front scenarios (less than 0.6, in the speech intelligibility rating of “Fair”). This is mainly due to the combined effects of seat occlusion, binaural effects (i.e., head and ear occlusion), and speaker directivity during front–rear speech transmission [22,32]. When the positions of the listener and speaker are reciprocal, the STI values for the front-to-back scenarios (Figure 4a) are always lower than those for the back-to-front scenarios (Figure 4b); this is mainly due to the weak radiation behind the speaker [32]. It is also worth noting that there is a higher STI for the driver listening to the passenger in the front passenger seat compared to when the positions of the listener and speaker are reciprocal. This is mainly because, in this scenario, the front passenger always faces the driver directly.
As shown in Figure 4a, when the speaker is in the driver’s seat, the STI slightly decreases after adding other occupants, but there is a variation exceeding 1 JND (i.e., 0.03) [66] only when the listener is in the BR or BM seat, and this sometimes reaches 0.07. In other words, when a person in the FP seat or BL seat is listening to the driver, the addition of other passengers will mostly not affect the STI (with a variation of no more than 1 JND); conversely, for a listener in either the BR or BM seat, there could be a perceptible difference after other passengers are added to the automotive cabin. It is worth mentioning that the influence of the occupant in the FP seat on the STI values of the rear-row listeners can always be ignored. When the listener is in the driver’s seat (Figure 4b), the additional occupants will have less of an effect on the STI values than the situation in which the speaker is in the driver’s seat (Figure 4a); the STI differences among various occupancy modes are mostly lower than 1 JND, except for the situation with the speaker in the BL seat and full seat occupation (0.046).
Note that there are small differences in the STI values among different arrangement configurations, and these are sometimes comparable to the differences among the STIs under various numbers of occupants. This indicates that, when considering the influence of occupants within an automobile on its acoustic environment and speech intelligibility, it is insufficient to focus solely on occupancy rates, as was done in a previous study [35]. This is because there are notable variations depending on the specific occupant distribution.
In fact, the STI accounts for both the effects of reverberation and the SNR. On the one hand, the addition of occupants provides additional absorption, thereby slightly reducing the reverberation time and increasing the speech intelligibility (see Figure 2); on the other hand, as the occupancy increases, the SNR value decreases (see Figure 3) and the speech intelligibility thus decreases. Additional occupants also reduce the sound level of the early reflected sounds that are beneficial to speech intelligibility [35]. The trend of the STI decreasing with an increasing number of occupants suggests that, for automotive cabins, the effect of adding occupants on the STI is mainly reflected in the detrimental effect of reducing SNR rather than the beneficial effect of reducing reverberation time; this is because the reverberation is already small enough to be ignored [7,22]. From this perspective, in the design of car interiors, properly arranging internal reflection boundaries to obtain more (early) reflected sounds, rather than simply increasing internal sound absorption, can greatly improve speech intelligibility and is more conducive to obtaining sufficient speech intensity in different scenarios (such as when fully occupied).
Compared to the results of previous studies [35,43], it seems that the STIs in the automotive cabin considered here are less affected by adding occupants. Desarnaulds et al. [43] reported STI increases of 0.050 and 0.035 with or without a public address system, respectively, in six churches, and Choi [35] found an average STI increase of 0.05 for six reflective classrooms and an average STI decrease of 0.02 for six absorptive classrooms. The changes in the STI value after adding occupants in the present study (mostly no more than 0.03) were lower than those found in both of these previous studies. This further validates the understanding that the influence of occupancy on the indoor acoustic environment and speech intelligibility is contingent upon the initial acoustic environment. Nevertheless, since the internal acoustical environment and volume of an automobile cabin are highly dissimilar from those of classrooms and churches, they are actually not comparable. Nonetheless, the quantitative findings derived from the present study can offer specific insights for future investigations of speech intelligibility within automotive cabins.

3.4. Effect of Occupants on Subjective SRT Results

Figure 5 presents the subjective SRT results for various speaker–listener position configurations and occupancy modes, showing the means and 95% confidence intervals. SRT is the SNR value that achieves a 50% intelligibility score; thus, a lower SRT value represents that a lower SNR can achieve sufficient speech intelligibility. In other words, a lower SRT value represents better speech intelligibility performance. For the convenience of comparison with the STI results in Figure 4, Figure 5 uses inverse coordinates for the SRT.
Note that the SRTs with no other passengers always reached minimum values when compared to other occupancy modes (Figure 5), that is, the SRT value increased slightly after additional occupants were added, meaning that the speech intelligibility slightly decreased. However, the differences among various occupancy modes were mostly within 1 dB, except when the speaker was in the driver’s seat and the listener was in the BR seat (reaching 2 dB). Overall, the SRT trend across the various occupancy modes was similar to the STI results. When the listener was in a front-row seat, the differences in SRT among the various occupancy modes were larger than those when the listener was in a rear-row seat. The SRT variations among different occupant distributions were also found to be comparable to those among the different numbers of occupants. These findings are both in line with the STI results.
A repeated-measures analysis of variance with a significance level of 0.05 was performed to examine the effect of occupants on the SRT result for each speaker–listener position configuration. The Geisser–Greenhouse correction was applied to correct the violation of the sphericity assumption. The results indicate that the influence of the occupancy mode on the SRT result was insignificant ( p > 0.3 ), except for the situation in which the speaker or listener were in the BR seat ( p > 0.01 , F = 3.17 ; or p = 0.007 , F = 4.76 ). Post-hoc pairwise comparisons revealed significant differences in the SRT results between “None” and “BM”, “BL”, “BM+BL”, “FP+BM”, or “FP+BM+BL” ( p < 0.05 ) when the listener was in the BR seat and the speaker was in the driver’s seat. There were significant differences between the SRT results for “None” and “FP+BM” ( p < 0.05 ) when the listener was in the driver’s seat and the speaker was in the BR seat. In addition, there were insignificant differences among the various occupancy modes for the other cases.

3.5. Implications and Limitations

This study provides an effective supplement to relevant research in larger enclosed environments. The results about the influence of occupants on the speech intelligibility in automotive cabins also have reference value for aircraft cabins, train cabins, and ship cabins with similar scales. Ensuring good speech intelligibility is important in these spaces because poor speech intelligibility usually represents higher listening effort, which affects the driver’s driving attention and thus affects driving safety. This study emphasizes the effect of occupants in speech intelligibility, which can be combined with appropriate cabin acoustic design and certain noise-canceling technology or speech enhancement algorithms to improve the speech intelligibility inside the cabin to the greatest extent possible.
Some factors that may affect the result were not taken into account in the present study, which are worth further research in the future. First, to simplify the research question, factors such as age, gender, body size, and the clothing of passengers were not taken into account. Second, this paper only selected a typical car cabin, but different types of car designs, interior materials, and sizes may lead to certain differences in results. Also, this paper did not consider the interaction between passengers and the actual background noise in the car even though passengers (or occupants) also have an absorption effect on the background noise, just like speech sound. Moreover, this was only an experimental study, and the mechanism of the influence of occupants on the small-space sound fields in automotive cabins deserves further in-depth analysis. For example, the effects of occupants on the sound propagation and low-frequency resonance modes in the automotive cabin could be examined in detail.

4. Conclusions

This study performed an experimental study of the effect of the occupants in an automotive cabin on speech intelligibility under different speaker–listener position configurations and occupancy rates. It was found that adding occupants to the automotive cabin leads to a slight reduction in the reverberation time and magnitude level due to the additional sound absorption they provide. However, the addition of occupants could not lead to perceptible changes in reverberation because the reverberation time values were already very small. The speech transmission index (STI) slightly decreased after adding occupants, but the variation among various occupancy modes was mostly no more than one just-noticeable difference (0.03). Nonetheless, the rear-row occupants had a considerable effect on the STIs for a listener in the back-right seat, with a variation up to 0.07. In addition, the influence of front-row passengers on the STI of rear-row listeners was extremely small, and vice versa. It is also worth noting that, due to the speaker orientation and directivity pattern, there was a higher STI for the driver listening to the passenger in the front passenger seat compared to when the positions of the listener and speaker were reciprocal. The findings also show that the distribution of the occupants had an effect comparable to the number of occupants. Subjective experiments further confirmed these findings, and the speech–reception threshold differences among the various occupancy modes were found to be mostly within 1 dB, except when the speaker was in the driver’s seat and the listener was in the back-right seat (reaching 2 dB).

Author Contributions

Conceptualization, L.L. (Linda Liang), M.R., L.L. (Linghui Liao), W.X. and L.O.; methodology, L.L. (Linda Liang) and M.R.; software, L.L. (Linda Liang); validation, L.L. (Linda Liang) and L.O.; formal analysis, M.R., L.L. (Linghui Liao) and L.O.; investigation, M.R., L.L. (Linghui Liao) and L.O.; resources, L.L. (Linda Liang); data curation, L.L. (Linda Liang), M.R. and L.L. (Linghui Liao); writing—original draft preparation, L.L. (Linda Liang) and M.R.; writing—review and editing, L.L. (Linda Liang) and W.X.; visualization, L.L. (Linda Liang); supervision, L.L. (Linda Liang), Y.Z. and W.X.; project administration, L.L. (Linda Liang) and W.X.; funding acquisition, L.L. (Linda Liang). All authors have read and agreed to the published version of the manuscript.

Funding

This research was funded by the Middle-aged and Young Teachers’ Basic Ability Promotion Project of Guangxi (Grant No. 2024KY0028).

Institutional Review Board Statement

This study was conducted in accordance with the guidelines detailed in the Declaration of Helsinki, and it was approved by the Medical Ethics Committee of Guangxi University (reference number: GXU-2024-043; date of approval: 14 May 2024).

Informed Consent Statement

Informed consent was obtained from all the subjects involved in this study.

Data Availability Statement

The original contributions presented in this study are included in the article, and further inquiries can be directed to the corresponding authors.

Acknowledgments

The authors are grateful to all of the participants for their patience and cooperation during this study.

Conflicts of Interest

The authors declare no conflicts of interest.

Abbreviations

The following abbreviations are used in this manuscript:
STISpeech Transmission Index
SRTSpeech–Reception Threshold
JNDJust-Noticeable Difference
BRIRBinaural Room Impulse Response
SNRSignal-to-Noise Ratio
FP-seatFront Passenger Seat
BR-seatBack-Right Seat
BM-seatBack-Middle Seat
BL-seatBack-Left Seat

References

  1. Goujard, B.; Sakout, A.; Valeau, V. Acoustic comfort on board ships: An evaluation based on a questionnaire. Appl. Acoust. 2005, 66, 1063–1073. [Google Scholar] [CrossRef]
  2. Kanka, S.; Fredianelli, L.; Artuso, F.; Fidecaro, F.; Licitra, G. Evaluation of Acoustic Comfort and Sound Energy Transmission in a Yacht. Energies 2023, 16, 808. [Google Scholar] [CrossRef]
  3. Borelli, D.; Gaggero, T.; Rizzuto, E.; Schenone, C. Onboard ship noise: Acoustic comfort in cabins. Appl. Acoust. 2021, 177, 107912. [Google Scholar] [CrossRef]
  4. Parizet, E. Speech intelligibility mappings in a car compartment. Int. J. Veh. Des. 1993, 14, 132–144. [Google Scholar]
  5. Peng, J.X.; Bei, C.; Sun, H. Relationship between chinese speech intelligibility and speech transmission index in rooms based on auralization. Speech Commun. 2011, 53, 986–990. [Google Scholar] [CrossRef]
  6. Bradley, J.; Sato, H.; Picard, M. On the importance of early reflections for speech in rooms. J. Acoust. Soc. Am. 2003, 113, 3233–3244. [Google Scholar] [CrossRef] [PubMed]
  7. Granier, E.; Dalenback, B.I.; Svensson, P.; Kleiner, B. Experimental auralization of car audio installations. J. Audio Eng. Soc. 1996, 44, 835–849. Available online: http://www.aes.org/e-lib/browse.cfm?elib=7882 (accessed on 1 October 1996).
  8. Meissner, M. Acoustics of small rectangular rooms: Analytical and numerical determination of reverberation parameters. Appl. Acoust. 2017, 120, 111–119. [Google Scholar] [CrossRef]
  9. Rumsey, F. Automotive audio: They know where you sit. J. Audio Eng. Soc. 2016, 64, 705–708. Available online: http://www.aes.org/e-lib/browse.cfm?elib=18378 (accessed on 19 September 2016).
  10. Kleiner, M.; Tichy, J. Acoustics of Small Rooms, 1st ed.; CRC Applied Mathematics Research Press: Boca Raton, FL, USA, 2014. [Google Scholar]
  11. Arweiler, I.; Buchholz, J.M. The influence of spectral characteristics of early reflections on speech intelligibility. J. Acoust. Soc. Am. 2011, 130, 996–1005. [Google Scholar] [CrossRef]
  12. Warzybok, A.; Rennies, J.; Brand, T.; Doclo, S.; Kollmeier, B. Effects of spatial and temporal integration of a single early reflection on speech intelligibility. J. Acoust. Soc. Am. 2013, 133, 269–282. [Google Scholar] [CrossRef] [PubMed]
  13. Ebbitt, G.L.; Remtema, T.M. Automotive speech intelligibility measurements. Sound Vib. 2017, 51, 6–11. [Google Scholar] [CrossRef]
  14. Herrera, C.; Donoso-Garcia, P.; Medeiros, E. Intelligibility in low-cost automotive audio systems. J. Audio Eng. Soc. 2016, 64, 320–331. [Google Scholar] [CrossRef]
  15. Samardzic, N.; Novak, C. In-vehicle speech intelligibility for different driving conditions using the speech transmission index. Noise Control Eng. J. 2011, 59, 397–407. [Google Scholar] [CrossRef]
  16. Samardzic, N.; Novak, C. In-vehicle application of common speech intelligibility metrics. Int. J. Veh. Noise Vib. 2011, 7, 328–346. [Google Scholar] [CrossRef]
  17. Parizet, E. The influence of speech importance function upon articulation index computation in cars. Noise Control Eng. J. 1992, 38, 73–79. [Google Scholar] [CrossRef]
  18. Wang, D.; Tan, G.; Chen, S.; Jiang, J.; Su, L. Research on speech intelligibility of sound field inside passenger car. Adv. Mater. Res. 2012, 403, 5214–5219. [Google Scholar]
  19. Dal-Degan, N.; Prati, C. Acoustic noise analysis and speech enhancement techniques for mobile radio applications. Signal Process. 1988, 15, 43–56. [Google Scholar] [CrossRef]
  20. Qatu, M.; Abdelhamid, M.; Pang, J.; Sheng, G. Overview of automotive noise and vibration. Int. J. Veh. Noise Vib. 2009, 5, 1–35. [Google Scholar] [CrossRef]
  21. Visintainer, A.; VanBuskirk, J. Effects of sound absorption on speech intelligibility in an automotive environment. In Proceedings of the Noise and Vibration Conference, Traverse City, MI, USA, 20 May 1997. [Google Scholar]
  22. Liang, L.D.; Yu, L.; Zhao, T.; Meng, Q.L.; Yu, G.Z. Speech intelligibility for various head orientations of a listener in an automobile using the speech transmission index. J. Acoust. Soc. Am. 2021, 149, 2686–2697. [Google Scholar] [CrossRef]
  23. Liang, L.D.; Yu, G.Z.; Zhou, H.L.; Meng, Q.L. Effect of listener head orientation on speech reception threshold in an automotive environment. Appl. Acoust. 2022, 193, 108782. [Google Scholar] [CrossRef]
  24. Liang, L.D.; Yu, G.Z. Binaural speech transmission index with spatialized virtual speaker in near field: Distance and direction dependence. J. Acoust. Soc. Am. 2020, 148, EL202–EL207. [Google Scholar] [CrossRef]
  25. Liang, L.D.; Yu, G.Z. Azimuth-dependent model of binaural speech transmission index based on near-field head-related transfer functions. Appl. Acoust. 2022, 195, 10855. [Google Scholar] [CrossRef]
  26. Liang, L.D.; Yu, G.Z. The combined effect of source directivity and binaural listening on near-field binaural speech transmission index evaluation. Appl. Acoust. 2023, 203, 109198. [Google Scholar] [CrossRef]
  27. Liang, L.D.; Yu, G.Z. Effect of speaker orientation on speech intelligibility in an automotive environment. Appl. Acoust. 2023, 205, 109269. [Google Scholar] [CrossRef]
  28. Bilzi, P.; Bozzoli, F.; Farina, A. Influence of artificial mouth’s directivity in determining speech transmission index. In Proceedings of the 119th Audio Engineering Society Convention, New York, NY, USA, 7–10 October 2005. [Google Scholar]
  29. Peng, J.X.; Wang, T.; Wu, S.X. Investigation on the effects of source directivity of chinese speech intelligibility in real and virtual rooms. Appl. Acoust. 2013, 74, 1037–1043. [Google Scholar] [CrossRef]
  30. Zhu, P.S.; Mo, F.S.; Kang, J. Influence of sound source characteristics in determining objective speech intelligibility metrics. Appl. Acoust. 2015, 89, 188–198. [Google Scholar] [CrossRef]
  31. Van Wijngaarden, S.J.; Drullman, R. Binaural intelligibility prediction based on the speech transmission index. J. Acoust. Soc. Am. 2008, 123, 4514–4523. [Google Scholar] [CrossRef]
  32. Liang, L.D.; Ren, M. The effect of listener head orientation on front-to-rear speech intelligibility in an automotive cabin. Appl. Acoust. 2023, 211, 109517. [Google Scholar] [CrossRef]
  33. Martellotta, F.; D’alba, M.; Crociata, S.D. Laboratory measurement of sound absorption of occupied pews and standing audiences. Appl. Acoust. 2011, 72, 341–349. [Google Scholar] [CrossRef]
  34. Choi, Y.J. Modeling chairs and occupants to closely approximate the sound absorption of occupied full scale theatre chairs. Appl. Acoust. 2014, 75, 52–58. [Google Scholar] [CrossRef]
  35. Choi, Y.J. Effect of occupancy on acoustical conditions in university classrooms. Appl. Acoust. 2016, 114, 36–43. [Google Scholar] [CrossRef]
  36. Choi, Y.J. Effects of the distribution of occupants in partially occupied classrooms. Appl. Acoust. 2018, 140, 1–12. [Google Scholar] [CrossRef]
  37. Martellotta, F.; Crociata, S.D.; D’Alba, M. On site validation of sound absorption measurements of occupied pews. Appl. Acoust. 2011, 72, 923–933. [Google Scholar] [CrossRef]
  38. Sato, H.; Bradley, J.S. Evaluation of acoustical conditions for speech communication in working elementary school classrooms. J. Acoust. Soc. Am. 2008, 123, 2064–2077. [Google Scholar] [CrossRef]
  39. Kath, U. The influence of clothes on the sound absorption of single persons. Acta Acust. United Acust. 1966, 17, 234–237. [Google Scholar]
  40. Bradley, J.S. The sound absorption of occupied auditorium seating. J. Acoust. Soc. Am. 1996, 99, 990–995. [Google Scholar] [CrossRef]
  41. Bradley, J.S.; Choi, Y.J.; Jeong, D.U. Understanding chair absorption characteristics using the perimeter-to-area method. Appl. Acoust. 2013, 74, 1060–1068. [Google Scholar] [CrossRef]
  42. Choi, Y.J.; Bradley, J.S.; Jeong, D.U. Towards better predictions of theatre chair absorption using the perimeter-to-area method. Appl. Acoust. 2014, 76, 119–127. [Google Scholar] [CrossRef]
  43. Desarnaulds, V.; Carvalho, A.P.; Monay, G. Church acoustics and the influence of occupancy. Build. Acoust. 2002, 9, 29–47. [Google Scholar] [CrossRef]
  44. Hodgson, M. Experimental investigation of the acoustical characteristics of university classrooms. J. Acoust. Soc. Am. 1999, 106, 1810–1819. [Google Scholar] [CrossRef]
  45. Bradley, J.S. Some further investigations of the seat dip effect. J. Acoust. Soc. Am. 1991, 90, 324–333. [Google Scholar] [CrossRef]
  46. Hodgson, M. Rating, ranking, and understanding acoustical quality in university classrooms. J. Acoust. Soc. Am. 2002, 112, 568–575. [Google Scholar] [CrossRef] [PubMed]
  47. Hodgson, M.; Nosal, E. Effect of noise and occupancy on optimal reverberation times for speech intelligibility in classrooms. J. Acoust. Soc. Am. 2002, 111, 931–939. [Google Scholar] [CrossRef]
  48. Alvarez-Morales, L.; Martellotta, F. A geometrical acoustic simulation of the effect of occupancy and source position in historical churches. Appl. Acoust. 2015, 91, 47–58. [Google Scholar] [CrossRef]
  49. Choi, Y.J.; Bradley, J.S. Effects of varied row spacing and adding cushions, carpet and occupants on pew sound absorption. Appl. Acoust. 2015, 99, 110–117. [Google Scholar] [CrossRef]
  50. Choi, Y.J.; Bradley, J.S.; Jeong, D.U. Experimental investigation of chair type, row spacing, occupants, and carpet on theatre chair absorption. J. Acoust. Soc. Am. 2015, 137, 105–116. [Google Scholar] [CrossRef]
  51. Speech Intelligibility Measurement Kit. 2022. Available online: https://bedrock-usa.com/speech-intelligibility-measurement-kit/ (accessed on 1 January 2022).
  52. IEC 60268-16; Sound System Equipment. Part 16: Objective Rating of Speech Intelligibility by Speech Transmission Index. International Electrotechnical Commission: Geneva, Switzerland, 2011.
  53. GB/T23461-2009; 3D Dimensions of Male Adult Head Forms. Echnical Report. National Standard of China: Beijing, China, 2009.
  54. Majdak, P.; Balazs, P.; Labac, B. Multiple exponential sweep method for fast measurement of head related transfer functions. J. Audio Eng. Soc. 2007, 55, 632–646. [Google Scholar]
  55. Houtgast, T.; Steeneken, H.; Plomp, R. Predicting speech intelligibility in rooms from the modulation transfer function.III. general room acoustics. Acta Acust. United Acust. 1980, 46, 60–72. [Google Scholar] [CrossRef]
  56. Schroeder, M.R. Modulation transfer functions: Definition and measurement. Acta Acust. United Acust. 1981, 49, 179–182. [Google Scholar] [CrossRef]
  57. Rife, D. Modulation transfer function measurement with maximum length sequences. J. Audio Eng. Soc. 1992, 40, 779–790. [Google Scholar] [CrossRef]
  58. GB/T 7347-1987; The Standard Spectrum of Chinese Speech. National Standard of China: Beijing, China, 1987.
  59. Hu, H.; Xi, X.; Wong, L.L.; Hochmuth, S.; Warzybok, A.; Kollmeier, B. Construction and evaluation of the mandarin chinese matrix (CMNmatrix) sentence test for the assessment of speech recognition in noise. Int. J. Audiol. 2018, 57, 838–850. [Google Scholar] [CrossRef]
  60. Kendall, G.S. The decorrelation of audio signals and its impact on spatial imagery. Comput. Music J. 1995, 19, 71–87. [Google Scholar] [CrossRef]
  61. Xie, B.S.; Shi, B.; Xiang, N. Audio signal decorrelation based on reciprocal-maximal length sequence filters and its applications to spatial sound. In Proceedings of the Audio Engineering Society Convention, San Francisco, CA, USA, 6 October 2012. [Google Scholar]
  62. Xiang, N.; Schroeder, M.R. Reciprocal maximum-length sequence pairs for acoustical dual source measurements. J. Acoust. Soc. Am. 2003, 113, 2754–2761. [Google Scholar] [CrossRef] [PubMed]
  63. Brand, T.; Kollmeier, B. Efficient adaptive procedures for threshold and concurrent slope estimates for psychophysics and speech intelligibility tests. J. Acoust. Soc. Am. 2002, 111, 2801–2810. [Google Scholar] [CrossRef] [PubMed]
  64. ISO3382-1; Acoustics–Measurement of the Reverberation Time–Part 1: Performance Spaces. International Organization for Standardization: Geneva, Switzerland, 2009.
  65. Xu, S.H.; Peng, J.X.; Xiao, Y.; Huang, W.Q. The effect of low frequency reverberation on Chinese speech intelligibility in two classrooms. Appl. Acoust. 2021, 182, 108241. [Google Scholar] [CrossRef]
  66. Bradley, J.S.; Reich, R.; Norcross, S.G. A just noticeable difference in C50 for speech. Appl. Acoust. 1999, 58, 99–108. [Google Scholar] [CrossRef]
Figure 1. Schematic diagramsof the experimental setup in the automotive cabin. There were eight speaker–listener position configurations, and these were divided into two groups: (a) Group 1 represents situations in which the speaker is in the driver’s seat; (b) Group 2 represents situations in which the listener is in the driver’s seat. Each group contains eight occupancy modes, and these are arranged and combined into situations for no passengers (one case), one passenger (three cases), two passengers (three cases), and three passengers (one case).
Applsci 14 07942 g001
Figure 2. Reverberation times ( T 30 ) in the 250–4000 Hz octave bands for various speaker–listener position configurations and occupancy modes ((a) represents situations in which the speaker is in the driver’s seat; (b) represents situations in which the listener is in the driver’s seat), including the maximum and minimum T 30 values, as well as the reference T 30 value with no other passengers.
Applsci 14 07942 g002
Figure 3. Relative magnitudes of the BRIRs for various speaker–listener position configurations and occupancy modes ((a) represents situations in which the speaker is in the driver’s seat; (b) represents situations in which the listener is in the driver’s seat), including the results at each ear. The results for the left and right ears are denoted by dashed and solid lines, respectively. The inset diagram in each panel shows the positional relationship between the speaker and the listener.
Applsci 14 07942 g003
Figure 4. STIs for various speaker–listener position configurations and occupancy modes ((a) represents situations in which the speaker is in the driver’s seat; (b) represents situations in which the listener is in the driver’s seat). The inset diagram in each panel shows the positional relationship between the speaker and the listener, which is represented by a red pattern. The range of ± 1 JND ( ± 0.03 ) is marked as a light red area in the figure referring to the result of “None” (red solid line).
Applsci 14 07942 g004
Figure 5. Subjective SRT results for various speaker–listener position configurations and occupancy modes, showing the means and 95% confidence intervals. The abbreviation “ns” denotes insignificant pairwise comparisons ( p > 0.05 ), and ‘*’, ‘**’, and ‘***’ represent significant pairwise comparisons with p < 0.05 , p < 0.01 , and p < 0.001 , respectively.
Applsci 14 07942 g005
Table 1. Experimental setup for the speaker and listener locations showing the occupancy modes for Groups 1 and 2.
Group 1
SpeakerListenerOccupancy Modes
D seatFP seatNoneBRBMBLBM+BLBR+BLBR+BMBR+BM+BL
D seatBR seatNoneFPBMBLBM+BLFP+BLFP+BMFP+BM+BL
D seatBM seatNoneFPBRBLBR+BLFP+BLFP+BMFP+BM+BL
D seatBL seatNoneFPBRBMBR+BMFP+BMFP+BRFP+BR+BM
Group 2
SpeakerListenerOccupancy modes
FP seatD seatNoneBRBMBLBM+BLBR+BLBR+BMBR+BM+BL
BR seatD seatNoneFPBMBLBM+BLFP+BLFP+BMFP+BM+BL
BM seatD seatNoneFPBRBLBR+BLFP+BLFP+BMFP+BM+BL
BL seatD seatNoneFPBRBMBR+BMFP+BMFP+BRFP+BR+BM
Table 2. Variation ranges in magnitude among the different occupancy modes under various speaker–listener position configurations.
SpeakerListenerVariation Range in Magnitude (dB)
125 Hz250 Hz500 Hz1 kHz2 kHz4 kHz8 kHz
D seatFP seatLeft0.491.681.410.900.540.600.91
Right0.550.730.680.880.740.390.41
BR seatLeft2.150.881.090.671.954.927.46
Right2.200.772.882.212.001.871.48
BM seatLeft1.630.961.753.210.862.093.35
Right2.622.961.831.952.293.902.86
BL seatLeft1.136.915.232.002.011.651.50
Right4.9010.803.531.862.791.884.05
FP seatD seatLeft0.640.731.531.001.080.400.49
Right0.830.370.640.570.520.320.35
BR seatLeft2.091.121.411.512.020.960.88
Right1.471.390.842.390.501.071.48
BM seatLeft1.331.281.161.930.740.551.09
Right1.191.171.001.520.851.670.71
BL seatLeft0.340.880.531.350.920.640.57
Right0.671.232.042.430.922.641.50
Note: Values greater than 1 JND (0.9 dB) are displayed in bold.
Disclaimer/Publisher’s Note: The statements, opinions and data contained in all publications are solely those of the individual author(s) and contributor(s) and not of MDPI and/or the editor(s). MDPI and/or the editor(s) disclaim responsibility for any injury to people or property resulting from any ideas, methods, instructions or products referred to in the content.

