Abstract
The Plasma Electrolytic Oxidation (PEO) process was investigated to enhance the adhesion of AA2024-O aluminum alloy with a polyetherimide (PEI) matrix composite, using oxy-fuel welding (OFW). A Central Composite Design (CCD) statistical model was used to optimize three independent parameters in PEO: immersion time (s), duty cycle (%), and electrolyte concentration (Na2B4O7·10H2O), aiming to achieve a maximum value of shear strength of the hybrid joint (in MPa). The hybrid joint without PEO treatment presented a resistance of 2.2 MPa while the best condition presented a resistance of 9.5 MPa, resulting in a value 4× higher than the untreated material, due to the characteristics of the coating, which presented a more hydrophilic surface, allowing better mechanical interlocking with the polymer matrix and resulting in mixed-mode failure (adhesive, cohesive, and light fiber). In addition to improving adhesion, the PEO treatment provided better corrosion resistance to the alloy, forming an inert aluminum oxide (Al2O3) coating, with an improvement of approximately 99.84% compared to the untreated alloy. The statistical design covers about 77.15% of the total variability of the PEO + welding process, with independent factors influencing around 48.4% of the variability.
1. Introduction
Hybrid structures are increasing in the automotive, aerospace, and naval industries, especially when these vehicles are electric or hybrid, making energy efficiency crucial for cost savings. When it is necessary to join components of different materials, adhesive bonding is the primary method employed [1]. It ensures good mechanical strength, mitigates stress concentrations, and offers better corrosion resistance properties [2].
When these materials are metallic alloys, they need to undergo surface treatments to enhance their corrosion resistance and increase their surface area, developing mechanical anchorage sites. In the case of aluminum alloys, the primary treatment used is anodization, which creates a thin alumina (Al2O3) oxide layer on the order of micrometers. This improves corrosion resistance in environments rich in Cl− ions and provides a certain degree of affinity with some adhesives [2,3].
The anodization process has several disadvantages, such as the use of extremely acidic electrolytes, high sensitivity to the chemical composition and surface condition of the substrate, and significant environmental and health risks [4]. Should the by-products from the anodizing procedure be indiscriminately released into the sewage infrastructure, it has the potential to instigate eutrophication, a phenomenon that ought to be meticulously circumvented. It is imperative to implement post-treatment protocols for the resultant effluents to avert this issue, which consequently incurs supplementary expenditures associated with transportation and treatment, and amplifies bureaucratic processes due to regulatory compliance [5,6,7].
To mitigate the environmental repercussions associated with the acidic anodization process, an electrochemical methodology predicated on anodization but utilizing elevated voltage levels (ranging from 100 to 700 V) was conceived in the 1970s. This advancement facilitated the implementation of more ecologically sustainable solutions, including those derived from silicates, aluminates, and borates, among various others. Referred to as Plasma Electrolytic Oxidation (PEO) or Micro-Arc Oxidation (MAO), this methodology is esteemed for its advantageous properties, which encompass elevated productivity, the utilization of benign and environmentally responsible alkaline electrolytes, enhanced hardness attributed to localized temperature surges that may attain levels of up to 25,000 K, and improved corrosion resistance resultant from the formation of a compact layer adjacent to the substrate. Furthermore, it affords an exceptional adhesion of the coating to the substrate [2,8].
Although PEO is a highly innovative and effective process, it consumes a significant amount of energy. To initiate the ionization process of gasses, present in the microbubbles near the substrate, voltages start at 100 V–120 V and reach final potentials around 400 V–450 V. This makes the process economically unfeasible for some companies compared to conventional methods with cheaper post-treatment [9,10,11,12,13,14].
In the literature, studies focus on optimizing the physical and chemical characteristics of oxide coatings. Bajat et al. [15] investigated the time optimization of the PEO process to stabilize corrosion in aluminum alloys. Coto et al. [16] optimized the PEO process on CP Grade 1 titanium sheets to improve photocatalytic properties. However, it is observed that there are few studies in the literature that aim to optimize surface properties using electrolytic plasma in light alloys, such as aluminum for applications in hybrid structures.
Recognizing the need to optimize adhesion between dissimilar materials, this study employs a Central Composite Design (CCD) factorial design to optimize three PEO process parameters: immersion time (X1), duty cycle (X2), and the electrolyte concentration of sodium tetraborate Na2B4O7·10H2O (X3). This process is then applied to the AA2024-O aluminum alloy to improve adhesion to the PEI/fiberglass composite material, using oxyacetylene welding (OFW), thus creating a type of adhesive bond without the need for external adhesive, using only the thermoplastic composite’s matrix.
2. Materials and Methods
2.1. PEI/Glass Fiber Laminate
The laminate used in this study was obtained from Toray Advanced Composites (Nijverdal, The Netherlands). Its polymer matrix is TC1000, reinforced with glass fiber (50% by volume). Widely used in the manufacturing of aerospace structures, such as seat shells, duct channels, rail interiors, and face sheets for structural sandwich panels, PEI/fiberglass laminate is characterized by its relatively high glass transition temperature (Tg) of approximately 217 °C (polymer matrix—according to ASTM D3418 [17] and D3878 [18]), degradation temperature of around 460 °C, and good mechanical strength (516 MPa).
2.2. Aluminum Alloy 2024
In this study, the AA2024-O alloy (Al-Cu) was used, with a chemical composition according to the supplier presented in Table 1.

Table 1.
Chemical composition of the AA2024 alloy, according to the supplier.
It has broad applicability in the aerospace industry, particularly in the production of structures such as fuselages, where the requirement for damage resistance is higher [19].
In this study, samples were prepared with dimensions of 100 × 25 × 2.5 mm, following ASTM D1002:19 standards [20], as shown in Figure 1. After cutting the samples, the aluminum was sanded with sandpaper to homogenize the surface up to 100# mesh, cleaned with a neutral detergent solution in an ultrasonic bath (900 s), then rinsed with isopropyl alcohol (99%), dried with a hot air blower, and stored on soft paper until treatment. A small area of 25 × 25 mm on the aluminum was designated for PEO treatment.
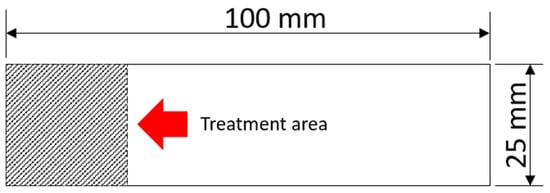
Figure 1.
AA2024 sample with the description of the region treated with PEO.
2.3. Experimental Design
For this study, a Central Composite Design (CCD) with k factors (where k = 3 factors) was employed, including immersion time (s), duty cycle (%), and electrolyte concentration (g/L). Such an experimental design involves a factorial layout among the variables, incorporating central points “0” and axial points “α” (Table 2), which aid in predicting the response surface behavior.
Table 2.
PEO variables.
From the data presented in Table 2, 17 experimental patterns were generated, which are a set of parameters (time, duty cycle, and concentration) and each pattern was repeated 5 times, meeting the ASTM D1002:19 standard. For statistical analysis, the Minitab 17.1.0 software was used. Analysis of variance (ANOVA) was conducted in this study to ensure process reliability and to assess the significance of each parameter on the response variable “y” (lap shear strength, MPa), calculated from Equation (1). The coefficient of determination (R2) was also assessed to quantify the total variability and determine the proportion explained by the model.
where τ: joint shear strength (in MPa); Fmáx: maximum force recorded before joint fracture (in N); and A: welded area of the structure (in mm2).
2.4. PEO Treatment
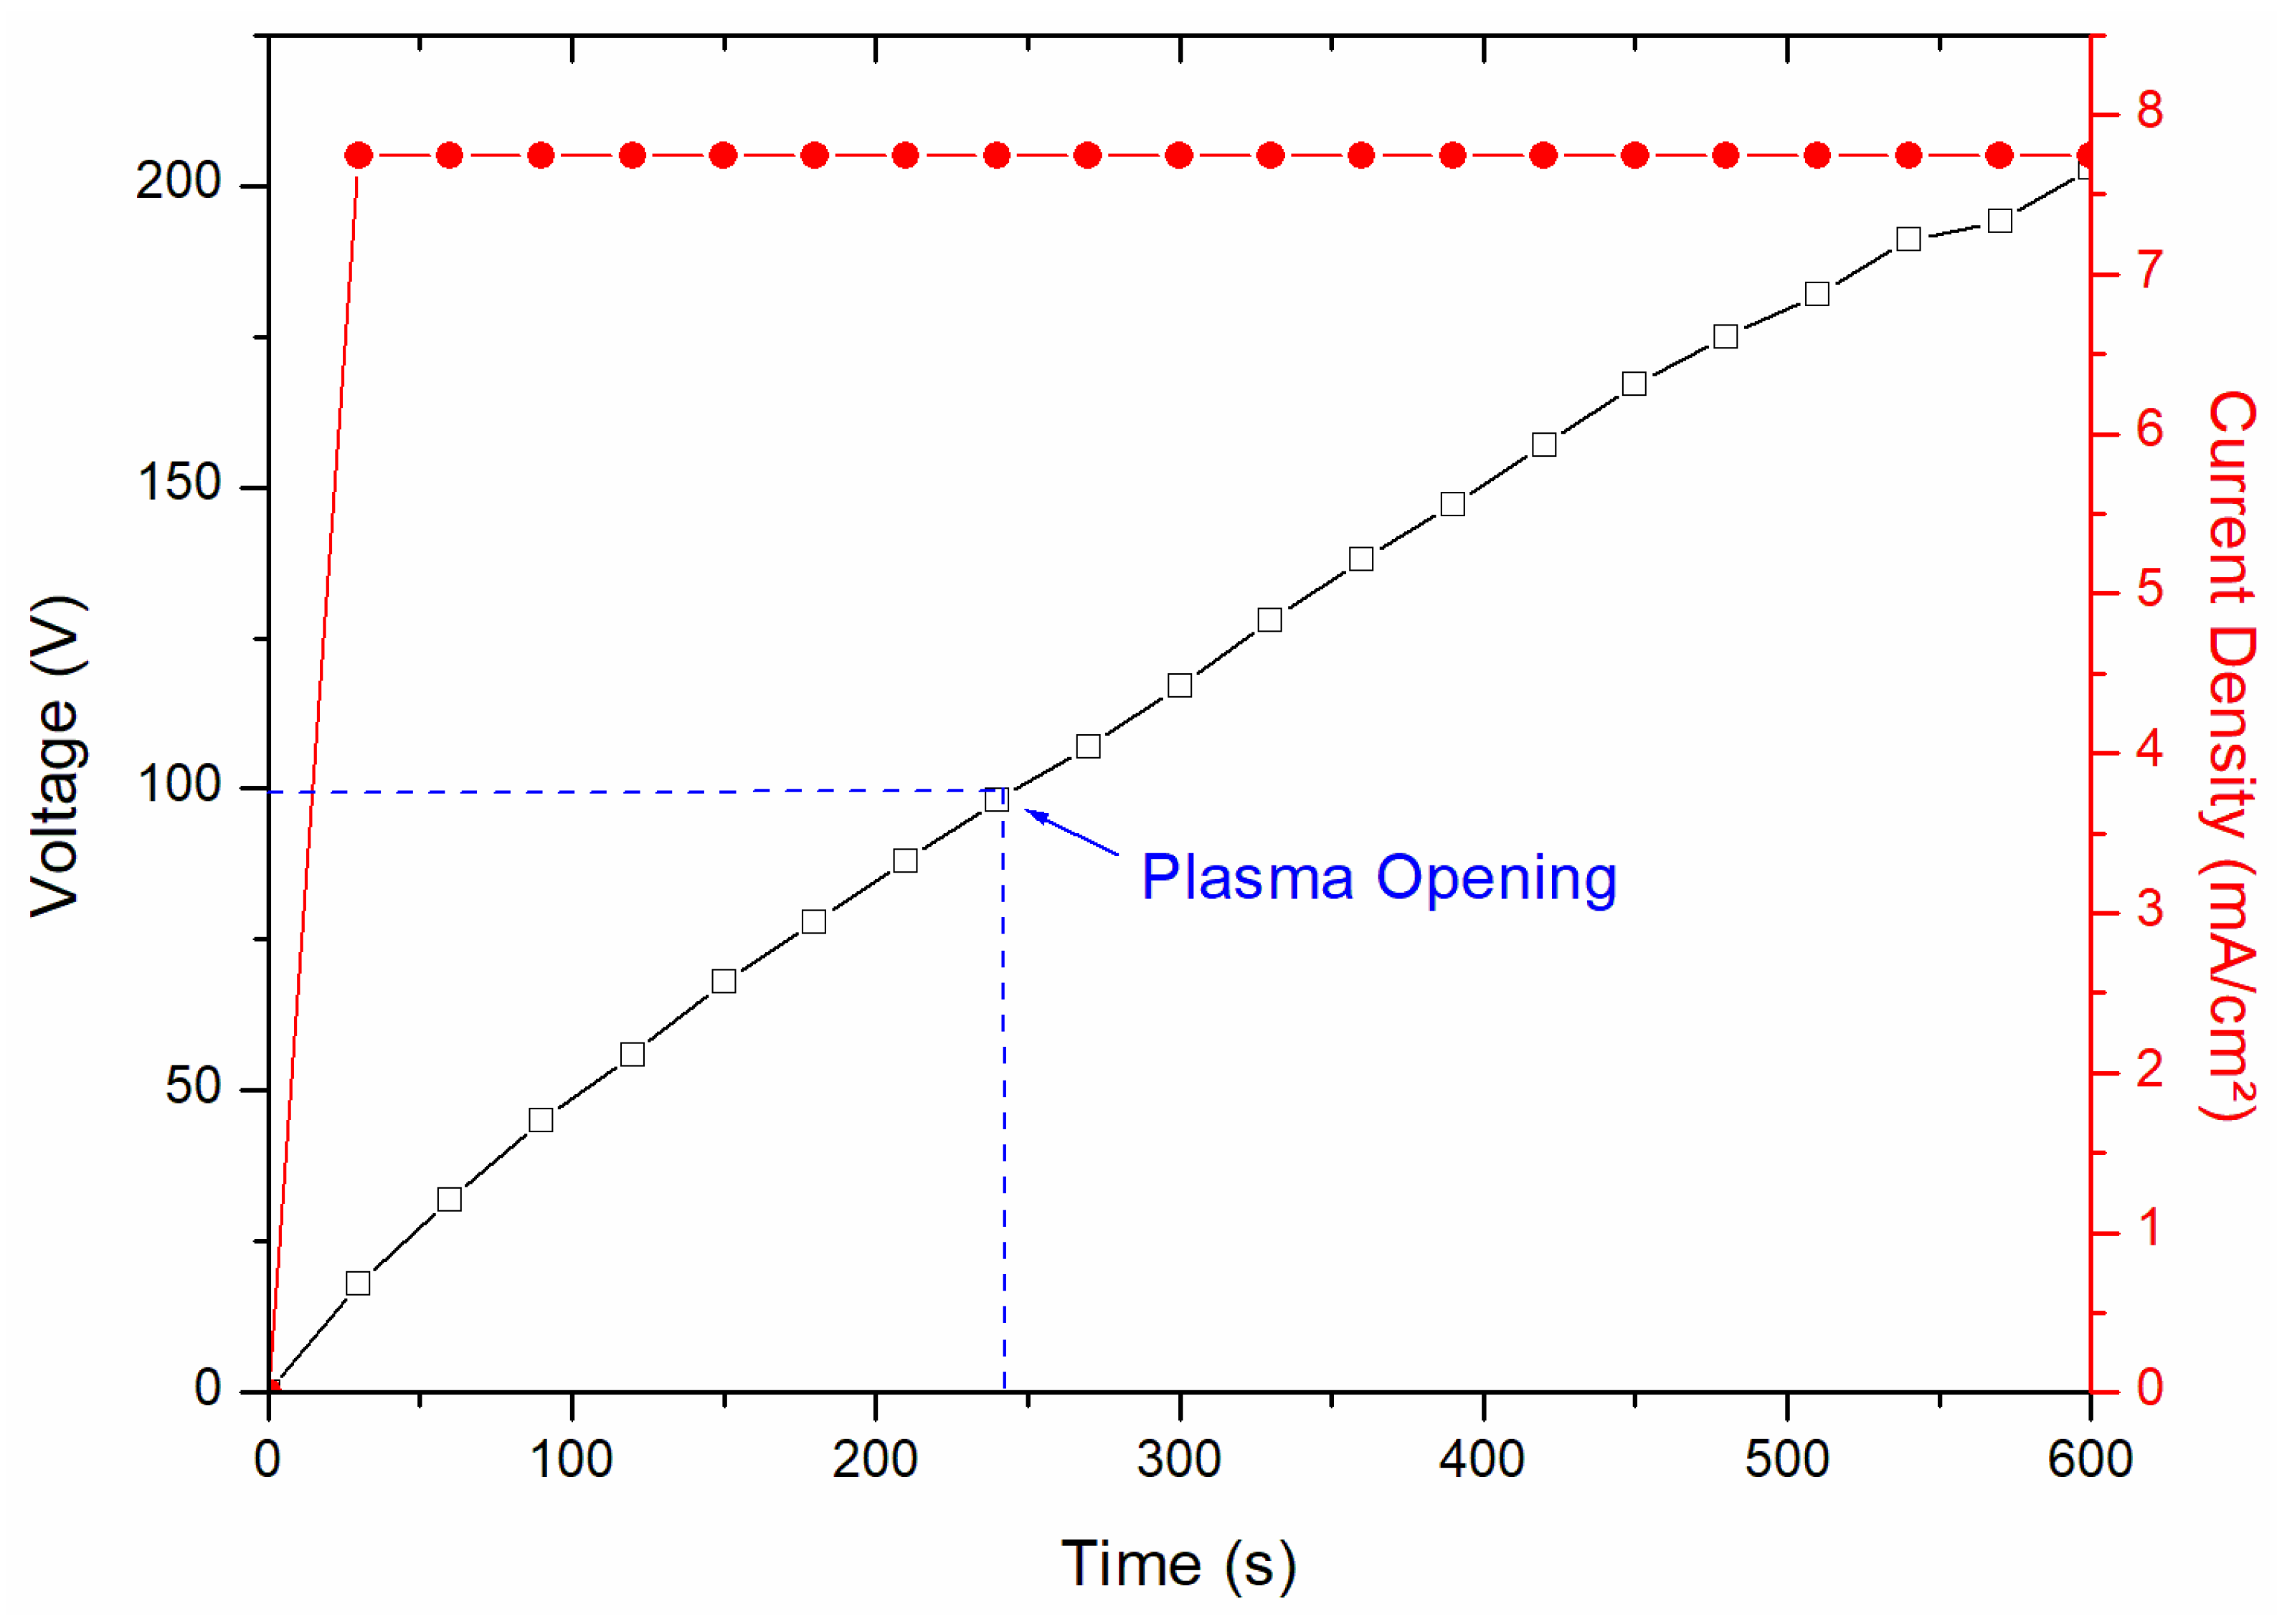
The electrolyte used in this study was based on sodium tetraborate (Na2B4O7·10H2O), with varying concentrations as shown in Table 1, supplemented with 1.5 g/L of potassium hydroxide (KOH) to increase the conductivity of the solution. This solution was chosen due to its promising adhesion results at the metal/oxide interface, as well as its ability to avoid the formation of excessively thick oxide layers, as in the Na2SiO3 solution [21]. Silicon-rich electrolytes, on the other hand, tend to produce coatings that are brittle under shear stresses [1,2,21,22]. The treatments were performed with different and constant current densities of 7.74 mA/cm2, as shown in Figure 2 (showing one of the treatments).
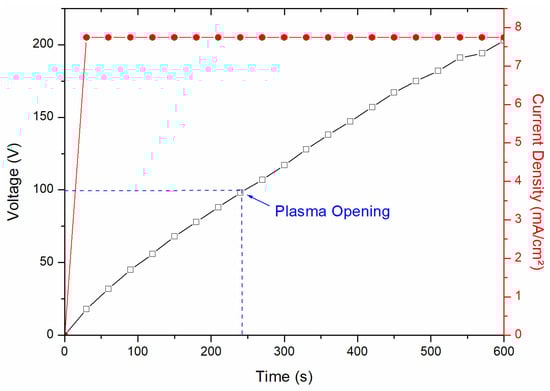
Figure 2.
Graph of the PEO process, with application of voltage and current density response.
The system used for the treatment consists of a pulsed DC power supply T2S TECHNOLOGY, model PS-2, which provides a range of 0 to 900 V with duty cycle control (15 to 100%), a 25-ohm rheostat used to regulate the electric current in the system, a 250 mL stainless steel (304) beaker as cathode, and a mechanical stirrer with a stainless steel (304) shaft.
2.5. Joining Dissimilar Materials
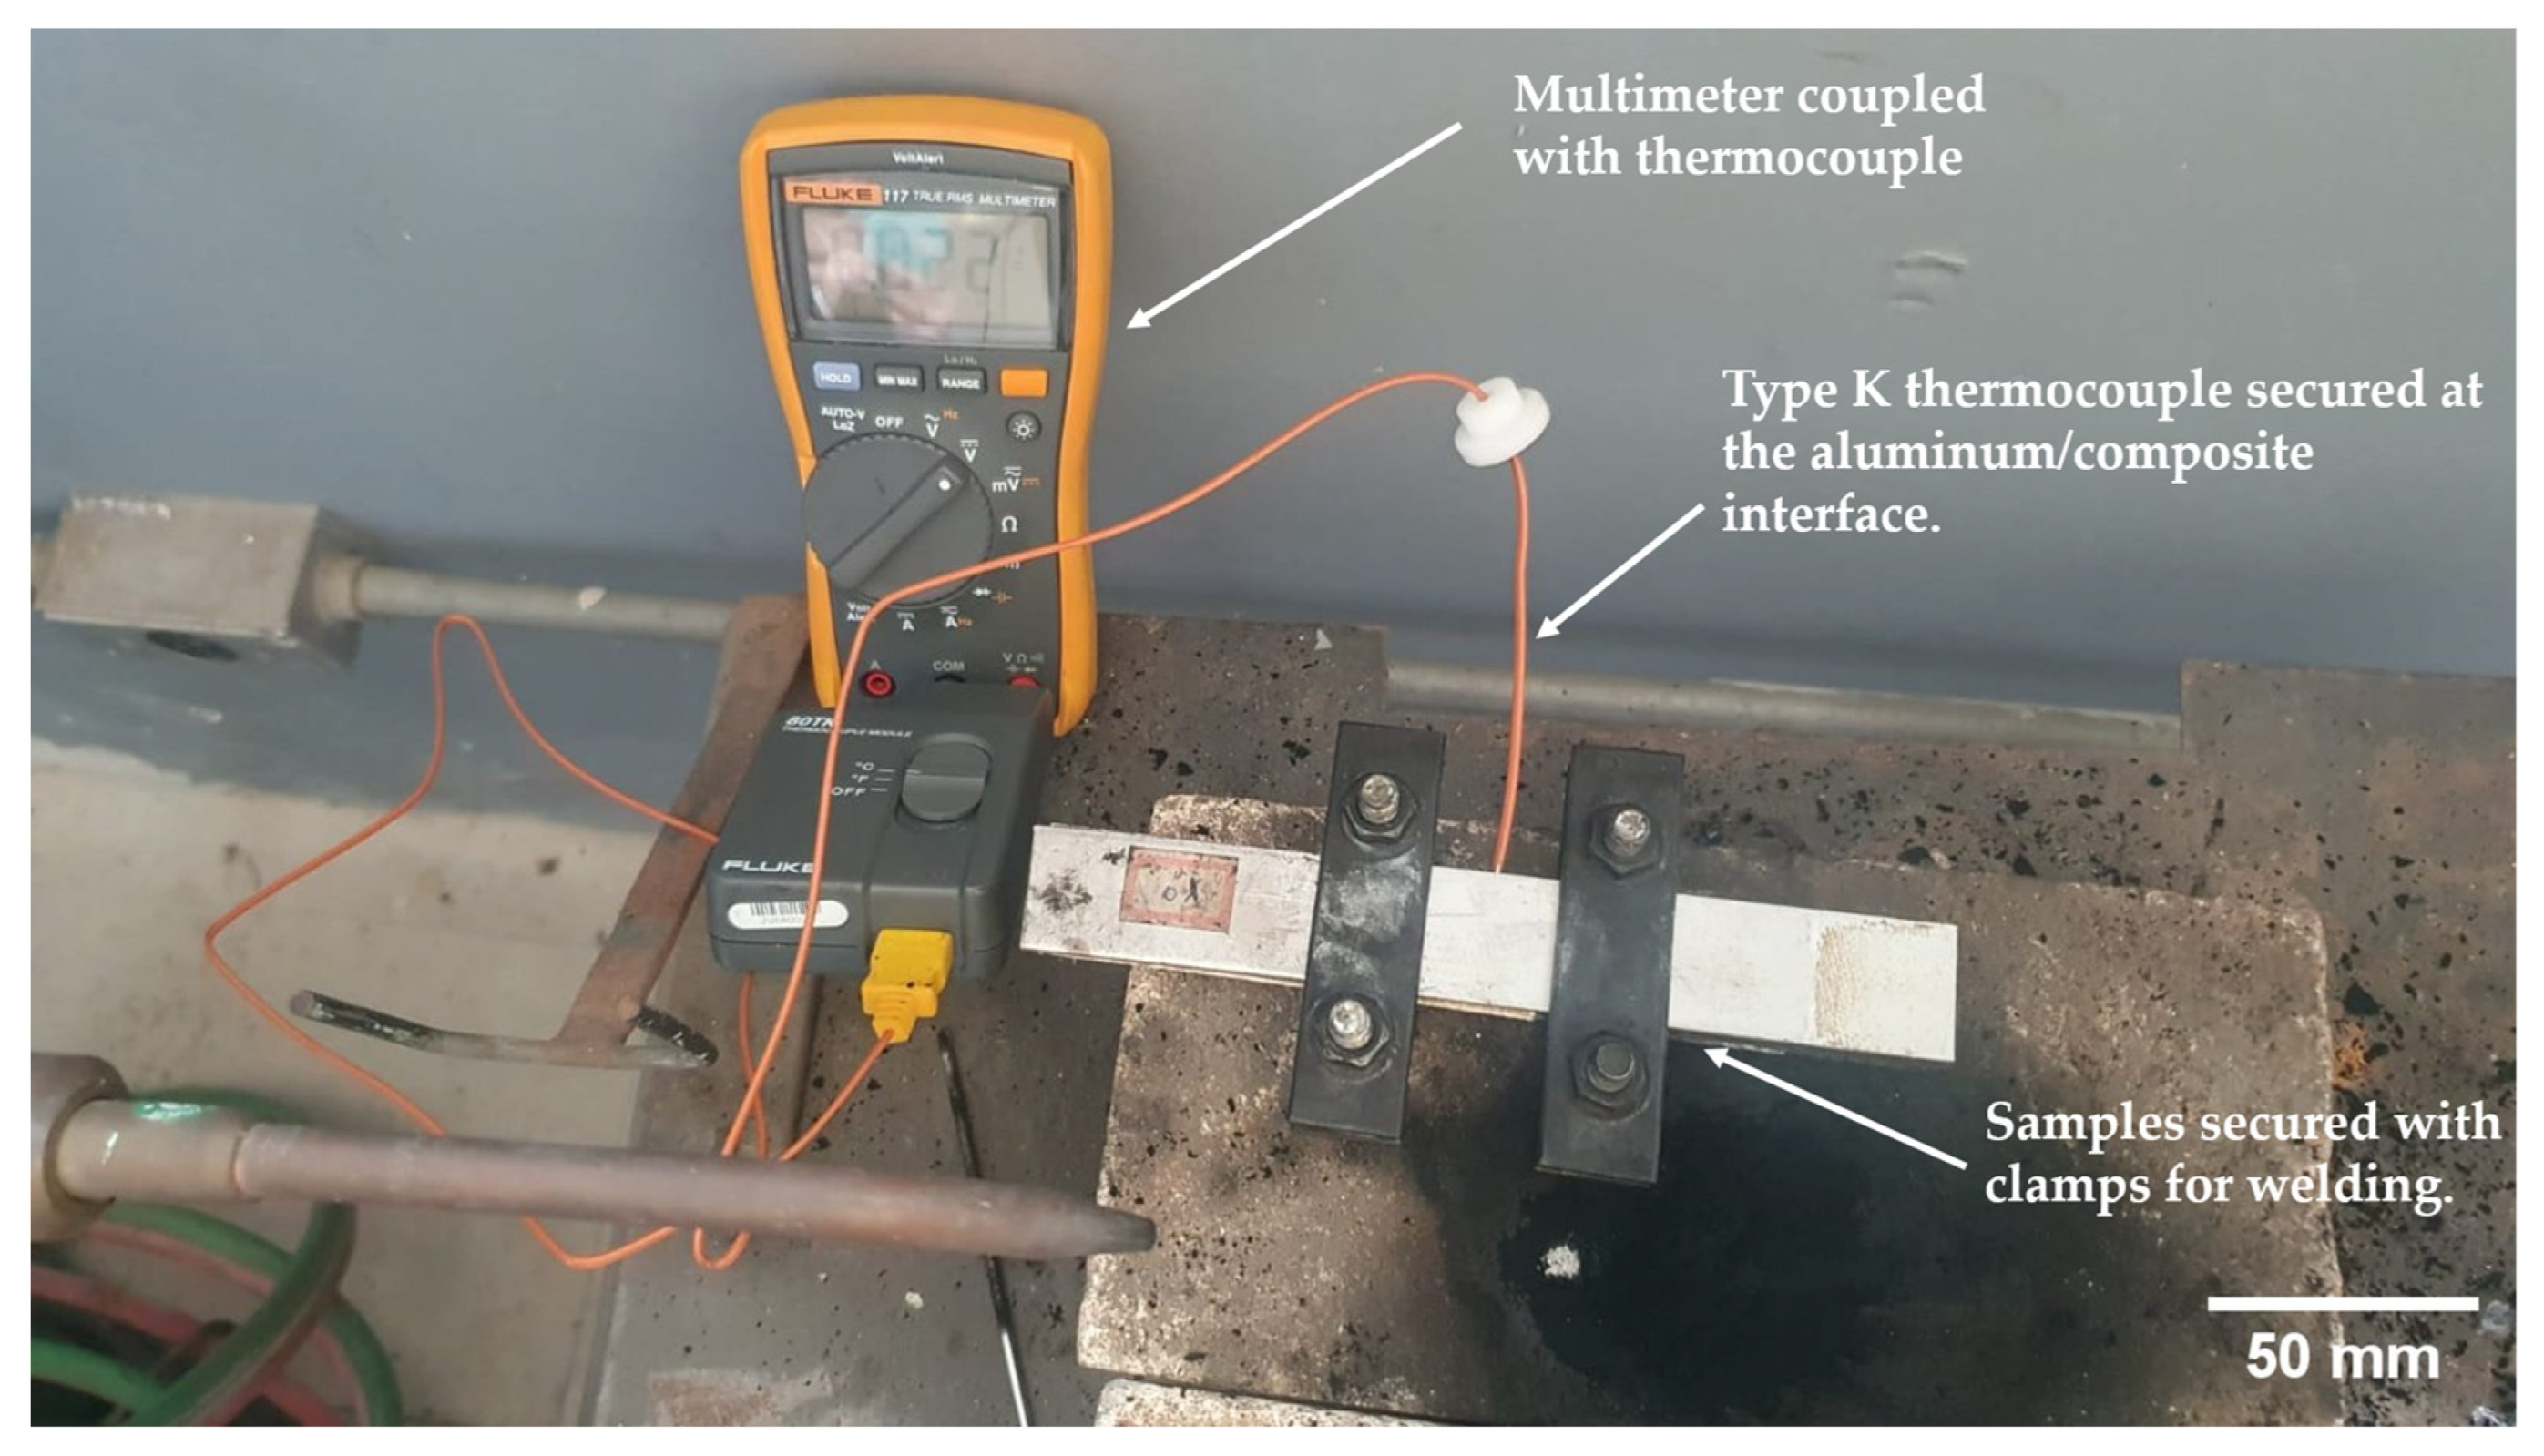
The method of joining materials used in this study was oxy-fuel welding (OFW). The gas pressures were set at 0.05 MPa for acetylene and 0.1 MPa for oxygen, with a flame exposure time of 2 min (on aluminum), as shown in Figure 3. To measure the temperature at the metal/compound interface, a type K thermocouple, FLUKE, model 117 True RMS, was used.
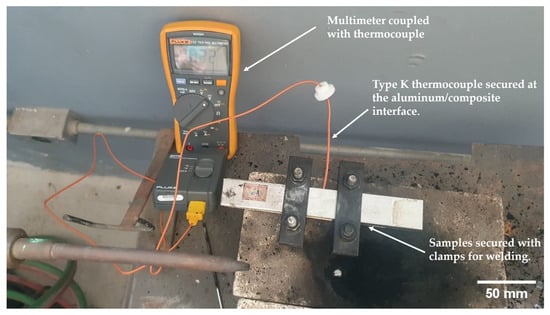
Figure 3.
FLUKE 117 True RMS thermometer with type K thermocouple on the sample to be welded.
When evaluating the temperature, it was observed that it was around 270 ± 10 °C, which is above the glass transition temperature (Tg) of the polymer matrix in the composite. It was not possible to control the temperature much, as new studies applying oxy-fuel welding are necessary for its optimization [23,24,25].
2.6. Characterizations
To evaluate the lap shear strength (LSS), a Shimadzu AG-X universal testing machine (Kyoto City, Japan) with a 50 kN load cell was used, operating at a speed of 1.5 mm/min, in accordance with ASTM D1002:19 [20]. Five samples were tested for each experiment (18 experimental conditions, with 17 corresponding to treated samples and 1 used as a control), totaling 90 samples analyzed. After statistical analysis and determining the highest lap shear strength value, the coating that yielded this result was evaluated using scanning electron microscopy (SEM) with a ZEISS microscope, model EVO LS15 (Jena, Germany). The thickness of the oxide coatings was measured using an INSTRUTHERM non-metallic film thickness gauge, model ME 250 (Sao Paulo, Brazil), employing the eddy current concept. Each sample underwent 10 measurements, with an accuracy of 0.1 µm. The contact angle of the untreated and treated samples was measured using a Ramé-Hart goniometer (ADVANCED 300 F-1, Succasunna, NJ, USA), applying 10 drops to each surface randomly.
To evaluate the corrosion resistance of the alloy and after PEO treatment, the samples were subjected to linear polarization electrochemical techniques using the AUTOLAB potentiostat/galvanostat model PGSTAT302N from Metrohm Autolab© (Utrecht, The Netherlands). The tests were conducted in a horizontal electrochemical cell with a 3.5% NaCl solution and equipped with three electrodes: treated AA2024 alloy (working electrode), platinum (counter electrode), and Ag/AgCl (saturated KCl—reference electrode). One replicate was performed for each sample, with each sample being immersed in the solution for approximately 86,400 s (at open circuit potential). The linear polarization test was performed at a scan rate of 0.33 mV/s, with an analysis range of +700 to −100 mV relative to the open circuit potential (OCP) value.
3. Results and Discussions
3.1. Lap Shear Strength (LSS)
The values obtained after the lap shear strength test are presented in Table 3. The experiments conducted with the aluminum samples treated by PEO (01 to 17) show average lap shear strength values ranging from 5.7 to 9.5 MPa. Considering the lap shear values, it is observed that the PEO treatment resulted in increases of 2.5 to 4.3× compared to the set without surface treatment. This is due to the costing’s morphological characteristics, such as micro-pores, protrusions, and other microstructures that appear in the oxide coating, providing a larger surface area for the sample and allowing greater interaction with the thermoplastic matrix [1,2,21,26,27,28].
Table 3.
Coded and actual parameters used and response variable (lap shear strength).
The obtained lap shear values are promising compared to other studies conducted on both metallic and polymeric materials. Table 4 presents some comparisons of lap shear values and the materials used.
Table 4.
Shear strength values of joints in dissimilar materials.
With the development of a statistical model, the significance of parameters (independent variables) was evaluated using analysis of variance (ANOVA). This model was adjusted by the coefficient of determination (R2), which quantitatively helps assess how much each variable influences the response variable (LSS) [1,36,37].
The ANOVA analysis results, using the independent variables immersion time, duty cycle, and electrolyte concentration, to the dependent variable (LSS), are presented in Table 5.
Table 5.
ANOVA with LSS as the dependent variable.
It was found that the F value (responsible for checking whether a term or the model itself is associated with the response variable) for the model was 2.03, implying that the adopted model is not significant in the response variable (LSS), and also showing that there is a 20% probability of the F value being due to noise. This study observed that the only factor significantly influencing the dependent factor is the electrolyte concentration (X3). As the “p-value” is less than 0.05, it indicates that this factor has a significant effect on the response variable. Furthermore, when analyzing the coefficient of determination (R2), the model explains 75.15% of the PEO + welding process variability. However, the statistical model did not demonstrate significance in explaining the variability, considering its p-value (0.200), which is greater than 0.05 [23,29,37].
It can be inferred that the model is not significant, due to the complex mechanisms of the PEO process added to the oxy-fuel welding process (which still requires optimization), as already presented in a previous study [35,38].
To evaluate the influence of each independent variable on the dependent variable, Equation (2), called effect size (η2), can be used. This equation considers the sum of squares of factors, blocks, and/or the statistical model itself to quantify variability within a data set [39].
where “SS” is the sum of squares of the specific factor, which quantifies the variability attributed to a specific factor within the statistical model, and “SST” is the total sum of squares of the model, which represents the total variability observed in the data, accounting for both the explanatory variables and the error [39]. Based on Equation (2), the effect of each factor was 14.29% for immersion time, 5.11% for duty cycle, and 28.96% for concentration. It is observed that the pure model error influences only 1.16% of the total process variability.
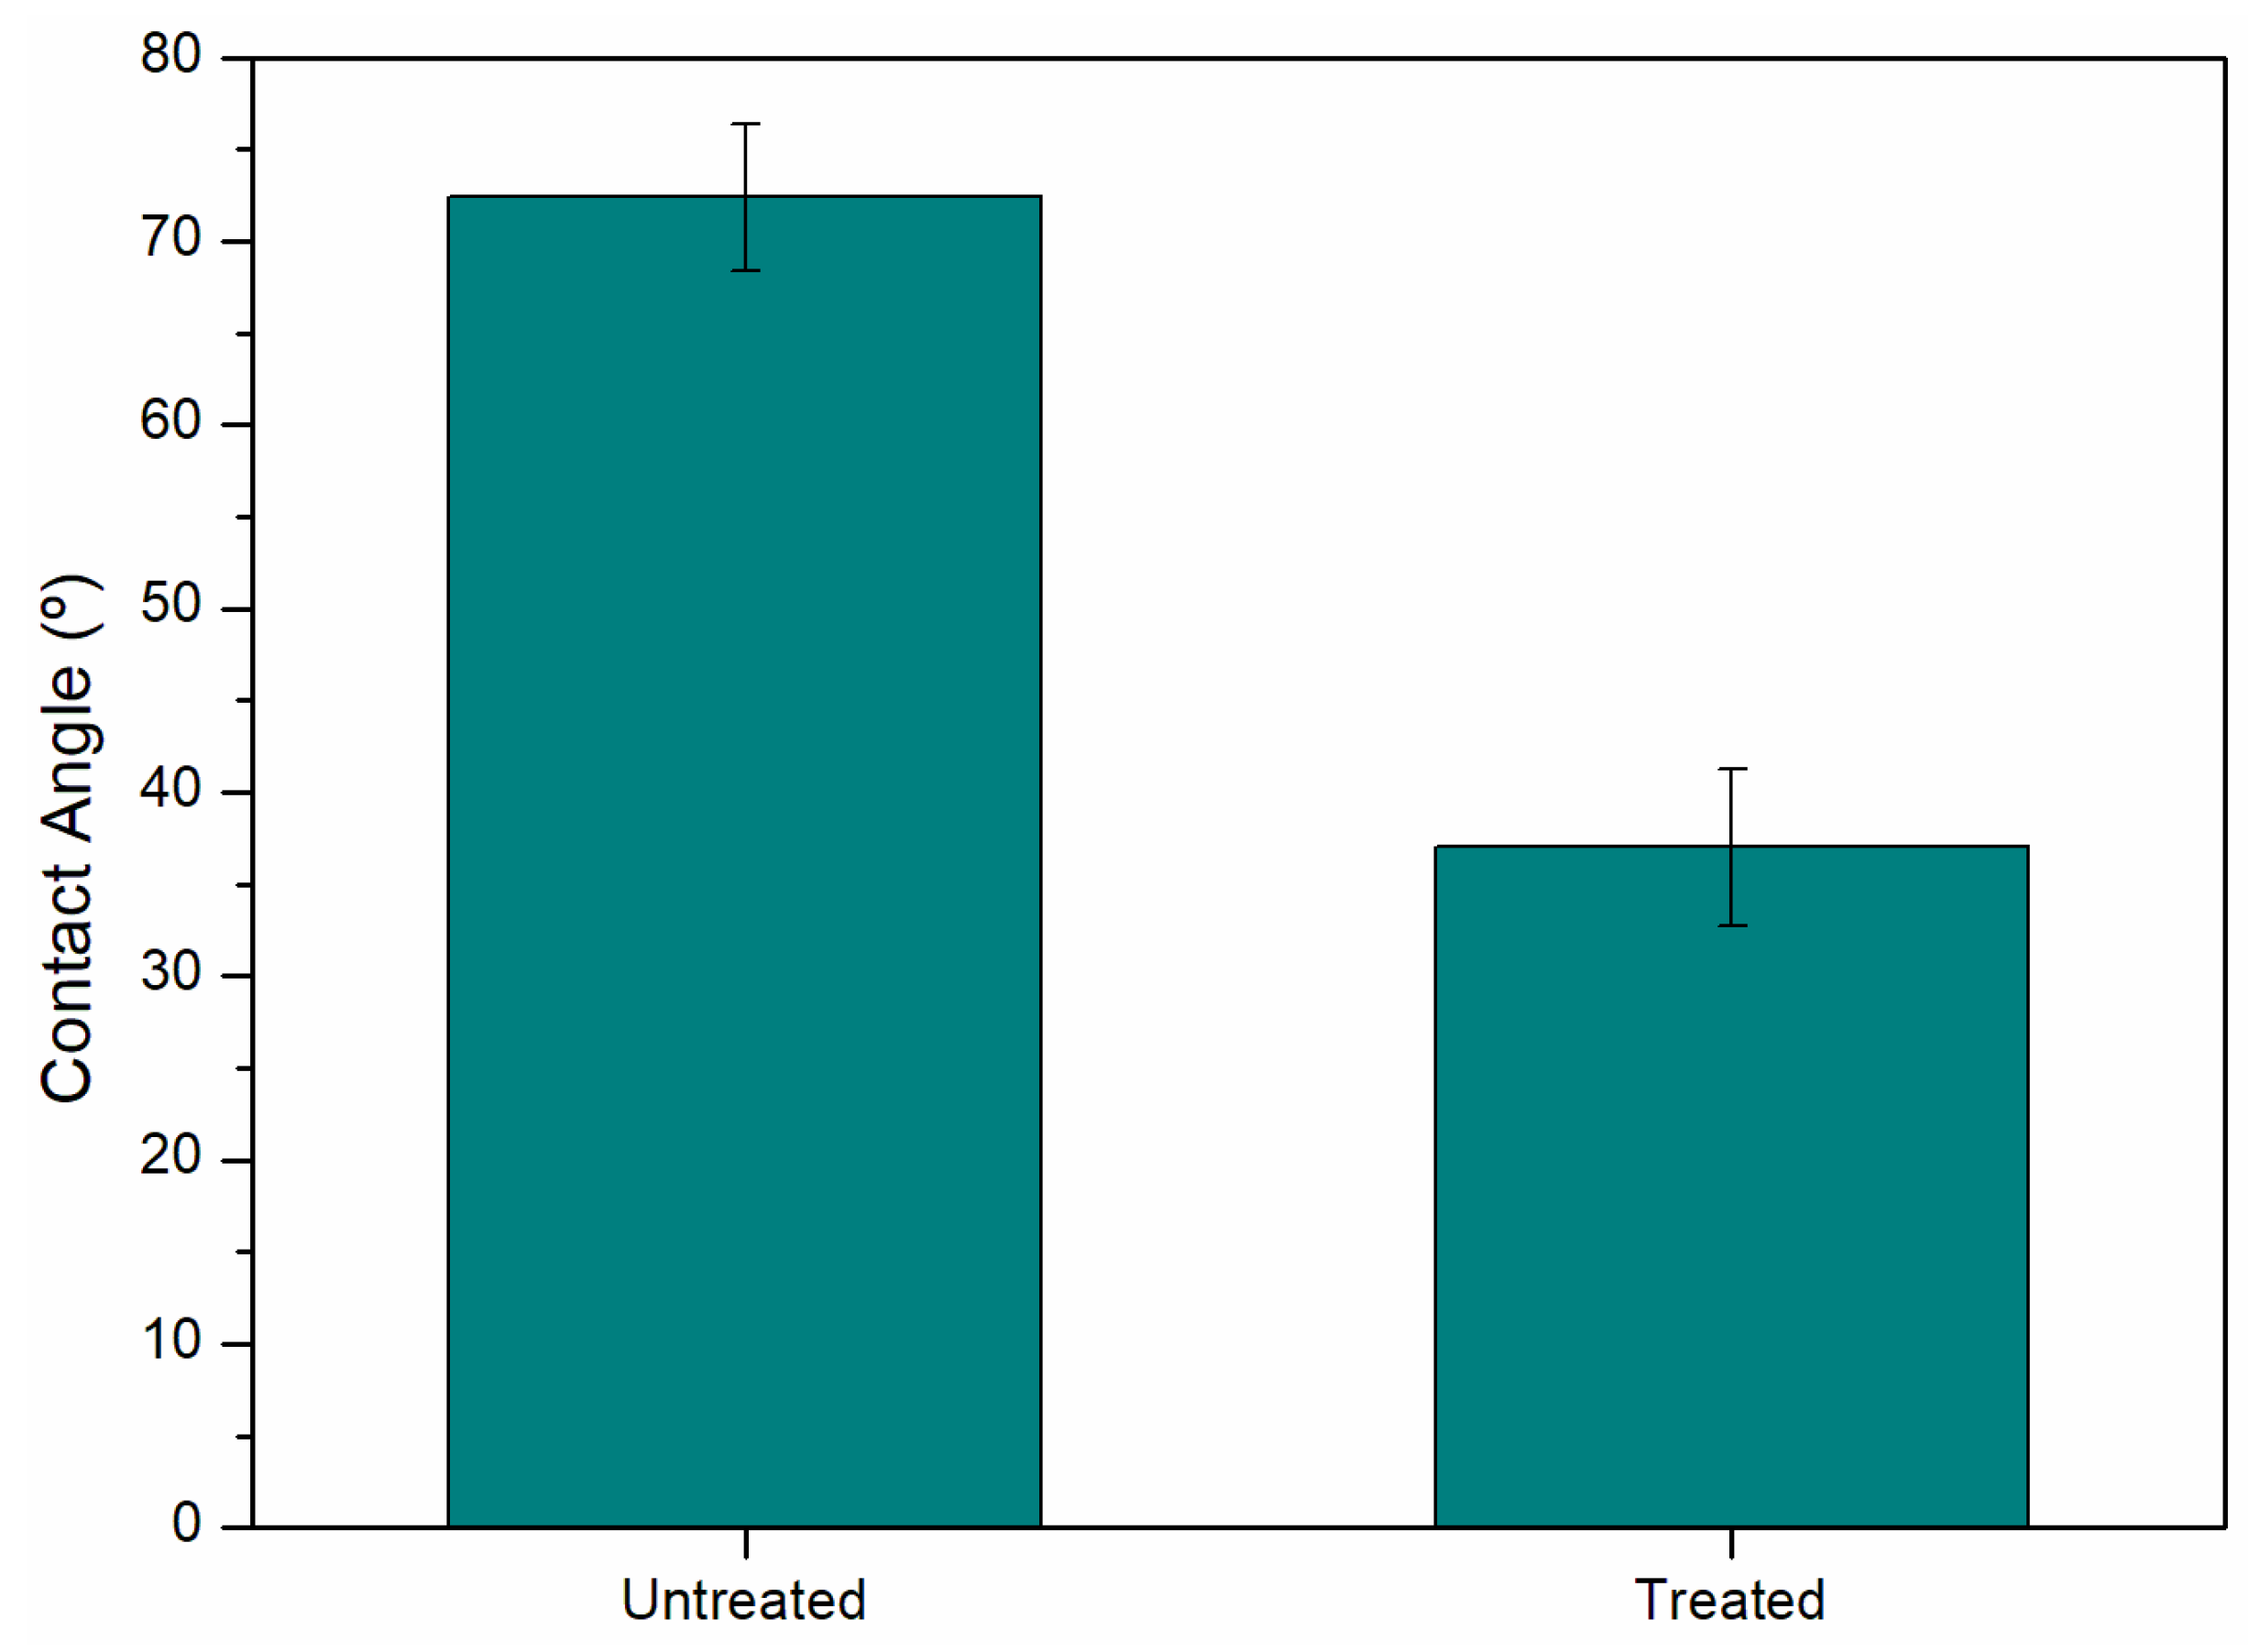
3.2. Contact Angle of Aluminum Surfaces
Contact angle analysis is a good indicator to reveal the hydrophobicity of the material surface. It can also be applied to surface adhesion, as the smaller the angle the better its wettability, and its value is strongly dependent on the micro- or nanostructure of the surface of the material [9]. Considering the untreated samples and the treated sample that exhibited the highest resistance value (9.5 MPa), contact angle analysis was conducted (Figure 4). The results indicated an angle of 72.4 ± 4.0° for the untreated sample and 37.0 ± 4.3° for the treated sample, representing a 48.9% reduction. This significant decrease in the contact angle suggests a substantial improvement in the adhesion of the thermoplastic matrix.
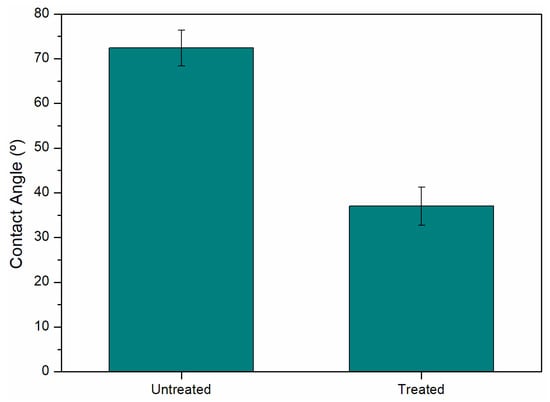
Figure 4.
Comparison of the contact angle value between untreated aluminum and PEO treatment.
3.3. Fractographic Evaluation of the Aluminum/Composite Interface
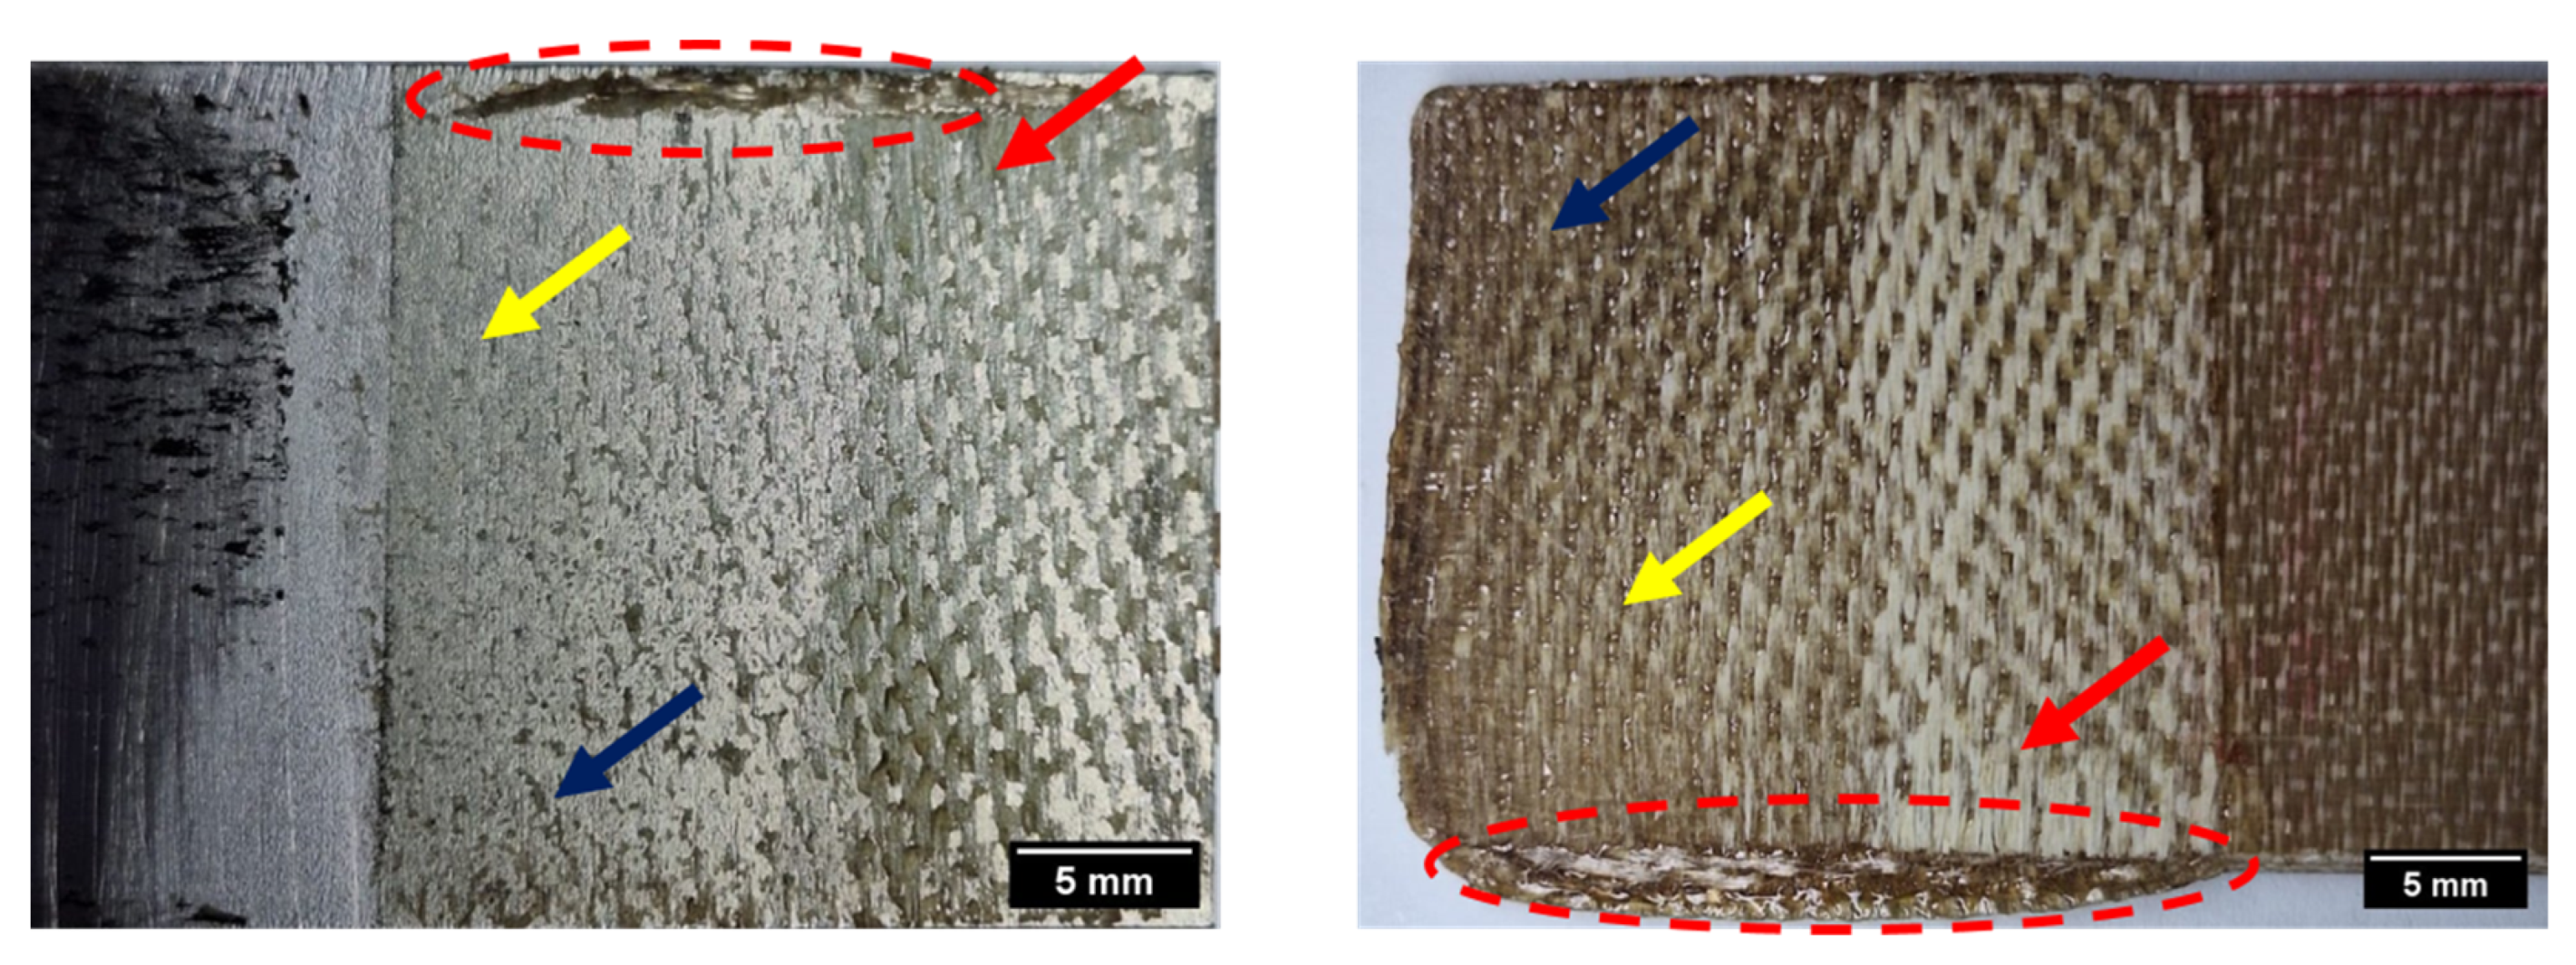
After obtaining the PEO process parameters and conducting the lap shear test, the fractured surfaces were visually characterized following the ASTM 5573-99 (2019) standard [40] to analyze the failure modes at the interface.
Figure 5 shows the surfaces of the aluminum and thermoplastic composite samples, highlighting the joined regions. It is observed that there were mixed-mode fractures, with three different types. The yellow arrows indicate a small region with adhesive failure, as there was no polymer matrix in that region in the aluminum sample after the assembly rupture, representing 16.64%. The blue arrows indicate a polymer matrix’s cohesive failure, where the matrix remained on the aluminum sample, representing 34.02%. Finally, the red arrows indicate a light fiber failure, with the reinforcement of the composite exposed both outside the laminate sample and on the aluminum sample, representing 49.34% of the total fracture [41]. It is also possible to observe the edge effect at the boundaries of the composite sample, indicating an excessive tightening in the assembly during the welding process, with the matrix reaching the glass transition temperature and flowing to the edges, a phenomenon previously observed in other studies [19,24,30,39].

Figure 5.
Fractography of the samples after the lap shear test. Adhesive failure (yellow arrows), cohesive failure (blue arrows), light fiber failure (red arrows), and edge effect (red circle).
In Figure 6, the different stages of deformation in the samples during the lap shear test are shown, and on the right, a real image after fracture is observed. Noticeably, the aluminum sample exhibited considerable deformation after the test, which is attributed to the material condition. In this study, AA2024-O aluminum was used, where the “O” designation signifies annealed material, characterized by high ductility and significant plastic deformation (purple arrow in Figure 6) [42,43,44].
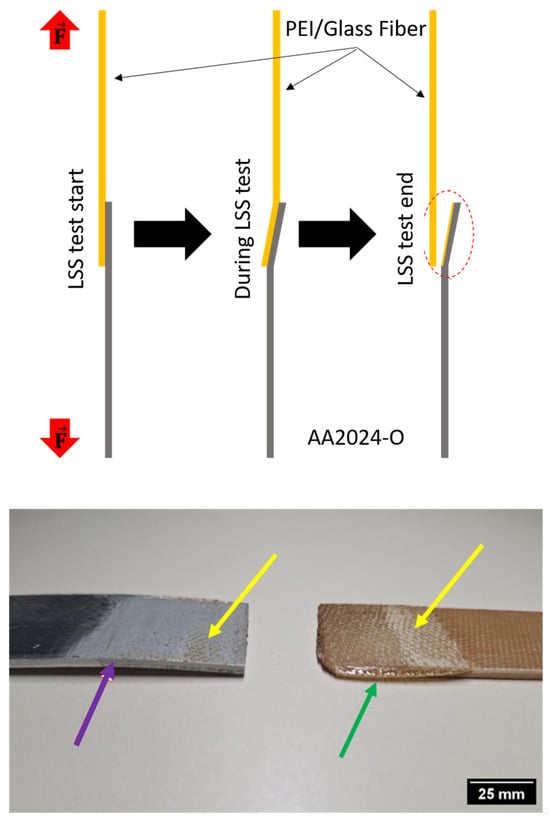
Figure 6.
Fractures on the interface surface. Region where the deformation was verified (red circle), plastic deformation in AA2024-O (purple arrow), edge effect in PEI/glass fiber (green arrow), and material anchor points (yellow arrows).
Although the PEI/glass fiber sample did not show deformation like the aluminum alloy, it exhibited an edge effect (green arrow), which is attributed to excessive tightening and the thermoplastic matrix softening phase, leading to flow towards the edges of the sample, as shown in Figure 6 and observed in other studies [19,24,30]. Studying this effect is crucial because it can result in delamination in the composite material, impacting the integrity of structures and/or substructures [45,46,47].
3.4. Coating Corrosion Resistance
The data from the linear polarization measurements are presented in Table 6, and the polarization curves of treated and untreated aluminum samples are shown in Figure 7. In the figures, Ecorr and jcorr represent the corrosion potential and corrosion current density, respectively. Additionally, Epit indicates the potential where a breakdown of the anodic layer occurs and localized corrosion (pitting) begins. The corrosion rate (CR) in mm/year is presented in Table 6 and is calculated using Equation (3).
where CR is the corrosion rate (mm/year); jcorr is the corrosion current density (A/cm2); W is the equivalent mass of the material studied (according to ASTM G102: 2015 [48]), and is the specific mass of the material studied (g/cm3).
Table 6.
Corrosion potential (Ecorr), corrosion current density (jcorr), pit corrosion (Epit), and corrosion rate (CR).
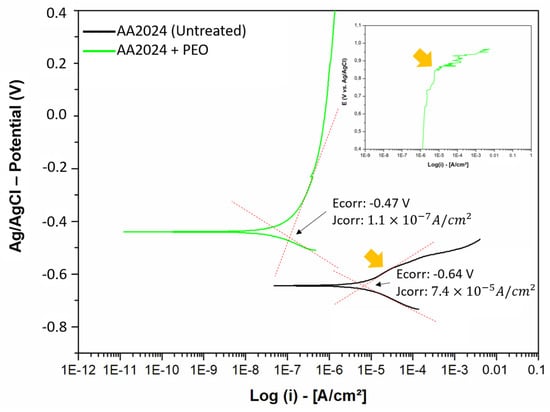
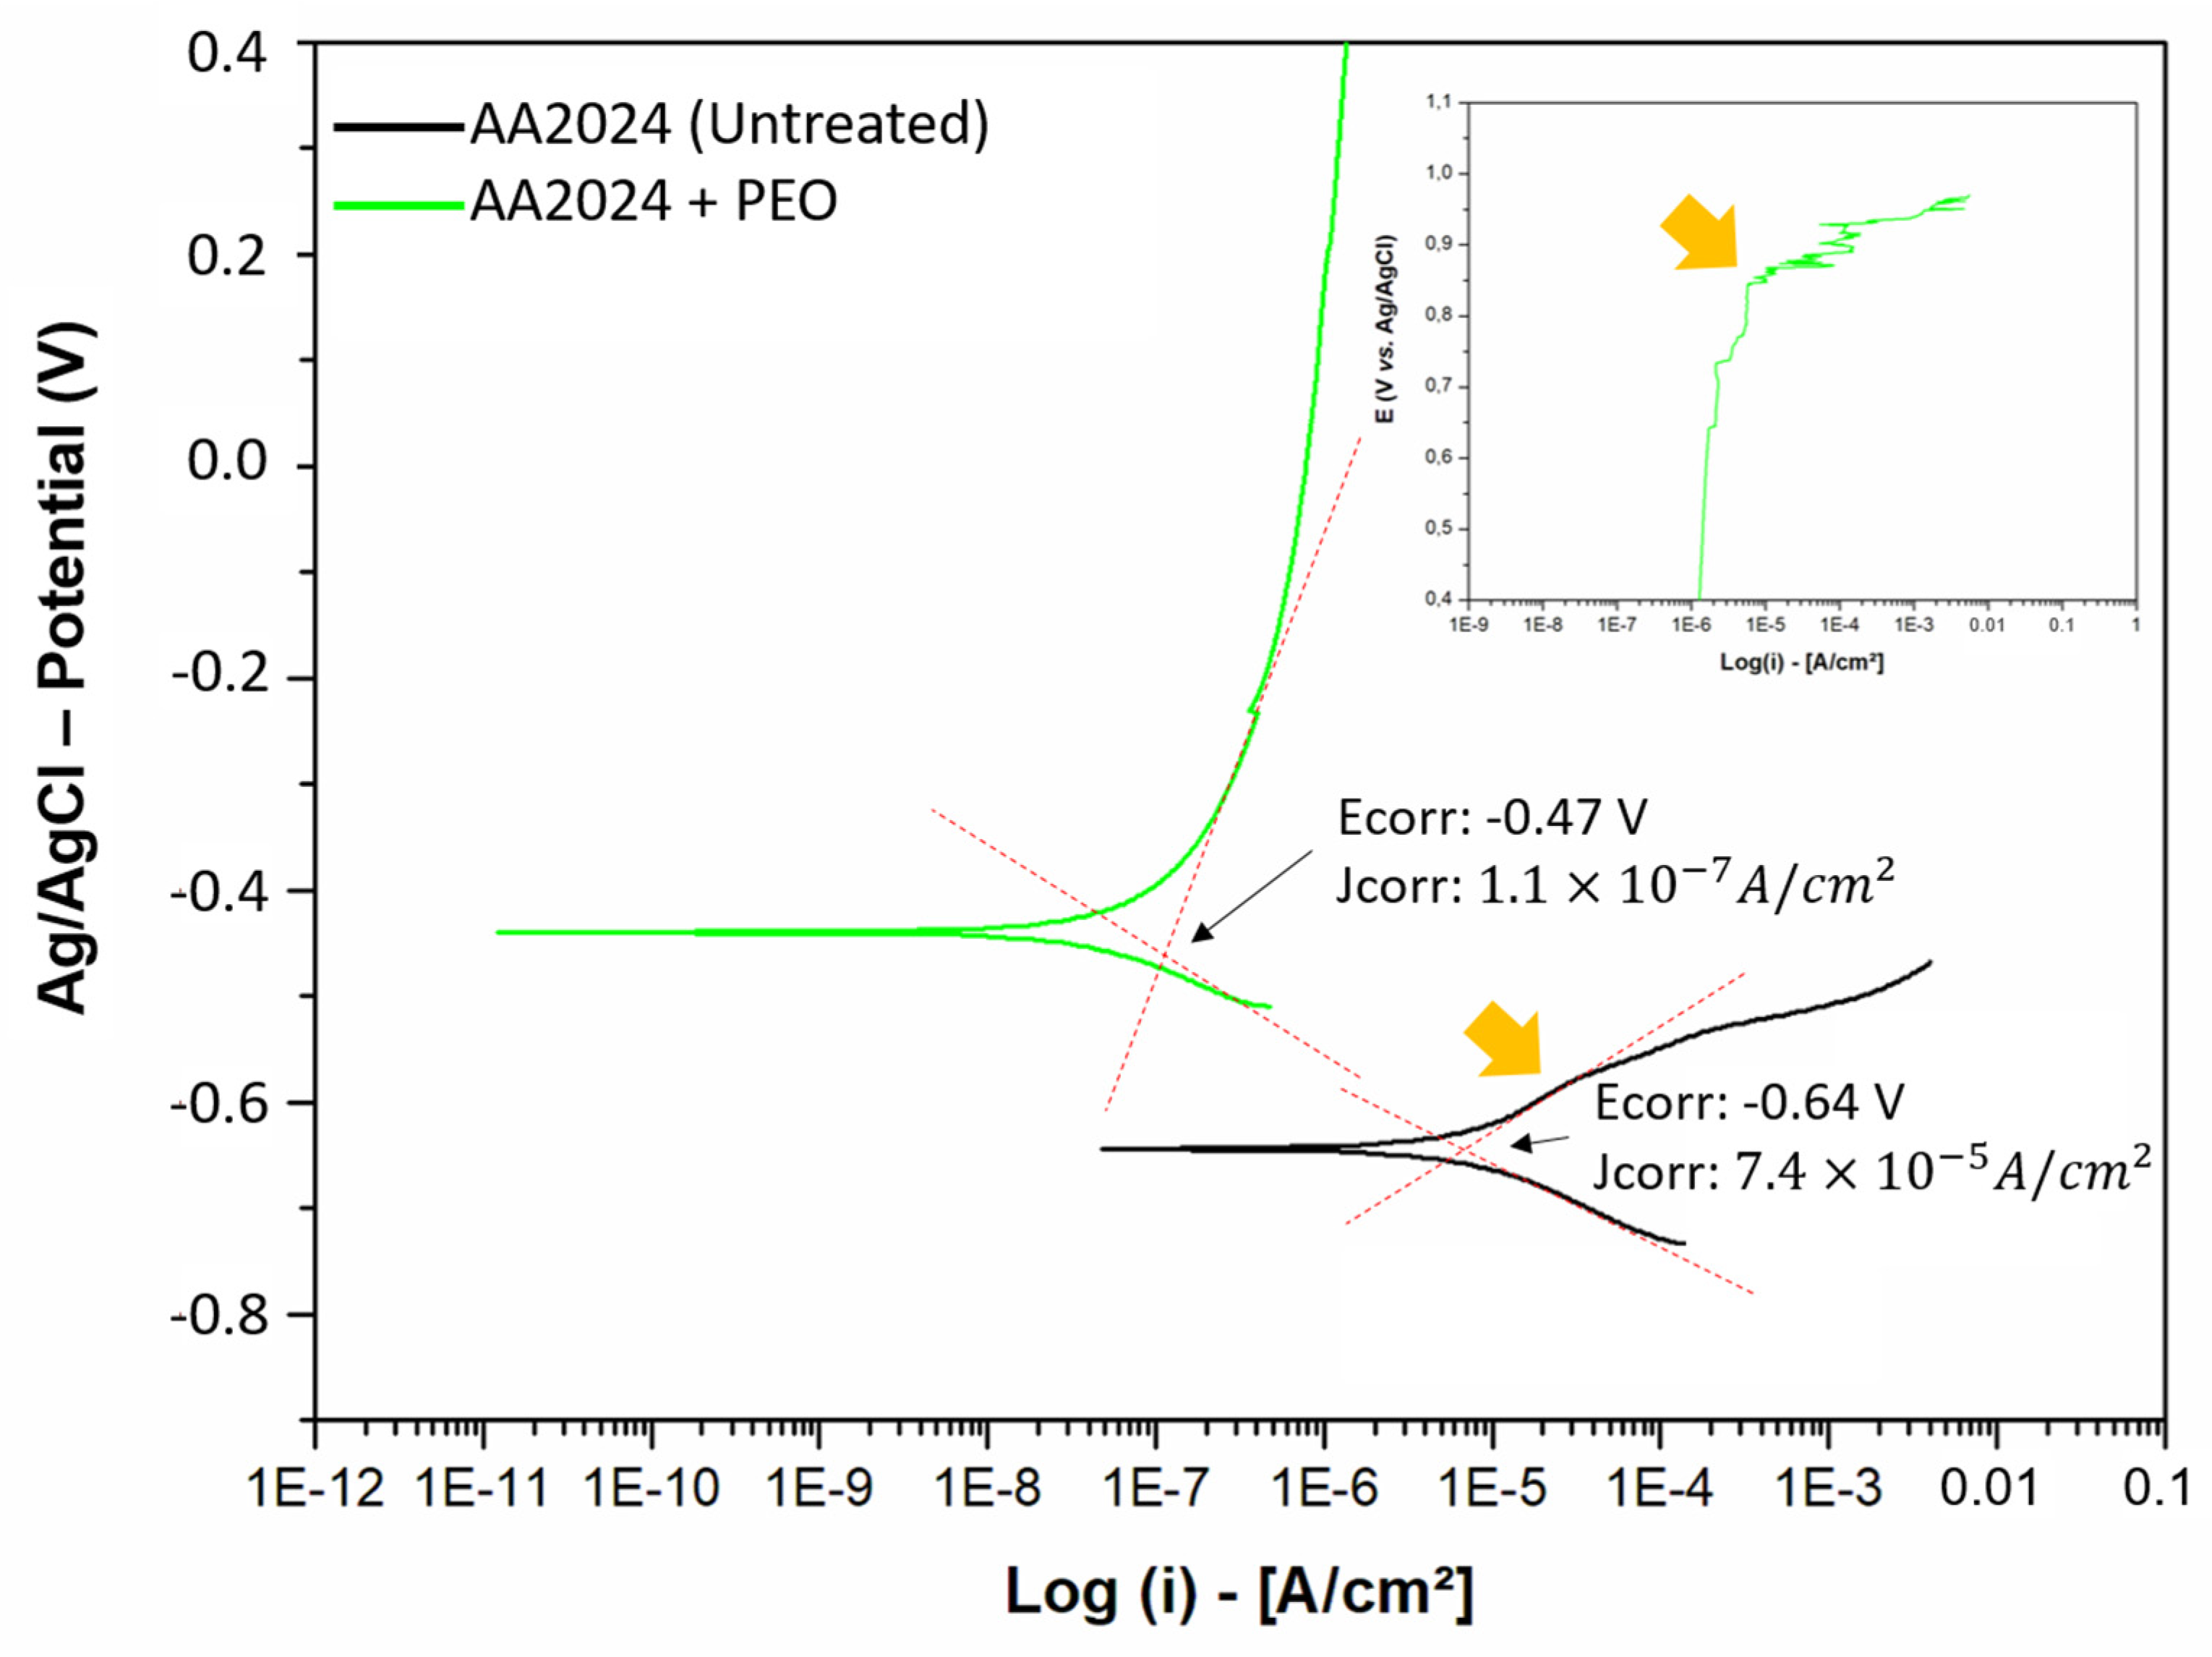
Figure 7.
Polarization curves of the AA2024 aluminum alloy with and without PEO treatment, with orange arrows indicating the breaking point of the coatings (Epit).
In general, it is observed that the PEO treatment made the aluminum sample much more corrosion-resistant compared to the untreated sample, both in terms of nobility (corrosion potential, Ecorr) and corrosion rate (current density, jcorr). A higher potential on the y-axis indicates a greater nobility of material, with less interaction with the aggressive environment. Moreover, being more shifted to the left on the x-axis (Log (i)) of the graph indicates higher corrosion resistance [2,49,50].
The data from Table 6 and Figure 7 demonstrate that the PEO treatment significantly increased the corrosion resistance of the AA2024 aluminum alloy. The pitting potential (Epit) indicates the oxide layer’s durability until its breakdown. In the untreated sample, the rupture points were subtle, around −0.55 V, with subsequent attempts at passivation. In contrast, the PEO-treated sample exhibited a more pronounced pitting potential at +0.85 V, characterized by a clear breakdown of the anodic curve and a sudden increase in corrosion current density [2,19,51].
The PEO treatment on the AA2024-O alloy significantly increased its corrosion resistance, with a reduction in corrosion rate of approximately 99.84% compared to the untreated sample (Equation (4)).
This improvement in resistance is attributed to the formation of an oxide layer acting as a barrier, consistent with findings from other studies demonstrating that PEO treatments indeed decrease the corrosion rate in aluminum alloys [52,53].
The noise observed at the end of the polarization curve corrosion test may indicate an attempt at repassivation of the alloy, reflecting changes in the surface state as it tries to form a protective layer. However, the test interruption due to the equipment reaching its “overlay” suggests that the continuous scanning method may have introduced inaccuracies. Continuous sweeps can distort the half-sweep curve, affecting corrosion potential and current density. Furthermore, traditional analysis techniques can introduce errors, especially in small ranges of superpotentials. Therefore, although noise may suggest repassivation, it is crucial to consider experimental limitations when interpreting results [54,55].
Figure 8 shows scanning electron microscopy images of the AA2024 aluminum alloy: an untreated sample (a, b) and a sample treated with the PEO process in experiment 3 (c, d).
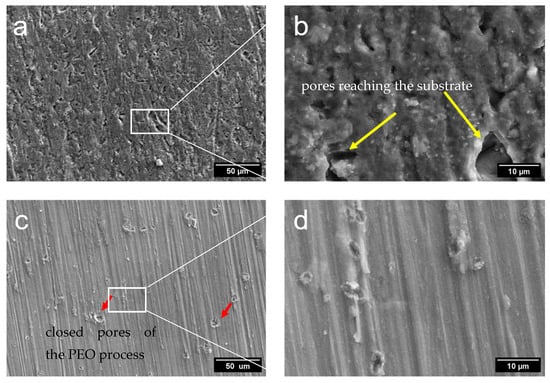
Figure 8.
SEM of AA2024 aluminum alloy, untreated (a,b) with magnification in 1000× and 5000× and treated (c,d) with magnification in 1000× and 5000×.
The treated sample (c, d) exhibits a surface with a compact morphology and few pores, featuring a thin coating with a thickness of 1.7 ± 0.5 µm. This is attributed to both the applied electrical regime, with a final voltage of around 320 V and a constant current in 60 mA, and the electrolyte used (Na2B4O7·10H2O), which allowed the development of a compact and thin layer. Other authors have observed that morphology strongly depends on the applied electrical potential; higher potentials result in thicker oxide coatings due to the dielectric layer breakdown [2,11,56].
The PEO coating showed a low number of pores, which can be explained by the electron avalanche that occurs during the process. This phenomenon generates rapid ionization and an intense electrical discharge, leading to the uniform melting and solidification of the material, minimizing the formation of pores on the coating surface. Thus, the high energy density provided by the electron avalanche contributes to a more compact and homogeneous structure. This phenomenon causes localized temperatures to briefly reach between 10,000 K and 25,000 K, followed by rapid cooling with the aqueous solution [8,57].
It is observed that the untreated sample in Figure 8a,b exhibits pores with distinct morphologies across the surface, indicated by the yellow arrows. Within these pores, microcracks are visible, which could potentially allow the substrate to be exposed to a chloride-rich environment, thereby increasing the corrosion rate, as illustrated in Figure 9.
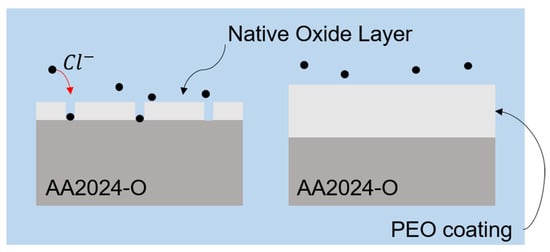
Figure 9.
Illustration of the passive oxide layer (left side) that allows interaction with Cl ions and the thicker PEO layer (right side) protecting the base material.
As already reported in the literature, Cl− ions interact with AlOH functional groups, reacting to form soluble aluminum chloride, as shown in Equation (5). This process leads to an increase in surface acidity due to the hydrolysis of Al3+ ions [58,59,60].
The passive layer of the alloy allows Cl− ions to penetrate easily, reaching the base material and promoting localized corrosion. However, the PEO treatment facilitated the growth of a thicker oxide layer with lower porosity, effectively mitigating the interaction of the alloy with Cl− ions. This phenomenon has also been observed in other studies [61,62].
4. Conclusions
In this study, the PEO process was used to grow a thin alumina oxide (Al2O3) layer on the AA2024-O aluminum alloy. The objective was to improve the alloy’s adhesion with the PEI/glass fiber thermoplastic composite using OFW, ensuring good mechanical performance (LSS).
Considering the strength of the aluminum/composite interface, the PEO treatment improved the shear strength, with lap shear values ranging from 5.7 to 9.5 MPa, a significant improvement compared to untreated aluminum (2.2 MPa). This improvement is attributed to the increase in surface area provided by the oxide coating, thus improving mechanical interlocking with the polymer matrix. Moreover, the wettability of the anodized surface was better, from 72.4° to 37°, which corroborates the increase in adhesion.
From the ANOVA analysis, it was found that the statistical model is not significant (R2 = 75.15%), with the model presenting a p-value of 0.200. Only the concentration of the solution (X3) showed significance with a p-value of 0.033. Additional analyses were carried out to determine the effect size (η2) of each factor. It was found that the electrolyte concentration influenced 28.96%, followed by the immersion time at 14.29%, followed by the duty cycle at 5.11%.
The corrosion analysis demonstrated that the PEO treatment is effective in mitigating localized corrosion in the AA2024 alloy by creating a thin barrier oxide layer that seals pores and defects, thereby further improving the material’s corrosion resistance. The treated sample exhibited higher corrosion potentials and significantly lower corrosion rates, with an improvement of 99.84%. These findings underscore the effectiveness of PEO treatments in enhancing the corrosion resistance of aluminum alloys in saline environments.
Author Contributions
Conceptualization, R.R.L.; methodology, R.R.L., E.R.R.S., L.F.B.M., A.B.R.M.A., M.d.O.L.V. and L.R.d.O.H.; validation, F.J.G.d.S., R.P.M. and E.C.B.; formal analysis, R.R.L. and R.d.C.M.S.-C.; investigation, R.R.L., R.d.C.M.S.-C.; and F.J.G.d.S.; resources, R.d.C.M.S.-C., R.P.M. and E.C.B.; data curation, R.R.L. and R.d.C.M.S.-C.; writing—original draft preparation, R.R.L.; writing—review and editing, R.R.L., F.J.G.d.S., R.P.M., E.C.B. and R.d.C.M.S.-C.; visualization, F.J.G.d.S., R.P.M., E.C.B. and R.d.C.M.S.-C.; supervision, F.J.G.d.S., R.P.M., E.C.B. and R.d.C.M.S.-C.; project administration, R.d.C.M.S.-C. and R.P.M.; funding acquisition, R.d.C.M.S.-C. and R.P.M. All authors have read and agreed to the published version of the manuscript.
Funding
This research was funded by CAPES: n° 88881.933644/2024-1.
Institutional Review Board Statement
Not applicable.
Informed Consent Statement
Not applicable.
Data Availability Statement
All the data used are available from the corresponding author and will be provided upon request, as this research is still ongoing.
Acknowledgments
The authors would like to thank the Coordination for the Improvement of Higher Education Personnel (CAPES) for the financial support provided under grant number 88881.933644/2024-1.
Conflicts of Interest
The authors declare no conflicts of interest.
References
- Shore, D.; Wilson, J.; Matthews, A.; Yerokhin, A. Adhesive bond strength of PEO coated AA6060-T6. Surf. Coat. Technol. 2021, 428, 127898. [Google Scholar] [CrossRef]
- Lucas, R.; Gonçalves, L.; Santos, D. Morphological and chemical characterization of oxide films produced by plasma anodization of 5052 aluminum alloy in solution containing sodium silicate and sodium phosphate. Rev. Bras. Apl. Vácuo 2020, 39, 33–41. [Google Scholar] [CrossRef]
- Jiang, B.; Chen, Q.; Yang, J. Advances in joining technology of carbon fiber-reinforced thermoplastic composite materials and aluminum alloys. Int. J. Adv. Manuf. Technol. 2020, 10, 2631–2649. [Google Scholar] [CrossRef]
- Ofoegbu, S.; Fernandes, F.; Pereira, A. The Sealing Step in Aluminum Anodizing: A Focus on Sustainable Strategies for Enhancing Both Energy Efficiency and Corrosion Resistance. Coatings 2020, 10, 226. [Google Scholar] [CrossRef]
- Leng, B.; Xue, Y.; Li, J.; Qi, J.; Yi, A.; Zhao, Q. A Critical Review of Anti-Corrosion Chemical Surface Treatment of Aluminum Alloys Used for Sports Equipment. Crystals 2024, 14, 101. [Google Scholar] [CrossRef]
- Ighalo, J.; Obiora-Okafo, I.; Dulta, K.; Omoarukhe, F.O.; Igwegbe, C.A.; Ebhodaghe, S.O. The Anodising Industry Wastewater: Considerations of Its Treatment for Environmental Protection. Water Conserv. Sci. Eng. 2022, 7, 65–76. [Google Scholar] [CrossRef]
- Ali, A.; Nymann, M.; Christensen, M.; Quist-Jensen, C.A. Industrial Wastewater Treatment by Nanofiltration—A Case Study on the Anodizing Industry. Membranes 2020, 10, 85. [Google Scholar] [CrossRef]
- Matin, R.; Totik, Y.; Sukuroglu, E.; Efeoglu, I.; Santos, T.G. Effects of voltage on the components of surface integrity of Al2O3 ceramic coatings on AA2024 by plasma electrolytic oxidation. J. Adhes. Sci. Technol. 2020, 34, 1971–1981. [Google Scholar] [CrossRef]
- Yerokhin, A.; Nie, X.; Leyland, A.; Matthews, A.; Dowey, S.J. Plasma electrolysis for surface engineering. Surf. Coat. Technol. 1999, 122, 73–93. [Google Scholar] [CrossRef]
- Hou, F.; Gorthy, R.; Mardon, I.; Tang, D.; Goode, C. Low voltage environmentally friendly plasma electrolytic oxidation process for titanium alloys. Sci. Rep. 2022, 12, 6037. [Google Scholar] [CrossRef]
- Huang, P.; Wang, F.; Xu, K.; Han, Y. Mechanical properties of titania prepared by plasma electrolytic oxidation at different voltages. Surf. Coat. Technol. 2007, 201, 5168–5171. [Google Scholar] [CrossRef]
- Ma, Y.; Hu, H.; Northwood, D.; Nie, X. Optimization of the electrolytic plasma oxidation processes for corrosion protection of magnesium alloy AM50 using the Taguchi method. J. Mater. Process Technol. 2007, 182, 58–64. [Google Scholar] [CrossRef]
- Shahri, Z.; Allahkaram, S.; Soltani, R.; Jafari, H. Optimization of plasma electrolyte oxidation process parameters for corrosion resistance of Mg alloy. J. Mag. Alloys 2020, 8, 431–440. [Google Scholar] [CrossRef]
- Ropyak, L.; Shihab, T.; Velychkovych, A.; Bilinskyi, V.; Malinin, V.; Romaniv, M. Optimization of Plasma Electrolytic Oxidation Technological Parameters of Deformed Aluminum Alloy D16T in Flowing Electrolyte. Ceramics 2023, 6, 146–167. [Google Scholar] [CrossRef]
- Bajat, J.; Vasilić, R.; Stojadinović, S.; Mišković-Stanković, V. Corrosion Stability of Oxide Coatings Formed by Plasma Electrolytic Oxidation of Aluminum: Optimization of Process Time. Corrosion 2013, 69, 693–702. [Google Scholar] [CrossRef]
- Coto, M.; Troughton, S.; Knight, P.; Joshi, R.; Francis, R.; Kumar, R.V.; Clyne, T.W. Optimization of the microstructure of TiO2 photocatalytic surfaces created by Plasma Electrolytic Oxidation of titanium substrates. Surf. Coat. Technol. 2021, 411, 127000. [Google Scholar] [CrossRef]
- ASTM D3418; Standard Test Method for Transition Temperatures and Enthalpies of Fusion and Crystallization of Polymers by Differential Scanning Calorimetry. ASTM: West Conshohocken, PA, USA, 2021.
- ASTM D3878; Standard Terminology for Composite Materials. ASTM: West Conshohocken, PA, USA, 2023.
- Starke, E.; Staley, J. Application of modern aluminum alloys to aircraft. Prog. Aerosp. Sci. 1996, 32, 131–172. [Google Scholar] [CrossRef]
- ASTM Standard Test Method for Apparent Shear Strength of Single-Lap-Joint Adhesively Bonded Metal Specimens by Tension Loading (Metal-to-Metal). Available online: https://www.astm.org/d1002-10r19.html (accessed on 22 July 2024).
- Lucas, R.; Sales-Contini, R.; Marques, L.; Reis, J.F.; Abrahão, A.B.R.M.; Botelho, E.C.; Mota, R.P. Characterization of the hybrid joint between AA2024-T3 alloy and thermoplastic composite obtained by oxy-fuel welding (OFW). AIMS Mater. Sci. 2024, 11, 585–601. [Google Scholar] [CrossRef]
- Lucas, R. Study of Plasma Electrolytic Oxidation on AA2024-T3 Alloy for Welding with PEI/Fiberglass Composite. Master’s Thesis. Available online: http://hdl.handle.net/11449/234558 (accessed on 22 July 2024).
- Oliveira, V.; Lucas, R.; Carvalho, T.; Carvalho, T.P.; Marques, L.F.; Reis, J.F.; Abrahão, A.B.R.M.; Botelho, E.C. Development of the Oxyacetylene Welding Process for PEI/Glass Fiber Laminates. Weld. J. 2021, 100, 142. [Google Scholar] [CrossRef]
- Wang, J.; Lu, C.; Xiao, C.; Cheng, J.; Ren, R.; Xiong, X. Heat distribution simulation and effects of ultrasonic welding amplitude on carbon fiber/polyetherimide composite joint properties. Mater. Lett. 2023, 340, 134148. [Google Scholar] [CrossRef]
- Rajak, D.; Wagh, P.; Linul, E. Manufacturing Technologies of Carbon/Glass Fiber-Reinforced Polymer Composites and Their Properties: A Review. Polymers 2021, 13, 3721. [Google Scholar] [CrossRef] [PubMed]
- Kumar, R.; Omkumar, M. Investigation of ultrasonic welding of carbon fiber reinforced thermoplastic to an aluminum alloy using a interfacial coating. Mater. Manuf. Process. 2021, 36, 1323–1331. [Google Scholar] [CrossRef]
- Kumar, R.; Omkumar, M. Ultrasonic welding of CF/PA6 composite to 6061Al alloy utilizing an interfacial coating as energy director. J. Adhes. Sci. Technol. 2024, 1–14. [Google Scholar] [CrossRef]
- Graffelman, J. Linear-Angle Correlation Plots: New Graphs for Revealing Correlation Structure. J. Comput. Graph. Stat. 2013, 22, 92–106. [Google Scholar] [CrossRef]
- Reis, J.; Cintra, I.; Marques, L.; Ferrandini, P.L.; Abrahao, A.B.M.; Lima, M.S.F.; Botelho, E.C. Study on YB-laser welding applied on aluminum/polymer composites. J. Adhes. Sci. Technol. 2024, 38, 716–737. [Google Scholar] [CrossRef]
- Abibe, A.; Sônego, M.; Santos, F.; Canto, L.; Amancio-Filho, S. On the feasibility of a friction-based staking joining method for polymer–metal hybrid structures. Mater. Des. 2016, 92, 632–642. [Google Scholar] [CrossRef]
- Scarselli, G.; Quan, D.; Murphy, N.; Deegan, B.; Dowling, D.; Ivankovic, A. Adhesion Improvement of Thermoplastics-Based Composites by Atmospheric Plasma and UV Treatments. Appl. Compos. Mater. 2021, 28, 71–89. [Google Scholar] [CrossRef]
- Aliasghari, S.; Ghorbani, M.; Skeldon, P.; Karami, H.; Movahedi, M. Effect of plasma electrolytic oxidation on joining of AA 5052 aluminium alloy to polypropylene using friction stir spot welding. Surf. Coat. Technol. 2017, 313, 274–281. [Google Scholar] [CrossRef]
- Schäfer, H.; Blaga, L.; Stöver, E.; Klusemann, B. Refill friction stir spot welding of thermoplastic composites: Case study on Carbon-fiber-reinforced polyphenylene sulfide. Thin-Walled Struct. 2023, 191, 111037. [Google Scholar] [CrossRef]
- Achereiner, F.; Münstedt, H.; Zeiler, T. Improved adhesion for thermoplastic polymers using oxyfluorination. J. Phys. Conf. Ser. 2008, 100, 1012032. [Google Scholar] [CrossRef]
- Lucas, R.; Marques, L.; Hein, L.; Botelho, E.C.; Mota, R.P. Experimental Design of the Adhesion between a PEI/Glass Fiber Composite and the AA1100 Aluminum Alloy with Oxide Coating Produced via Plasma Electrolytic Oxidation (PEO). Ceramics 2024, 7, 596–606. [Google Scholar] [CrossRef]
- Mohedano, M.; Lopez, E.; Mingo, B.; Moon, S.; Matykina, E.; Arrabal, R. Energy consumption, wear and corrosion of PEO coatings on preanodized Al alloy: The influence of current and frequency. J. Mater. Res. Technol. 2022, 21, 2061–2075. [Google Scholar] [CrossRef]
- Salazar, J.; Soria, A.; Barrena, M. Welding of AA6061-(Al2O3)p composite: Effect of weld process variables and post-welding heat treatment on microstructure and mechanical properties. Sci. Technol. Weld. Join. 2005, 10, 339–343. [Google Scholar] [CrossRef]
- John, A.; Saeed, A.; Khan, Z. Influence of the Duty Cycle of Pulse Electrodeposition-Coated Ni-Al2O3 Nanocomposites on Surface Roughness Properties. Materials 2023, 16, 2192. [Google Scholar] [CrossRef]
- Kroes, A.; Finley, J. Demystifying omega squared: Practical guidance for effect size in common analysis of variance designs. Psychol. Methods 2023. [Google Scholar] [CrossRef] [PubMed]
- ASTM Standard Practice for Classifying Failure Modes in Fiber-Reinforced-Plastic (FRP) Joints. Available online: https://www.astm.org/d5573-99r19.html (accessed on 22 July 2024).
- Frutuoso, F.; Vitoriano, J.; Junior, C. Controlling plasma electrolytic oxidation of titanium using current pulses compatible with the duration of microdischarges. Results Mater. 2022, 15, 100310. [Google Scholar] [CrossRef]
- Garchani, F.; Lgaz, H.; Kaya, S.; Lee, H.-S.; Ibrahim, S.M.; Chafiq, M.; Ko, Y.G.; Kabiri, M.R. Effects of heat treatment on the corrosion behavior and mechanical properties of aluminum alloy 2024. J. Mater. Res. Technol. 2023, 25, 1355–1363. [Google Scholar] [CrossRef]
- Kumar, N.; Pramod, G.; Samrat, P.; Samrat, P.; Sadashiva, M. A Critical Review on Heat Treatment of Aluminium Alloys. Mater. Today Proceed 2022, 58, 71–79. [Google Scholar] [CrossRef]
- Droździel-Jurkiewicz, M.; Bieniaś, J. Evaluation of Surface Treatment for Enhancing Adhesion at the Metal–Composite Interface in Fibre Metal-Laminates. Materials 2022, 15, 6118. [Google Scholar] [CrossRef] [PubMed]
- Mohan, H.; Barazanchy, D.; Tooren, M. Mitigation of edge effects in induction welding by the use of magnetic composite concentrators. In Proceedings of the AIAA SciTech Forum 2022, San Diego, CA, USA & Virtual, 3–7 January 2022. [Google Scholar]
- Liu, S.; Sinke, J.; Dransfeld, C. An inter-ply friction model for thermoset based fibre metal laminate in a hot-pressing process. Compos. B Eng. 2021, 227, 109400. [Google Scholar] [CrossRef]
- Guo, Y.; Zhao, H.; Zhai, D.; Gao, Z.; Li, Q.; Chen, X.; Zhao, G. Micro/nano dual-scale porous surface structure of the Al alloys and improvement on the joint strength with carbon fiber reinforced PA 6 thermoplastic. Compos. B Eng. 2023, 249, 110407. [Google Scholar] [CrossRef]
- ASTM G102: 2015; Standard Practice for Calculation of Corrosion Rates and Related Information from Electrochemical Measurements. ASTM: West Conshohocken, PA, USA, 2015.
- Fatimah, S.; Kamil, M.; Han, D.; Al-Zoubi, W.; Ko, Y.G. Development of anti-corrosive coating on AZ31 Mg alloy subjected to plasma electrolytic oxidation at sub-zero temperature. J. Magnes. Alloy 2022, 10, 1915–1929. [Google Scholar] [CrossRef]
- Fattah, A.; Chaharmahali, R.; Alizad, S.; Kaseem, M. Corrosion behavior of composite coatings containing hydroxyapatite particles on Mg alloys by plasma electrolytic oxidation: A review. J. Magnes. Alloy 2023, 11, 2999–3011. [Google Scholar] [CrossRef]
- Marcuz, N.; Ribeiro, R.; Rangel, E.; da Cruz, N.C.; Correa, D.R.N. The Effect of PEO Treatment in a Ta-Rich Electrolyte on the Surface and Corrosion Properties of Low-Carbon Steel for Potential Use as a Biomedical Material. Metals 2023, 13, 520. [Google Scholar] [CrossRef]
- Premchand, C.; Manojkumar, P.; Lokeshkumar, E.; Ravisankar, B.; Rameshbabu, N. Surface characteristics of AC PEO coatings fabricated on commercial Al alloys. Surf. Coat. Technol. 2022, 449, 128975. [Google Scholar]
- Liu, G.; Lu, X.; Zhang, X.; Zhang, T.; Wang, F. Improvement of corrosion resistance of PEO coatings on Al alloy by formation of ZnAl layered double hydroxide. Surf. Coat. Technol. 2022, 441, 128528. [Google Scholar] [CrossRef]
- Wang, D.; Kijkla, P.; Saleh, M.; Kumseranee, S.; Punpruk, S.; Gu, T. Tafel scan schemes for microbiologically influenced corrosion of carbon steel and stainless steel. J. Mater. Sci. Technol. 2022, 130, 193–197. [Google Scholar] [CrossRef]
- Skinner, W. Influence of experimental inaccuracies on corrosion rates and Tafel slopes determined from electrochemical measurements in different overpotential ranges. Corrosion Eng. Sci. Technol. 1987, 22, 172–175. [Google Scholar] [CrossRef]
- Lucas, R.; Mota, R.; Abrahão, A.; Botelho, E.C.; Sales-Contini, R.C.M. Characterization of oxide coating grown by plasma electrolytic oxidation (PEO) at different times on aluminum alloy AA2024-T3. MRS Commun. 2022, 12, 266–271. [Google Scholar] [CrossRef]
- Villanueva, S.; Tamayo, J.; Cerón, D.; Mercado, D.F.; Torres-Palma, R.A.; Riassetto, D.; Riva, J.S.; Amaya-Roncancio, S.; Castilla-Acevedo, S.F. Impact of the duty cycle on the morphology and photocatalytic properties of S-TiO2 obtained by plasma electrolytic oxidation to treat real electroplating wastewater contaminated with Cr6+. J. Environ. Chem. Eng. 2023, 11, 110246. [Google Scholar] [CrossRef]
- Xhanari, K.; Finšgar, M. Organic corrosion inhibitors for aluminum and its alloys in chloride and alkaline solutions: A review. Arab. J. Chem. 2016, 12, 4646–4663. [Google Scholar] [CrossRef]
- Gobara, M.; Baraka, A.; Akid, R.; Zorainy, M. Corrosion protection mechanism of Ce4+/organic inhibitor for AA2024 in 3.5% NaCl. RSC Adv. 2020, 10, 2227–2240. [Google Scholar] [CrossRef] [PubMed]
- Zamani, P.; Valefi, Z.; Jafarzadeh, K. Comprehensive study on corrosion protection properties of Al2O3, Cr2O3 and Al2O3–Cr2O3 ceramic coatings deposited by plasma spraying on carbon steel. Ceram. Int. 2022, 48, 1574–1588. [Google Scholar] [CrossRef]
- Nagai, T.; Taoka, N.; Ohta, A.; Makihara, K.; Miyazaki, S. Effects of Cl passivation on Al2O3/GaN interface properties. Jpn. J. Appl. Phys. 2022, 62, SA1002. [Google Scholar] [CrossRef]
- Shi, Y.; Dai, Y.; Gao, G.; Cheng, C.; Song, Y. Study of the corrosion process of a PEO-treated aluminum alloy in different concentrations of NaCl. Mater. Technol. 2022, 56, 407–414. [Google Scholar] [CrossRef]


Disclaimer/Publisher’s Note: The statements, opinions and data contained in all publications are solely those of the individual author(s) and contributor(s) and not of MDPI and/or the editor(s). MDPI and/or the editor(s) disclaim responsibility for any injury to people or property resulting from any ideas, methods, instructions or products referred to in the content. |
© 2024 by the authors. Licensee MDPI, Basel, Switzerland. This article is an open access article distributed under the terms and conditions of the Creative Commons Attribution (CC BY) license (https://creativecommons.org/licenses/by/4.0/).