Article

Ergonomic Assessment of Key Biomechanical Factors in Patient Lifting: Results from a Cross-Sectional Study

by
Karolis Senvaitis
1,*,
Aušra Adomavičienė
2,
Alina Tomaševič
2,
Radvilė Kernagytė
2,
Ada Petrauskaitė
2 and
Kristina Daunoravičienė
1
1
Department of Biomechanical Engineering, Vilnius Gediminas Technical University, LT-10223 Vilnius, Lithuania
2
Department of Rehabilitation, Physical and Sports Medicine, Vilnius University, LT-01131 Vilnius, Lithuania
*
Author to whom correspondence should be addressed.
Appl. Sci. 2024, 14(17), 8076; https://doi.org/10.3390/app14178076
Submission received: 20 July 2024 / Revised: 24 August 2024 / Accepted: 30 August 2024 / Published: 9 September 2024
(This article belongs to the Section Applied Biosciences and Bioengineering)

Abstract

:
This study includes an ergonomic evaluation of patient lifting motion performed by healthcare specialists. This analysis focuses on the neck, shoulder, and elbow, as these are statistically significant areas with insufficient research data. Data collection was conducted using the Movella Xsens system as a standard 17 IMU (inertia measurement unit) marker set. A total of 44 test subjects participated, resulting in 396 measurements. A mathematical model was presented, including the main expressions and a three-dimensional moment arm of the shoulder calculation determining both the moment and accumulated moment. The patient load profile was measured in the experiment and parametrically integrated into the mathematical model. Ergonomic limits were calculated and presented, showing that during the lifting motion, the neck exceeds its ergonomic limit by 66%, the shoulders by 49%, and the elbow by 76%. The accumulated moment can vary by up to 23% depending on different evaluated techniques or data cross-sections. The model was verified by comparing it with data from other experiments, and recommendations were presented based on the findings, along with suggestions for future research development in the area.

1. Introduction

Social, medical, or any other care closely related to patient lifting is becoming more and more needed. Based on Eurostat data, the number of specialists in nursing or similar sectors has increased by 16.6% in the 2012 to 2020 timespan. Furthermore, in 2021, based on statistical data, more than 40% of specialists in the healthcare sector are older than 55 years. Musculoskeletal system disorders are often a challenge to the longevity and satisfaction of specialists’ careers [1]. Chronical illness often arises from significant or uncomfortable loads that are closely associated with patient handling or lifting. Load distribution in healthcare specialists is often foreseen in the neck, lower back, shoulder, knees, and elbows. The lifting motion is a complex and difficult maneuver, not only to perform but to measure and research too [2]. Existent standards like ISO 11228 [3] or RULA [4] state some recommendations, like different angle evaluation and weight, but they are very limited in their definition. None of these standards state exposure times in different risk zones or how the accumulation of these loads works or impacts our joints in the long term. This shows the limitation of these standards and the probable lack of research evidence allowing us to broaden the standards.
Statistical research shows that the neck, shoulder, and elbows are among the top five musculoskeletal segments that sustain injury. The other two are often the lower back or knees, but these segments are explored more in numerous research studies than the motions and loads of the arms and neck. Based on five different and independent research studies varying in sample size and country, neck muscle skeletal disorder probability is around 0.331–0.501, shoulder muscle skeletal disorder probability is around 0.346–0.453, and elbow muscle skeletal disorder probability is around 0.055–0.273 [5,6,7,8,9]. Healthcare professionals, especially nursing and rehabilitation specialists, are often faced with patient lifting tasks that cannot be planned in advance. These tasks often include helping patients stand up and moving them from the bed back into the bed. Often, this means that the body position is ergonomically incorrect, based on different scenarios, patient body type, and given physical conditions. Since a living person is being lifted, complexity is higher than most of the other industry tasks. Not only can a patient’s physical disability be a factor, but their mental condition can be, too, which healthcare specialists must be aware of, as it might impact their lifting technique. Although a “no-lift” policy is being established in Europe, many specialists still perform lifting tasks manually, often without using specialized equipment. Their responsibility for the patient’s comfort often means that nurses or other healthcare specialists may not consider the long-term effects on their own bodies, as their focus is on meeting the immediate needs of the patient. Analyzing what forces and loads accumulate in the specialist’s body during these motions serves as an important aspect of biomechanical analysis [10,11,12].
All these factors contribute not only to the complexity of the motion but also to the need to research it and understand it better. Data gathered from researching such motions can inform recommendations for standards, medical diagnoses, risk assessments, and the development of engineering solutions that may reduce or eliminate the load during lifting. It is even stated that musculoskeletal disorders are one of the main reasons for skipping work, frequently visiting the doctor, or being forced to entirely change work positions [13]. But chronic musculoskeletal illness is as important as rapid injuries, which can often be identified from the evaluation of a performed technique or its factors, as the loads handled are way above what is recommended [14]. Chronic illnesses, such as chronic neck pain, bursitis, and rotator cuff tendinopathy, are harder to predict and evaluate, but their basis is similar to that of acute injuries—strain exceeding what the tissue can handle. The main difference is that long-term trauma results from accumulation over time, while acute injuries, such as cervical or shoulder strain or rotator cuff tear, occur from a high peak load sustained during motion. Therefore, it is important to identify problematic motion patterns and the factors affecting them, as these impact both acute and chronic musculoskeletal disorders. Good data models and engineering measurements make a direct and important contribution to healthcare.
This paper aims to present research analyzing healthcare specialists during patient lifting motion. The evaluation is conducted using different data cross-sections to distinguish the effects of various techniques. This is carried out using motion-capture equipment and a developed mathematical model while calculating the statistical significance of every significant data set being presented. The initial goal is to improve a methodology that would enhance the effectiveness of evaluations and calculations, ultimately improving conditions for healthcare specialists. This is conducted with a presented mathematical model and experimental data-capture methodology, practically calculating patient load. Additionally, this study demonstrates that ergonomic evaluation can be performed using data from the IMU system without relying on numerous complex and difficult-to-obtain criteria.

2. Materials and Methods

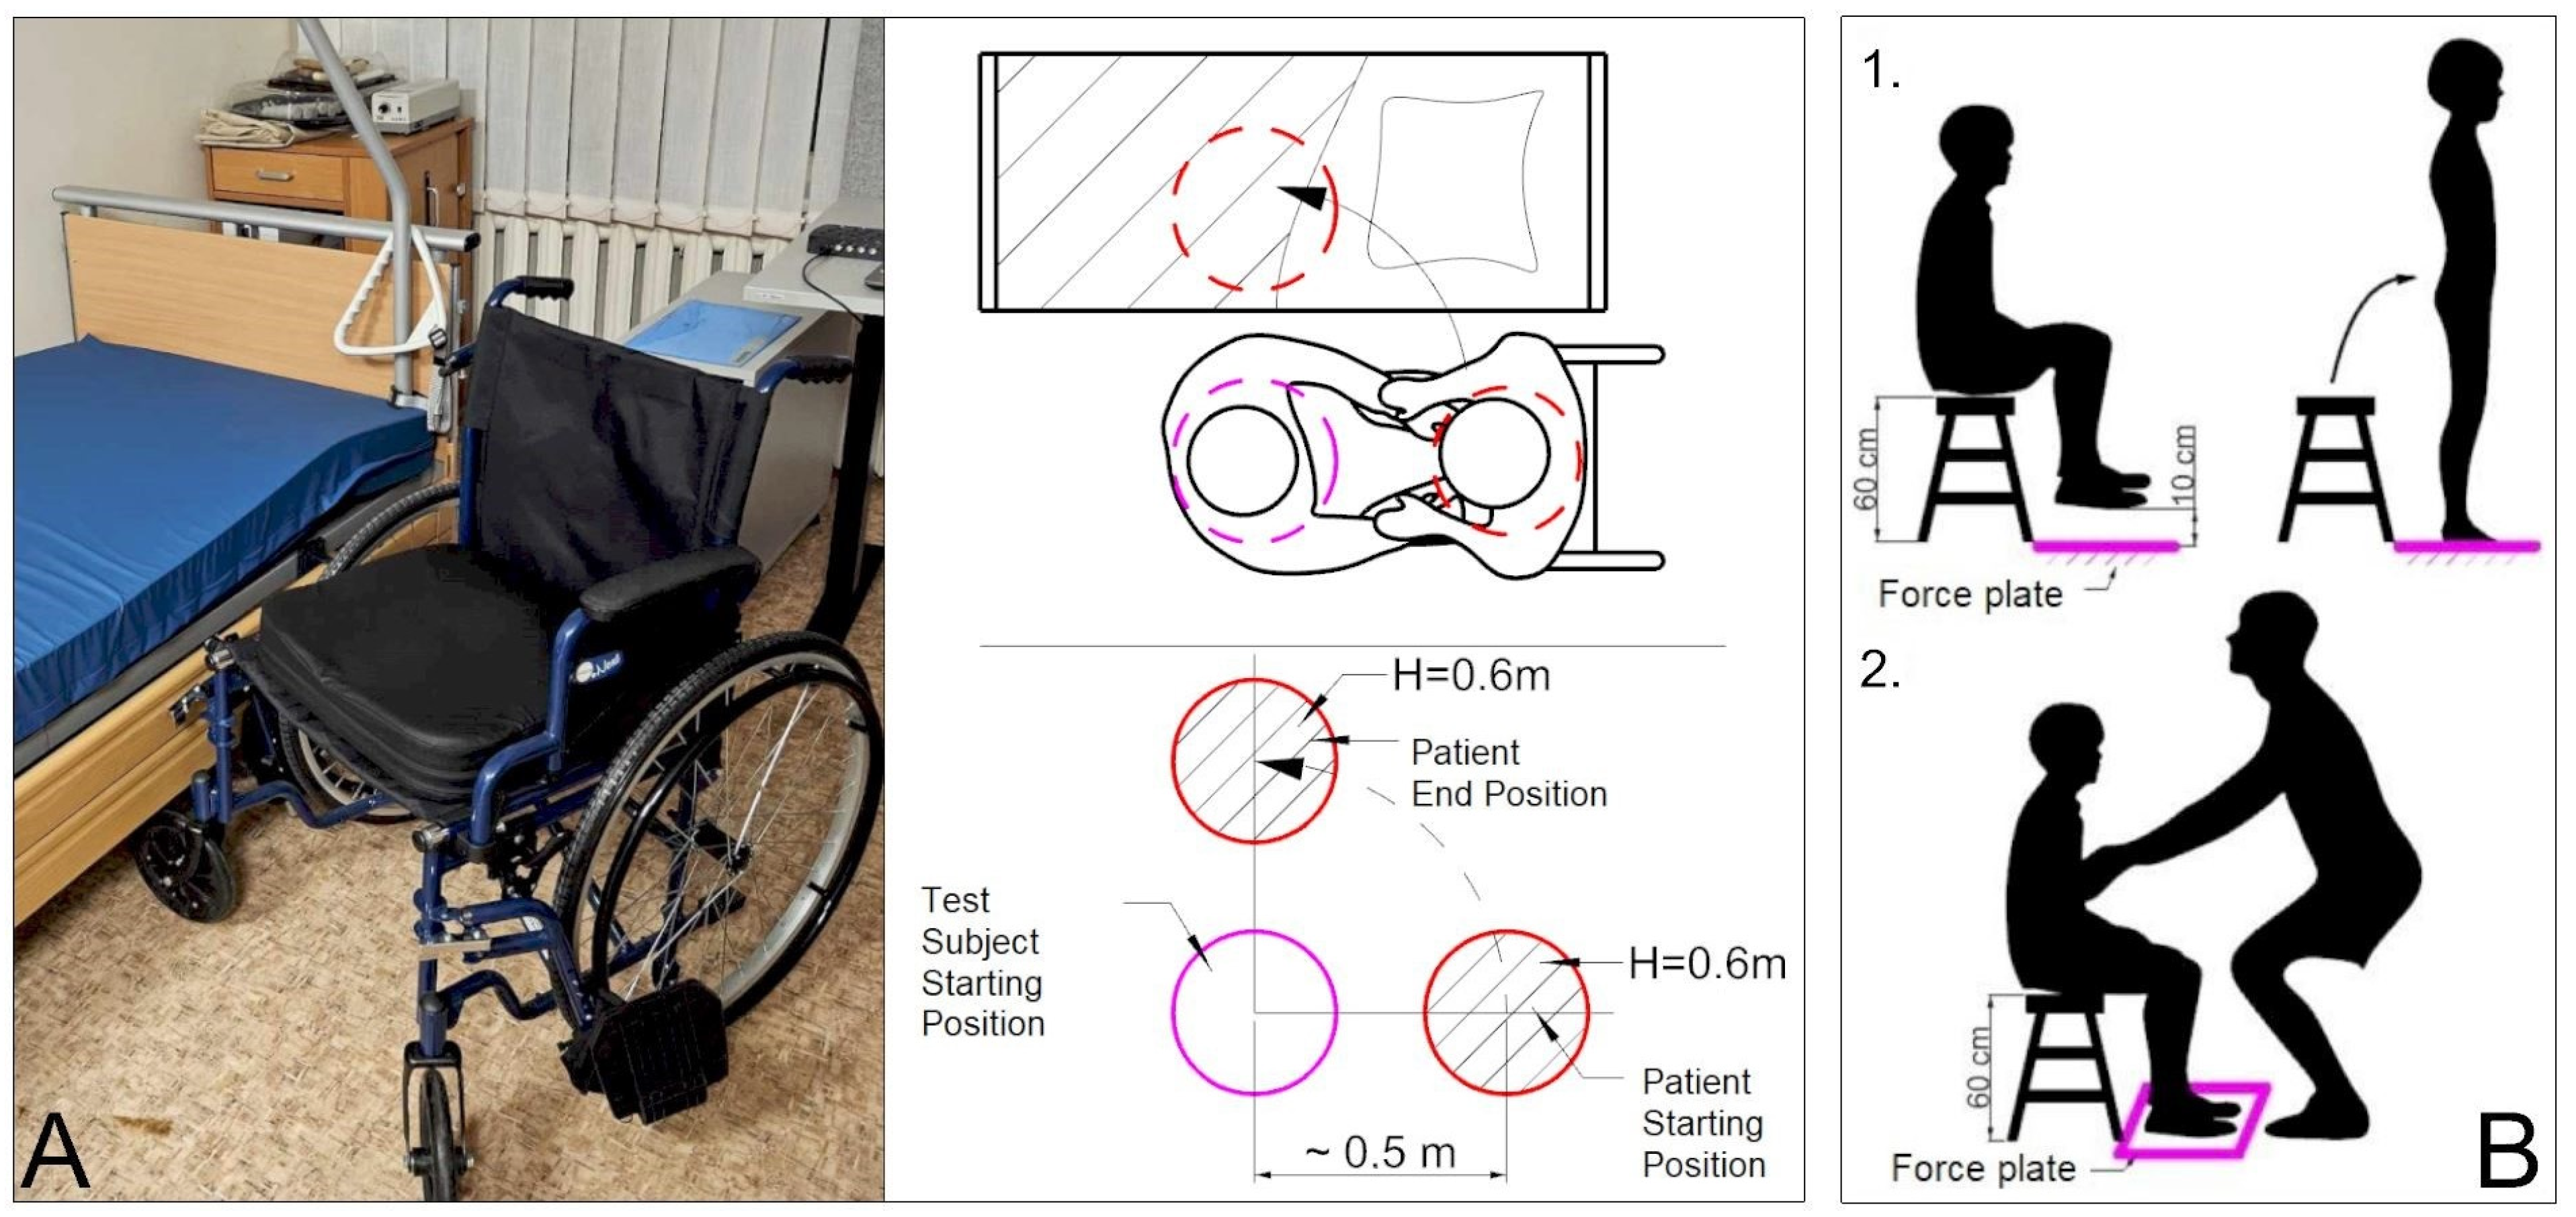
2.1. Test Subject and Research Procedure

For this experiment, healthcare specialists were gathered, primarily consisting of nurses and rehabilitation specialists. In total, 44 participants (16 men and 28 women) were recruited for this research. The average age was 28 ± 12 years, average height was 175.11 ± 11.58 cm, and average weight was 75.30 ± 12.58 kg. The sample size was calculated using GPower 3.1.9.7. for a statistical power of 0.95, an effect size of 0.475, and a significance level of 0.05, assuming a two-tailed data distribution. The calculation determined that 34 test subjects would suffice for single-tailed analysis. Each participant underwent 9 measurements, resulting in a total of 396 data measurements analyzed for this research. Additionally, test subjects were required to complete a form providing supplementary cross-sectional data. This form was used to evaluate test subjects’ physical readiness based on sport activities they engage in and their frequency, together with other properties. This was a qualitative assessment granting scores from 1 to 10 to each of the test subjects. The goal was to study the possible correlation between fitness level and research results. Furthermore, test subjects were allocated to distinctive groups, which had been formed according to the results of their respective measurements. These data sets were used for comparison with the full research sample size. Groups were formed according to the following criteria: age, physical readiness, tenure, and gender. Age groups were divided into younger than 25 y.o. (n = 243), between 25 and 35 y.o. (n = 99), and older than 50 y.o. (n = 53). Test subject’s physical readiness level was judged by score, with low score (n = 126) being below 6, mid score (n = 171) being 6 to 8, and high score (n = 99) being 9 to 10. Further criteria were tenure, first group having less than 1 year (n = 207), second group having 1 to 3 years (n = 99), and third group having more than 3 years of tenure (n = 90). Another group divided test subjects according to their gender, categorizing them as male (n = 144) and female (n = 252). The last group consisted of different lift scenarios, described in the next paragraph, each containing of same amount of measurements (n = 132).
For this research, the motion of lifting a patient from a wheelchair to a bed was selected. This motion is based on techniques physiotherapists normally use in their work environments. The motion comprises three main phases: lifting, transferring, and putting down. The lifting and putting down are symmetrical motions, distinguishable by observing knee flexion/extension, as knees extend during lifting phase and flex during putting-down phase. Transferring phase involves trunk rotation and a shift in the center of gravity, increasing the complexity and potential risk of injury associated with this motion. This phase is identified as a gap between lift and put-down motions. Furthermore, three scenarios were chosen to evaluate possible technique and motion changes:
  • The first scenario simulates a heavily physically disabled person, where patient does not assist the test subject in any way and remains relaxed. Patient’s hands are down.
  • The second scenario simulates a patient with ability to move above the waist, where the assistance is provided by the patient placing their hands on the test subject’s shoulders. The patient cannot stand on their own, and the assistance is minimal.
  • Similarly to the first scenario, in the third scenario, the patient does not assist at all, but in this case, test subject uses ergonomical belt during the lifting. Patient’s hands are down, and body is relaxed.
For consistency, the same person (180.10 cm height and 65.27 kg weight) participated as the patient in all the measurements to minimize the potential environmental variables.
Main study procedure and sequence are shown in Figure 1. Test subject was equipped with the IMU marker system—Xsens Movella. This system was chosen because it offers great flexibility working with larger measurement sample sizes and small number of errors that would require repeating the measurement. A standard systems marker set was used, consisting of 17 markers in total. Data were captured at 60 Hz. The system was calibrated while standing and walking. Afterward, three different scenarios were performed with three repetitions each. In total, nine measurements were taken for each test subject. After each measurement, a visual inspection was conducted to ensure data consistency and quality. The measurement was repeated if any issues were detected with the data. Once all data were collected, batch HD processing was performed to smooth out, recenter, and improve the data. HD smoothing was carried out in Movella Xsens MVN 2023.2 software package. Processed position data of 17 markers were exported in .xlsx format. This file was directly plugged into a model created in Rhino Grasshopper 7 SR34 software package. Test subjects’ individual anthropometric data were captured before conducting the measurement. For data that could not be directly measured, such as segment weights and center of gravity distances, calculations were based on the Hall, S. K., and Williams R. L. methods, as these are widely utilized [15,16,17]. Individualization in the model involves scaling limb marker positions according to the specific measurements of each subject. The same individualized scaling was applied in the mathematical moment calculation. The patient load force profile was integrated into model, parametrizing it based on the duration of each measurement.
After completing the calculations in the model, the data were normalized by patient height and time. However, normalization was applied only to the joint moment and motion amplitude data, while the accumulated moment was excluded from normalization. This approach was taken because the duration of motion significantly influences the accumulation of load. In the final steps, the data were grouped based on different test subject parameters. Statistical calculations were then performed on these grouped data sets, presented, and evaluated.
The lifting procedure scheme is presented in Figure 2A. Both surfaces are adjusted to an exact height of 0.6 m. The wheelchair is positioned at an angle near the bed, with its brakes engaged. The test subject approaches the patient, and the motion analysis begins when he/she starts bending. The end position of the motion is defined when the test subject stands up, straightens their back, and positions their head in a neutral or semi-neutral position.
The experimental scheme to determine the patient load profile is presented in Figure 2B. Due to the motion’s complexity, the need for additional equipment, and the large sample size, real-time measurement of patient’s loads proves challenging. Consequently, it was decided to conduct an experiment that would allow the determination of load profile of a patient, leveraging the consistency of using the same patient across all measurements. For this experiment, a BTS P-6000 force plate was employed, initially recoding at 250 Hz. A total of ten measurements were conducted. The experiment consists of two independent measurements:
  • The patient begins by sitting on the chair without touching the force plate, with legs lifted. The measurement commences when the patient stands on the force plate, remains standing for a few seconds, and then returns to a seated position on the chair. This is presented in Figure 2B(1) scenario.
  • The second measurement begins with the patient sitting on the chair with their legs touching the force plate. The patient is lifted by the test subject between two surfaces, replicating the main research scenario. Throughout the lift, the patient keeps their legs on the force plate, allowing measurement of the remaining force. This setup enables continuous measurement of the force exerted while the patient’s legs remain in contact with the force plate throughout the lifting motion. This presented in Figure 2B(2) scenario.
The patient load profile on the test subject is determined by subtracting the full gravitational force of the patient from the gravitational force that remains unengaged while the test subject lifts the patient.
F i L = F i S F i K ,
Here, F i L represents the patient load for the test subject at a given time frame i. F i S is the patient ground reaction force (GRF) while standing on the force plate at the same given time frame i. F i K stands for the load at a given time frame i, which remains on the force plate while the test subject lifts the patient.

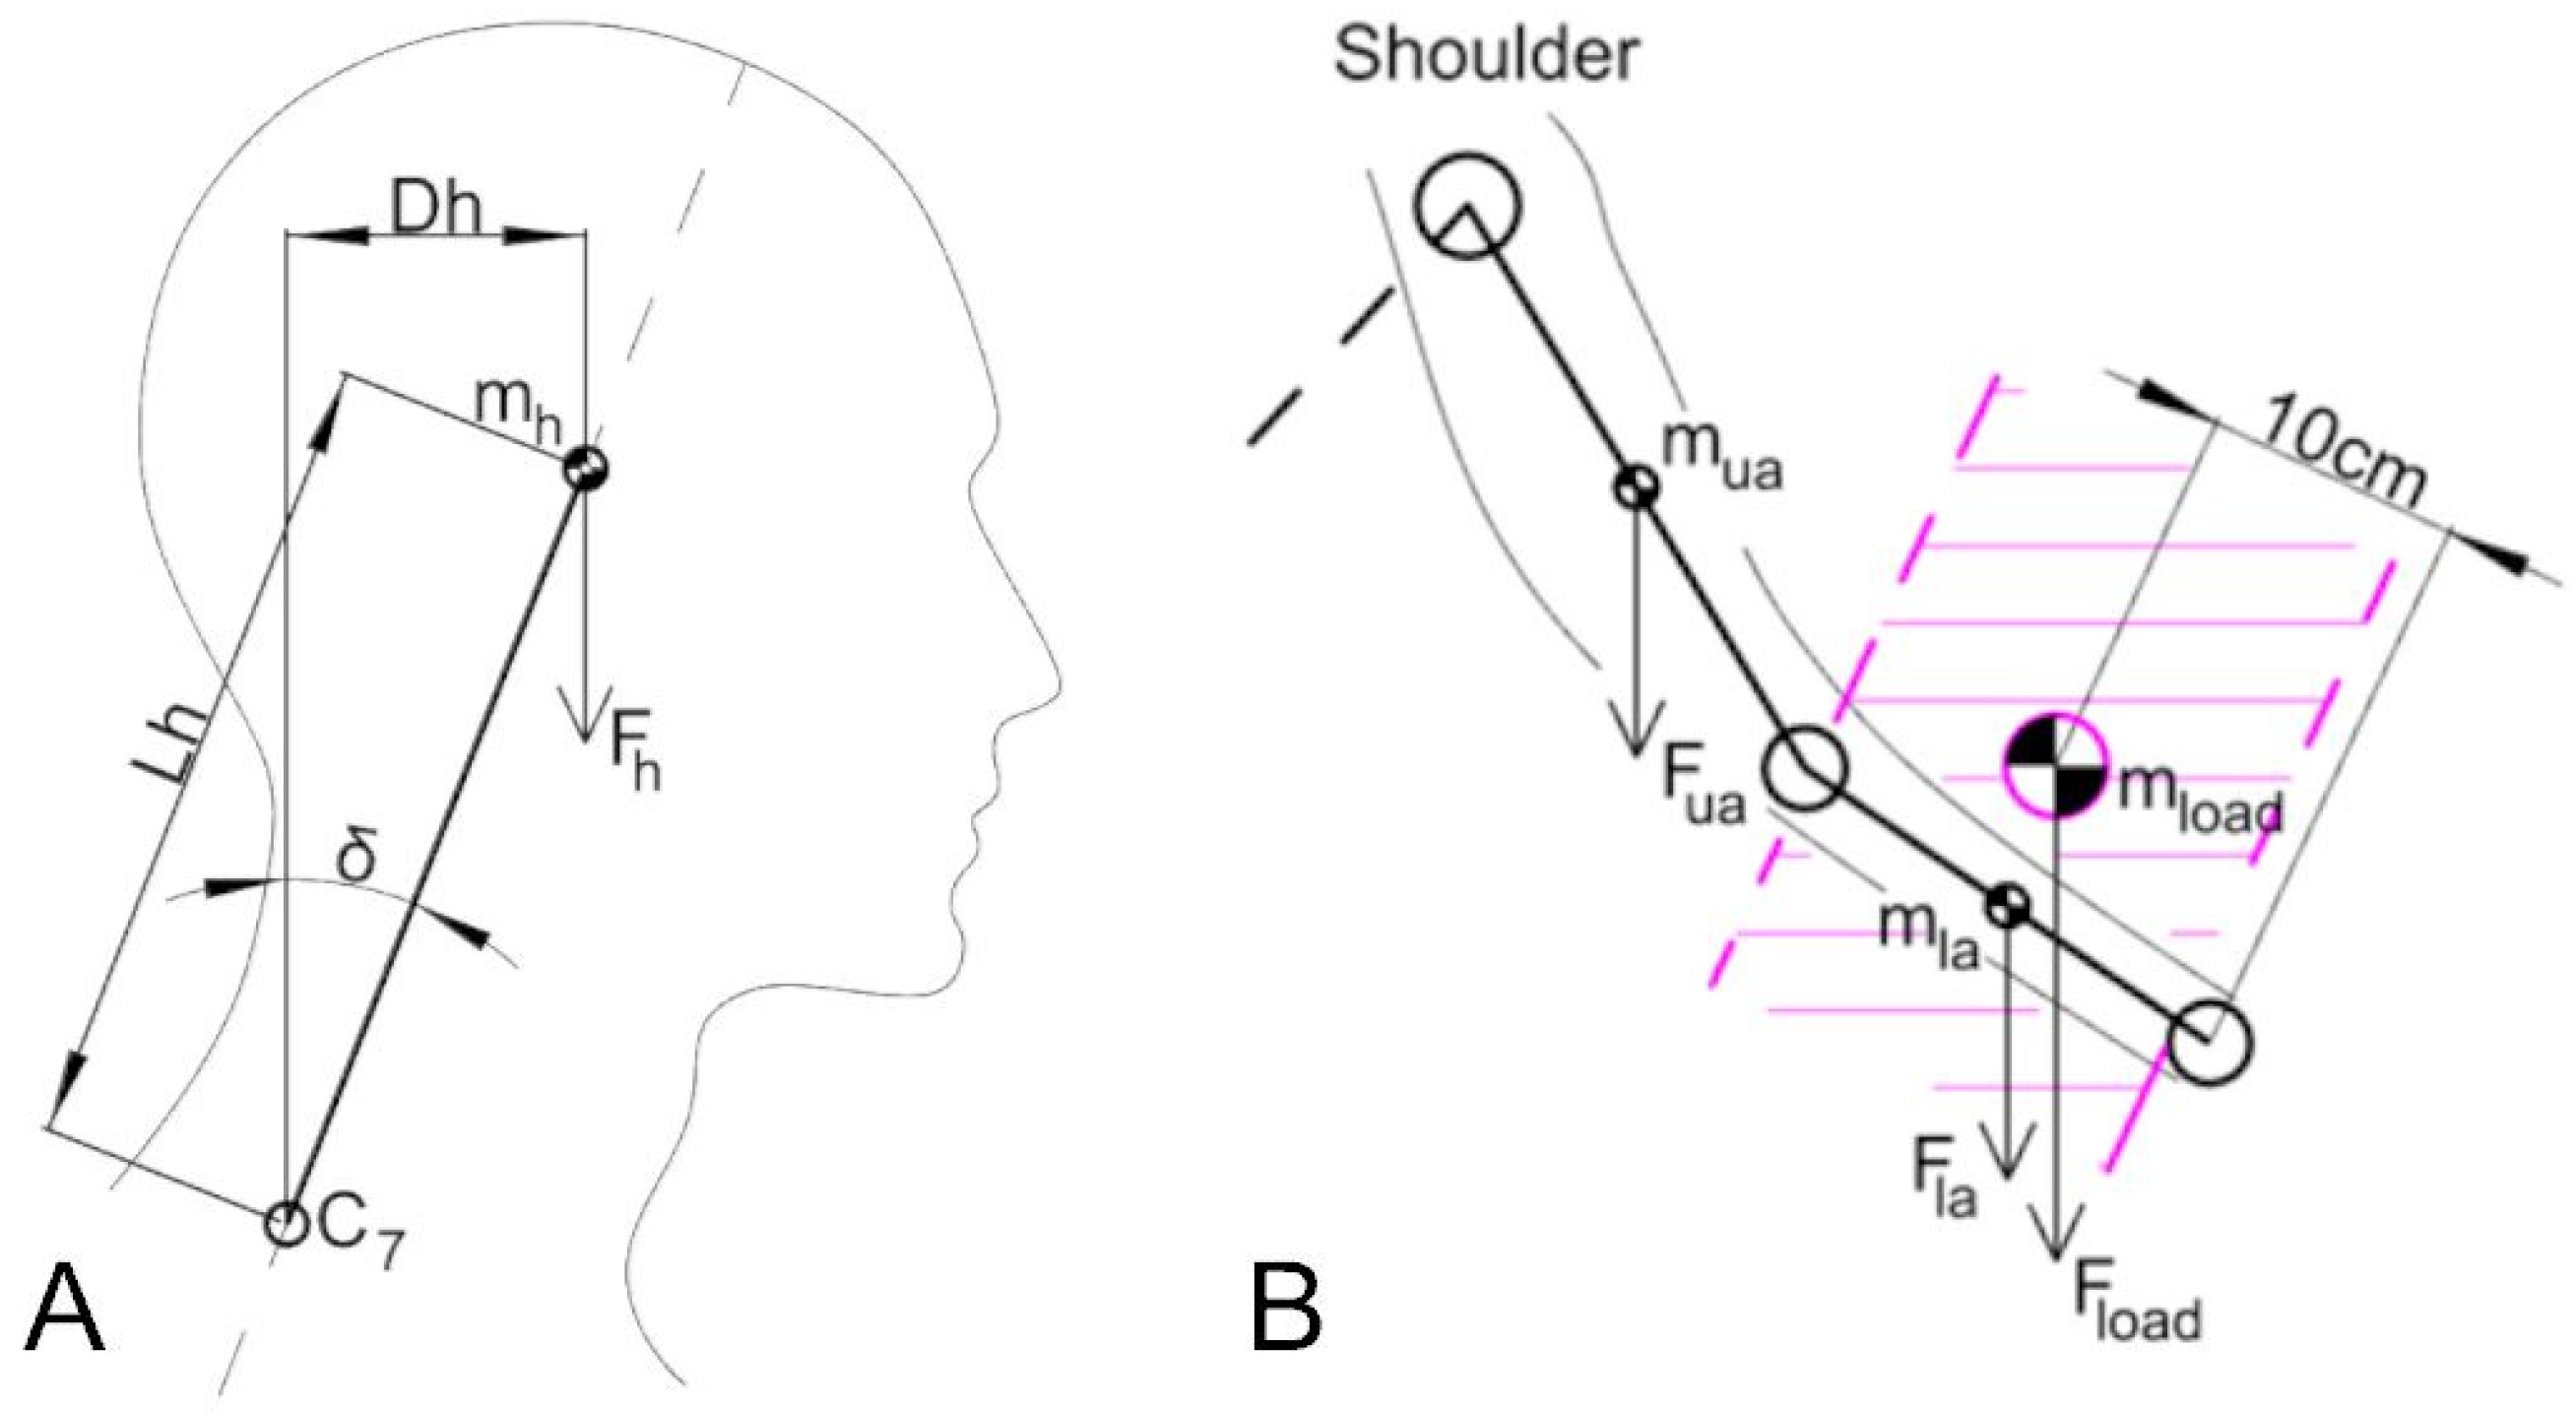
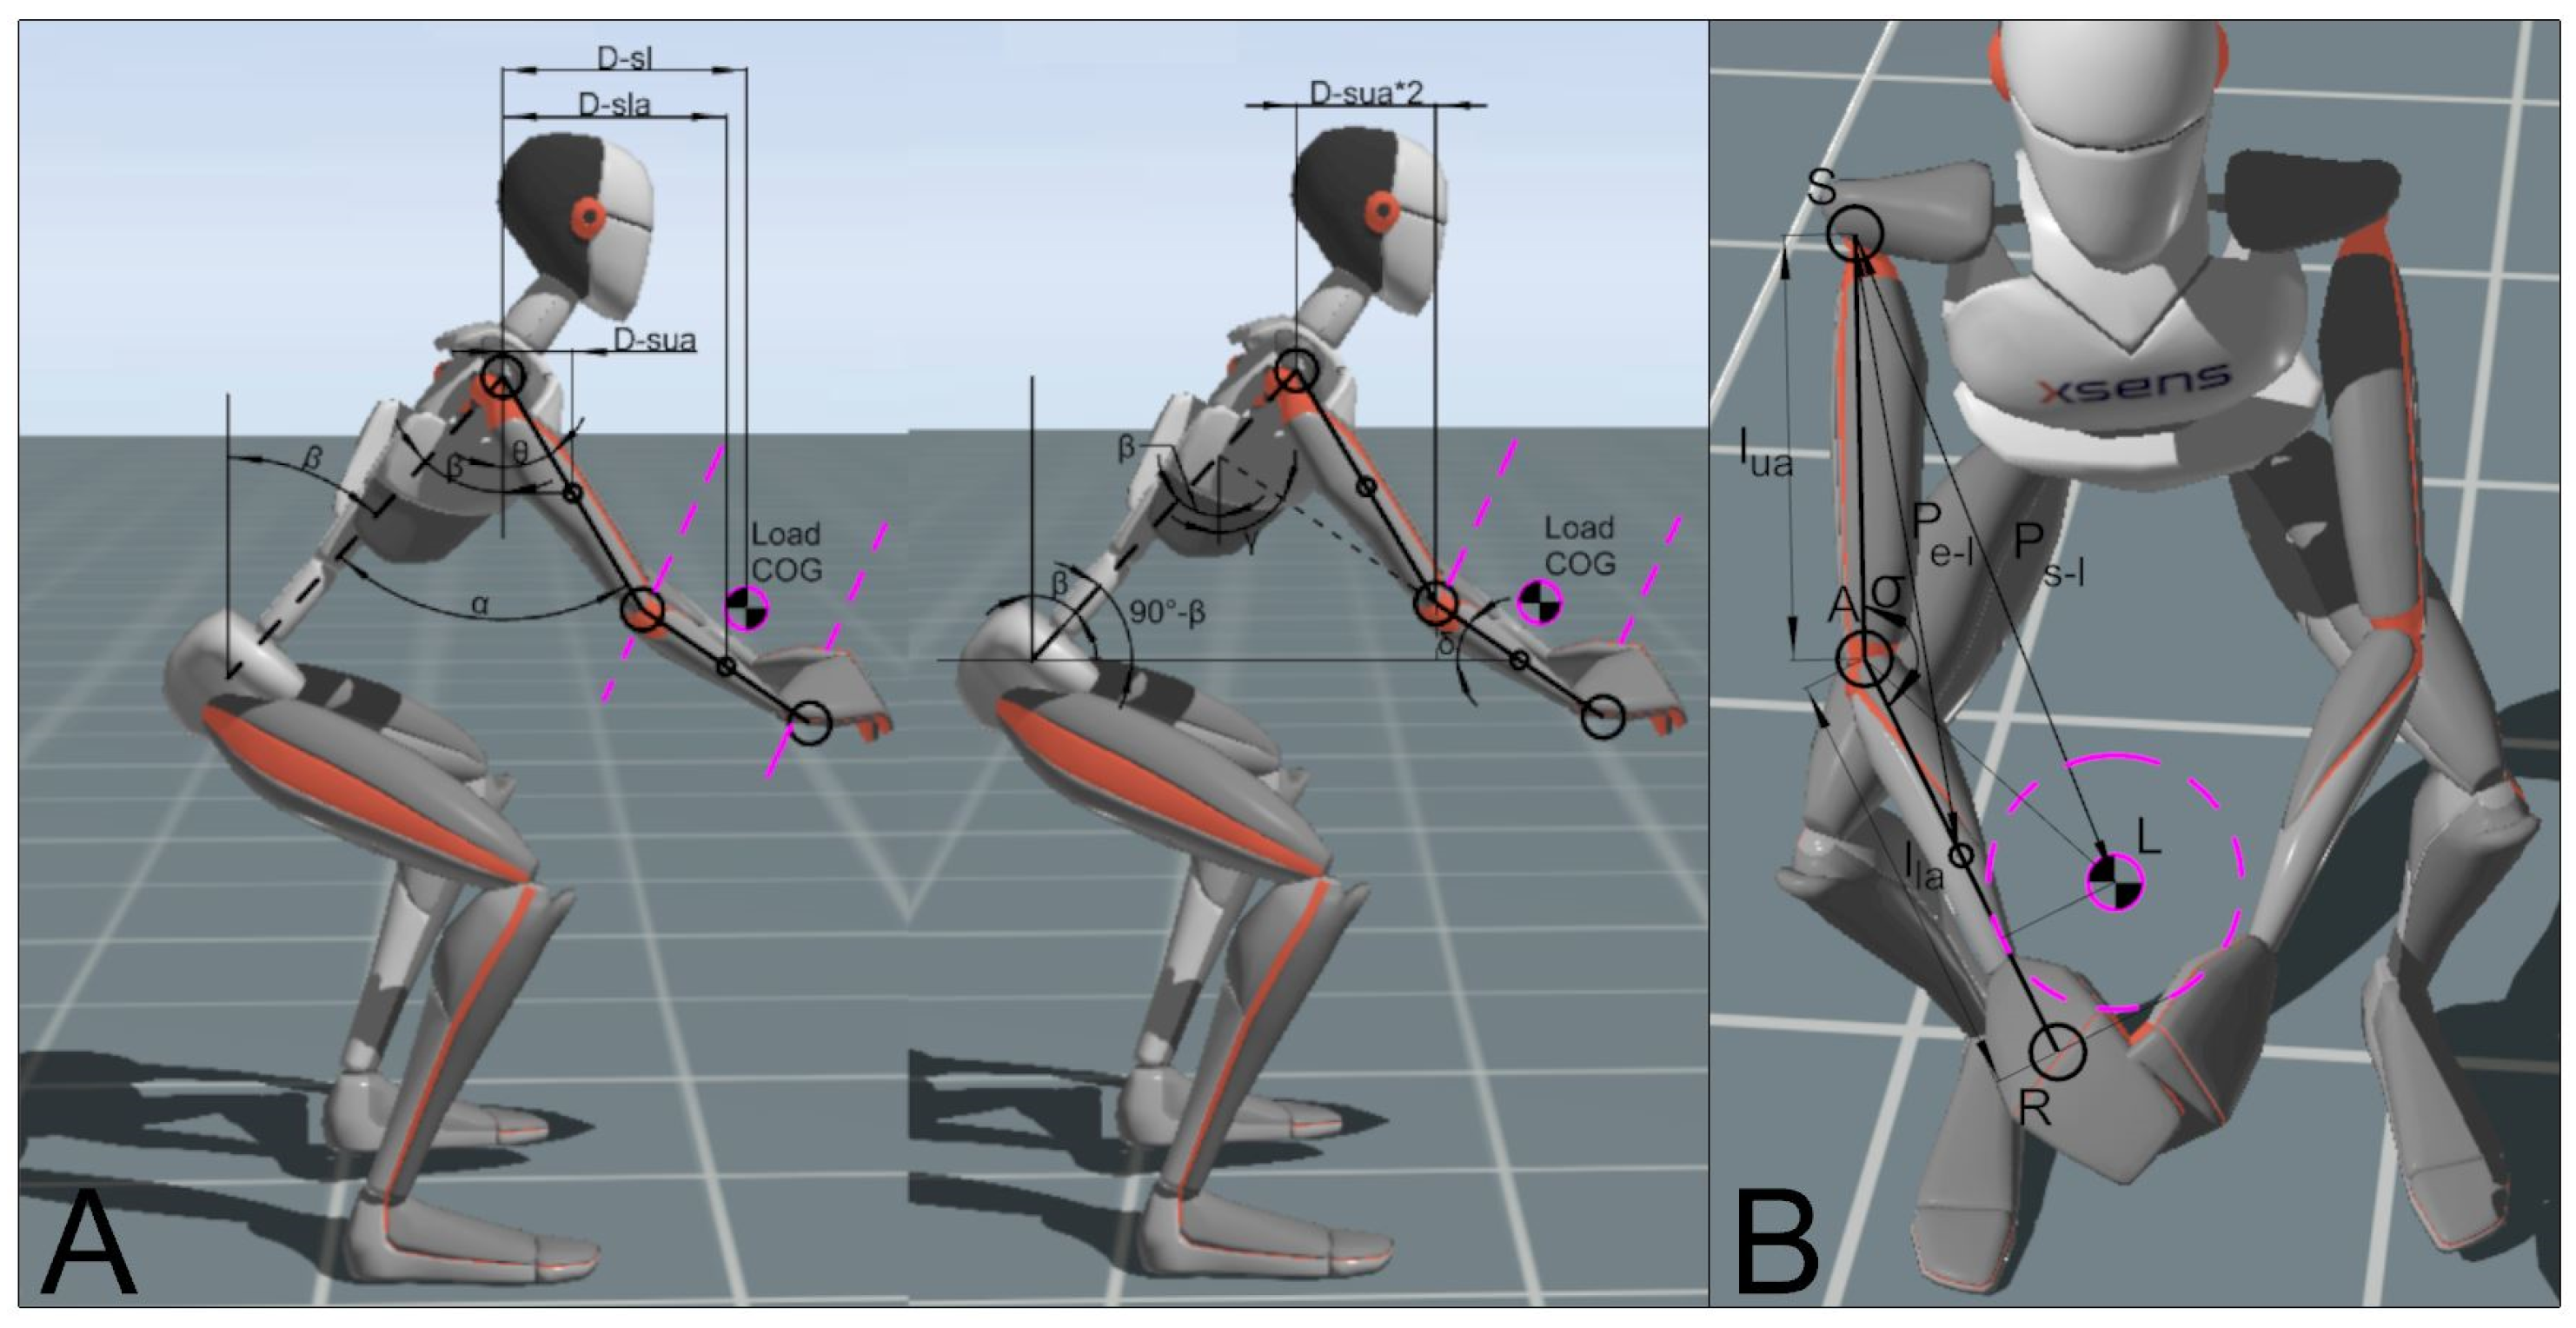
2.2. Mathematical Methods

A simplified mathematical model was employed for this research, primarily focusing on simplifying shoulder anatomy for moment calculations. It assumes a single point of shoulder contact, consistent with similar studies where moments are estimated [18,19].
Figure 2. The experiment lifting procedure environment and schematical view: (A)—patient transfer motion capture setup; (B)—patient load evaluation: (B.1)—patient reaction force estimation; and (B.2)—patient leftover reaction force estimation [20].
Applsci 14 08076 g002
The neck kinetic chain is open, and it consists of one main segment—the head. The most significant factor influencing neck moment is overall position of the head, which is defined by an angle. All ergonomic angles may affect head’s angle, and while flexion and extension are biggest contributors to shoulder moment arm, it is important to be able to evaluate all angles. Figure 3A presents the principal schematic for head moment calculation in this model.
Based on the head moment calculation schematic (Figure 3A), the head moment arm is determined as the projection of the distance between the C7 vertebra and the head’s center of gravity. The calculation for this moment is expressed as follows:
S N = F h · D h = ( m h · g ) · ( cos δ · L h ) ,
Here, S N represents the neck moment, F h denotes the gravitational force at the center of mass, and D h is the shoulder arm of head. m h is mass, g is gravitational constant, and L h signifies the distance between C7 and mass center of the head. This representation is applicable to both 2D and 3D environments, depending on how L h and δ are defined in the calculation. In this case, 3D vectors were defined in Rhino Grasshopper computational model to obtain representative values based on the marker positions.
Figure 3B illustrates principal schematics for shoulder and elbow moment calculation. An additional simplification assumes the lower arm is a conjunction of the wrist and forearm. The load center of mass is calculated to be 10 cm closer than end of lower arm segment, based on approximated trunk size of the patient. Center of mass and other parameters are calculated accordingly. Center of mass calculation schematics are shown in Figure 4 and described in Expression (3) based on the Pamula, H. center of mass calculator [21]. The hand position is assumed to be clenched, as the patient is held during lifting. All the other dimensions and masses are calculated based on individual data.
X l a = m d · X d + m p · X p m d + m p ,
Here, X l a is the lower arm COG distance from elbow side. Other parameters are masses and COG distances, accordingly, with d representing lower arm and p representing hands.
The mathematical expression for shoulder moment is given in Expression (4). It comprises three separate moments: upper arm, lower arm, and load. Each component is the gravitational force multiplied by the shoulder arm distance from shoulder joint to center of mass of a calculated segment. The elbow moment is expressed with two components, the lower arm and the load, as presented in Expression (5).
S S = s S u a + s S l a + s S l o a d = F u a · · D s u a + F l a · · Q s l a + F l o a d · · Q s l ,
S E = s E l a + s E l o a d = F l a · · D e l a + F l o a d · · D e l ,
Since some of the data are not directly available in the output of the MVN system, those moments can be expressed using known metrics, primarily limb lengths and ergonomic angles.
Schematic overview of further mathematical expressions is given in Figure 5A. Based on the given schematics, shoulder and elbow projected distances (shoulder arms) can be expressed as follows:
D s u a = X u a · l u a · sin α β ,
D s l a = l u a · sin α β + X l a · l l a · cos δ ,
D s l = l u a · sin α β + l l a 0.1 · cos δ ,
D e l a = X l a · l l a · cos δ ,
D e l = l l a 0.1 · cos δ ,
Here, X represents the segment length ratio of mass center location, starting from the segment origin, and l stands for segment length. However, these lengths represent projected view from the sagittal plane. While the most significant plane of arm motion impacts moment shoulder arm, other ergonomic angles should also be evaluated to maintain the accuracy of the assessment.
Figure 5B shows a schematic of the three-dimensional relationship with sagittal plane expression. Mathematically, the parametrical plane is defined by the shoulder, elbow, and wrist points, denoted as p S , A , R . The distance ratio of the maximum segment length and the analyzed frame distance is directly proportional to the ratio of moment arm projected to sagittal plane and three-dimensional sagittal moment arm. Thus, the two-dimensional expression of moment arm D can be interchanged with the three-dimensional expression of moment arm Q using the given Expressions (11) and (12). The projected moment arm from shoulder to upper arm remains unchanged, as it consists of a single segment without any possible bending motions from its origin point.
Q s l a = D s l a P e l l u p + X l a ,
Q s l = D s l P s l l u p + l l a 0.1 ,
Here, X represents the segment length ratio of the mass center location, starting from the segment origin, and l represents the segment length. These lengths represent projected view from the sagittal plane. While the sagittal plane is the most significant plane of arm motion impacting the moment shoulder arm, other ergonomic angles should also be evaluated to maintain the accuracy.
When evaluating the accumulated moment, one of the most critical components is frequency. If datasets from different frequencies were summed, they would be incomparable. For example, data at 240 Hz with a stable load of 5 Nm on the shoulder would correspond to an accumulated moment of 1200 Nm per second. For this reason, several studies recommended using low frequency to calculate the sum of forces or joint moments. In biomechanics research, frequency of 5 Hz is recommended, as it accounts for the accelerations of movements and is the lowest frequency needed to capture the extremes of the load [22,23,24].
All moments of this research were calculated as quasi-static, without taking acceleration into account. Quasi-static analysis examines a system or part of it, assuming it is in equilibrium, without any dynamic effects or loads, such as inertia and other time-dependent behavior [20]. In the scope of this research, the acceleration effect constituted only 1.6% of the gravitational constant, making the dynamic load negligible.
Models of different data cross-sections were evaluated using statistical significance tests. It was determined through Q-Q plot test that the data from this research do not follow a parametric distribution. Based on these findings, the Kolmogorov–Smirnov test was chosen to evaluate statistical significance comparing data cross-section with whole sample size. Data are considered statistically significant when its test p value is less than 0.05. Furthermore, standard deviation is not recommended for non-parametric data distributions, so mean absolute deviation (MAD) is used to represent data variance, as it provides a more informative and accurate representation under these conditions [25].

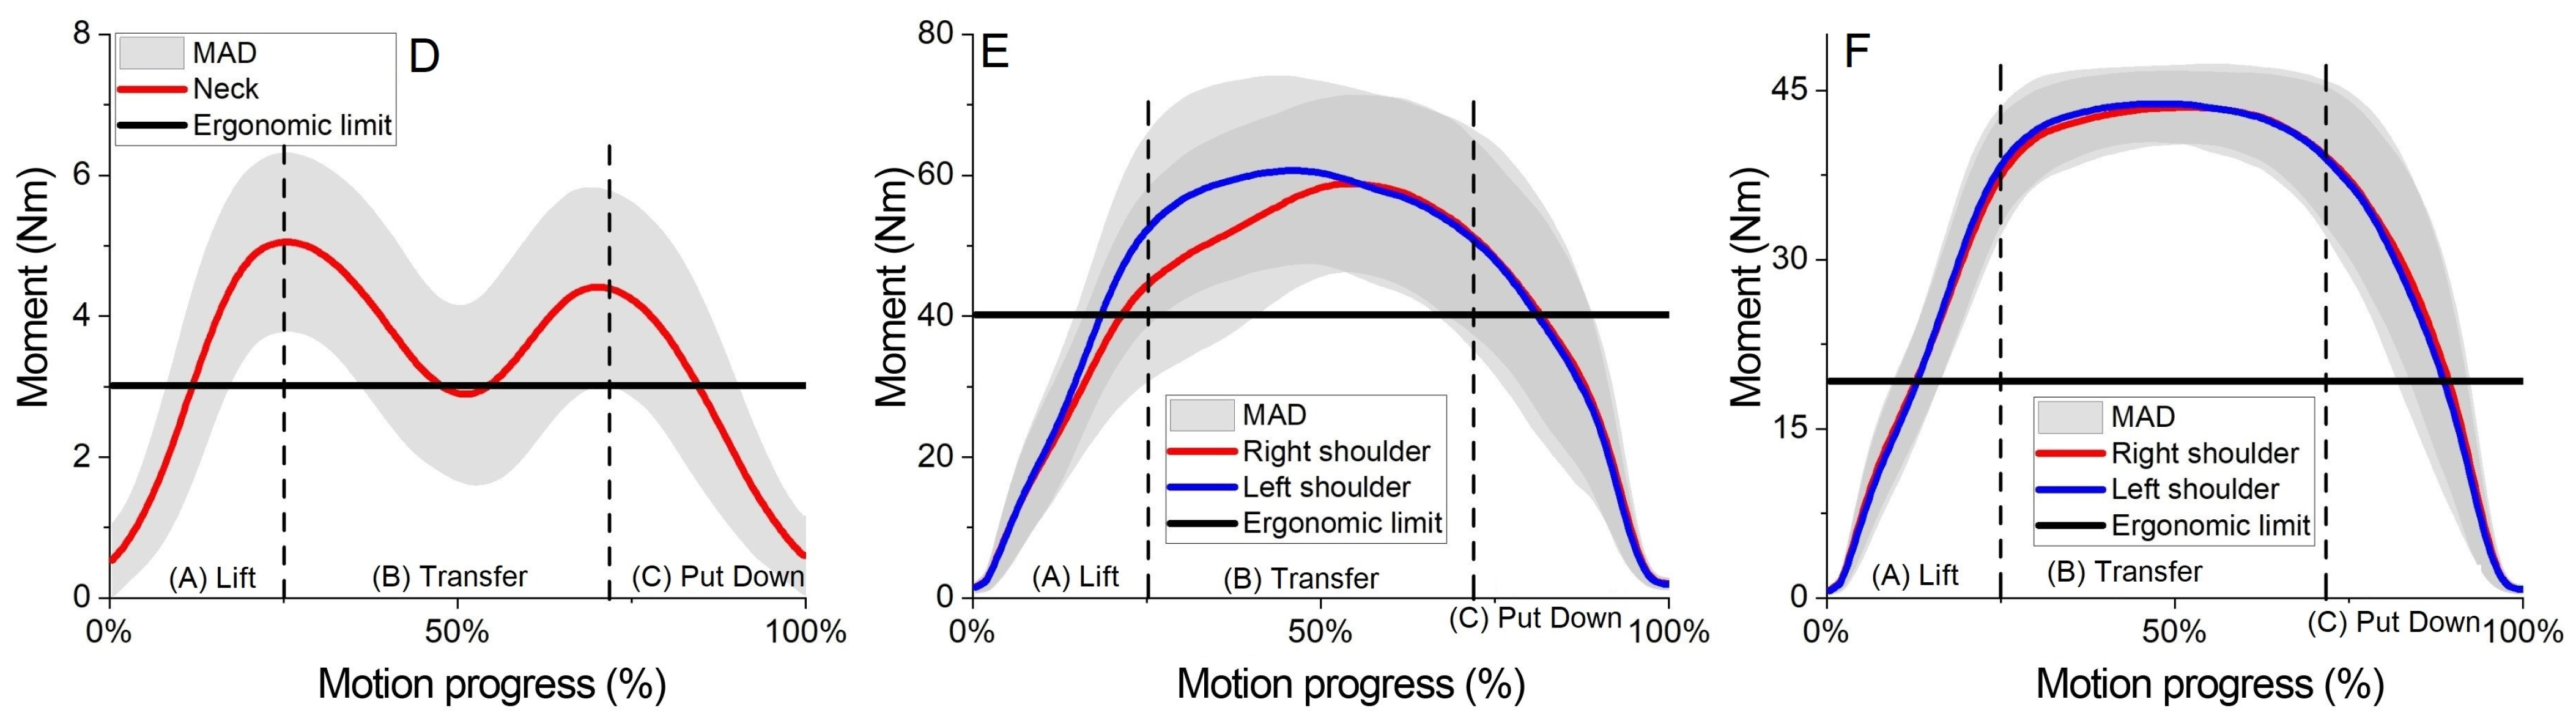
2.3. Ergonomic Boundary Evaluation

Ergonomic standards, such as RULA [4] or ISO 11228 [3], do not provide informative quantitative boundaries to evaluate ergonomics. Thus, estimations based on RULA were made, focusing on positions to determine moment values at upper risk limits, thereby broadening the spectrum of ergonomic analysis and enabling more comprehensive data comparison. According to the RULA [4] standard, the maximum risk score on the neck occurs when neck is flexed 20° or more. For shoulders, the maximum risk score is given when the arms are lifted above a 90° angle. However, for this research, this boundary was adjusted to 45°, as the load shoulder arm moment works similarly whether above or below 90°. The load weight for the maximum risk score is estimated to be 10 kg or more. The maximum risk score for elbows is assigned when they are at 100° or more, calculating in isolated motion [26]. For neck calculations, a study was found that evaluated surgical practices to determine neck performance during these activities. In his research, Zhang C. recommends not exceeding a neck moment of 0.04 Nm/kg, which translates to 3.01 Nm for average value of this research group [27]. For shoulder and elbow, the ergonomic boundary limits are calculated as follows:
M S = cos β · x u a · m u a + x l a · m l a + x l · m l · g = 40.21   N m
M E = cos γ · x l a · m l a + x l · m l · g = 19.22   N m ,
The presented ergonomic boundaries are used to calculate how much the performed motion is below or above these thresholds. These data help determine the risk factor of the performed generalized motion or technique.

3. Results

3.1. Patient Load Force Profile

An experimental patient load measurement was conducted to obtain a parametric curve for use in further moment calculations. The results are presented in Figure 6. Pearson correlation coefficients were calculated, and the average correlation of all measurements with their grouped average is 0.992. The largest mean absolute deviation in the data is 9.46%. When comparing the free-standing data with the patient’s nominal weight, the average difference is 1.89%, suggesting that the measurements are both accurate and reliable.
It was observed that the average force exerted by the patient while standing is 662.28 N, whereas the maximum force during the lift is 345.46 N. The average load on the test subject’s GRF during the lift motion is 205.34 N. Based on these results, the average constant load exerted by the patient on the test subject during the lift was measured to be 429.95 N. This corresponds to approximately 67.14% of the patient’s full weight.

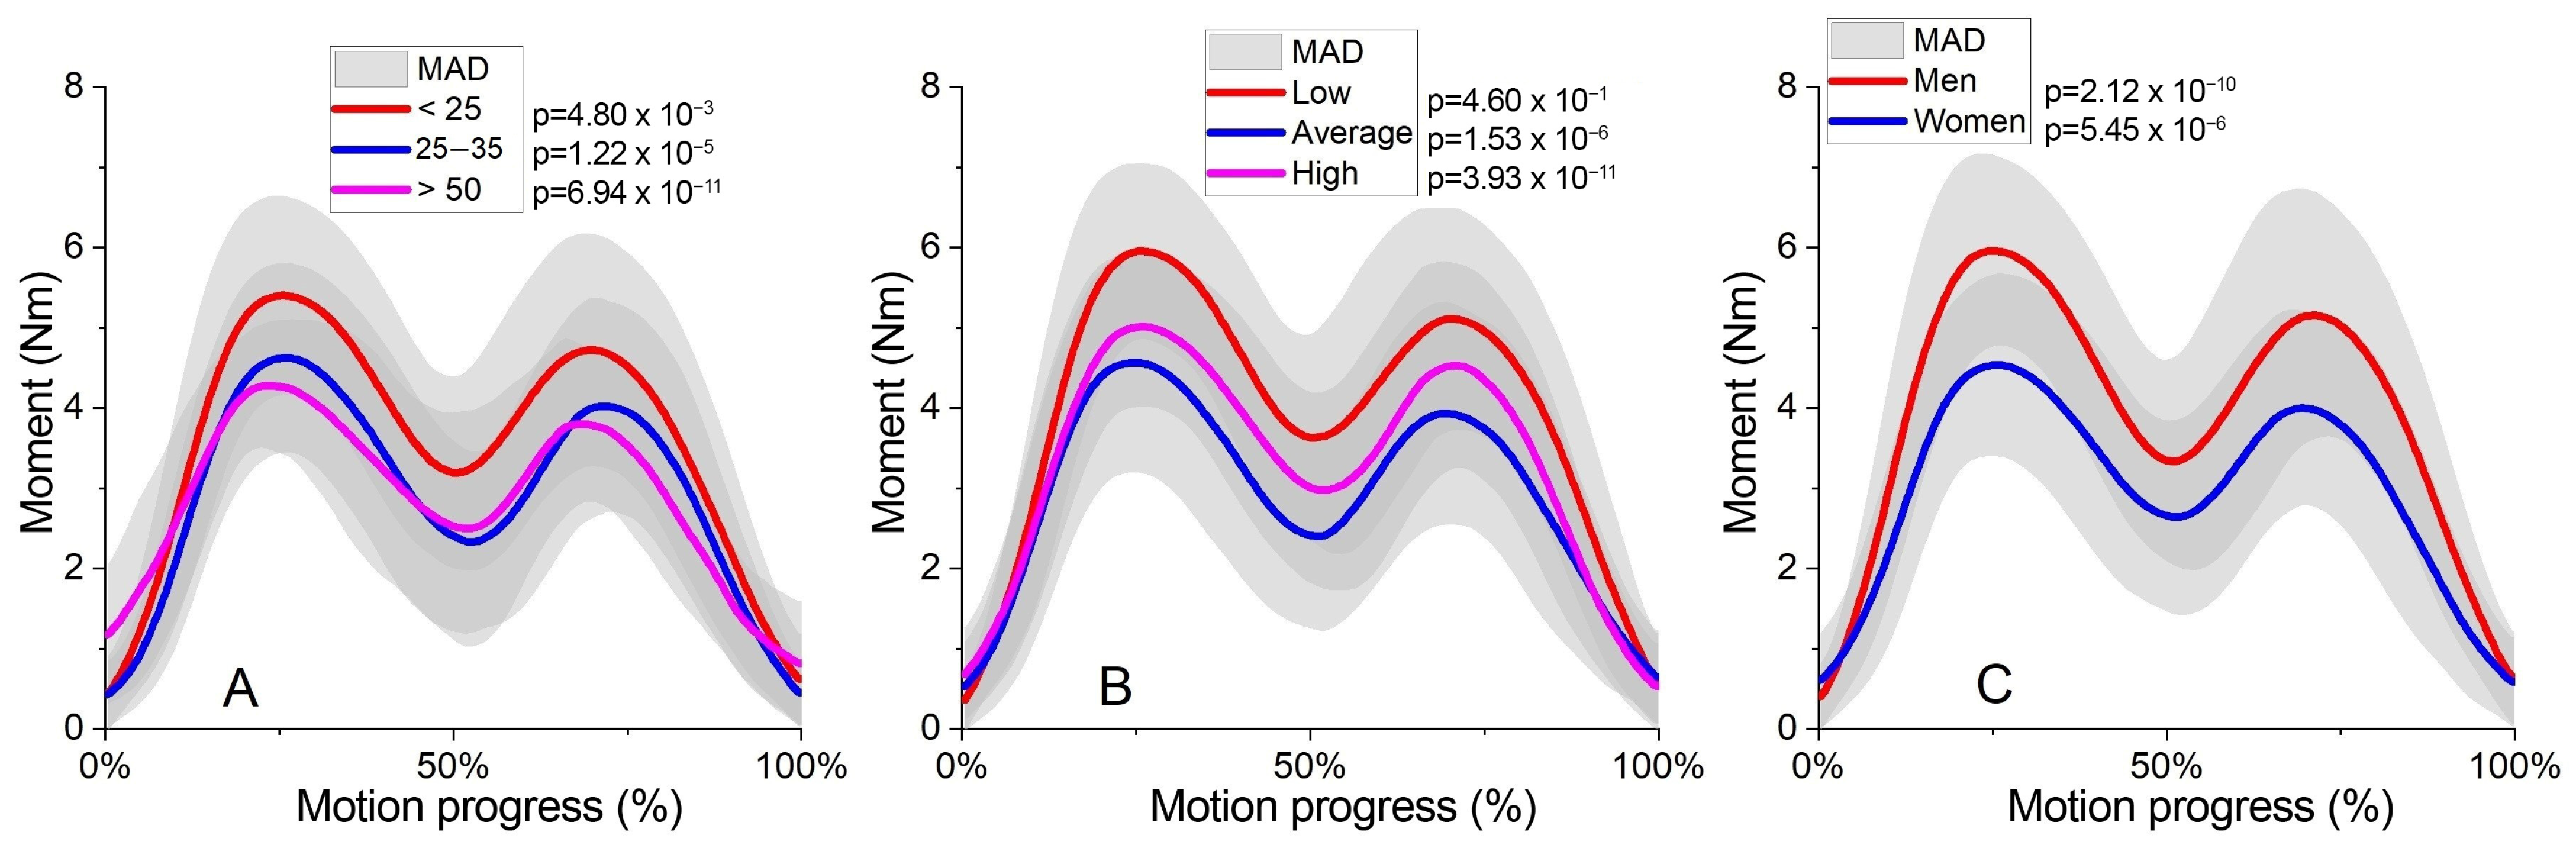
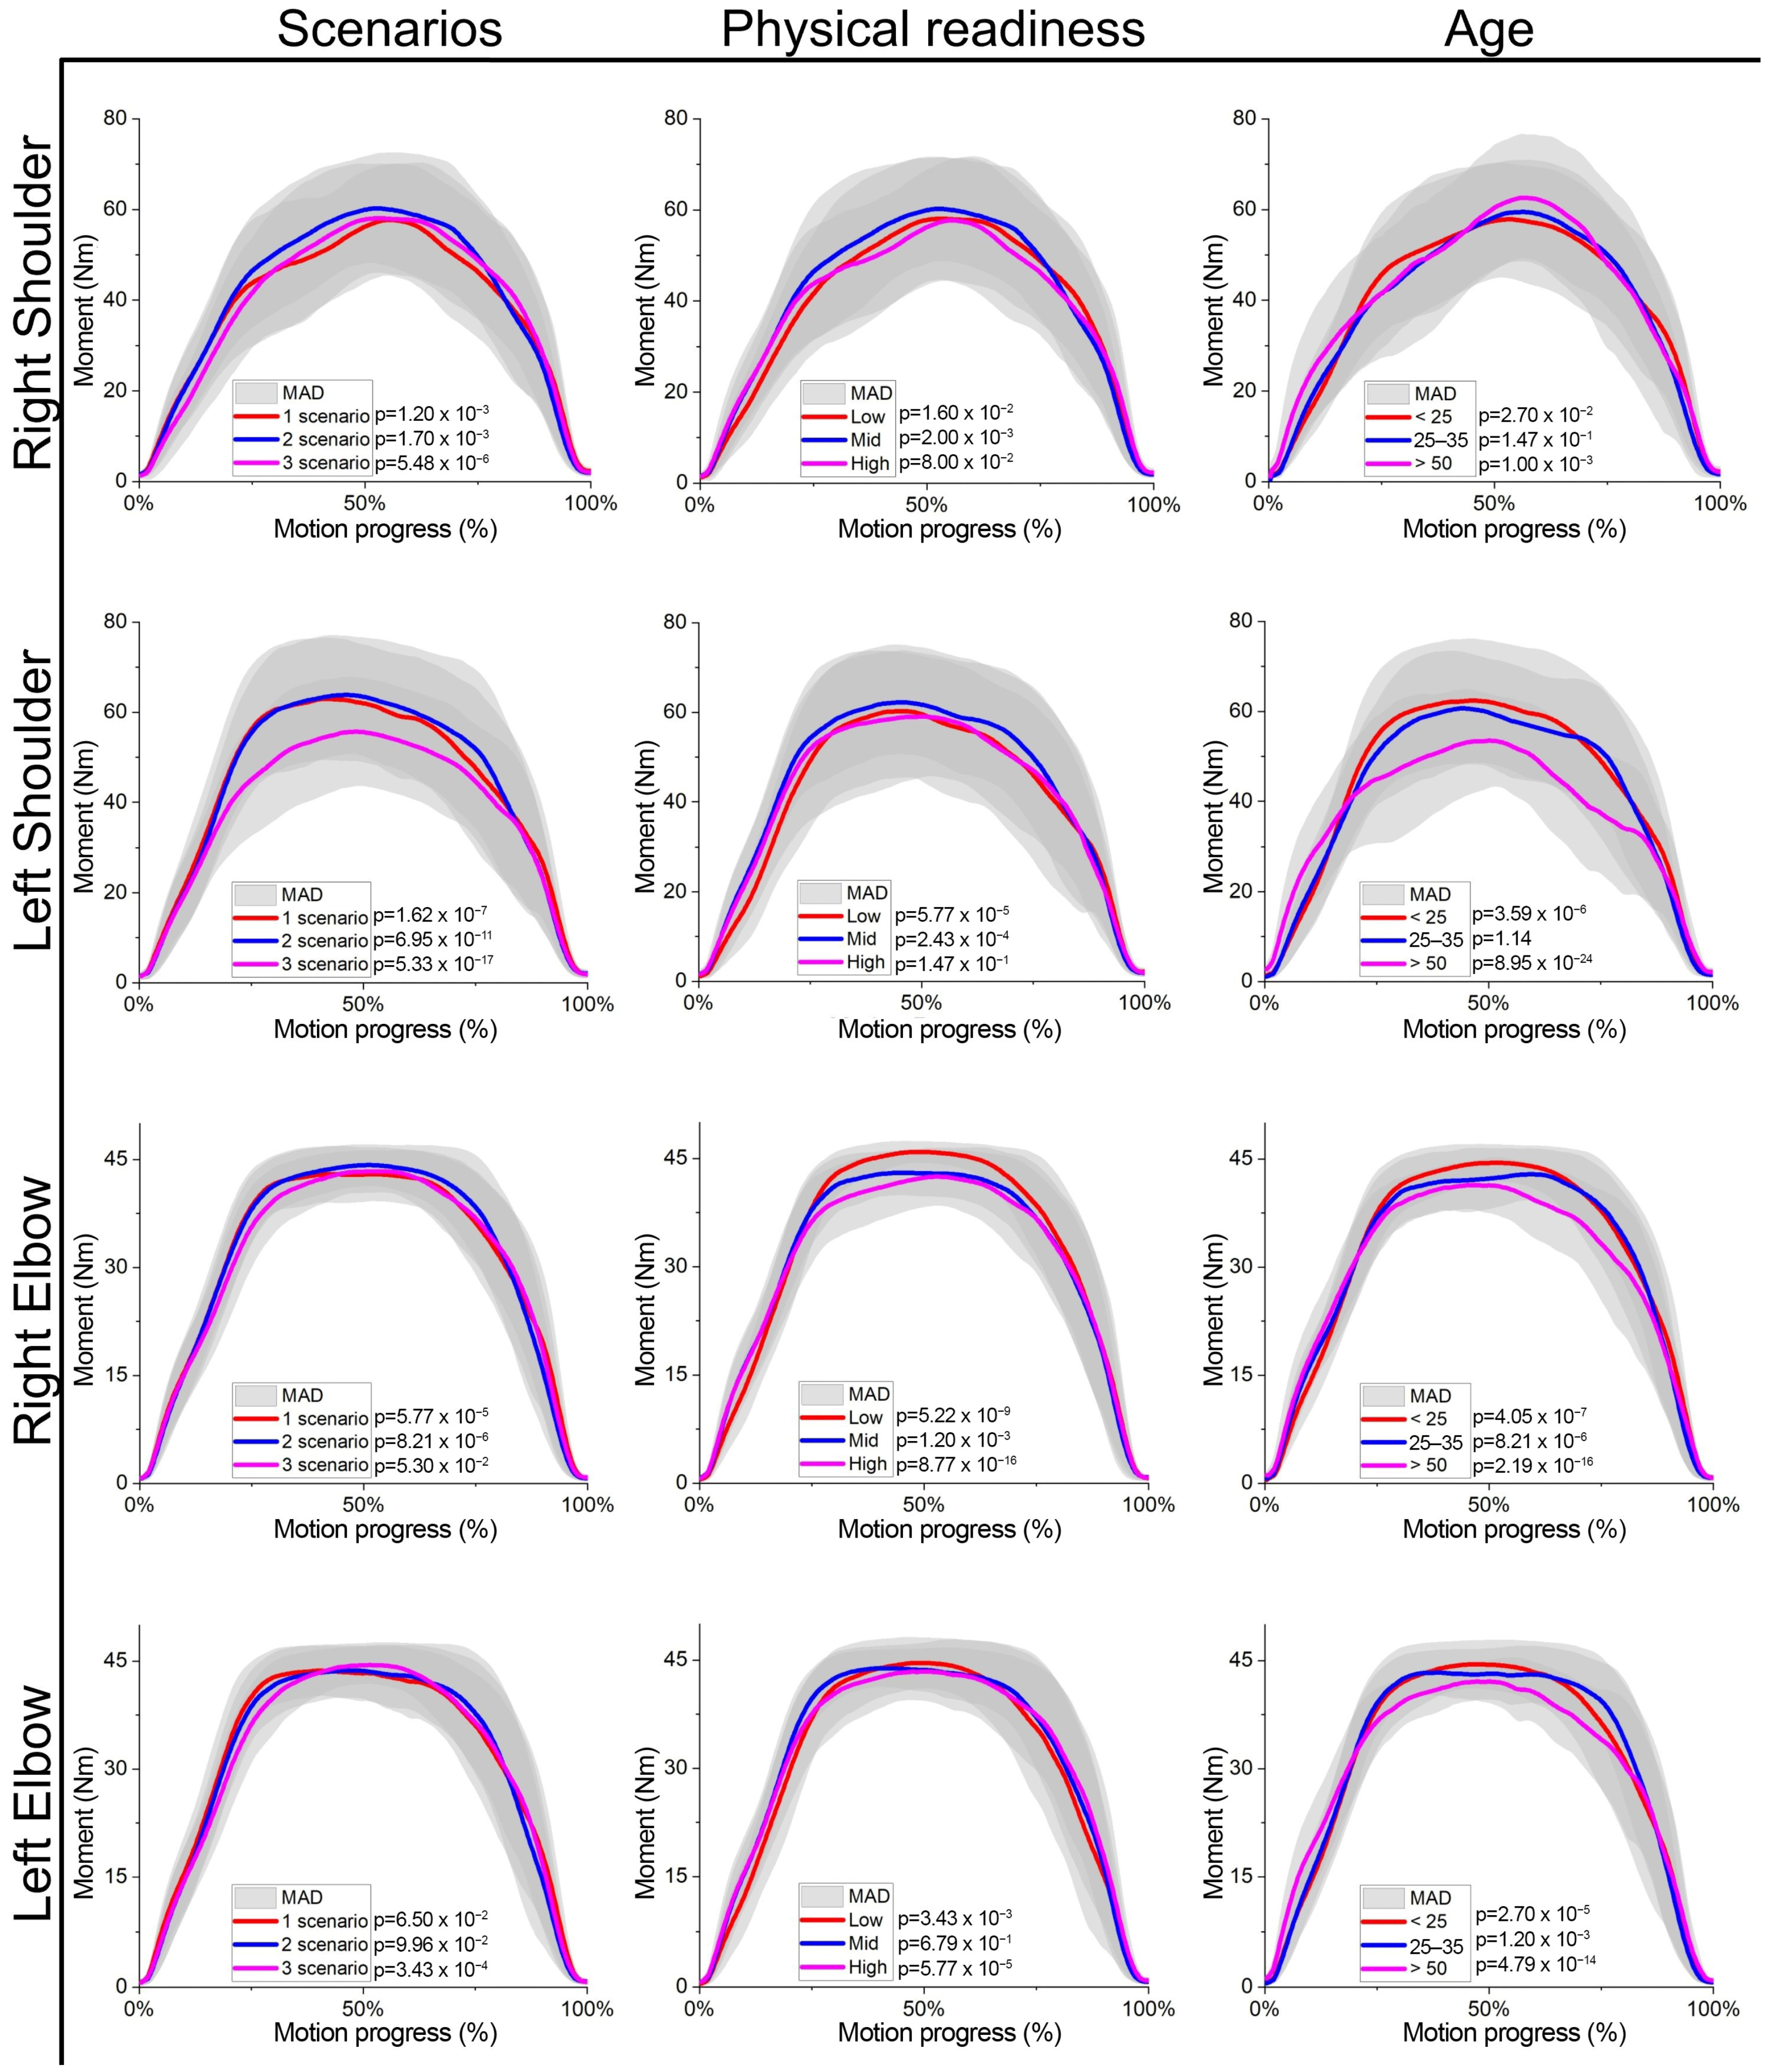
3.2. Inverse Dynamics Results

Dynamics is a key finding of this research. Figure 7 presents the average neck moment values across different data cross-sections. The moment does not start from exactly zero because some of the test subjects’ nominal positions still involve slight bending or flexion of the neck, resulting in the generation of the moment. Similar considerations apply to shoulders and elbows. When evaluating the age of the subjects, all data show statistical significance. Subjects younger than 25 years are closest to the overall sample average, reflecting their larger representation in the study. Conversely, both the 25–35 years group and those over 50 years exhibit lower neck moments during movements. Specifically, the youngest subjects have the highest average moment value at 5.40 Nm, followed by 4.62 Nm for the middle-aged group and 4.28 Nm for the oldest group. The average moment for those older than 50 is 20.7% higher than for those younger than 25 years. The subsequent section assesses physical readiness (Figure 7B). Here, data variance among all three subject groups is noted. The data from subjects with low physical readiness are not statistically significant and closely match the average of the entire test group. A positive impact is observed in the group with an average physical level, with the highest moment value being 9.68% lower than the overall sample average. Conversely, the high physical readiness group exhibits a negative effect, with the highest moment value being 17.88% above the overall group average. Both findings are statistically significant. The third chart (Figure 7C) illustrates the difference between genders. Both datasets are statistically significant, showing an inter-gender difference of about 31.4% in moments between the extremes. Men perform the movement with a neck moment 15.24% higher than the overall sample average, while women’s moment is 11.41% lower.
Figure 8 shows shoulder and elbow moment graphs separated by scenario, age, and physical readiness level. Among the scenarios for the shoulder girdle, the third scenario stands out, characterized by a less loaded start of the movement and an overall lower moment amplitude. The right arm’s moment averages between 60.46 and 60.80 Nm in the first and second scenarios, while the maximum value in the third scenario is 55.99 Nm. The left arm reaches values of 62.98 to 63.82 Nm in the first two scenarios and 55.67 Nm in the third. All shoulder data are statistically significant. Meanwhile, the third scenario for the right elbow and the first and second scenarios for the left elbow are not statistically significant. There is minimal variation across all the elbow scenarios. However, statistically, the third scenario, where an ergonomic belt is used, is the best for the elbows, though it differs only slightly from the first two. Ergonomic belts are commonly used in patient transfers nowadays, though they were not originally designed for full patient transfers. While there is an assumption that these belts might help reduce the risk of musculoskeletal injuries, the discussion among physiotherapists and nurses is ongoing on how these belts should be used properly and under what circumstances, as there is no substantial evidence of their benefits [28]. However, data gathered in this research show a lower shoulder load when using these belts, particularly during the initial lift phase of the transfer.
The level of physical readiness shows interesting non-intuitive variance. No significant differences in the effects of physical readiness are observed in the left shoulder and left elbow segments; however, it is noted that the left shoulder is most heavily loaded among individuals with high physical readiness. The same result is detected in the right shoulder moment graph. Individuals with high physical readiness place 2.44–2.61% more load on their shoulders on average compared to the overall evaluated sample group. The most noticeable trends are evident in the right elbow. During the peak moment, it is observed that the group with the lowest physical readiness exerts the highest load moment, approximately 5.53% more than the whole sample average. Additionally, the ergonomics of the group with high physical readiness in the elbow area are very similar to those of the group with medium physical readiness. Also, the high physical readiness group has a 4.63% lower moment than the low physical activity group during the first half of the transfer movement.
Analyzing the data by participant age reveals more significant findings. In this group, only two measurements of both shoulders in the 25–35 age group are statistically insignificant. The most ergonomic motion, resulting in the lowest moment, is consistently observed among professionals over 50 years old. In this age group, a positive effect is evident in both elbows and the left shoulder graphs. However, it is important to note that while the right shoulder shows the highest moment extremity within this age group, this does not represent the highest moment observed overall. Furthermore, the extremity of the moment in the elbows is consistently 3.26–4.90% lower in the group of subjects older than 50 years. For the shoulders, the maximum moment of the left shoulder is notably 11.84% lower, while the maximum value of the right shoulder is higher by 6.47% from the overall test sample. These percentage differences illustrate variations within ±2.84% for shoulders and ±2.19% for elbows across other age groups, which are considered not statistically significant.
Figure 9A shows the average neck moment variation in relation to the ergonomic limits derived from Zhang’s research and the RULA standard. Across all scenarios, these ergonomic boundaries are consistently exceeded. During each motion cycle phase, an extreme neck moment is generated that surpasses these limits. Specifically, the first extremity accounts for 36.00% of the total motion duration, while the second extremity accounts for 30% of the motion duration. Overall, the ergonomic limit is exceeded 66.00% of the time, averaging a duration of 3.3 ± 0.73 s. It is evident that during the transfer, subjects position their necks in such a way that the moment does not exceed the limit, but only for a brief period. Figure 9B shows the shoulder ergonomic limit plot in comparison with right and left shoulder moment plots. On average, shoulder load is 48.57% higher than the ergonomic limit. Figure 9C demonstrates the elbow moment compared to the ergonomic limit. This limit is exceeded throughout the entire transfer motion cycle and largely during the lifting and placing phases. Both elbows experience almost identical moments. The right elbow exceeds the ergonomic limit for 76.68% of the motion duration, while the left elbow exceeds the ergonomic limit for 75.67%. In terms of time, this generally amounts to 3.81 ± 0.84 s. Given that the weight being lifted far exceeds the weight used to set the ergonomic limit, the elbow position during the motion should be lowered to minimize the load held in the active elbow position.
Table 1 presents cumulative moment data for various data segments. This serves as additional criteria to evaluate different data cross-sections. The analysis of the different scenarios reveals that in the first scenario, all cumulative moments are higher compared to those of the entire sample. The second scenario is closest to the average, while the third scenario shows reduced cumulative moments in the shoulder area. Typically, the moment values are 9.74% higher compared to the whole sample average, while shoulder moments are, on average, 9.67% lower than the mean value.
Another data cross-section presented in Table 1 is age. Shoulder and elbow groups of test subjects up to 25 years and 25–35 years do not show significant differences, but a 10.35% positive effect is observed in the left shoulder’s moment for those older than 50 years, along with a 6.88% positive effect for the right elbow. In the neck area, individuals under 25 years generated an 8.39% higher accumulated moment, while those in the 25–35 and over 50-year-old age groups exerted a 13.65% lower moment on average. Significant deviations in the physical readiness group are seen only in the neck and right elbow areas among individuals with medium and high physical readiness. In the neck area, the group with high physical readiness generated a remarkable 22.99% higher cumulative moment, while those with medium physical readiness generated 15.98% less. In the right elbow, a 5.15% better accumulated moment is observed in the group with medium physical readiness and a 9.74% higher composite moment among those with high physical readiness.
When the data are sorted by work experience, individuals with the most experience accumulate, on average, 7.57% less moment across all joints. Interestingly, individuals with 1–2 years of work experience accumulate, on average, 8.98% more moment across all joints. A distinction between genders is only noticeable in the neck area. Women generate 8.93% less moment, while men generate 15.19% more compared to the total sample size average. Comparing these groups, men’s cumulative moment is 26.48% higher than women’s.

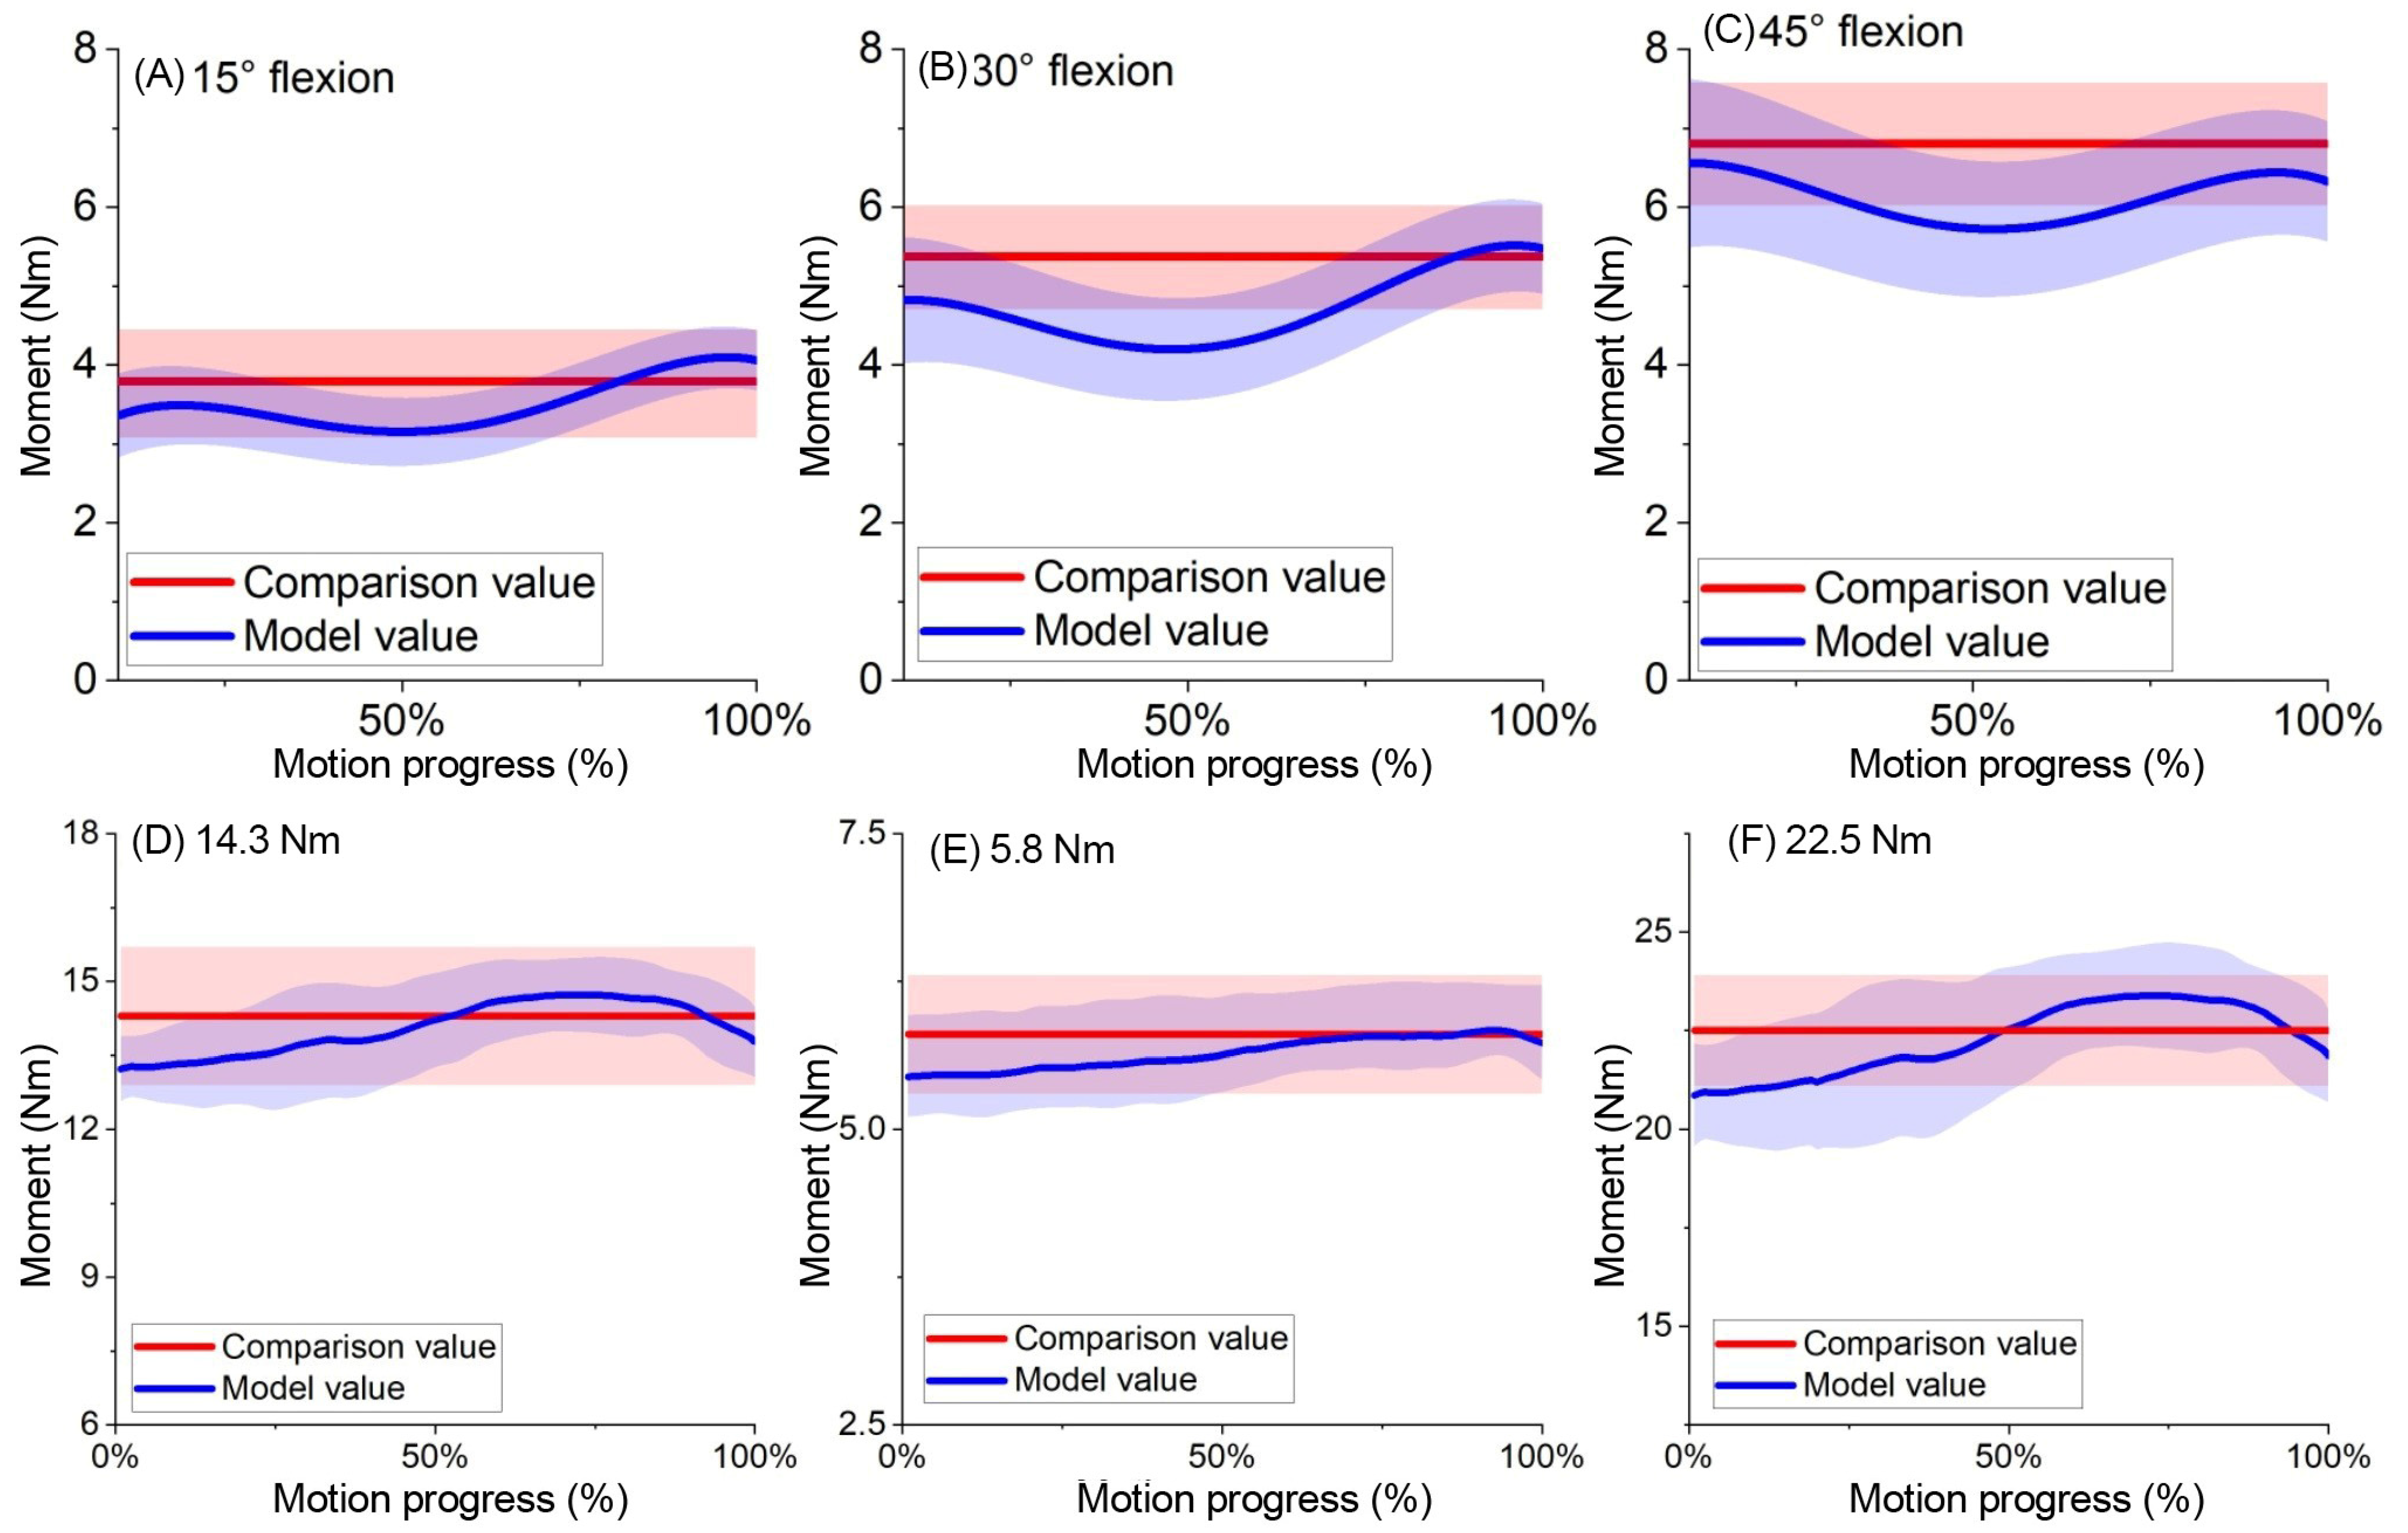
3.3. Model Verification

The constructed computational model consists of kinematics and dynamics calculations. The kinematics used in the model are directly imported from Movella Xsens software, which is widely utilized in the market and has verified kinematic values [29,30,31]. The Xsens and the Vicon motion measurement system comparison shows a correlation of 0.98 in the sagittal plane and 0.89 in the frontal plane kinematic data during mobile and dynamic tasks [30]. Due to previous studies, the kinematic data measured by Xsens IMU equipment are considered verified, and the process is not repeated.
The computational model directly utilizes Xsens kinematic and coordinate data as inputs to evaluate dynamic parameters based on specific conditions and available kinematic and individual data. Due to its nature, the model is not a musculoskeletal model, making traditional verification processes unsuitable compared to those used for other models. Instead, the model is theoretically verified using empirical data from similar research to assess the validity of the obtained data. Ingram A. conducted a study measuring shoulder and elbow moments during daily tasks. One straightforward and easily comparable task, lifting an object to shoulder height, was selected for model verification. In Ingram’s study, the task was repeated 10 times. The highest shoulder moment was recorded when raising the hand to shoulder height with a 5 N object, yielding a maximum moment of 14.3 ± 1.4 Nm. Similarly, the maximum elbow moment was 5.8 ± 0.5 Nm. These scenarios served as the first verification scenarios for hand movements. Another scenario involved extending the arm to shoulder level while holding a 2 kg object, resulting in a moment of 22.5 ± 1.4 Nm. Given the variation in anthropometric data among subjects, identical results were not expected. However, if the values in the computational model fall within ±10%, it indicates that the output data are reasonably accurate and valid. Ingram’s study involved 10 males aged 34.3 ± 11 years [32]. The model verification calculations are also performed with a male subject, repeating the motion of extending the arm to shoulder level seven times under the same load as in the reference study. Verification of comparison data is presented in Figure 10D–F graphs.
The verification of the neck moment calculation model was conducted using a similar method. After analyzing the studies, research by Tapanya, W. [33], conducted with 32 participants aged 21.5 ± 1.63, was discovered. This research focused on determining the kinematic and dynamic impacts on the neck across various scenarios related to posture while using a mobile phone. This study identified neck flexion angles of 15°, 30°, and 45°, measured the moments, and provided averages with standard deviation. To validate the model’s neck bending moment settings, calculations were performed for 10 subjects under these conditions. Simulated motion amplitudes were input into the model with the body in a vertical position, and only the neck position was modified. The comparison results are presented in Figure 10A–C graphs.
Figure 10A–C plot displays time-normalized values, highlighting the segment representing the shoulders in the extended arm position. The curve fluctuations represent limb variability across different measurements and arm instability within the same measurement period, depicting a fluctuation period of approximately 2–3 s due to data normalization. In the initial verification, comparing shoulder moments with a 5 N weight, the average difference between the comparative and model values for the shoulders is 4.28%. The average difference between the comparative and model values for the elbows is 2.81%. In the second verification, the average shoulder difference is 7.17%, with an average shoulder error for both scenarios of 5.73%. It is considered that the main influence on the differences between measurements comes from varying anthropometric data of the subjects.
In the neck moment calculation verification, it was observed that in all scenarios, the model consistently estimates a lower neck moment compared to the provided average. The differences between the averages of both studies are not linear. In scenario A, with a 15° head tilt, the numerical model yields an average value of 3.51 ± 0.59 Nm, while the comparative model provides an average of 3.79 ± 0.70 Nm, resulting in a 7.28% difference. In scenario B, with a 30° head flexion, the model’s average is 4.75 ± 0.81 Nm versus the comparative model’s 5.37 ± 0.65 Nm, indicating an 11.61% difference. In scenario C, with a 45° tilt, the numerical model averages 6.14 ± 1.07 Nm, while the comparative model provides an average of 6.81 ± 0.78 Nm, indicating a 9.70% difference. The overall average difference across the three scenarios reveals that the numerical model consistently estimates neck moments about 9.53% lower than the comparative model. This difference between scenarios does not follow a linear pattern and does not consistently increase, indicating an average variation lower than 10%. It is important to acknowledge that differences in anthropometric data among study samples can lead to variations beyond those caused by calculation precision or methodological choices. After a thorough evaluation of all primary calculations with published experimental data, the model is considered to have up to a 10% error margin.

4. Discussion

Motion analysis of the work environment can be a beneficial tool for evaluation, diagnosis, and engineering solutions. Data analysis can support ergonomic conclusions and prevent or minimize harmful movement effects [34]. The comparative analysis presented in this research highlights the differences across different scenarios and data cross-sections. The main data variations that have the greatest impact on the lift motion ergonomics have been distinguished: physical readiness level, age, and lifting scenarios. Evaluations across different data sections showed that the poorest ergonomic outcomes were observed among men with a high level of physical readiness who performed movements without a transfer belt or without any patient assistance. The assumption has been made that this might be impacted by sports activities that require explosive and agile movements, potentially leading to exaggerated lifting postures. The research results suggest that physical readiness is essential, but a moderate fitness level is more beneficial than exceptional performance in sports. While a high fitness level may improve the prevention of acute traumas, it could also increase the risk of chronic traumas due to the greater forces exerted on the musculoskeletal system. This finding challenges the conventional belief that higher fitness levels always lead to better ergonomic performance. The relationship between fitness levels and ergonomic outcomes highlights how a training program can influence occupational safety, enabling targeted and research-based physical training to maximize the ergonomic efficiency of specialists. This could be greatly enhanced with modern technology, such as wearable sensors that provide instant feedback on the posture of specialists performing the movement. Similar findings could apply to other industries involving lift motions, especially where the objects being lifted are cumbersome, requiring adaptations to technique or posture. Notably, the best ergonomic parameters are observed in women with a moderate physical readiness level and more than three years of work experience who use an ergonomic belt during transfers. It was detected that women generally exert less load on their bodies than men, even in normalized conditions. These results are unexpected because, generally, greater strength and body size are expected to provide better control over motion, which should enhance technique. Furthermore, researchers suggest that there is no significant difference between sexes when it comes to relative strength performance [35]. Nonetheless, lift ergonomics are significantly influenced by body posture, with notable differences observed. This research does not provide support to explain how ergonomic outcomes might differ between men and women; therefore, further research on this topic is recommended.
Medical institutions could use this research as a basis for making improvements. One of the main recommendations is to introduce ergonomic belt use, as it significantly improves patient lift ergonomics. Although this requires the patient to be equipped with a belt, which can be time-consuming and potentially inconvenient, it helps reduce the load on the musculoskeletal system during the lift. The mandatory use of such assistive devices should be considered. Since fitness levels should not be ignored, it is recommended that training programs be developed that help specialists improve their posture control and strengthen their core, leg, and arm muscles. Training programs or other fitness encouragement could serve as proactive measures for preventing injuries. In addition to physical development, more experienced staff could transition from active transfers to mentoring and teaching roles, thereby reducing the learning curve and minimizing body strain during lifts. Regular assessments of healthcare specialists’ lifting techniques are also recommended to ensure that staff are not only properly certified but also receive timely feedback on any deviations in technique.
This research aimed to achieve representative accuracy and enhance mathematical modeling capabilities by estimating the moment shoulder arm in three-dimensional space, as it became evident that sagittal plane models underestimated the loads on body segments [1]. Furthermore, an advanced mathematical model, even if it is not as comprehensive, can provide valuable insights and drive decision making without relying on complex inverse dynamics or other computations. The need for difficult calculations or simulations is a limitation, as not all specialists possess the necessary skills. The easier it is to obtain the decision-driving data, the more straightforward it becomes to make decisions in a decentralized manner. Such an advancement in modeling increases accessibility to the research, data, and progress. The goal is to push the boundaries of modeling accuracy by accounting for different planes, postures, movement scenarios, and interplay between different body postures. Although simplifications were made by combining the forearm and hand for this specific research, detailed load calculations were conducted for shoulder and upper arm moments. Individualizing calculations for larger data sets and integrating a parametrized load model is believed to be one of the challenges addressed in this research. This approach aims to demonstrate utility without the need for extensive computational or time resources. Future work could focus on refining this modeling method to extend its scope to the full body, capture joint nuances more accurately, and increase accessibility by developing a stand-alone model suitable for everyday use.
Anatomical simplifications were necessary, such as treating the shoulder as a single point and treating the lower arm as a combination of the forearm and wrist, which may not fully reflect the joint complexity and variability in real-world scenarios. Similar simplifications were applied to the shoulder joint, which is highly complex. Despite this, its moment calculation still often translates to a single point. Although the sample size was adequate for an overall statistical power of 0.95, it revealed gaps when analyzing specific data cross-sections, particularly among older age groups or varying experience levels. This limitation might affect the accuracy of relationships between younger and older specialists. Furthermore, this study lacked a control group, which limited the ability to directly compare certified personnel with those not trained in safe lifting practices. This choice was made to mitigate the risk of injury during research, although potential differences between trained and untrained personnel remain unexplored. Conducting the research as a single-point cross-section may not fully capture how ergonomic factors evolve over time among different specialists. Multiple measurements over time would provide a more comprehensive understanding. To address this limitation, a longitudinal study is recommended. Additionally, such a study might increase the ability to identify possible chronic disorders correlated with the techniques used by specialists. Skals, S. performed a similar lift motion research, analyzing fixed loads with different surface heights. This research analyzed repetitive industry work, but its findings show improved results from different studies where lifting techniques are limited. Allowing subjects to freely execute the lift can reduce the load, as individual bodies may require slight adaptation [1]. Insights into neck loading align with the findings by Hlavenka T. M., which predict peak load during retraction of the neck engaging and disengaging from the lifting motions [29].
The concept of the accumulated moment emerges as a useful metric for comparing loads across different studies. Currently, there is no established method for comparing findings across different studies. Without a standardized metric, it is challenging to compare the lifting results from this study with the lift motion analysis on industry workers and loads. While still relatively broad, this metric facilitates initial comparisons and provides a foundation for more detailed analyses of various factors, particularly as it has been increasingly researched and used in recent years [36,37]. Accumulated moment estimation revolves around quantifying the load on the body segment over a period of time. It is crucial to quantify this metric to evaluate the long-term impact. This finding aligns with recent research suggesting that chronic exposure to high accumulated moments can lead to fatigue failure in tissues, ultimately contributing to the development of chronic conditions [36]. Understanding the role of accumulated moments offers a more comprehensive perspective on injury prevention, shifting the focus from isolated incidents of high stress to the cumulative effects of repetitive actions over time. Future research could investigate how variations in task duration, frequency, and load intensity influence the development of chronic conditions, thereby informing more effective interventions. In this study, accumulated moments of 97 Nm for the neck, 1184 Nm for the shoulder, and 834 Nm for the elbow were identified during single-patient lift motions. By knowing the weight of the patient being lifted, these data could be normalized and compared to other tasks where accumulated moments were evaluated, allowing for a better understanding of the strain on the musculoskeletal system in even more complex tasks. Experimental patient load measurements demonstrated their applicability in scenarios where more precise solutions are impractical due to large sample sizes or technical constraints. This approach bridges the gap between accurately evaluating force effects and relying on purely theoretical estimations.

5. Conclusions

This study highlights the critical importance of ergonomic aspects in healthcare practice and advocates for proactive measures to reduce the risk of strain and injury for healthcare providers. It was found that the technique used has a significant impact on the accumulated moment, potentially influencing the results by as much as 22.99%. Upon evaluating the ergonomic limits, it was observed that the limits were exceeded as follows: the neck limit by 66.00%, the shoulder limit by 48.57%, and the elbow limit by 75.67%. These findings strongly advocate for minimizing direct patient lifting whenever possible and emphasize the extensive use of assistive equipment to reduce potential long-term adverse effects.

Author Contributions

Conceptualization, K.S. and K.D.; methodology, K.S., A.A. and K.D.; software, K.S.; validation, K.S.; resources, R.K.; data curation, A.T. and A.P.; writing—original draft preparation, K.S.; writing—review and editing, K.D.; visualization, K.S.; supervision, K.D. and A.A.; project administration, K.S.; funding K.S. and A.A. All authors have read and agreed to the published version of the manuscript.

Funding

This research received no external funding.

Institutional Review Board Statement

This study was conducted in accordance with the Bioethics certificate, No. 2023/3-1504-959, issued by Vilnius Regional Biomechanical Research Ethics Committee. Date of approval: 2023-03-07.

Informed Consent Statement

Informed consent was obtained from all subjects involved in the study.

Data Availability Statement

Data from this research are publicly unavailable due to ethical data protection protocols.

Conflicts of Interest

The authors declare no conflicts of interest.

References

  1. Skals, S.; Bláfoss, R.; de Zee, M.; Andersen, L.L.; Andersen, M.S. Effects of load mass and position on the dynamic loading of the knees, shoulders and lumbar spine during lifting: A musculoskeletal modelling approach. Appl. Ergon. 2021, 96, 103491. [Google Scholar] [CrossRef] [PubMed]
  2. Conforti, I.; Mileti, I.; Del Prete, Z.; Palermo, E. Measuring Biomechanical Risk in Lifting Load Tasks Through Wearable System and Machine-Learning Approach. Sensors 2020, 20, 1557. [Google Scholar] [CrossRef] [PubMed]
  3. ISO 11228-1; Ergonomics—Manual Handling—Part 1: Lifting, Lowering and Carrying. International Organization for Standardization: Geneva, Switzerland, 2003.
  4. McAtamney, L.; Corlett, E.N. RULA: A Survey Method for the Investigation of Work-Related Upper Limb Disorders. Appl. Ergon. 1993, 24, 91–99. [Google Scholar] [CrossRef] [PubMed]
  5. Ribeiro, T.; Serranheira, F.; Loureiro, H. Work-related musculoskeletal disorders in primary health care nurses. Appl. Nurs. Res. 2017, 33, 72–77. [Google Scholar] [CrossRef]
  6. Anap, D.B.; Iyer, C.; Rao, K. Work-related musculoskeletal disorders among hospital nurses in rural Maharashtra, India: A multi-centre survey. Int. J. Res. Med. Sci. 2017, 1, 101–107. [Google Scholar] [CrossRef]
  7. Ryu, E.; Ye, B.; Yi, Y.; Kim, J. Risk factors of musculoskeletal symptoms in university hospital nurses. Ann. Occup. Environ. Med. 2014, 26, 47. [Google Scholar] [CrossRef]
  8. Chung, Y.C.; Hung, C.T.; Li, S.F.; Lee, H.M.; Wang, S.G.; Chang, S.C.; Pai, L.W.; Huang, C.N.; Yang, J.H. Risk of musculoskeletal disorder among Taiwanese nurses cohort: A nationwide population-based study. BMC Musculoskelet. Disord. 2013, 14, 144. [Google Scholar] [CrossRef]
  9. Arvidsson, I.; Gremark Simonsen, J.; Dahlqvist, C.; Axmon, A.; Karlson, B.; Björk, J.; Nordander, C. Cross-sectional associations between occupational factors and musculoskeletal pain in women teachers, nurses and sonographers. BMC Musculoskelet. Disord. 2016, 17, 35. [Google Scholar] [CrossRef]
  10. Hignett, S.; McAtamney, L. Rapid entire body assessment (REBA). Appl. Ergon. 2000, 31, 201–205. [Google Scholar] [CrossRef] [PubMed]
  11. David, G.C. Ergonomic methods for assessing exposure to risk factors for work-related musculoskeletal disorders. Occup. Med. 2005, 55, 190–199. [Google Scholar] [CrossRef] [PubMed]
  12. Buchholz, B.; Paquet, V.; Punnett, L.; Lee, D.; Moir, S. PATH: A work sampling-based approach to ergonomic job analysis for construction and other non-repetitive work. Appl. Ergon. 1996, 27, 177–187. [Google Scholar] [CrossRef] [PubMed]
  13. Boschman, J.S.; Noor, A.; Lundström, R.; Nilsson, T.; Sluiter, J.K.; Hagberg, M. Relationships between work-related factors and musculoskeletal health with current and future work ability among male workers. Int. Arch. Occup. Environ. Health 2017, 90, 517–526. [Google Scholar] [CrossRef]
  14. Hani, D.B.; Huangfu, R.; Sesek, R.; Schall, M.C., Jr.; Davis, G.A.; Gallagher, S. Development and validation of a cumulative exposure shoulder risk assessment tool based on fatigue failure theory. Ergonomics 2021, 64, 39–54. [Google Scholar] [CrossRef] [PubMed]
  15. Ramachandran, H.; Vasudevan, D.; Brahma, A.; Pugazhenthi, S. Estimation of mass moment of inertia of human body, when bending forward, for the design of a self-transfer robotic facility. J. Eng. Sci. Technol. 2016, 11, 166–176. [Google Scholar]
  16. Hall, S.J. Basic Biomechanics, 6th ed.; McGraw-Hill: Boston, MA, USA, 2012. [Google Scholar]
  17. van der Helm, F.C.; Veeger, H.E. Quasi-static analysis of muscle forces in the shoulder mechanism during wheelchair propulsion. J. Biomech. 1996, 29, 39–52. [Google Scholar] [CrossRef]
  18. Cheung, K.; Ma, K.Y.; Cheung, H.H.; Lee, C.H.; Chan, I.M.M.; Cheung, S.T.; Chung, W.Y.; Yeung, S.S.; Lo, W.C. Predictors of work-related mus-culoskeletal symptoms in shoulders among nursing assistants working in nursing homes. PeerJ 2021, 9, e11152. [Google Scholar] [CrossRef] [PubMed]
  19. Guduru, R.K.R.; Domeika, A.; Obcarskas, L.; Ylaite, B. The Ergonomic Association between Shoulder, Neck/Head Disorders and Sedentary Activity: A Systematic Review. J. Healthc. Eng. 2022, 2022, 5178333. [Google Scholar] [CrossRef]
  20. Senvaitis, K.; Daunoraviciene, K.; Adomaviciene, A. Biomechanical assessment of critical factors during patient lifting: Shoulder gridle and cumulative moment ergonomic evaluation. Acta Mech. Autom. (AMA) 2024, 18, 323–332. [Google Scholar] [CrossRef]
  21. Pamuła, H.; Loo, W. Center of Mass Calculator. Available online: https://www.omnicalculator.com/math/center-of-mass (accessed on 27 December 2023).
  22. Kumar, S.; Narayan, Y. Cumulative spinal load among X-ray technologist: A field study of techniques, frame rate and prediction. Int. J. Ind. Ergon. 2005, 35, 889–903. [Google Scholar] [CrossRef]
  23. Greenland, K.O.; Merryweather, A.S.; Bloswick, D.S. The effect of lifting speed on cumulative and peak biomechanical loading for symmetric lifting tasks. Saf. Health Work 2013, 4, 105–110. [Google Scholar] [CrossRef]
  24. Backes, A.; Skejø, S.D.; Gette, P.; Nielsen, R.Ø.; Sørensen, H.; Morio, C.; Malisoux, L. Predicting cumulative load during running using field-based measures. Scand. J. Med. Sci. Sports 2020, 30, 2399–2407. [Google Scholar] [CrossRef]
  25. Boslaugh, S.; Watters, P.A. Statistics in a Nutshell: A Desktop Quick Reference; O’Reilly Media: Sebastopol, CA, USA, 2008. [Google Scholar]
  26. Arendra, A.; Akhmad, S.; Lumintu, I. Working tool redesign to reduce ergonomic risk of salt evaporation field workers based on RULA and REBA assessments using esMOCA Instrument. J. Phys. Conf. Ser. 2020, 1477, 022034. [Google Scholar] [CrossRef]
  27. Zhang, C.; Roossien, C.C.; Verkerke, G.J.; Houdijk, H.; Hijmans, J.M.; Greve, C. Biomechanical Load of Neck and Lumbar Joints in Open-Surgery Training. Sensors 2023, 23, 6974. [Google Scholar] [CrossRef] [PubMed]
  28. Miller, H.; Rockefeller, K.; Townsend, P. International round table discussion: Do gait belts have a role in safe patient handling programs? Int. J. Safe Patient Handl. Mobil. 2017, 7, 116–121. [Google Scholar]
  29. Hlavenka, T.M.; Christner, V.F.K.; Gregory, D.E. Neck posture during lifting and its effect on trunk muscle activation and lumbar spine posture. Appl. Ergon. 2017, 62, 28–33. [Google Scholar] [CrossRef] [PubMed]
  30. Lloyd, R.; Cronin, J.; Faigenbaum, A.; Haff, G.; Howard, R.; Kraemer, W.; Micheli, L.; Myer, G.; Oliver, J. National Strength and Conditioning Association Position Statement on Long-Term Athletic Development. J. Strength Cond. Res. 2016, 30, 1491–1509. [Google Scholar] [CrossRef]
  31. Ramasamy, Y.; Usman, J.; Razman, R.; Wei, Y.M.; Towler, H.; King, M. A Systematic Review of the Biomechanical Studies on Shoulder Kinematics in Overhead Sporting Motions: Types of Analysis and Approaches. Appl. Sci. 2023, 13, 9463. [Google Scholar] [CrossRef]
  32. Murray, I.A.; Johnson, G.R. A study of the external forces and moments at the shoulder and elbow while performing everyday tasks. Clin. Biomech. 2004, 19, 586–594. [Google Scholar] [CrossRef]
  33. Tapanya, W.; Puntumetakul, R.; Swangnetr, M.; Neubert, R.; Boucaut, R. Influence of Neck Flexion Angle on Gravitational Moment and Neck Muscle Activity When Using a Smartphone While Standing. Ergonomics 2021, 64, 900–911. [Google Scholar] [CrossRef]
  34. Namdari, S.; Yagnik, G.; Ebaugh, D.D.; Nagda, S.; Ramsey, M.L.; Williams, G.R.; Mehta, S. Defining Functional Shoulder Range of Motion for Activities of Daily Living. J. Shoulder Elbow Surg. 2012, 21, 1177–1183. [Google Scholar] [CrossRef]
  35. Bartolomei, S.; Grillone, G.; Di Michele, R.; Cortesi, M. A Comparison between Male and Female Athletes in Relative Strength and Power Performances. J. Funct. Morphol. Kinesiol. 2021, 6, 17. [Google Scholar] [CrossRef] [PubMed]
  36. Gallagher, S.; Schall, M.C., Jr. Musculoskeletal Disorders as a Fatigue Failure Process: Evidence, Implications and Research Needs. Ergonomics 2017, 60, 255–269. [Google Scholar] [CrossRef] [PubMed]
  37. Gallagher, S.; Schall, M.C., Jr.; Sesek, R.F.; Huangfu, R. An Upper Extremity Risk Assessment Tool Based on Material Fatigue Failure Theory: The Distal Upper Extremity Tool (DUET). Hum. Factors 2018, 60, 1205–1217. [Google Scholar] [CrossRef] [PubMed]
Figure 1. Flow chart of study procedure.
Applsci 14 08076 g001
Figure 3. Neck moment (A) and shoulder moment (B) calculation principal schematics. Purple outline represents patients body.
Applsci 14 08076 g003
Figure 4. Unified forearm and hand center of mass schematics.
Applsci 14 08076 g004
Figure 5. Mathematical scheme of projected shoulder distance expression (A) and three-dimensional trigonometry expression (B) [20]. Purple outline represents patient’s body.
Applsci 14 08076 g005
Figure 6. Patient load for test subject measurement results and load profile definition. Different movement phases are identified in the graph. (A)—patient lift motion; (B)—patient move-while-lifting motion; (C)—patient put-down motion. Colored area shows ±MAD.
Applsci 14 08076 g006
Figure 7. Average neck moment values during different data cross-sections with statistical significance: (A)—test subject age; (B)—test subject physical readiness; (C)—test subject gender. Gray colored area shows ±MAD.
Applsci 14 08076 g007
Figure 8. Average arm moment values during different scenarios with statistical significance. Gray colored area shows ±MAD.
Applsci 14 08076 g008
Figure 9. Average neck and arm moment values, with ergonomic limit and identified motion phases: (A)—patient lift motion phase; (B)—patient move-while-lifting motion phase; (C)—patient put-down motion phase; (D)—neck moment; (E)—shoulder moment; (F)—elbow moment. Gray colored area shows ±MAD.
Applsci 14 08076 g009
Figure 10. Neck, shoulder, and elbow mean value comparison with experiment model: (A)—neck 15° flexion scenario, (B)—neck 30° flexion scenario, (C)—neck 45° flexion scenario, (D)—shoulder verification with 14.3 Nm baseline, (E)—elbow verification with 5.8 Nm baseline, (F)—shoulder verification with 22.5 Nm baseline. Colored area around average value shows ±SD.
Applsci 14 08076 g010
Table 1. Mean cumulative force moment (5 Hz) expressed in analyzed data groups. Data are expressed in maximum values and mean absolute deviation (MAD). Green indicates values more than 5% below the whole sample average, while red indicates data points more than 5% above the whole sample average.
NeckR. ShoulderL. ShoulderR. ElbowL. Elbow
Mean Acc NmMoment MADMean Acc NmMoment MADMean Acc NmMoment MADMean Acc NmMoment MADMean Acc NmMoment MAD
All pop. n = 39696.6632.491156.51351.511211.7373.27890.9206.2776.285171.06
Scenario
#1 n = 132103.8133.311286.58343.991366.35429.59964.06214.76846.99188.39
#2 n = 13292.2029.951117.29289.821196.24318.38855.78180.34734.82149.8
#3 n = 13293.9534.271065.65381.061072.51339.11852.89215.93747.05166.44
Age
<25 n = 243104.7731.591166.98324.271258.59373.28918.52212.67775.20171.15
25–35 n = 9984.2328.491103.70313.461164.99301.67856.52164.62763.53138.86
>50 n = 5382.7031.601206.20563.301086.31451.79829.65239.63804.58235.34
Physical level
Low n = 126100.2032.601201.74431.101238.15444.85905.26246.61812.04216.07
Mid. n = 17181.2127.751154.55370.841205.51334.85845.02175.08766.54145.40
High n = 99118.8829.291207.27373.061252.46460.54977.76243.67783.86222.65
Tenure
<1 year n = 207101.2328.731104.02332.511183.23366.27878.32205.93746.71171.78
1–3 year n = 99100.8436.381304.80447.161355.17398.31960.40219.54839.24185.50
>3 year n = 9076.3028.611114.10280.261119.36324.65843.40185.56775.06139.52
Gender
Man n = 144111.3429.051131.11302.521240.81360.21920.27207.16766.97170.18
Woman n = 25288.0331.771171.02379.071195.06379.86874.12204.13781.61171.64
Disclaimer/Publisher’s Note: The statements, opinions and data contained in all publications are solely those of the individual author(s) and contributor(s) and not of MDPI and/or the editor(s). MDPI and/or the editor(s) disclaim responsibility for any injury to people or property resulting from any ideas, methods, instructions or products referred to in the content.

