Article

Synergism Interactions of Plant-Based Proteins: Their Effect on Emulsifying Properties in Oil/Water-Type Model Emulsions

by
Raquel Reis Lima
1,
Maria Eduarda Martins Vieira
2,
Nathalia da Silva Campos
2,
Ítalo Tuler Perrone
3,
Rodrigo Stephani
2,
Federico Casanova
4,* and
Antônio Fernandes de Carvalho
1,*
1
Department of Food Science and Technology, Federal University of Viçosa, Viçosa 36570-900, Brazil
2
Chemistry Department, Federal University of Juiz de Fora, Juiz de Fora 36036-900, Brazil
3
Department of Pharmaceutical Sciences, Federal University of Juiz de Fora, Juiz de Fora 36036-900, Brazil
4
Research Group for Food Production Engineering, National Food Institute, Technical University of Denmark, Søltofts Plads, 2800 Kongens Lyngby, Denmark
*
Authors to whom correspondence should be addressed.
Appl. Sci. 2024, 14(17), 8086; https://doi.org/10.3390/app14178086
Submission received: 15 July 2024 / Revised: 27 August 2024 / Accepted: 2 September 2024 / Published: 9 September 2024
(This article belongs to the Section Applied Biosciences and Bioengineering)

Abstract

:
This study investigated the synergistic effects of three protein concentrates from legumes (pea, lentil, and lima bean) as emulsifiers and stabilizers of oil-in-water (O/W) emulsions using a simplex-centroid mixture design. The aim was to check whether proteins combined in different proportions have better emulsifying properties than isolated proteins. During this study, each protein concentrate was characterized by different evaluated parameters: emulsifying activity, emulsion stability, accelerated stability test, thermal coagulation time, stability to coalescence, and others. After statistical analysis mixture optimization, it was found that the best formulation for stabilizing O/W emulsion under the tested conditions (2% total protein; 3% sunflower oil) was the protein blend containing 21.21% pea, 32.78% lentil, and 46.01% fava bean. This blend exhibited better emulsification properties compared to the individual proteins.

1. Introduction

The growing interest in protein-based products has sparked research and development efforts to explore various plant protein sources with emulsifying properties [1]. The use of plant proteins as ingredients is promising due to their lower environmental footprint, techno functionality, and nutritional value [2,3].
Soy protein products (concentrates or isolates) are commonly used for plant protein-based emulsifiers, but due to allergen concerns, the industry is looking for other alternatives [4,5,6,7]. The use of legume proteins is well justified, given the food industry’s strong interest in replacing conventional and synthetic proteins with healthier alternatives. Several studies have investigated the use of fava bean, lentil, and pea proteins as emulsifiers, demonstrating their ability to stabilize oil-in-water emulsions [8,9,10,11,12].
Pulses contain large amounts of protein, between 20 and 40%, and are a rich source of essential amino acids such as leucine and lysine [13,14,15]. The major proteins in lentils are globulins (~50%) and albumins (~16.8%), both of which are considered globular proteins. Globulins consist of vicilin-like trimeric proteins (175–180 kDa) and legumin proteins (300–370 kDa) with sedimentation coefficients of 7S and 11S, respectively. In contrast, proteins from the albumin fraction have a lower molecular weight (5–80 kDa) and are considered compact globular proteins [16,17]. Similar to other protein-based emulsifiers, these proteins act by diffusion at the interface and form a viscoelastic film to stabilize the oil droplets via charge repulsion and steric stabilization [18]. However, since plant proteins have low solubility compared to animal proteins, mechanisms to modify the protein structure and improve its technofunctional properties have been investigated [19].
Studies show that combining vegetable protein with other macromolecules, such as gum, pectin, and polyphenols or combining vegetable protein with animal protein might enhance their emulsifying properties. The association of pea protein and whey protein showed a synergistic effect in the interfacial properties when compared to the protein fractions alone [20]. Another study using milk proteins and pea proteins found that mixing pea proteins with milk proteins increased emulsion stability [21,22]; pea proteins also increased the elasticity of casein-stabilized interfaces [12,23]. Whey–plant and plant–plant protein(soy and pea) blends behaved synergistically, leading to enhanced emulsion stability [24]. However, little is known about the synergistic effect of different plant sources on the stability of oil-in-water emulsions.
The aim of the present study was to investigate the synergistic effect of protein concentrates from legumes (peas, lentils, and broad beans) on the stabilization of oil-in-water emulsions. Our hypothesis is that combined proteins have better emulsifying properties than separate proteins. The proportions of the proteins tested were composed according to a simplex centroid mixture design, and the desirability function was used to optimize the formulations [25,26]. This study also aimed to simulate real-life situations that can be replicated in the food industry, as food manufacturers typically do not extract their own proteins but instead opt for concentrated proteins, which are more cost-effective. To this end, we used commercially available proteins, ensuring that our results are applicable on an industrial scale.

2. Materials and Methods

2.1. Materials

A total of 52% pea protein concentrate (w/w), 53% lentil (w/w), and 56% fava bean (w/w) were purchased from Ingredion® (Westchester, IL, USA) (The certificate of analysis is included in the Supplementary Materials). Sunflower oil was purchased from a local supermarket (Juiz de Fora, Brazil) with a refractive index of 23 °C: 1.474 (the determination of the refractive index was performed using a bench-top Abbe refractometer -Q767B [27]) and density of 23 °C: 0.92 g/cm3 (the determination of the density was performed using pycnometer method [28]). All chemicals were of analytical grade.

2.2. Simplex-Centroid Design

The experiment was designed according to a simplex-centroid delineation and consisted of three individual proteins and seven groups of protein blends. The component proportion of blends is illustrated in Table 1. The experimental domain of this research consisted of different proportions of components of X1 (pea protein concentrate (PPC)), X2 (lentil protein concentrate (LPC)), and X3 (fava bean protein concentrate (FPC)) between zero and one (0 ≤ Xi ≤ 1; ∑ Xi = 1). Three replicates were performed at the central point (33.33% for each protein). For all other treatments, the emulsions with the respective mixtures were prepared via two independent replicates to allow for error estimation [26].

2.3. Emulsion Preparation

To prepare O/W emulsions, protein concentrates (2.0%, w/w) were dissolved in a solution of water at 45 °C and sunflower oil (3.0%, w/w) under mixing at 8.000 rpm for 2 min in a high-speed mixer (Silverson L4RT, Silverson Machines, East Longmeadow, MA, USA), followed by homogenization (APV model 2000 SPX Laboratory Homogenizer, SPX Flow, Charlotte, NC, USA) at 20 MPa (thus, we applied 15 MPa to the first stage valve and 5 MPa to the second stage valve. Single pass of 1 L of the sample was used). For all emulsions, the pH was adjusted to 7 with 0.1 M of NaOH. At the time of analysis, the emulsions were between 23 °C and 25 °C.

2.4. Size and ζ-Potential

ζ-potential was measured according to the method of [29] by using Zetasizer Nano ZS90 (Malvern Instruments, Malvern, UK). Before measurement, the emulsion was diluted 500 times with 10 mmol/L of phosphate buffer (pH 7.0). Each record was scanned twelve times, and three repeated measurements were taken for each sample.
The emulsion particle size measurement method was based on [29] with some modifications. The particle polydispersity index (PDI) and size of the emulsion droplets dispersed in deionized water and 10 mg/mL of sodium dodecyl sulfate (SDS) after storing for 4 h and 24 h were determined using a static polyangular dispersion particle size analyzer (Zetasizer Nano ZS90, Malvern Instruments) The refractive index of soybean oil was 1.474, and the imaginary part of the refractive index (due to absorption) was fixed at 0.001.

2.5. Emulsion Flocculation Index Measurement (FI)

Following the method of [29], the d4.3 values were determined using deionized water and sodium dodecyl sulfate (SDS (10 mg/mL)) as dispersant. The values of d3.4 without and with SDS were expressed as d4.3−DS and d4.3+SDS, respectively. During the study, all emulsion samples were diluted with deionized water or SDS (10 mg/mL) solution to avoid the influence of multiple dispersions. The flocculation index (FI) of the emulsion was determined after 0 or 24 h of static storage. The flocculation index (FI) was calculated according to the following formula:
FI (%) = [(d4.3−SDS)/(d4.3+SDS) − 1.0] × 100%

2.6. Flocculation and Coalescence Measurement

The calculation method of coalescence and flocculation stability ((C + F)%), coalescence (C%), and flocculation (F%) of the emulsion during storage for 0–24 h was based on the method of [15]. We used the obtained values of d4.3 with and without SDS, evaluated at 0 h and 24 h storage time. We used the following formula:
(C + F)% = [(d4.3−SDS, (24 h) − d4.3+SDS, (0 h))/d4.3+SDS, (0 h)] × 100%
C% = [(d4.3+SDS, (24 h) − d4.3+SDS, (0 h)/d4.3+SDS, (0 h)] × 100%
F% = (C + F%) − C%

2.7. Emulsion Activity Index (EAI) and Emulsion Stability Index (ESI)

Protein emulsification activity was determined according to the method in [30] with some modifications. The protein sample (30 mL with a concentration of 2% (w/v)) was dispersed in 10 mL of soybean oil. The mixture was homogenized (Ultra-Turrax IKA T25, IKA, Staufen, Germany) at 15,000 rpm for 2 min. Then, 200 μL of the emulsion sample was immediately mixed with 25 mL of 0.1% SDS, and the absorbance (Shimadzu 1800 UV-Vis Spectrometer, Shimadzu, Columbia, MD, USA) of the solution was read at 500 nm. Emulsifying activity index (EAI, expressed in m2/g) and emulsion stability (expressed in min) were calculated using Equations (5) and (6), respectively.
EAI (m2/g) = [2 × 2.303 × A0/0.25 × protein concentration]
ESI (min) = [ A0 × ΔtA ]
where A0 = absorbance at 0 min, A10 = absorbance at 10 min, △A = A0 − A10, and △t = 10 min.

2.8. Determination of Centrifugal Stability Constant

The measurement of the emulsion centrifugal stability constant (KE) was based on the method of [29] with modifications. Briefly, the emulsion was centrifuged for 10 min at 3000× g. A volume of 50 μL before and after centrifugation was taken and then diluted in distilled water (25 mL volumetric flask). Distilled water was used as a blank, the absorbance at 500 nm was measured, and A0 and A were recorded. The following formula was used to evaluate the centrifugal stability of the emulsion:
KE (%) =(A0 − A)/A × 100

2.9. Stability against High Temperatures

Emulsion stability (ES) to high temperatures was determined following the methodology of [31] with some modifications. Briefly, the emulsions were heated to 80 °C for 30 min and centrifuged at 1000× g for 10 min. ES was calculated using following formula:
ES = (Feh/Ieh) × 100
where Feh is the final emulsion height, and Ieh is initial emulsion height.

2.10. Heat Coagulation Time (HCT)

Heat stability was determined according to the oil bath method proposed in [32] with some modifications. Briefly, a volume of 10 mL of the samples was placed in a 50 mL glass tube with screw cap (Schott). The samples were immersed in an oil bath at a constant temperature of 140 °C. The sample was shaken continuously, and the time in minutes taken for the sample to coagulate was recorded.

2.11. Optimization Experimental Design

Mixed regression analysis was applied to the data to determine the estimated coefficients and significance of the model terms, the F-test, and the coefficient of determination (R2). The results were first fitted to all available mixture regression models of increasing complexity, from linear to special cubic models. Model significance, lack of fit significance, and adjusted R2 value were used to assess the adequacy of model fit. The adjusted R2 value describes the proportion of variation in responses explained by the model, and the value was adjusted for the number of terms in the model. The models were then reduced (if any), leaving only significant terms. Finally, it was found that the responses for the analysis were best fitted using a quadratic model or the special cubic model [26].
Y = β1X1 + β2X2 + β3X3 + β12X1X2 + β13X1X2 + β23X2X3 (Quadratic)
  • OR
Y = β1X1 + β2X2 + β3X3 + β12X1X2 + β13X1X2 + β23X2X3 + β123X1X2X3 (Special Cubic)
where Y is the predicted response of the analysis; β1, β2, and β3 are the estimated coefficients of the individual linear effect terms; β12, β13, and β23 are the binary interaction effect terms; and β123 is the ternary interaction effect term. Once the estimated model equation for each response was obtained, contour and surface plots were generated.
The simultaneous optimization of the response variables was performed using the desirability function approach, which is the most popular method for solving optimization problems with multiple quality features [33]. This technique consists of converting each response variable into an individual desirability function that varies in the range of 0–1. A value of 0.0 was assigned to the predicted values of the response variable outside the region of interest, and a desirability value of 1.0 corresponded to the response variable when it reached its target. The most influential response variables for emulsion stability were selected, and thus the desirability function was applied. After applying the desirability function, a new ternary mixture was used to produce new emulsions (three repetitions were performed. n = 3). Finally, the model was validated by comparing the average responses of these emulsions with the respective values predicted by the model equations.

2.12. Statistical Analysis

All tests were performed in triplicate. A one-way analysis of variance (ANOVA) with Tukey’s Multiple Comparisons (family error rate) was applied to the data to determine a significant difference (p < 0.05) between emulsions. The experimental design, data analysis, contour and surface plots, and simultaneous optimization of the response variables were developed using a Minitab TM 19 (Minitab Inc., State College, PA, USA, EUA) statistical software package. The level of confidence used was at α = 0.05 [26,34].

3. Results and Discussion

3.1. Surface Characteristics

The surface charges (ζ-potential) of all protein mixtures at pH 7.00 are presented in Table 2. In all cases, the proteins carried a negative charge at a neutral pH. The measured surface charge values were comparable to those reported in the literature for pea protein: −20 to −30 mV [35], −20 to −22 mV [13], and −25 mV [36]; lentil protein: −25 to −30 mV [37], −30 mV [38], and −30 mV [39]; and fava bean protein: −22 mV [40], −20 mV [41], and −28.3 mV [42]. The surface charge values determined in this work are in agreement with the literature for legume proteins [35,39,43].
The T9 (−32.15 ± 1.27 mV) had higher surface charge values than the samples of the individual proteins found in this work and also in the literature. In this study, it was observed that the association between the proteins changed the surface charge of the mixtures, as the mixed proteins had higher negative charges than the protein alone. For example, pure lentil protein (T2 = −23.77 ± 2.33) had a lower surface charge when combined with pea or bean protein (T4 = −26.75 ± 2.34 and T6 = −28.05 ± 1.20).
The solubility of proteins is important because proteins, when well dispersed and in a solution, generally have good emulsifying properties and can easily migrate to the oil-water interface. The [44] relates ζ- potential to solubility and hydrophobicity, i.e., the more negative the charges, the greater the solubility of the protein and the lower the hydrophobicity of the surface. Ref. [45] found that protein solubility is directly related to charge, suggesting that proteins with higher charge are more soluble. The authors also studied proteins from peas, lentils, and broad beans and found a correlation between surface charge and solubility but inversely to hydrophobicity.

3.2. Emulsifying Properties

The emulsion activity index (EAI) and emulsion stability are two key parameters for the emulsifying properties of proteins. EAI is a measure of the ability of emulsifiers to form an emulsion, while emulsion stability evaluates the capacity of the emulsifier to stabilize the emulsion within a given time period [17,46]. The emulsion activity and emulsion stability of the different protein mixtures are shown in Figure 1. Treatment T2 with 100% lentils showed the highest emulsifying activity, followed by T4 and T8, which have a higher proportion of lentils in the formulation. The emulsifying properties of plant proteins are intrinsically linked to their amphiphilic nature, which connects hydrophilic and hydrophobic areas and thus facilitates interaction at the water–oil interfaces. Hydrophobicity allows the proteins to accumulate in the oil phase, while hydrophilicity promotes adsorption in the aqueous phase. Once adsorbed, the proteins reduce the interfacial tension and stabilize the emulsion by forming a viscoelastic layer that prevents the droplets from coalescing [22,47]. Protein adsorption at the interface generally occurs in two stages. First, the proteins migrate and bind at the oil–water interface [48]. Once the protein molecules are transported and bound to the interface, their hydrophobic part promotes adsorption. Lentil protein has a higher hydrophobicity [49] compared to pea and fava bean protein, which could explain its greater activity at the surface to form the emulsion. However, its stabilizing effect is low. Ref. [45] observed that pea protein was able to stabilize the emulsion longer than lentil protein. It has been suggested that this phenomenon is related to the high negative charge on the surface of the pea protein that coats the oil droplets. Previous studies with pea, lentil, and bean proteins at a pH of 7 gave EAI and ESI values for fava beans: 8 m2/g, 14 [41], 28 m2/g, 25 min [50]; lentil protein: 18 to 25 m2/g, 12 to 18 min [37]; and pea protein: 13.1 to 14.1 m2/g, 53 to 95 min [51], 19.3 ± 0.2 m2/g, 61.6 ± 0.2 min [52]. The values found in this work are consistent with those in the literature. Lentil protein in combination with pea protein showed better ESI average values, while T5, a combination of pea and fava protein in equal amounts, showed lower average values than pea and fava protein alone.
The T10 mixture (Figure 1) showed better results in terms of the emulsifying and stabilizing effect of the final emulsion. The combination in equal proportions favored both EAI and ESI. Lentil proteins are believed to be responsible for the rapid adsorption at the interface. Lentil proteins usually have a considerable amount of hydrophilic amino acid residues, such as glutamine/glutamic acid, asparagine/aspartic acid, lysine, and arginine [37], which contribute to hydrogen bonds and electrostatic interactions [53] Since pea and bean proteins are more soluble, they can stabilize the emulsion [49,54]. Due to the higher solubility of proteins, more solubilized proteins can be rapidly adsorbed at the oil–water interface, which facilitates the formation of densely packed films around oil droplets [55]. The T10 treatment, which combines lentil, bean, and pea proteins in equal proportions, showed the best results in terms of the emulsifying effect and stabilization. This synergistic combination improves both the emulsifying ability (EAI) and the emulsion stability index (ESI) and makes the T10 mixture effective.

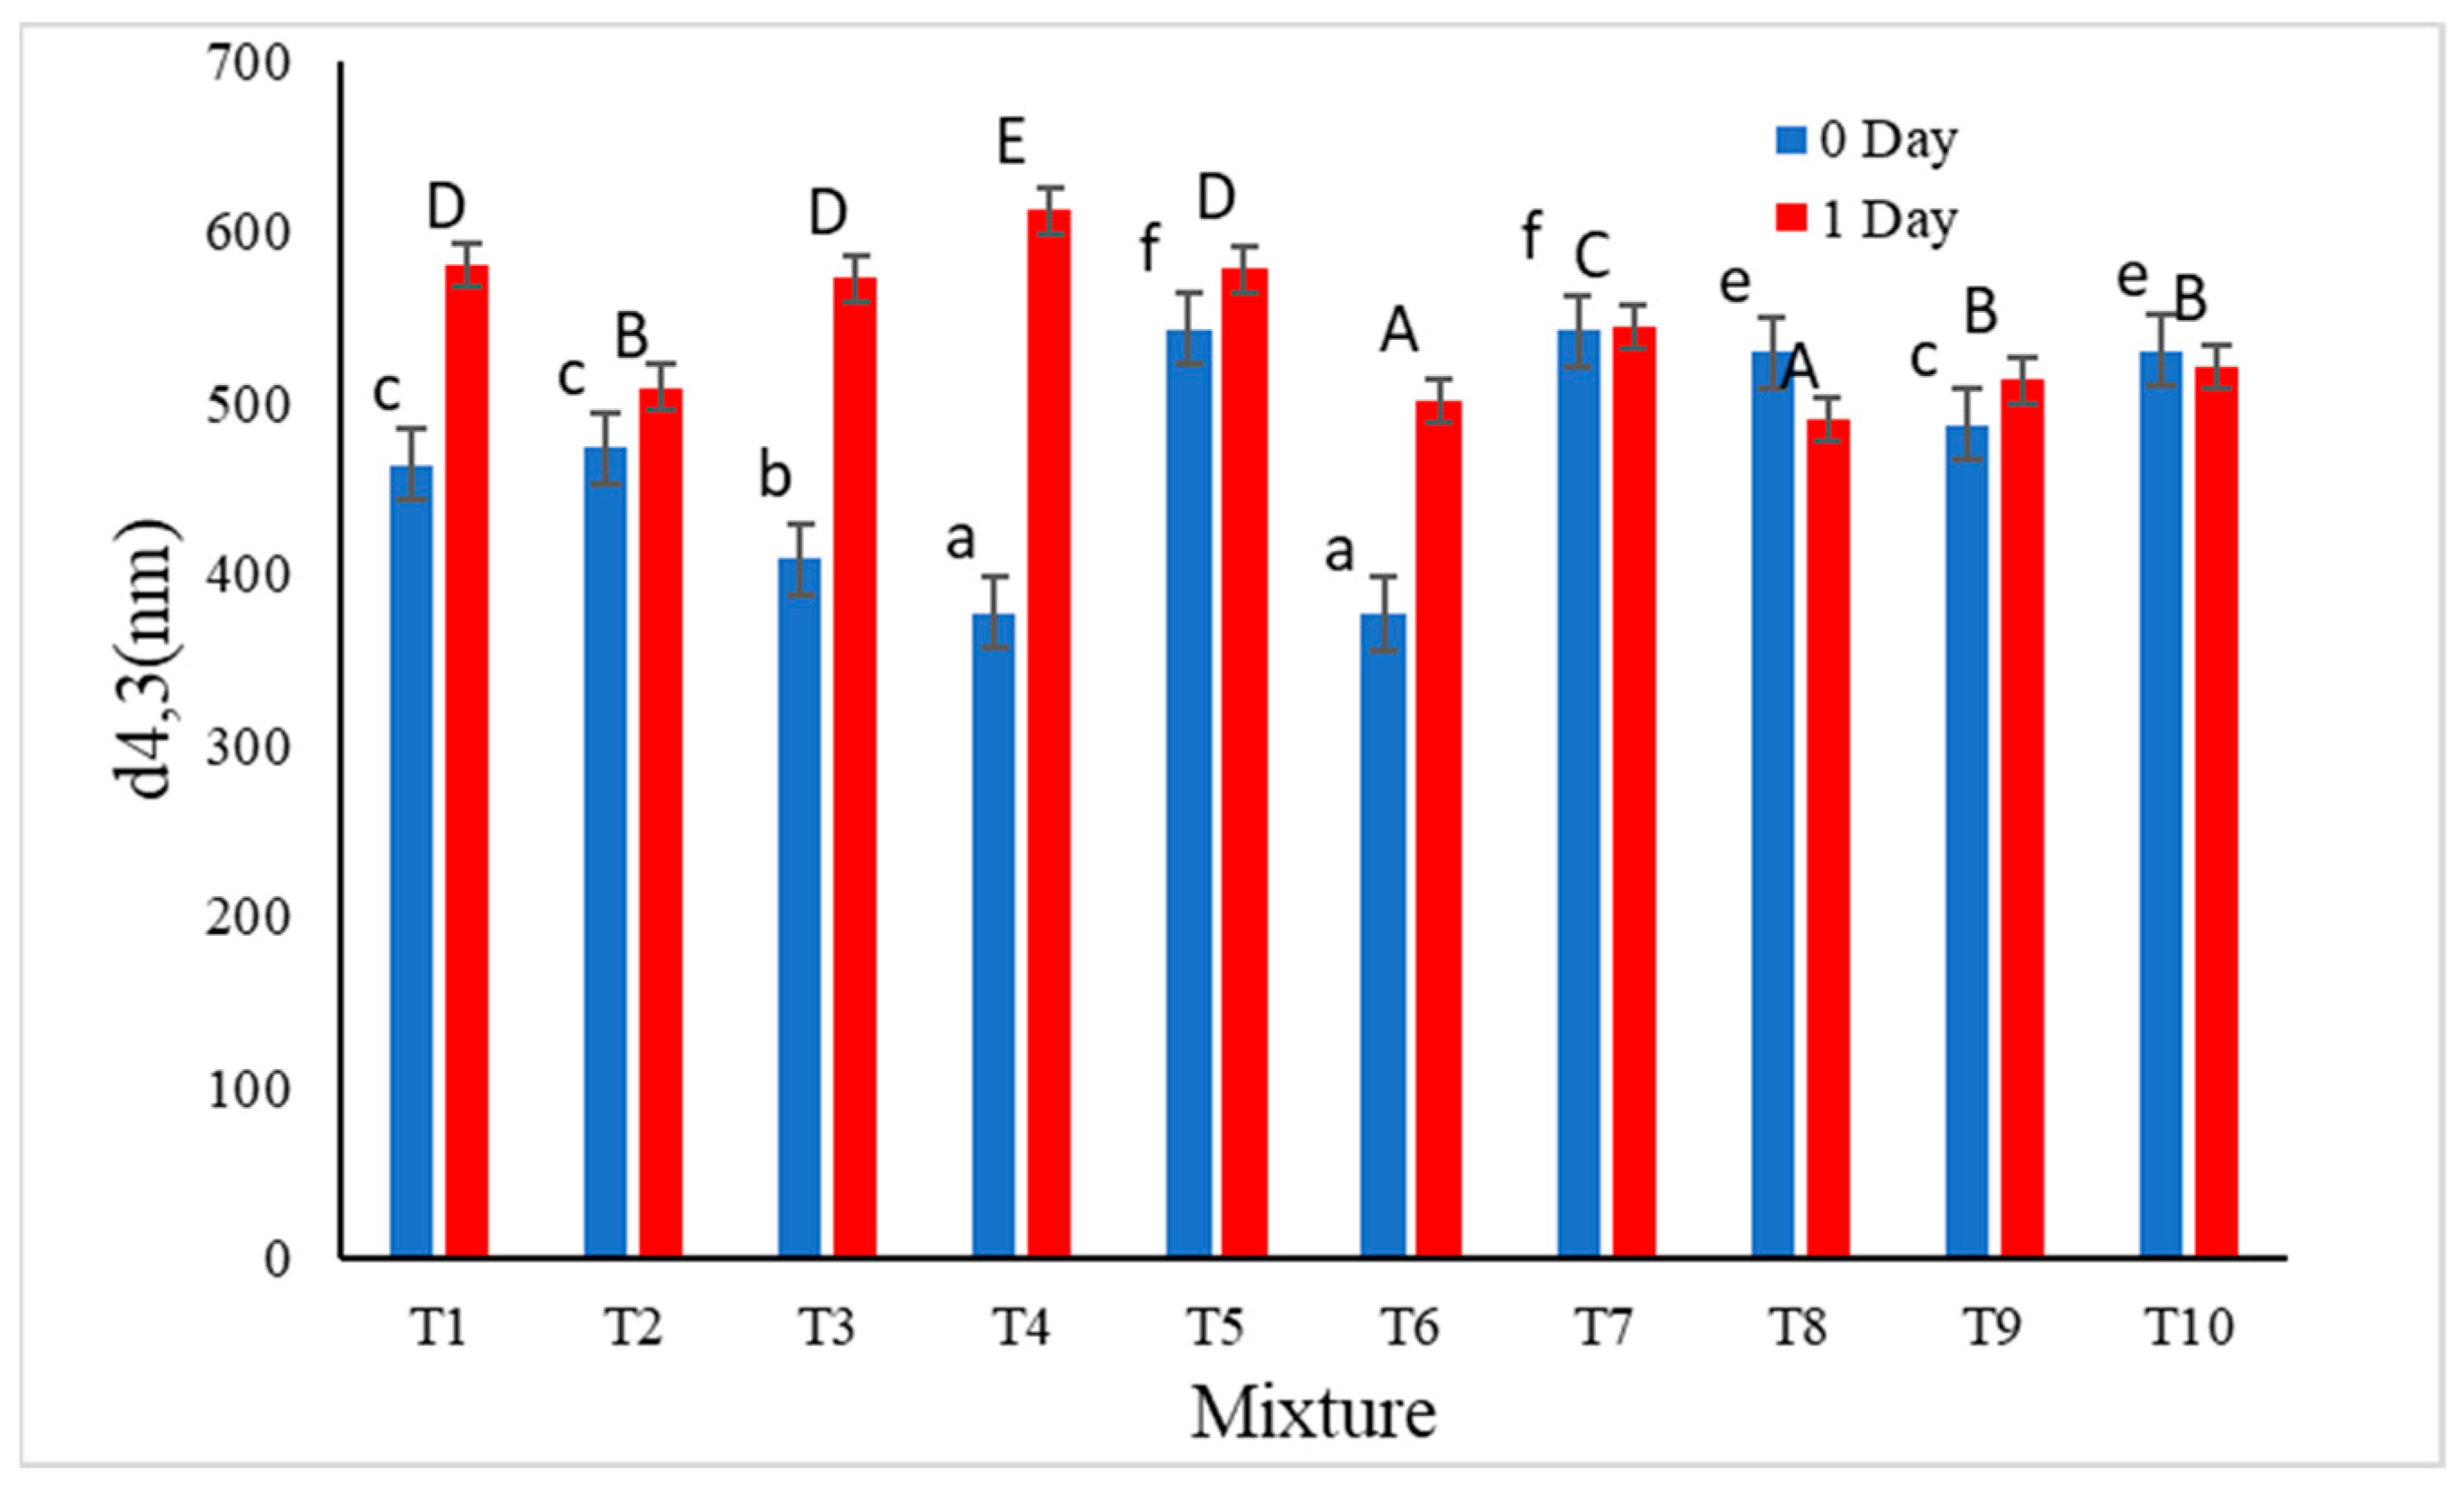
3.3. Stability to Flocculation and Coalescence

Flocculation is a significant mechanism contributing to the destabilization of emulsions [56,57]. It occurs when emulsion droplets aggregate, which can result from reduced electrostatic repulsion or inadequate protein adsorption at the interface [57,58]. To calculate the flocculation and coalescence index, we used the d4.3 values. The value d4.3, also known as the volume mean diameter, is crucial for understanding the particle size distribution in emulsions. It represents the average size of particles, weighted by volume, which helps in evaluating the stability and quality of the emulsion. Larger d4.3 values often indicate larger particle sizes, which can lead to increased flocculation and coalescence, impacting the stability of the emulsion. The measurement of d4.3 provides insight into the behavior of the emulsion under different conditions and can guide the optimization of formulations for better performance.
Emulsions stabilized with lentil proteins exhibited a lower flocculation index (3.93 ± 0.09%) compared to those stabilized with pea proteins (5.72 ± 0.01%) and fava bean proteins (25.80 ± 0.12%) [8]. This discrepancy is likely due to the lower content of sulfhydryl (SH) and disulfide (SS) bonds in lentil proteins, as SH groups can form bridges that enhance droplet flocculation [8]. Conversely, emulsions stabilized with bean proteins showed an inverse relationship, where the flocculation index increased with higher bean content (e.g., T3: 100% fava—FI: 25.80 ± 0.12%).
Flocculation can lead to coalescence, a process where droplets merge to form larger aggregates, contributing to phase separation [59]. This phase separation occurs when the oil droplet size is sufficiently large to increase oil density. Table 2 presents data on coalescence and flocculation. Coalescence was minimized in treatments with lower flocculation indices. Treatment T4, containing 50% lentils, 50% peas, and 0% fava beans, showed the poorest emulsion stability, with a high flocculation index (26.02 ± 0.12%), low flocculation stability (26.69 ± 0.13%), and poor coalescence stability (78.39 ± 0.38%), in addition to a larger particle size (650 nm) after 24 h (Figure 2). Most treatments exhibited an increase in droplet size after 24 h, except for T7, where the size remained constant, and T8 and T10, which showed a decrease in droplet size (Figure 2). Notably, pea protein, present in all three treatments, appears to be the most effective in reducing both coalescence and flocculation, as indicated by the contour plot (Figure 3A,D).
Variations in emulsification behavior among proteins may stem from differences in their physicochemical properties, such as molecular weight, hydrophobicity, and the presence of free SH and SS bonds [58]. These properties affect the diffusion and interaction of plant proteins at the oil–water interface [49]. A study examining lentil, pea, soybean, and rapeseed proteins found that physicochemical properties were influenced by pH, protein type, and their interactions [49]. Differences in hydrophobicity among these proteins are thought to reflect inherent variations in protein composition, including the ratios of 11S to 7S proteins or globulins to albumins. In general, solubility depends on the balance between protein–protein and protein–solvent interactions [59]. Ref. [49] found that pea protein was the most effective at reducing interfacial tension. This suggests that the effectiveness of the protein in reducing interfacial tension is best when the protein has a larger charge and lower hydrophobicity. However, flexible proteins exhibited better emulsification and foaming properties due to their higher surface hydrophobicity. Other key factors influencing greater structural flexibility are greater surface hydrophobicity and fewer desulfated bonds [60]. Thus, when different proteins come together in a given emulsion, each fraction of the protein can act in its specificity to improve the overall emulsification outcome [22].

3.4. Accelerated Tests—Stability to Centrifugation and Extreme Heat Treatment

Accelerated tests, such as centrifugation and extreme heating to 140 °C, are essential for evaluating the stability of emulsions, even if these conditions do not represent a real-life scenario. Through these tests, it is possible to determine the performance of emulsions under stress and predict their long-term behavior under normal storage and used conditions. Oil and water emulsions that are stabilized only by plant proteins, such as lentils, peas, and broad beans, may exhibit separation or structural loss under adverse conditions, revealing weaknesses that would not be detected under normal conditions. These accelerated tests allow researchers to observe instability phenomena such as flocculation and coalescence and identify components that can be optimized. They also ensure the safety and quality of the final product.
The coalescence of the emulsion droplets can be accelerated by mechanical stirring or by centrifugal force, as the frequency of collision of the emulsion droplets is increased. Centrifugation is a simple and practical method for determining the effects of formulation on the coalescence stability of emulsions by forcing the droplets to collide with each other through centrifugal force 24. Table 2 lists the stability constants (KE). T3 with 100% fava bean protein was the most stable emulsion and resisted centrifugal force better.
By adsorbing at the interface and forming an interfacial film, the steric hindrance formed can inhibit the movement of small droplets [61]. These results are in agreement with the discovery made by [43] that the fava bean protein adsorbs much better at the interface than the pea protein, followed by the lentil protein. It was observed that all the emulsions that contained a higher percentage of fava bean in their formulation showed higher stability after centrifugation [12,22].
According to [43], the adsorption rate of fava bean protein when added to an oil–water emulsion is much higher than that of pea > lentil protein at the same concentrations, which could explain the lower contribution of lentil proteins to emulsion stability. Indeed, both protein solubility and surface charges are important for the stability of emulsion systems [62].
Gravity separation often causes droplets to remain in contact for prolonged periods of time, which can lead to increased flocculation or coalescence. The highest coalescence was observed in T8 (50% lentil, 25% pea, 25% fava) and T2 (100% lentils) after centrifugation, with a thicker oil layer forming. Samples with a higher proportion of lentils in the formulation had a thick oil layer. In sample T3, the presence of pure broad beans in the emulsion improved the resistance of the oil droplets to high gravity, resulting in greater homogeneity with a creaminess threshold of less than 5%.
An analysis of the contour plot (Figure 3C) shows untested areas responsible for better emulsion stability. Higher concentrations of fava beans may reduce the coalescence of the samples during centrifugation, resulting in more stable emulsions, but mixtures with lentils and peas may also exhibit the same properties. Lentil protein, in combination with pea protein, did not lead to higher stability at the tested concentrations.
Heat treatment can lead to greater movement of the oil droplets, their flocculation, and a loosening of the protein structure, resulting in the formation of interactions between the protein molecules (hydrophobic or disulfide bonds) [63]. These phenomena reduce the thermal stability of the emulsion [31]. When the samples were heated to 80 °C for 30 min and then centrifuged, only treatments T2 (100% lentil protein) and T4 (50% pea, 50% lentil) showed extreme phase separation, which completely changed the appearance of the samples. All other emulsions remained stable, proving that they could withstand heat treatment at 80 °C. The fava bean protein was able to thermally stabilize the emulsion with lentils and also the emulsion with peas and lentils. Ref. [64] found a peak of denaturation of the lentil protein between 118 and 123 °C, temperatures way above those tested in the present study. However, the lentil protein was not able to withstand such stress, so the solid part settled at the bottom of the tube. This sedimentation was also observed by Jeske S [65] in samples with lentil protein that were not treated with high pressure when subjected to the accelerated stability test. A wide range of commercial plant-based milk substitutes analyzed in another study showed high deposition rates for almost all products due to insoluble plant material via flocculation and precipitation [36,66].
In HCT (Time of Thermal Coagulation) analysis, coagulation is induced by applying heat in order to measure the thermal stability of the sample. Methods of this type can be useful to some extent to simulate batch sterilization in an autoclave, where the heating of the sample is as slow as in laboratory-scale thermal stability tests.
The mixed protein suspensions had a thermal clotting time (HCT) of 13.53 ± 2.11 to 25.78 ± 0.67 min in an oil bath at 140 °C (Table 2). The T2 treatment had the shortest thermal clotting time. The longest time was observed in the mixtures with the highest concentration of pea and bean protein. The combination of lentil protein with pea or bean resulted in a prolongation of the clotting time. In a study with lentil protein at 3.3% (w/w), a value of 8.28 min was determined for thermal stability [65]. In general, it can be stated that the proteins were stabilized to a certain degree and protected from heat-induced coagulation. As long as the proteins are at the interface with the oil, their hydrophobic groups are aligned with the oil phase so that no interactions are forced between the exposed hydrophobic sites of the protein molecules. However, as the degree of denaturation increases, the proteins may lose their ability to stabilize the interface, and eventually, the system becomes unstable, leading to exposure of the hydrophobic groups and aggregation.
Ref. [67] observed that HCT increased from 2.8 to 6.7 min when pH was increased from 6.3 to 7.2. This heat-induced coagulation is determined by a balance between attractive and repulsive forces, as an increase in the latter has been shown to increase HCT. The charge distribution between amino acid side chains is altered by pH, and for lentil proteins, negative charges increase with increasing pH, resulting in greater repulsion between lentil proteins. The results of this work are consistent with those obtained by 65. The surface charge of the emulsions, with the lentil protein having the highest charge (−23.77 ± 2.33), showed a shorter coagulation stability time, while the other emulsions, which had longer HCT times, showed lower surface charges. This inverse correlation was observed in the correlation test, although it did not reach significant values (r = −3.64; p < 0.05), indicating a weak correlation.

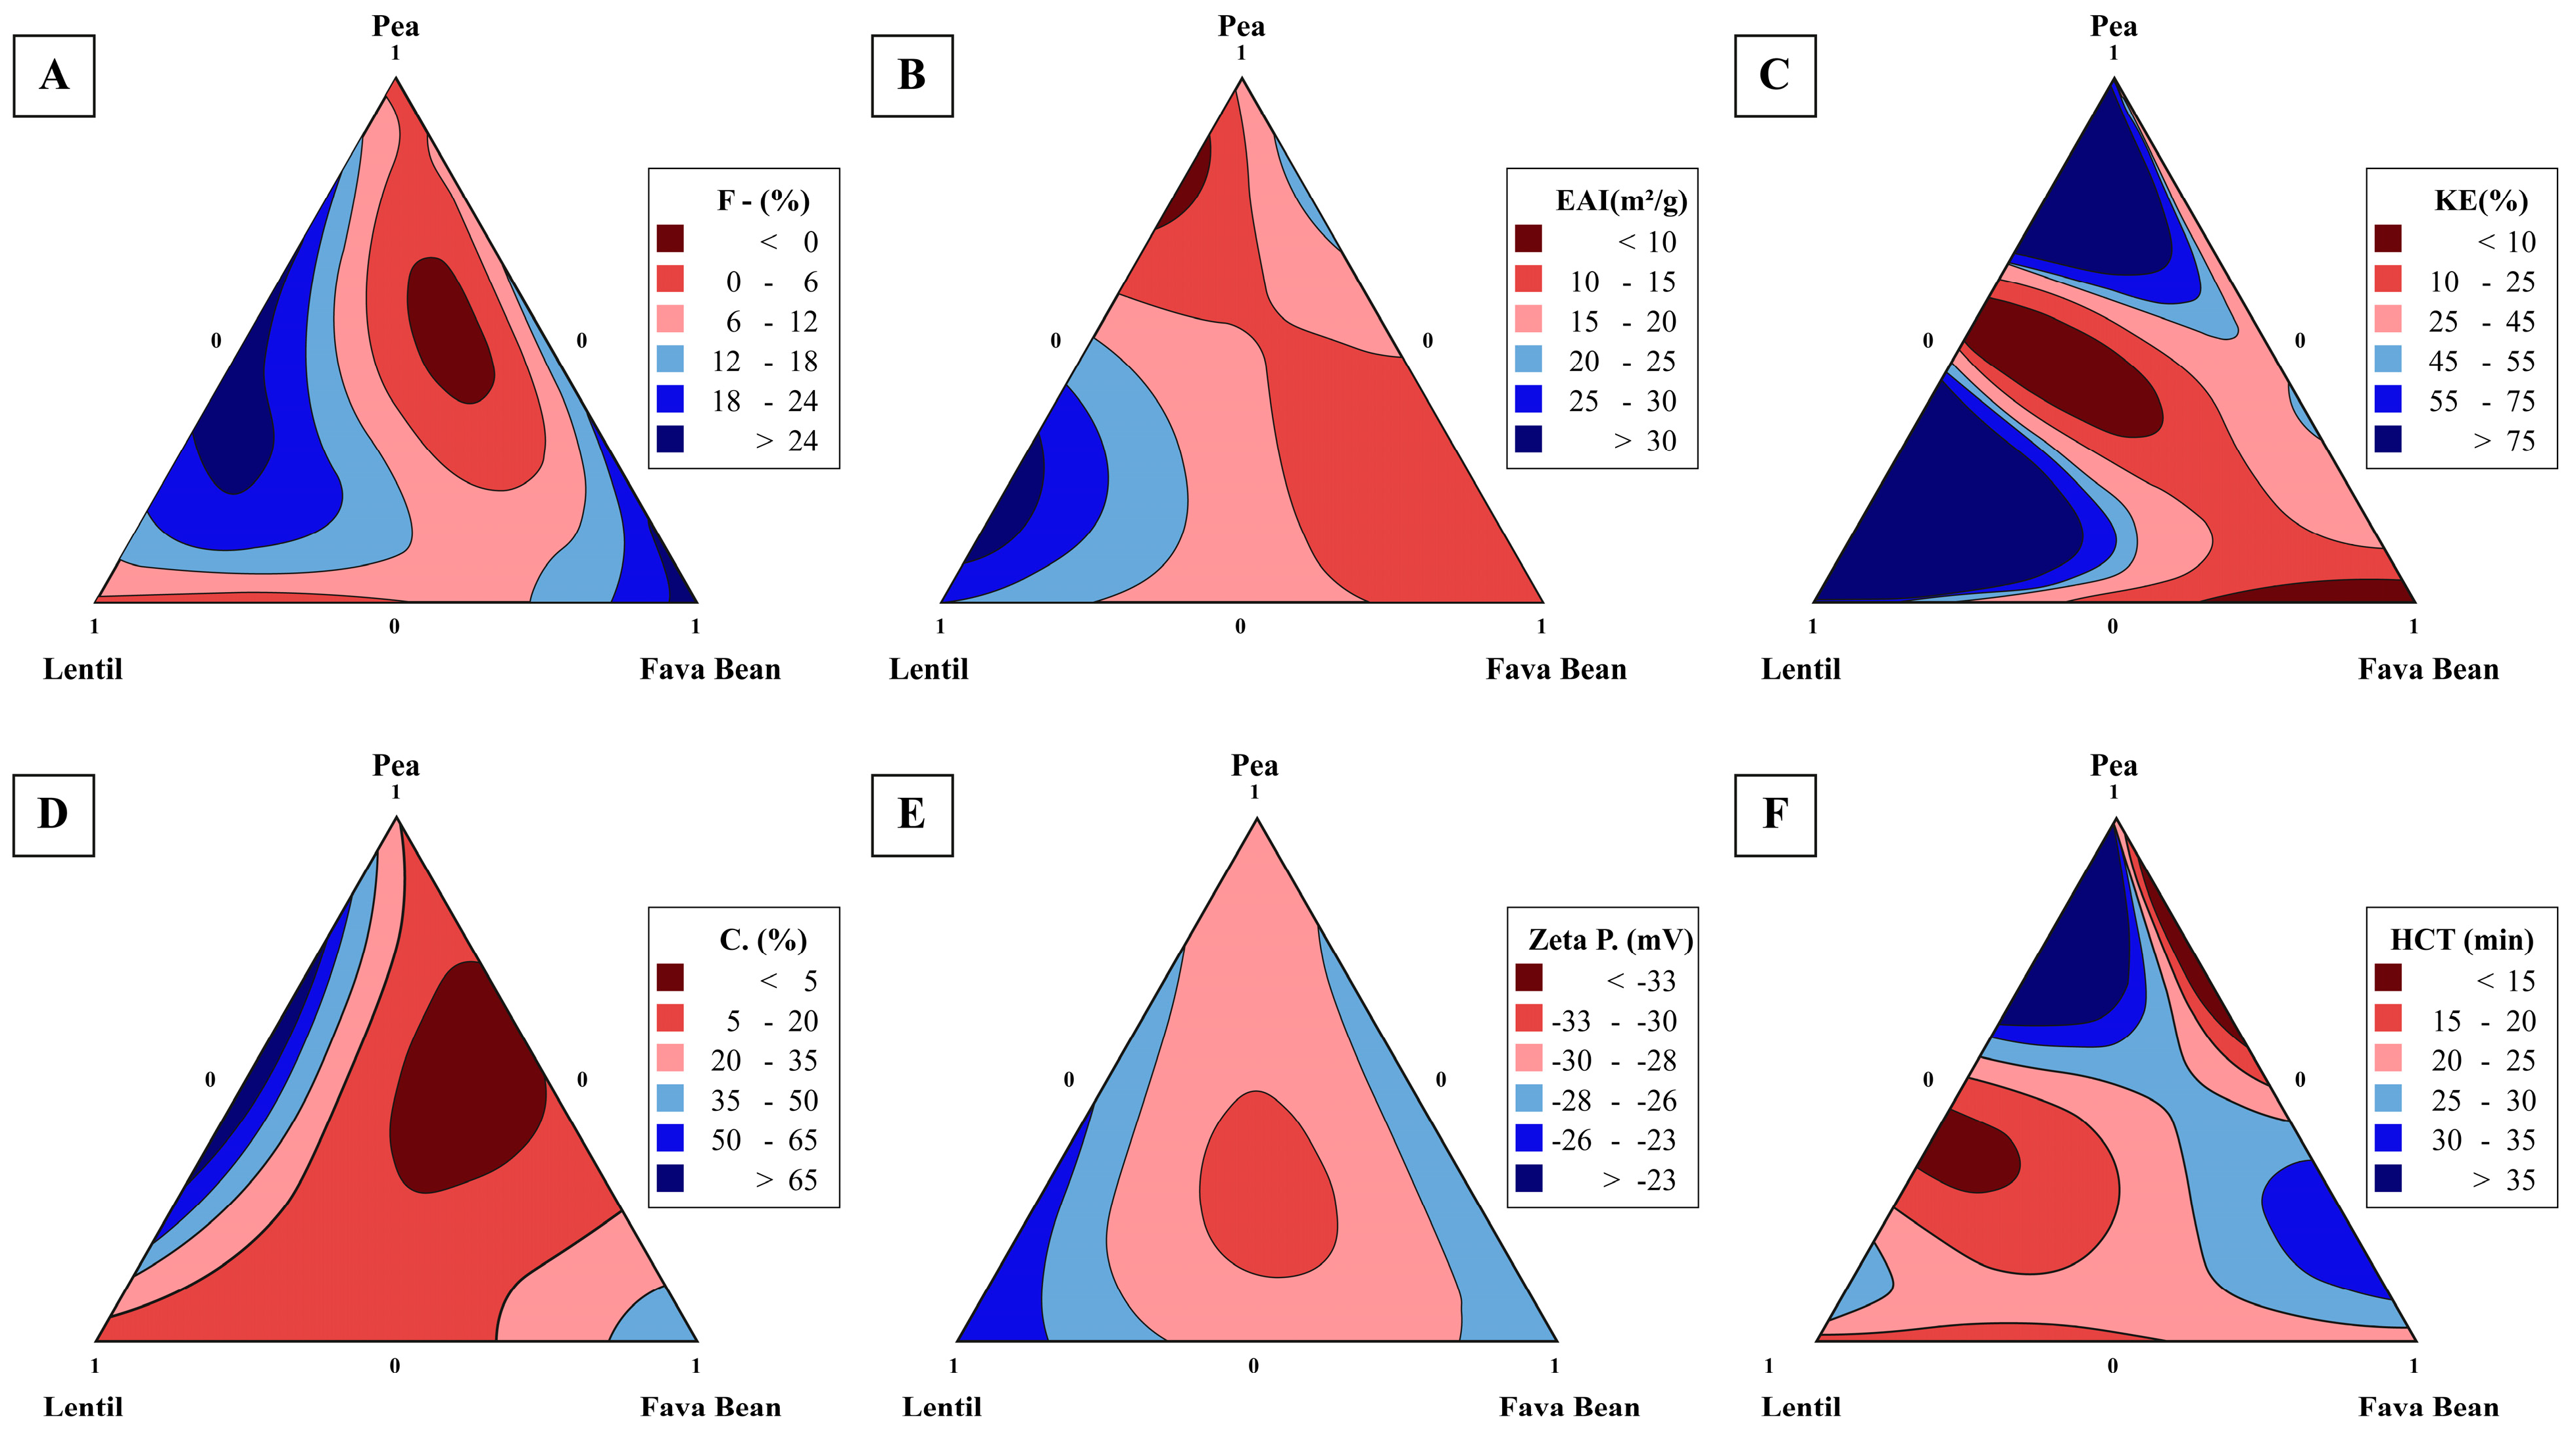
3.5. Surface Response Graphs—Response Optimization Variable

Response surface analysis is a statistical method that can be used to examine the relationship between several independent variables and a dependent variable in order to optimize a response. Before a contour plot (Figure 3) could be created, a model had to be created to relate these variables to each other using polynomial regression. All analyzed variables were subjected to regression analysis for model fitting. Not all variables analyzed in the sample were able to fit the model. Table 3 shows the models of the regression equations for the responses variable, along with the regression equation and the R2 value. Model validation was conducted using an ANOVA test. Each response variable was fitted to a single model that best explained its behavior concerning the protein combination. As shown in Table 3, the lack of fit was not significant for any of the models (p > 0.05). The adjusted R2 values, ranging from 0.7376 to 0.9988, indicate that the models can satisfactorily account for the variability in the data. The model was validated to ensure that the assumptions of the analysis, such as normality and homoscedasticity of the residuals, were met. However, response variables such as the stability index, mean particle size, and polydispersity index could not be adequately fitted to the model.
After fitting the model, the variables that showed model fit are shown in Figure 3. The contour plots created for each response variable allow us to observe the interaction between the independent variables and the response and to visualize the maximum and minimum ranges of the dependent variable. This visualization helps us to identify the ideal conditions for optimizing the variables and to determine which protein is responsible for this behavior.
To make the effect of the independent variables on the reaction of interest clear, contour diagrams for the variables of flocculation, coalescence stability, emulsification activity, centrifugal stability, surface charge (zeta potential), and HCT are shown in Figure 3. On the basis of the contour graph, the influence of the individual proteins or their combination on the most important reactions can be understood. It can be seen that pea protein has the strongest influence on the coalescence and flocculation stability and thermal stability (HCT). The bean protein was responsible for the accelerated stability when the sample was subjected to mechanical stress, and the pea protein influenced the emulsifying activity.
It is possible to identify several experimentally untested regions that can assume optimal values for each tested variable. For coalescence and flocculation stability, the formulations can vary between pea and bean proteins, while the lowest values for surface charge are in the central region of the diagram, that is, when the three proteins are combined. The experimental values proved that for the zeta potential, T10 (combination of the three proteins in equal proportions) was the best formulation, so Table 4 shows experimental values of possible optimal formulations for the main tested variables.

3.6. Optimization of Multiple Parameters

For each parameter assessed, a regression analysis was performed to determine the model that best explained the responses. In this study, it was possible to predict significant effects on several parameters, such as coalescence stability, flocculation stability, particle size, HCT, emulsifying activity, and zeta potential. The quadratic and special cubic models allowed the evaluation of the influence of the variables on the responses. In addition, the analysis of variance (ANOVA) confirmed the significance of the influence of the model on these responses (Table 3).
To select the parameters for the optimization of the emulsion, a correlation analysis was performed between the analyses carried out to determine which variables are related to each other and, thus, select the relevant variables. Table 5 shows the significant correlation values between the variables.
In order to optimize the formulation of the ideal protein concentration and address multiple variables with optimal solutions, it is important to select the key parameters for analysis. The fewer variables considered during the optimization, the more accurate the results will be. We use correlation analysis to determine which response variables are related to one another.
Through the correlation analysis, it was possible to cross the data from emulsifying activity with the results of the centrifugation stability and the polydispersity index. The zeta potential was correlated with the emulsion stability. Coalescence stability was correlated with flocculation stability, which in turn correlated with particle size. Based on these correlations, the following parameters were selected for optimization of the mixture: EAI, HCT, zeta potential, particle size, and coalescence stability.
For each analysis, the parameters of interest were defined. The variables EAI and HCT were maximized, while the zeta potential, coalescence stability, and IPD variables were minimized (Table 6). The lower and upper limits for each dependent variable were set to values that guarantee the integrity and intrinsic properties of the product based on the maximum or minimum values obtained for each response (Table 3). The optimization results provide information about the influence of the mixture on the stability of the emulsion.
After setting the optimization parameters (Table 6), the desirability function was used to calculate a new optimal formulation that satisfied the previously set values with greater accuracy. The optimal experimental formulation is 21.21% pea protein, 32.78% lentil, and 46.01% broad bean (R2 Adj, 0.9057).

3.7. Verification of Predictive Models

After calculating the new formulation for the mixture of the three proteins, the predicted concentration (21.21% pea, 32.78% lentils, and 46.01% fava beans) was tested in the laboratory, and the analyses were repeated for comparison with the values predicted by the program (n = 3). The (experimental) values obtained in the laboratory are shown in Table 6.
It can be noted that the values obtained are close to those predicted by the mathematical optimization model, with the exception of EAI, and therefore, the fitted model is considered valid for the formulation. Through the desirability function, it is possible to optimize each parameter independently, as shown in Table 3, to modulate, maximize, or minimize each response variable, in addition to optimizing multiple responses to obtain the ideal formulation.
The predicted value and the experimental value are close in most analyses, with a relative error of less than 5%. It can be concluded that the mathematical optimization model, with the exception of EAI, is considered valid for the formulation. The equation-predicted formulation showed better results for the tested dependent variables than the mixture formulations and even better than the isolated protein.

3.8. Applications

Research into oil–water emulsions stabilized by plant proteins offers several practical advantages, particularly in the food industry. These emulsions are often used in products such as mayonnaise, sauces, creams, and desserts, providing texture and stability. In addition, plant-based drinks are gaining more market share as they are an excellent alternative for drinks and ingredients for home recipes for consumers who do not consume milk and dairy products. The use of plant-based proteins, such as those mentioned in this paper—peas, lentils, and fava beans—provides a healthy alternative to synthetic emulsifiers, which many consumers associate with unnatural additives. With the growing interest in clean-label products, emulsions stabilized by plant proteins can meet the demands of a public that is increasingly concerned about the quality of the food they consume. In addition, plant proteins are often more sustainable and help to reduce the environmental footprint of food production. Research in this field not only enables the innovation of new products but also the exploration of different protein sources, expanding formulation possibilities. Thus, the development of these emulsions can not only improve consumer acceptance but also increase the functionality and nutritional value of food.

4. Conclusions

This study reveals the importance of synergism among different plant proteins, particularly those extracted from peas, lentils, and broad beans, for improving the emulsifying properties of oil–water emulsions. The results indicate that the combination of these proteins provides superior functionality compared to using each of them individually. This highlights the potential of protein blends in various applications, especially in the food industry and sectors that depend on emulsified systems. The ideal formulation identified to ensure emulsion stability and emulsifying capacity, which has been tested under conditions of gravitational acceleration and thermal instability, consists of 21.21% peas, 32.78% lentils, and 46.01% broad beans, considering an oil–water emulsion with 2% total protein and 3% sunflower oil. The response optimization approach used has proven to be a valuable tool for developing more stable emulsions.

Supplementary Materials

The following are available online at https://www.mdpi.com/article/10.3390/app14178086/s1.

Author Contributions

R.R.L.: Data curation, Formal analysis, Methodology, Validation, Writing—original draft, Writing—review and editing. M.E.M.V.: Data curation, Formal analysis, Investigation. N.d.S.C.: Data curation, Formal analysis, Investigation. R.S.: Conceptualization, Project administration, Resources, Supervision, Í.T.P.: Project administration, Resources, Supervision, F.C.: Supervision, Writing—review and editing, A.F.d.C.: Project administration, Resources, Supervision, Writing—review and editing. All authors have read and agreed to the published version of the manuscript.

Funding

This research received no external funding.

Institutional Review Board Statement

Not applicable.

Informed Consent Statement

Not applicable.

Data Availability Statement

The raw data supporting the conclusions of this article will be made available by the authors on request.

Acknowledgments

The authors are thankful to CNPq/Vida Veg LTDA, Capes (001) and FAPEMIG.

Conflicts of Interest

The authors declare no conflicts of interest.

References

  1. Jaeger, S.R.; Dupas de Matos, A.; Frempomaa Oduro, A.; Hort, J. Sensory Characteristics of Plant-Based Milk Alternatives: Product Characterisation by Consumers and Drivers of Liking. Food Res. Int. 2024, 180, 114093. [Google Scholar] [CrossRef]
  2. Jeske, S.; Zannini, E.; Arendt, E.K. Evaluation of Physicochemical and Glycaemic Properties of Commercial Plant-Based Milk Substitutes. Plant Foods Hum. Nutr. 2017, 72, 26–33. [Google Scholar] [CrossRef] [PubMed]
  3. McClements, D.J.; Grossmann, L. The Science of Plant-Based Foods: Constructing Next-Generation Meat, Fish, Milk, and Egg Analogs. Comprehensive Reviews in Food Science and Food Safety; Blackwell Publishing Inc.: Hoboken, NJ, USA, 2021; pp. 4049–4100. [Google Scholar] [CrossRef]
  4. Ray, M.; Rousseau, D. Stabilization of Oil-in-Water Emulsions Using Mixtures of Denatured Soy Whey Proteins and Soluble Soybean Polysaccharides. Food Res. Int. 2013, 52, 298–307. [Google Scholar] [CrossRef]
  5. Huang, L.; Cai, Y.; Liu, T.; Zhao, X.; Chen, B.; Long, Z.; Zhao, M.; Deng, X.; Zhao, Q. Stability of Emulsion Stabilized by Low-Concentration Soybean Protein Isolate: Effects of Insoluble Soybean Fiber. Food Hydrocoll. 2019, 97, 105232. [Google Scholar] [CrossRef]
  6. Wang, L.; Wu, M.; Liu, H.M. Emulsifying and Physicochemical Properties of Soy Hull Hemicelluloses-Soy Protein Isolate Conjugates. Carbohydr. Polym. 2017, 163, 181–190. [Google Scholar] [CrossRef]
  7. Tran, T.; Rousseau, D. Stabilization of Acidic Soy Protein-Based Dispersions and Emulsions by Soy Soluble Polysaccharides. Food Hydrocoll. 2013, 30, 382–392. [Google Scholar] [CrossRef]
  8. Ladjal-Ettoumi, Y.; Boudries, H.; Chibane, M.; Romero, A. Pea, Chickpea and Lentil Protein Isolates: Physicochemical Characterization and Emulsifying Properties. Food Biophys. 2016, 11, 43–51. [Google Scholar] [CrossRef]
  9. Li, C.; Huang, X.; Peng, Q.; Shan, Y.; Xue, F. Physicochemical Properties of Peanut Protein Isolate-Glucomannan Conjugates Prepared by Ultrasonic Treatment. Ultrason. Sonochem. 2014, 21, 1722–1727. [Google Scholar] [CrossRef]
  10. Ghumman, A.; Kaur, A.; Singh, N. Impact of Germination on Flour, Protein and Starch Characteristics of Lentil (Lens culinari) and Horsegram (Macrotyloma uniflorum L.) Lines. LWT 2016, 65, 137–144. [Google Scholar] [CrossRef]
  11. Sharan, S.; Zanghelini, G.; Zotzel, J.; Bonerz, D.; Aschoff, J.; Saint-Eve, A.; Maillard, M.N. Fava Bean (Vicia faba L.) for Food Applications: From Seed to Ingredient Processing and Its Effect on Functional Properties, Antinutritional Factors, Flavor, and Color. Compr. Rev. Food Sci. Food Saf. 2021, 20, 401–428. [Google Scholar] [CrossRef]
  12. Olsmats, E.; Rennie, A.R. Pea Protein [Pisum sativum] as Stabilizer for Oil/Water Emulsions. Adv. Colloid Interface Sci. 2024, 326, 103123. [Google Scholar] [CrossRef] [PubMed]
  13. Stone, A.K.; Karalash, A.; Tyler, R.T.; Warkentin, T.D.; Nickerson, M.T. Functional Attributes of Pea Protein Isolates Prepared Using Different Extraction Methods and Cultivars. Food Res. Int. 2015, 76, 31–38. [Google Scholar] [CrossRef]
  14. Jiang, J.; Zhu, B.; Liu, Y.; Xiong, Y.L. Interfacial Structural Role of PH-Shifting Processed Pea Protein in the Oxidative Stability of Oil/Water Emulsions. J. Agric. Food Chem. 2014, 62, 1683–1691. [Google Scholar] [CrossRef] [PubMed]
  15. Tang, C.H.; Shen, L. Role of Conformational Flexibility in the Emulsifying Properties of Bovine Serum Albumin. J. Agric. Food Chem. 2013, 61, 3097–3110. [Google Scholar] [CrossRef]
  16. Shewry, P.R.; Croy, R.R.D.; Boulter, D. The Synthesis and Structure of Pea Storage Proteins. Crit. Rev. Plant Sci. 1984, 1, 287–314. [Google Scholar] [CrossRef]
  17. Boye, J.; Zare, F.; Pletch, A. Pulse Proteins: Processing, Characterization, Functional Properties and Applications in Food and Feed. Food Res. Int. 2010, 43, 414–431. [Google Scholar] [CrossRef]
  18. Wanasundara, J.P.D. Proteins of Brassicaceae Oilseeds and Their Potential as a Plant Protein Source. Crit. Rev. Food Sci. Nutr. 2011, 51, 635–677. [Google Scholar] [CrossRef]
  19. Alves, A.C.; Tavares, G.M. Mixing Animal and Plant Proteins: Is This a Way to Improve Protein Techno-Functionalities? Food Hydrocoll. 2019, 97, 105171. [Google Scholar] [CrossRef]
  20. Grasberger, K.; Sunds, A.V.; Sanggaard, K.W.; Hammershøj, M.; Corredig, M. Behavior of Mixed Pea-Whey Protein at Interfaces and in Bulk Oil-in-Water Emulsions. Innov. Food Sci. Emerg. Technol. 2022, 81, 103136. [Google Scholar] [CrossRef]
  21. Hinderink, E.B.A.; Münch, K.; Sagis, L.; Schroën, K.; Berton-Carabin, C.C. Synergistic Stabilisation of Emulsions by Blends of Dairy and Soluble Pea Proteins: Contribution of the Interfacial Composition. Food Hydrocoll. 2019, 97, 105206. [Google Scholar] [CrossRef]
  22. Zhang, X.; Wang, Q.; Liu, Z.; Zhi, L.; Jiao, B.; Hu, H.; Ma, X.; Agyei, D.; Shi, A. Plant Protein-Based Emulsifiers: Mechanisms, Techniques for Emulsification Enhancement and Applications. Food Hydrocoll. 2023, 144, 109008. [Google Scholar] [CrossRef]
  23. Hinderink, E.B.A.; Sagis, L.; Schroën, K.; Berton-Carabin, C.C. Behavior of Plant-Dairy Protein Blends at Air-Water and Oil-Water Interfaces. Colloids Surf. B Biointerfaces 2020, 192, 111015. [Google Scholar] [CrossRef] [PubMed]
  24. Ho, K.K.H.Y.; Schroën, K.; San Martín-González, M.F.; Berton-Carabin, C.C. Synergistic and Antagonistic Effects of Plant and Dairy Protein Blends on the Physicochemical Stability of Lycopene-Loaded Emulsions. Food Hydrocoll. 2018, 81, 180–190. [Google Scholar] [CrossRef]
  25. Zhang, Y.; Lee, A.Y.; Pojchanun, K.; Lee, C.P.; Zhou, A.; An, J.; Hashimoto, M.; Tan, U.X.; Leo, C.H.; Wong, G.; et al. Systematic Engineering Approach for Optimization of Multi-Component Alternative Protein-Fortified 3D Printing Food Ink. Food Hydrocoll. 2022, 131, 107803. [Google Scholar] [CrossRef]
  26. Hayati, I.N.; Ching, C.W.; Rozaini, M.Z.H. Flow Properties of O/W Emulsions as Affected by Xanthan Gum, Guar Gum and Carboxymethyl Cellulose Interactions Studied by a Mixture Regression Modelling. Food Hydrocoll. 2016, 53, 199–208. [Google Scholar] [CrossRef]
  27. Batista, R.S.; Costa, H.; Parreira, L.A.; Bernardes, C.O.; Abreu, K.M.P.; Menini, L. Essential Oil of Piper macedoi Yunck. Leaves, Potential Alternative for the Management of Banana Anthracnose Disease. J. Nat. Pestic. Res. 2023, 5, 100039. [Google Scholar] [CrossRef]
  28. Wiley Analytical Scientific. Gravimetric Analysis: Determining the Density of a Sample for Various Applications; Graf-Utzmann, M., Murtagh, R., Eds.; WILEY-VCH GmbH, Boschstr: Weinheim, Germany; Available online: https://www.sartorius.com/en/products/weighing/lab-weighing-resources/gravimetric-analysis-determining-the-density-of-a-sample-for-various-applications-white-paper#id-1337374 (accessed on 2 January 2024).
  29. Li, H.; Li, F.; Wu, X.; Wu, W. Effect of Rice Bran Rancidity on the Emulsion Stability of Rice Bran Protein and Structural Characteristics of Interface Protein. Food Hydrocoll. 2021, 121, 107006. [Google Scholar] [CrossRef]
  30. Du, M.; Xie, J.; Gong, B.; Xu, X.; Tang, W.; Li, X.; Li, C.; Xie, M. Extraction, Physicochemical Characteristics and Functional Properties of Mung Bean Protein. Food Hydrocoll. 2018, 76, 131–140. [Google Scholar] [CrossRef]
  31. Rahmati, N.F.; Koocheki, A.; Varidi, M.; Kadkhodaee, R. Thermodynamic Compatibility and Interactions between Speckled Sugar Bean Protein and Xanthan Gum for Production of Multilayer O/W Emulsion. J. Food Sci. Technol. 2018, 55, 1143–1153. [Google Scholar] [CrossRef]
  32. Dumpler, J.; Kulozik, U. Heat Stability of Concentrated Skim Milk as a Function of Heating Time and Temperature on a Laboratory Scale—Improved Methodology and Kinetic Relationship. Int. Dairy J. 2015, 49, 111–117. [Google Scholar] [CrossRef]
  33. Derringer, G.; Suich, R. Simultaneous Optimization of Several Response Variables. J. Qual. Technol. 1980, 12, 214–219. [Google Scholar] [CrossRef]
  34. Estevão, S.T.; Batista de Almeida e Silva, J.; Lourenço, F.R. Development and Optimization of Beer Containing Malted and Non-Malted Substitutes Using Quality by Design (QbD) Approach. J. Food Eng. 2020, 289, 110182. [Google Scholar] [CrossRef]
  35. Cui, L.; Bandillo, N.; Wang, Y.; Ohm, J.B.; Chen, B.; Rao, J. Functionality and Structure of Yellow Pea Protein Isolate as Affected by Cultivars and Extraction PH. Food Hydrocoll. 2020, 108, 106008. [Google Scholar] [CrossRef]
  36. Wei, Y.; Cai, Z.; Wu, M.; Guo, Y.; Tao, R.; Li, R.; Wang, P.; Ma, A.; Zhang, H. Comparative Studies on the Stabilization of Pea Protein Dispersions by Using Various Polysaccharides. Food Hydrocoll. 2020, 98, 105233. [Google Scholar] [CrossRef]
  37. Lee, H.W.; Lu, Y.; Zhang, Y.; Fu, C.; Huang, D. Physicochemical and Functional Properties of Red Lentil Protein Isolates from Three Origins at Different PH. Food Chem. 2021, 358, 129749. [Google Scholar] [CrossRef] [PubMed]
  38. Tabilo-Munizaga, G.; Villalobos-Carvajal, R.; Herrera-Lavados, C.; Moreno-Osorio, L.; Jarpa-Parra, M.; Pérez-Won, M. Physicochemical Properties of High-Pressure Treated Lentil Protein-Based Nanoemulsions. LWT 2019, 101, 590–598. [Google Scholar] [CrossRef]
  39. Galvão, A.M.M.T.; Vélez-Erazo, E.M.; Karatay, G.G.B.; Furtado, G.d.F.; Vidotto, D.C.; Tavares, G.M.; Hubinger, M.D. High Internal Phase Emulsions Stabilized by the Lentil Protein Isolate (Lens culinaris). Colloids Surf. A Physicochem. Eng. Asp. 2022, 653, 129993. [Google Scholar] [CrossRef]
  40. Felix, M.; Lopez-Osorio, A.; Romero, A.; Guerrero, A. Faba Bean Protein Flour Obtained by Densification: A Sustainable Method to Develop Protein Concentrates with Food Applications. LWT 2018, 93, 563–569. [Google Scholar] [CrossRef]
  41. Choe, U.; Chang, L.; Ohm, J.B.; Chen, B.; Rao, J. Structure Modification, Functionality and Interfacial Properties of Kidney Bean (Phaseolus vulgaris L.) Protein Concentrate as Affected by Post-Extraction Treatments. Food Hydrocoll. 2022, 133, 108000. [Google Scholar] [CrossRef]
  42. Liu, C.; Damodaran, S.; Heinonen, M. Effects of Microbial Transglutaminase Treatment on Physiochemical Properties and Emulsifying Functionality of Faba Bean Protein Isolate. LWT 2019, 99, 396–403. [Google Scholar] [CrossRef]
  43. Gumus, C.E.; Decker, E.A.; McClements, D.J. Impact of Legume Protein Type and Location on Lipid Oxidation in Fish Oil-in-Water Emulsions: Lentil, Pea, and Faba Bean Proteins. Food Res. Int. 2017, 100, 175–185. [Google Scholar] [CrossRef]
  44. Presenza, L.; Fabrício, L.F.d.F.; Galvão, J.A.; Vieira, T.M.F.d.S. Simplex-Centroid Mixture Design as a Tool to Evaluate the Effect of Added Flours for Optimizing the Formulation of Native Brazilian Freshwater Fish Burger. LWT 2022, 156, 113008. [Google Scholar] [CrossRef]
  45. Primozic, M.; Duchek, A.; Nickerson, M.; Ghosh, S. Effect of Lentil Proteins Isolate Concentration on the Formation, Stability and Rheological Behavior of Oil-in-Water Nanoemulsions. Food Chem. 2017, 237, 65–74. [Google Scholar] [CrossRef] [PubMed]
  46. Karaca, A.C.; Low, N.; Nickerson, M. Emulsifying Properties of Chickpea, Faba Bean, Lentil and Pea Proteins Produced by Isoelectric Precipitation and Salt Extraction. Food Res. Int. 2011, 44, 2742–2750. [Google Scholar] [CrossRef]
  47. Cui, Z.; Kong, X.; Chen, Y.; Zhang, C.; Hua, Y. Effects of Rutin Incorporation on the Physical and Oxidative Stability of Soy Protein-Stabilized Emulsions. Food Hydrocoll. 2014, 41, 1–9. [Google Scholar] [CrossRef]
  48. Shao, Y.; Tang, C.H. Characteristics and Oxidative Stability of Soy Protein-Stabilized Oil-in-Water Emulsions: Influence of Ionic Strength and Heat Pretreatment. Food Hydrocoll. 2014, 37, 149–158. [Google Scholar] [CrossRef]
  49. Chang, C.; Tu, S.; Ghosh, S.; Nickerson, M.T. Effect of PH on the Inter-Relationships between the Physicochemical, Interfacial and Emulsifying Properties for Pea, Soy, Lentil and Canola Protein Isolates. Food Res. Int. 2015, 77, 360–367. [Google Scholar] [CrossRef]
  50. McCarthy, N.A.; Kennedy, D.; Hogan, S.A.; Kelly, P.M.; Thapa, K.; Murphy, K.M.; Fenelon, M.A. Emulsification Properties of Pea Protein Isolate Using Homogenization, Microfluidization and Ultrasonication. Food Res. Int. 2016, 89, 415–421. [Google Scholar] [CrossRef]
  51. Yang, J.; Liu, G.; Zeng, H.; Chen, L. Effects of High Pressure Homogenization on Faba Bean Protein Aggregation in Relation to Solubility and Interfacial Properties. Food Hydrocoll. 2018, 83, 275–286. [Google Scholar] [CrossRef]
  52. Shevkani, K.; Singh, N.; Kaur, A.; Rana, J.C. Structural and Functional Characterization of Kidney Bean and Field Pea Protein Isolates: A Comparative Study. Food Hydrocoll. 2015, 43, 679–689. [Google Scholar] [CrossRef]
  53. Wang, F.; Zhang, Y.; Xu, L.; Ma, H. An Efficient Ultrasound-Assisted Extraction Method of Pea Protein and Its Effect on Protein Functional Properties and Biological Activities. LWT 2020, 127, 109348. [Google Scholar] [CrossRef]
  54. Jarpa-Parra, M.; Bamdad, F.; Wang, Y.; Tian, Z.; Temelli, F.; Han, J.; Chen, L. Optimization of Lentil Protein Extraction and the Influence of Process PH on Protein Structure and Functionality. LWT 2014, 57, 461–469. [Google Scholar] [CrossRef]
  55. Deng, Y.; Huang, L.; Zhang, C.; Xie, P.; Cheng, J.; Wang, X.; Li, S. Physicochemical and Functional Properties of Chinese Quince Seed Protein Isolate. Food Chem. 2019, 283, 539–548. [Google Scholar] [CrossRef] [PubMed]
  56. Delahaije, R.J.B.M.; Wierenga, P.A.; Van Nieuwenhuijzen, N.H.; Giuseppin, M.L.F.; Gruppen, H. Protein Concentration and Protein-Exposed Hydrophobicity as Dominant Parameters Determining the Flocculation of Protein-Stabilized Oil-in-Water Emulsions. Langmuir 2013, 29, 11567–11574. [Google Scholar] [CrossRef]
  57. Tcholakova, S.; Denkov, N.D.; Ivanov, I.B.; Campbell, B. Coalescence Stability of Emulsions Containing Globular Milk Proteins. Adv. Colloid Interface Sci. 2006, 123–126, 259–293. [Google Scholar] [CrossRef]
  58. Delahaije, R.J.B.M.; Gruppen, H.; Giuseppin, M.L.F.; Wierenga, P.A. Towards Predicting the Stability of Protein-Stabilized Emulsions. Adv. Colloid Interface Sci. 2015, 219, 1–9. [Google Scholar] [CrossRef] [PubMed]
  59. Bouyer, E.; Mekhloufi, G.; Huang, N.; Rosilio, V.; Agnely, F. β-Lactoglobulin, Gum Arabic, and Xanthan Gum for Emulsifying Sweet Almond Oil: Formulation and Stabilization Mechanisms of Pharmaceutical Emulsions. Colloids Surf. A Physicochem. Eng. Asp. 2013, 433, 77–87. [Google Scholar] [CrossRef]
  60. Damodaran, S.; Anand, K. Sulfhydryl-Disulfide Interchange-Induced Interparticle Protein Polymerization in Whey Protein-Stabilized Emulsions and Its Relation to Emulsion Stability. 1997. Available online: https://pubs.acs.org/sharingguidelines (accessed on 2 January 2024).
  61. Hu, Y.Q.; Yin, S.W.; Zhu, J.H.; Qi, J.R.; Guo, J.; Wu, L.Y.; Tang, C.H.; Yang, X.Q. Fabrication and Characterization of Novel Pickering Emulsions and Pickering High Internal Emulsions Stabilized by Gliadin Colloidal Particles. Food Hydrocoll. 2016, 61, 300–310. [Google Scholar] [CrossRef]
  62. Petursson, S.; Decker, E.A.; McClements, D.J. Stabilization of Oil-in-Water Emulsions by Cod Protein Extracts. J. Agric. Food Chem. 2004, 52, 3996–4001. [Google Scholar] [CrossRef]
  63. McClements, D.J. Protein-Stabilized Emulsions. Curr. Opin. Colloid Interface Sci. 2004, 9, 305–313. [Google Scholar] [CrossRef]
  64. Joshi, M.; Adhikari, B.; Aldred, P.; Panozzo, J.F.; Kasapis, S. Physicochemical and Functional Properties of Lentil Protein Isolates Prepared by Different Drying Methods. Food Chem. 2011, 129, 1513–1522. [Google Scholar] [CrossRef]
  65. Jeske, S.; Bez, J.; Arendt, E.K.; Zannini, E. Formation, Stability, and Sensory Characteristics of a Lentil-Based Milk Substitute as Affected by Homogenisation and Pasteurisation. Eur. Food Res. Technol. 2019, 245, 1519–1531. [Google Scholar] [CrossRef]
  66. Burger, T.G.; Singh, I.; Mayfield, C.; Baumert, J.L.; Zhang, Y. The Impact of Spray Drying Conditions on the Physicochemical and Emulsification Properties of Pea Protein Isolate. LWT 2022, 153, 112495. [Google Scholar] [CrossRef]
  67. Alonso-Miravalles, L.; Zannini, E.; Bez, J.; Arendt, E.K.; O’Mahony, J.A. Thermal and Mineral Sensitivity of Oil-in-Water Emulsions Stabilised Using Lentil Proteins. Foods 2020, 9, 453. [Google Scholar] [CrossRef] [PubMed]
Figure 1. Emulsion activity (EAI, m2/g) and stability indices (ESI, min) for 10 treatments of protein mixtures from peas, lentils, and fava beans. Data represent the mean ± one standard deviation (n = 3). Means with similar superscripts in a column did not differ significantly (p > 0.5).
Applsci 14 08086 g001
Figure 2. D4.3 value of emulsions with protein mixtures at time zero and after 24 h. Day zero averages that are followed by identical lowercase letters do not differ statistically from one another. Day one averages that are followed by identical uppercase letters also do not differ statistically.
Applsci 14 08086 g002
Figure 3. Contour plots showing the effects of pea protein, lentil protein, and fava bean protein proportion on (A) Flocculation stability (%); (B) EAI (m2/g); (C) Centrifugal stability constant—KE (%); (D) Coalescence stability—C (%); (E) Zeta potential (mV); (F) HCT (min).
Applsci 14 08086 g003
Table 1. Sample codes and experimental design.
Emulsion CodeComponent Proportion
Pea (%)Lentil (%)Fava Bean (%)
T110000
T201000
T300100
T450500
T550050
T605050
T7502525
T8255025
T9252550
T1033.3333.3333.33
Table 2. Flocculation and coalescence stability, average flocculation index (FI), centrifugal stability, HCT (heat coagulation time) stability constant (KE), and zeta potential of emulsions of emulsion prepared with different mixtures of pea, lentil, and fava bean protein.
TreatmentCoalescence Stability (%)Flocculation
Stability (%)
Flocculation Index (%)HCT
(Minutes)
KE (%)Zeta Potential
(mV)
T122.18 ± 0.03 c4.13 ± 0.014 j5.7 2 ± 0.01 e18.34 ± 3.99 ab24.46 ± 0.03 d−30.28 ± 2.62 b
T26.92 ± 0.016 e4.77 ± 0.014 h3.93 ± 0.09 f13.53 ± 2.11 c65.58 ± 3.84 b−23.77 ± 2.33 a
T349.41 ± 0.23 b27.18 ± 0.13 a25.80 ± 0.12 a20.3 ± 1.80 ab3.45 ± 2.05 h−26.25 ± 2.33 a
T478.39 ± 0.38 a26.69 ± 0.13 b26.02 ± 0.12 a19.7 ± 0.83 ab40.53 ± 0.05 c−26.75 ± 2.34 a
T55. 25 ± 0.02 f15.15 ± 0.06 d13.13 ± 0.05 b18.4 ± 4.14 ab10.91 ± 2.65 f−26.15 ± 2.19 ab
T611.58 ± 0.04 d4.49 ± 0.07 h12.79 ± 0.04 c18.96 ± 0.56 ab16.11 ± 0.11 e−28.05 ± 1.20 b
T74.93 ± 0.07 f1.31 ± 0.07 k3.21 ± 0.07 g25.78 ± 0.67 a16.39 ± 0.09 e−28.10 ± 2.12 b
T811.67 ± 0.02 d18.56 ± 0.03 c0.53 ± 0.07 i16.85 ± 0.50 b74.01 ± 0.07 a−29.90 ± 2.69 b
T97.07 ± 0.01 e4.24 ± 0.01 j5.76 ± 0.06 e25.00 ± 0.79 a17.41 ± 0.49 e−32.15 ± 1.27 c
T105.19 ± 0.01 f6.82 ± 0.02 g3.38 ± 0.04 g21.63 ± 0.60 ab6.87 ± 0.02 g−30.40 ± 1.27 b
Different letters in the same column indicate significant differences at p < 0.05.
Table 3. Model fit for each response variable and the statistical data obtained when applying ANOVA of the selected models.
Response VariableModelF-TestR2p-Value
Zeta potential (mV)Linear5.0476.810.022
Coalescence (%) Linear1008.8799.88<0.001
Flocculation Index (%)Quadratic 139.3498.00<0.001
Centrifugal stability (%)Special cubic140.8199.96<0.001
HCT (min)Quadratic8.6274.360.010
EAI (m2/g)Quadratic7.7573.760.002
Centrifugal stability constant—KE (%)Special Quadratic79.6399.58<0.001
Table 4. Experimental optimization of the response variable.
Evaluated ParametersPea (%)Lentil (%)Fava Bean (%)Experimental ValueAdjusted
R2
Zeta potential (mV)33.3333.3333.33−30.430.99
Coalescence 34.8727.7637.372.990.98
Flocculation Index36.7321.8541.411.00.99
Centrifugal stability (%)41.4130.6027.990.50.98
HCT (min)56.7343.26027.000.99
EAI (m2/g)19.1980.81032.850.95
Table 5. Pearson correlation analysis between the tested variables that were significant.
Sample 1Sample 2Correlationp-Value
EAI (m2/g)Centrifugal stability (%)0.7590.024
EAI (m2/g)IPD0.6950.002
HCT (min)Centrifugal stability (%)0.7250.008
Coalescence stability (%)Flocculation stabilit (%)0.7650.000
Coalescence stability (%)Flocculation index (%)0.8450.000
Flocculation stability (%)Flocculation index (%)0.7250.000
Flocculation stability (%)D4,3 (nm)0.7580.008
Zeta Potential (mV)ESI (min)0.6570.005
Table 6. Predicted and experimental values for optimization parameters of the protein mixture.
Dependent Variable ResponseGoalLower LimitUpper LimitPredicted ValueExperimental Value Relative Error (%)
EAI (m2/g)Maximize16.0032.0016.0923.75 ± 1.1841.0
Zeta potential (mV)Minimize−28.00−31.00−30.9−29.16 ± 1.460.90
Coalescence stability (%)Minimize4.07.03.562.53 ± 0.690.91
D4.3 (nm)Minimize400.00420.00421.28436.16 ± 16.063.56
HCT (min)Maximize18.0026.0024.6922.40 ± 2.546.73
Disclaimer/Publisher’s Note: The statements, opinions and data contained in all publications are solely those of the individual author(s) and contributor(s) and not of MDPI and/or the editor(s). MDPI and/or the editor(s) disclaim responsibility for any injury to people or property resulting from any ideas, methods, instructions or products referred to in the content.

