Abstract
Adhesive bonds, including car putty coatings, are used in the construction of modern motor vehicles. Therefore, it is important to improve methods that allow nondestructive evaluation of the properties of these joints. The main objective of this study was to evaluate selected properties of putty coatings such as the width of the applied coating and adhesion to the substrate based on changes in ultrasonic wave parameters. The research was carried out in two stages. In the first, the values of the surface wave amplitude were determined as a function of the width of the coating to the substrate. It was found that as the width of the coating increases, the amplitude of the surface wave pulse decreases. The second stage involved correlation studies to relate the reflection coefficient |r| to the adhesion of the coating to the substrate. Based on the results, it was found that as the value of the reflection coefficient decreases, the value of the coating’s adhesion to the substrate increases. The determined values of this parameter range from 0.30 to 0.86, which correspond to the adhesion of the range 1.51 to 18.97 MPa. The obtained test results have practical significance and can be used in evaluating the condition of coatings in vehicle body repair shops.
1. Introduction
The stage of manufacturing motor vehicles, particularly their bodies, is crucial for ensuring the durability, corrosion resistance, and aesthetic appeal of the vehicle structure, which is increasingly valued by vehicle users [1,2,3,4]. One effective way to protect the vehicle body from corrosion and achieve the desired decorative properties is by applying adhesive coatings. In the automotive industry, adhesive bonds are used not only to join the coating to steel or aluminum car body but also to form essential bonded connections within the vehicle body structure. To prevent corrosion of a damaged car body, materials such as car putty and primer varnish are applied. Car putties are commonly used in car body repair processes. During application of the putty to a car body, it is important to control technological parameters like humidity, temperature, and the proportion of individual components, as this is critical for the durability of the bond between the coating and the steel substrate [5]. In addition, as workshop practice shows, putty coating can be applied to a large area at a relatively low thickness. In the subsequent stages of body repair, the car putty coating is sanded to remove irregularities and smooth the surface of the body sheet.
The durability of adhesive bonds can be evaluated using destructive [6] or nondestructive methods [7]. Potential inspection methods for adhesive joints include visual [8], radiographic [9], and thermographic [10] as well as ultrasonic techniques [11,12]. Both car body manufacturers and repair shops require easily interpretable processes for assessing the quality and durability of these joints. The ultrasonic method, which uses a transducer to generate surface waves, meets these requirements.
Ultrasonic testing of adhesive joints has been implemented to verify defects such as kissing bond [13,14], the lack of adhesive where it should be applied [15], or to evaluate the adhesion of the coating to the substrate during the service life and observe changes based on ultrasonic surface wave parameters [16]. In addition, time-amplitude analysis of ultrasonic signals allows for assessing the thickness of layers and the uniformity of adhesion over the entire surface of the coating application, which is crucial for ensuring the durability and reliability of joints in not only the automotive industry but also other industries [17]. Other studies in the amplitude-frequency scope [18,19] leads to the conclusion that the ultrasonic wave can be a diagnostic parameter indicating the state of the adhesive joint. The use of ultrasound in the testing of adhesive joints not only improves the safety of structures but also allows for the optimization of manufacturing processes through early detection of defects and minimization of the risk of their occurrence, especially within the car body repair process.
Ultrasonic testing of adhesive coatings used in machinery and vehicles is a crucial method for assessing the technical condition and durability of these coatings [20]. This technique utilizes ultrasonic waves for nondestructive testing of materials, allowing for the detection of defects such as cracks, delaminations [21], or blisters [22] that may arise from usage. Due to its high precision and accuracy, ultrasonic testing enables the monitoring of adhesive coating quality without the need for the disassembly of components, significantly reducing downtime for machines and vehicles [23]. The application of this technology is particularly important in the automotive and aerospace industries, where reliability and safety are paramount. Moreover, regular ultrasonic inspections can prevent costly failures and extend the lifespan of machines, translating to greater operational efficiency and financial savings for enterprises.
The main objective of this study was to evaluate selected properties of putty coatings such as the width of the applied coating and adhesion to the substrate based on changes in ultrasonic wave parameters. The research was divided into two main stages. In the first stage, a surface wave was used to assess the width of the car putty coating applied to the body sheet. The second stage included correlation tests that allowed for determining the relationship between the reflection coefficient of the longitudinal wave and the mechanical adhesion of the coating to the substrate, determined on the basis of the destructive test. The main novelty contained in this article is the use of various types of ultrasonic waves in the assessment of selected properties of the adhesive coating. The research results described so far in the literature did not allow for estimating the width of the putty coating applied to the body sheet based on the amplitude of the surface wave pulse. There are also very few studies using the reflection coefficient, especially in terms of its correlation with the adhesion of the coating to the substrate (mechanical strength of the joint).
2. Materials and Methods
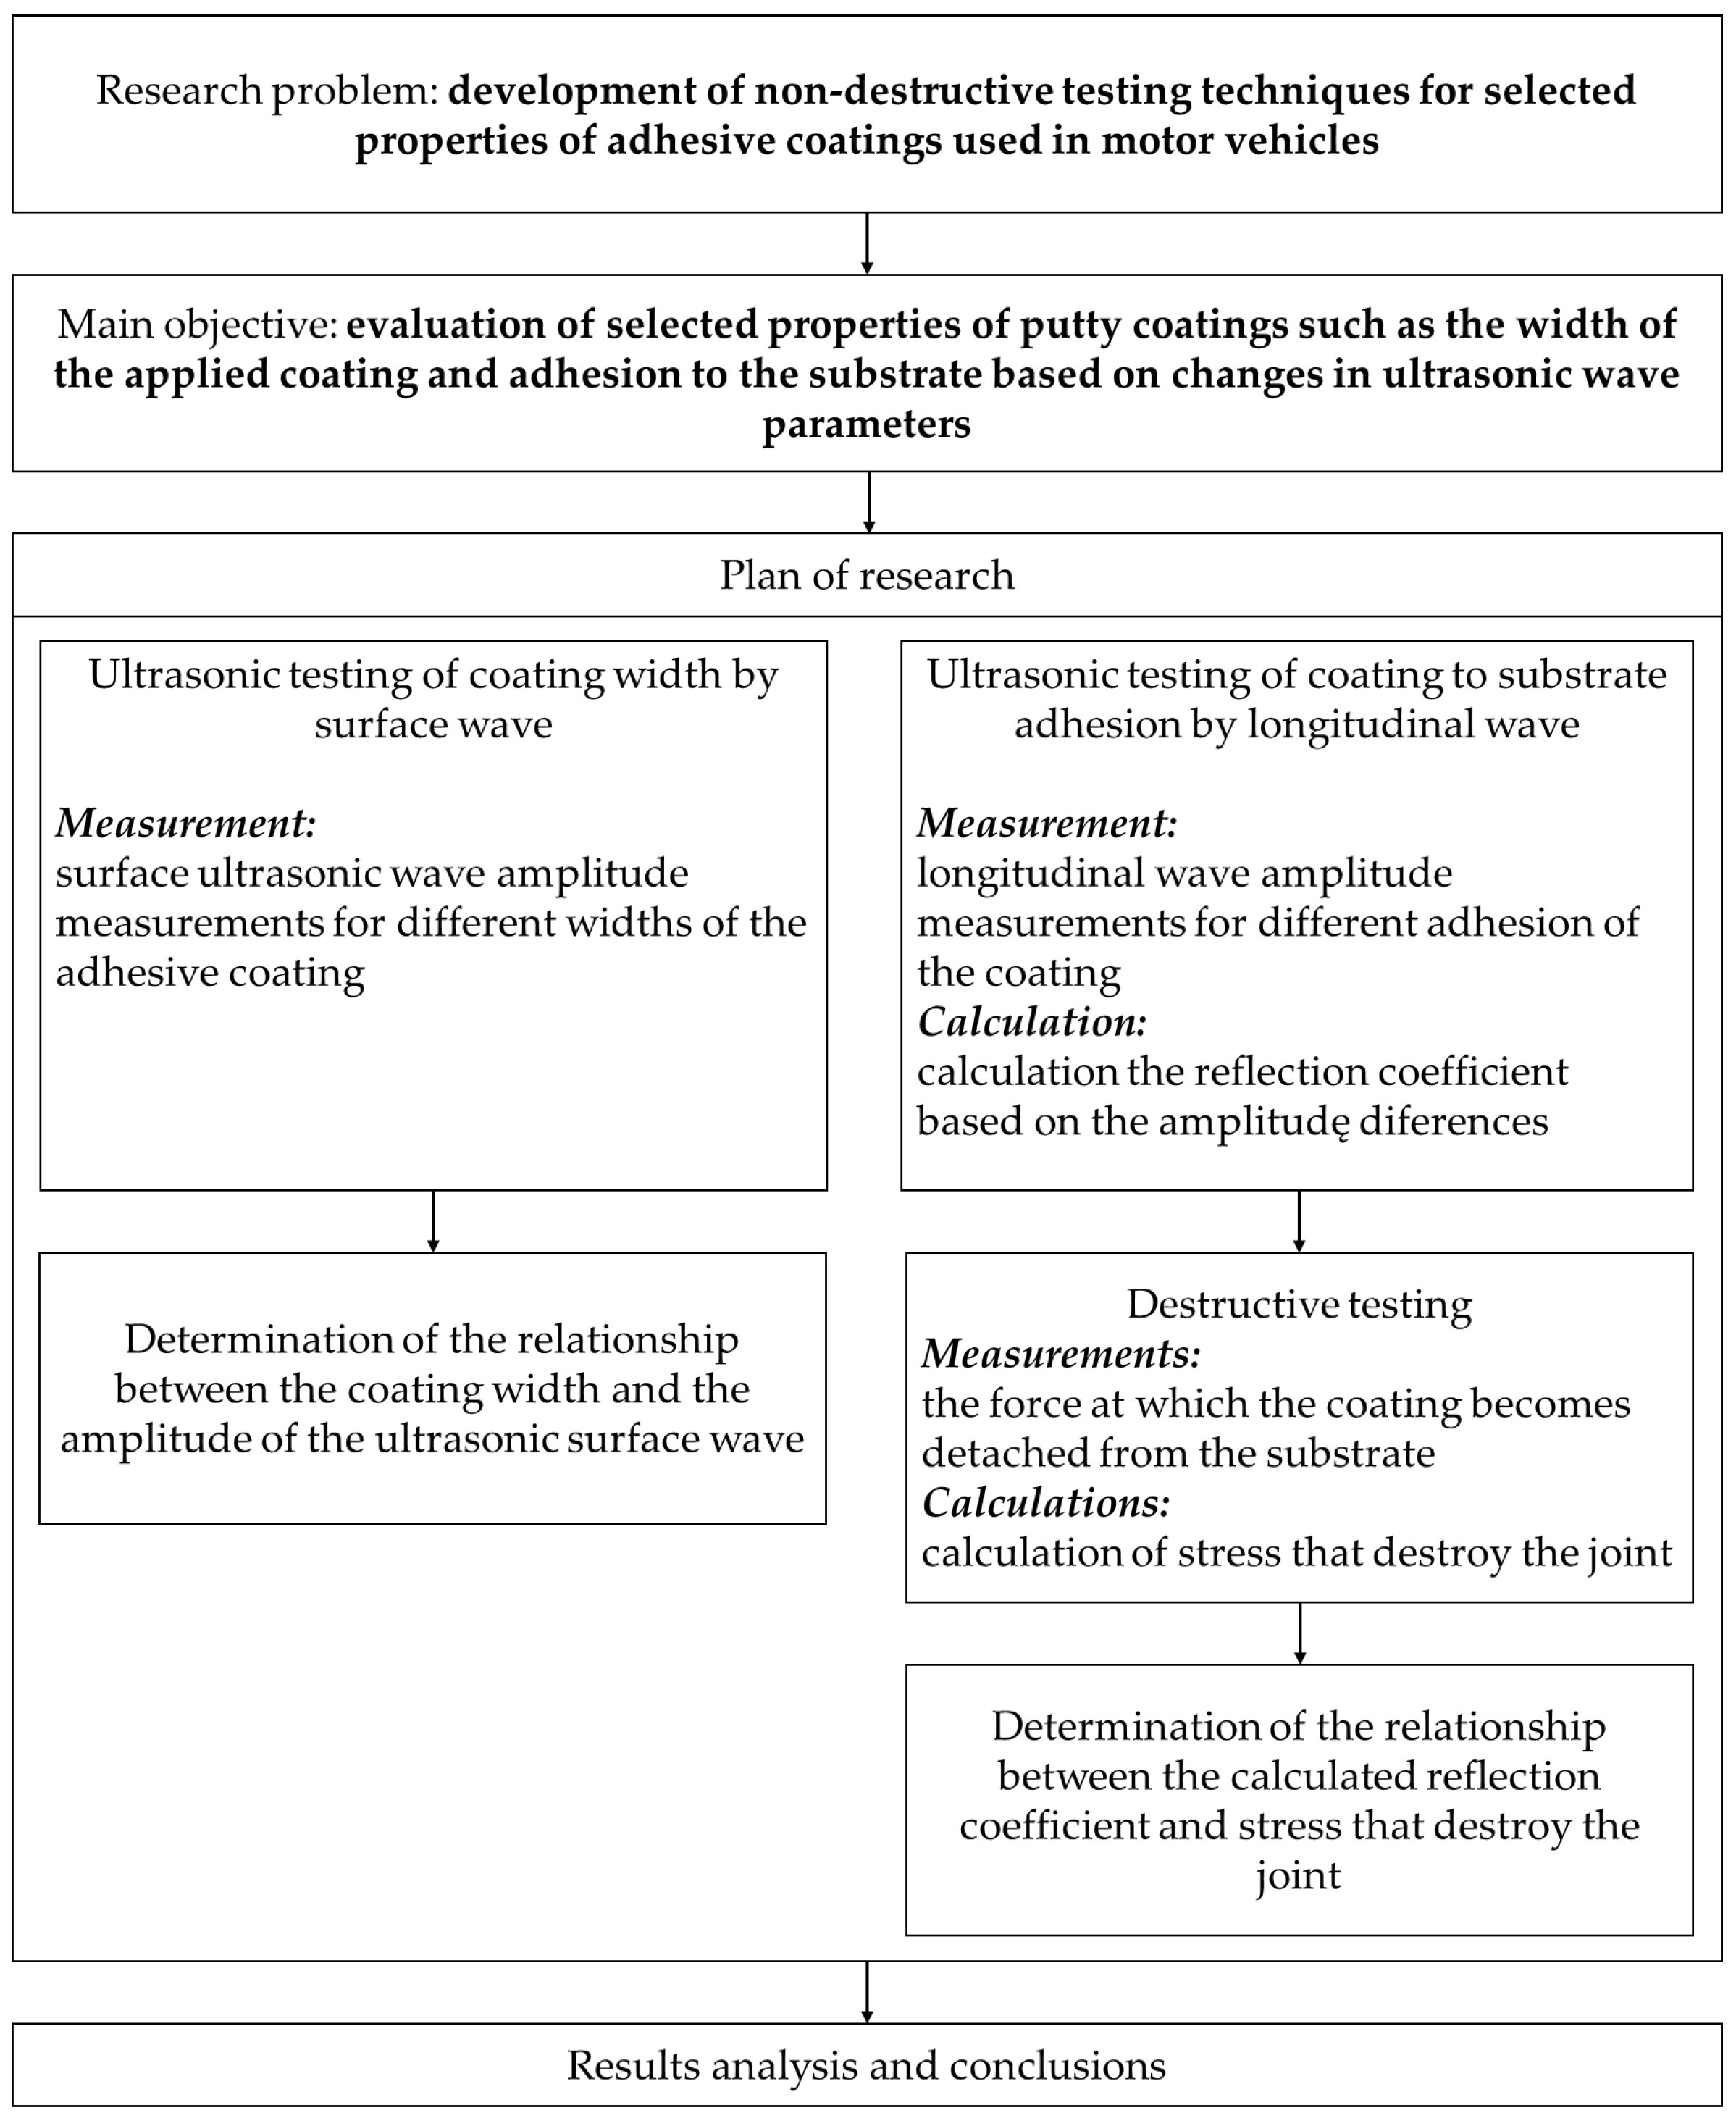
The research presented in this article is divided into several stages, and the detailed tasks are shown in Figure 1.

Figure 1.
The consecutive stages of the conducted research.
2.1. Ultrasonic Coating Width Testing Methodology
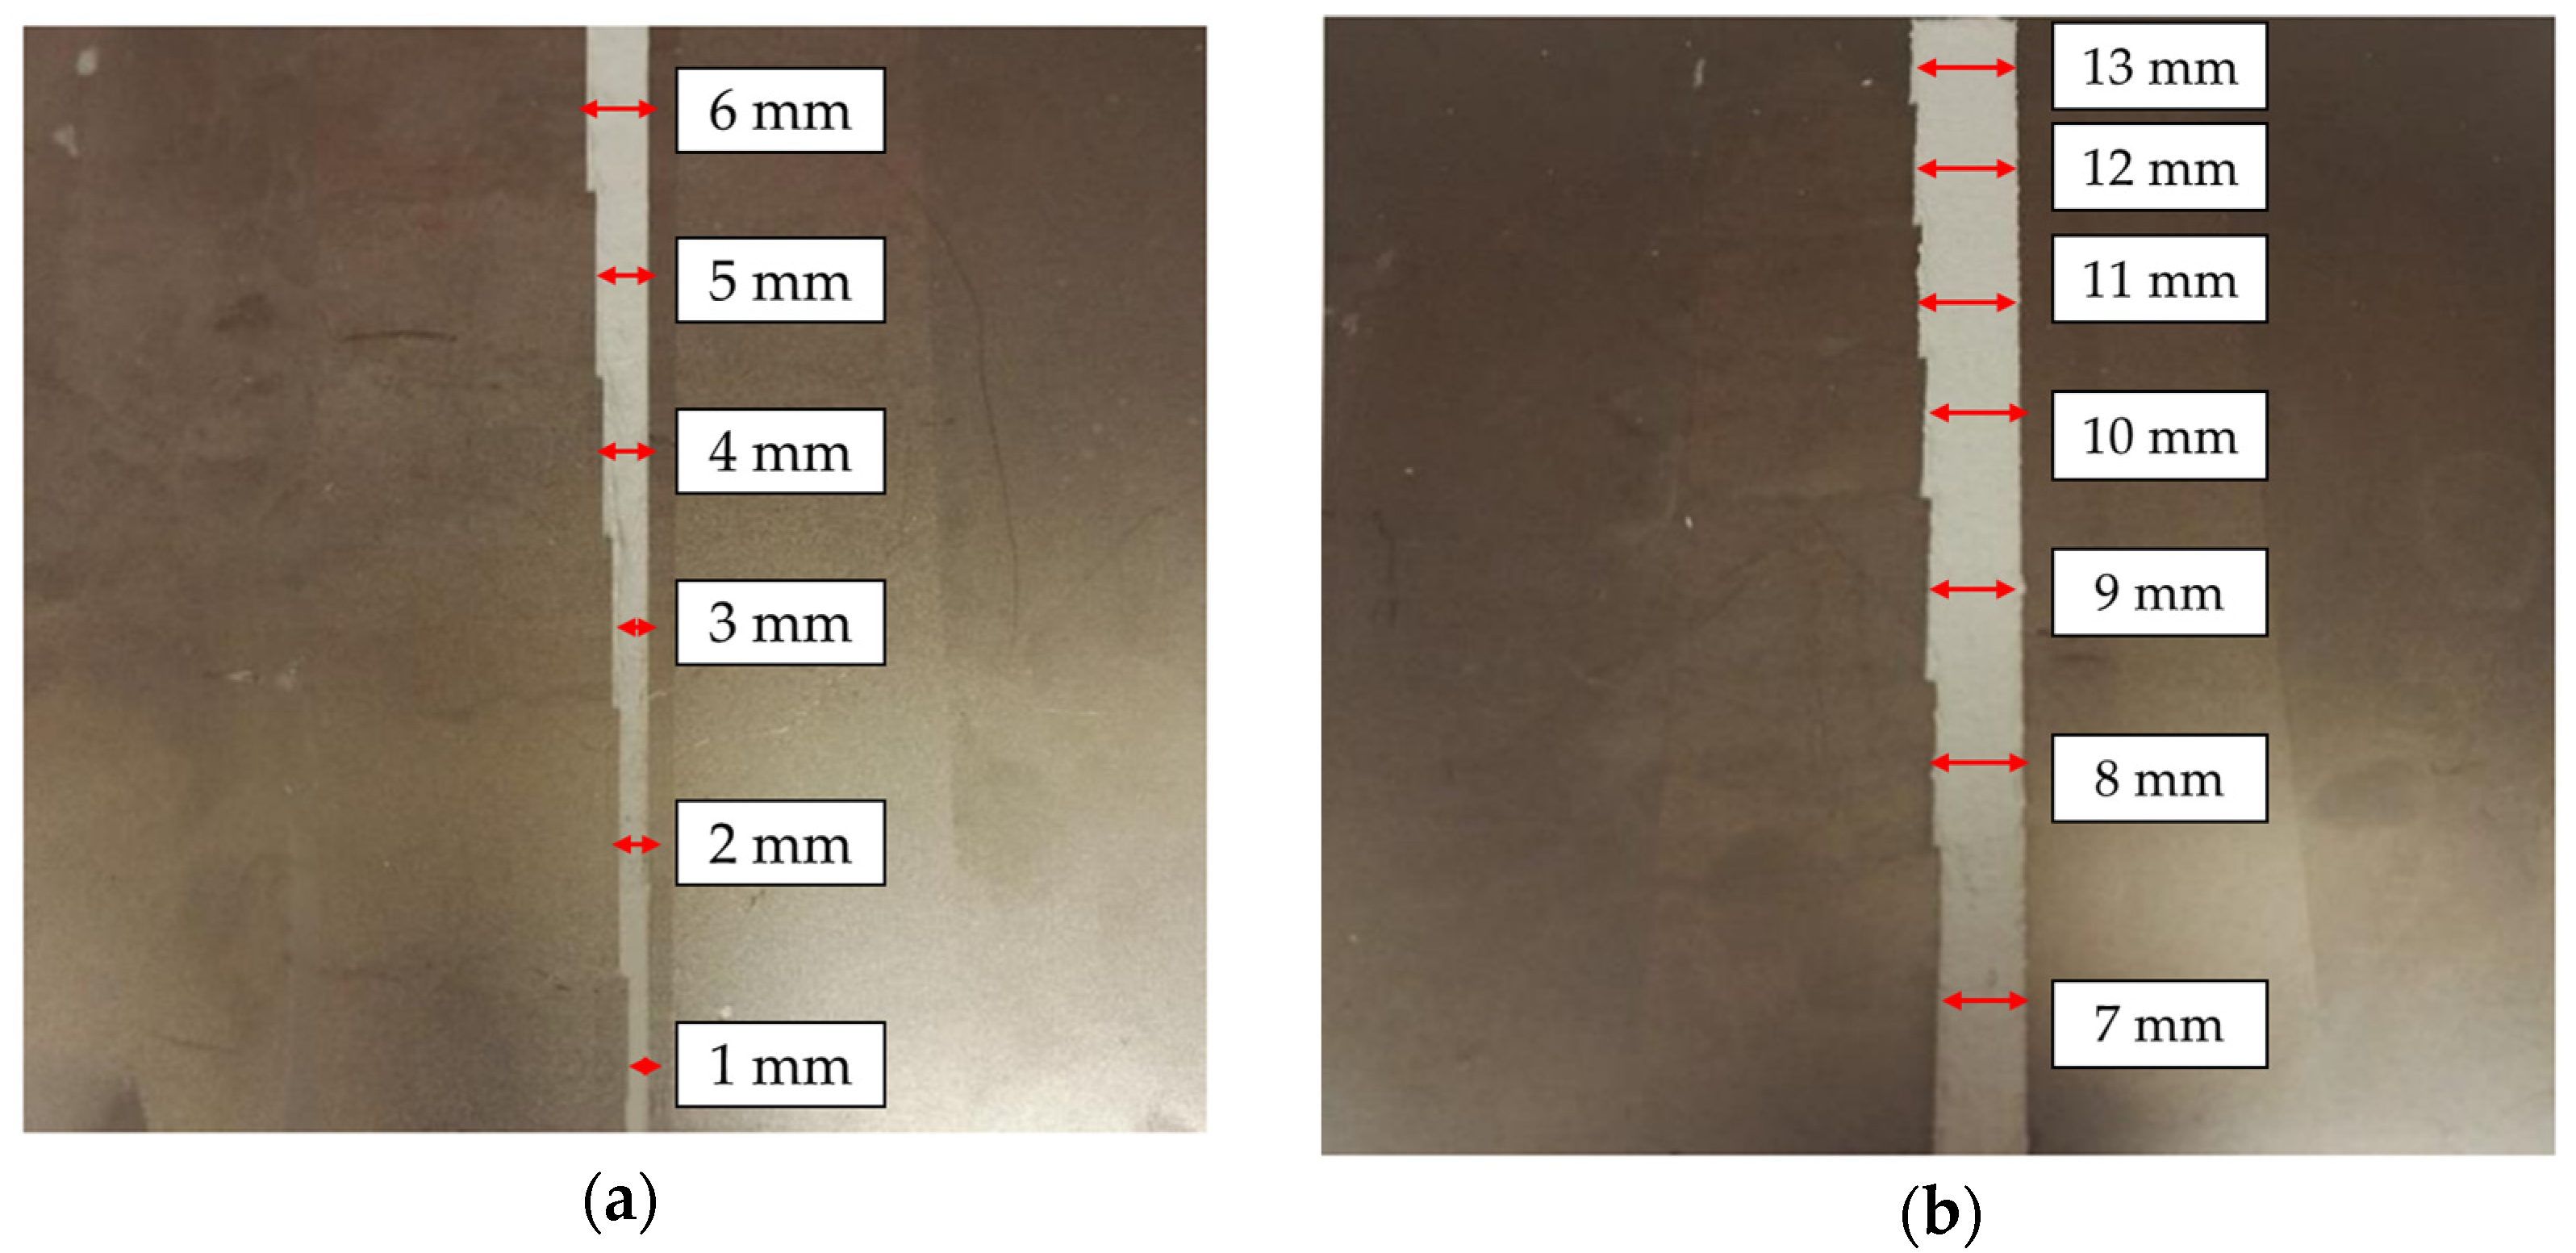
The goal of this part of the research is to evaluate the suitability of using the ultrasonic Rayleigh wave to test the width of a putty coating applied to a body sheet. The coating was applied in varying widths to the body steel sheet. Car putty coating is still the most commonly used material in the construction of motor vehicle bodies, mainly in car body repair process. Universal putty coating was applied to 0.8 mm thick body sheet. Before the application process of the coating, the surface of the specimens was treated with sandpaper and then cleaned. The roughness of the surface not only affects the adhesion of the coating to the substrate but also affects the dispersion of the ultrasonic wave [24]. Therefore, it is important that the values of its basic parameters (Ra, Rz) are similar over the entire surface of the sample. The next step was the preparation and application of putty on the steel sheet. The finished putty was applied to two steel sheets: on the first one in a width of 1 to 6 mm and on the second one from 7 to 13 mm, with a coating thickness of 0.7 mm (Figure 2). The applied coating was left for a period of about 30 min until it was completely set with the substrate.

Figure 2.
View of samples with putty coating; (a) coating width from 1 to 6 mm, (b) coating width from 7 to 13 mm.
Ultrasonic testing was carried out using a USM 35XS flaw detector from Krautkramer (GE, Boston, MA, USA) and two MWB 90-4 surface wave transducers with a frequency of 4 MHz from the same manufacturer. The tests were performed using the pass-through technique, where one head transmitted an ultrasonic wave pulse (transmitting head) and the other received this pulse (receiving head). Conducting the tests required maintaining invariable, experimentally determined settings of the flaw detector as follows:
- -
- Pulse gain: 58 dB;
- -
- Ultrasonic wave speed: 4000 m/s;
- -
- Run-up: 0 µs;
- -
- Distance between heads: 110 mm;
- -
- Constant coupling between the head and the surface of the substrate.
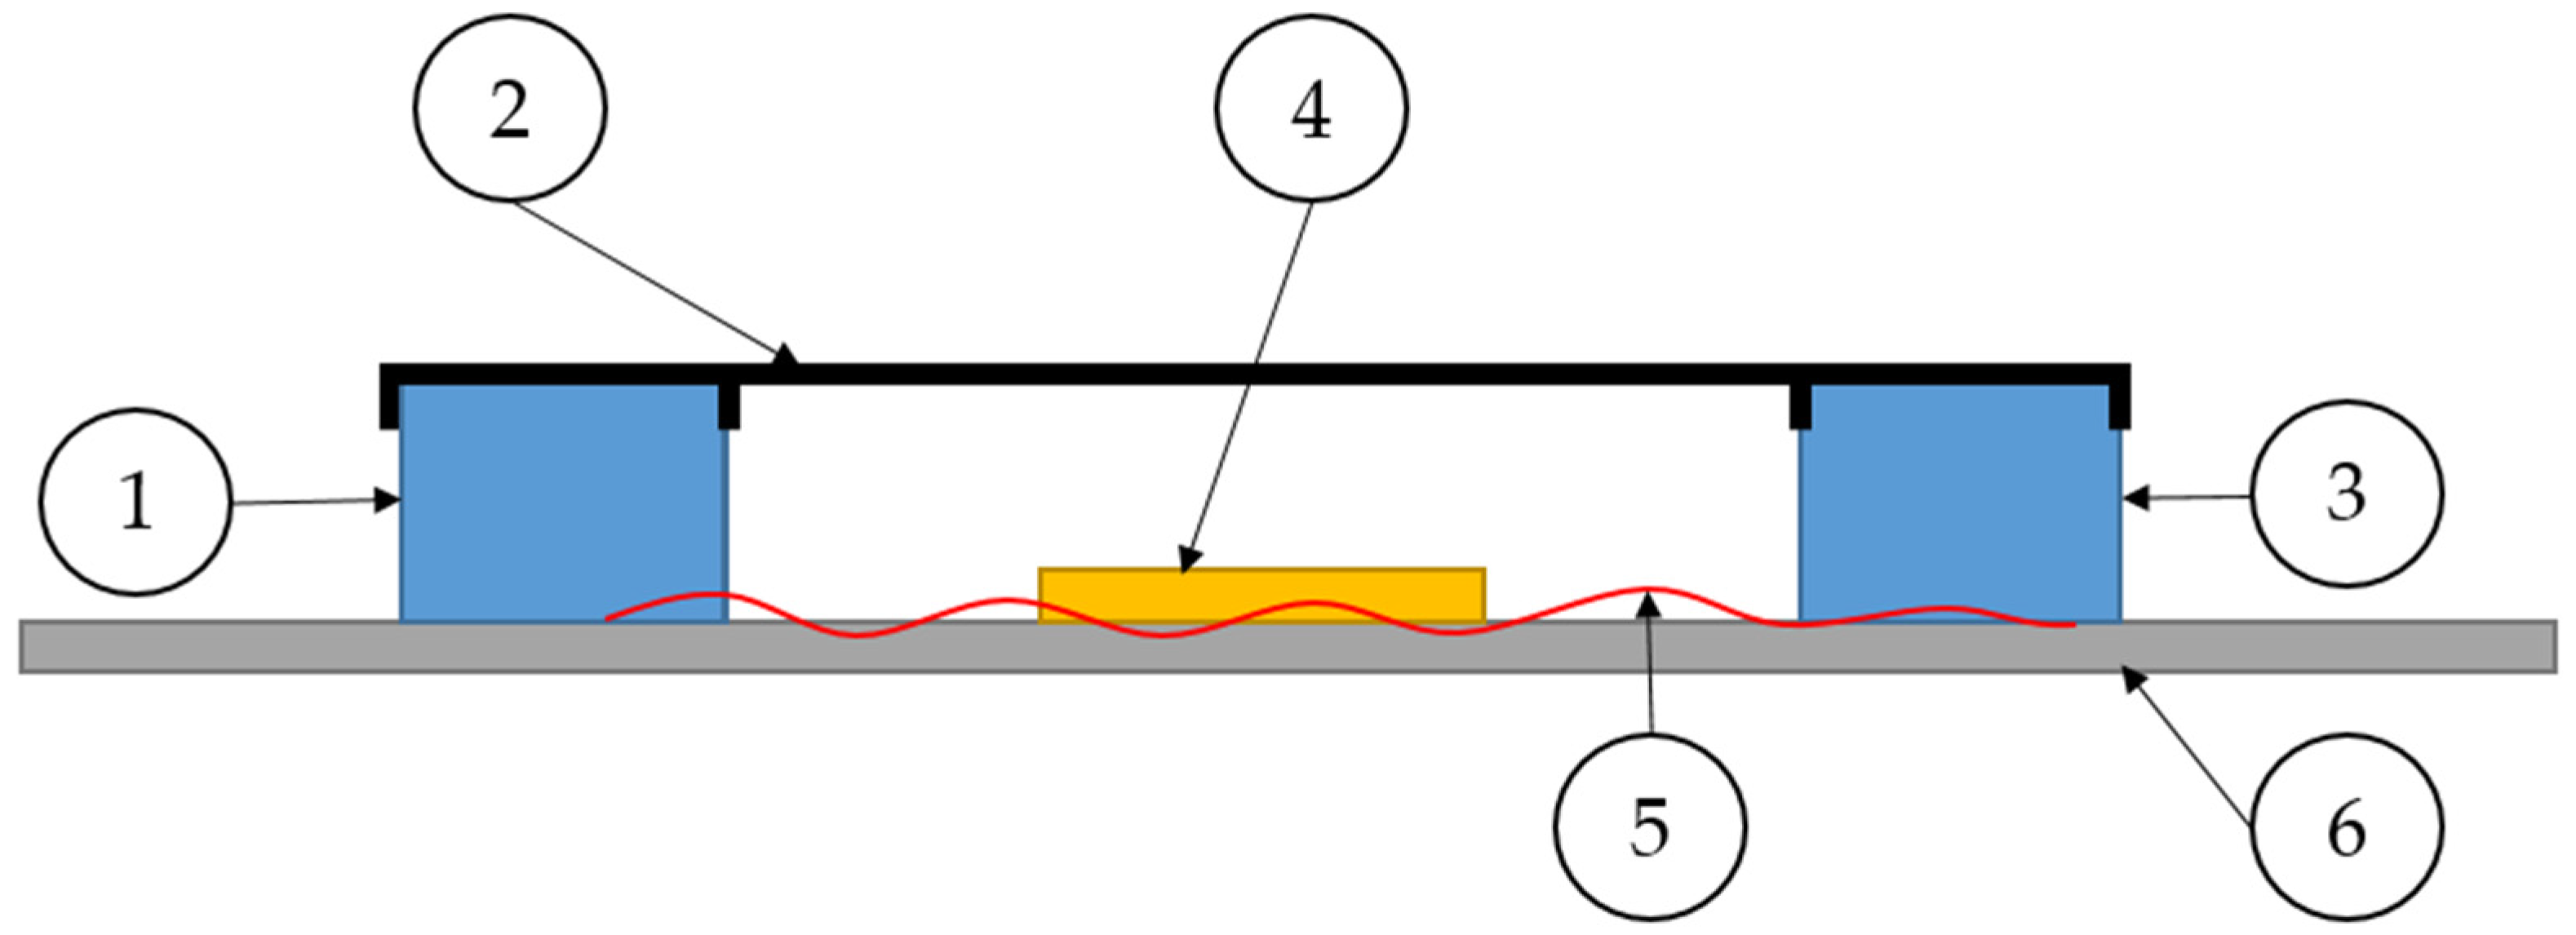
The observed ultrasonic parameter during the tests was the pulse amplitude of the ultrasonic Rayleigh wave. An important parameter during the implementation of the study was the use of a fixed distance of ultrasonic head placement and their parallel positioning so that the transmitted pulse was received by the other head. Therefore, a holder was designed and fabricated to ensure constant placement of the heads regardless of the width of the coating on the sample. A schematic diagram of the implementation of ultrasonic coating width measurements by the ultrasonic surface wave is shown in Figure 3.
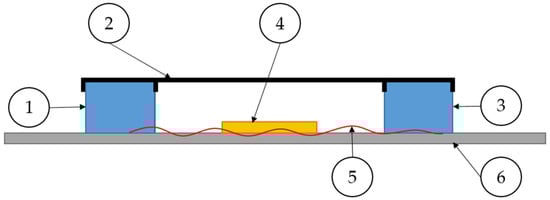
Figure 3.
Ultrasonic measurement by Rayleigh wave; 1—transmitting transducer, 2—holder, 3—receiving transducer, 4—car putty coating, 5—surface wave, 6—car body sheet.
2.2. Correlational Research Methodology
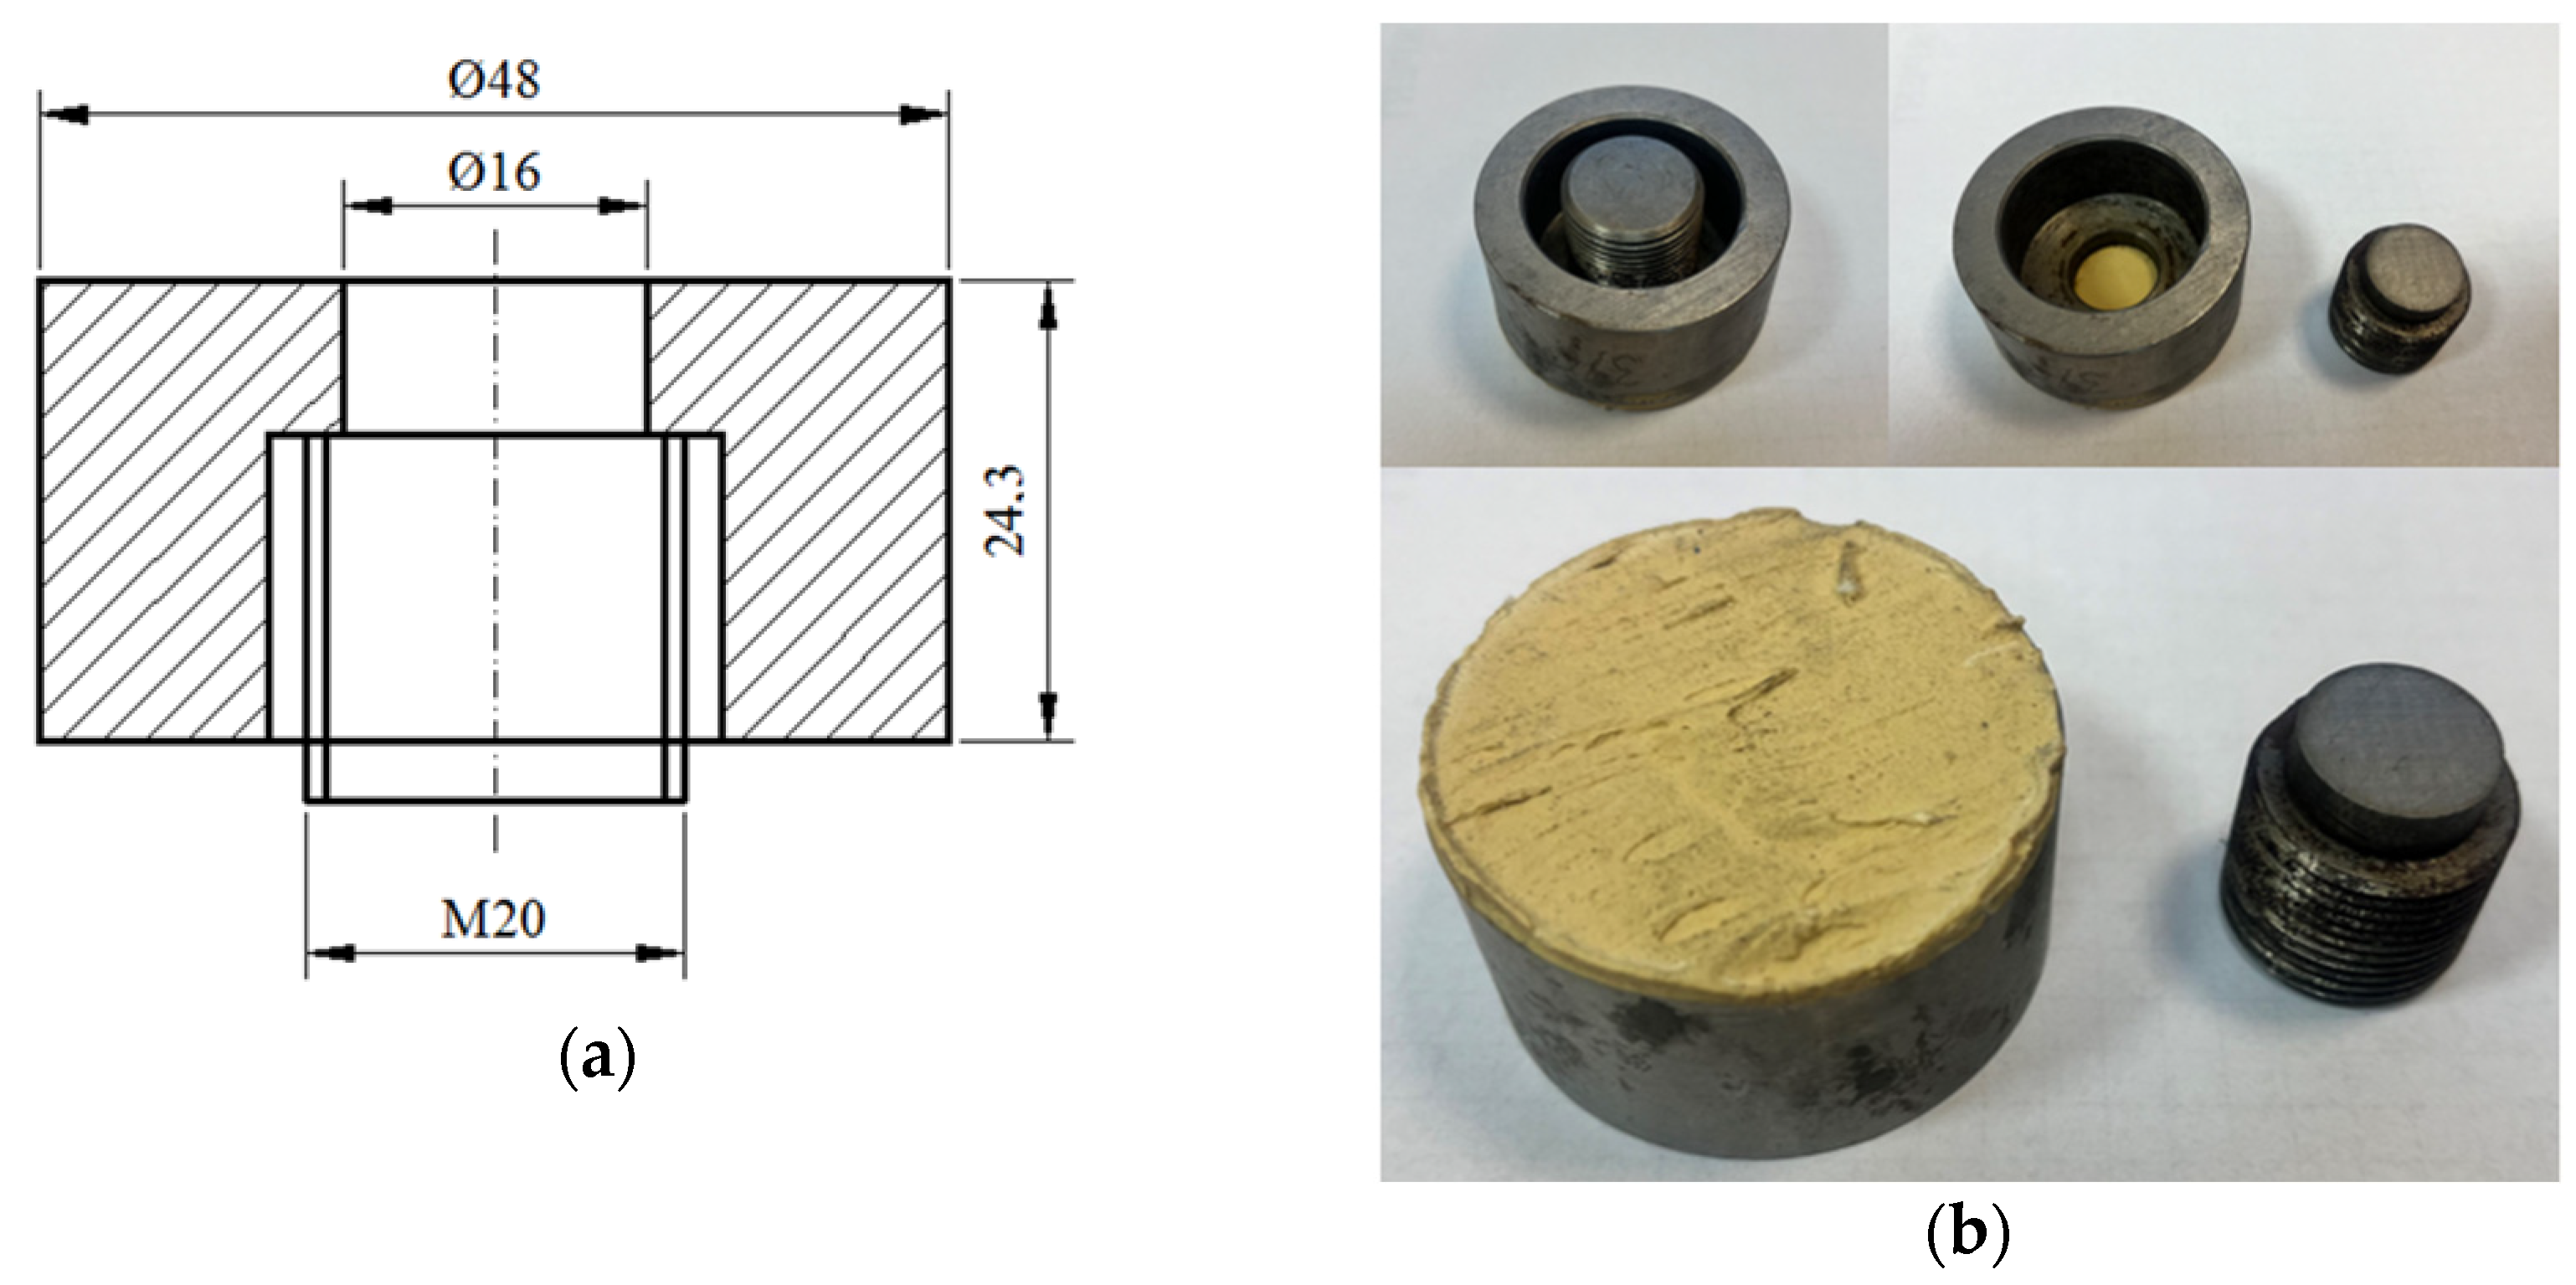
The main goal of the correlation study was to determine the reflection coefficient |r| values and mechanical strength considering the curing temperature of the putty coating used in automotive body repairs. To achieve this goal, the surface of all specimens was prepared equally. The samples used in the study were cylindrical in shape and 48 mm in diameter with a pin in the center of the sample (Figure 4). Evaluation of the quality of the joint between the putty coating and the steel substrate was carried out by two different methods: ultrasonic, which is nondestructive, and destructive, which is the strength test. Since the implemented tests were to determine the relationship between the reflection coefficient of the longitudinal wave and the mechanical adhesion of the coating to the substrate, it was necessary to maintain an appropriate regime during the performance of various activities such as:

Figure 4.
View of the sample used during correlation studies; (a) diagram, (b) sample with pin.
- -
- Preparation of the surface to which the car putty was applied (the same for all samples);
- -
- Preparation of the regeneration material—car putty (maintaining appropriate, i.e., identical proportions when mixing the components of the regeneration material for all samples);
- -
- Curing the coating in an oven (maintaining the appropriate time and temperature);
- -
- Performing the ultrasonic testing according to the specified procedure using the same test equipment and the same ultrasonic flaw detector settings for each sample;
- -
- Conducting strength tests with constant settings of the apparatus.
The coating was applied not only to the part of the specimen that was peeled off but to the entire surface of the specimen (all specimens were identical in diameter). The thickness of the coating was 2 mm. When ultrasonic measurements were carried out, the change in the gain of the ultrasonic longitudinal wave pulse (amplitude of pulse verification) was determined. From these measurements the reflection coefficient was calculated as a nondestructive measure of adhesion. The study used a series of cylindrical samples, which were divided into 4 measurement series. Samples from the first series were characterized by the fact that the applied coating was cured at 20 °C. For the second series, the applied coating was annealed at 40 °C. The remaining measurement series, the third and fourth, contained samples on which the applied coating was cured at 50 and 60 °C, respectively. In the first stage of the tests, the surfaces of all samples were prepared according to the recommendations of the manufacturer of the car putty coating. Degreasing was performed, the surfaces were hand sanded, and then the surface was degreased again. The samples prepared in this way were subjected to a surface roughness profile test on a Taylor Hobson Surtronic 3+ profilometer (Sutronic, Wegalaan, The Netherlands) to determine its basic parameters such as Ra (average surface roughness for the length of the measurement) and Rz (an average of the five largest total deviations recorded for length).
In the next stage of the study, ultrasonic measurements were performed on samples without an applied coating. The parameter measured was the pulse amplification of the longitudinal ultrasonic wave that propagates in the material (amplitude of the pulse). A UMT 12 (Ultramed, Radom, Poland) digital ultrasonic flaw detector and a Karl Deutsch (Karl Deutsch, Wuppertal, Germany) DS-12 HB 1–6 ultrasonic transducer were used in the study. The ultrasonic head was mounted from the side of the pin to a surface to which no coating was applied. This allowed for the performance of an identical test when the coating has already been applied. The next step in the testing was to prepare the samples, i.e., apply the coating material to the previously prepared surface and anneal it accordingly. For each specimen, an equal amount of putty was applied, having previously prepared it from two components in proportions according to the recommendations of the manufacturer of the regeneration material. The curing time of the coating at different temperatures in the thermal chamber was determined:
- -
- Temperature 40 °C—60 min;
- -
- Temperature of 50 °C—46 min;
- -
- Temperature 60 °C—47 min.
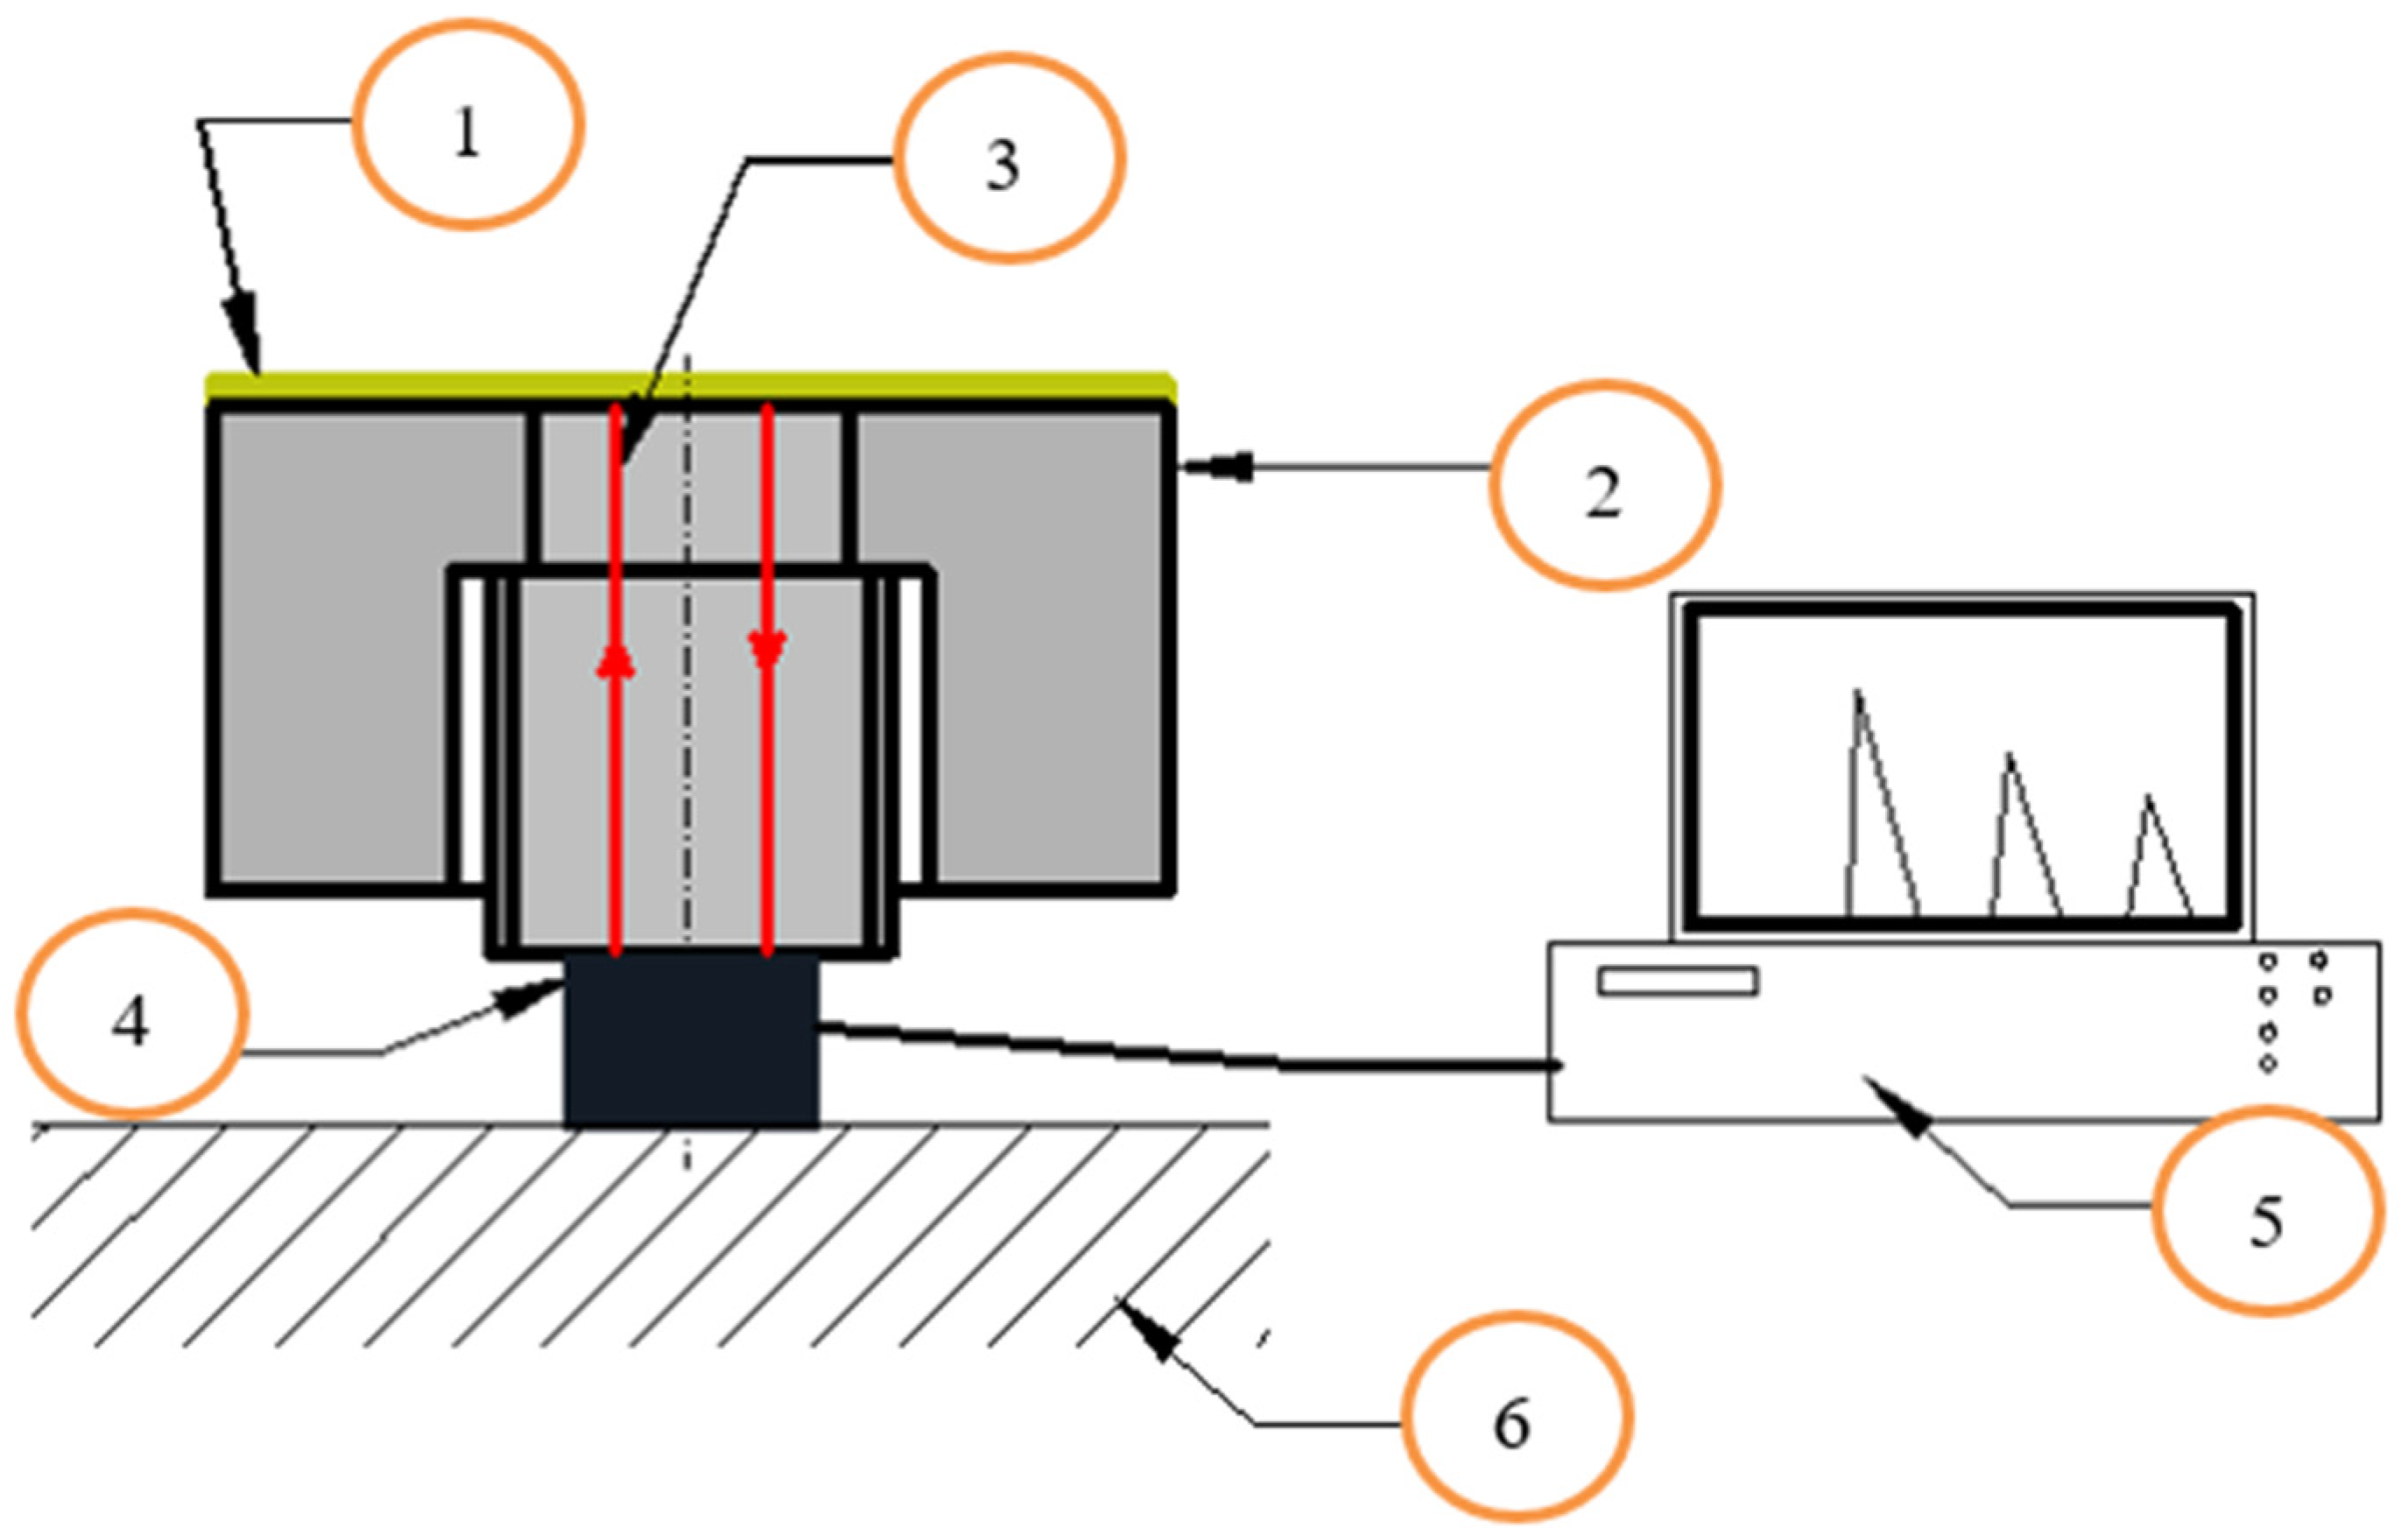
In the further implementation of the experiment, ultrasonic measurements were made after the coating was applied and set to the steel substrate. An identical ultrasonic apparatus was used, and the same ultrasonic flaw detector settings were applied as for ultrasonic measurements before the coating was applied. A schematic of the implementation of ultrasonic testing is shown in Figure 5.
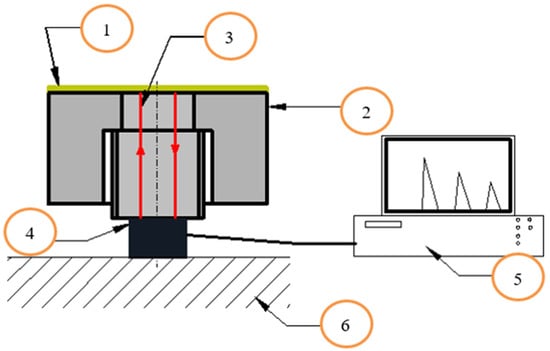
Figure 5.
Diagram of the implementation of ultrasonic measurements after the application and curing of the putty coating to the steel substrate; 1—coating, 2—sample, 3—ultrasonic wave beam, 4—ultrasonic transducer, 5—ultrasonic flaw detector, 6—table.
Ultrasonic testing uses the reflection coefficient, which can be determined by taking into account the theoretical background and the following expression [25,26]:
where
- |r|—reflection coefficient;
- z1—acoustic wave resistance of medium 1 kg/m2*s;
- z2—acoustic wave resistance of medium 2 kg/m2*s.
Equation (1) is a theoretical relationship and does not allow the calculation of the reflection coefficient for samples with different process parameters. Therefore, Equation (2) was used to calculate the value of this parameter [25,26]:
where
- |r|—reflection coefficient;
- ΔW—the decrease in the height of the pulses h1 and h2, expressed in decibels; h1—amplitude of the longitudinal wave after application of the coating; h2—amplitude of the longitudinal wave before application of the coating.
The last research step, which was planned, was the implementation of strength tests. These consisted of destroying the bond between the coating and the substrate in the test of tearing the front pin from the applied and cured car putty coating. During the tear test of all specimens, the jaw speed of the testing machine was the minimum that could be set on the machine and was 25 mm/min, and the total test time was set at 15 s. The parameter recorded during the described tests was the maximum force that occurred when the pin was detached from the putty coating. During the coating adhesion test, the pin shown in Figure 4b was pulled by the jaws of the testing machine while blocking the rest of the specimen. In this way, the pin was peeled off and the testing machine allowed the maximum destructive force of the adhesion bond to be recorded. The recorded force was then related to the surface area of the pin to which the coating was applied. In this way, the maximum stress that caused the pin to detach from the coating was determined.
3. Results
3.1. Ultrasonic Coating Width Testing
The results of testing the width of the joint between the putty coating and the body sheet in the form of changes in the parameters of the ultrasonic surface wave pulse, propagating along the joint, are shown in Table 1. The results show that the height of the ultrasonic pulse decreases with increasing width of the putty coating. This is because the applied putty strongly attenuates the ultrasonic wave, which propagates along the interface between the coating and the substrate. The greatest difference in pulse height values occurs between no coating and a width of 1 mm. The value of this parameter drops from 99% to 48.6% of the measurement range. Furthermore, the relationship between pulse height and coating width is almost linear.

Table 1.
Results of ultrasonic test of car putty coating width.
3.2. Correlational Research
Based on the results obtained from the roughness profile measurements of all samples used in the correlation study, it can be concluded that values reflect the same surface preparation. In the case of the Ra parameter, its value in most cases ranges from 0 to about 1 µm. There are isolated cases where the value of the arithmetic mean deviation of the roughness profile from the average value is higher. This difference did not significantly affect further ultrasonic and strength tests. Also, in the case of the second tested parameter of the roughness profile, increased Rz values were observed in several samples. For most of the samples, the value of this parameter ranged from 3 to 8 µm. In conclusion, the roughness profile studies confirmed that the prior preparation of the surface of the samples allow, in most cases, for the obtainment similar surface properties.
In the case of coatings cured at 20 °C, it can be seen that the reflection coefficient |r| ranges from 0.63 to 0.87. The adhesion determined from strength tests ranges between 1.51 and 3.25 MPa. Among all the samples, one was rejected due to the phenomenon of decohesion during the destructive test, while the results of two others differed significantly from the others, which may suggest the presence of errors during the implementation of measurements. The aggregate results obtained for samples cured at 20 °C are summarized in Table 2.
Table 2.
Results of ultrasonic and mechanical test for samples cured at 20 °C.
Samples with coatings cured at 40 °C show better adhesion than those that were cured at 20 °C. It reaches between 3.48 and 5.38 MPa. These results correspond to the determined value of the reflection coefficient in the range of 0.7–0.8. The results obtained for sample 40.10 were rejected in Section 4, due to the low value of the |r| coefficient (0.266), which differed significantly from others in this measurement series. The aggregate results of the measurements for the coating cured at 40 °C are summarized in Table 3. Putty coatings cured at 50 °C are characterized by adhesion in the range of 4.56–7.60 MPa. On the other hand, the results of ultrasonic testing revealed |r| coefficient values ranging from 0.516 to 0.613 (Table 4).
Table 3.
Results of ultrasonic and mechanical test for samples cured at 40 °C.
Table 4.
Results of ultrasonic and mechanical test for samples cured at 50 °C.
The fourth measurement series included samples cured at 60 °C, in which putty coatings achieved the best adhesion to the steel substrate (7.32–18.97 MPa). These values corresponded to a reflection coefficient |r| in the range of 0.299–0.398 (Table 5). In contrast to the other measurement series, the fourth series contained as many as two samples in which the phenomenon of decohesion occurred.
Table 5.
Results of ultrasonic and mechanical test for samples cured at 60 °C.
4. Discussion
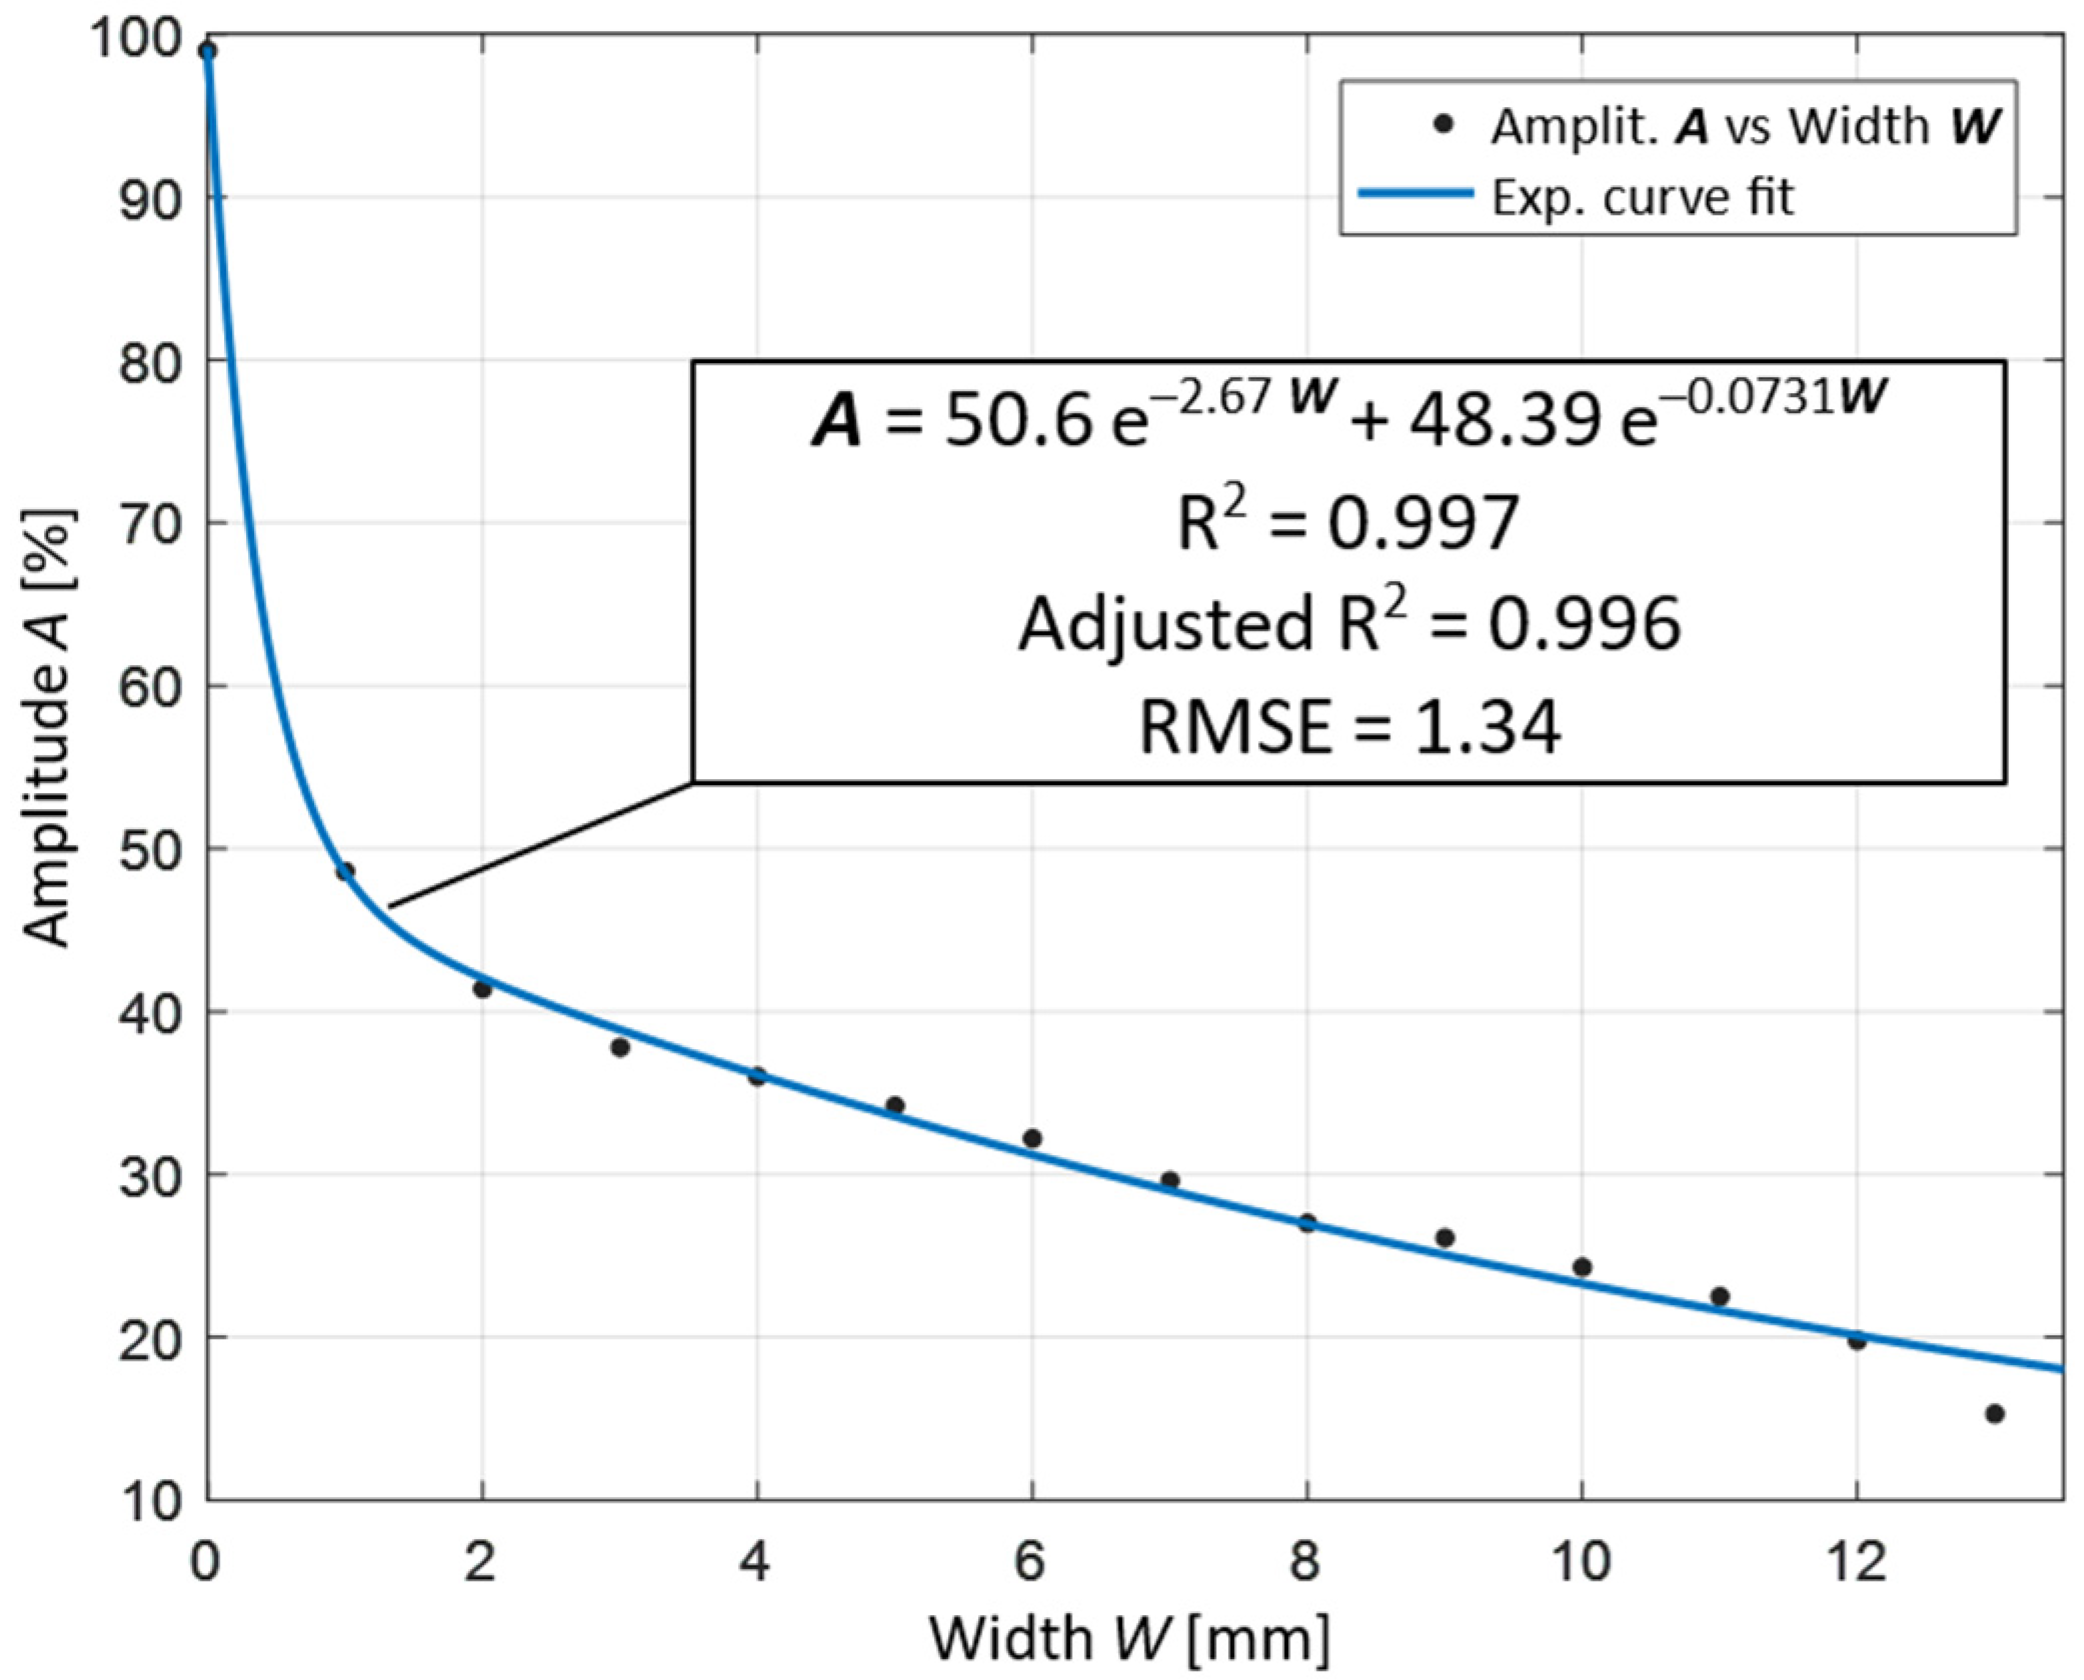
The effectiveness of nondestructive testing procedures/systems depends not only on the correctness of the measurements and obtaining good quality diagnostic signals. An increasingly important factor is the support of data analysis methods, which enable searching for ambiguous relationships hidden in the received signals and building decision rules based on them [27,28]. This allows for creating a bridge between raw data and the final decision/assessment of the condition of the tested object. In this aspect, it is important to consider the aspect of complexity of the interpretation of the obtained analysis results. One the one hand, algorithms based on artificial intelligence methods are increasingly used, which often free the operator from participation in the decision-making process [29,30]. At the same time, such an algorithm is usually in a form of a black box, and the interpretation of its results is very difficult. Another approach, the classic one, is based on the search for appropriate diagnostic features, which will enable the construction of clear and transparent decision rules [31]. In this case, it is necessary to carry out an appropriate selection and assessment of the usefulness of the considered signal features [32,33]. Therefore, based on the results presented in Section 3, in the next stage, a detailed analysis was performed to assess the quality of information provided by the recorded diagnostic parameters. The results presented in the previous section are the basis for further analysis allowing to build the models for quantitative assessment of both studied aspects. First, to evaluate the observed dependence between the pulse amplitude A and putty width W quantitatively, a procedure of the curve fitting to the obtained measurement results was carried out. In reference to the remarks stated in Section 3.1, the entire analyzed interval can be divided into two main sections: the initial one, which is up to a width of approximately 1 mm, and the further one, for a width above approximately 1 mm. In this way, the entire characteristic can be expressed using two separate lines. However, this requires an assessment of the position of the point separating both intervals; thus, a global model was finally considered. Overall, the observed dependence has an exponential character; thus, an exponential function was utilized. As a result of the analysis, to reach better fitting ability to the initial range up to 1 mm of W, a second-degree exponential curve was applied to the procedure. The fitting procedure results are presented in Figure 6. The obtained functional dependence allows for a very good representation of the character of the pulse amplitude variability, resulting in a fitting coefficient close to 1.
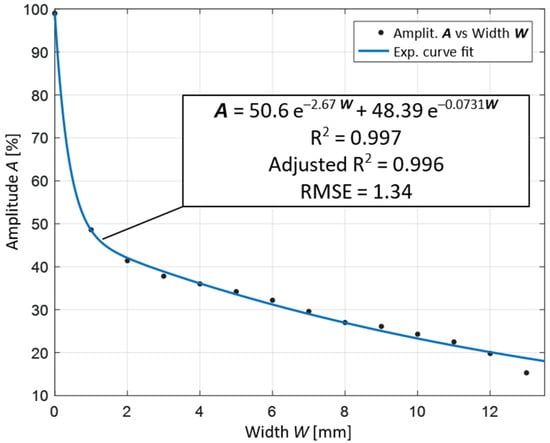
Figure 6.
Relationship between the amplitude of the pulse A for a different putty width W, expressed in reference to the no coating pulse height reading; results given in %.
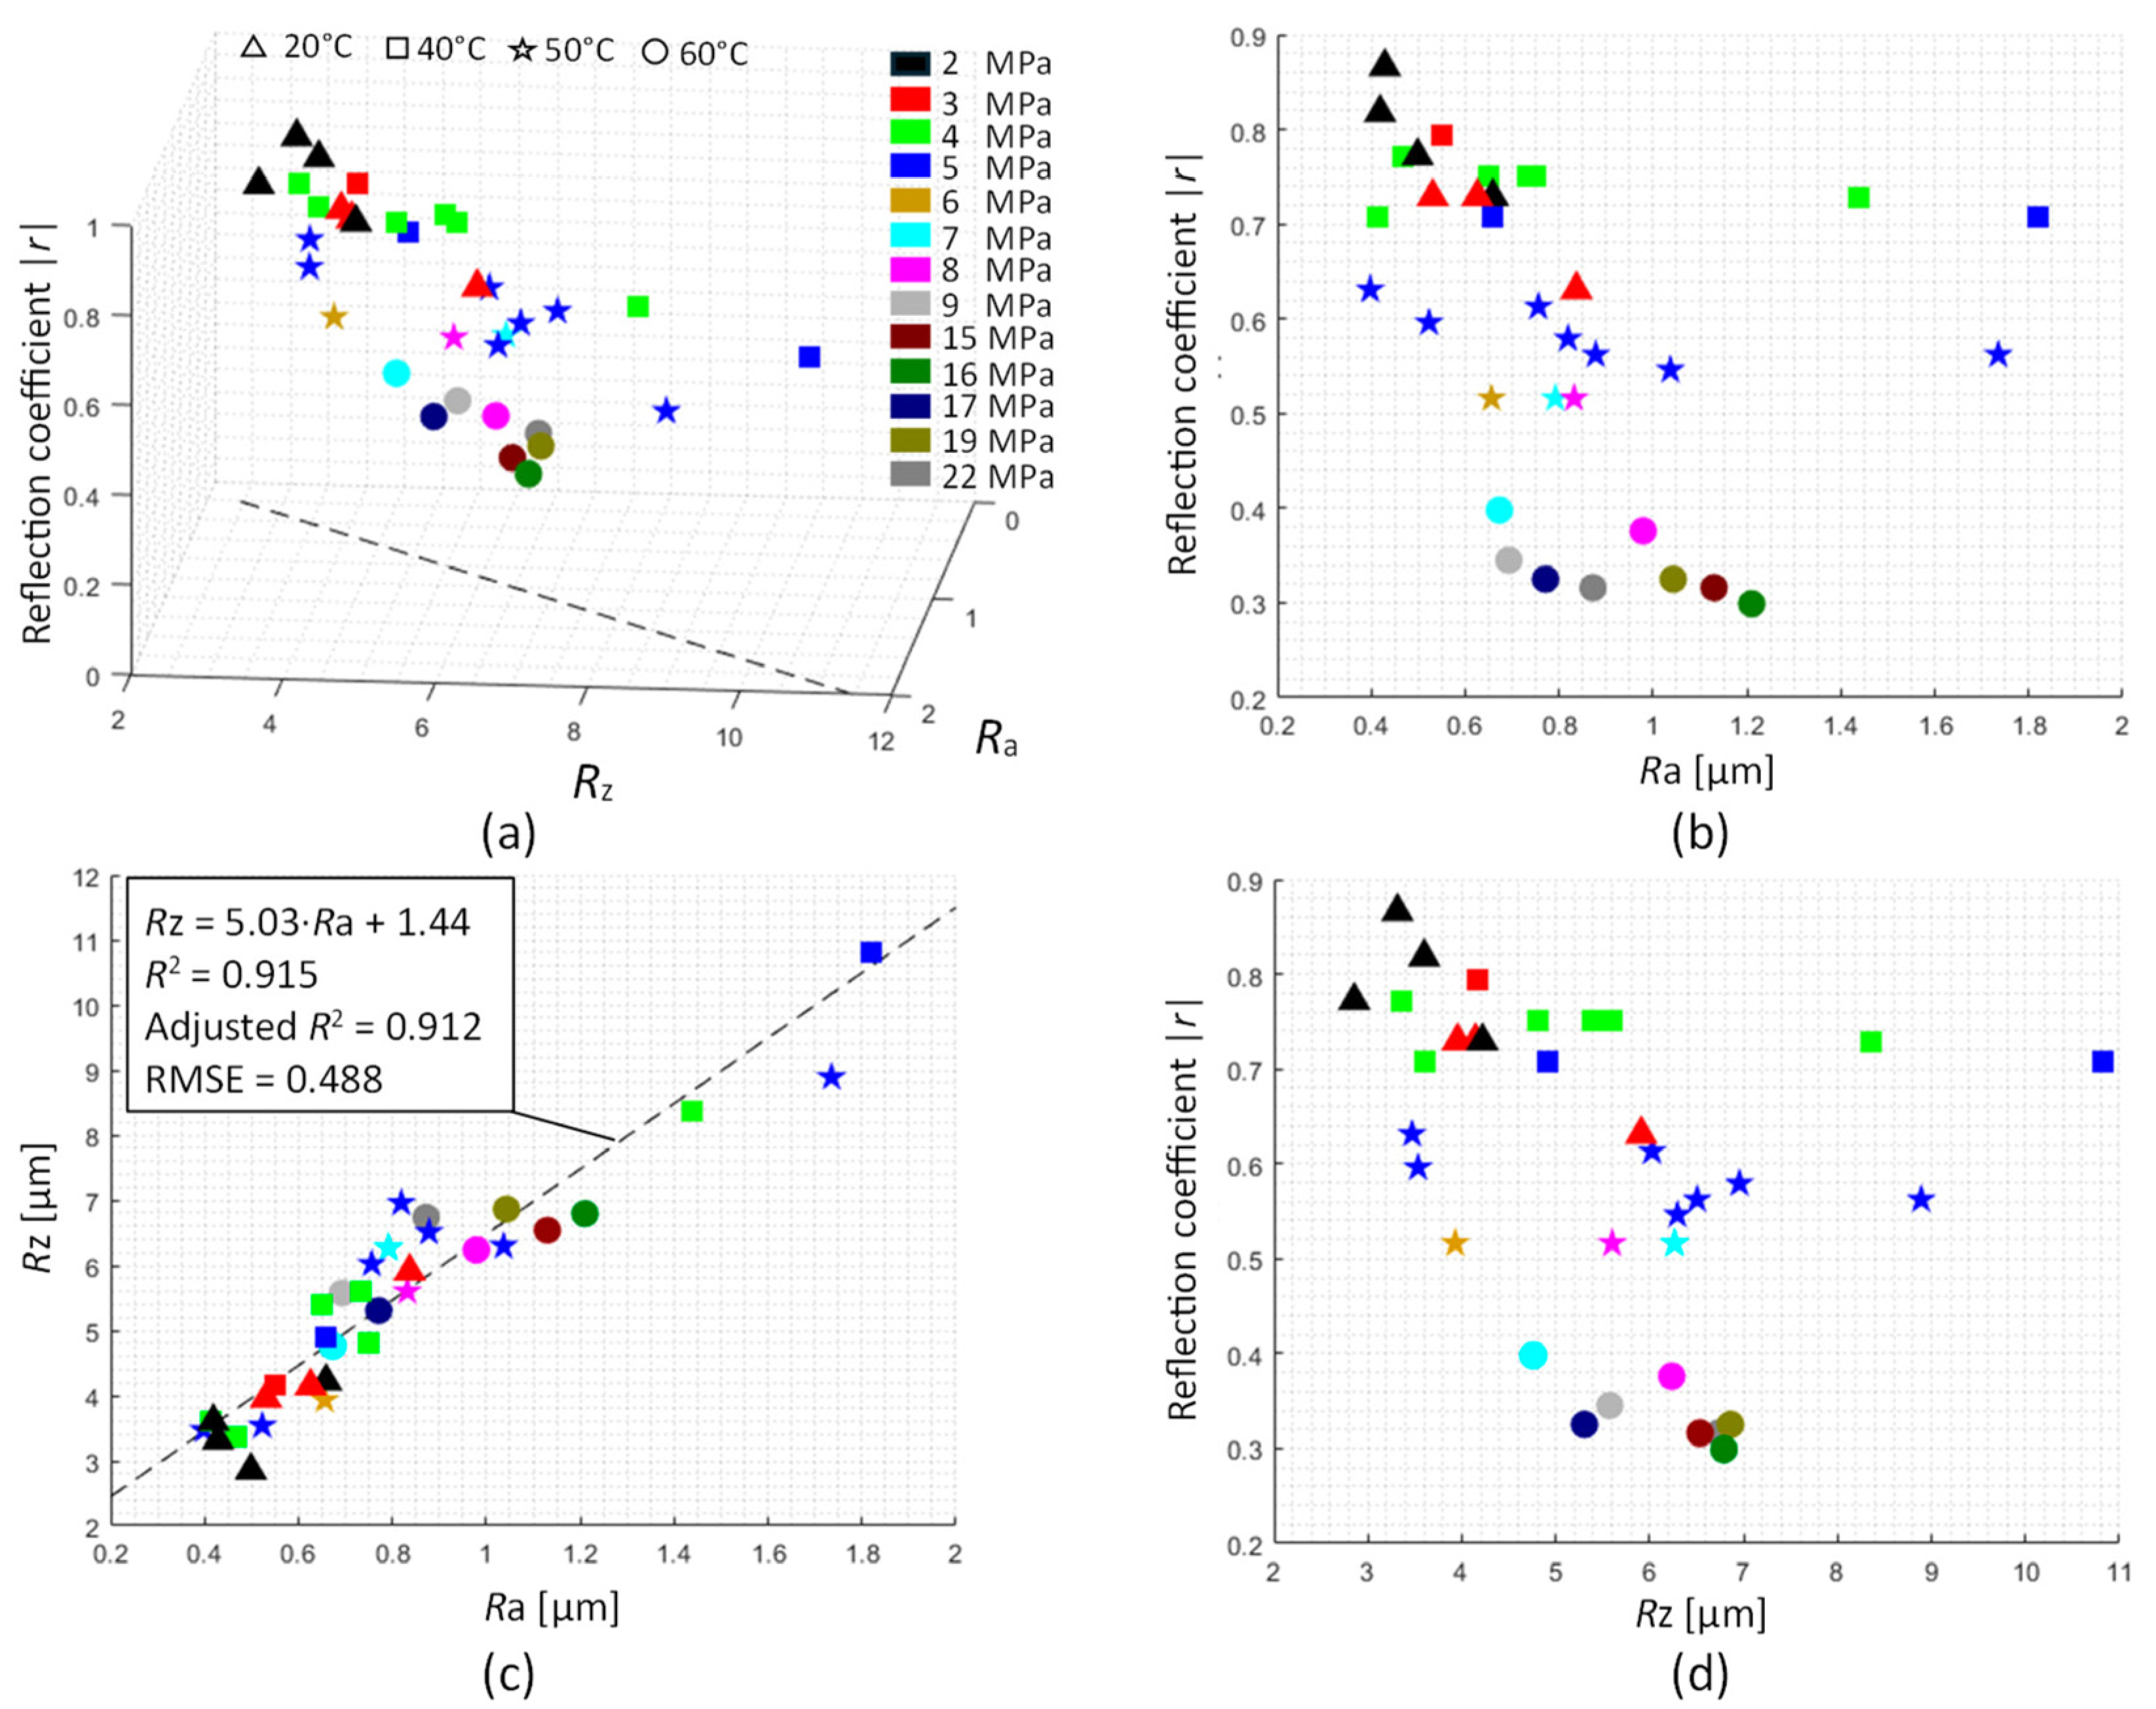
In the second case of the conducted experiments, considering the results presented in Section 3.2, in the quantitative assessment of the quality of the putty joint, the influence of several factors should be taken into account, i.e., the wave reflection coefficient |r|, surface roughness Ra and Rz, and also the temperature T used during the drying process of the putty. First, plots showing the 3D space expressed by the value of the reflection coefficient |r| and surface roughness Ra and Rz were presented (Figure 7). For detailed evaluation, different shapes of markers (in relation to different drying temperatures of the putty) and different colors (in relation to the different stress values) were used on the plots. Based on the results, a large variability of the obtained values in such a defined space can be noticed. In Section 3.2, the described trend of decreasing the reflection coefficient value with the increase in the strength of the joint between the putty and the steel sample (higher value of the obtained stress) is clearly visible, which is illustrated by successive colors of markers while moving from higher to lower values on the |r| axis. This is of course a consequence of obtaining a larger contact area between the putty and steel and, thus, provides better conditions for the transmission of the mechanical wave at the putty mass–steel interface for higher temperatures T. At the same time, it can be noted that there is no clear dependence between the reflection coefficient |r| and the roughness parameters; however, this assessment is not complete, because the samples included in individual groups corresponding to different temperatures do not represent the same ranges of Ra and Rz parameters, which currently make the comparison of results difficult. Nevertheless, the roughness parameters are dependent on each other, which is confirmed by the plot presented in Figure 7c. The last factor analyzed was the drying temperature level of the putty. The obtained results allow for a clear observation of a decrease in the value of the reflection coefficient |r| and, thus, an increase in the quality of the joint, along with the increase in temperature T. To sum up, based on observations, it can be stated that two parameters in the NDT assessment of the quality of the putty mass–steel connection can be clearly determined as decisive ones, i.e., the reflection coefficient |r| and drying temperature T.
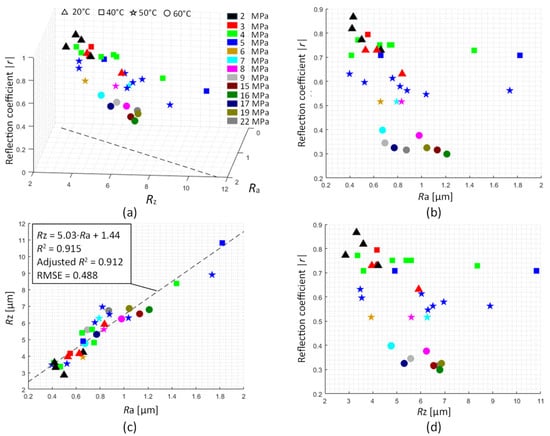
Figure 7.
Relationship between the reflection coefficient |r| of the wave for a different steel surface roughness Ra and Rz in reference to putty drying temperature (different markers shape) and generalized stress level (different color); the obtained stresses were aggregated by fixing to levels expressed by closed integer; (a) 3D view, (b–d) projections on component planes.
To confirm the observations and to quantify the importance of the information carried by all four parameters, a procedure based on the F-test feature selection algorithm was used. It is a statistical method used to assess the importance of features in a data set in which the test statistic adopts the Snedecor F distribution [31]. The purpose of this method is to select such variables that have the greatest power to differentiate between different groups (categories) of the target variable. For the test, the key concept is the ratio of the estimates of the intergroup and intragroup variance F. The higher the value of the coefficient F, the greater the power of differentiation between states/categories and the lower the probability that this difference arose by chance. The method used is to examine each feature individually and build a ranking of features taking into account the F values. The results of the analysis are presented in Figure 8. They clearly confirm the previous observations. Reflection coefficient |r| and the drying temperature of the putty T are distinguished from the set by their differentiation power, which in turn will allow for greater efficiency in assessing the quality of the tested joint.
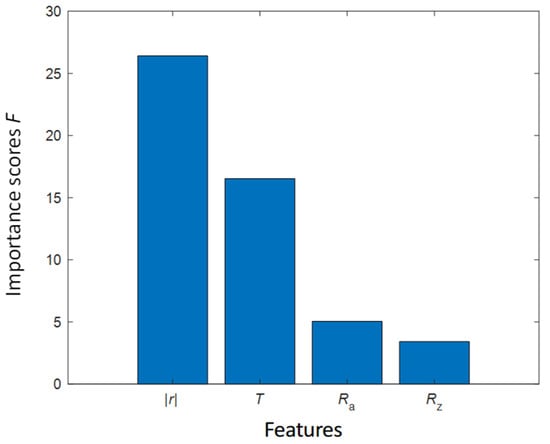
Figure 8.
Assessment of features importance using F-test method.
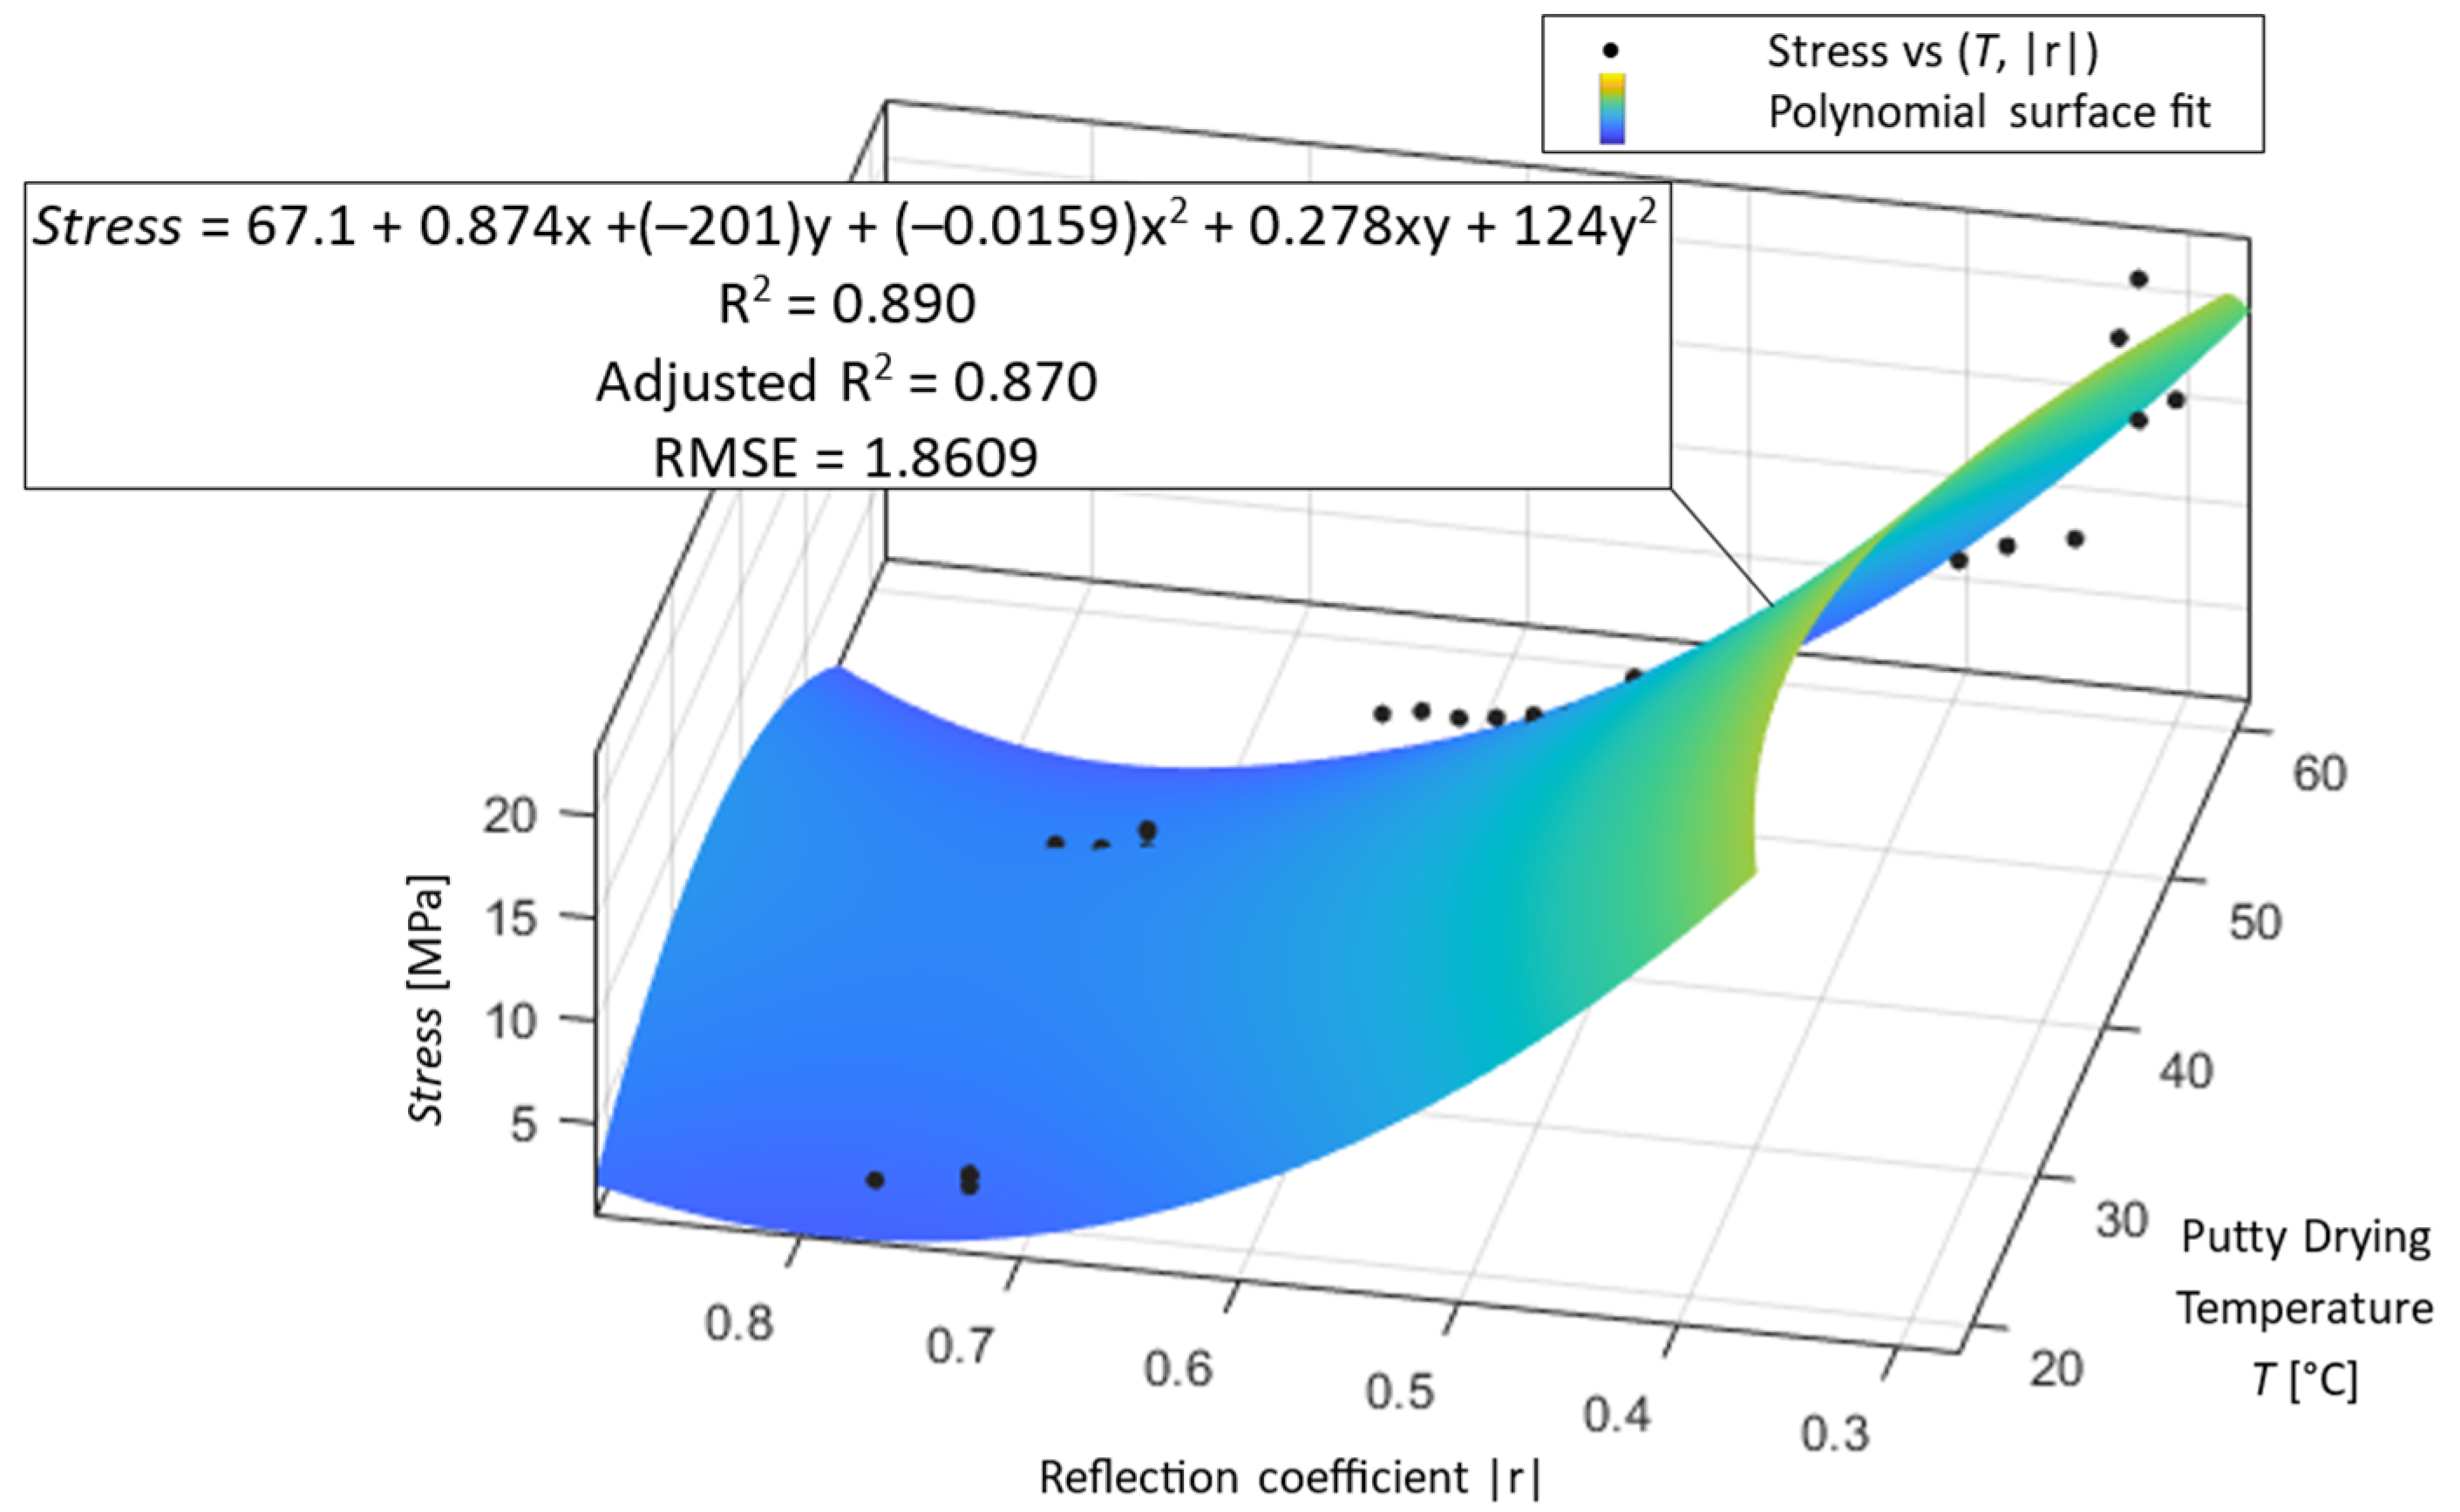
Based on the results obtained, at a later stage, only the first two parameters (|r| and T) from the above ranking were considered, and two models of the joint quality assessment procedure were proposed: the first taking into account only the value of the reflection coefficient |r| and the second taking into account both selected parameters. Both models were built using the curve fitting procedure, and their results are shown in Figure 9 and Figure 10. In both cases, the coefficient of determination R2 as well as adjusted R2 were close to 0.9. Such models allow for clear interpretation, as they directly show the relationship between the analyzed quantities. Furthermore, these types of models are easy to implement, and, considering the obtained fitting quality factors, it is possible to confirm the effectiveness of correct evaluation of the proposed models. However, these models do not take into account unusual situations, as can be seen, for example, in the case of the results of a single-parameter model. In several cases, similar reflection coefficient |r| values were obtained for clearly different stress values. To improve this situation, it is necessary to use procedures operating based on probability methods or artificial intelligence, and the construction of these types of models require a significant increase in the representation of samples in the studied population. To this end, the authors have already started a broader study, and their results will be presented in the future.
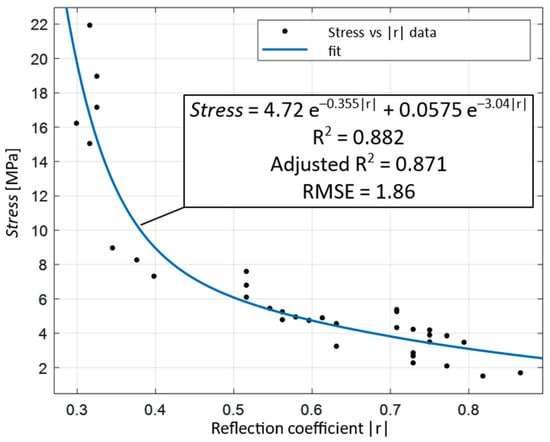
Figure 9.
Putty coating quality evaluation model based on reflection coefficient |r|.
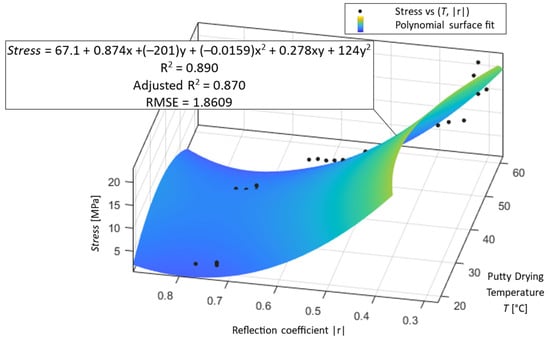
Figure 10.
Putty coating quality evaluation model based on putty drying temperature T and reflection coefficient |r| of wave.
The use of the Rayleigh wave in assessing the width of the putty coating applied to the body sheet has a key advantage, namely access to the component under examination only from the side of the applied putty. Many times, there is no access to the elements of the car body sheet from the inside without first disassembling them or dismantling the interior equipment. Disregarding the measurement in the absence of applied putty, the height of the ultrasonic pulse (amplitude) decreases linearly with an increase in the width of the coating. In view of the above, it can be concluded that the pulse height of the ultrasonic Rayleigh wave is a useful diagnostic parameter when determining the width of a putty coating on a body steel substrate. The conducted research and its results can be a basis for developing a nondestructive method for determining the width of the applied putty coating.
Analyzing all the results of the realized correlation studies, one can observe a trend in which, as the curing temperature of the coating increases, its adhesion to the steel substrate also increases, and the value of the reflection coefficient |r| of the ultrasonic longitudinal wave decreases. It can also be concluded that both the nondestructive measure of adhesion, which is the reflection coefficient, and the destructive measure of adhesion (the strength of the bond) mainly depend on the coating curing temperature. Studies of the surface roughness profile, as well as the regime during the conduct of the experiment, allow for the exclusion of other factors that could affect the above-described measures of adhesion of the coating to the substrate. The theoretical value of the reflection coefficient |r| is in the range from 0 to 1. The values of this coefficient obtained during experimental testing did not reach the limits. The coefficient was in the range of 0.30–0.86. This may be due to both the complex nature of the adhesive bonding and the specifics of the ultrasonic method. The results of ultrasonic measurements depend primarily on the acoustic properties of the material of the substrate and the coating, as well as the quality of the bonding performed.
5. Conclusions
The ultrasonic method has many advantages, the most important of which is the lack of interference with the tested material or connection. Therefore, ultrasonic testing can be used in the vehicle repair process to assess the quality of the repair. This was confirmed by the research and results presented in this article. The pulse amplitude of the ultrasonic Rayleigh wave is a useful diagnostic parameter when determining the width of the putty coating on a car body steel substrate. As the width of the applied putty increases, the amplitude of the surface wave pulse passing through the adhesive joint decreases (from 99% of the screen height of ultrasonic flaw detector in the absence of an applied coating to 15.3% for a 13 mm wide coating). The values of the reflection coefficient |r| obtained during experimental tests did not reach the limit values of 0–1. A value of 1 means no adhesion of the coating to the substrate, and a value of 0 means perfect adhesion. The determined values of this parameter range from 0.30 to 0.86. This may be due to both the complex nature of the adhesive bond and the specificity of the ultrasonic method. To sum up, it should be stated that ultrasonic tests of the connection between the coating and the substrate should be continued, and further directions of research considered by the authors of the article are primarily tests of the putty coating located under the varnish layer, correlation tests of other regenerative coatings, and the use of other ultrasonic techniques, e.g., a phased array in diagnostics of adhesive connections.
Author Contributions
Conceptualization, D.U. and G.P.; methodology, D.U. and A.B.; software, G.P. and D.B.; validation, D.U., D.B. and A.B.; formal analysis, D.U. and A.B.; investigation, D.U. and G.P.; resources, D.U.; data curation, D.U. and D.B.; writing—original draft preparation, D.U., G.P. and A.B.; writing—review and editing, D.U. and D.B.; visualization, D.U. and G.P.; supervision, A.B.; project administration, D.B. and A.B.; funding acquisition, D.U. and G.P. All authors have read and agreed to the published version of the manuscript.
Funding
The presented research results were funded with grants for education allocated by the Ministry of Science and Higher Education in Poland.
Institutional Review Board Statement
Not applicable.
Informed Consent Statement
Not applicable.
Data Availability Statement
The data presented in this study are available on request from the corresponding author.
Conflicts of Interest
The authors declare no conflicts of interest.
References
- Mahajan, S.M.; Varade Mayur, A.; Mahajan Pratiksha, N.; Patil Sneha, V. Review on Automotive Body Coating Process. Int. J. Eng. Manag. Res. 2019, 9, 103–106. [Google Scholar]
- Trembach, B.; Silchenko, Y.; Balenko, O.; Hlachev, D.; Kulahin, K.; Heiko, H.; Bellorin-Herrera, O.; Khabosha, S.; Zakovorotnyi, O.; Trembach, I. Study of the hardfacing process using self-shielding flux-cored wire with an exothermic addition with a combined oxidizer of the Al-(CuO/Fe2O3) system. Int. J. Adv. Manuf. Technol. 2024, 134, 309–335. [Google Scholar] [CrossRef]
- Lozynskyi, V.; Trembach, B.; Hossain, M.M.; Kabir, M.H.; Silchenko, Y.; Krbata, M.; Sadovyi, K.; Kolomiitse, O.; Ropyak, L. Prediction of phase composition and mechanical properties of Fe–Cr–C–B–Ti–Cu hardfacing alloys: Modeling and experimental Validations. Heliyon 2024, 10, e25199. [Google Scholar] [CrossRef]
- Akafuah, N.K.; Poozesh, S.; Salaimeh, A.; Patrick, G.; Lawler, K.; Saito, K. Evolution of the Automotive Body Coating Process—A Review. Coatings 2016, 6, 24. [Google Scholar] [CrossRef]
- Bagani, C.; Halfpenny, A.; Hill, M.; Tarasek, A. A practical methodology for the fatigue life estimation of adhesive joints. Procedia Struct. Integr. 2024, 57, 598–610. [Google Scholar] [CrossRef]
- Adams, R.D. Adhesive Bonding: Science, Technology and Applications; Woodhead Publishing: Sawston, UK; Elsevier: Amsterdam, The Netherlands, 2021; ISBN 978-0-12-819954-1. [Google Scholar]
- Chapman, G.B., II. Nondestructive Evaluation of Adhesive Bonds Using 20 MHz and 25 Khz Ultrasonic Frequencies on Metal and Polymer Assemblies; AuthorHouse Publishing: Bloomington, IN, USA, 2014; ISBN 978-1-4969-2553-4. [Google Scholar]
- Liu, B.; Wang, S.; Zhan, M.; Wang, H.; Zhang, G.; Jian, Q. Optical nondestructive evaluation for minor debonding defects and interfacial adhesive strength of solid propellant. Measurement 2022, 194, 111066. [Google Scholar] [CrossRef]
- Opdam, N.J.M.; Roeters, F.J.M.; Verdonschot, E.H. Adaptation and radiographic evaluation of four adhesive systems. J. Dent. 1997, 25, 391–397. [Google Scholar] [CrossRef]
- Hung, Y.Y.; Ng, N.; Ng, R.; Shepard, S.M.; Hou, Y.; Lhota, J.R. Review and comparison of shearography and pulsed thermography for adhesive bond evaluation. Opt. Eng. 2007, 46, 5. [Google Scholar] [CrossRef]
- Kowalczyk, J.; Jósko, M.; Wieczorek, D.; Sędłak, K.; Nowak, M. Study of the Kinetics of Adhesive Bond Formation Using the Ultrasonic Method. Appl. Sci. 2024, 14, 163. [Google Scholar] [CrossRef]
- Kowalczyk, J.; Matysiak, W.; Sawczuk, W.; Wieczorek, D.; Sędłak, K.; Nowak, M. Quality Tests of Hybrid Joint–Clinching and Adhesive—Case Study. Appl. Sci. 2022, 12, 11782. [Google Scholar] [CrossRef]
- Jeenjitkaew, C.; Guild, F.J. The analysis of kissing bonds in adhesive joints. Int. J. Adhes. Adhes. 2017, 75, 101–107. [Google Scholar] [CrossRef]
- Solodov, I.; Kornely, M.; Philipp, J.; Stammen, E.; Dilger, K.; Kreutzbruck, M. Linear vs nonlinear ultrasonic testing of kissing bonds in adhesive joints. Ultrasonics 2023, 132, 106967. [Google Scholar] [CrossRef] [PubMed]
- Goglio, L.; Rossetto, M. Ultrasonic testing of adhesive bonds of thin metal sheets. NDT E Int. 1999, 32, 323–331. [Google Scholar] [CrossRef]
- Ulbrich, D. Monitoring the boundary of an adhesive coating to a steel substrate with an ultrasonic Rayleigh wave. Open Eng. 2022, 12, 933–945. [Google Scholar] [CrossRef]
- Kowalczyk, J.; Ulbrich, D.; Sędłak, K.; Nowak, M. Adhesive Joints of Additively Manufactured Adherends: Ultrasonic Evaluation of Adhesion Strength. Materials 2022, 15, 3290. [Google Scholar] [CrossRef]
- Deng, M.; Wang, P.; Lv, X. Nondestructive evaluation of adhesive joints in layered structures using nonlinear measurements of second harmonics of ultrasonic Lamb waves. In Proceedings of the IEEE Ultrasonics Symposium 2004, Montreal, QC, Canada, 23–27 August 2004. [Google Scholar]
- Jósko, M. Metodologiczne Aspekty Oceny Przyczepności Powłok Regeneracyjnych Metodą Ultradźwiękową; Poznan University of Technology Publishing House: Poznań, Poland, 2002. [Google Scholar]
- Zhang, J.; Cho, Y.; Kim, J.; Malikov, A.K.u.; Kim, Y.H.; Yi, J.-H.; Li, W. Non-Destructive Evaluation of Coating Thickness Using Water Immersion Ultrasonic Testing. Coatings 2021, 11, 1421. [Google Scholar] [CrossRef]
- Chen, H.-L.R.; Zhang, B.; Alvin, M.A.; Lin, Y. Ultrasonic Detection of Delamination and Material Characterization of Thermal Barrier Coatings. J. Therm. Spray Technol. 2012, 21, 1184–1194. [Google Scholar] [CrossRef]
- Alig, I.; Tadjbach, S.; Kruger, P.; Oehler, H.; Lellinger, D. Characterization of coating systems by scanning acoustic microscopy: Debonding, blistering and surface topology. Prog. Org. Coat. 2009, 64, 112–119. [Google Scholar] [CrossRef]
- Kamran, M.S.; Rehman, A.; Adnan, M.; Ali, H.; Noor, F. Diagnostics of reciprocating machines using vibration analysis and ultrasound techniques. Insight Non-Destr. Test. Cond. Monit. 2019, 61, 676–682. [Google Scholar] [CrossRef]
- Ditri, J.J.; Hongerholt, D. Stress distribution determination in isotropic materials via inversion of ultrasonic Rayleigh wave dispersion data. Int. J. Solids Struct. 1996, 33, 2437–2451. [Google Scholar] [CrossRef]
- Allin, J.M. Disbond Detection in Adhesive Joints Using Low-Frequency Ultrasound. Ph.D. Thesis, University of London, London, UK, 2002. [Google Scholar]
- Pilarski, A.; Rose, J.L. A transverse-wave ultrasonic oblique-incidence technique for interfacial weakness detection in adhesive bonds. J. Appl. Phys. 1988, 63, 300–307. [Google Scholar] [CrossRef]
- Feng, B.; Ribeiro, A.L.; Pasadas, D.J.; Ramos, H.G. Locating Low Velocity Impacts on a Composite Plate Using Multi-Frequency Image Fusion and Artificial Neural Network. J. Nondestruct. Eval. 2022, 41, 34. [Google Scholar] [CrossRef]
- Yusa, N.; Knopp, J.S. Evaluation of Probability of Detection (POD) Studies with Multiple Explanatory Variables. J. Nucl. Sci. Technol. 2015, 53, 574–579. [Google Scholar] [CrossRef]
- Sun, H.; Ramuhalli, P.; Jacob, R.E. Machine Learning for Ultrasonic Nondestructive Examination of Welding Defects: A Systematic Review. Ultrasonics 2023, 127, 106854. [Google Scholar] [CrossRef] [PubMed]
- Inês Silva, M.; Malitckii, E.; Santos, T.G.; Vilaça, P. Review of Conventional and Advanced Non-Destructive Testing Techniques for Detection and Characterization of Small-Scale Defects. Prog. Mater. Sci. 2023, 138, 101155. [Google Scholar] [CrossRef]
- Maciusowicz, M.; Psuj, G. Classification of Grain-Oriented Electrical Steel Sheets by Magnetic Barkhausen Noise Using Time-Frequency Analysis and Selected Machine Learning Algorithms. Appl. Sci. 2022, 12, 12469. [Google Scholar] [CrossRef]
- Guyon, I.; Elisseeff, A. An introduction to variable and feature selection. J. Mach. Learn. Res. 2003, 3, 1157–1182. [Google Scholar]
- Johnson, R.A.; Wichern, D.W. Applied Multivariate Statistical Analysis, 4th ed.; Repr. with Corr.; Prentice Hall: Upper Saddle River, NJ, USA, 1999; ISBN 978-0-13-834194-7. [Google Scholar]


Disclaimer/Publisher’s Note: The statements, opinions and data contained in all publications are solely those of the individual author(s) and contributor(s) and not of MDPI and/or the editor(s). MDPI and/or the editor(s) disclaim responsibility for any injury to people or property resulting from any ideas, methods, instructions or products referred to in the content. |
© 2024 by the authors. Licensee MDPI, Basel, Switzerland. This article is an open access article distributed under the terms and conditions of the Creative Commons Attribution (CC BY) license (https://creativecommons.org/licenses/by/4.0/).