Abstract
To balance the tradeoff between quality of service (QoS) and operating expenditure (OPEX), the service provider should request the appropriate amount of resources to the cloud operator based on the estimated variation of service requests. This paper proposes a popularity-aware service provisioning framework (PASPF), which leverages the network data analytics function (NWDAF) to obtain analytics on service popularity variations. These analytics estimate the congestion level and list of top services contributing most of the traffic change. Based on the analytics, PASPF enables the service provider to request the appropriate amount of resources for each service for the next time period to the cloud operator. To minimize the OPEX of the service provider while keeping the average response time of the services below their requirements, we formulate a constrained Markov decision process (CMDP) problem. The optimal stochastic policy can be obtained by converting the CMDP model into a linear programming (LP) model. Evaluation results demonstrate that the PASPF can achieve less than OPEX of the service provider compared to a popularity-non-aware scheme while keeping the average response time of the services below the requirement.
1. Introduction
In the flourishing cloud industry [1], there are two kinds of players: cloud operators (i.e., cloud providers) and service providers (i.e., cloud consumers).
The cloud operators have three primary deployment models: Infrastructure-as-a-Service (IaaS), Platform-as-a-Service (PaaS), and Software-as-a-Service (SaaS) [2,3]. Specifically, IaaS provides on-demand infrastructure resources to consumers via the cloud, such as computing, storage, networking, and virtualization. Consumers do not have to manage, maintain, or update their own data center infrastructure, but they are responsible for the operating system, middleware, virtual machines, and any apps or data. IaaS gives consumers flexibility and scalability to purchase only the components they need and scale them up or down as needed. There is low overhead and no maintenance costs, making IaaS a very affordable option. However, the main drawbacks to IaaS are the possibilities of security and service reliability issues due to multi-tenant systems with multiple clients, which can be avoided by choosing a reliable and trustworthy provider. Meanwhile, PaaS provides and manages all the hardware and software resources to develop applications through the cloud. Consumers can use PaaS to develop, run, and manage applications without having to build and maintain the infrastructure or platform on their own. PaaS enhances developer productivity but comes with limited customizations and low flexibility due to the dependency on cloud providers. Finally, SaaS provides an entire application stack that consumers can access and use. SaaS products are completely managed by the cloud provider and come ready to use, including all updates and overall maintenance. Consumers can easily access, set up, and start using SaaS products over any internet connection on any device. However, the main drawbacks to SaaS are very limited customization and vendor lock-in issues due to the tight dependency on the cloud providers. In practice, the service providers frequently use IaaS to achieve a high level of control and flexible management [4,5]. Thus, we focus on the IaaS paradigm from the perspective of service providers. For IaaS, there are two kinds of pricing policy: pay-as-you-go and pay-as-per-use [6]. In the pricing policy of pay-as-you-go, the service provider pays a certain amount of cost to borrow a fixed amount of resources (e.g., CPU, memory, storage, etc.) for a specified period of time (e.g., 1 h) [6]. The pricing policy of pay-as-per-use, on the other hand, charges based on the usage. That is, when a service provider chooses the pricing policy of pay-as-per-use, he/she only pays for what he/she uses. However, the price of pay-as-per-use is generally more expensive than that of pay-as-you-go. Since one of the objectives in this paper is to minimize the cost of the service provider, we consider the pricing policy of pay-as-you-go. However, in pay-as-you-go, if the requests for a specific service boost up and the borrowed resources for a specific service are not sufficient to support the boosted requests, the response time of that service cannot meet its requirement. This phenomenon can be avoided by borrowing sufficient amounts of resources. However, too excessive resource borrowing causes a significant increased service deployment cost (i.e., operating expenditure (OPEX)) of the service provider. This indicates that the service provider should borrow an appropriate amount of resources based on the estimated service popularity variation (i.e., variation of service requests).
To address this issue of the service providers, this paper proposes a popularity-aware service provisioning framework (PASPF). In the PASPF, the service provider assesses the popularity variation of the service by requesting the analytics to a network data analytics function (NWDAF) in 5G. The NWDAF provides the analytics that estimate the congestion level and list of top services contributing most of the traffic change for the next time period. After receiving these analytics, the service provider communicates with the cloud operator to request an appropriate allocation of resources for each service in the forthcoming period. To minimize the OPEX of the service provider while ensuring that the average response time for services remains within specified requirements, a constrained Markov decision process (CMDP) problem was formulated. We derived the optimal stochastic policy by transforming the CMDP model into a linear programming (LP) model. The evaluation results indicate that PASPF can reduce over in the service provider’s OPEX compared to a popularity-non-aware scheme while keeping the average response time of the services below the requirement. Moreover, it has been found that the PASPF can dynamically adjust its operational policy based on the environment, which can be utilized as the guidelines for the service providers to design the service provisioning framework.
The followings are this paper’s contributions: (1) We construct the popularity estimation model, which can be used to generate the analytics in NWDAF. (2) The PASPF derives the optimal policy on how much resources are requested for each service. The optimal policy can be derived from a low complexity and practical LP model. (3) The evaluation results under various conditions offer valuable insights for cost-efficient service provisioning.
2. Related Work
There have been lots of works conducted on how to deploy the services in the cloud environments without various performance metrics (e.g., deployment cost, reliability, response time, operational cost, etc.) [7,8,9,10,11,12,13].
Wen [7] formulated a multi-objective optimization problem to maximize the reliability of the services and minimize the deployment cost of the services. In addition, they proposed a heuristic algorithm that minimizes the selected objective while bounding the other objective. Shi [8] formulated a mixed integer linear programming method to minimize the deployment cost while keeping the average response time of the services below the requirement. Then, they divided the problem into linearized sub-problems to solve the problem with the existing solutions. Menzel et al. [9] developed a genetic algorithm-based approach to balance the tradeoff between the response time and the deployment cost of the services. Wu et al. [10] formulated an optimization problem to minimize the overall operational cost during a certain time interval. Deng et al. [11] introduced a model for deploying sub-components-based services to minimize the deployment cost while satisfying response time requirements. Chen et al. [12] developed a heuristic approach that deploys sub-components in the heterogeneous cloud environment to reduce transmission latency. Chen et al. [13] formulated an edge service deployment optimization problem and proved that the formulated problem is NP-hard. Then, they proposed an approximation algorithm to find the near-optimal solution with low complexity. Chen et al. [14] introduced a cooperative edge caching strategy that retrieves content from several servers in collaboration while taking into account the popularity of the contents. Deng et al. [15] developed a heuristic algorithm aimed at reducing the average response time of services by taking into account the content popularity. Wu et al. [16] formulated a joint optimization problem for service provisioning, server activation, and scheduling, taking into account the fluctuations in service popularity over time.
However, there is no work that has considered the dynamics of service popularity and the pricing policy of pay-as-you-go to minimize the deployment cost (i.e., OPEX) of the service provider.
3. Popularity-Aware Service Provisioning Framework
3.1. Overall Framework
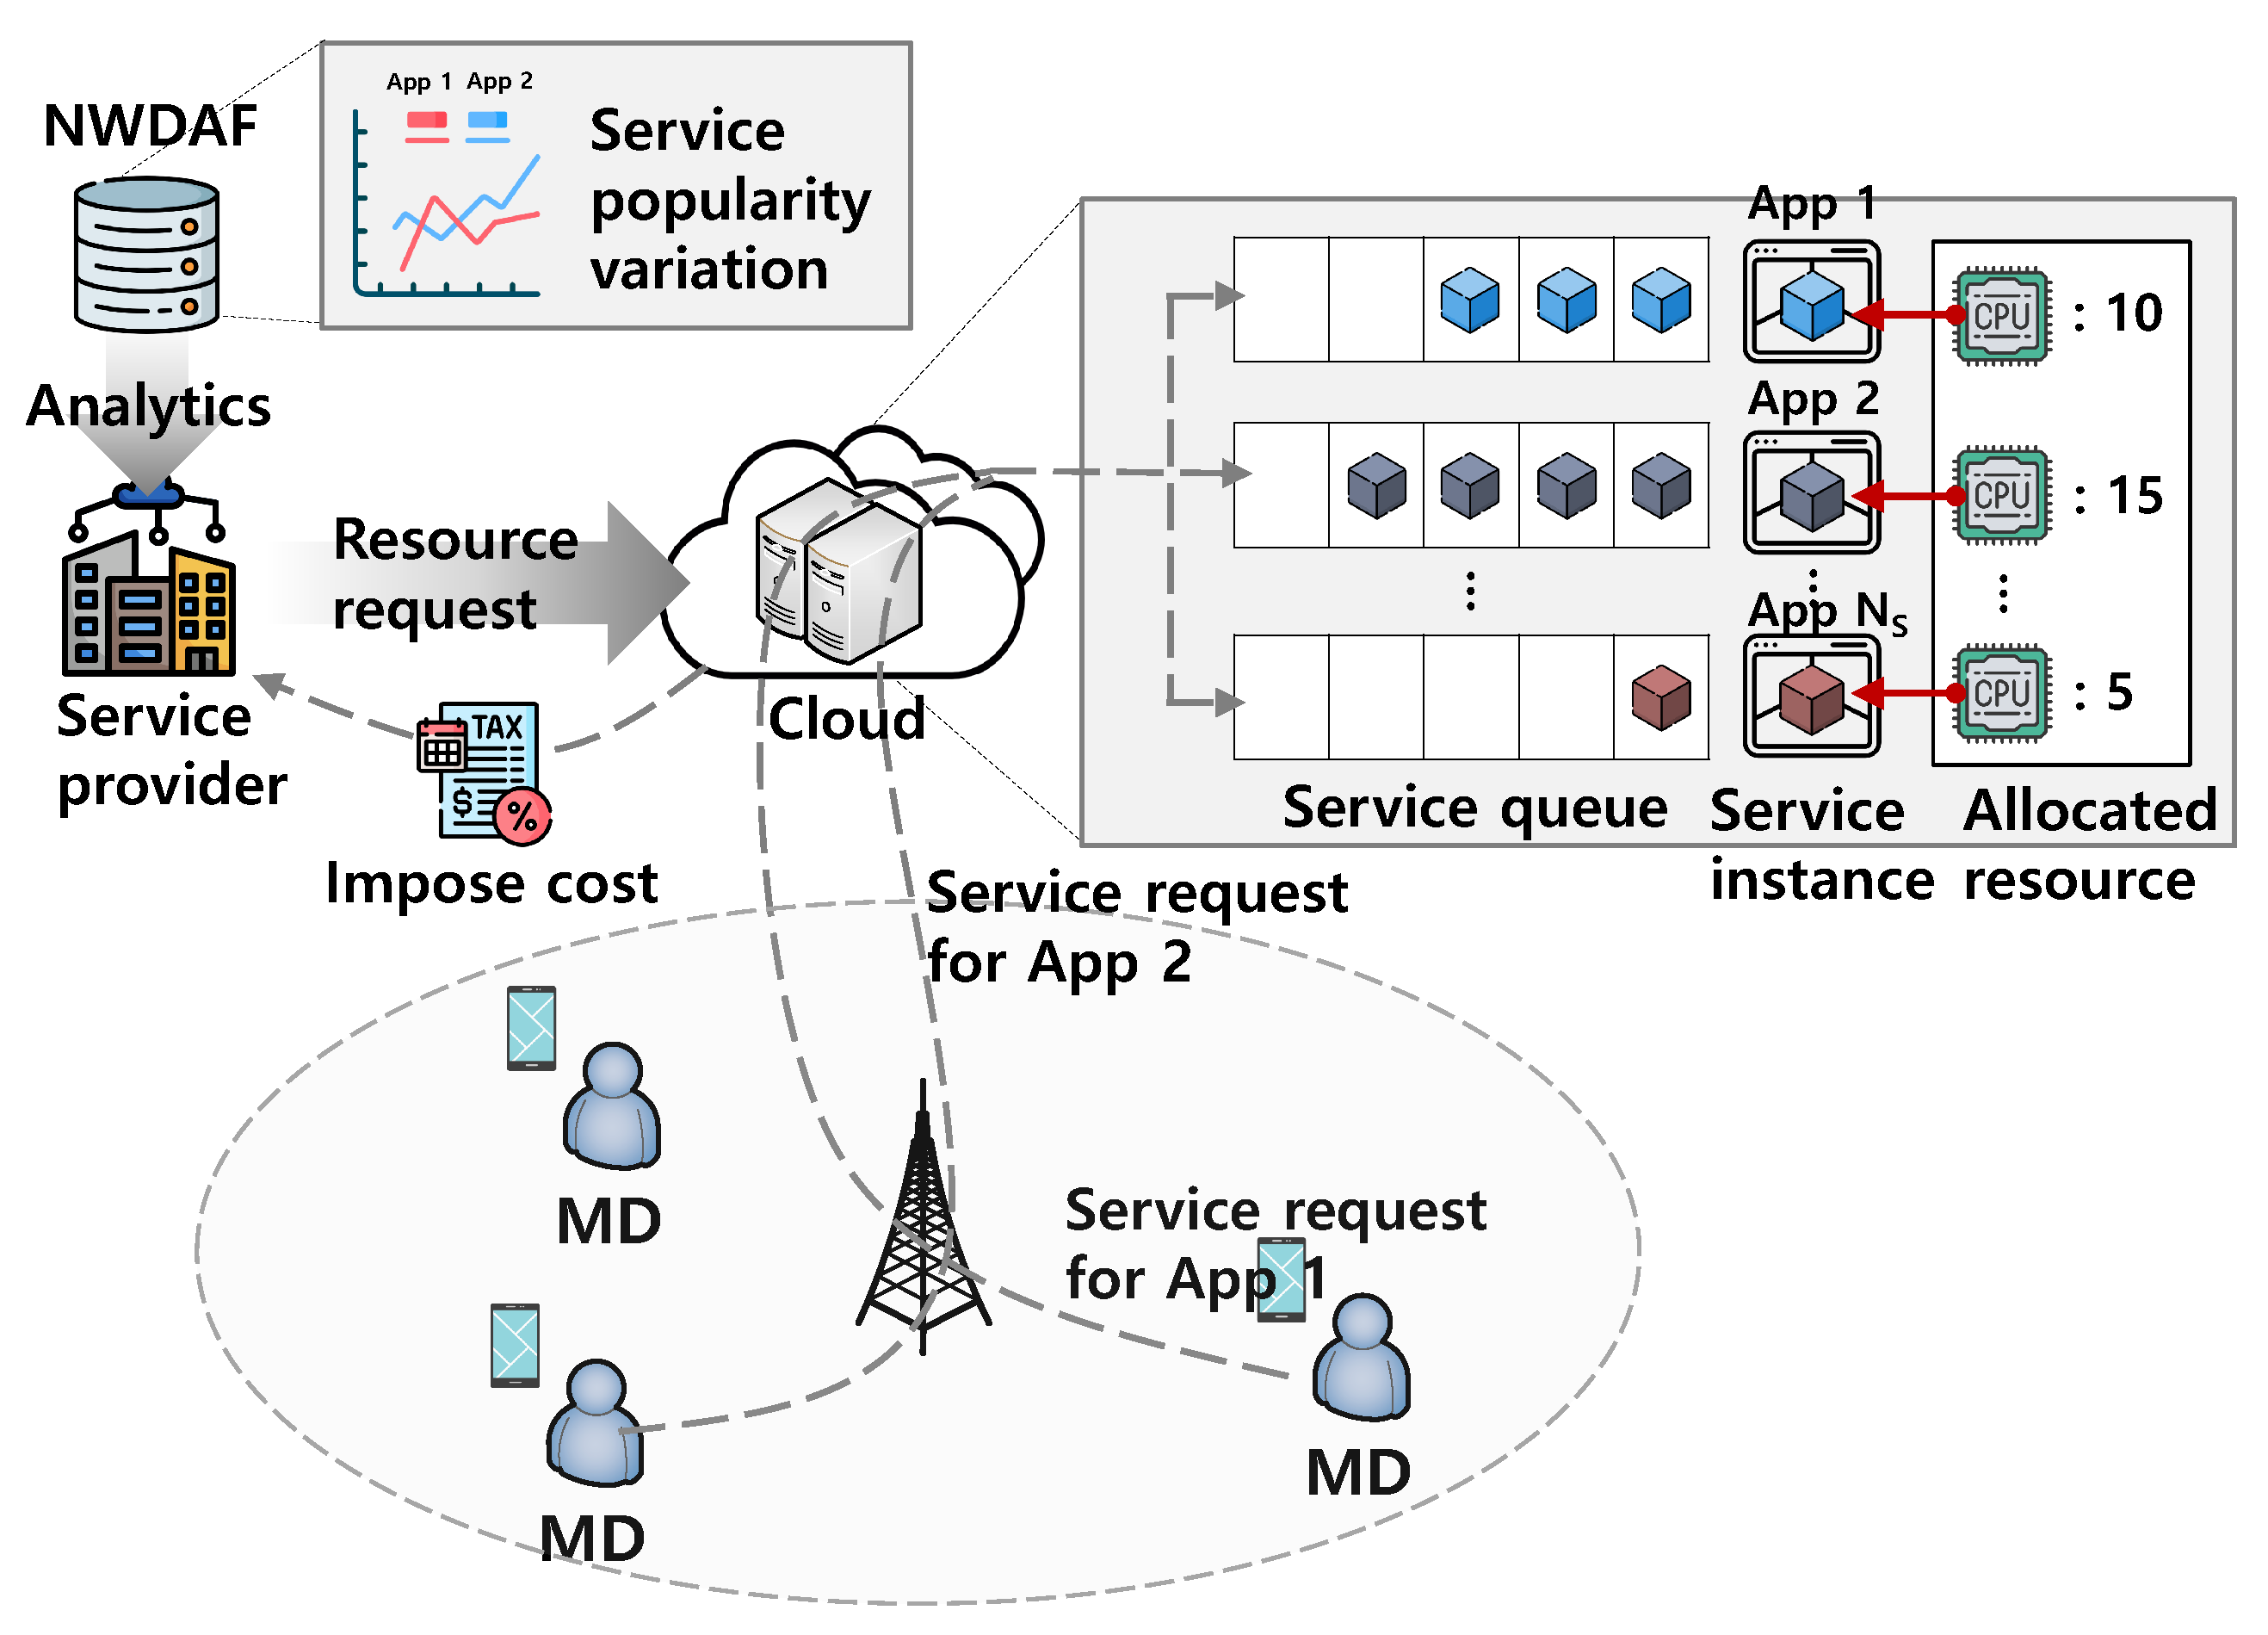
Figure 1 shows the system model of this paper. The service provider operates services for mobile devices (MDs). For the service provision, the service provider exploits the IaaS of the cloud operator based on the pricing policy of pay-as-you-go. That is, if the service provider requests resources (e.g., CPU, memory, storage, etc.) for the provision of service i during a contract time (e.g., 1 h), the service provider should pay , where is the unit cost for using one resource during the contract time to the cloud operator. After receiving the resource request message, the cloud operator allocates resources to the service instance.
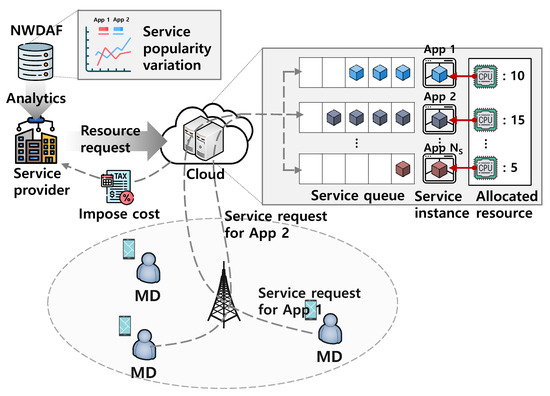
Figure 1.
System model.
As shown in Figure 1, when the MD requests the service i, the service request is enqueued in the service queue and handled in a first-in-first-out (FIFO) manner. In addition, the processing rate of each service is proportional to the requested resource . This means that the response time of the request is determined by the number of requests in the service queue and the requested resources. Therefore, when lots of MDs request the service i simultaneously and insufficient resources are requested for that service, the response time of that service for some MDs cannot meet its requirement. This phenomenon can be avoided by requesting enough resources. However, since the cost of the IaaS is proportional to the requested resources , too excessive resource requesting causes a significant increased OPEX of the service provider. That is, there is a tradeoff between the service response time and the OPEX. To optimize this tradeoff, in the PASPF, the service provider requests the analytics on the popularity variation of each service to the NWDAF in 5G. As in standard [17], the NWDAF can provide the analytics (i.e., service popularity dynamics) that estimates how the congestion level and list of top services contributing most of the traffic change for the next time period. After receiving the analytics, the service provider can decide the optimal amount of resources for each service for the next time period. In short, the PASPF operates as follows:
- The PASPF leverages the NWDAF, where the popularity estimation model runs to obtain the analytics on the popularity variations of each service.
- Based on the analytics, the PASPF decides the optimal amount of resources for the next time period and requests the corresponding resources to the cloud operator.
Note that, for the optimal decision, we formulated the CMDP model, which will be described in the next section.
3.2. Popularity Estimation Model
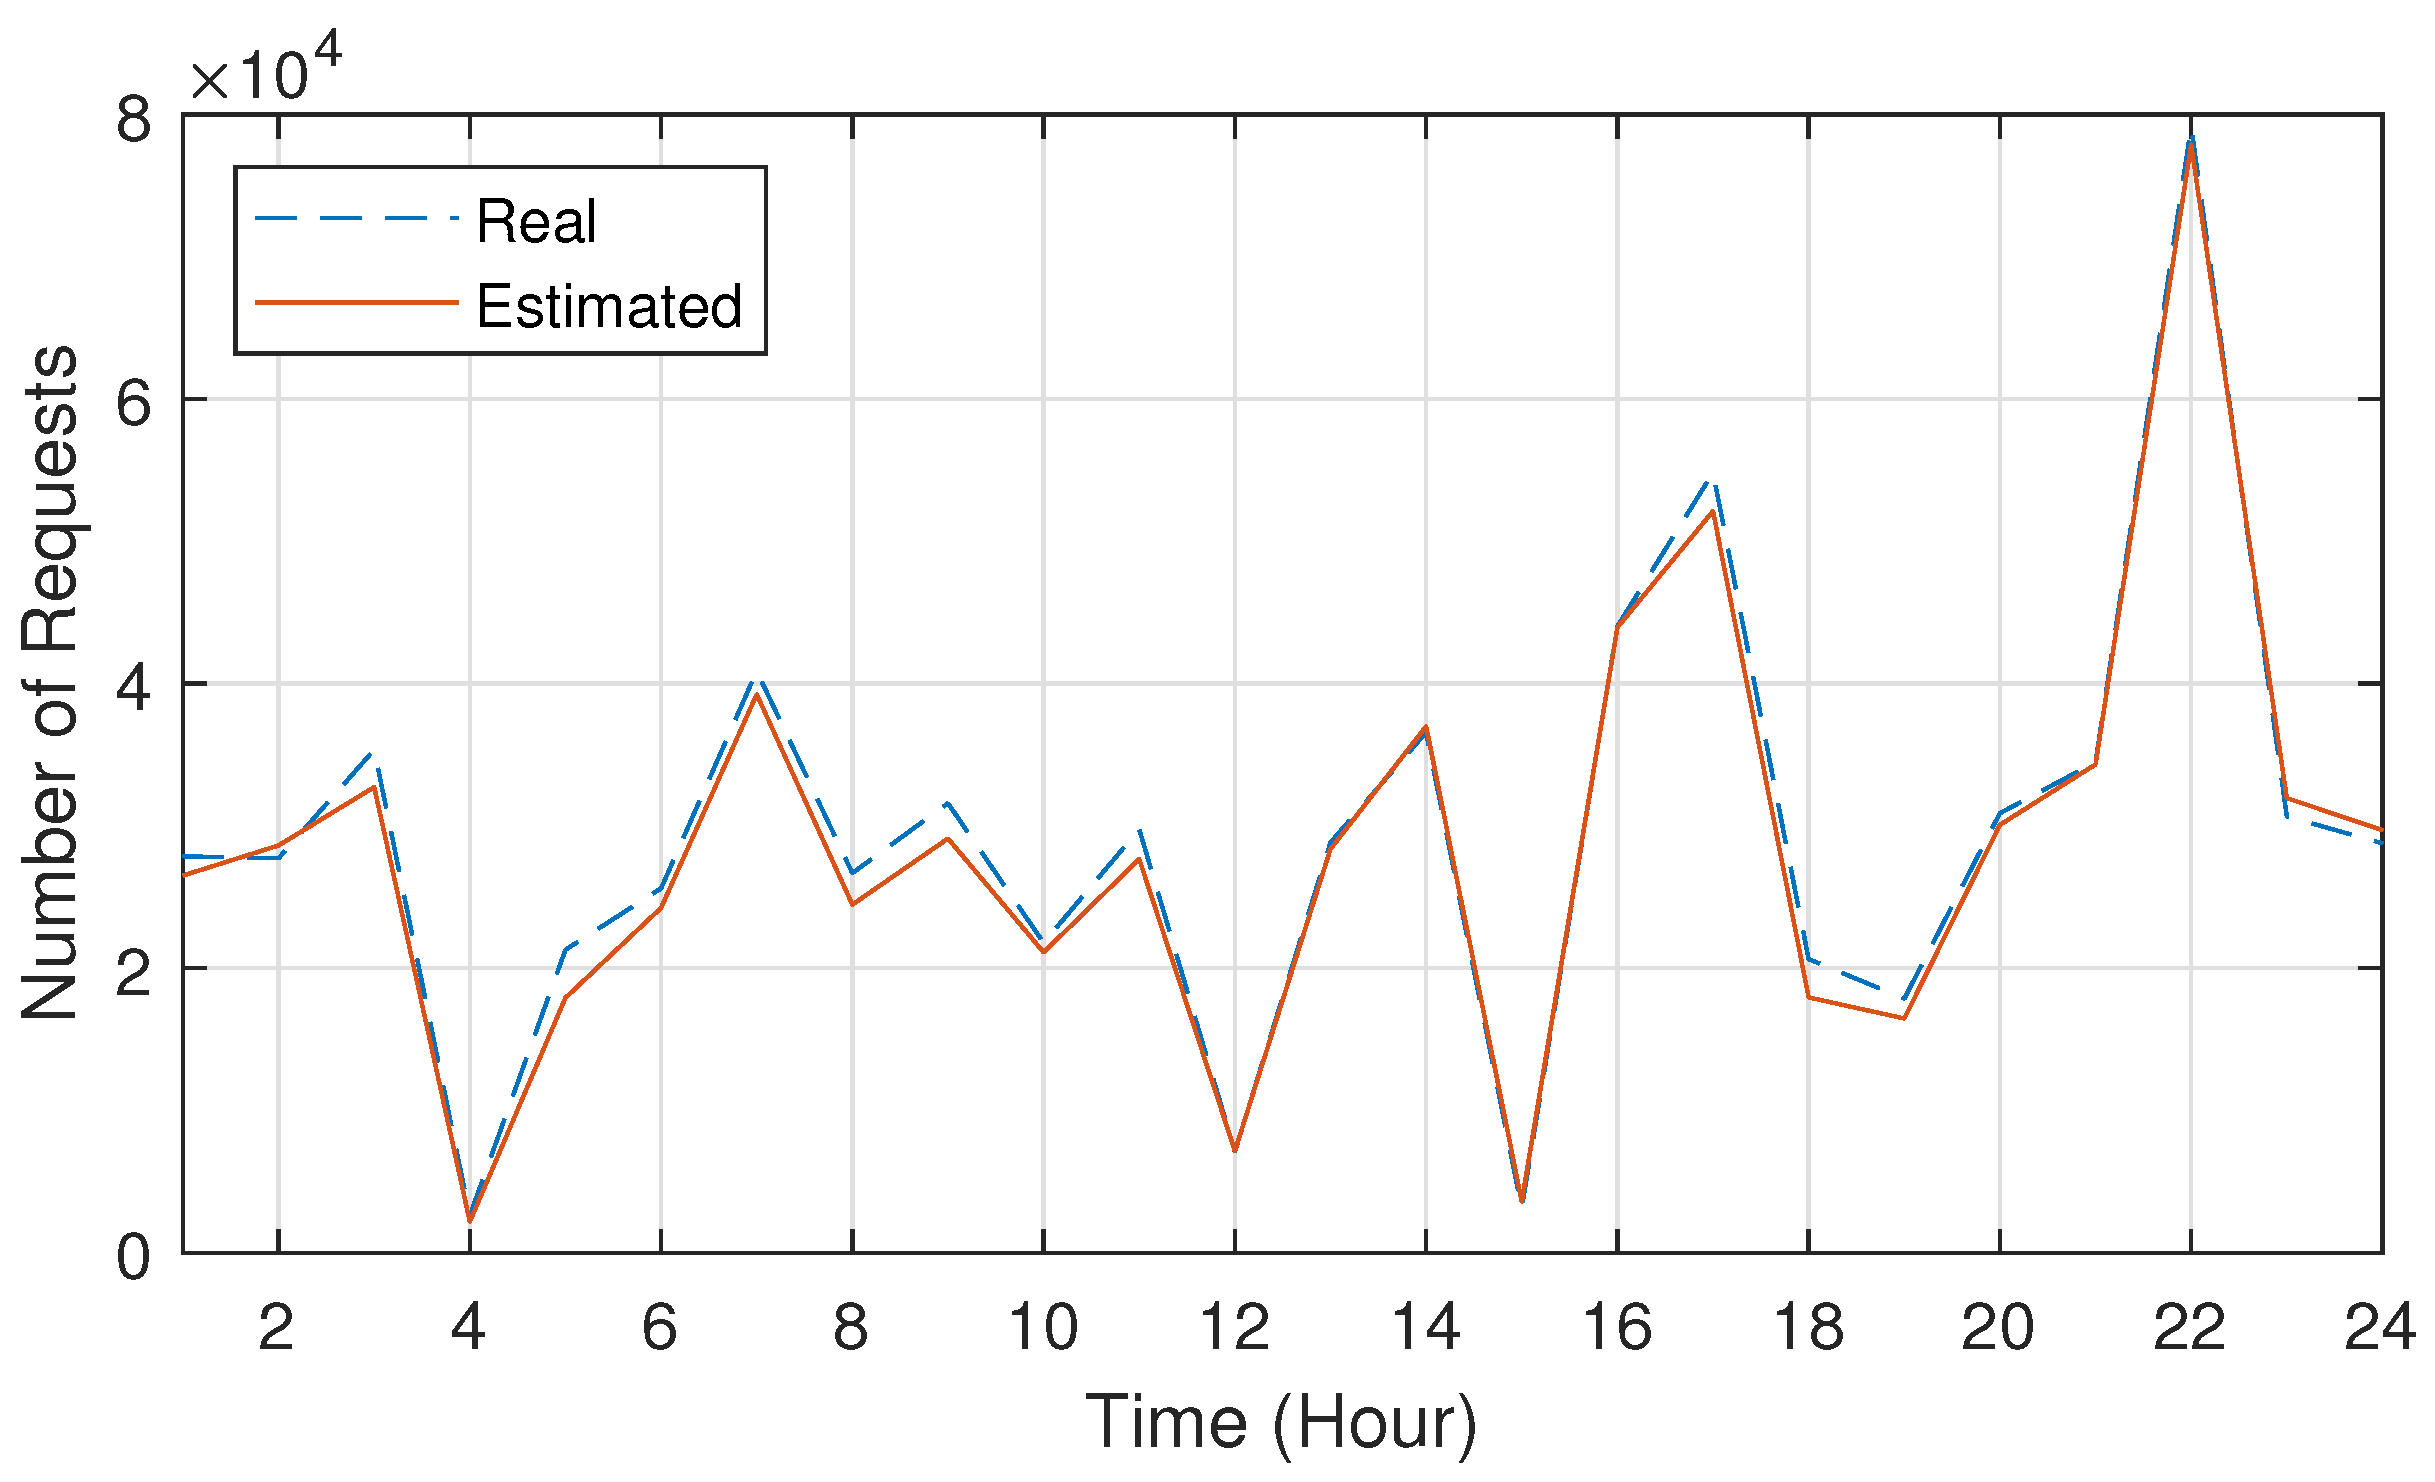
To estimate the popularity variation of each service, we constructed a general long short-term memory (LSTM) model based on Tensorflow and trained it with the Kaggle public dataset [18]. Within the dataset, we separated into a training set and into a test set. Note that the training set was utilized for the model design, and the test set was used for the validation and test. The details of the hyper-parameters are as follows. The number of layers and the hidden size are 5 and 16, respectively. The input and window sizes were set to 1 and 24, respectively. The learning rate was set to .
Figure 2 shows the real and estimated results for the number of Amazon service requests as a function of time. As shown in Figure 2, the constructed model could catch the popularity variation well. Specifically, the accuracy of the constructed model became approximately over , which means that the model is well generalized for the estimation. This indicates that the NWDAF can provide the accurate analytics estimating top services contributing most of the traffic change for the next time period. Thus, based on the analytics, the service provider requests the appropriate amount of resources for each service for the next time period to the cloud operator.
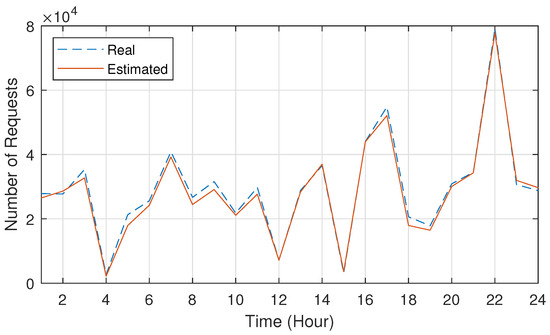
Figure 2.
The estimation result on the popularity variation.
4. Constrained MDP
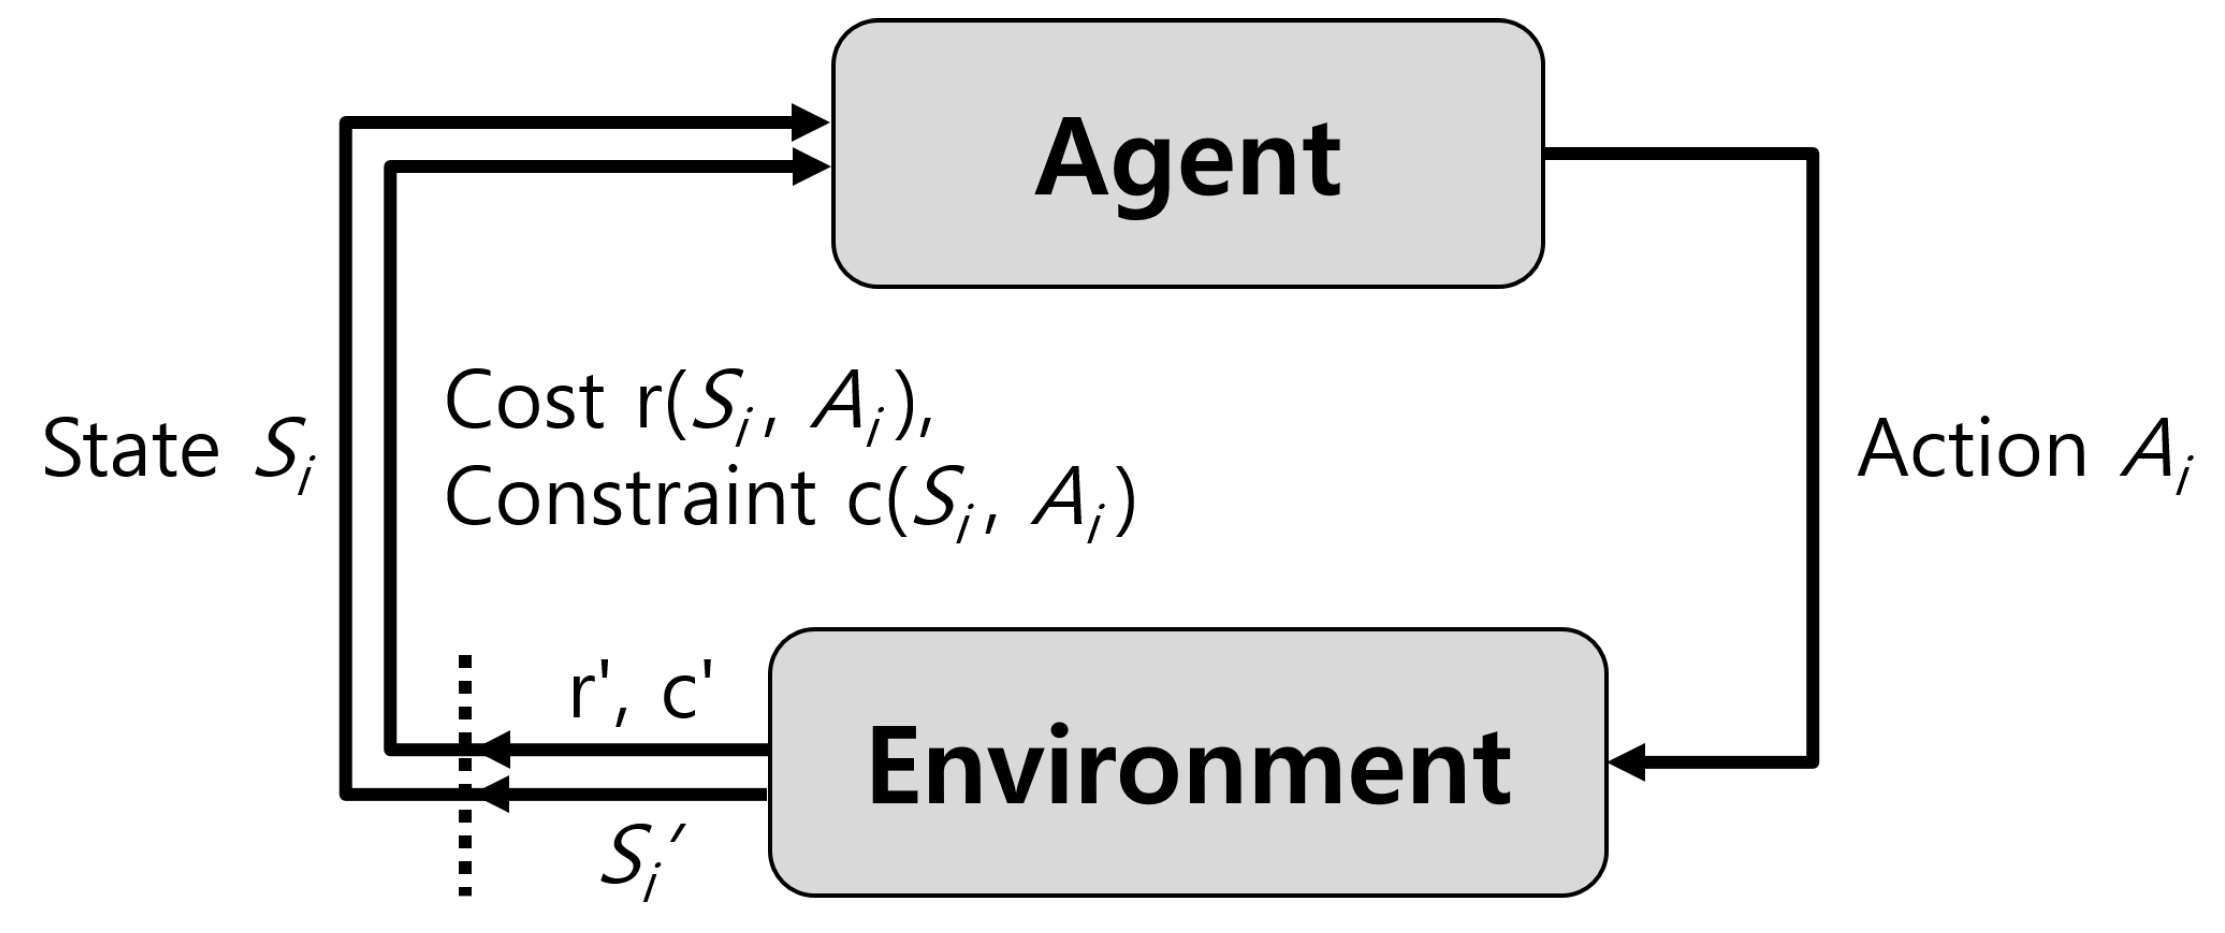
As shown in Figure 3, in the CMDP model, the agent executes a sequence of specific actions to minimize (or maximize) the cost (or reward) under given constraints [19]. In this paper, the service provider decides the amount of resources for each service for the next time period at the time epochs of to minimize the OPEX of the service provider while keeping the average response time of the services below their requirements. The Table A1 summarizes the important notations.
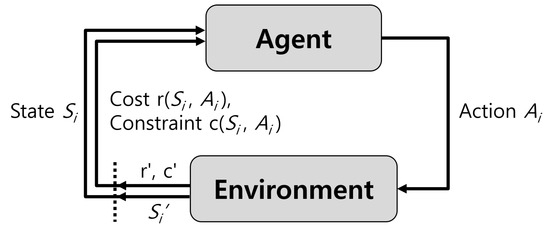
Figure 3.
CMDP process.
4.1. State Space
The overall state space is defined as
where denotes the state space for the remaining contract time. and represent the state spaces for the allocated resources and the popularity of the service i, respectively. is the state space for the queue length of the service i.
Since denotes the contract time, can be defined as
Let denote the maximum resources that can be allocated to one instance for the service i. Then, can be described as
Meanwhile, the popularity of the service i can be represented as the number of service requests during the time epoch. Then, can be described as
where denotes the maximum number of service requests during the time epoch.
When represents the maximum queue length, can be represented as
4.2. Action Space
The total action space can be defined as
where is the action space for the service i.
Since denotes the maximum resources that can be allocated for the service i, can be represented as
4.3. Transition Probability
Since T denotes the remained contract time, only when can allocated resource for the service i change based on the chosen action . That is, the transition of is affected by T and . Meanwhile, the popularity of the service i, , influences the incoming rate of the queue for the service i. In addition, the allocated resources for the service i, , affects the processing rate of the queue for that service. To sum up, the transition of is affected by and . The other states transit independently with each other. Thus, the transition probability from the current state S to the next state can be defined as
where T and are the current and next states of the remaining contract time. In addition, , , and (or , , and ) are the current (or next) states for the allocated resources, the popularity, and the queue length for the service i, respectively.
When the current contract time is over (i.e., ), the service provider requests the resources for the next contract period. Therefore, when , the next state for the remained contract time, , is always .
Meanwhile, when the current contract time is not over (i.e., ), the remained contract time decreases one by one. Thus, the corresponding transition probability can be represented as
The service provider periodically requests resources for the provision of the service i, and the request period is the contract time . That is, only when the current contract time is over (i.e., ) does the allocated resources for the service i, , change according to the requested resources . Therefore, the corresponding transition probabilities can be described as
and
It is assumed that the service processing rate for the service i with one resource unit follows an exponential distribution with the mean . Then, the probability that the service i is processed with the resources within the time epoch can be calculated as [20]. Since the processing rate is proportional to the allocated resources , the probability that the service i is processed within the time epoch is also proportional to the allocated resources . Meanwhile, the unit incoming rate is defined as the rate when the popularity of the service i is one. Then, the probability that the request for the service i with popularity arrives at the corresponding queue within the time epoch can be calculated as [20]. Based on these probabilities and , the corresponding transition probability can be defined as
Note that the transition probability of the popularity of the service i (i.e., ) can be defined by the popularity estimation model in Section 3.2.
4.4. Cost and Constraint Functions
We define here the cost function to minimize OPEX of the service provider. Since is the unit cost for using one resource unit during the contract time, the total cost for the services can be calculated as , which can be considered as the cost function . That is, .
We define the constraint function to maintain the average response time of the services below their requirements. Basically, the average response time of the service i is proportional to the queue length of the service i. That is, the queue length of the service i can represent the response time of the service i. Therefore, the constraint function for the service i can be defined as .
4.5. Optimization Formulation
The average OPEX of the service provider, , is defined as
where and are the state and the determined action at , respectively.
The average response time of the service i, , can be represented as
We can express the CMDP model as follows:
where is a policy that represents the probabilities of deciding a specific action at each state. Moreover, indicates the response time requirement of the service i.
To transform the CMDP model to an equivalent LP model, the stationary probabilities of state S and action A, , can be defined as the decision variables for the LP model. Consequently, the LP model can be obtained by
being subject to
and
The objective function, Equation (18), was used to minimize the average OPEX of the service provider. The constraint in Equation (19) was matched to the constraint of the CMDP model in Equation (17). Equation (20) presents the constraint for the Chapman–Kolmogorov equation. The constraints in Equations (21) and (22) ensure that the probability properties are satisfied.
The above LP model can be solved by a conventional algorithm such as Vaidya’s algorithm [21]. Then, we can obtain the optimal policy with a low complexity, which can be considered as the advantage of the transformation. Specifically, when using Vaidya’s algorithm, the computational complexity is , where n denotes the number of decision variables in the model. From the solution of the LP model, we can obtain the optimal stochastic policy for the CMDP model as
By means of the optimal stochastic policy (i.e., optimal probability distribution), Instead of utilizing the conventional LP solving algorithms, various deep reinforcement learning approaches [22,23] can be used to solve the CMDP model. The service provider requests appropriate resources to the cloud operator at a given state S.
5. Evaluation Results
To show the effectiveness of the PASPF on the average OPEX and the average response time, we designed the following comparison schemes: (1) NON-POP, where the service provider requests the same amount of resources for each service regardless of its popularity (note that the total requested resource amount in the NON-POP is same as that in PASPF); (2) MINIMUM, where the service provider requests the minimum amount of resources for each service; and (3) MAXIMUM, where the service provider requests the maximum amount of resources for each service.
The default values for the parameters are described as follows. The service processing rate and the unit incoming rate were set to 0.05 and 0.1, respectively. The unit cost for using one resource unit during the contract time was 1.
5.1. Effect of
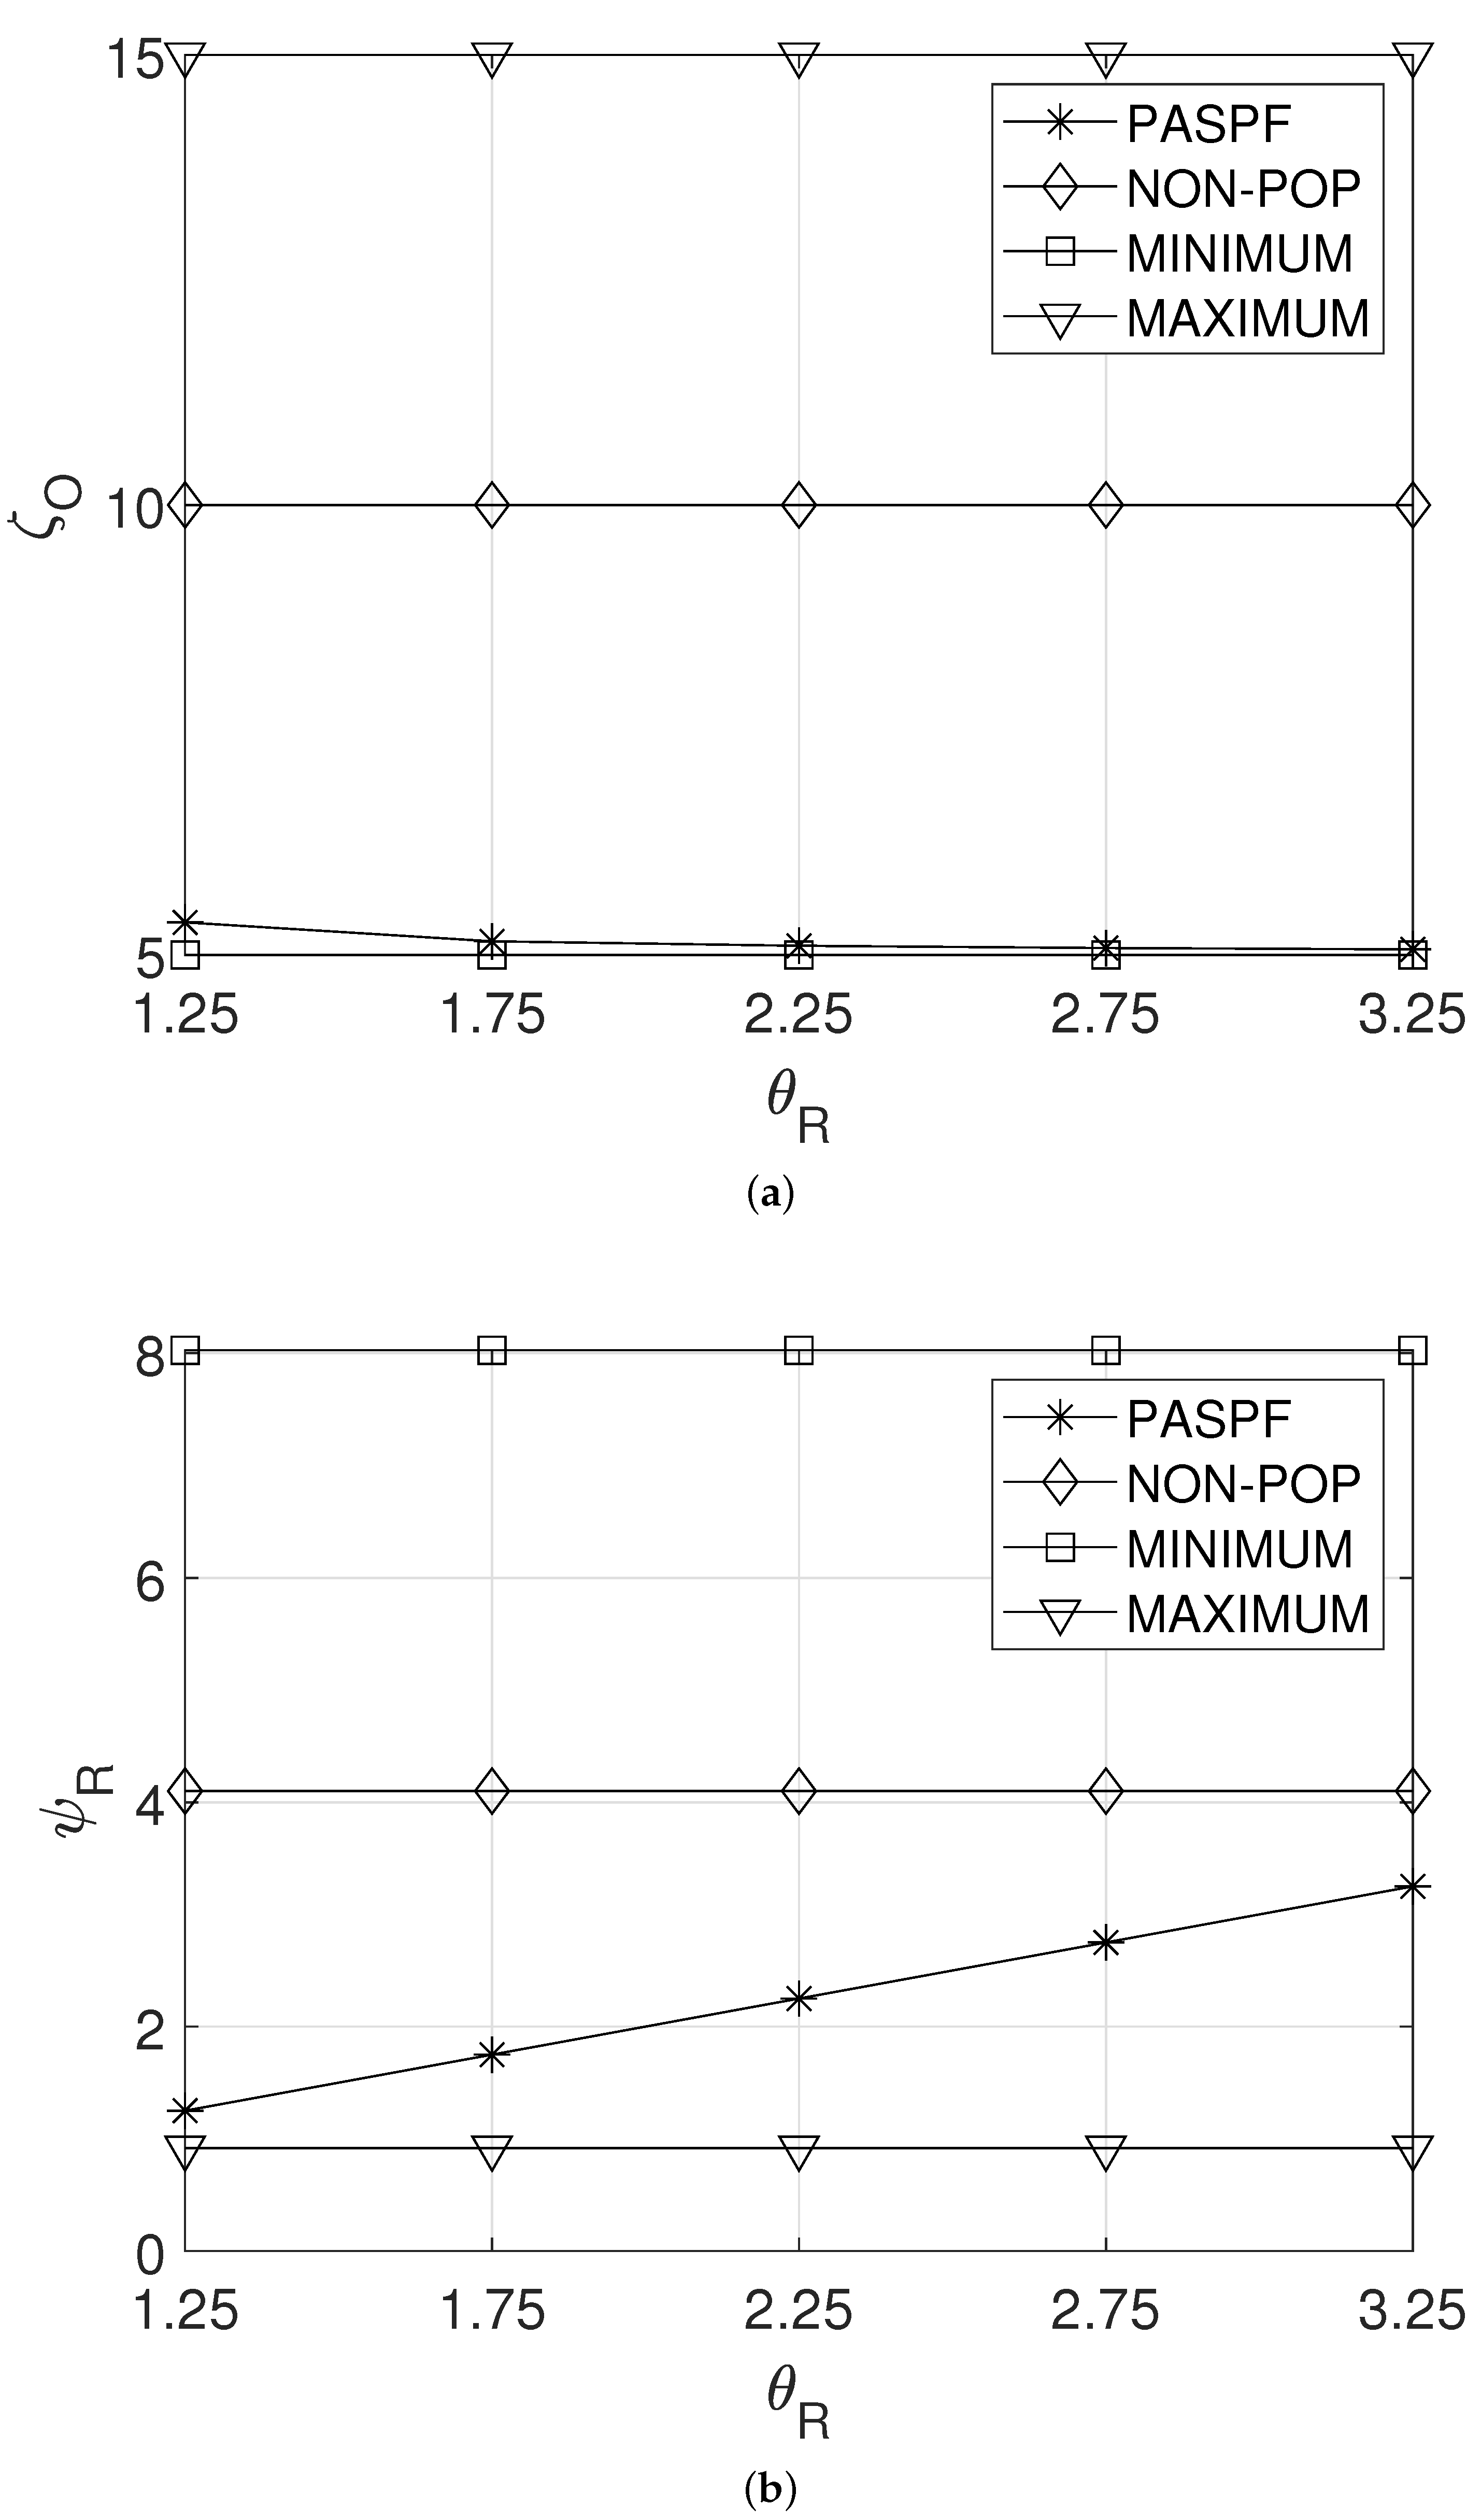
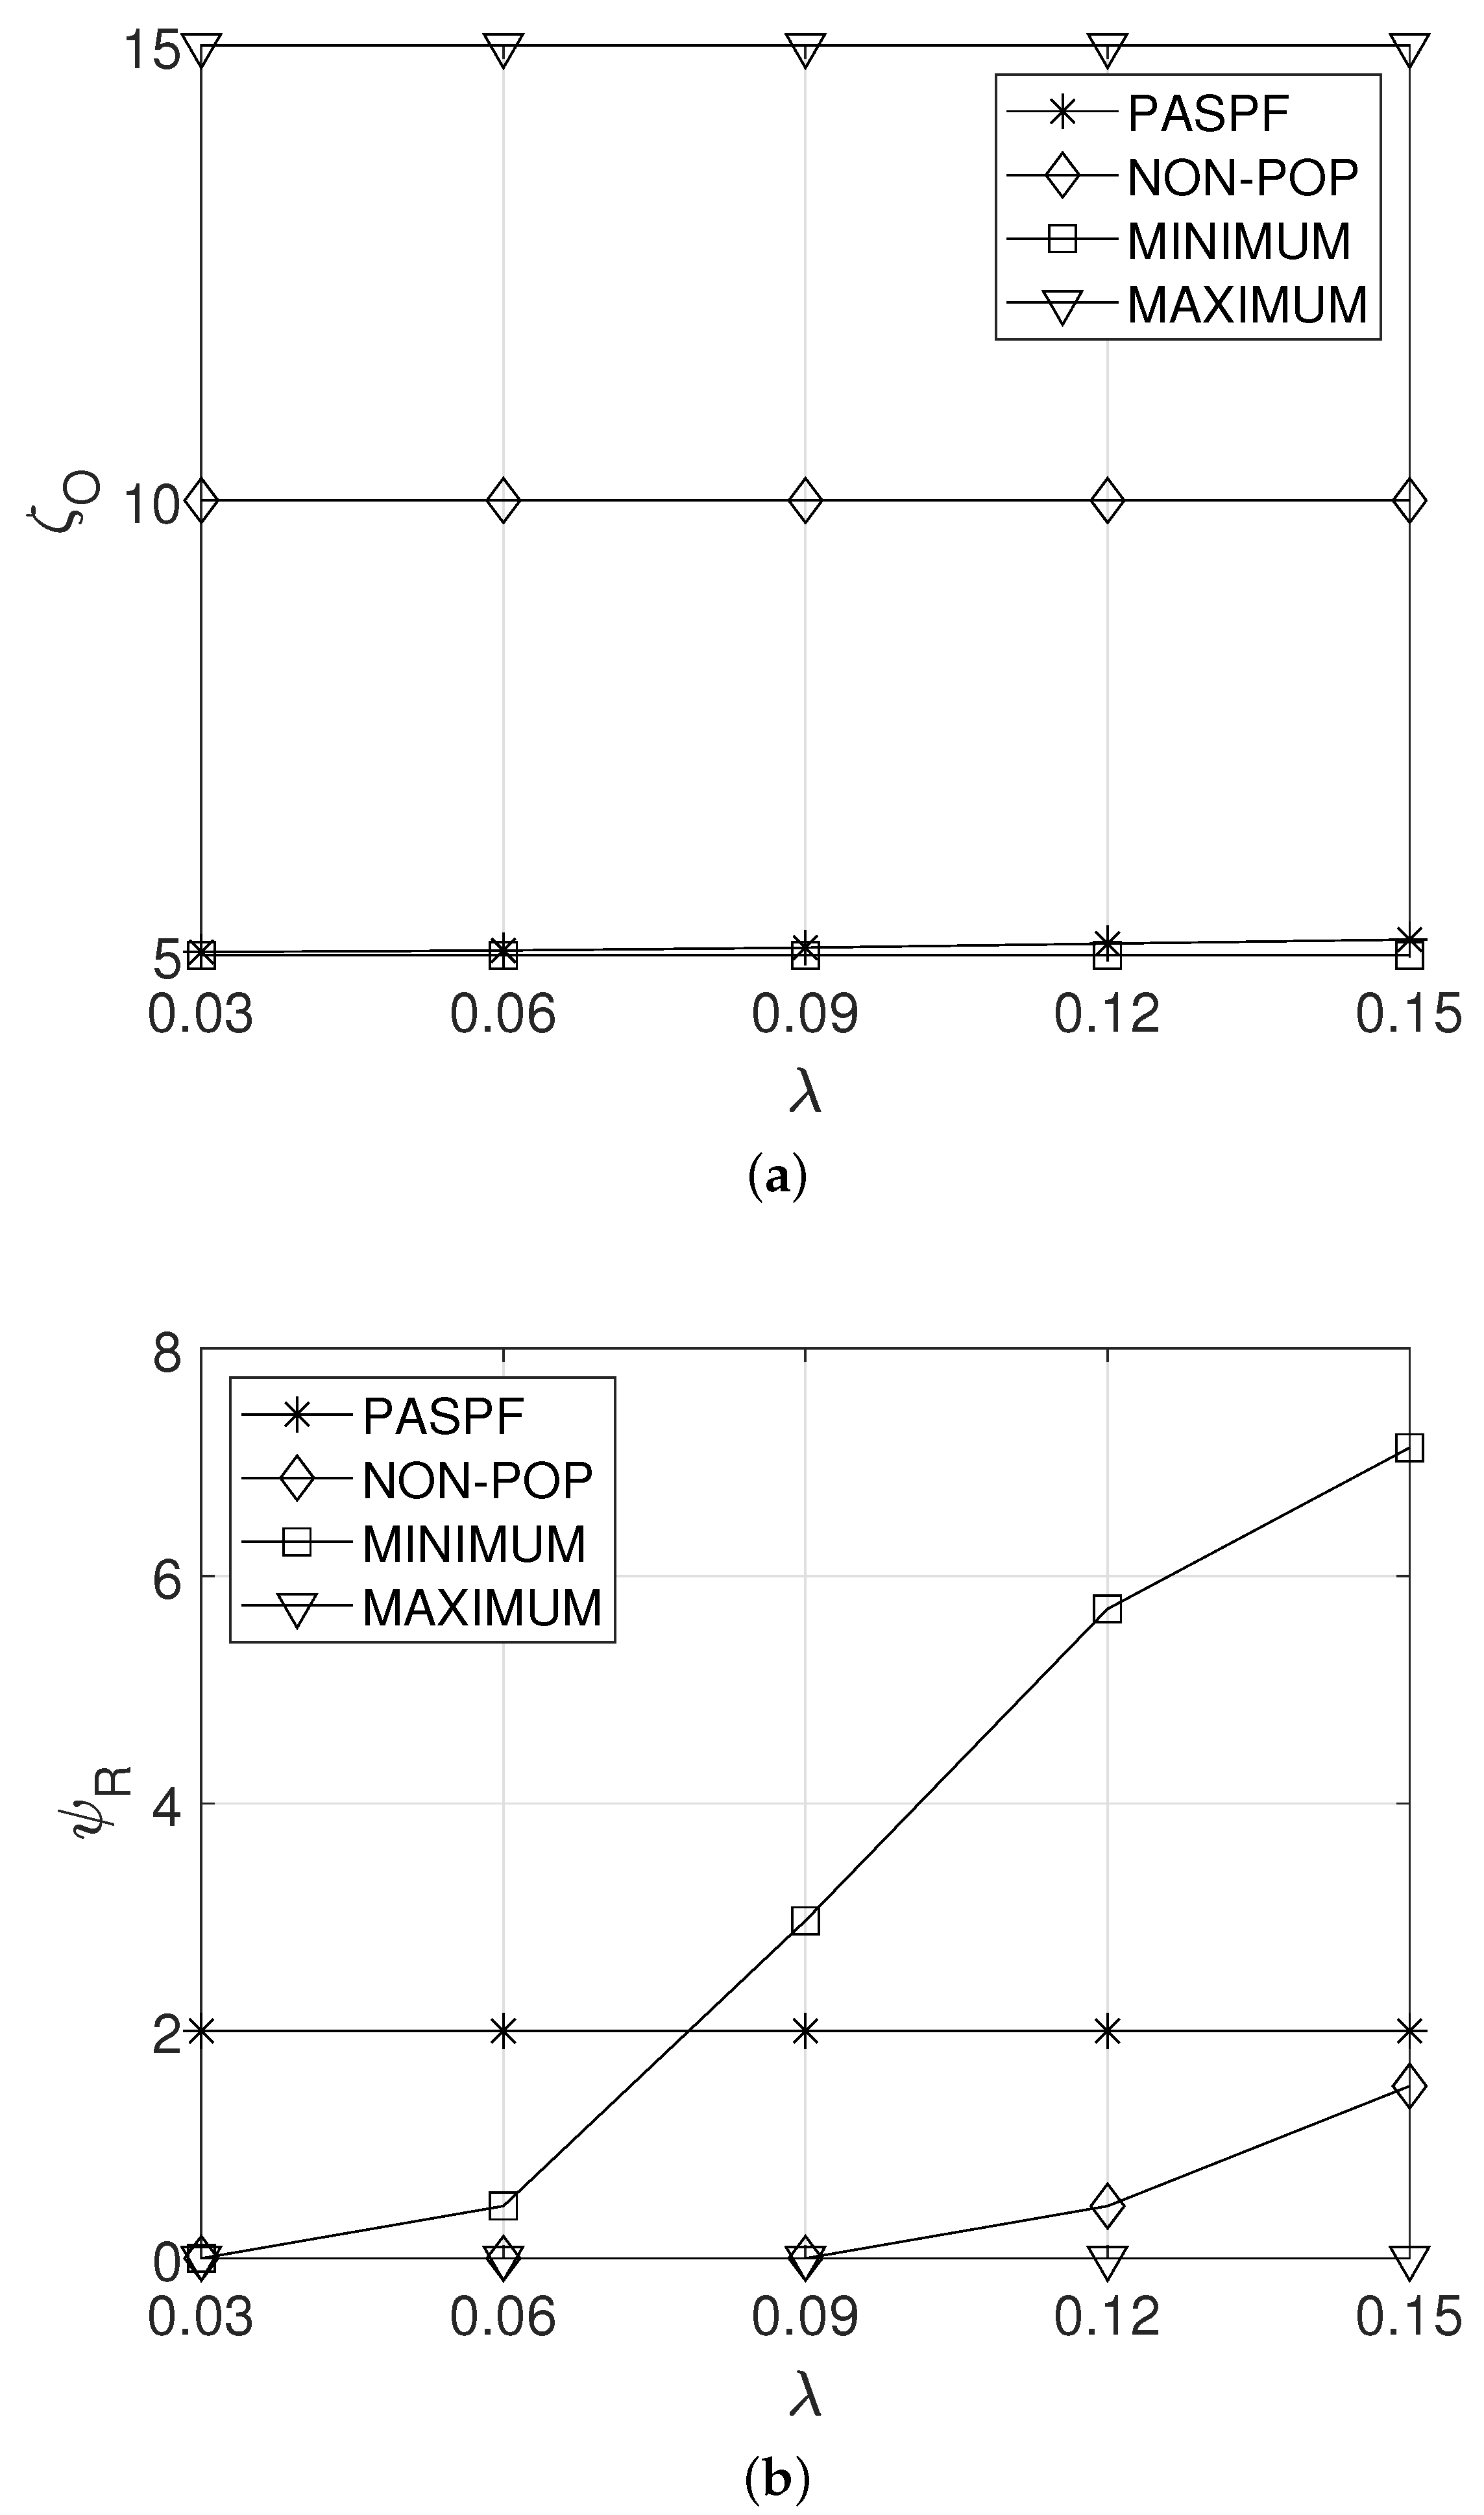
Figure 4a,b show the effect of the response time requirement of the service, , on the average OPEX of the service provider and the average response time of the service, and , respectively. From Figure 4a, it can be observed that the average OPEX, , of PASPF decreased as increased. This can be explained in the following way. A large implies that the service does not require a tight response time. ThePASPF recognizes this fact and then requests less resources for the service. Thus, as shown in Figure 4b, a longer average response time of the service is expected. Note that the average response time of the service of the PASPF did not exceed the response time requirement of the service . In contrast, the other comparison schemes maintained their policy even when the service required a more relaxed response time. Thus, their and were constant regardless of (see Figure 4a,b).

Figure 4.
Effect of the response time requirement of the service. (a) Average OPEX of the service provider. (b) Average response time of the service.
5.2. Effect of
Figure 5a,b show the effect of the unit incoming rate on the average OPEX of the service provider and the average response time of the service , respectively. A higher unit incoming rate indicates that more resources should be requested to maintain a sufficiently low response time. However, since the comparison schemes did not consider the incoming rate, their OPEXs remained constant regardless of (see Figure 5a). On the other hand, the PASPF requested more resources when a higher unit incoming rate was given. Thus, its OPEX slightly increased with the increase in the unit incoming rate. However, the average response time of the PASPF can be maintained below the response time requirement (see Figure 5b). Meanwhile, since MINIMUM requests insufficient resources, it had the lowest OPEX (see Figure 5a), but its average response time significantly increased as the unit incoming rate increased (see Figure 5b). Even though MAXIMUM can achieve the lowest average response time of the service (see Figure 5b), its OPEX is highest (see Figure 5a). In addition, the average response time of the NON-POP could be maintained below the response time requirement (see Figure 5b), but its OPEX was higher than those of the PASPF and MINIMUM (see Figure 5a). This means that the NON-POP always requests an excessive amount of resources regardless of popularity.
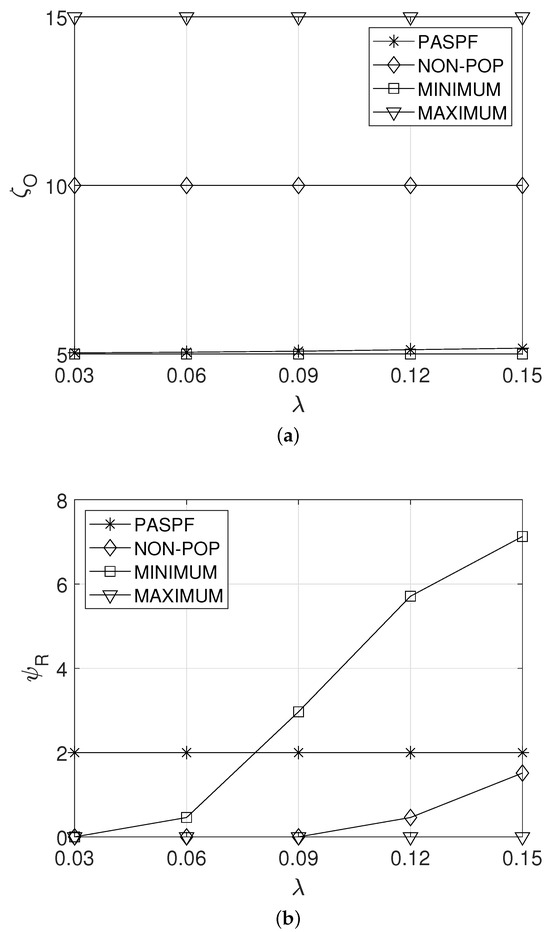
Figure 5.
Effect of the unit incoming rate. (a) Average OPEX of the service provider. (b) Average response time of the service.
5.3. Effect of
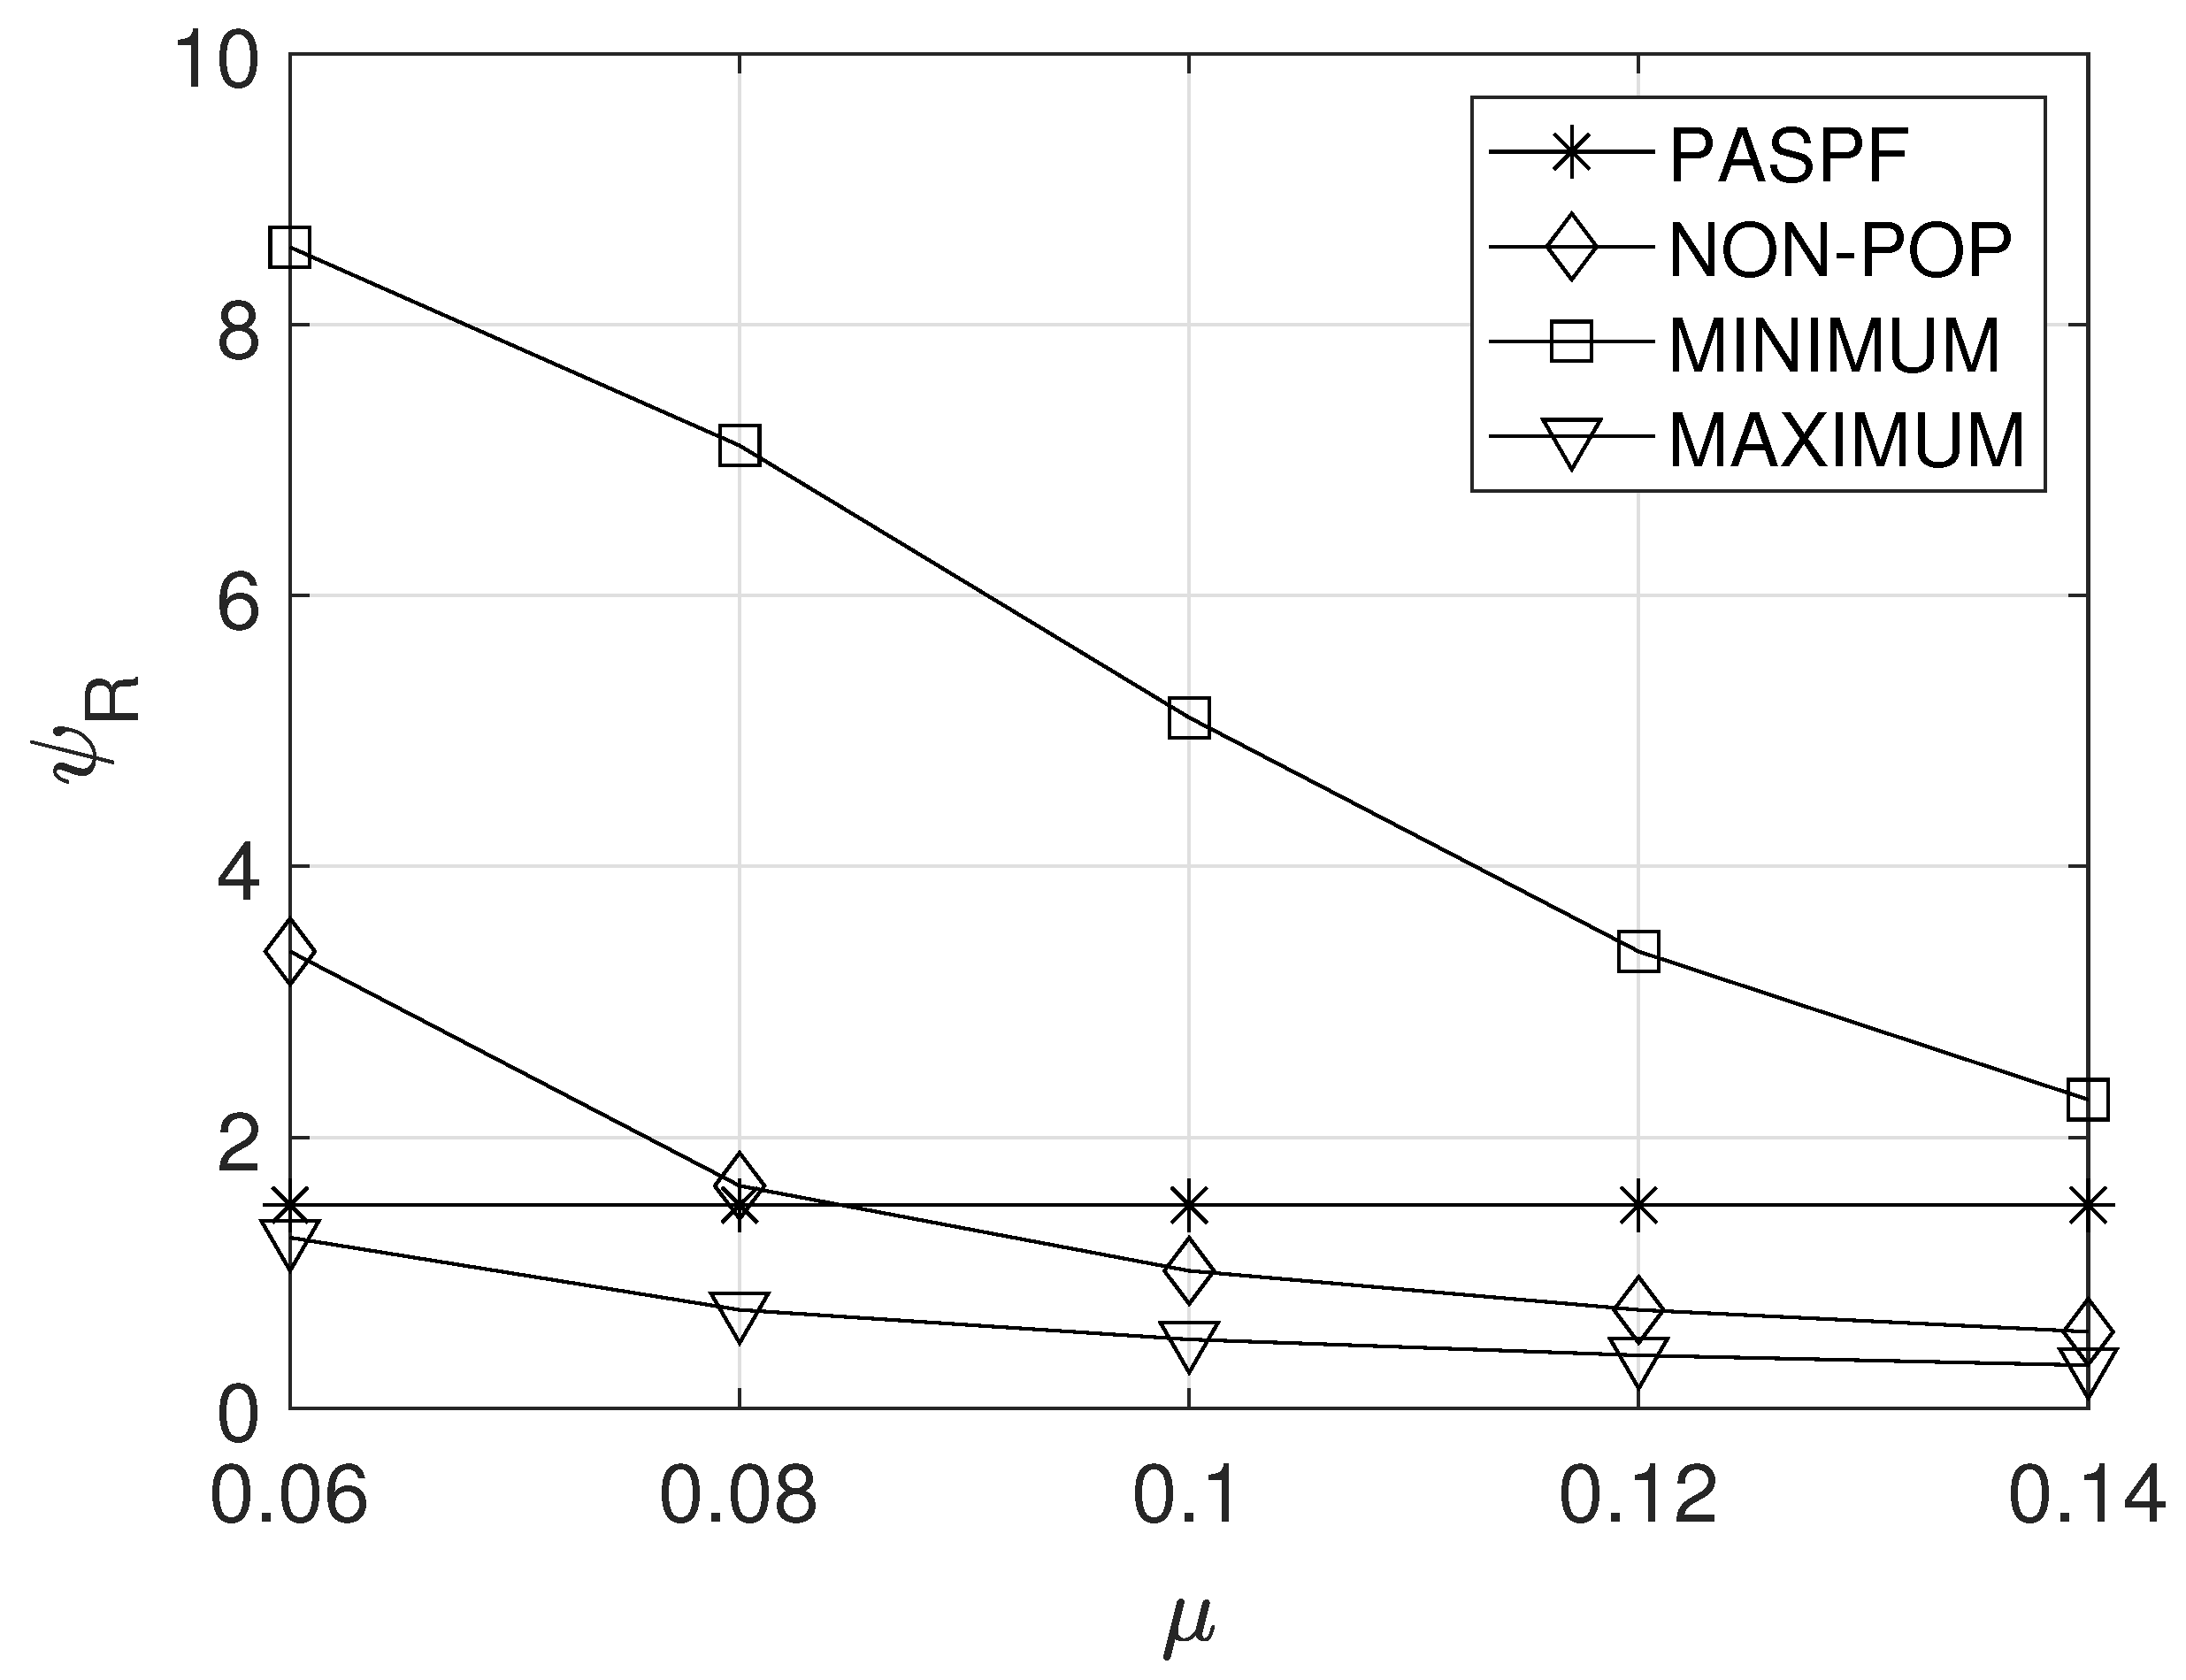
Figure 6 shows the effect of the service processing rate with one resource unit, , on the average response time of the service. From Figure 6, it can be shown that the average response time of the comparison schemes decreased as increased. This can be explained in the following way. Basically, the comparison schemes request a fixed amount of resources for each service. Thus, the increment of leads to the shorter average queue length for each service, which can reduce the average response time. Specifically, since MAXIMUM requests a sufficient amount of resources, the increment of slightly reduced the average response time. On the other hand, due to the insufficient amount of resources in MINIMUM, the increment of had a significant impact on the average response time.

Figure 6.
Effect of the service processing rate with one resource unit on the average service response time.
On the other hand, as increases, the PASPF requests smaller amount of resources for each service to reduce OPEX. Therefore, its average response time of the service di not decrease with the increase of .
5.4. Effect of
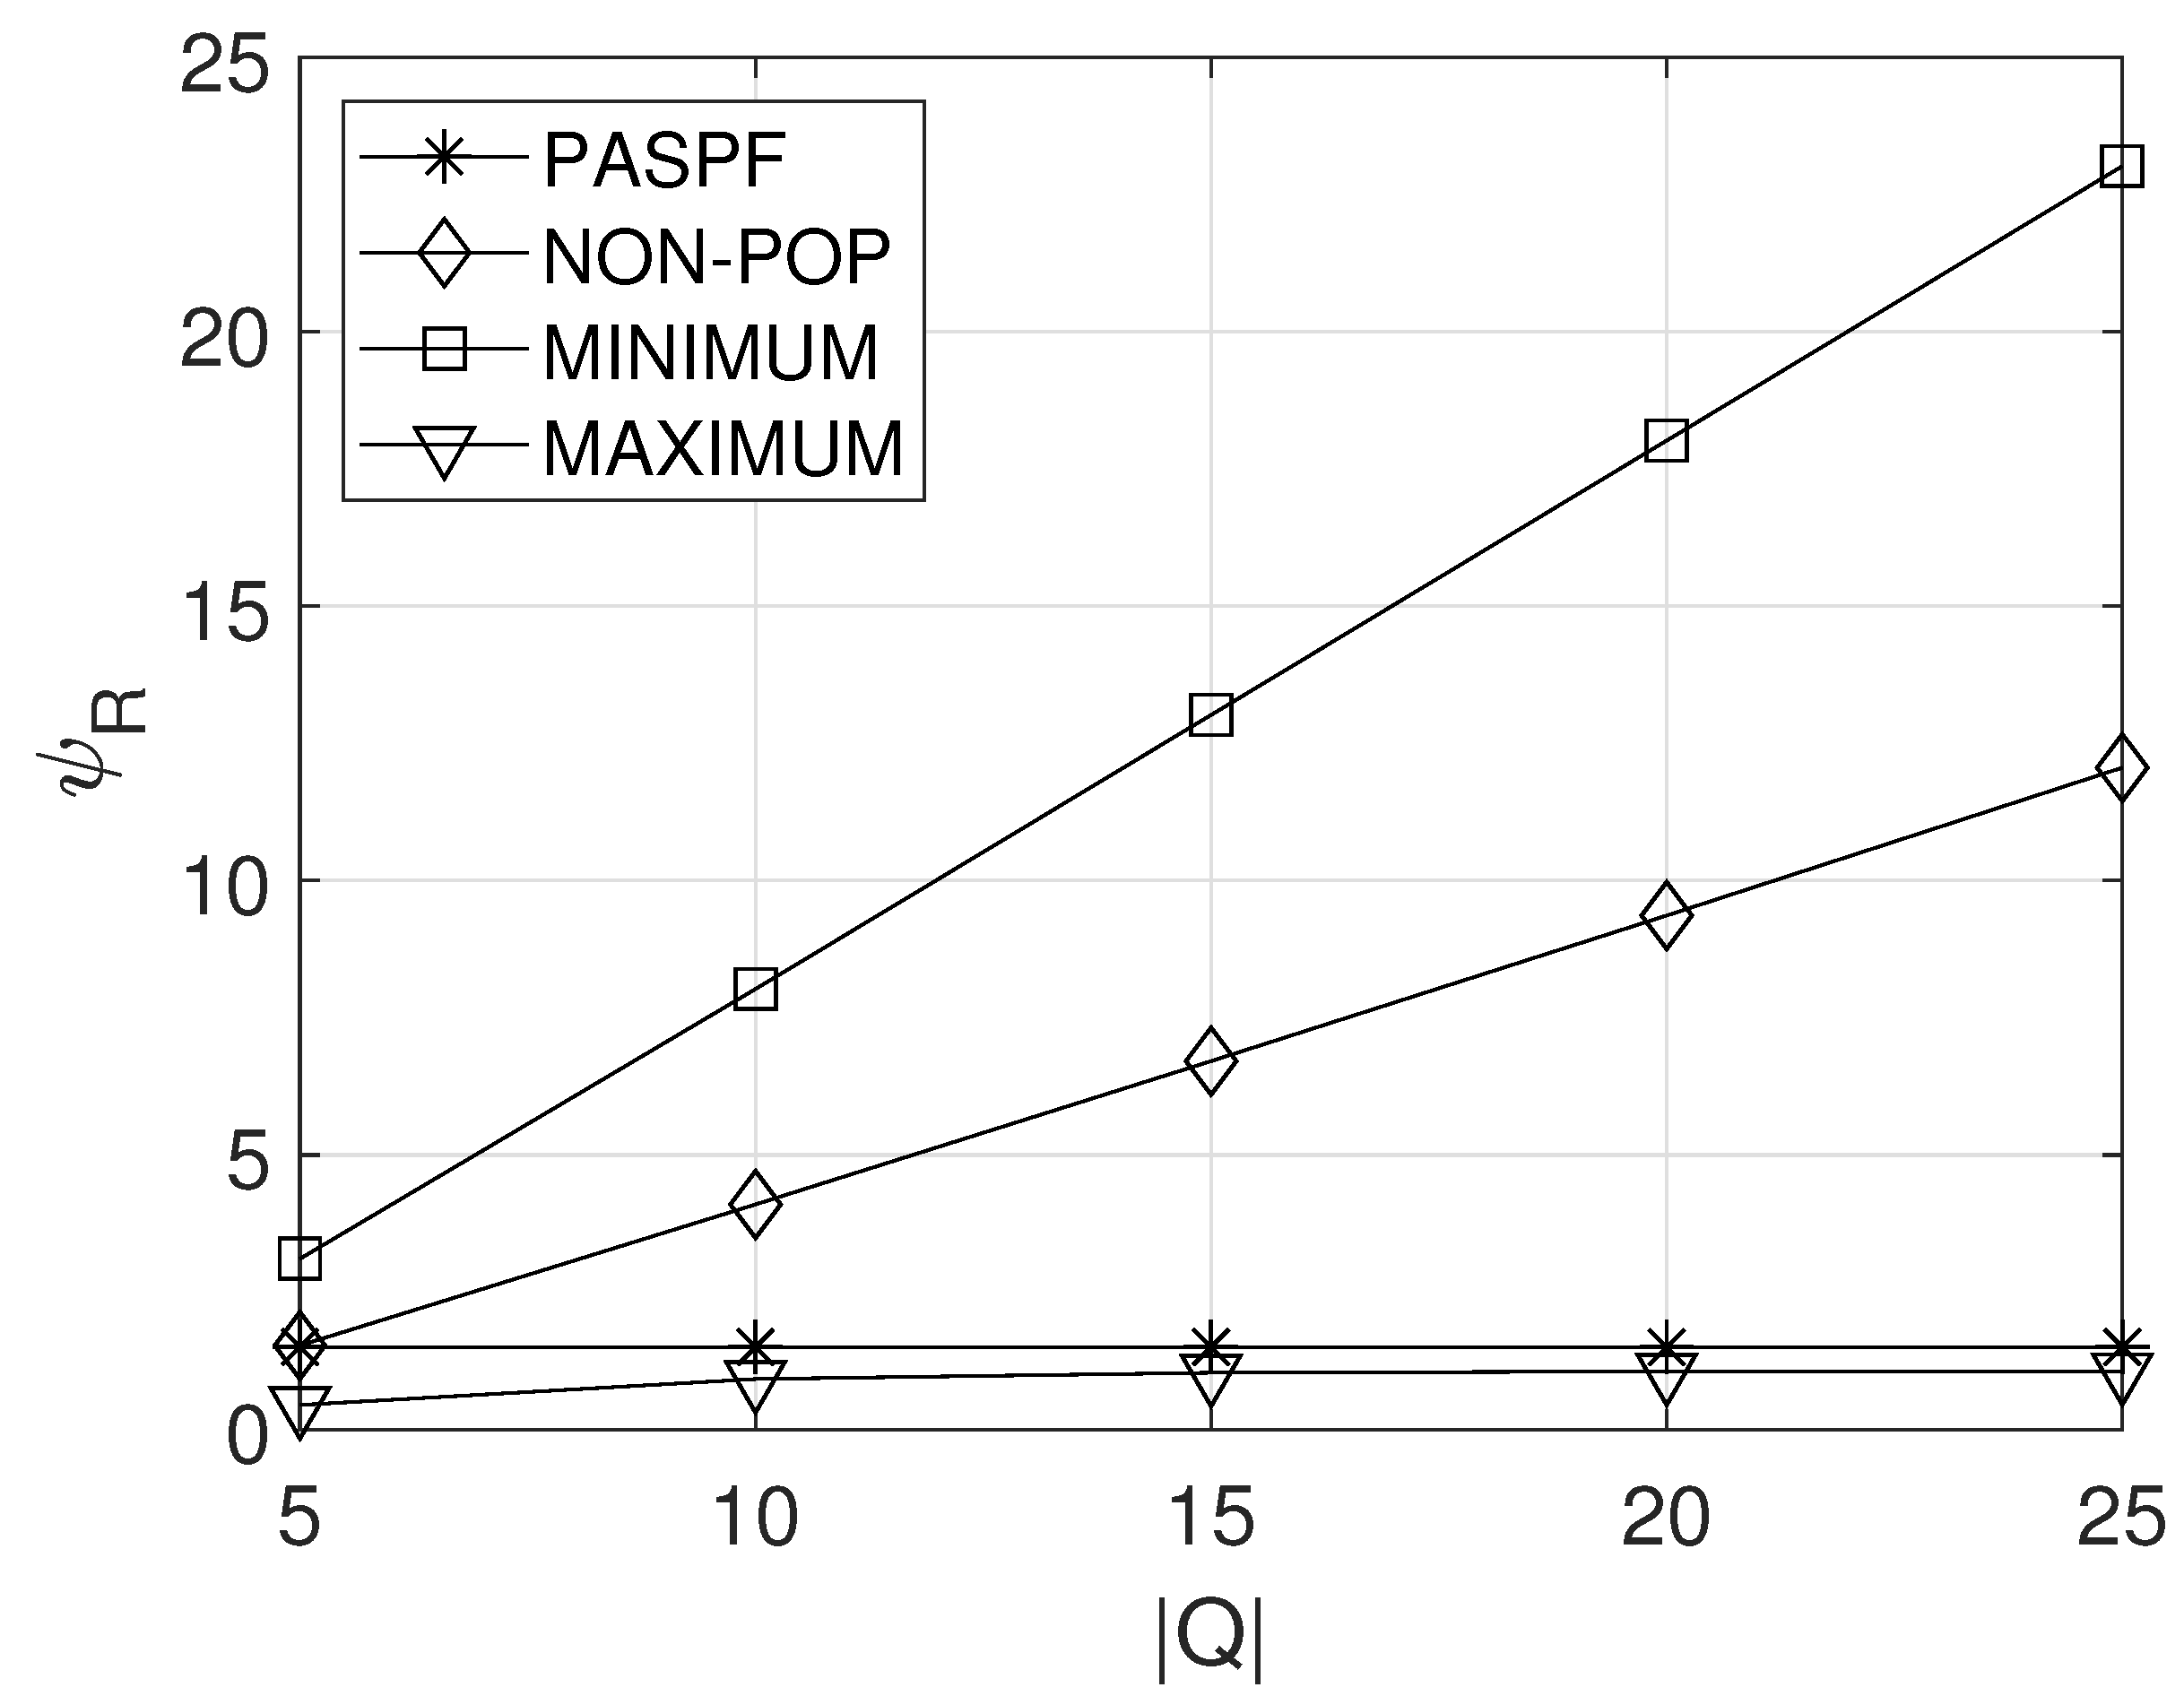
Figure 7 shows the effect of the maximum queue length on the average service response time . Basically, as the maximum queue length increased, the average queue length naturally increasds when the same service processing rate was given (i.e., when the same resources were requested). This is because the probability that the service dropped due to the fully-occupied queue decreases. Therefore, from Figure 7, it can be observed that the average service response time of the comparison schemes increased with the increase in . Meanwhile, since the PASPF adjusts the amount of requested resources by considering the maximum queue length, its average service response time could be maintained at the same level.

Figure 7.
Effect of the maximum queue length on the average service response time.
6. Conclusions
This paper designed a popularity-aware service provisioning framework (PASPF), in which a service provider inquires about the popularity variant of services by sending a request to NWDAF. The analytics were then used to decide appropriate the amount of resources requested to the cloud operator for the following billing cycle. To minimize the service provider’s OPEX while keeping the average response time of the services below their requirements, a CMDP was formulated. By transforming the CMDP model into an LP model, the optimal stochastic policy was achieved. The evaluation results show that, compared to a popularity-non-aware scheme, the PASPF can save over OPEX on service provider costs while guaranteeing sufficiently low average response times. In our future work, the proposed framework will be extended to consider the dynamicity of the network status, such as bandwidth and congestion, in order to analyze the impact of the dynamicity on performance.
Author Contributions
Conceptualization, H.K.; methodology, H.K.; software, Y.K. (Yumi Kim) and B.K.; validation, H.K. and Y.K. (Yeunwoong Kyung); formal analysis, H.K.; investigation, Y.K. (Yeunwoong Kyung); writing—original draft preparation, H.K. and Y.K. (Yeunwoong Kyung); supervision, Y.K. (Yeunwoong Kyung). All authors have read and agreed to the published version of the manuscript.
Funding
This research was supported by the National Research Foundation (NRF) of Korea Grant funded in part by the Korean Government (MSIP) (No. RS-2024-00340698) and in part by a grant from Kyung Hee University in 2023 (KHU-20233236).
Informed Consent Statement
Not applicable.
Data Availability Statement
The raw data supporting the conclusions of this article will be made available by the authors on request.
Conflicts of Interest
The authors declare no conflicts of interest.
Appendix A

Table A1.
Important notations.
Table A1.
Important notations.
| Notation | Description |
|---|---|
| Overall state space | |
| State space for the remained contract time | |
| State space for the allocated resources of the service i | |
| State space for the popularity of the service i | |
| State space for the queue length of the service i | |
| Contract time | |
| Maximum resources that can be allocated to one instance for the service i | |
| Maximum number of service requests during the time epoch | |
| Maximum queue length | |
| Overall action space | |
| Action space of the service i | |
| Average service processing time of the service i with one resource unit | |
| Unit incoming rate of the service | |
| Time epoch | |
| Unit cost for using one resource unit during the contract time | |
| Average OPEX of the service provider | |
| Average response time of the service i | |
| Average |
References
- Gartner Forecasts Worldwide Public Cloud End-User Spending to Supass $675 Billion in 2024. Available online: https://www.gartner.com/en/newsroom/press-releases/2024-05-20-gartner-forecasts-worldwide-public-cloud-end-user-spending-to-surpass-675-billion-in-2024 (accessed on 10 July 2024).
- IaaS vs. PaaS vs. SaaS. Available online: https://www.redhat.com/en/topics/cloud-computing/iaas-vs-paas-vs-saas (accessed on 10 July 2024).
- PaaS vs. IaaS vs. SaaS vs. CaaS: How are They Different. Available online: https://cloud.google.com/learn/paas-vs-iaas-vs-saas?hl=en (accessed on 24 July 2024).
- Dimitri, N. Pricing Cloud IaaS Computing Services. J. Cloud Comput. 2020, 9, 14. [Google Scholar] [CrossRef]
- Li, S.; Huang, J.; Cheng, B. Resource Pricing and Demand Allocation for Revenue Maximization in IaaS Clouds: A Market-Oriented Approach. IEEE Trans. Netw. Serv. Manag. 2021, 18, 3460–3475. [Google Scholar] [CrossRef]
- Amazon EC2 Spot Instances Pricing. Available online: https://aws.amazon.com/ec2/spot/pricing/?nc1=h_ls (accessed on 10 July 2024).
- Wen, Z.; Cala, J.; Watson, P.; Romanovsky, A. Cost Effective, Reliable and Secure Workflow Deployment over Federated Clouds. IEEE Trans. Serv. Comput. 2017, 10, 929–941. [Google Scholar] [CrossRef]
- Shi, T.; Ma, H.; Chen, G.; Hartmann, S. Cost-Effective Web Application Replication and Deployment in Multi-Cloud Environment. IEEE Trans. Parallel Distrib. Syst. 2022, 33, 1982–1995. [Google Scholar] [CrossRef]
- Menzel, M.; Ranjan, R.; Wang, L.; Khan, S.U.; Chen, J. CloudGenius: A Hybrid Decision Support Method for Automating the Migration of Web Application Clusters to Public Clouds. IEEE Trans. Comput. 2015, 64, 1336–1348. [Google Scholar] [CrossRef]
- Wu, Y.; Wu, C.; Li, B.; Zhang, L.; Li, Z.; Lau, F.C.M. Scaling Social Media Applications Into Geo-Distributed Clouds. IEEE/ACM Trans. Netw. 2015, 23, 689–702. [Google Scholar] [CrossRef]
- Deng, S.; Xiang, Z.; Taheri, J.; Khoshkholghi, M.A.; Yin, J.; Zomaya, A.Y.; Dustdar, S. Optimal Application Deployment in Resource Constrained Distributed Edges. IEEE Trans. Mob. Comput. 2021, 20, 1907–1923. [Google Scholar] [CrossRef]
- Chen, X.; Tang, S.; Lu, Z.; Wu, J.; Duan, Y.; Huang, S.C.; Tang, Q. iDiSC: A New Approach to IoT-Data-Intensive Service Components Deployment in Edge-Cloud-Hybrid System. IEEE Access 2019, 7, 59172–59184. [Google Scholar] [CrossRef]
- Chen, F.; Zhou, J.; Xia, X.; Jin, H.; He, Q. Optimal Application Deployment in Mobile Edge Computing Environment. In Proceedings of the IEEE 13th International Conference on Cloud Computing (CLOUD), Beijing, China, 19–23 October 2020. [Google Scholar]
- Chen, J.; Wu, H.; Yang, P.; Lyu, F.; Shen, X. Cooperative Edge Caching with Location-Based and Popular Contents for Vehicular Networks. IEEE Trans. Veh. Technol. 2020, 69, 10291–10305. [Google Scholar] [CrossRef]
- Deng, S.; Xiang, Z.; Yin, J.; Taheri, J.; Zomaya, A. Composition-Driven IoT Service Provisioning in Distributed Edges. IEEE Access 2018, 6, 54258–54269. [Google Scholar] [CrossRef]
- Wu, T.; Fan, X.; Qu, Y.; Yang, P. MobiEdge: Mobile Service Provisioning for Edge Clouds with Time-varying Service Demands. In Proceedings of the IEEE 27th International Conference on Parallel and Distributed Systems (ICPADS), Beijing, China, 14–16 December 2021. [Google Scholar]
- 3GPP TS 23.288; Architecture Enhancements for 5G System (5GS) to Support Network Data Analytics Services (Release 18). 3GPP: France, Paris, 2024.
- IP Network Traffic Flows Labeled with 75 Apps. Available online: https://www.kaggle.com/code/kerneler/starter-ip-network-traffic-flows-49778383-1/notebook (accessed on 10 July 2024).
- Ko, H.; Pack, S.; Leung, V. An Optimal Battery Charging Algorithm in Electric Vehicle-Assisted Battery Swapping Environments. IEEE Trans. Intell. Transp. Syst. 2022, 23, 3985–3994. [Google Scholar] [CrossRef]
- Ko, H.; Pack, S. Function-Aware Resource Management Framework for Serverless Edge Computing. IEEE Internet Things J. 2023, 10, 1310–1319. [Google Scholar] [CrossRef]
- Wikipedia. Linear Programming. Available online: https://en.wikipedia.org/wiki/Linear_programming (accessed on 12 July 2024).
- Zhang, L.; Ma, X.; Zhuang, Z.; Xu, H.; Sharma, V.; Han, Z. Q-Learning Aided Intelligent Routing with Maximum Utility in Cognitive UAV Swarm for Emergency Communications. IEEE Trans. Veh. Technol. 2023, 72, 3707–3723. [Google Scholar] [CrossRef]
- Zhang, L.; Jia, X.; Tian, N.; Hong, C.; Han, Z. When Visible Light Communication Meets RIS: A Soft Actor–Critic Approach. IEEE Wirel. Commun. Lett. 2024, 13, 1208–1212. [Google Scholar] [CrossRef]
Disclaimer/Publisher’s Note: The statements, opinions and data contained in all publications are solely those of the individual author(s) and contributor(s) and not of MDPI and/or the editor(s). MDPI and/or the editor(s) disclaim responsibility for any injury to people or property resulting from any ideas, methods, instructions or products referred to in the content. |
© 2024 by the authors. Licensee MDPI, Basel, Switzerland. This article is an open access article distributed under the terms and conditions of the Creative Commons Attribution (CC BY) license (https://creativecommons.org/licenses/by/4.0/).