Abstract
In the process of tunnel construction, problems such as high-stress rockburst, large deformation of soft rock, water inrush and mud gushing, secondary cracking of linings, blasting interference, man-made damage, and mechanical damage are often encountered. These pose a great challenge to the installation of monitoring equipment and line protection. In order to solve these problems, the 2# inclined shaft of Muzhailing Tunnel in the Gansu Province of China, which exists under high stress, water bearing, and bias conditions, was taken as the research object in this paper. By assembling a string, drilling grouting and sealing, and introducing multiple modes of protection, new fiber grating sensor group installation and line protection methods were proposed. The automatic continuous monitoring of the deep deformation of surrounding rock and the automatic continuous monitoring of steel arch stress were realized. The field monitoring results showed that: (1) the fiber grating displacement sensor group could be used to verify the authenticity of the surface displacement results monitored by the total station; (2) the NPR anchor cable coupling support effectively limited the large deformation of soft rock and the expansion of surrounding rock in a loose circle, and the range of the loose circle was stable at about 1 m; and (3) the main influence range of blasting was at a depth of 0~5 m in surrounding rock, and about 25 m away from the working face. In addition, to secure weak links in the steel arch due to the hardening phenomenon, a locking tube was set at the arch foot. In the support design, the fatigue life of the steel was found to be useful as the selection index for the steel arch frame to ensure the stability of the surrounding rock and the long-term safety of the tunnel. The present research adopted a robust method and integrates a variety of sensor technologies to provide a multifaceted view of the stresses and deformations encountered during the tunneling process, and the effective application of the above results could have certain research and reference value for the design and monitoring of high stress, water-bearing, and surrounding rock supports in tunnels.
1. Introduction
Field monitoring can provide basic data for the smooth implementation of tunnel support, which is crucial for the development of tunnel support engineering techniques. Its main purposes are to grasp the dynamics and stability of the contribution of tunnel-surrounding rock, to provide a scientific basis for the daily dynamic management of tunnel support, and to provide a reference for the design and construction of other similar projects. Additionally, it aids in the detection of construction hazards in time to ensure construction safety. It can also be used to verify the rationality of supporting structures, design parameters, and construction, and to provide a scientific basis for the modification and optimization of supporting parameters. In addition, it can also provide standards for quality inspection and the acceptance of tunnel engineering. In order to study the nucleation and evolution mechanism of rockbursts, comprehensive monitoring activities consisting of a digital borehole camera, a cross-hole sonic instrument, and a sliding micrometer was considered to carry out in situ measurements in two specially excavated test tunnels, marked as B and F [1]. AE monitoring was used to validate possible rockburst detection and to collectively analyze the obtained data to demonstrate its effectiveness in safety control during hard bedrock excavation [2]. Two monitoring sections of different lithology were tested using a multi-point displacement meter and wave velocity tomography technology. The results showed that when the excavation face exceeded a very small distance from the monitoring section, a large amount of deformation had already occurred in both monitoring sections [3]. Both commercial and developed corrosion sensors based on electrochemical and fiber Bragg grating techniques were adopted to evaluate the status of stress and corrosion in the Xiamen Xiang’an Subsea Tunnel [4]. A new roadway convergence monitoring system based on draw-wire displacement sensors was adopted in a gold mine in Shandong Province. These were very important for deformation monitoring of the tunnel sections. The convergence monitoring system could realize continuous monitoring with easy installation, no artificial companions, no safety loopholes, and no interference with the normal operation of tunnels and roadways [5]. Ariznavarreta-Fernandez proposed a tunnel convergence measurement system called CANG (Convergence via Angular Sensor), which could monitor the position of wire points around the work area. This measurement system recorded the angle and length of each wire at each moment, and determined the shape and convergence value of the wire [6]. In order to monitor and evaluate the stability of rock mass under tunnel boring machine (TBM) excavation, an advanced microseismic (MS) monitoring system was established [7]. In addition, existing tunnel surface displacement monitoring methods include automatic tracking total station observation technology and digital close-range photogrammetry [8,9].
Compared with traditional sensing technology, optical fiber sensing technology provides flexible installation options. Each FBG sensor corresponds to a specific position, and multiple sensors can be connected in series for multi-point measurement [10]. This technology has the advantages of small size, light weight, long distance, good real-time performance, corrosion resistance, ease of reuse, anti-electromagnetic interference, dexterity, and good long-term stability [11,12,13,14]. It is particularly suitable for use in harsh construction conditions, and is not affected by fire, explosions, or strong electromagnetic radiation. One pertinent use of optical fiber is in the monitoring of surface displacement caused by tunnel excavation [15]. An optical fiber distributed sensing method has also been used for deformation monitoring of a foundation pit [16]. Some of the other applications of this method have included the application of distributed sensing technology to the construction and operation of railway tunnels [17], monitoring the cyclic performance of concrete tunnel lining sections [18], assessing the safety of tunnel structures [19], and monitoring the corrosion of steel bars in concrete [20].
As an important part of the primary support structure and the main bearing structure, the steel arch plays a key role in preventing the collapse of tunnels and controlling the loose deformation of the surrounding rock in the tunnel considering high ground stress and weak surrounding rock. Khan found that the strength and stiffness behavior of tunnel steel braces were highly dependent on the degree of constraint applied to the support vault [21]. The results showed that the prestressed steel arch structure could provide effective support, and the stress gradually decreased from one force point to the arch foot line. In addition, the stress distribution of the surrounding rock caused by the prestressed steel arch had a certain uniformity, but from the theoretical point of view, the construction method of squeezing the surrounding rock using the prestressed steel arch was feasible [22]. Chen analyzed the use of a locking bolt and steel arch in the weak surrounding rock of a tunnel. The results showed that the welding part was the weakest part of the locking bolt, and that it should be firmly reinforced [23]. According to the theory of circular beams on elastic foundations and the stress measurement of steel arches, Wen deduced an analytical solution for the internal force of combined supports [24]. In a study on the characteristics of a flexible support, a method for predicting the stability of the support based on the strain measurement of the steel arch was proposed. The field test showed that this method could gauge the safety and stability level of surrounding rock and the initial support [25]. In the stress measurement of a tunnel steel arch, one study used a steel string surface strain sensor, dial gauge, and steel bar stress sensor [26]. However, the aforementioned traditional steel frame stress measurement method has problems such as error fluctuation, an obvious size effect, and the inability to automatically monitor. This method is not convenient for remote measurement, and the connection cable is vulnerable to damage, while also being prone to causing short-circuiting.
However, in the process of tunnel construction, problems such as high stress rockbursts, soft rock deformation, water inrush, secondary lining cracking, blasting interference, man-made damage, and mechanical damage are often encountered. These all pose great challenges to the installation of monitoring equipment and the protection of lines. However, the short aperture of fiber itself, the brittleness of its texture, and difficulties relating to further crushing limit the wide application of fiber grating technology. In order to study the variation law of deep surrounding rock deformation with time, the supporting effect of NPR (negative Poisson’s ratio) anchor mesh cable coupling supports was tested. Taking the 2# inclined shaft of Muzhailing Tunnel in Gansu Province as the research object, optical fiber displacement group installation and line protection methods were adopted in a large deformation tunnel of complex soft rock with high stress and water-bearing properties.
2. Project Overview
2.1. Engineering Background
Muzhailing Tunnel is the third-longest highway tunnel in China. It is the key control project spanning from Weiyuan to the Wudu Expressway of Lanzhou to the Haikou National Expressway (G75) in China. The total length of the tunnel is 15,221 km. It is the longest tunnel in the whole line, with a maximum depth of 638 m. The tunnel passes through the watershed of the Weihe River Basin, with a vertical depth of 3252 m. It is located on a plateau, with cold temperatures and strong wind, and above the earthquake zone, with concentrated heavy rainfall and a generally poor construction environment.
The 2# inclined shaft of Muzhailing Tunnel is one of the areas with the largest amount of deformation and the most serious damage. The total length is 1813.43 m, and the maximum buried depth is 591 m. The ground elevation is 2416–3133 m. The relative height difference is 717 m. The self-weight stress is 14.77 MPa, and the direction of the maximum horizontal principal stress is N34E. The trend of the inclined shaft is 24.95 MPa. The direction of the inclined shaft is N71E, which is at an angle of 37° with the maximum principal stress, covering structural erosion, river erosion accumulation, and hillside accumulation. The terrain is deep, and the valley is in the shape of a “V”. The formation lithology is mainly composed of soft carbonaceous slate through the fault fracture zone and fault zone. The surrounding rock is mainly medium-temperature carbonaceous slate, which is composed of a thin-layer structure, fragmented loose structure, rock mass fissures, and extremely developed joint fissures. The surrounding rock grade is in a “V” shape, which is a valley shape.
2.2. Original Support Design
The original support design consisted of two parts: the initial support, and the secondary support. The specific support forms are presented in Table 1.

Table 1.
Original support design.
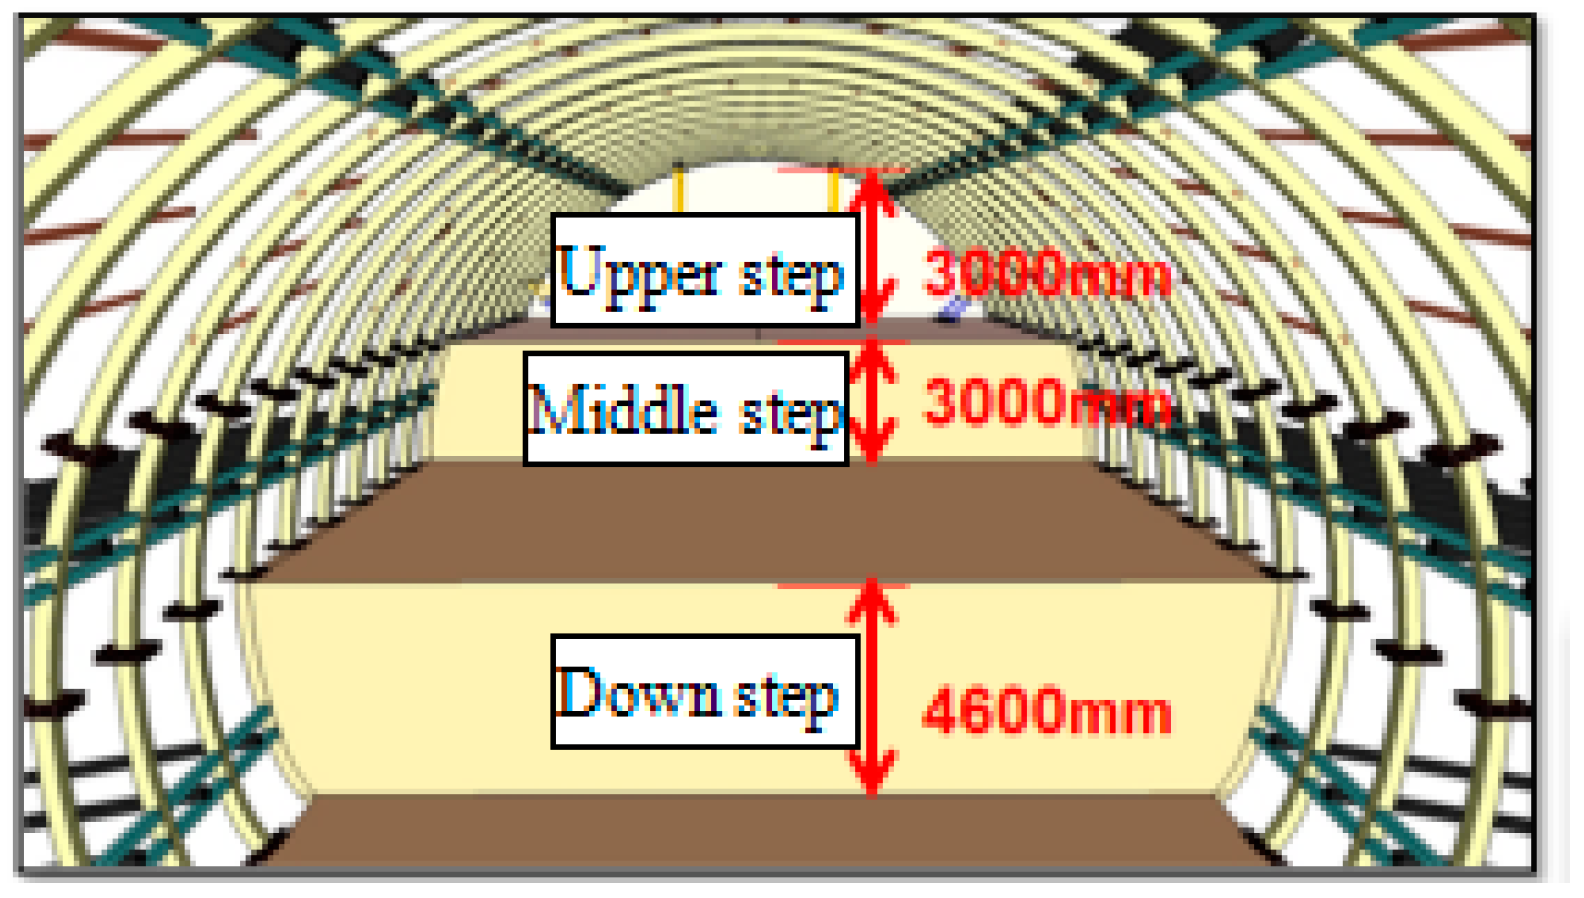
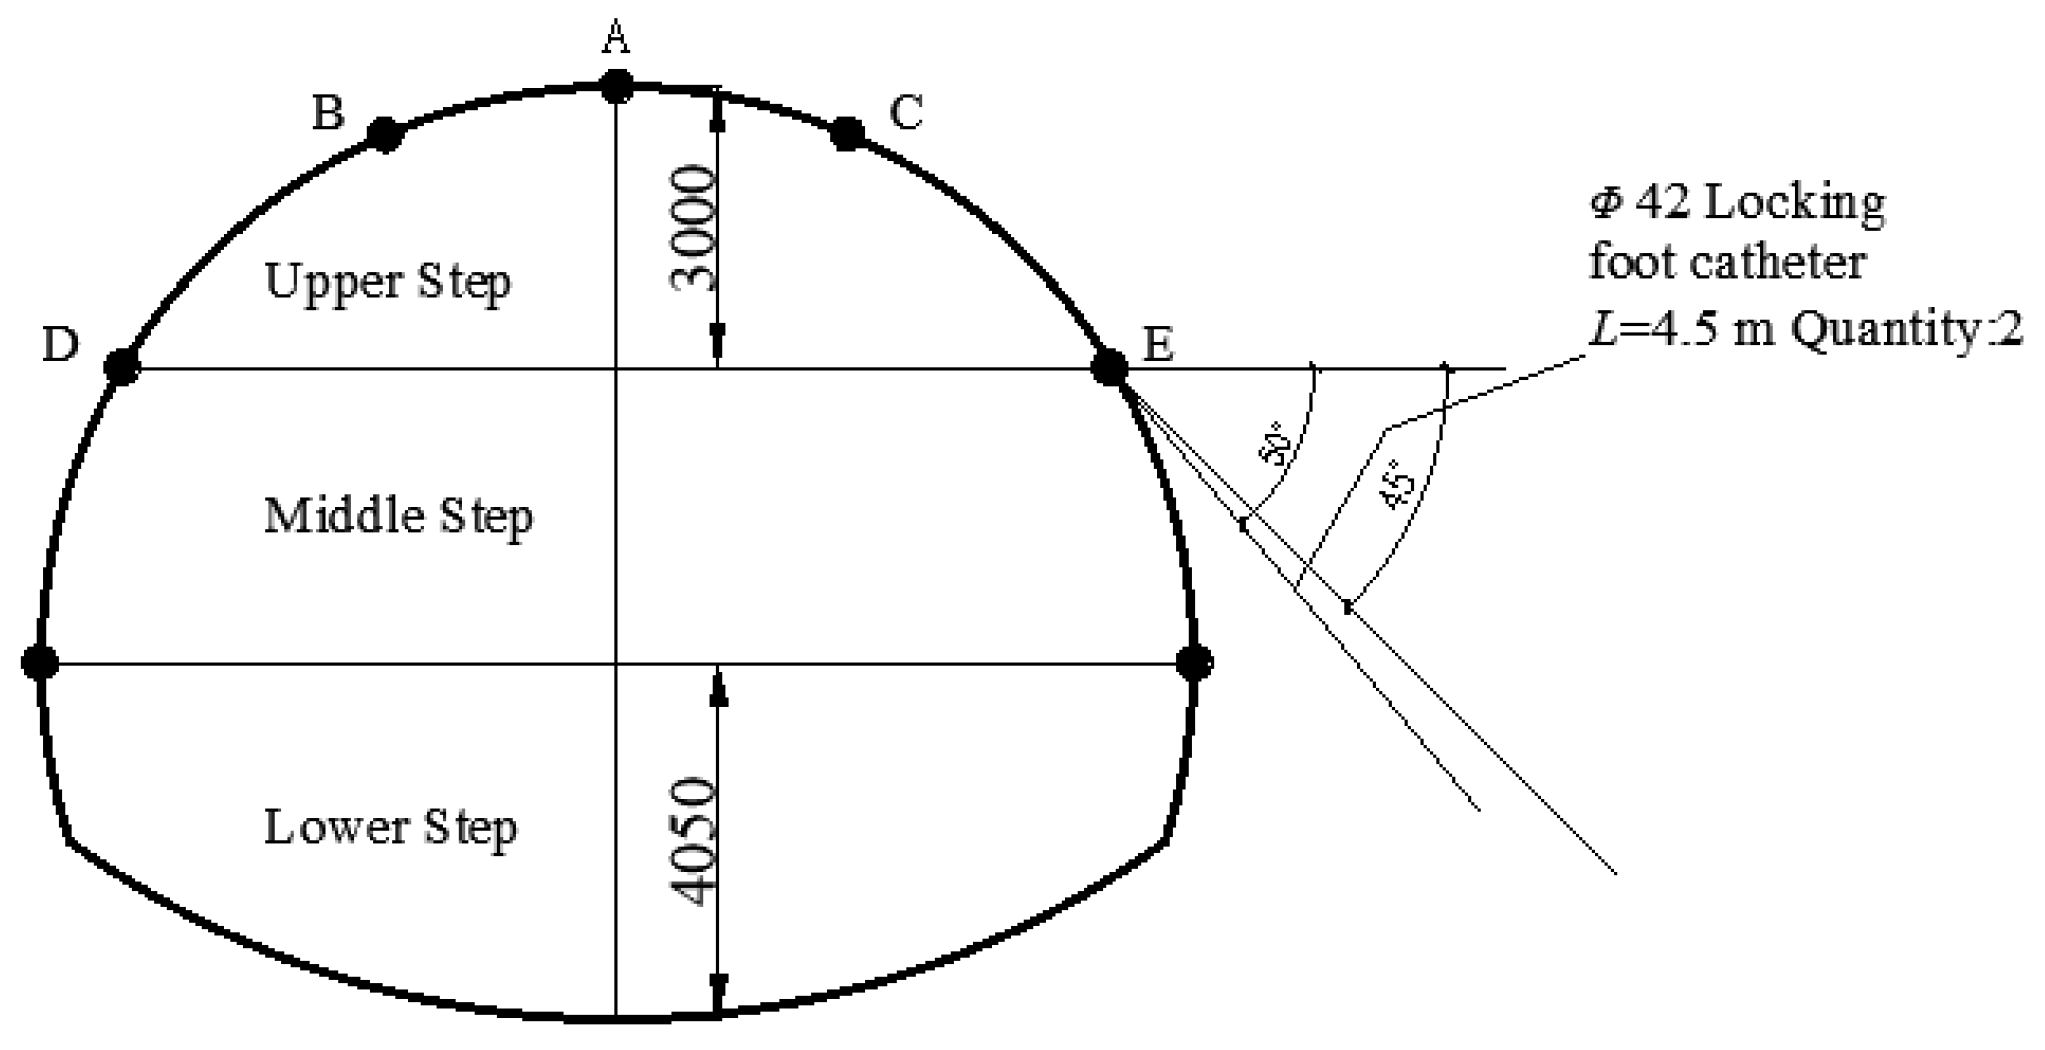
The project was constructed using a three-step method. The first step height was 3000 mm; the second step height was 3000 mm; and the third step height was 4610 mm, as shown in Figure 1.
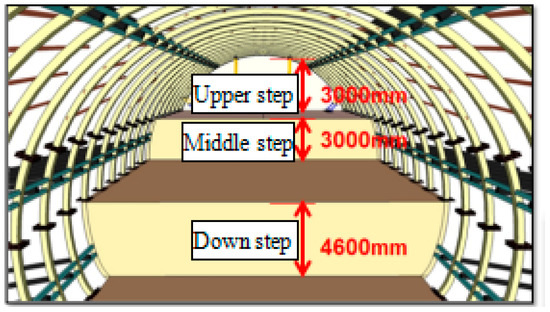
Figure 1.
Three-step construction.
2.3. Engineering Problem
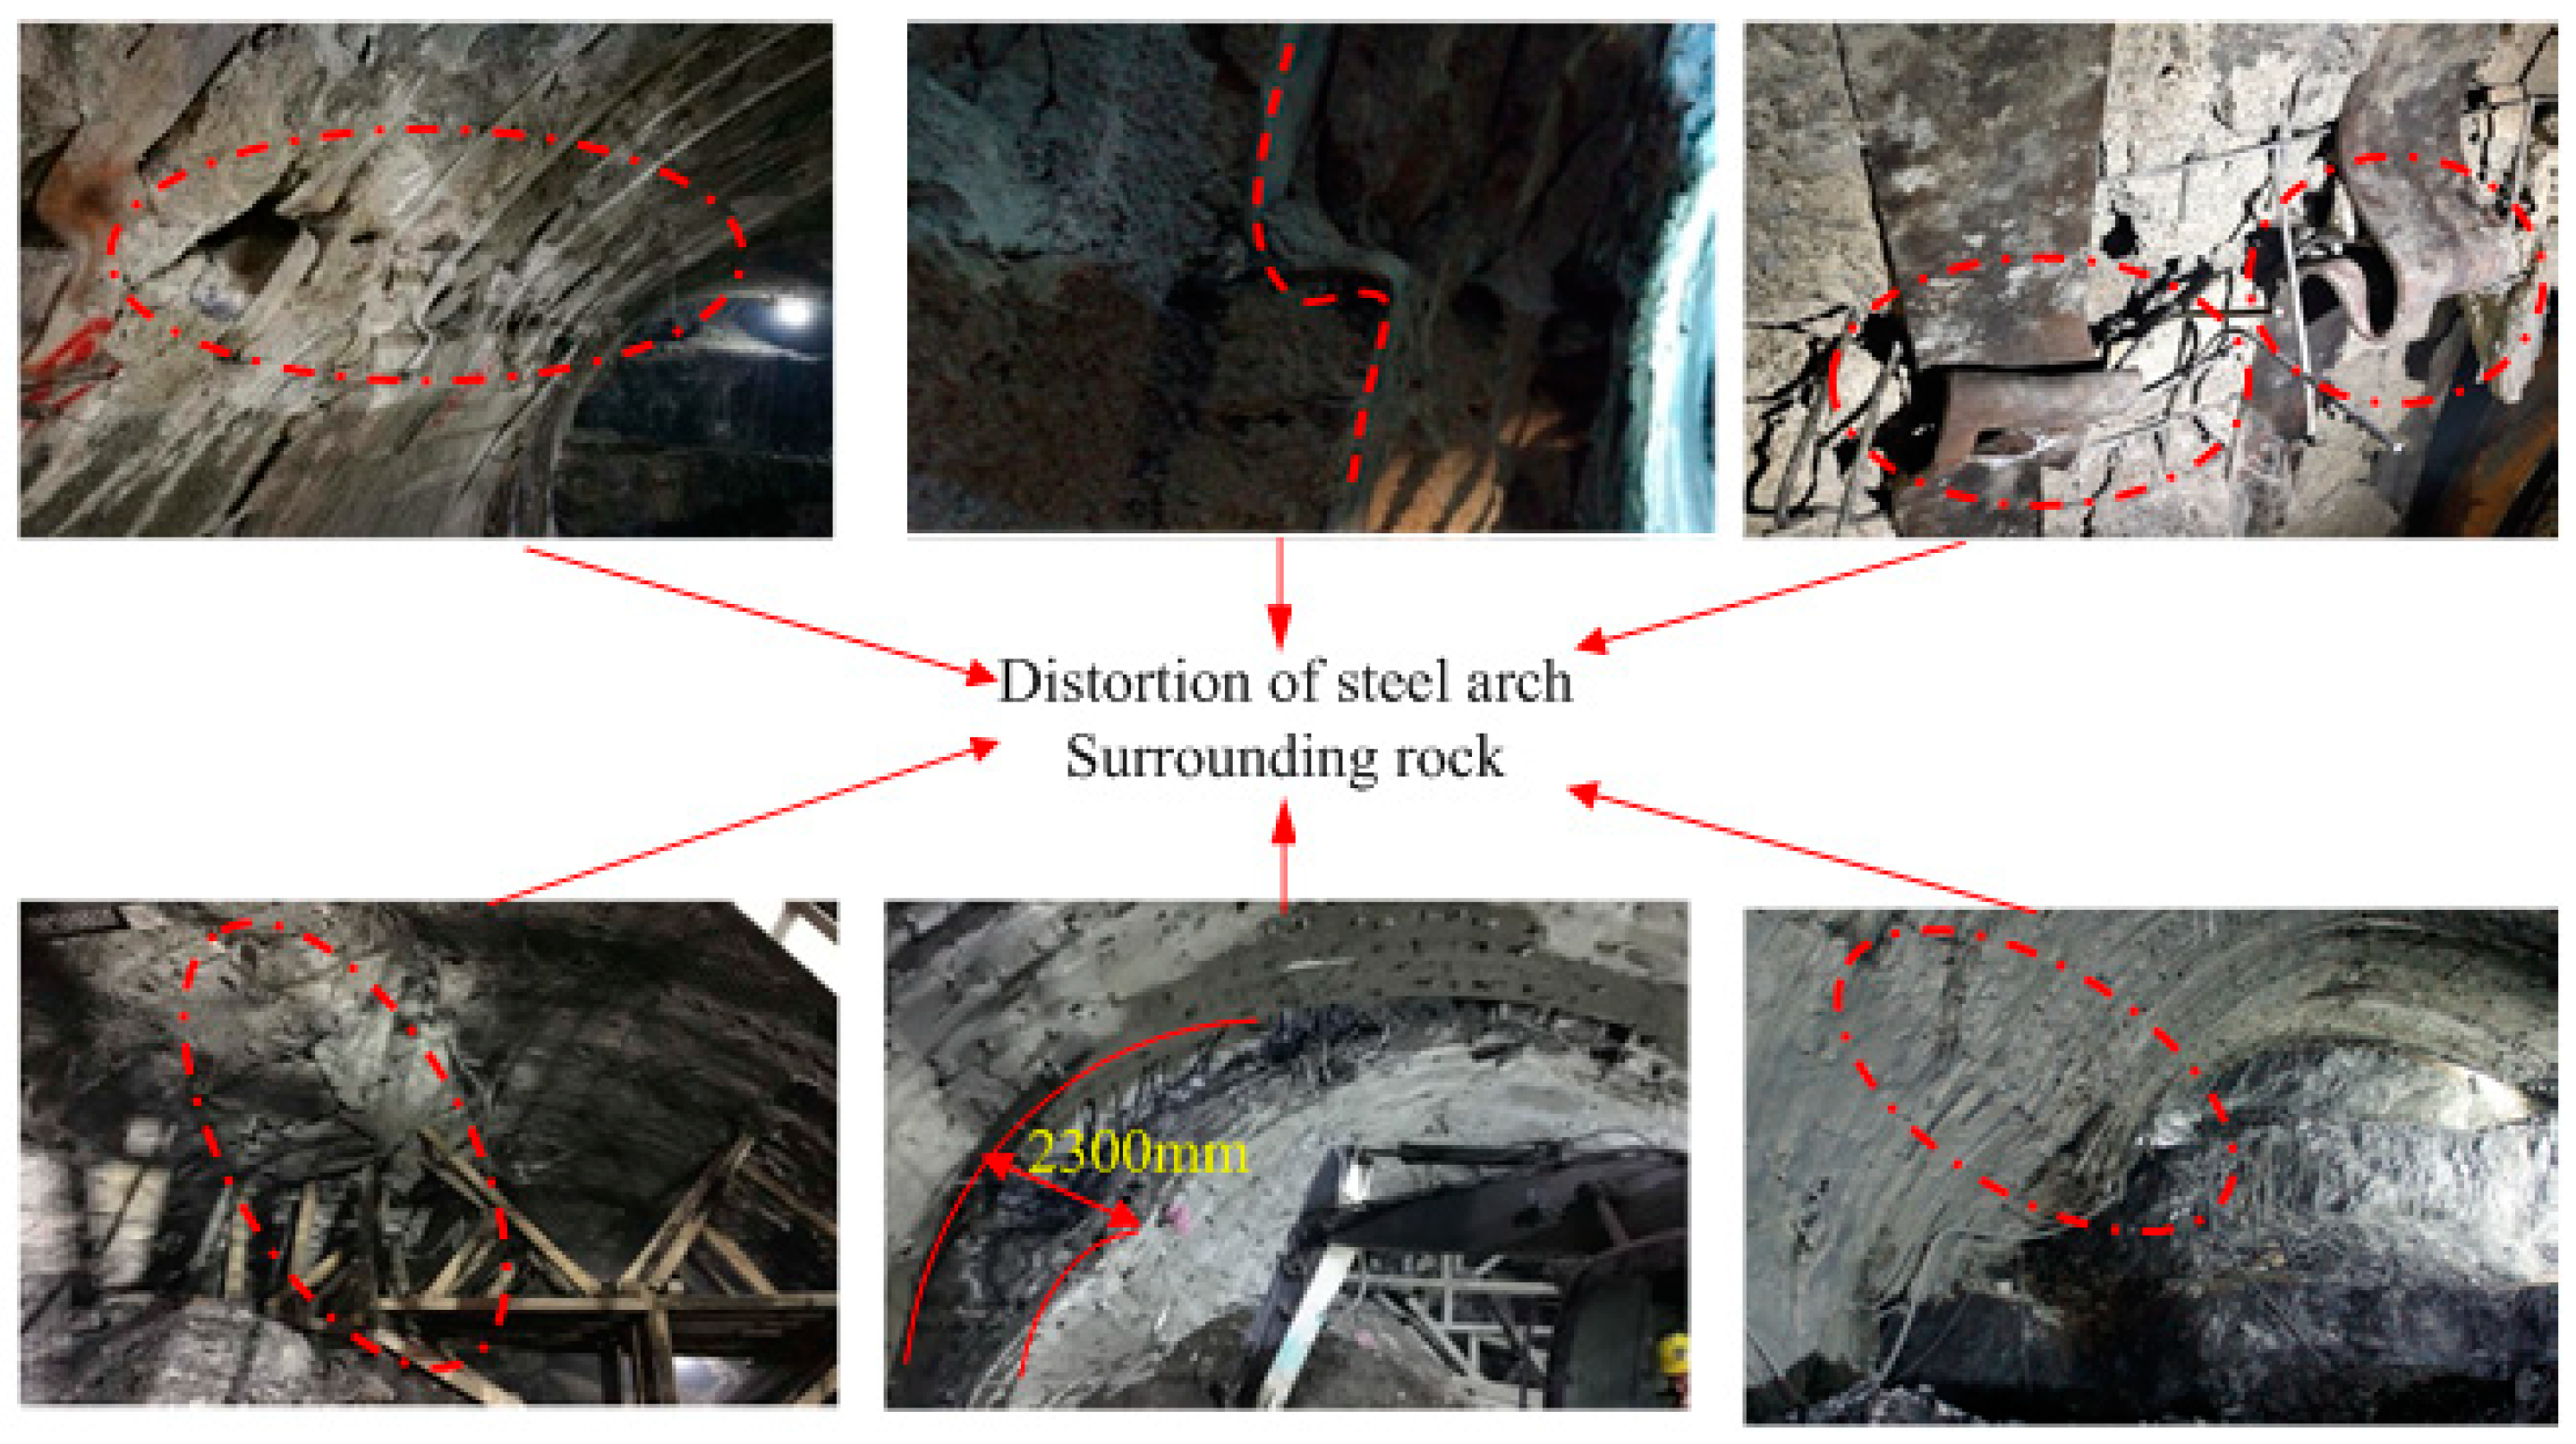
High ground stress occurred in the 2# inclined shaft of Muzhailing Tunnel, where the surrounding rock was thin layered slate. During the construction, which crossed multiple fault fracture zones, the initial support was invaded many times due to high deformation, and the cumulative convergence value of the 2# inclined shaft rose from 300~800 mm up to 3145 mm. The total length of the section demolition caused by the deformation of the initial support was about 495 m. As shown in Figure 2, the initial support was severely damaged, and the steel frame was twisted.

Figure 2.
Tunnel deformation and failure.
2.4. Improved Scheme for Project
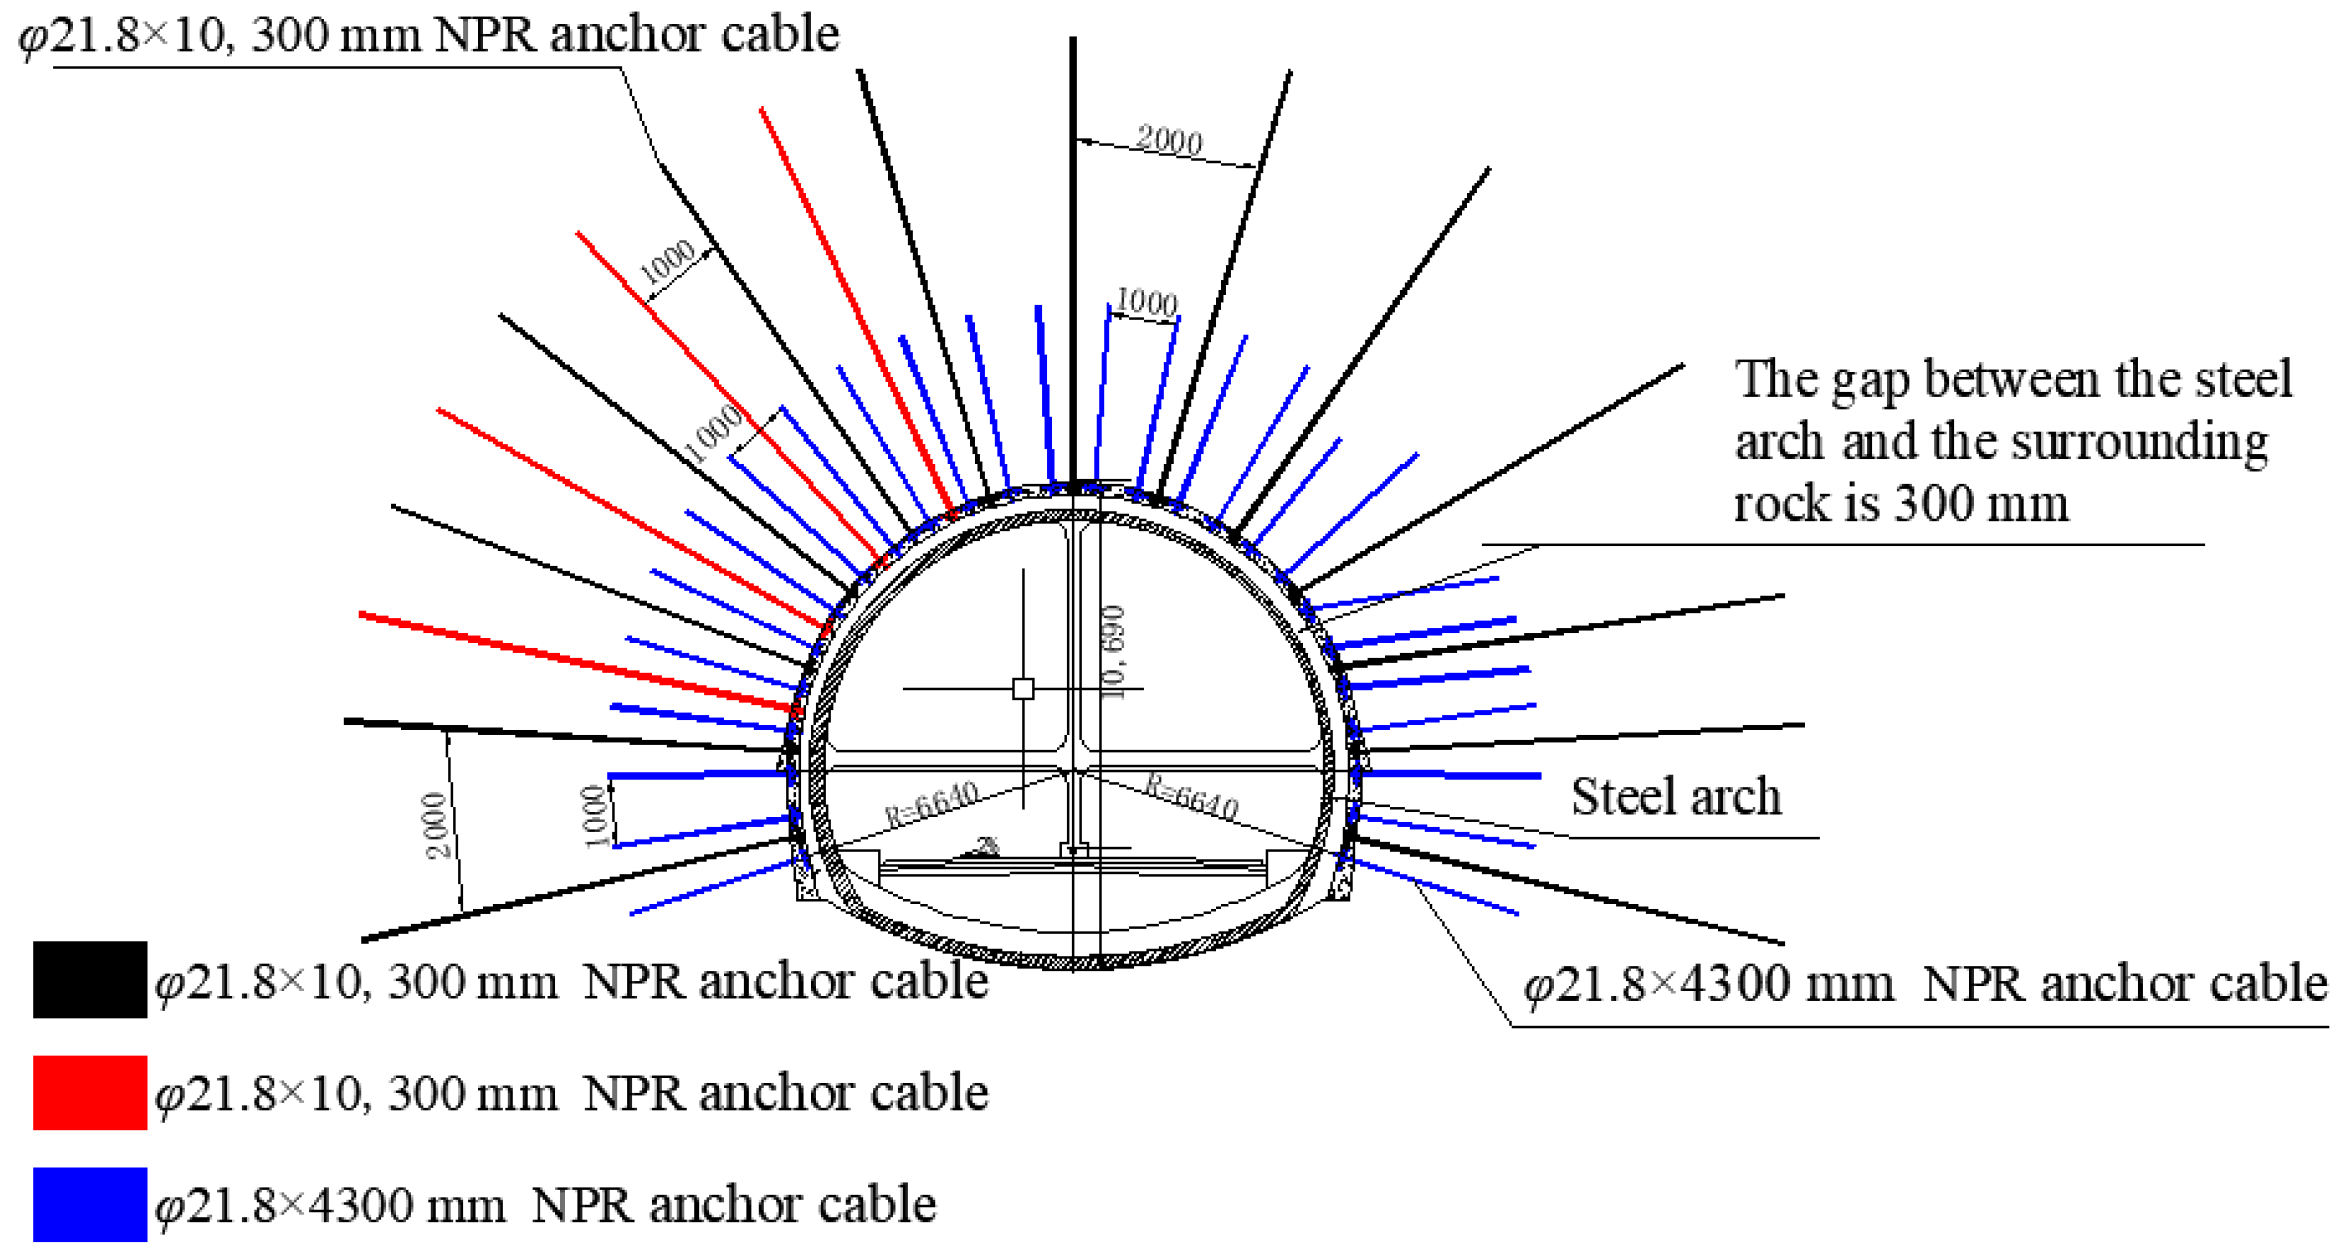
A new constant resistance large deformation (CRLD) bolt/anchor cable with negative Poisson’s ratio was developed to predict geological disasters such as deep high-stress rockbursts, earthquakes, pressure bumps, and landslides [27]. In order to solve the latter engineering problem, an NPR anchor cable network coupling support design was adopted. The specific design included:
- (1)
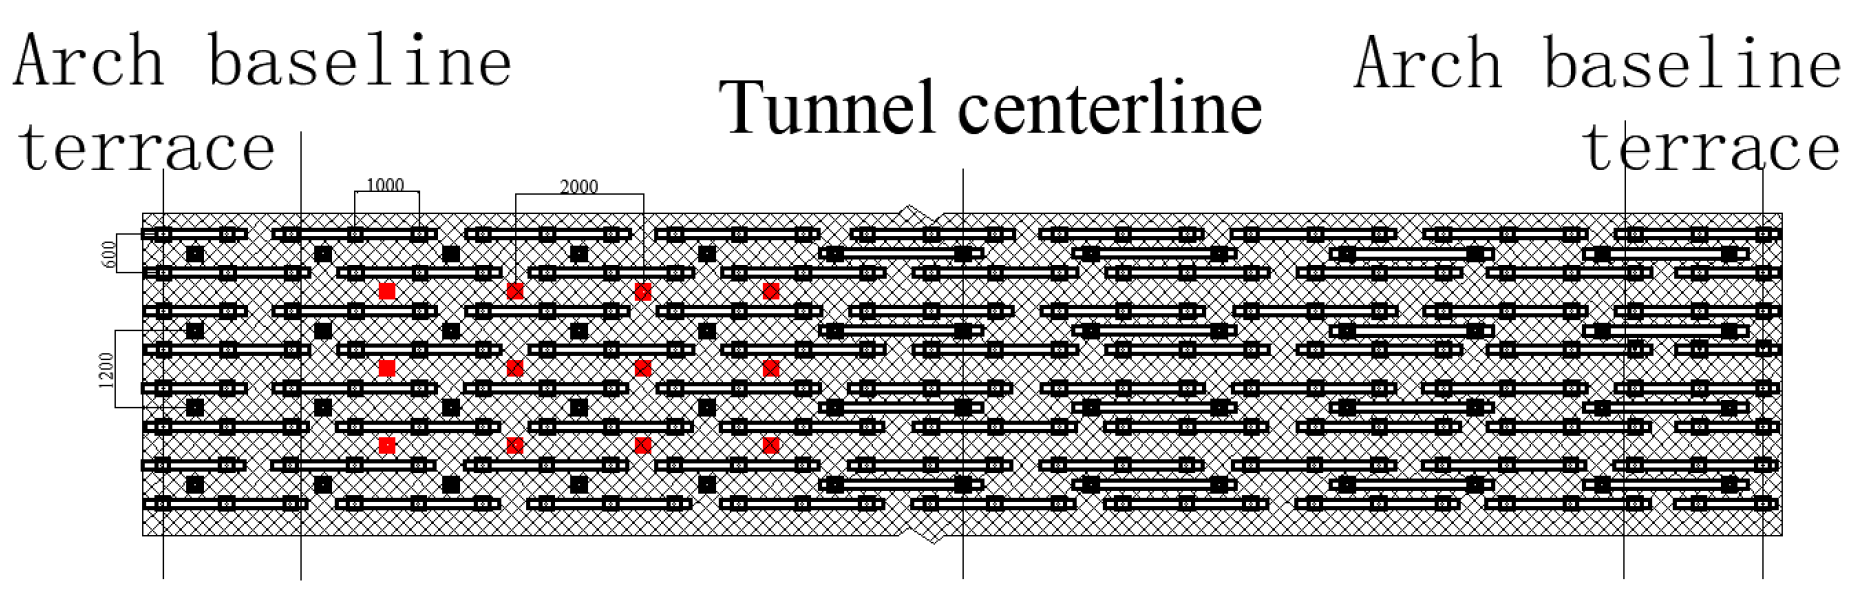
- The adoption of an NPR anchor cable of 4300 mm in length, with pre-tightening force equal to or exceeding 35 t and inter-row spacing of 1000 × 600 mm.
- (2)
- The adoption of an NPR anchor cable of 10,000 mm in length, with pre-tightening force equal to or exceeding 35 t and inter-row spacing of 2000 × 1200 mm.
- (3)
- Reinforcement and support of the anchor cable was performed using two constant-resistance anchor cables added to the upper left corner of the tunnel, with a pre-tightening force equal to or exceeding 35 t and inter-row spacing adjusted to 1000 × 1200 mm in a three-flower arrangement.
- (4)
- A wire mesh was welded with an Φ8 mm steel bar and a mesh size of 100 × 100 mm.
- (5)
- Concrete was sprayed with an initial spray thickness of 100 mm. According to the monitoring results, after the deformation of the surrounding rock was stable, it was sprayed back into contact with the steel frame.
As an illustration, the angle of the NPR anchor cable was not allowed to be parallel to the joint surface, and the angle of the anchor cable was adjusted according to different joint shapes.
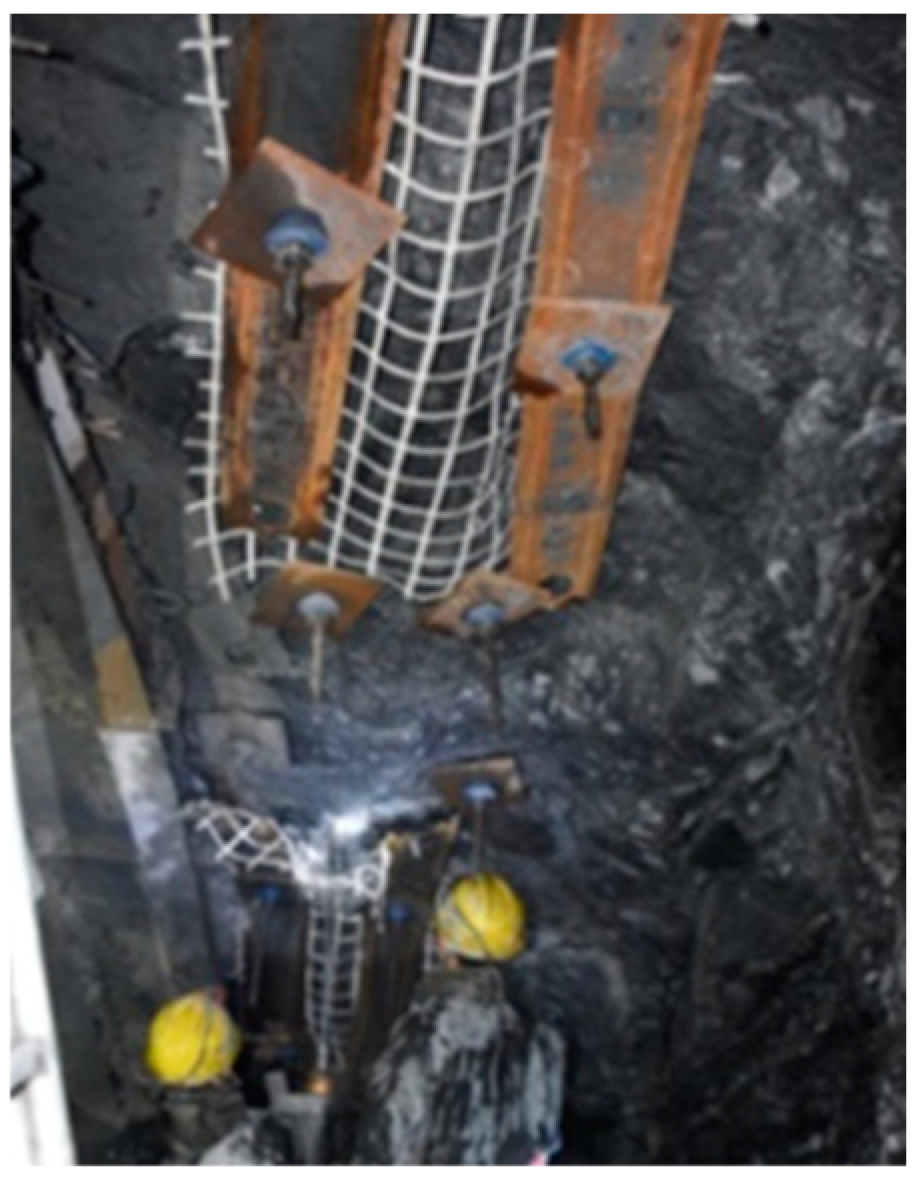
The design of the NPR anchor cable coupling support is shown in Figure 3. The plane expansion is shown in Figure 4. The NPR cable construction site is shown in Figure 5.

Figure 3.
Coupling support design through NPR cables and net cross-section diagram.

Figure 4.
Coupling support design through NPR cables and net plane graph.

Figure 5.
NPR cables construction site.
3. Installation Methods and Circuit Protection
3.1. Equipment Selection
An NZS-FBG-MDP displacement sensor and steel arch strain gauge were used. An NZS-FBG-A02 fiber grating wireless demodulator was used for automatic monitoring. The recording of field data and initial wavelengths was based on the A02 unattended fiber grating demodulator.
3.2. Station Position and Arrangement of Monitoring Points
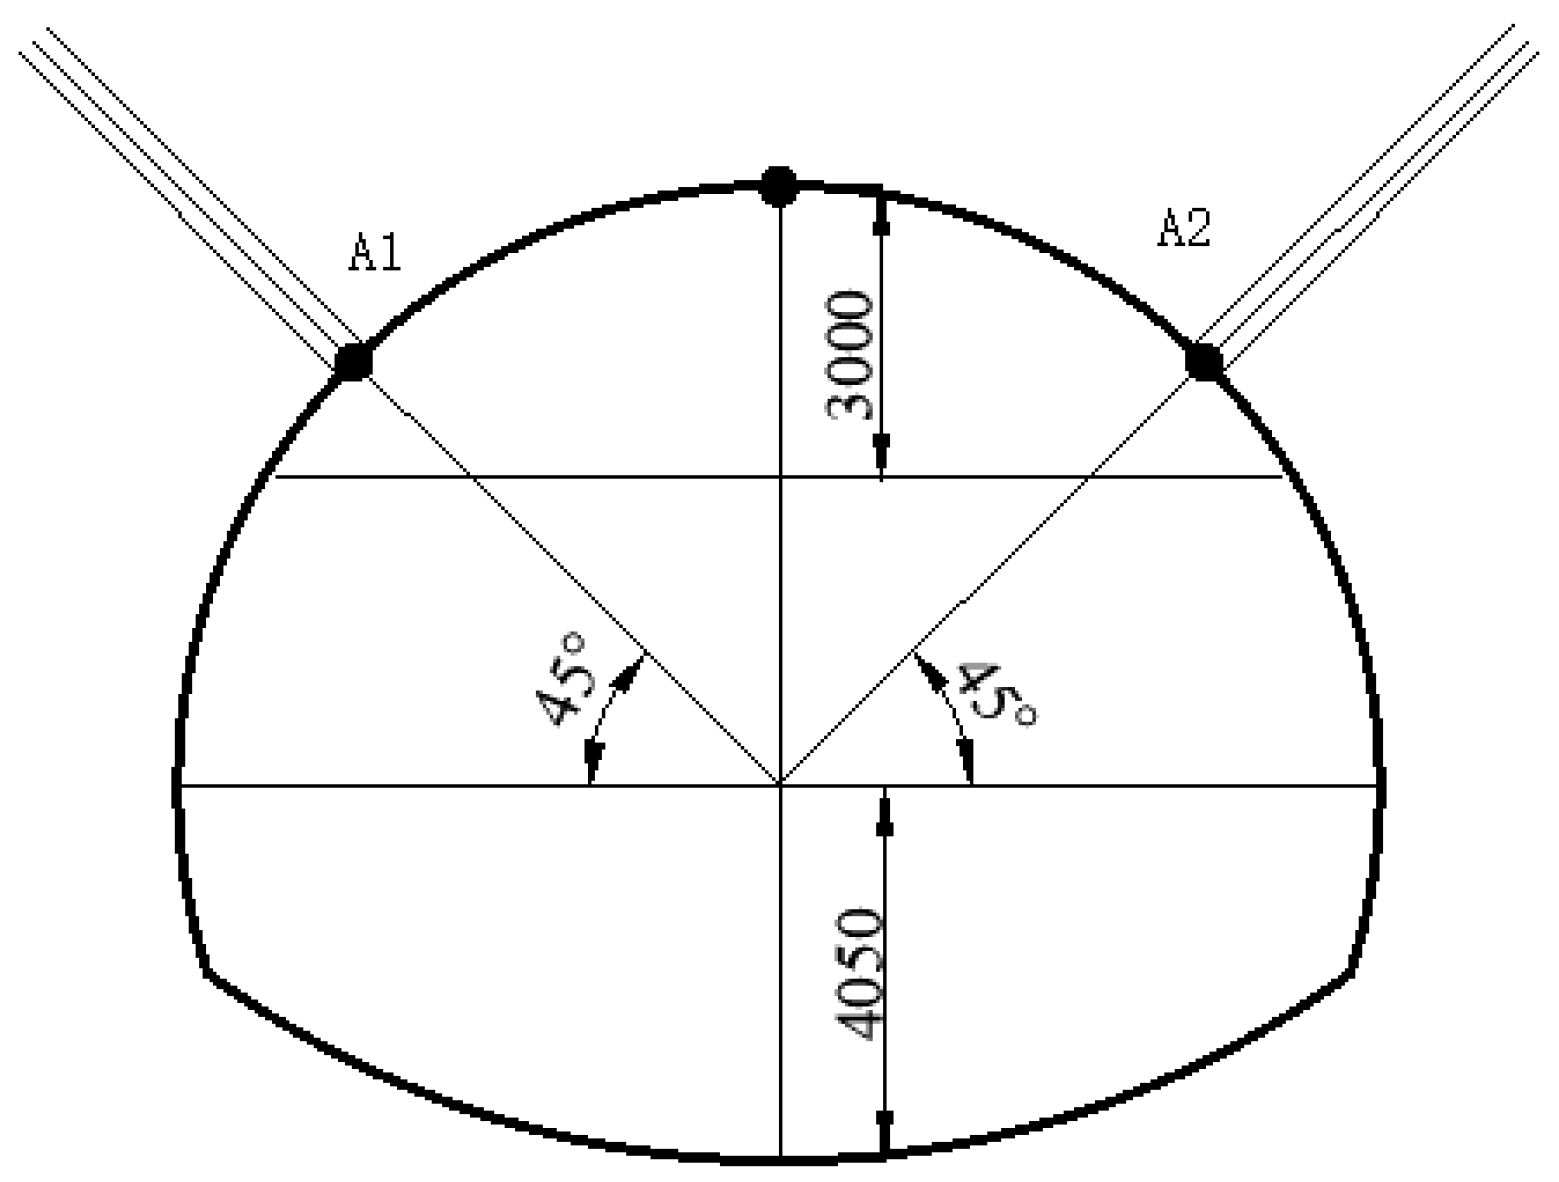
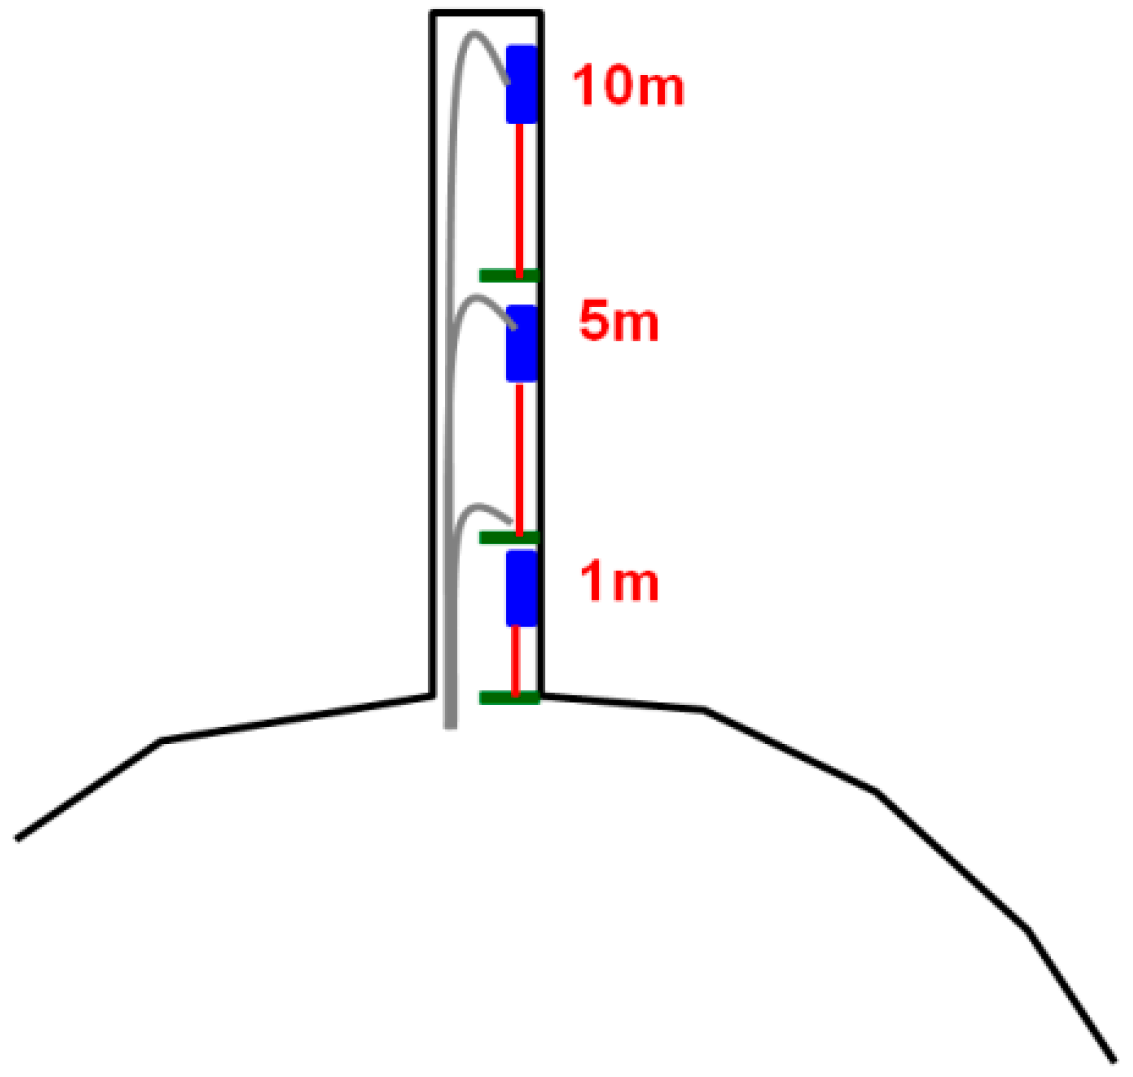
Two measuring points were arranged for each section (Figure 6). Three fiber grating displacement meters were installed at each measuring point, and a path was formed to measure the relative displacements at 0–1 m, 1–5 m, and 5–10 m. The arrangement of measuring points is shown in Figure 7. The parallel flow operation was carried out simultaneously with the construction of the NPR anchor cable.

Figure 6.
Stationing position of fiber optic displacement meter.

Figure 7.
Monitoring point arrangement of fiber optic displacement meter.
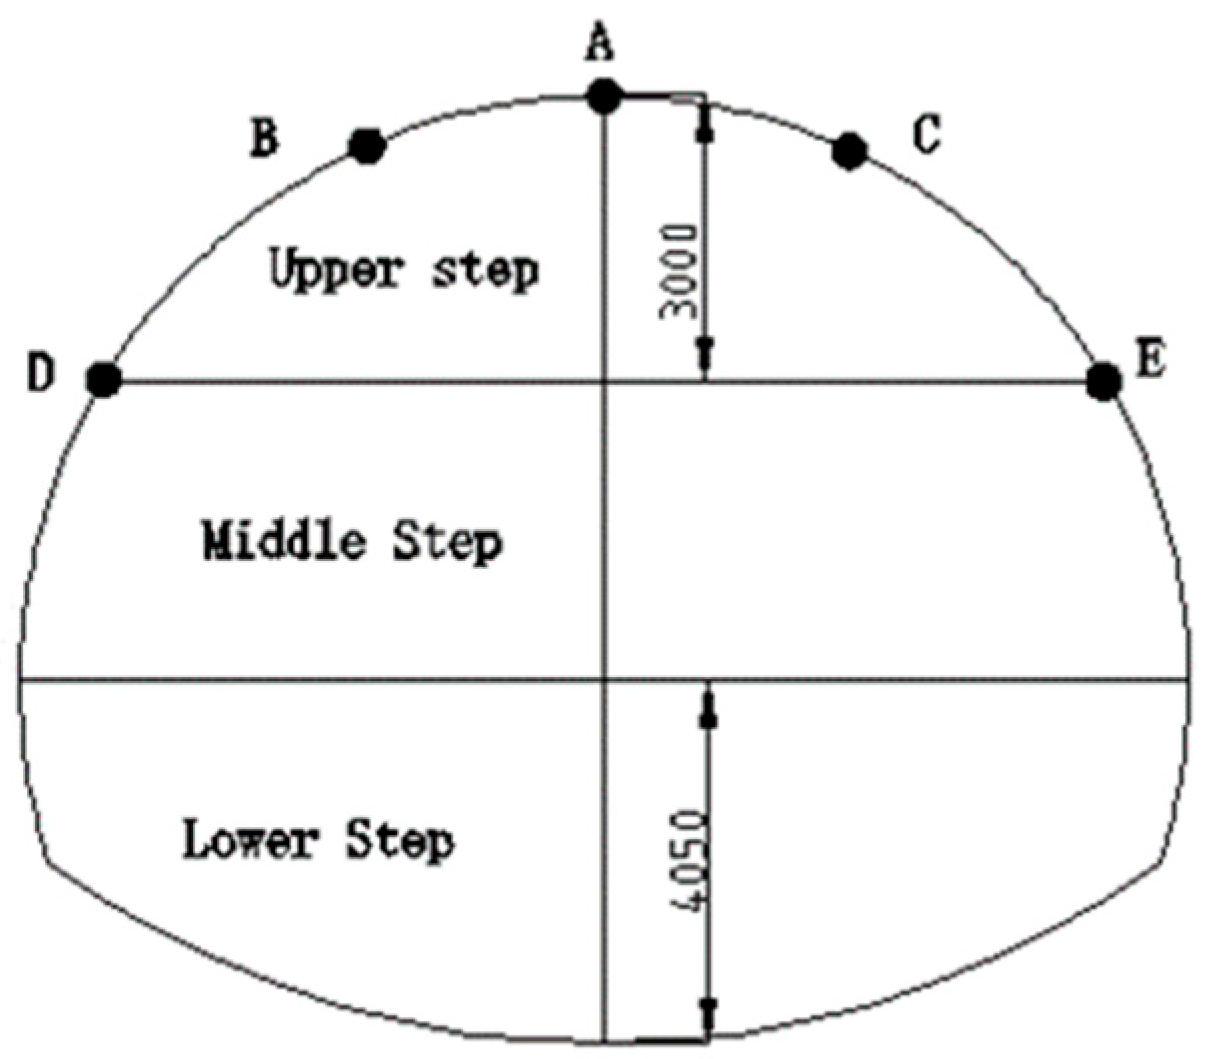
In addition, according to previous statistics, the upper step exhibited the most serious case of surrounding rock deformation, while the middle and lower steps had less deformation. Therefore, the situation at the upper step measuring point was able to meet the analysis requirements of the work proposed in this paper. Thus, in this paper, the K1+800.8m upper step measurement point was used. The arrangement of measuring points is shown in Figure 8. Five measuring points were arranged in each section, at the vault (A), arch shoulder (B/C), and arch waist (D/E). After the installation of point B was completed, no data generation occurred during the test. Because the follow-up project involved the construction of the tunnel intersection, the test section could not be further supplemented because of the lack of on-site installation conditions. Therefore, only the stress curve of the steel arch at the vault (A), arch shoulder (C), and arch waist (D/E) over time was analyzed.

Figure 8.
Stationing position of steel arch strain gauge.
3.3. Installation Methods of Fiber Optic Displacement Meter
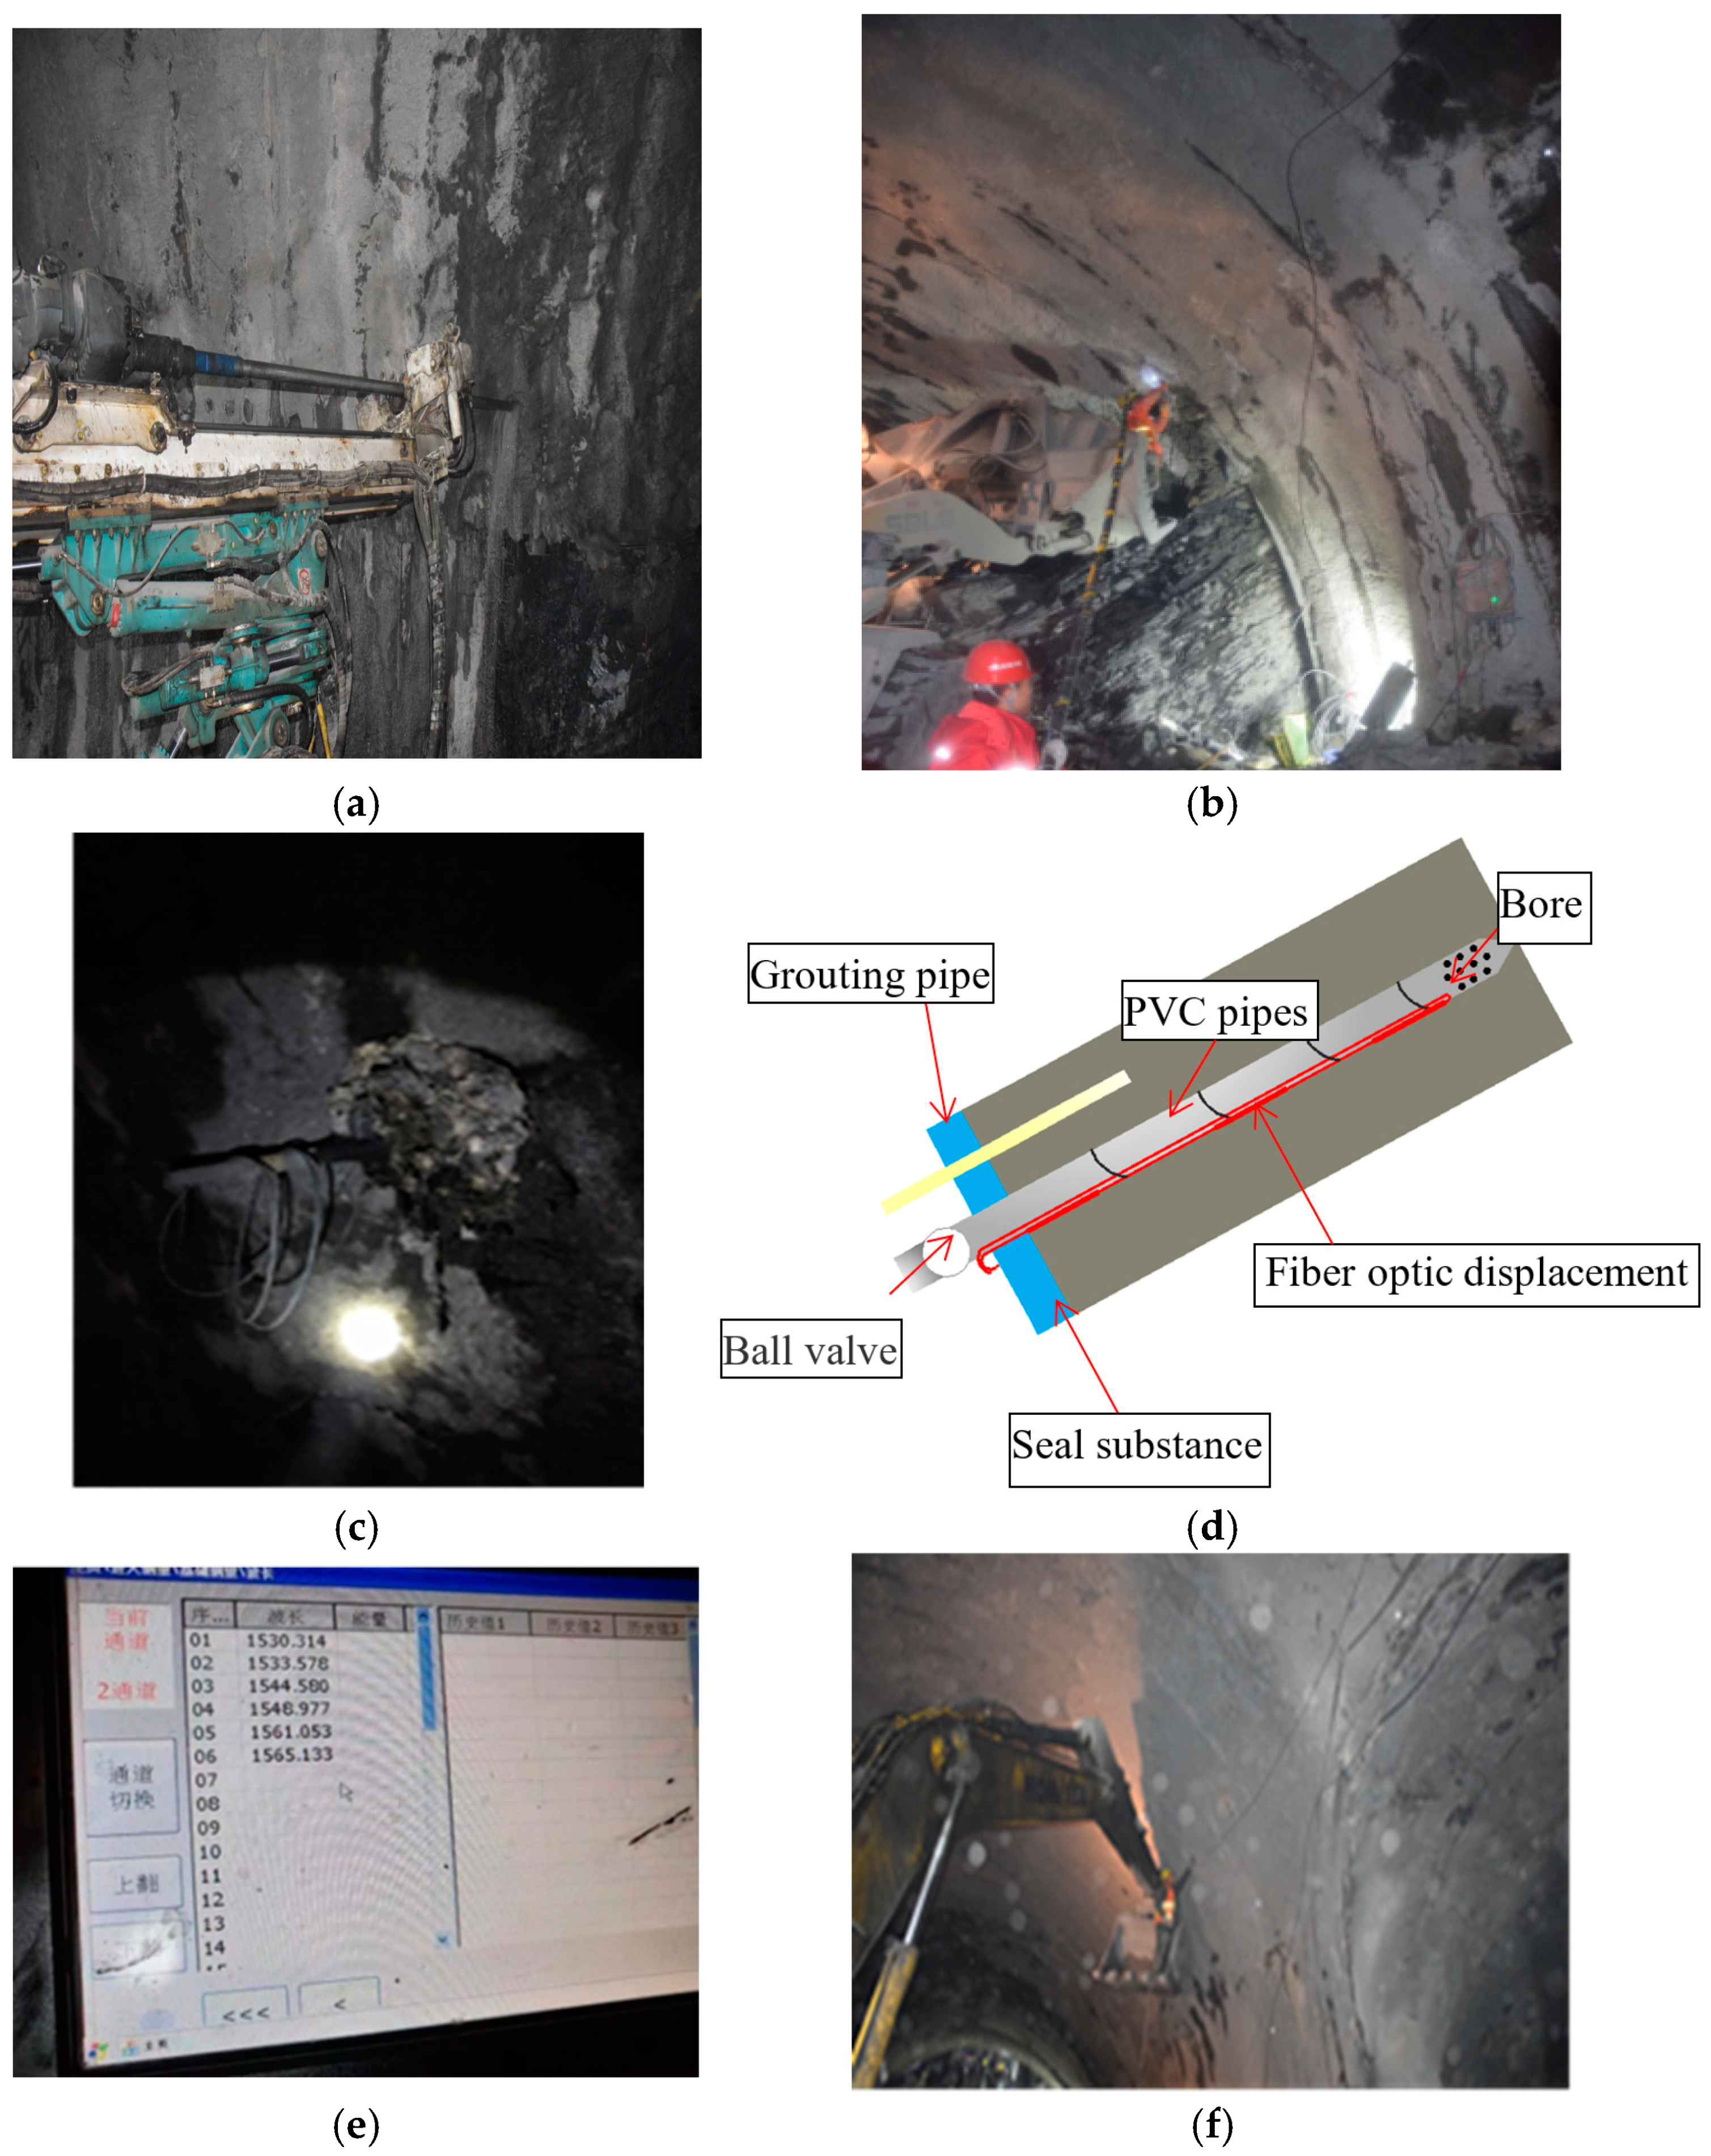
The installation method of the fiber optic displacement meter included the following steps (Figure 9):

Figure 9.
Installation of fiber optic displacement meter. (a) Drilling; (b) displacement meter lowering; (c) orifice sealing; (d) drilling grouting; (e) testing; (f) connecting.
- (1)
- Drilling was affected by the size of the equipment. The diameter of the drilled recess was more than 75 mm, and the depth of the hole was more than 10 m. Combined with the site construction conditions and construction environment, the C-6 drilling rig was used for drilling. The boreholes are shown in Figure 9a. In order to prevent the borehole from collapsing and ensure the quality of the borehole, after the borehole was punched, the debris in the borehole were rinsed during the lowering of the instrument to prevent sticking.
- (2)
- The fiber Bragg grating displacement sensor group was then lowered. First, the displacement meter and grouting pipe were lowered. Subsequently, the 4 m grouting pipe was put into the hole, and extreme care was taken not to stick it to the cable and to position it on the opposite side, as shown in Figure 9b.
- (3)
- After the lowering was completed, the orifice sealing work was started. Cotton wool was inserted into the borehole and mixed with mineral polyurethane expansion quick-drying glue in a ratio of 1:1 for good stirring and inserted into the borehole. The sealing length of the orifice was about 0.3 m, and the sealing effect could be achieved through a reaction cycle of about 30 min. The mineral polyurethane expansion quick-drying adhesive is shown in Figure 9c.
- (4)
- The grouting principle is shown in Figure 9d, and the technical requirements of grouting are shown in Table 2. The cement was stirred in a tank at the site, and the entire hole was grouted to prevent cement solidification. After a certain amount of grouting, the PVC pipe began to produce gas, and the slurry flowed back. At the beginning, the slurry was concentrated, and a ball valve was used to control the slurry to flow outward until a slurry with the same concentration was obtained. The ball valve switch was then closed, and grouting was continued. When the grouting amount was approximately equal to the calculated grouting amount, the grouting work was stopped. At the same time, the grouting pipe was closed, and the hole grouting work was completed.
Table 2. Grouting technical requirements.
- (5)
- After 2~3 days of natural curing, the cement slurry was able to meet the requirements of curing strength. Initial testing was performed, and the initial wavelength was recorded, as shown in Figure 9e.
- (6)
- The wires were then connected with welded steel bars, as shown in Figure 9f.
3.4. Installation Methods of Steel Arch Strain Gauge
The installation method for the steel arch strain gauge involved the following steps:
- (1)
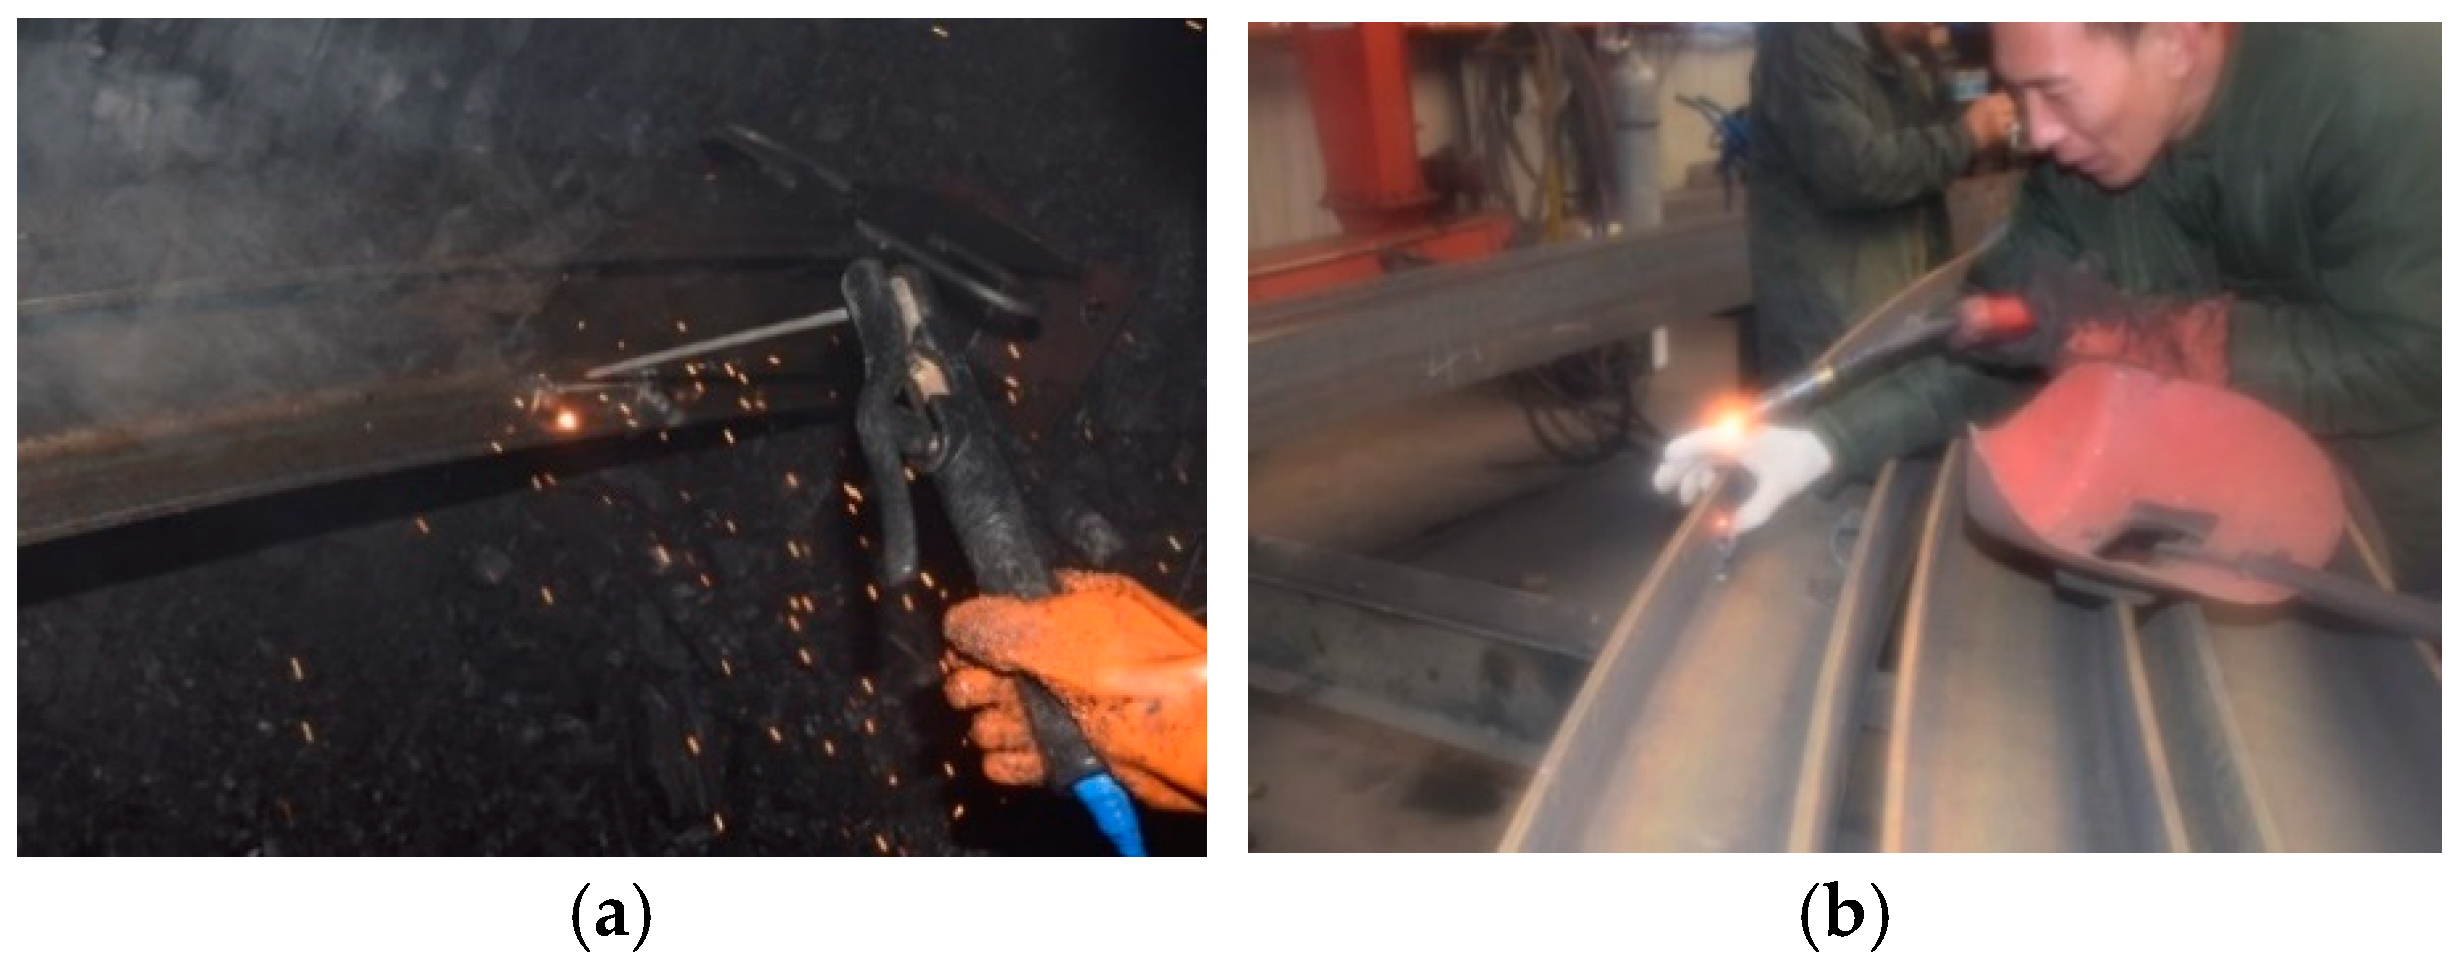
- The welding fixture was utilized to weld the fixture base with the strain gauge model to the measuring point position, to ensure that the welding orientation could not be misaligned. Subsequently, the fixture was opened, and the strain gauge model was taken out. The upper part of the clamp featured a groove; the function of the groove was to provide a certain space for rotation of the strain gauge, in order to prevent the strain gauge from becoming stuck. The entire fixture was designed to be detachable; when other constructions on the site risked the safety of the sensor, the sensor could be disassembled and the fixture alone could be retained, as shown in Figure 10a. Due to the long welding time on site, the subsequent operations were delayed and the welding was carried out using the pre-welding method of the steel bar processing shed, as shown in Figure 10b. The implementation of this method effectively improved the work efficiency.
 Figure 10. Welding fixture: (a) Field welding fixture; (b) Indoor welding fixture.
- (2)
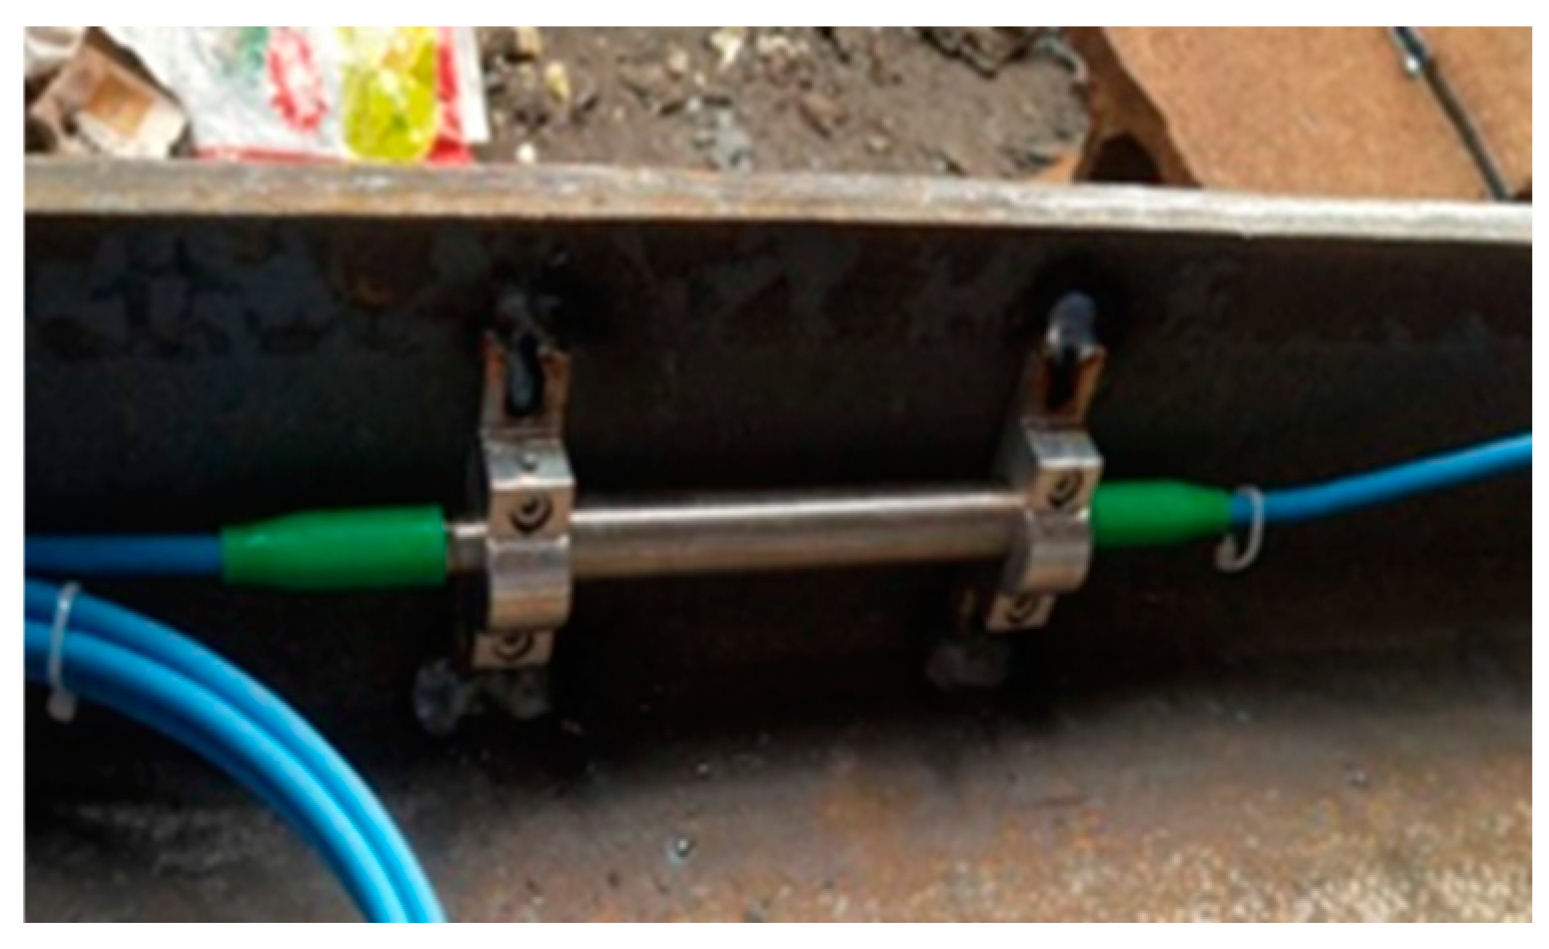
- Indoor assembly and line protection was the next priority. First of all, the fiber grating strain gauge was put into the fixture, and adjustments were made using a leveler to ensure that the sensor and the fixture remained level. Fixation was then performed, and the fixation screw was further fixed with an M4 screw. Once the M4 screw was locked, four further screws were required to be locked simultaneously and evenly. Finally, the sensor was temporarily connected to the fiber grating demodulator to detect and record the wavelength information of the sensor in the free state. It was found that when the strain wavelength and the free state were relatively large (more than 200 p.m.), the M4 screw required loosening. Subsequently, it was re-uniformly locked until the strain wavelength change was less than 200 p.m. The installed strain gauge is shown in Figure 11.
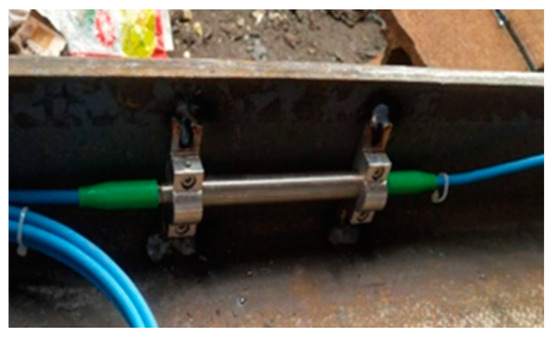 Figure 11. Installed strain gauge.
The strain gauge lead hose was connected in series, and the steel wire hose had sufficient flexibility to ensure that the bending radius of the lead was more than 5 cm. At the same time, the hose had a certain rigidity to ensure that the lead wire was not broken when it was pressed. A hole was drilled on the steel arch wing; the diameter of the hole was consistent with the steel wire hose hole, which was used for the steel wire connection between the steel arches, as shown in Figure 12.

Figure 12.
Wing hole punching.
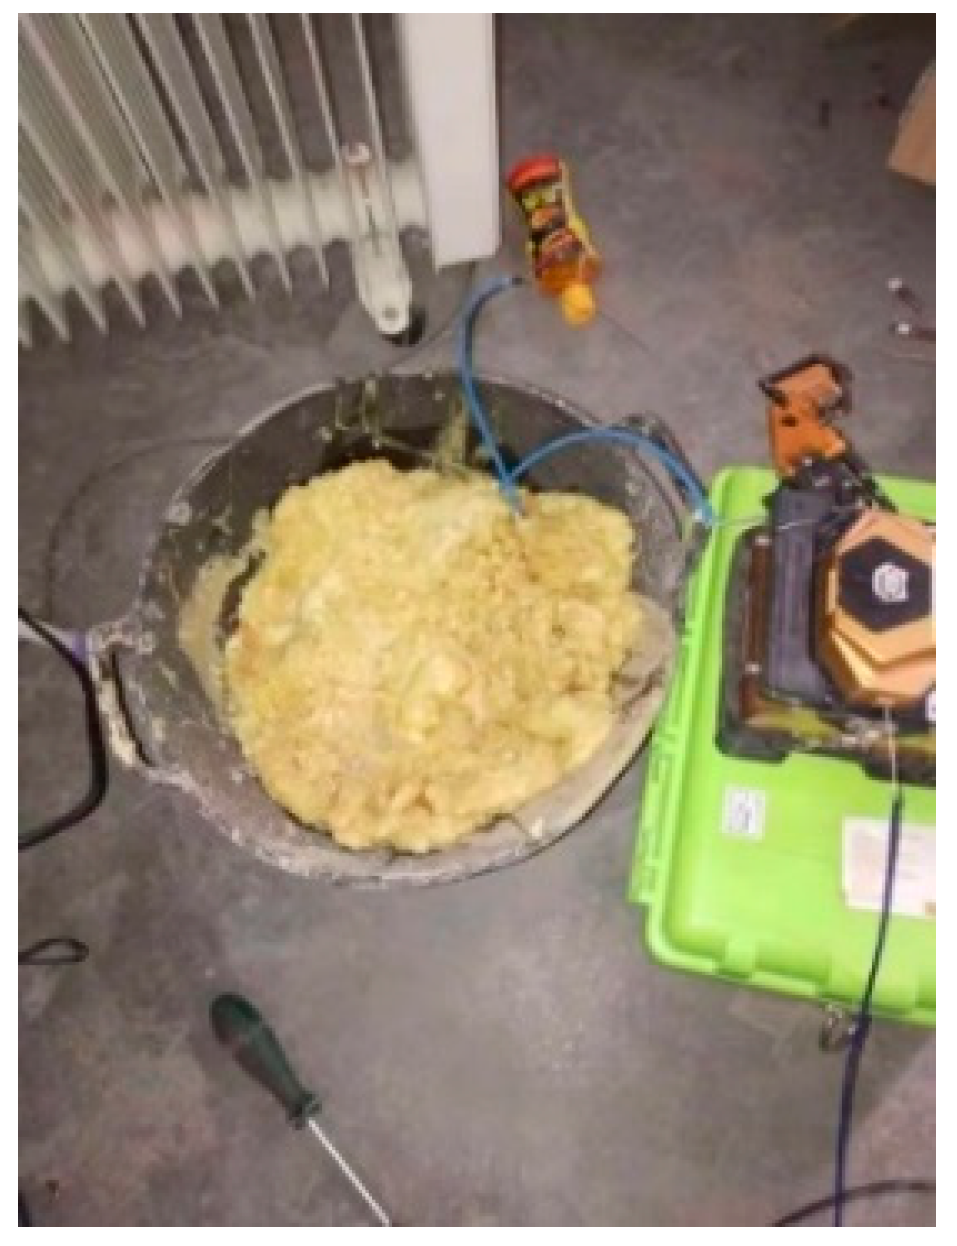
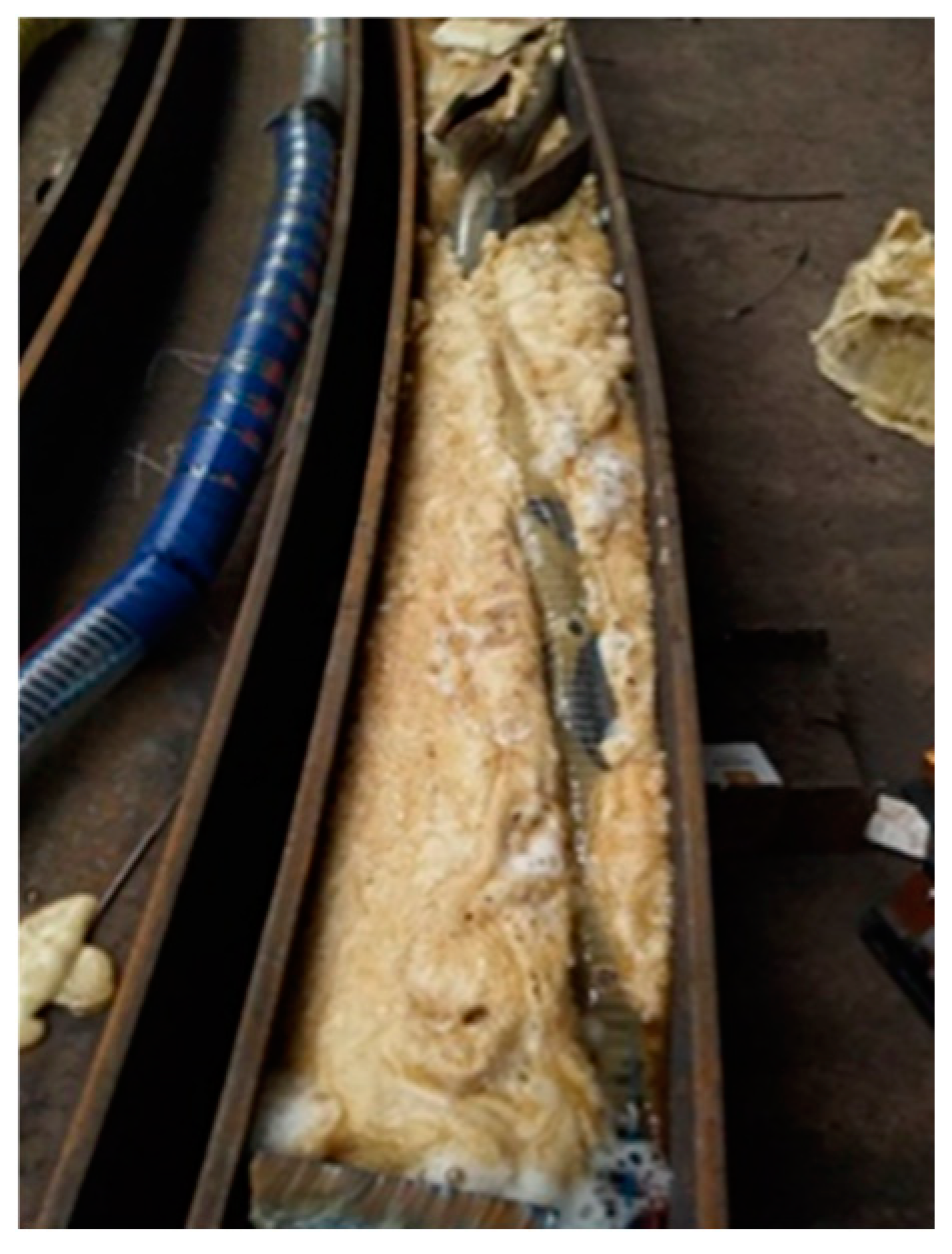
In view of the complexity of the geological conditions of the construction tunnel, mineral polyurethane foam was used for secondary plugging protection in order to further protect the lead. Mineral polyurethane foam has good waterproof performance and strength, which could effectively lessen the impact force of shotcrete, the seepage impact force of surrounding rock, and the expansion force of concrete solidification. In order to test whether the material had an effect on the data collected during the foaming process, relevant tests were performed, as shown in Figure 13. The tests showed that the accuracy of the strain gauge data remained consistent following the application of mineral polyurethane foam. The covering effect of the mineral polyurethane foam is shown in Figure 14.

Figure 13.
Mineral polyurethane foam and strain gauge compatibility.

Figure 14.
Mineral polyurethane foam covering effect test.
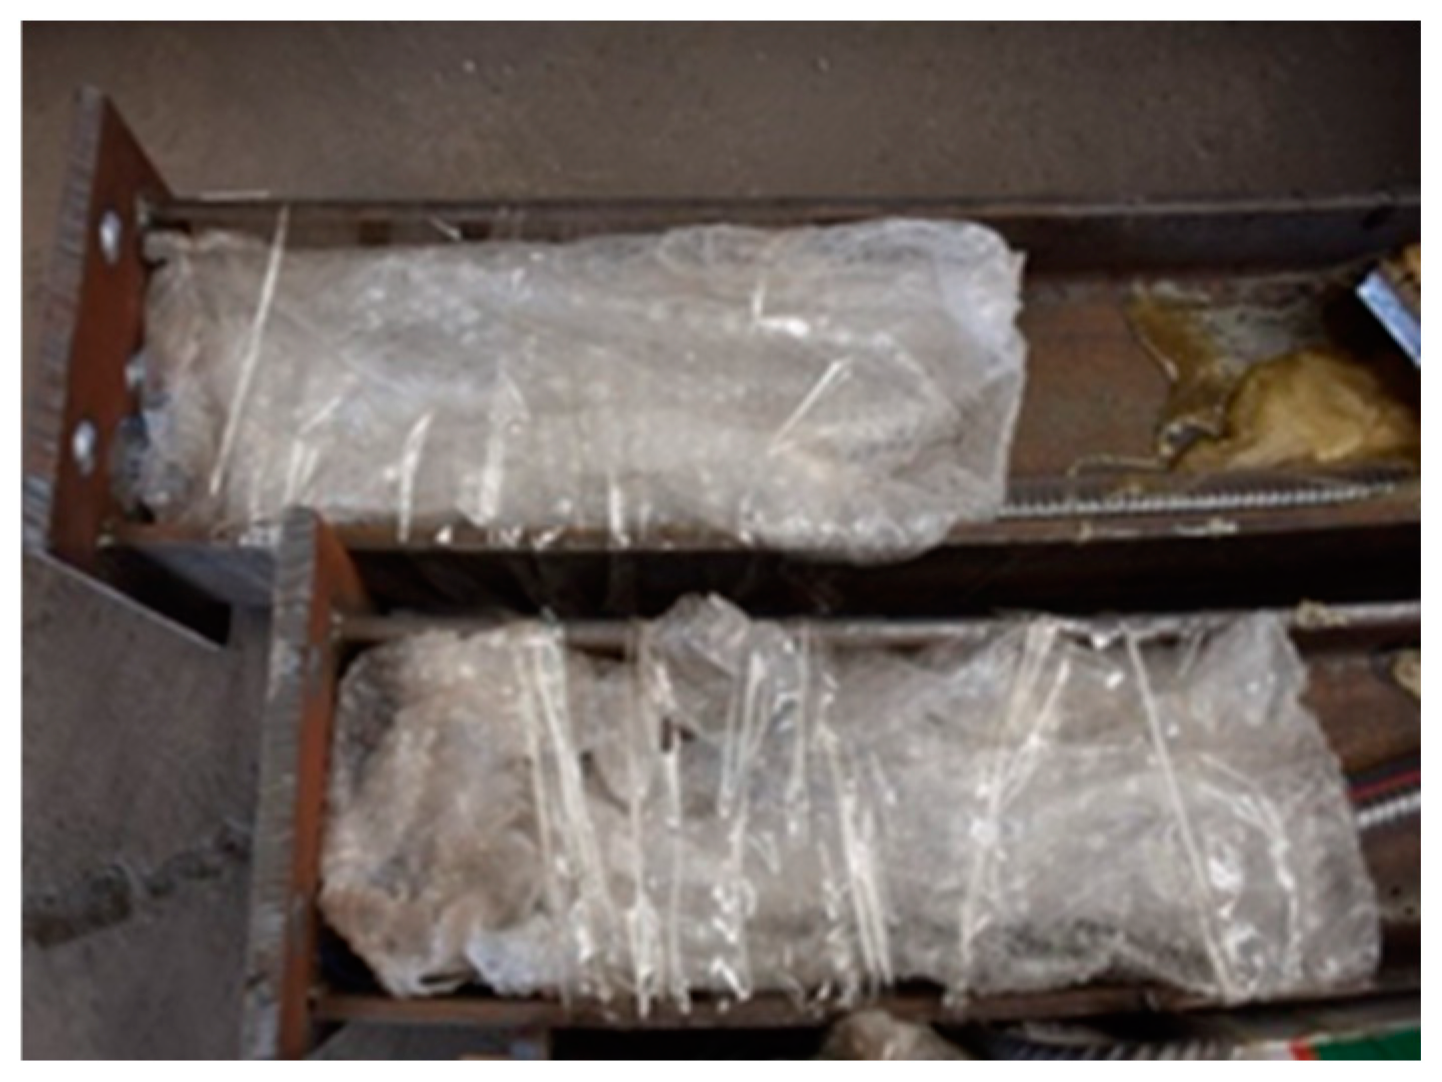
Because the steel arch was transported by a loader, in order to avoid the phenomenon of lead breakage during transportation, the lead wires wound at both ends of the steel arch were sealed, and the methods of foam filling and foam paper covering were adopted, as shown in Figure 15.
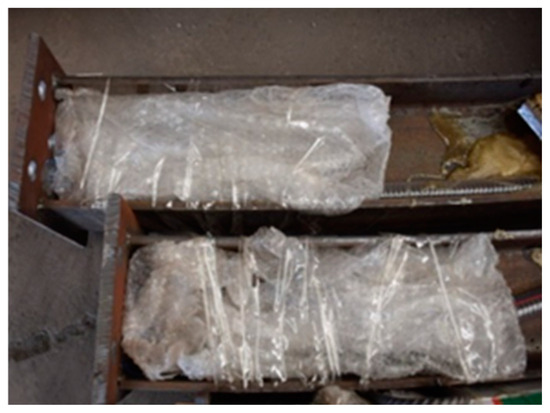
Figure 15.
Line protection during transportation.
- (3)
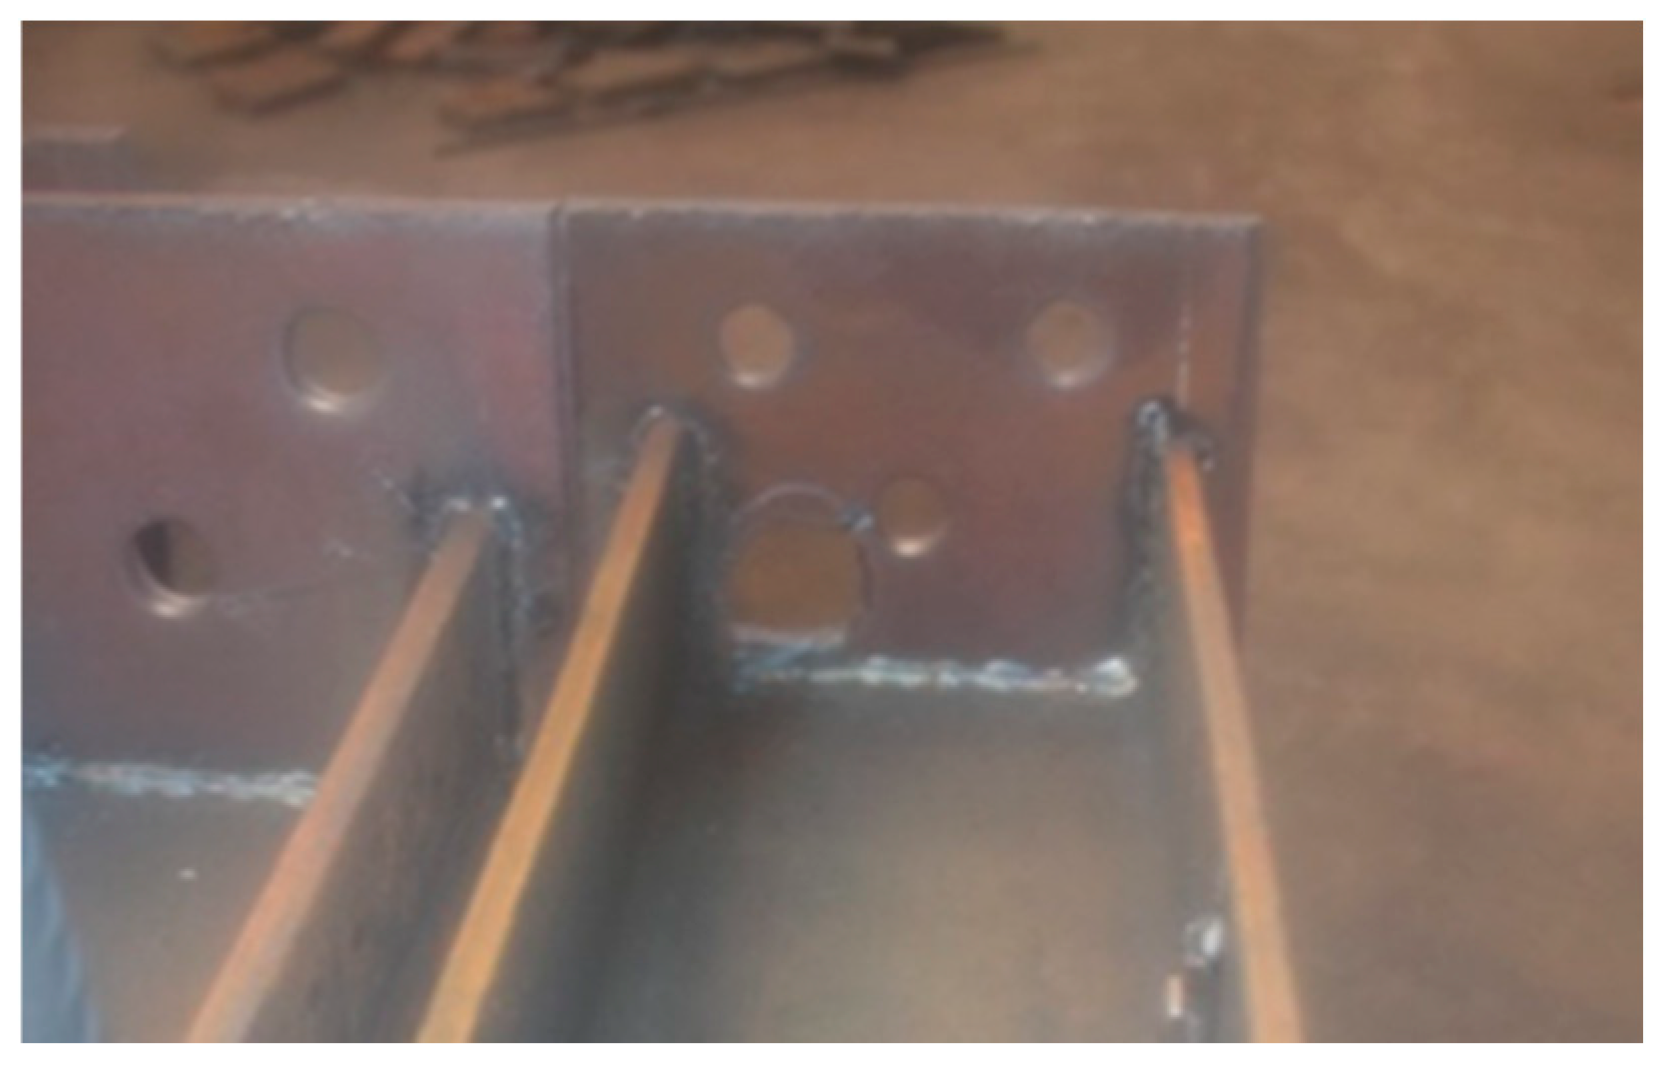
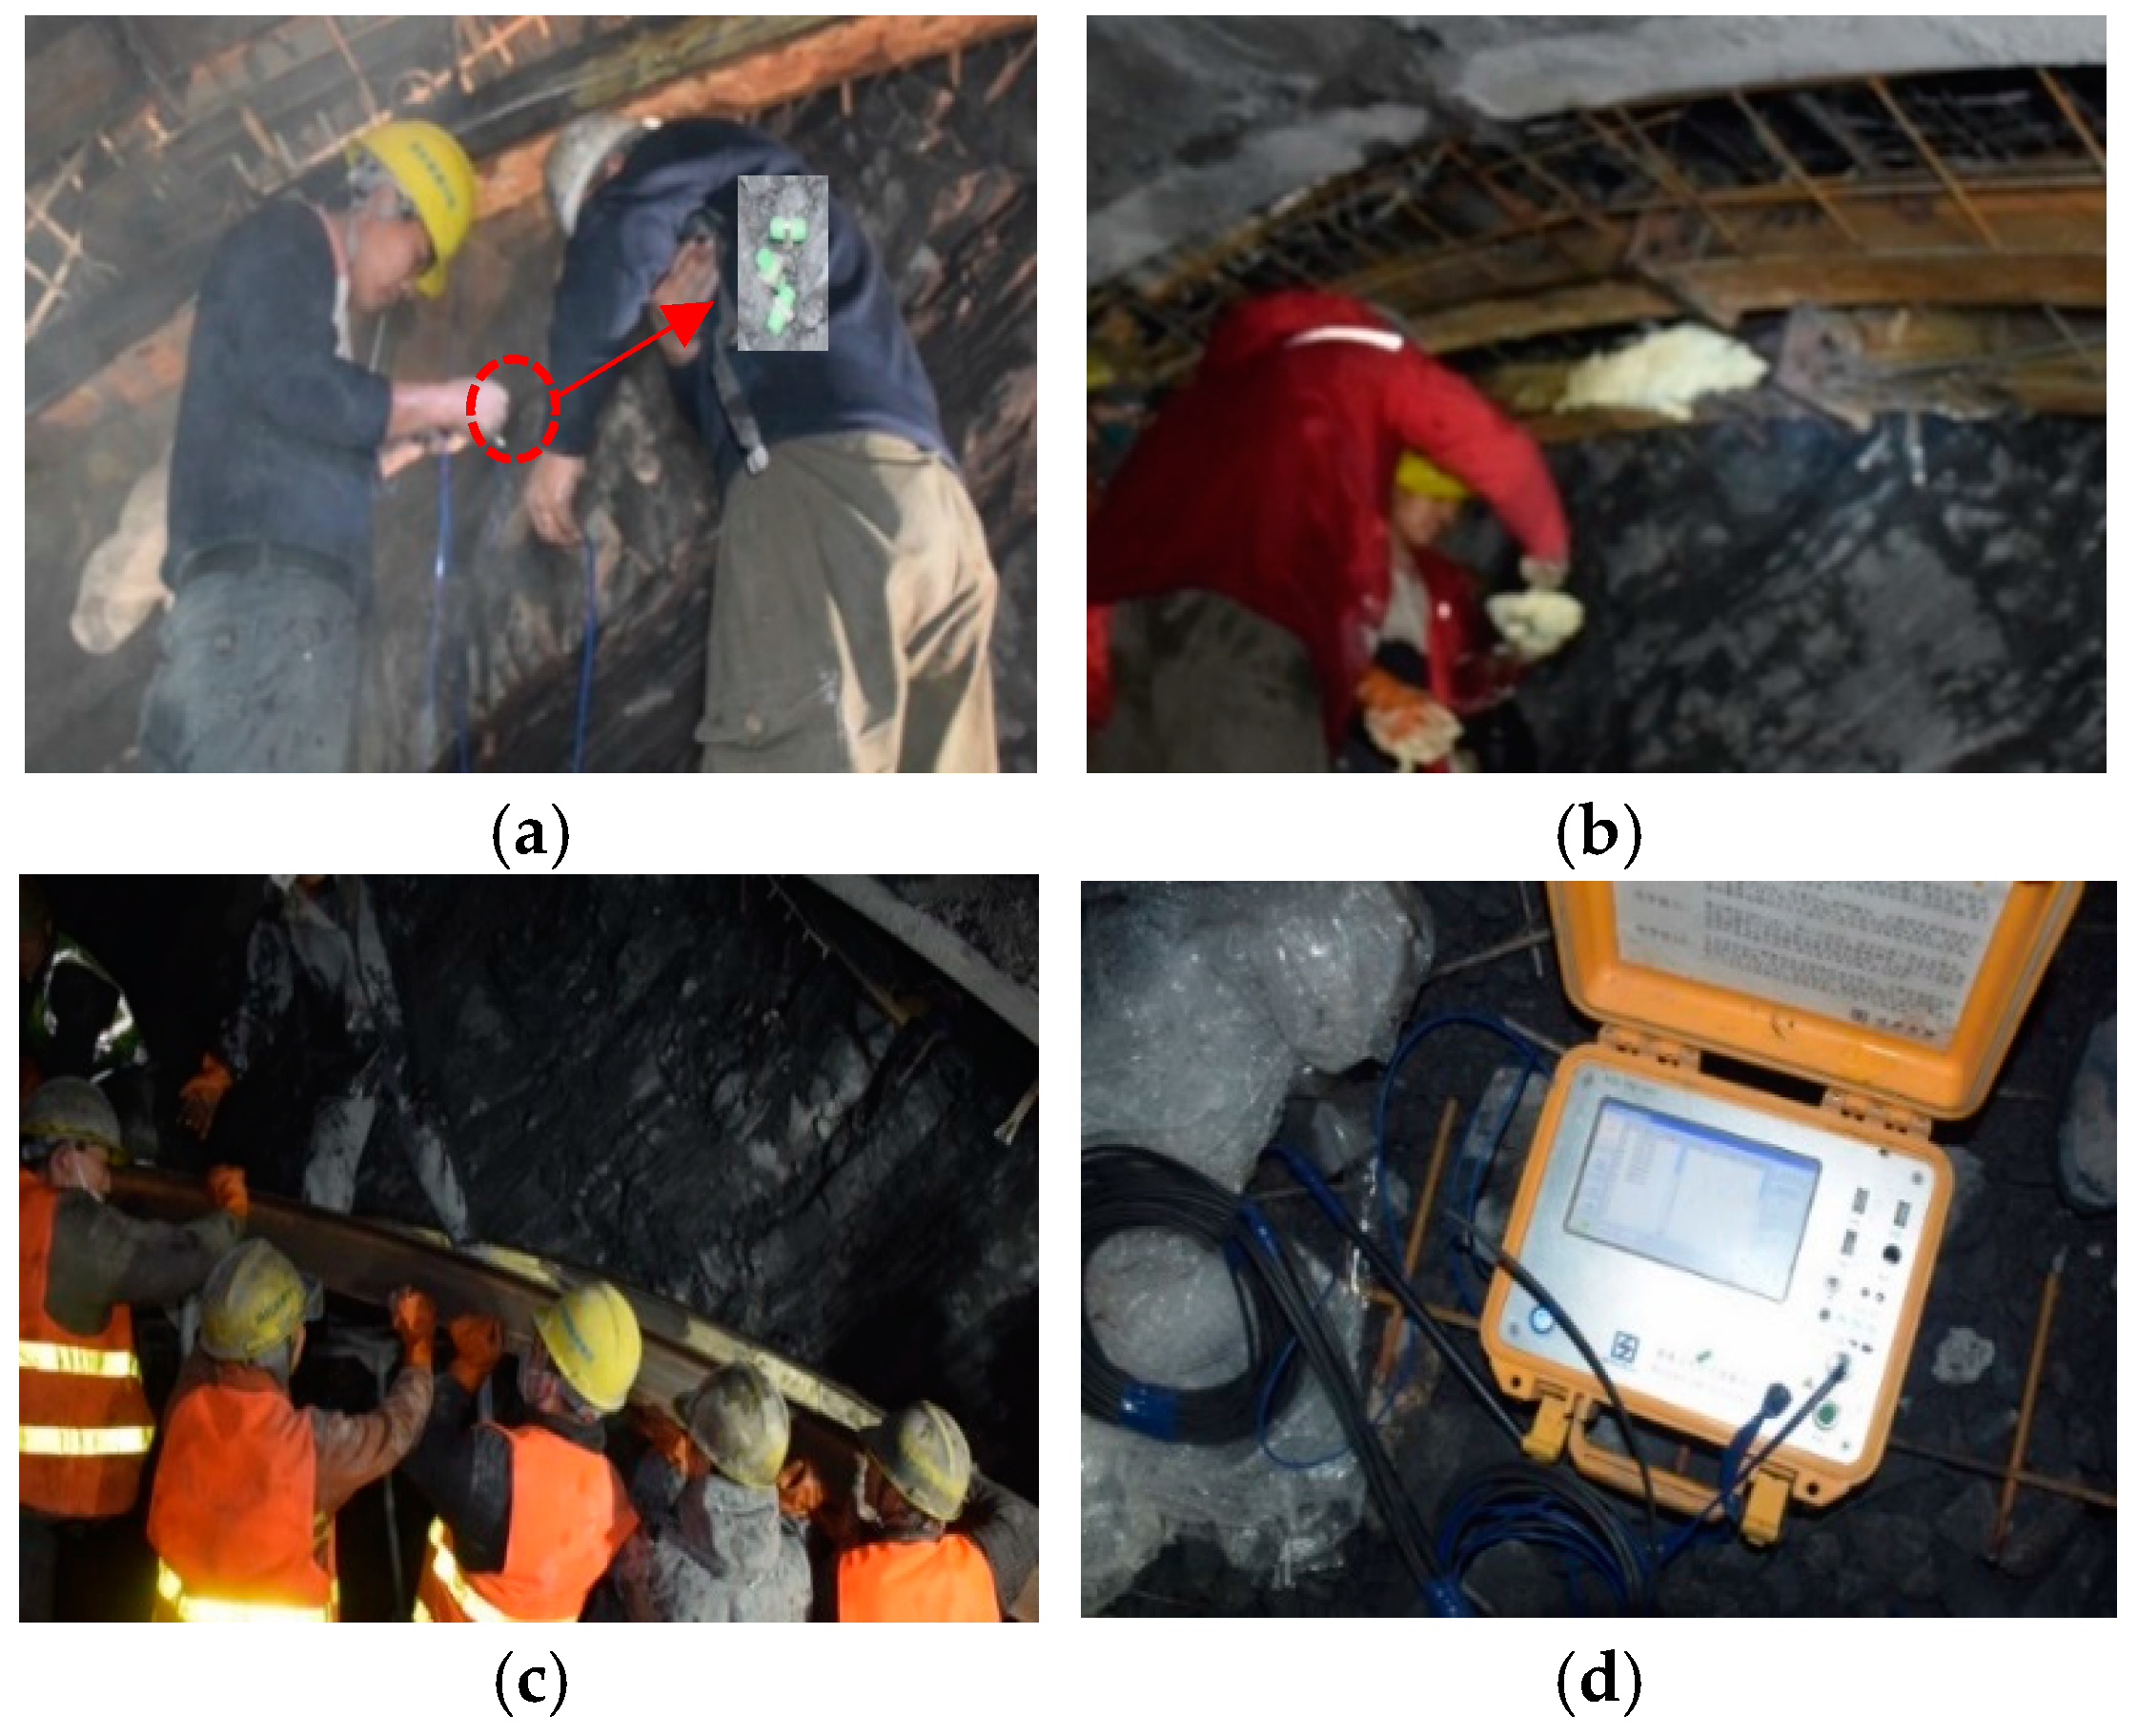
- In order to facilitate on-site installation and data recording, strain gauges were fitted to the steel arch at the desired position, as shown in Figure 16a, and the flange was used to connect the wires in series, as shown in Figure 16b. This method effectively reduced problems related to long fusion connection time and poor operability. After the docking was completed, the polyurethane foam was sealed to protect the circuit, as shown in Figure 16c. After all steps were completed, the respective sensor wavelengths across the appropriate time frame were recorded, and the recorded wavelengths were used as the initial wavelengths for subsequent data analysis, as shown in Figure 16d.
 Figure 16. Field installation and data logging. (a) Installation of steel arches; (b) flange connection; (c) line protection; (d) data logging.
- (4)
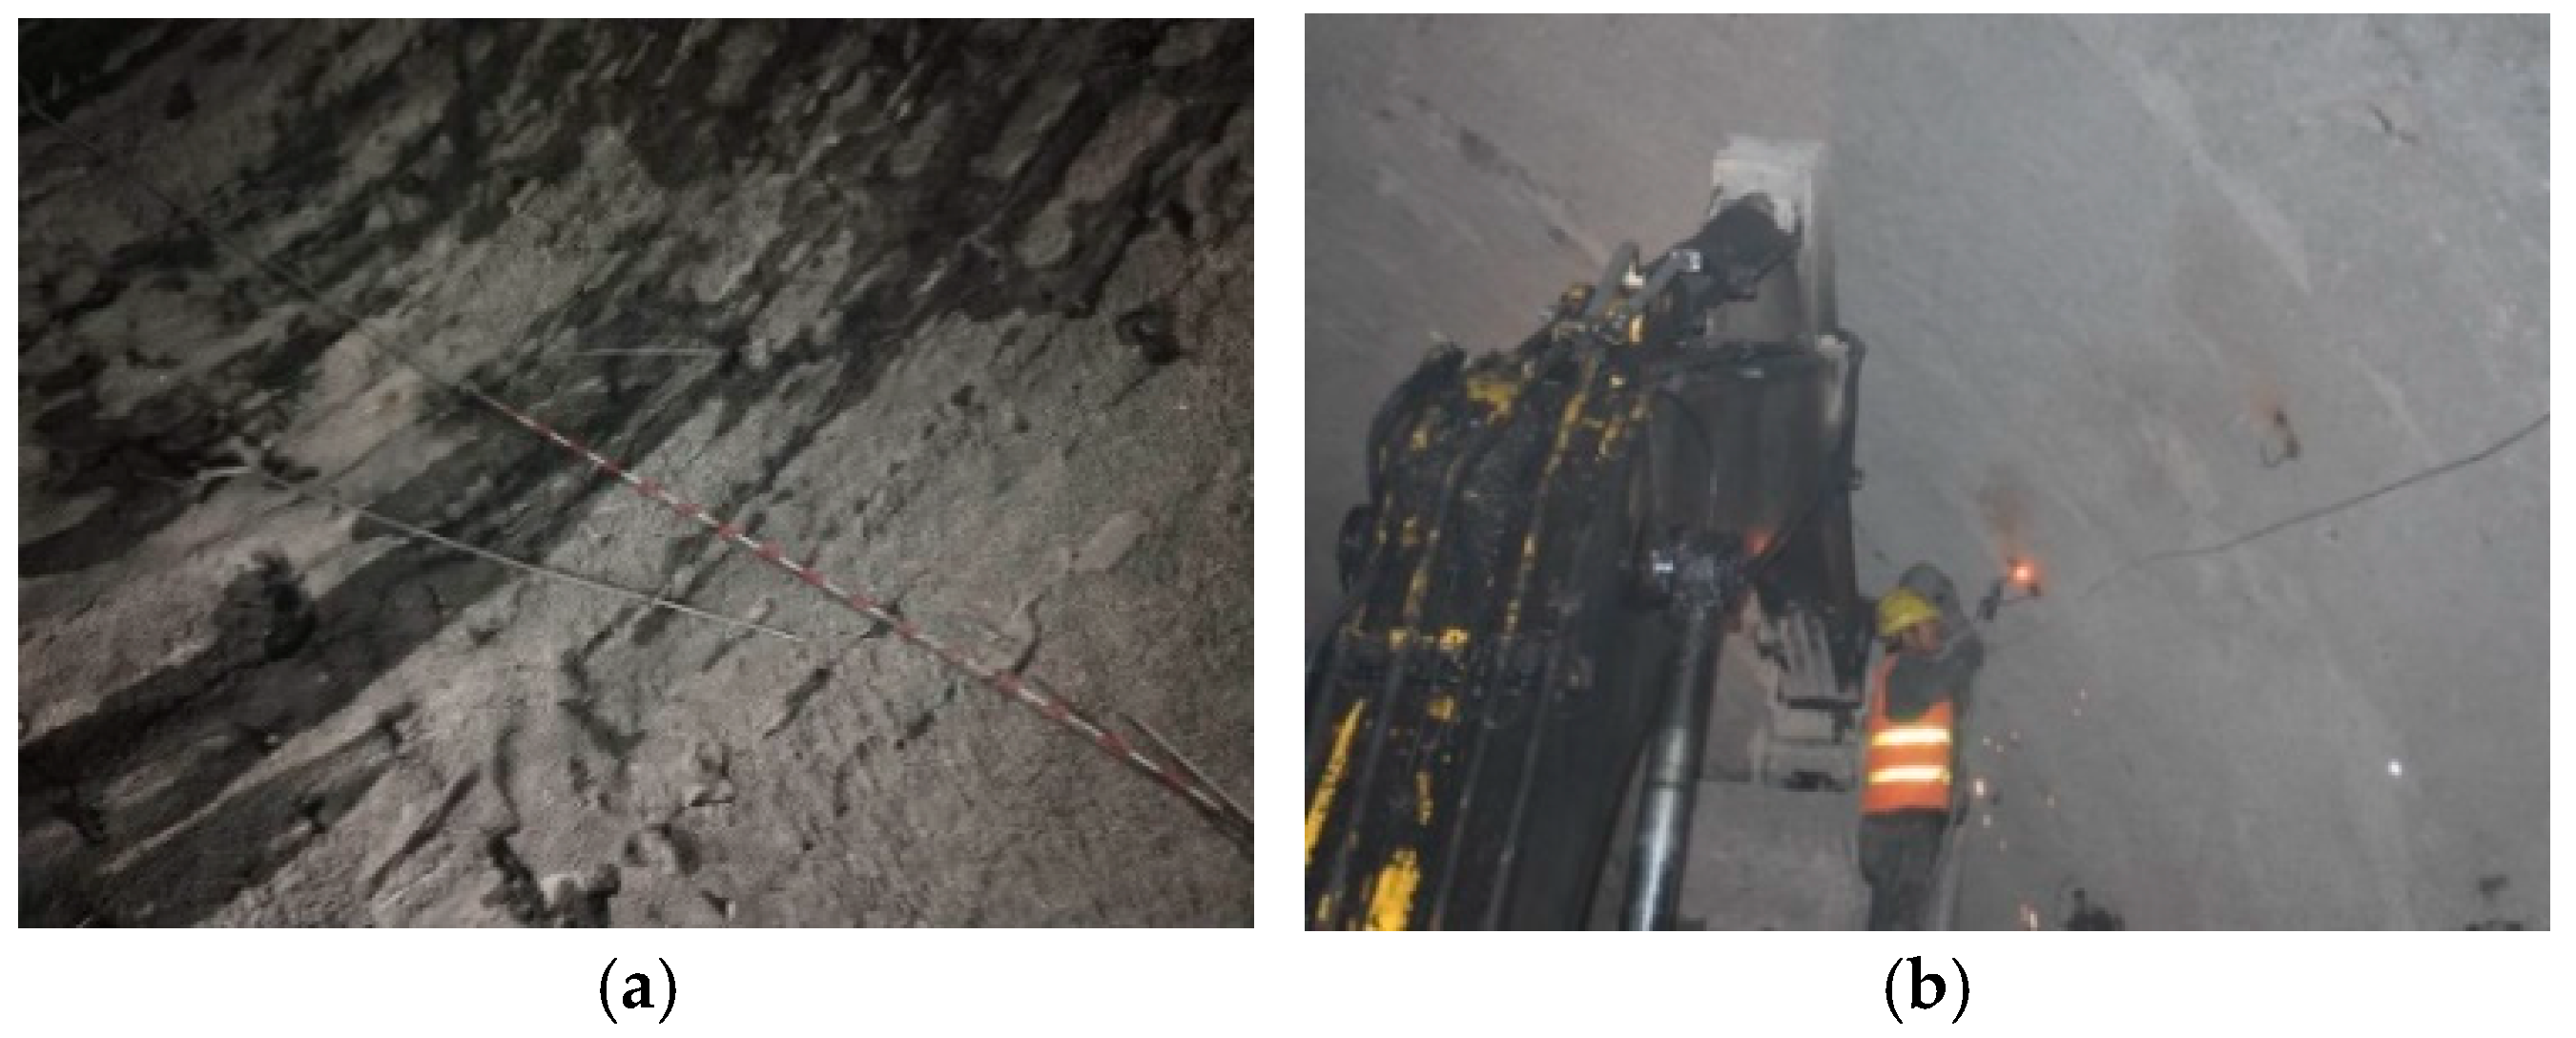
- Multiple optical cables were connected to the FBG wireless demodulator. First, the hook was welded, as shown in Figure 17a. Subsequently, these components were protected by galvanized steel tubes and reflective strips (Figure 17b). The protective effect was strong enough that the influence of blasting impact and stone crushing was avoided. In addition, the reflective strip provided a good reflective effect and prevented the excavator from tearing the line due to operation during slag removal.
 Figure 17. Peg welding. (a) Welding hook; (b) steel pipe + reflective strip protection.
3.5. Circuit Protection
Traditional installation methods are mostly on-site installation methods, which come with problems such as increased time consumption, low work efficiency, serious interference with normal construction operations, and a lack of conductivity with large-scale monitoring. Specifically, the subsequent operations of blasting and drilling concrete posed additional challenges that impacted the installation time. In addition, the on-site working space was small, and the above problems could therefore not be effectively solved by increasing manpower. Through field practice, it was found that the time required for sensor installation and wiring was about 2 h. In addition, the site geological conditions were harsh, the construction environment was complex and changeable, and issues with the line were frequent. The main types of line damage were blasting damage, man-made damage, and mechanical damage, as shown in Figure 18. Damage to the line directly led to the instability of data transmission, which seriously affected monitoring quality and continuity. However, the reliable transmission of data could be ensured via effective protection of the line. The existing installation method was not suitable for the construction of soft rock tunnels under high stress and high water conditions. In accordance with the relevant field processes and geological conditions, the author put forward a new line protection method.

Figure 18.
Line damage. (a) Man-made damage; (b) blasting damage; (c) mechanical damage.
For protection of the junction box, due to its extremely light weight, a distribution box was used. However, sometimes, an explosion occurred during the blasting process. Therefore, a 5 mm thick steel plate was used and welded to a 50 × 50 × 50 cm steel box, which was suspended and welded to a height, as shown in Figure 19.

Figure 19.
Protection of junction box. (a) Junction box failure; (b) distribution box; (c) steel box.
The wearable wire hose (Figure 20b) was used to protect the communication cable, but the protective effect was still not particularly strong, and blasting failures and excavator damage often occurred. Thus, further protection, using a galvanized steel pipe and a reflective strip (Figure 20c), was introduced. This protection method had good effectiveness and prevented damage from blasting and stone crushing. Moreover, the reflective strip provided a good reflection effect. In addition, these protective factors prevented excavators from tearing the wire during slag removal operations.
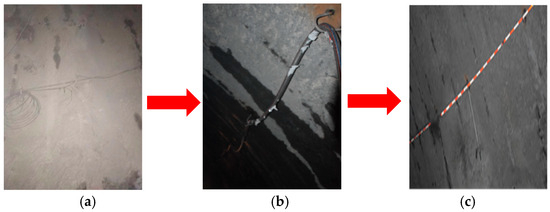
Figure 20.
Line protection. (a) Line damage; (b) wire hose protection; (c) galvanized steel pipe protection with reflective strip.
In order to avoid crushing caused by high ground stress, the lead wire was pre-punched using a PPR tube (Figure 21b), and the U-shaped cable was inserted into the bottom of the PVC tube to protect the displacement meter line. However, the tube presented strong bending resistance, insufficient flexibility, and unsatisfactory results. In the later stages, a flexible PE hollow tube was used to avoid the bending of the optical fiber line, which produced good results (Figure 21c).

Figure 21.
Protection of displacement meter lines. (a) No protection; (b) PPR pipe protection; (c) PE hollow pipe protection.
4. On-Site Monitoring Results Analysis
4.1. Monitoring Principles and Calculation Equation
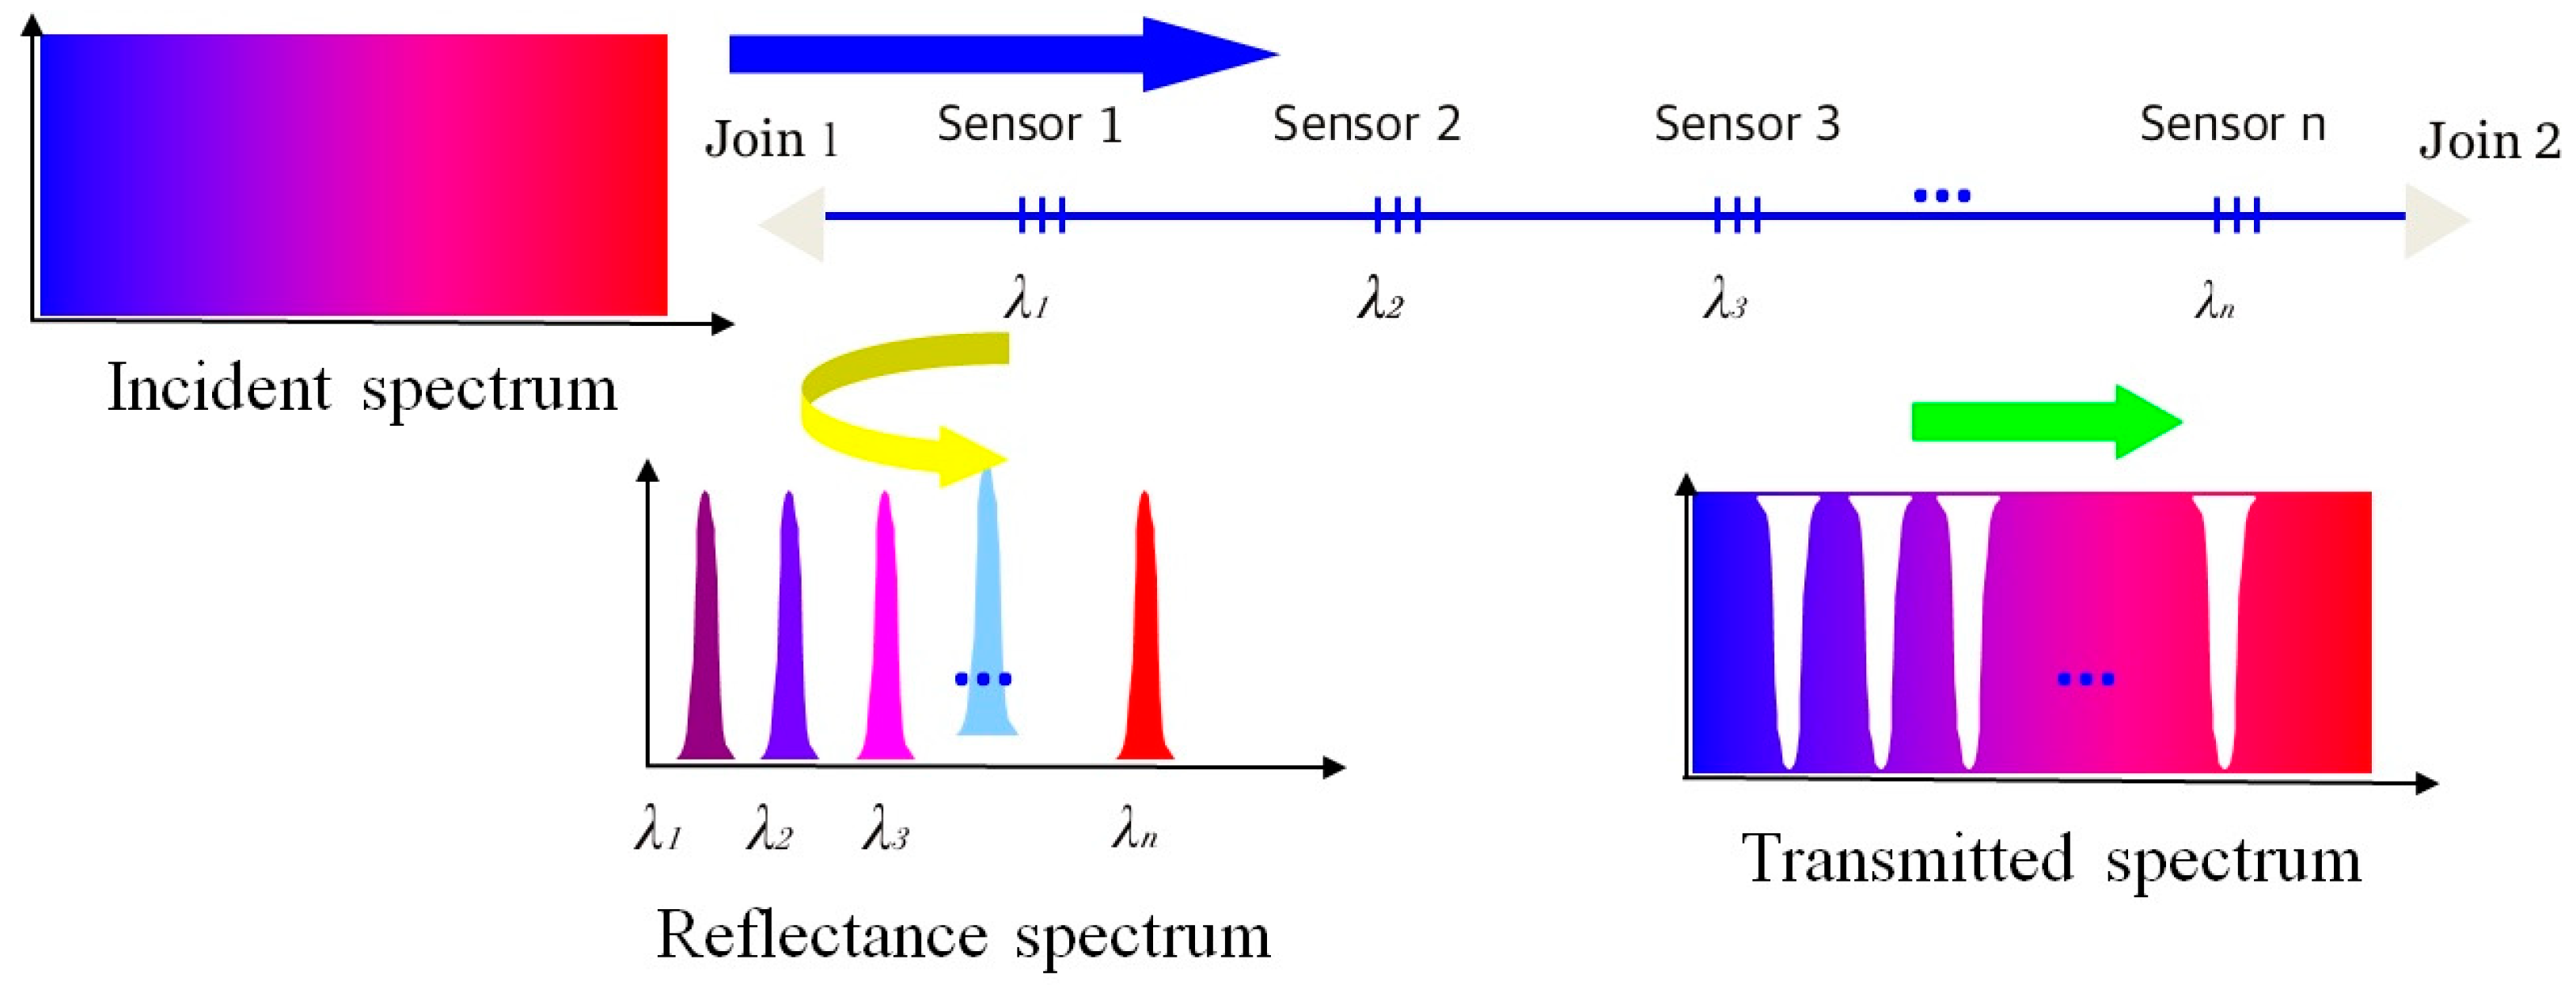
This project was mainly implemented using quasi-distributed fiber Bragg grating sensing technology (FBG). The quasi-distributed fiber grating sensing technology (FBG) was mainly used to integrate the fiber grating strain gauge into a number of different types of fiber grating sensors and install them on the objects to be measured, thereby generating the measured values of various deformation parameters of the objects. The principle of the detection system is shown in Figure 22. When a broadband light was transmitted through the FBG sensor, the incident light at a specific wavelength was reflected back. When an axial strain change was imposed on FBG, the center wavelength shifted through the Bragg condition.
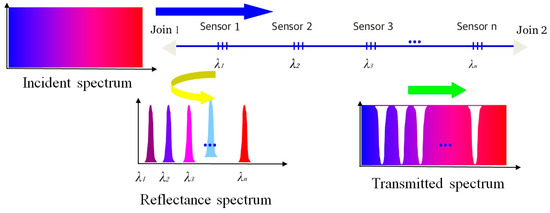
Figure 22.
FBG principle of sensing system.
The calculation equation was:
where 46.902, 45.009; P (nm) is the measuring wavelength; is the initial wavelength; is the temperature-compensated wavelength; and is the temperature-compensated initial wavelength.
4.2. Deep Surrounding Rock Convergence Deformation Characteristics
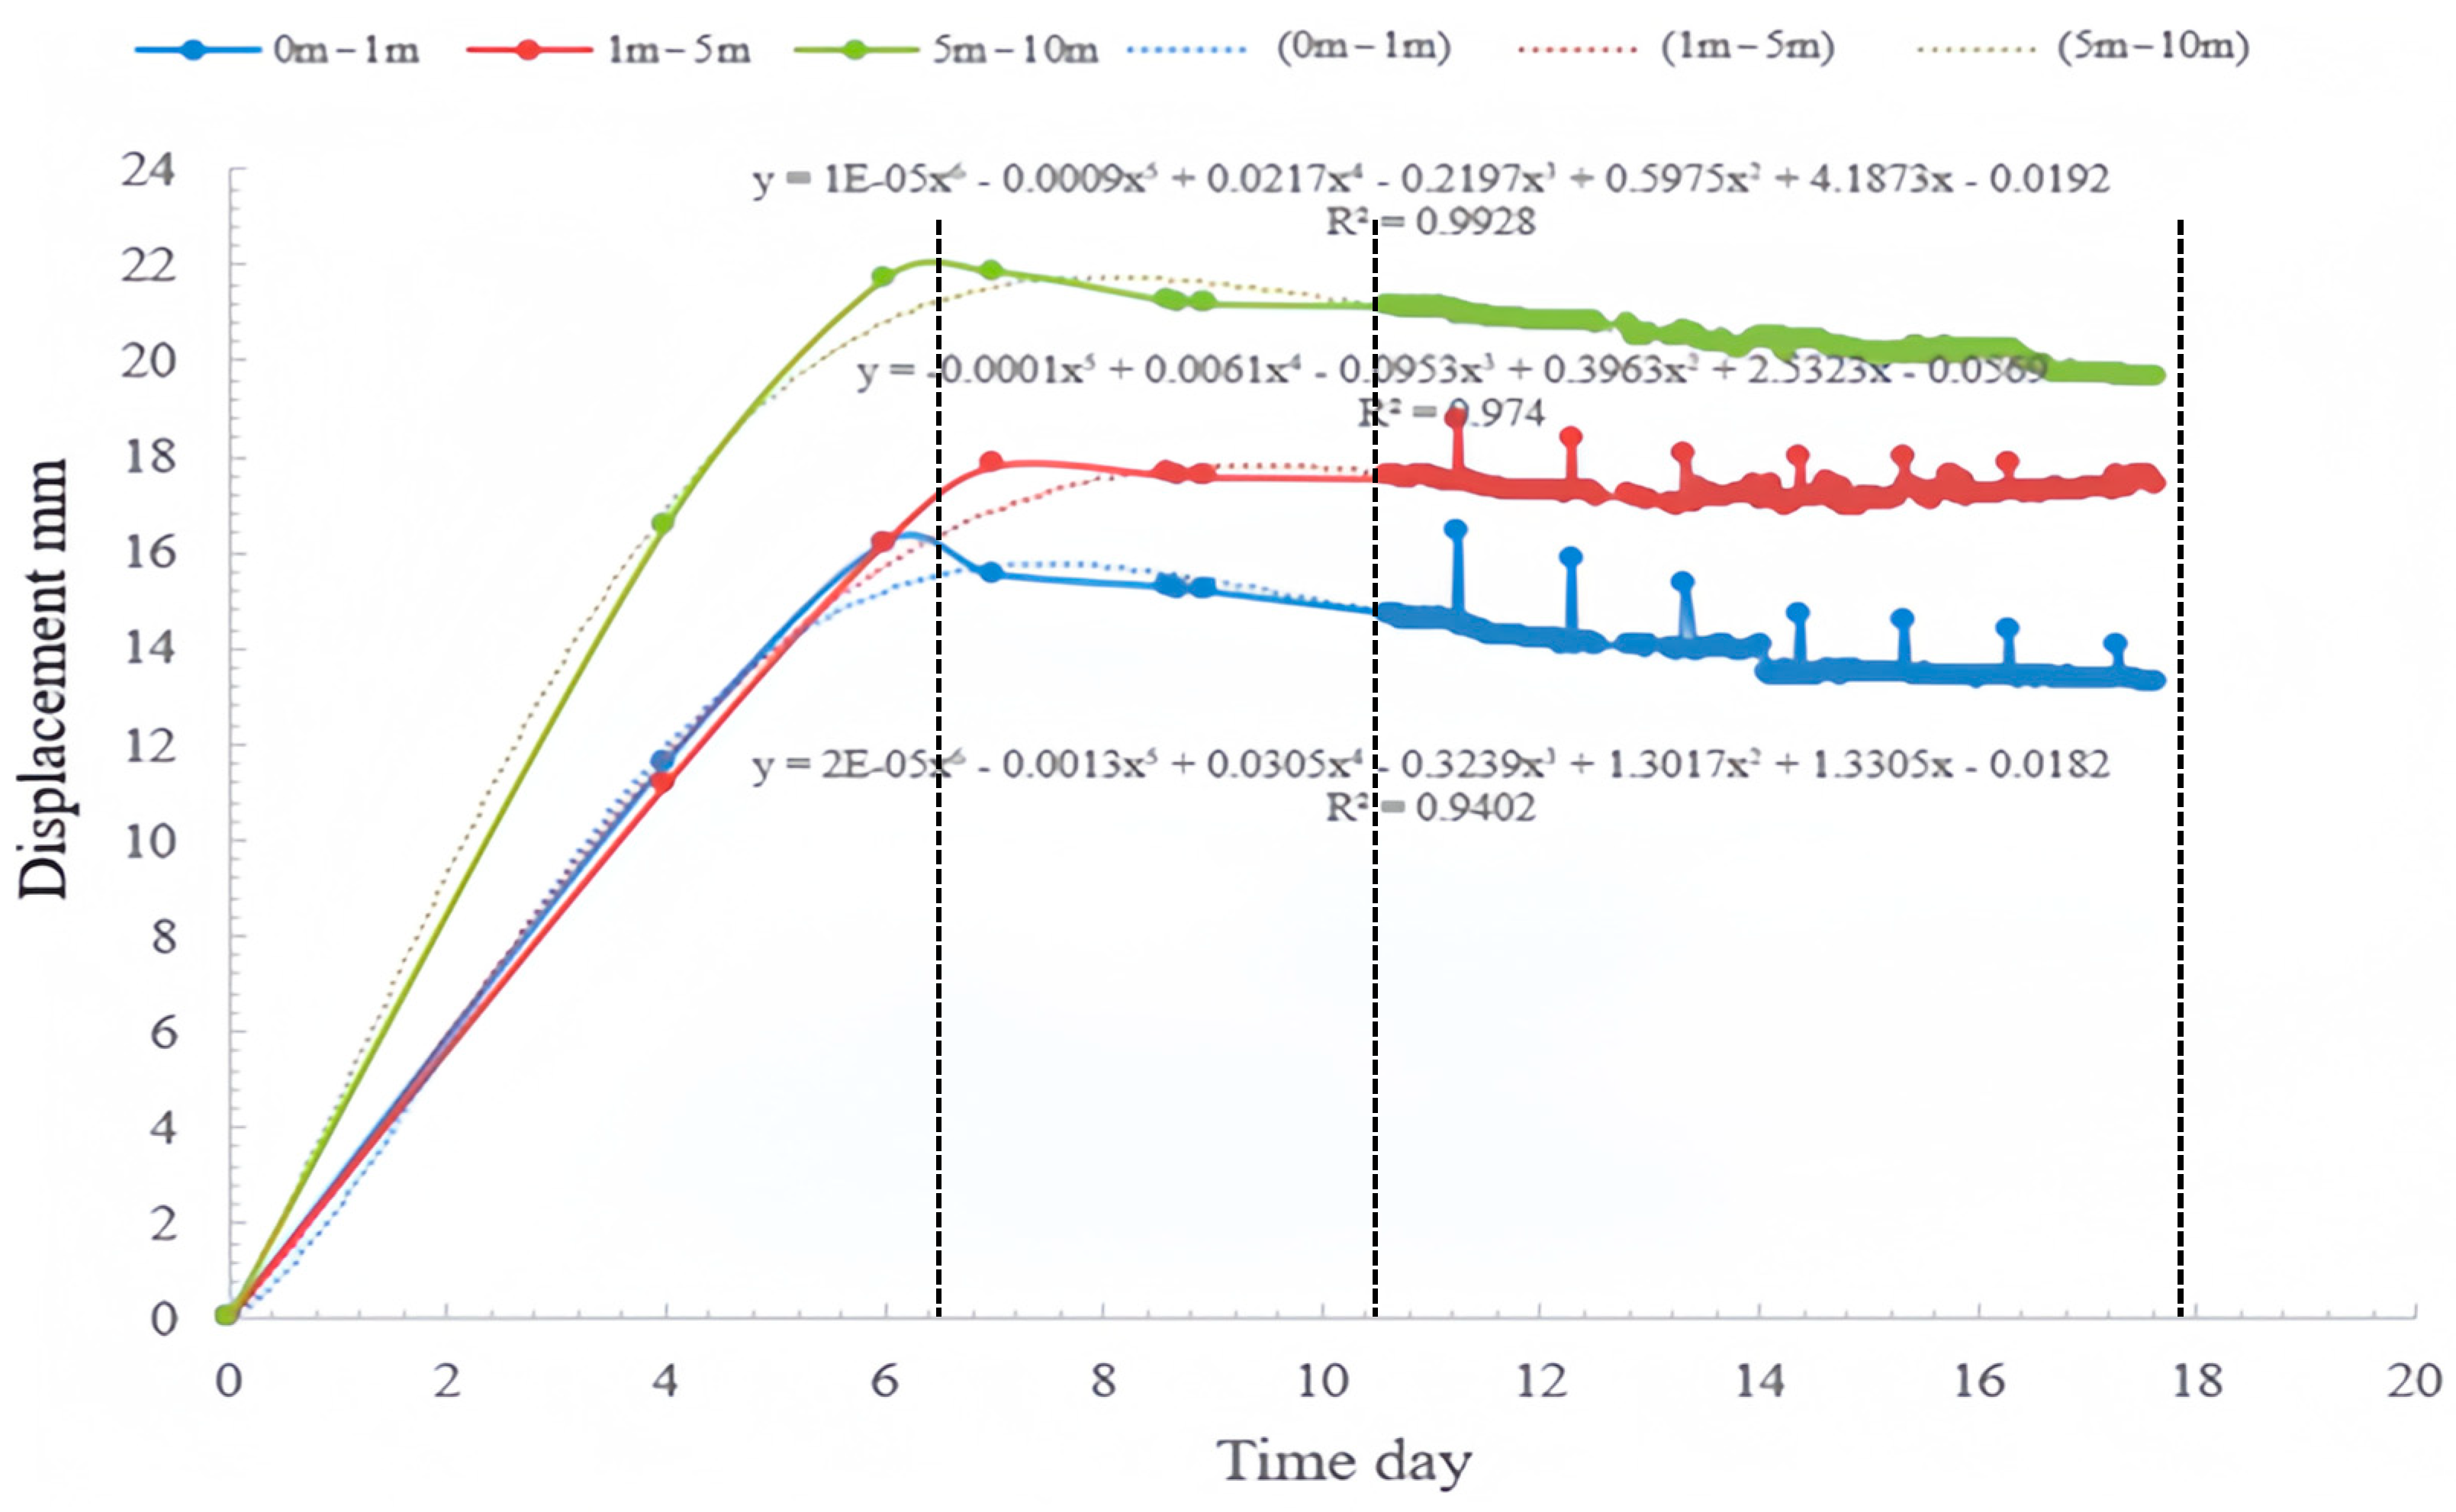
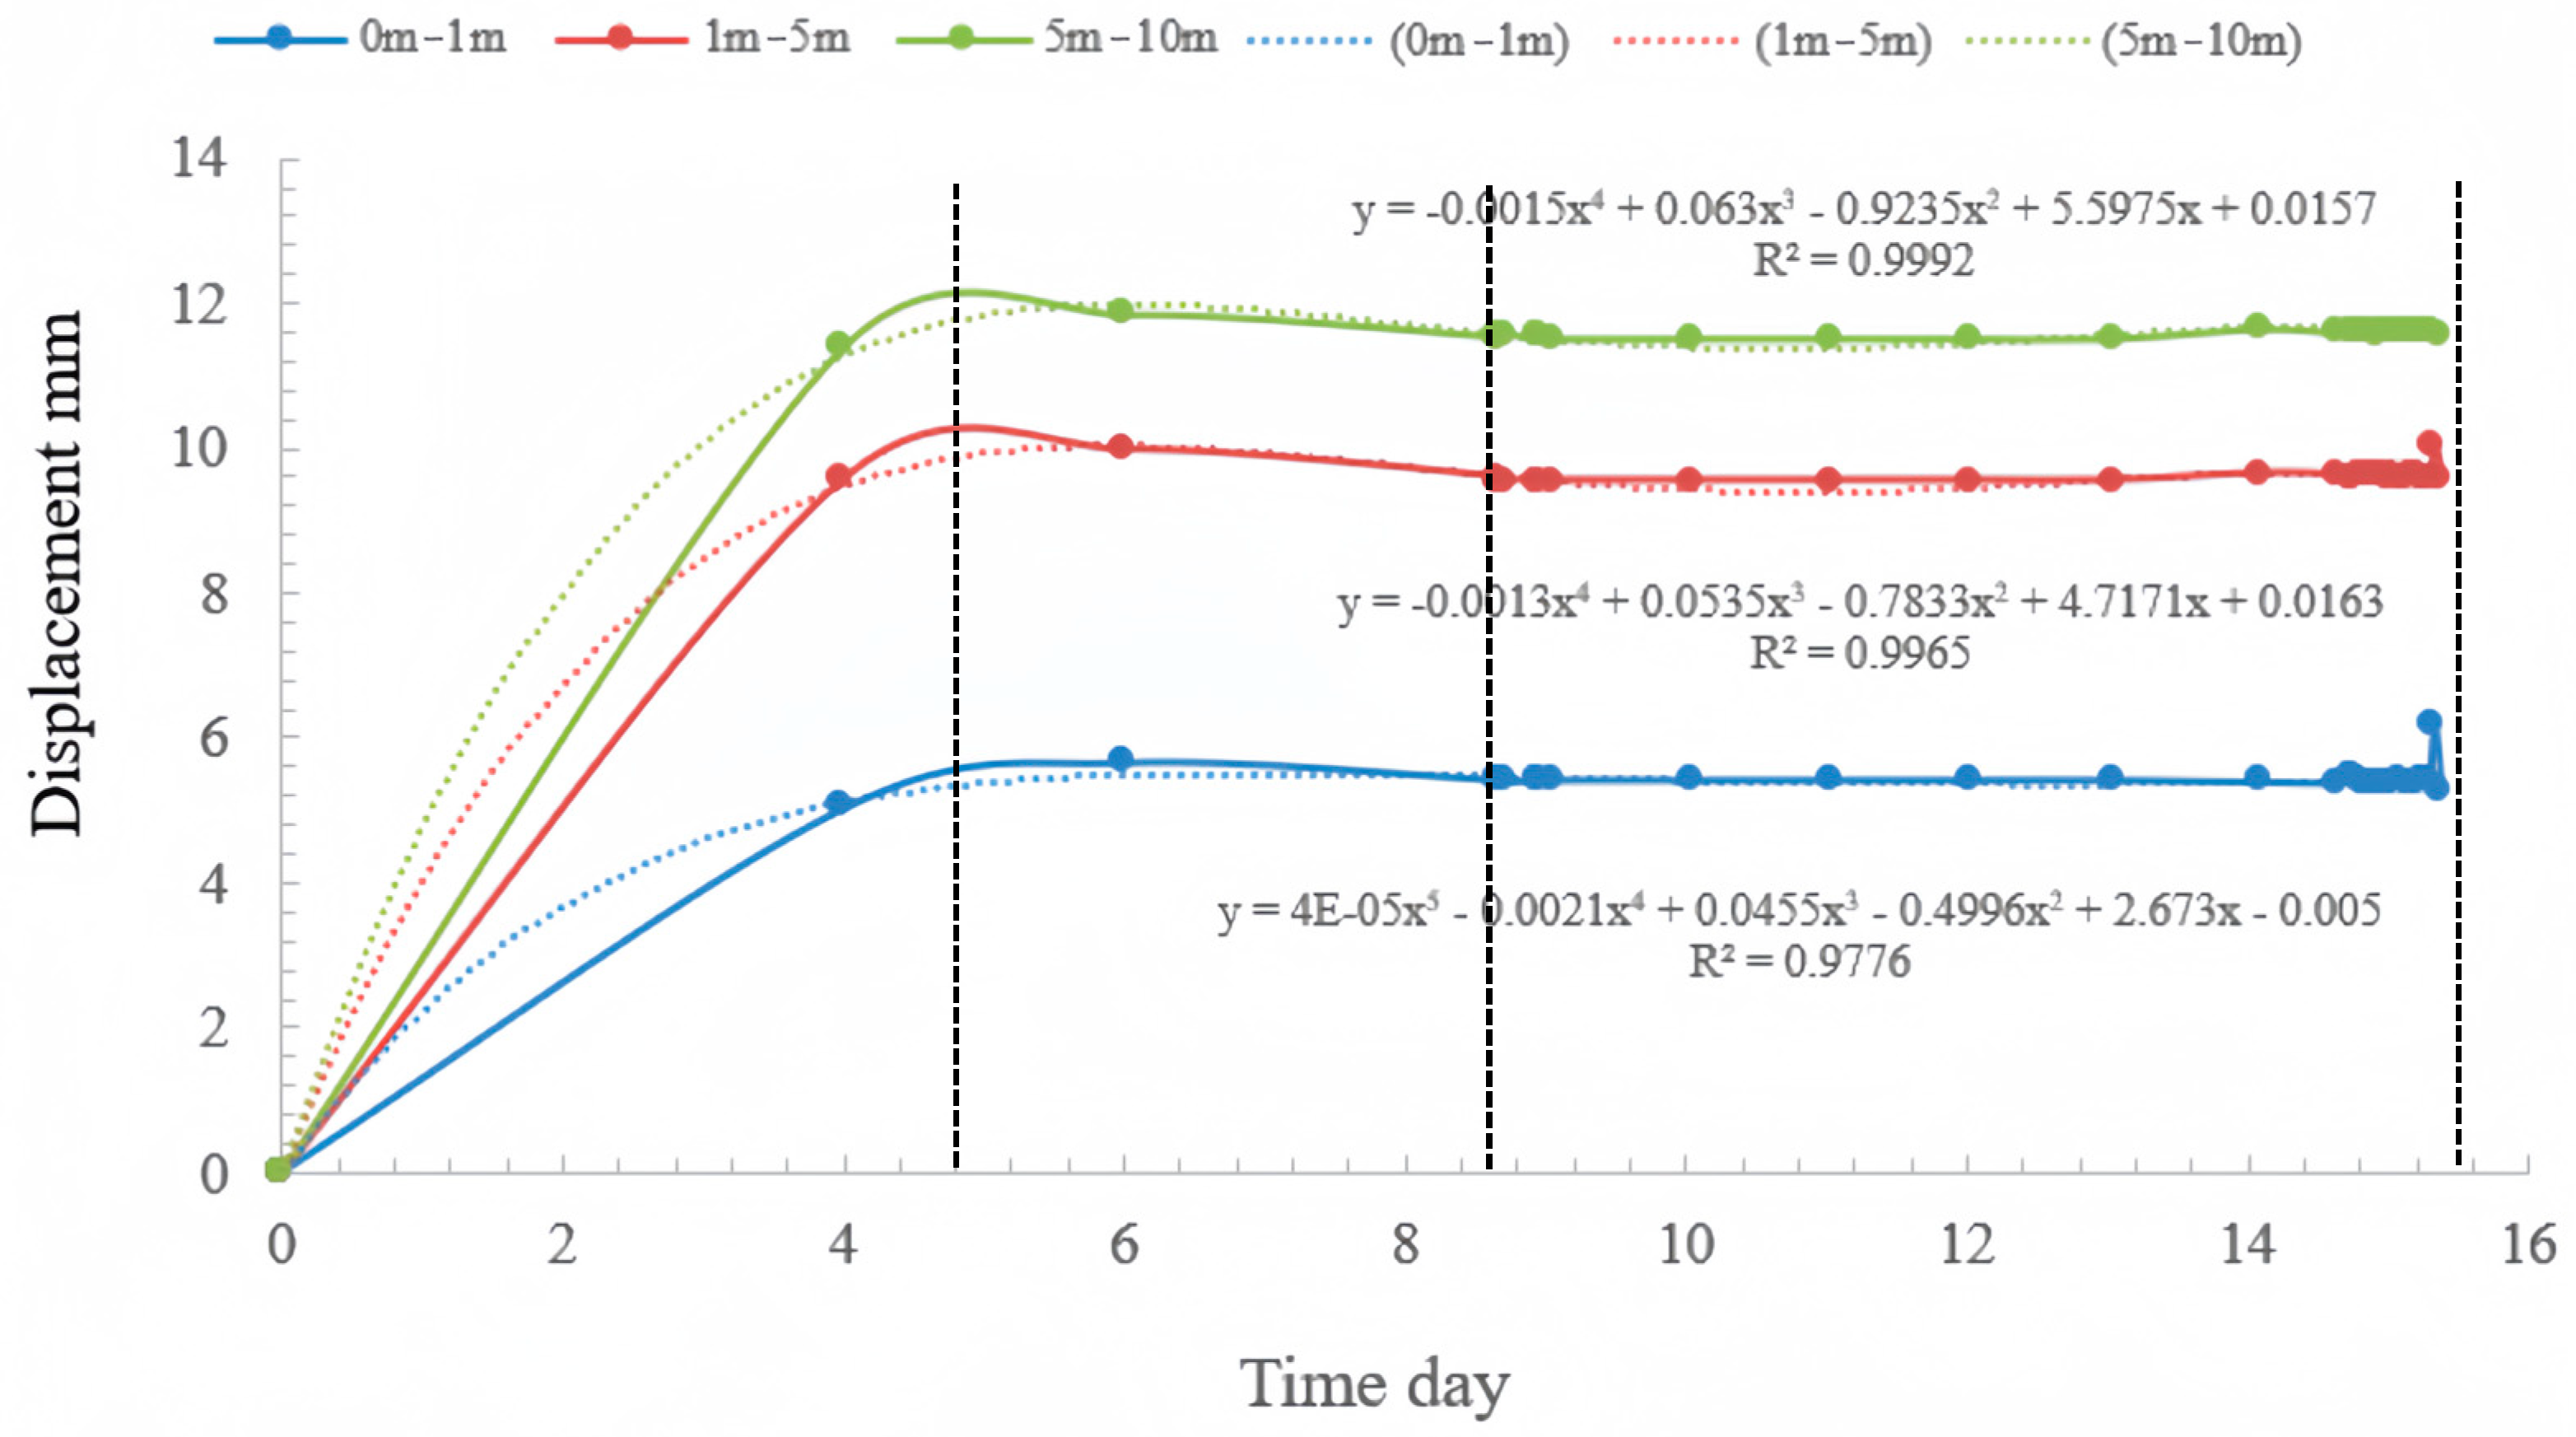
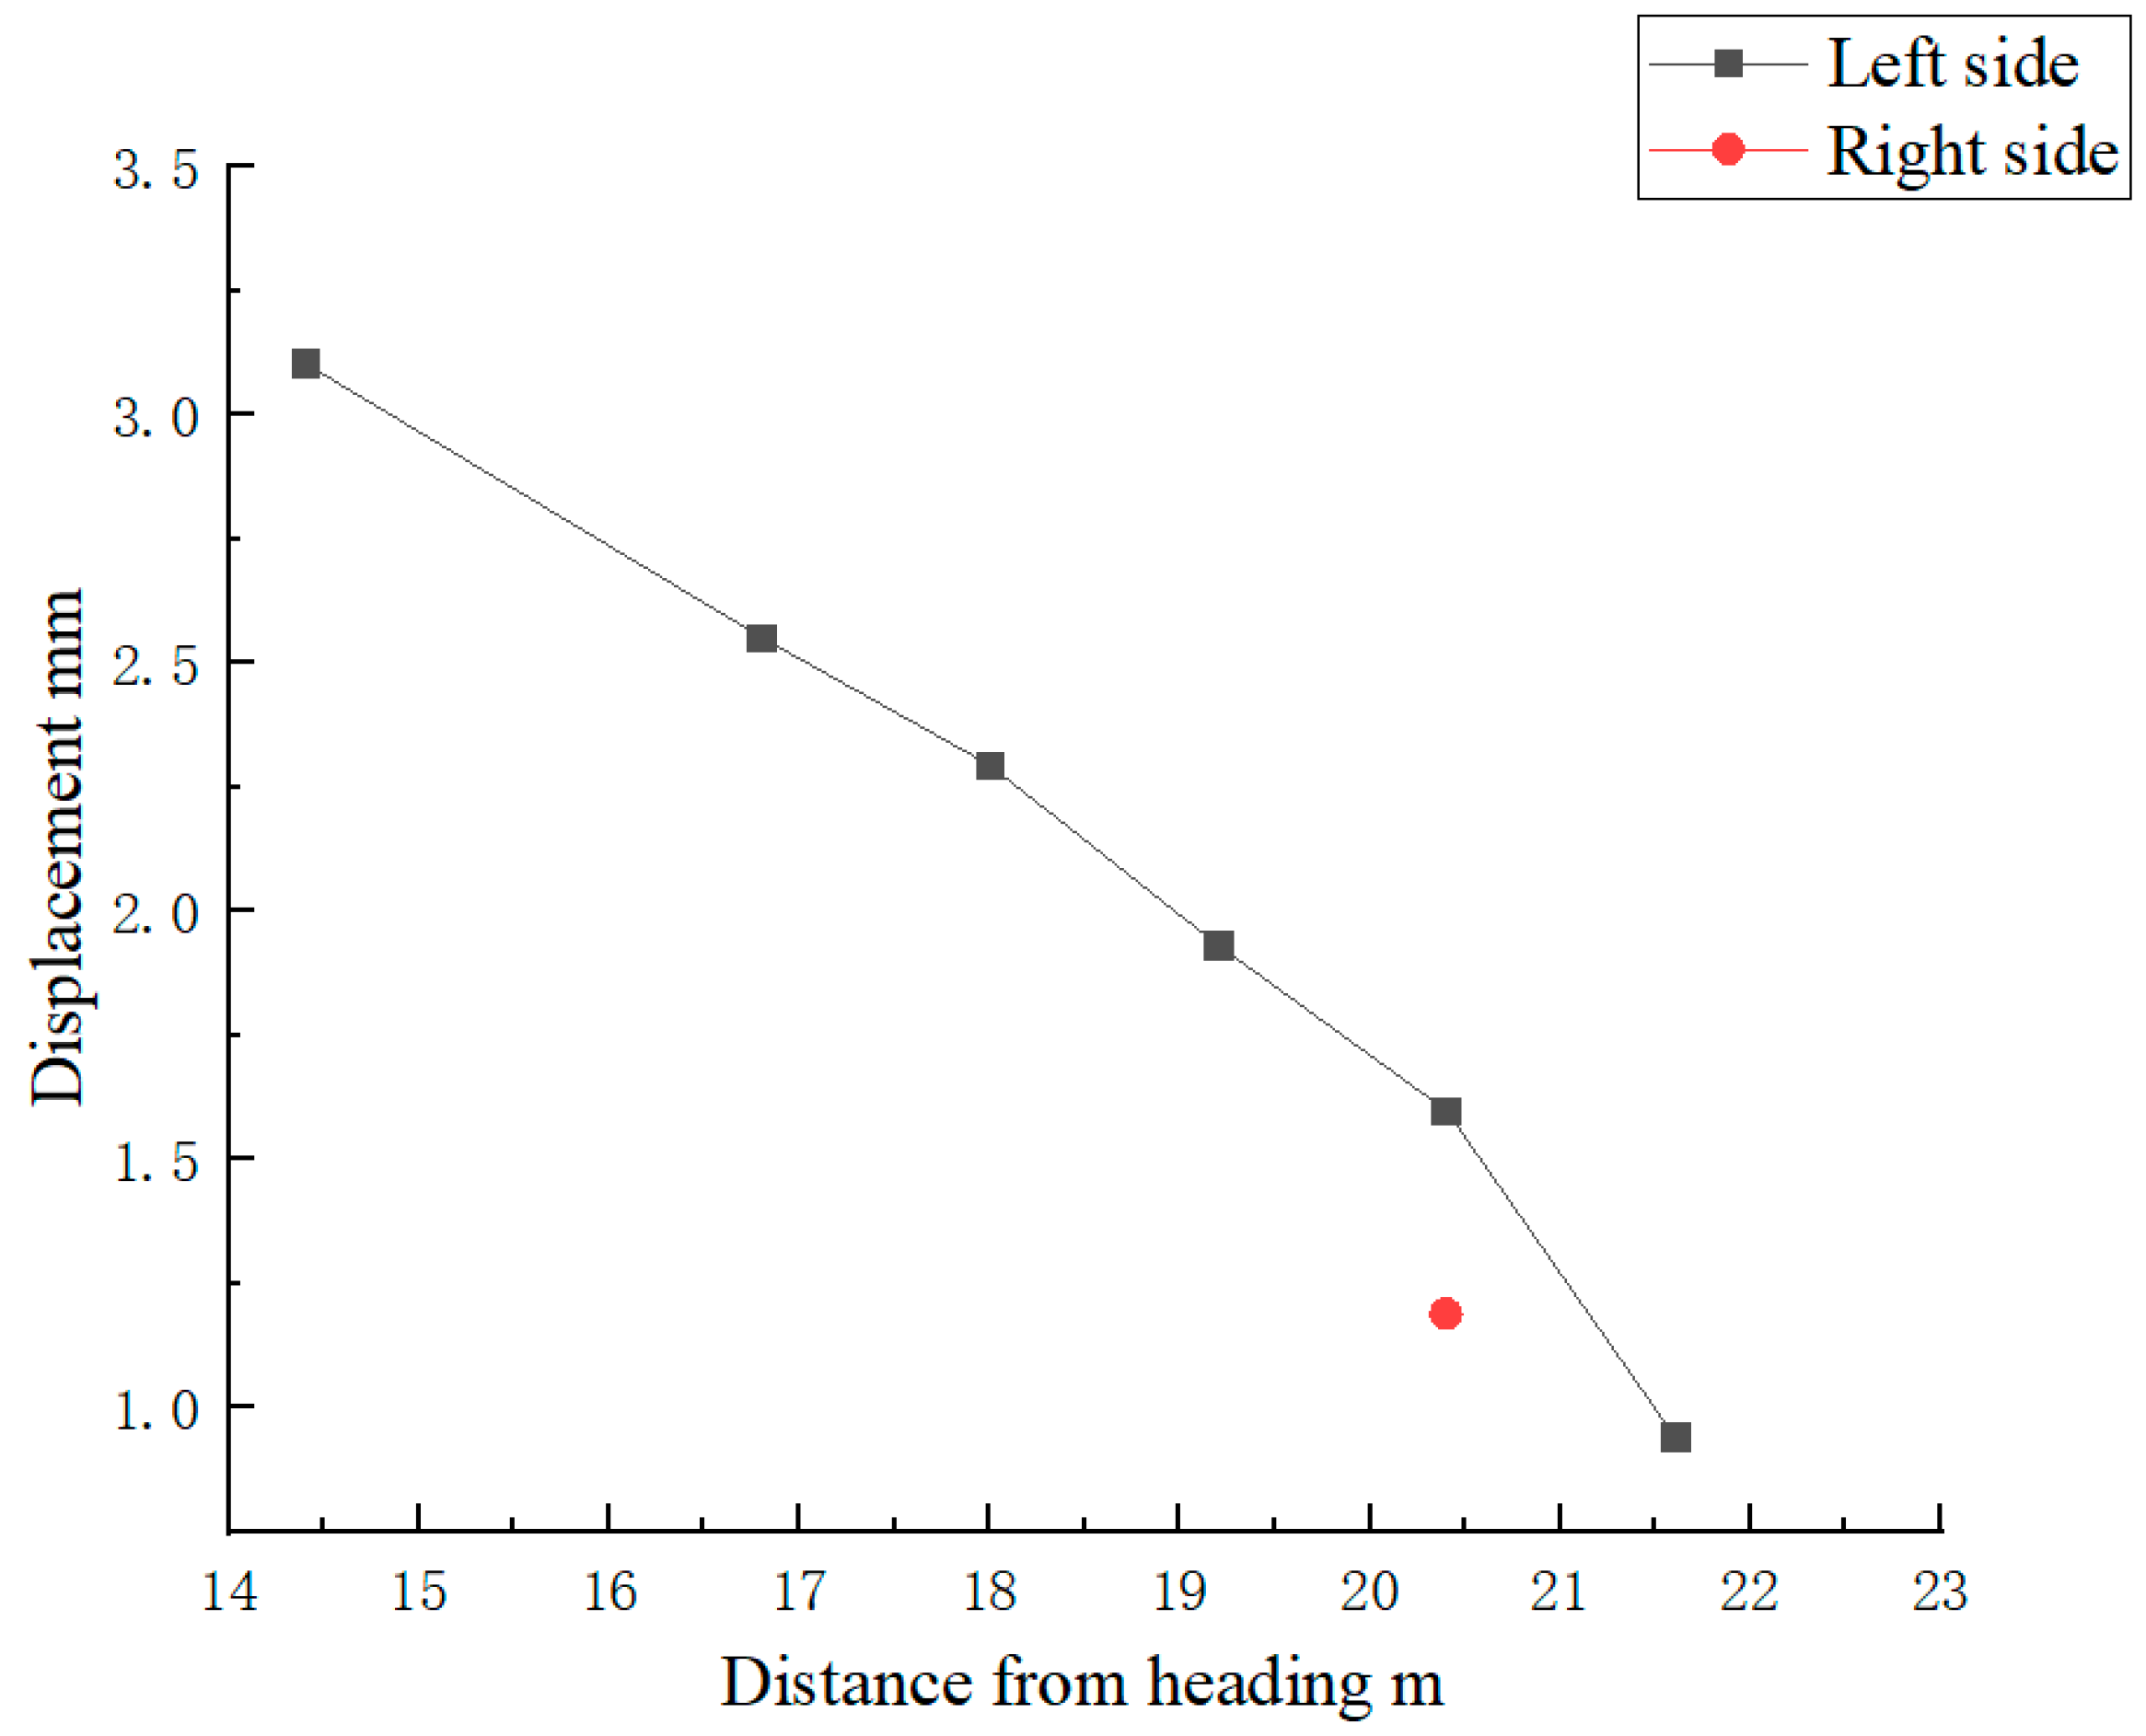
Through the monitoring and measurement of the tunnel, the convergence curve of the deep surrounding rock was obtained (Figure 23 and Figure 24). The deep displacement of surrounding rock increased with time in a manner of exponential decay, and the relationship is shown in Figure 23 and Figure 24. The analysis of the convergence deformation curve showed that on the whole, the convergence deformation process of surrounding rock followed three stages: a rapid deformation period, a deformation stationary period, and a stable deformation period. In general, the convergence displacement value of surrounding rock increased rapidly in the early stages, and with the development of time, after the deformation reached a certain degree, it finally tended to stability. According to the calculations, the cumulative convergence values of the surrounding rock on the left and right sides of the section were 55.85 mm and 27.48 mm, respectively, which showed that the degree of deformation and fragmentation in the left surrounding rock was much larger than that in the right side. Compared with the cumulative convergence value of 300~800 mm before support improvement, the displacement was obviously reduced, and the support achieved good results. During the same period, the cumulative convergence values of surface displacement provided by the construction party were 79 mm (left side) and 46 mm (right side), which were greatly different from the data of the optical fiber displacement meter group. This might be due to the error-prone nature of, and lack of rigor in, manual operation. Locally, due to the interval arrangement of the 4 m NPR anchor cable and 10 m NPR anchor cable, the surrounding rock formed an overall layered plate structure at about 5 m and about 10 m, resulting in a large displacement fluctuation in the 5–10 m section. Thus, the convergence value of the 5–10 m section on the left and right sides was the largest. Because the 0–1 m section represented the loose fracture zone of the surrounding rock, the 0–1 m section also had large displacement. The prominent scatter points in the figure are the displacement fluctuations caused by blasting.
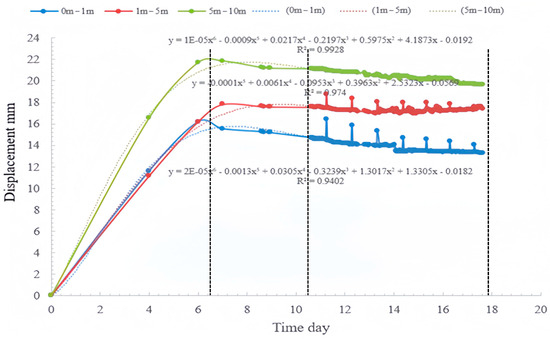
Figure 23.
Time–displacement curve (left side).
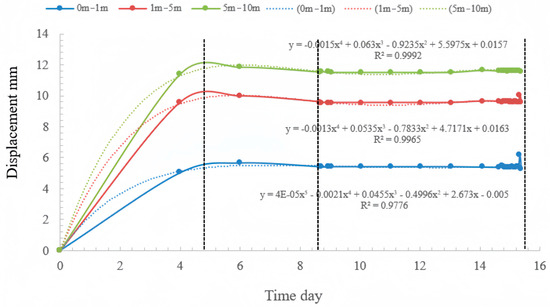
Figure 24.
Time–displacement curve side (right side).
4.3. Determination of Surrounding Rock Loose Circle Thickness
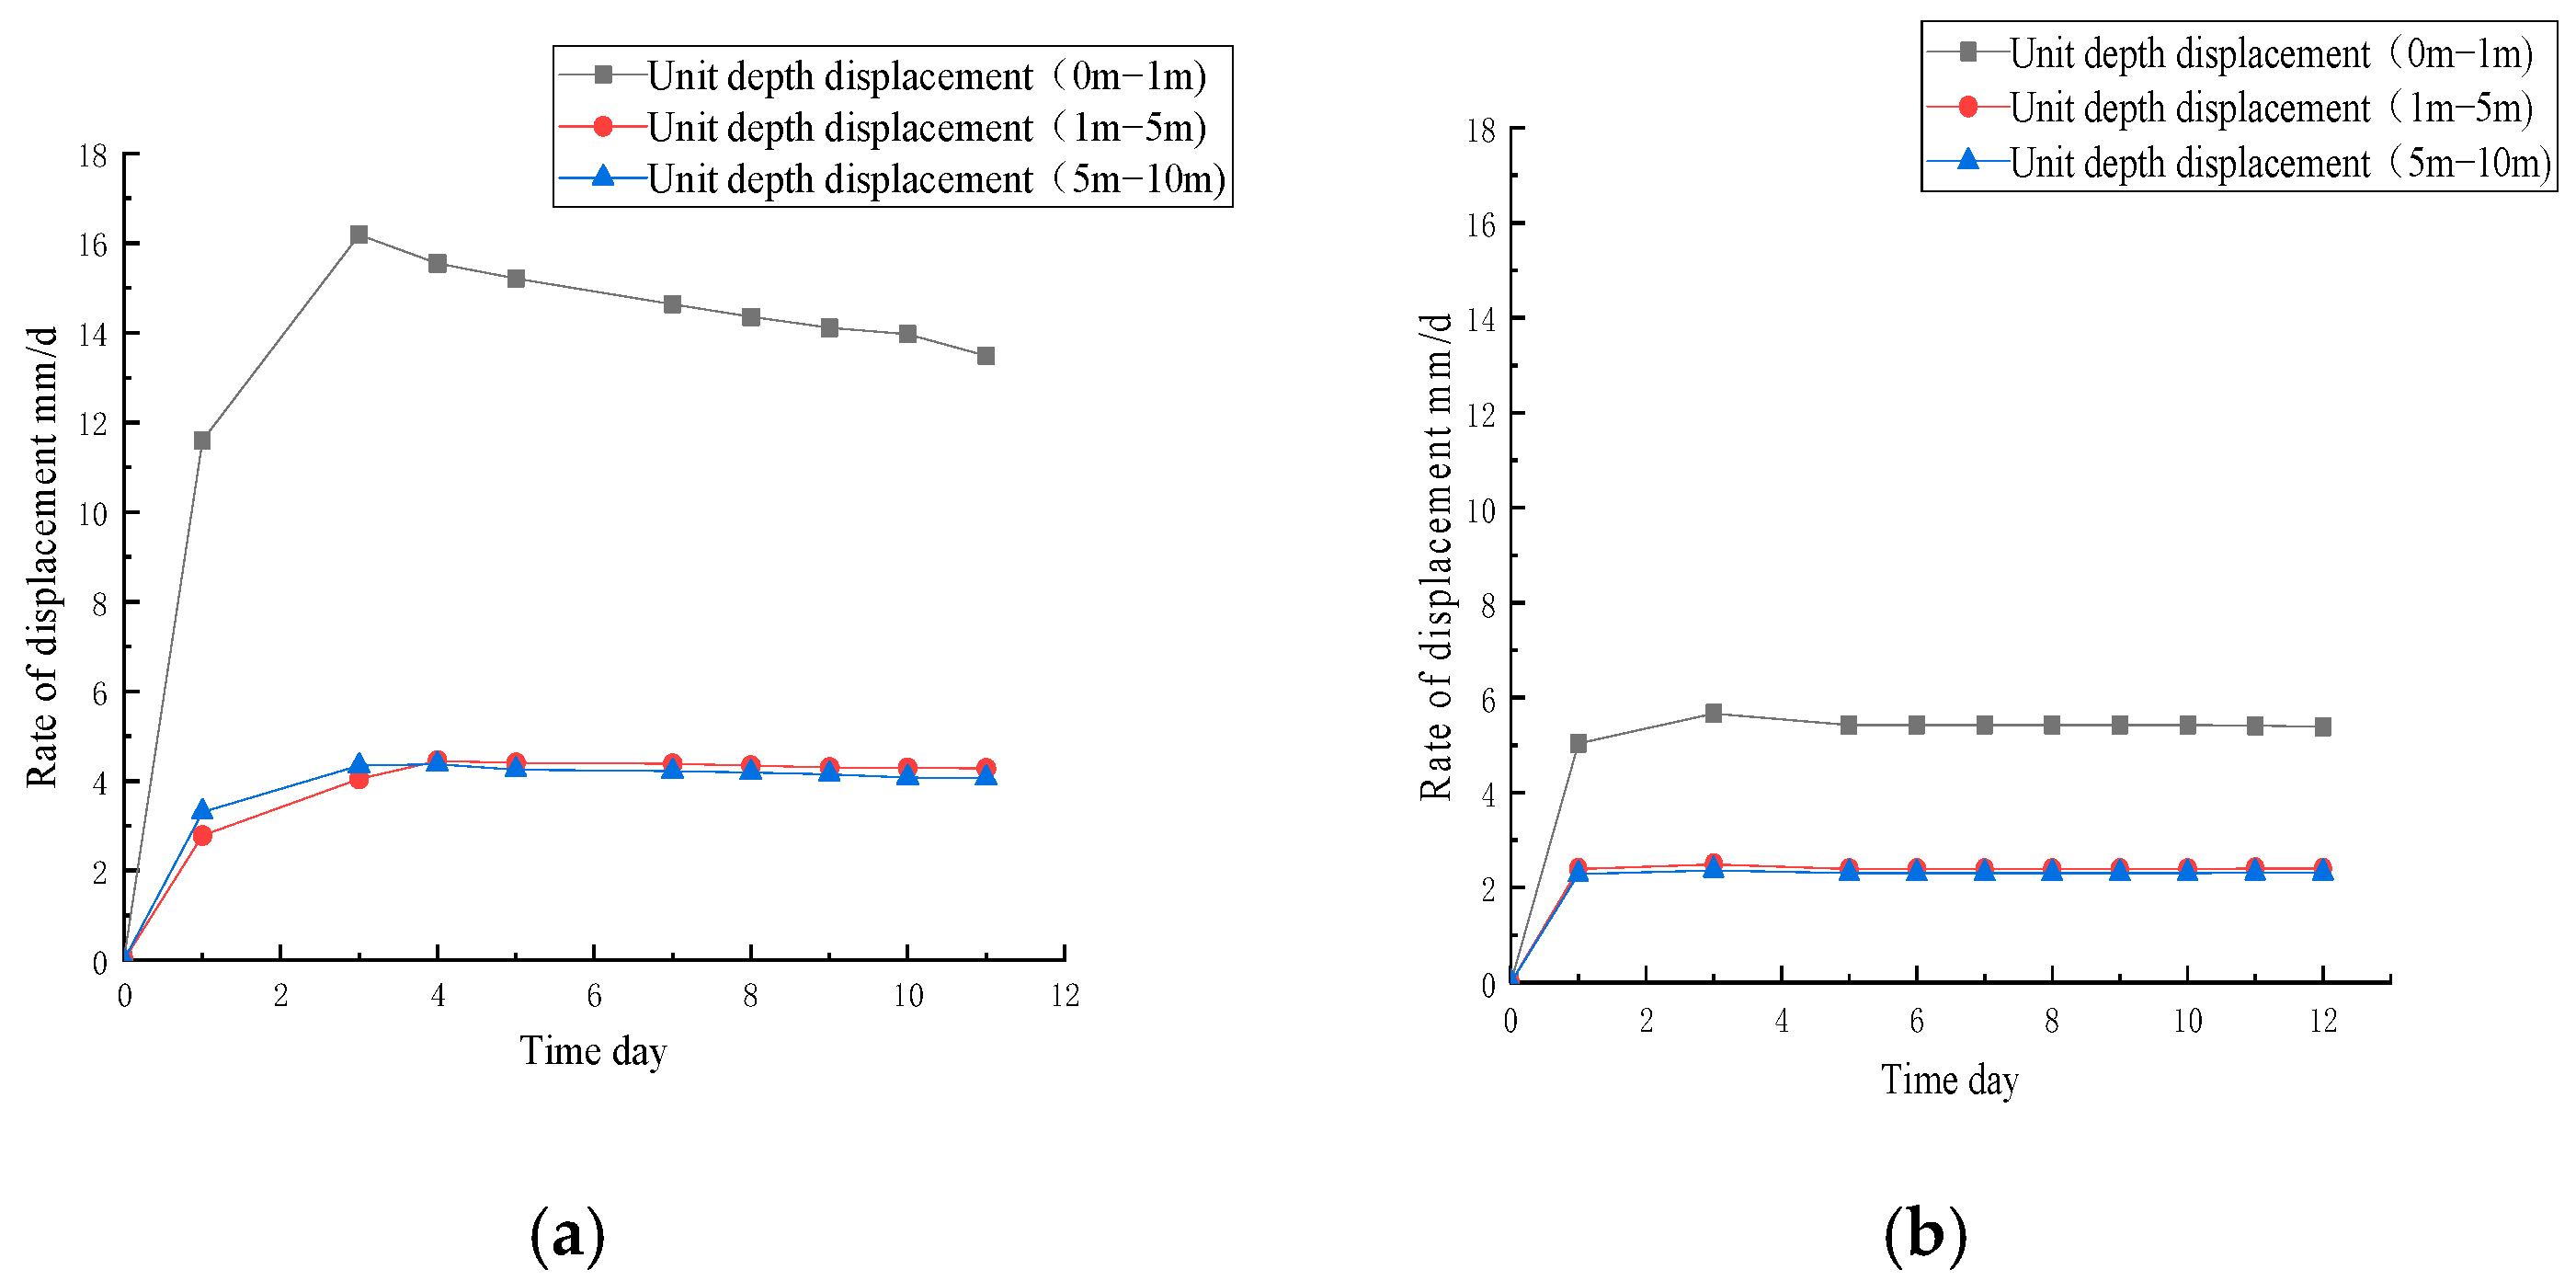
By measuring the thickness of the loose circle, the range and degree of influence of tunnel excavation activities on the surrounding rock could be grasped in detail. Based on this, the tunnel support parameters could be reasonably corrected, and lining construction could be adjusted in a timely and accurate manner, so as to achieve informed construction. At present, the commonly used loose circle thickness test methods are the acoustic method, the geological radar method, and the borehole camera method. However, these methods are complicated in terms of operation and are inconvenient for engineering applications [28]. Through data processing, the unit depth displacement rate curves of the surrounding rock at three sections within 10 m of the left and right sides of the main section were obtained, as shown in Figure 25. Through the analysis of the characteristics of the above curves, it could be judged whether the depth was in the loose circle. Therefore, the thickness of the surrounding rock loose circle was estimated. This method was very simple and convenient and enabled us to observe the changes in the surrounding rock loose circle with time.

Figure 25.
Displacement rate of unit depth surrounding rock with time. (a) Left side; (b) right side.
From Figure 25, it can be seen that the displacement rate remained basically stable throughout the measurement period, and there was no mutation. The maximum displacement rates per unit depth on the left side of the section were 16.18 mm (0–1 m), 4.45 mm/d (1–5 m), and 4.37 mm/d (5–10 m) (Figure 25a), and the maximum displacement rates per unit depth on the right side of the section were 5.67 mm/d (0–1 m), 2.49 mm/d (1–5 m), and 2.38 mm/d (1–5 m) (Figure 25b). The displacement rate per unit depth in the 0~1 m interval was much higher than that in the 1~5 m and 5~10 m intervals. Therefore, it could be inferred that the depth of the surrounding rock loose zone of the 2# inclined shaft of the Muzhailing Tunnel was basically stable. At about 1 m, the beneficial effect of the NPR bolt harness coupling support in limiting the expansion of the surrounding rock loose circle was effectively verified. The displacement rate per unit depth on the left side of the section was much higher than that on the right side of the section. When measuring the depth of the loose circle, the number of measuring points could be appropriately increased to improve the accuracy of the measurement value.
From the above analysis, the general law of radial displacement of surrounding rock after applying NPR bolt harness coupling support was obtained: the deformation was the largest in the shallow part of the wall, and gradually decreased along the radial direction to the deep part. After reaching a certain depth, the deformation became weak. This marked the maximum radius of the surrounding rock loose circle, R0. Without considering the influence of other processes, the displacement rate increased rapidly with time in the early stages, and then gradually decreased until the surrounding rock tended to stability, i.e., the displacement did not change.
4.4. Depth and Breadth of Blasting Effects
Because the early monitoring was not automatic, it was impossible to monitor the influence of blasting on the displacement of surrounding rock in this interval before the primary support was applied to the secondary lining. In addition, only the existing data were analyzed. From the depth point of view, the main influence range of blasting was the surrounding rock at a depth of 0~5 m. The displacement fluctuation caused by blasting was negatively correlated with the tunnel face, and the displacement fluctuation caused by blasting was about 25 m away from the tunnel face. Combined with the comprehensive analysis of Figure 26, it was concluded that the blasting shock wave caused transient damage to the surrounding rock, and the NPR anchor cable had good blast resistance and reliability. Due to the suspension effect of the NPR anchor cable, the integrity of the surrounding rock was not seriously affected. Under the combined action of the NPR anchor cable and steel arch, the surrounding rock had a tendency to continue to deform and then stabilize.

Figure 26.
Depth and width of blasting.
4.5. Traditional Stress State Analysis of Steel Arches
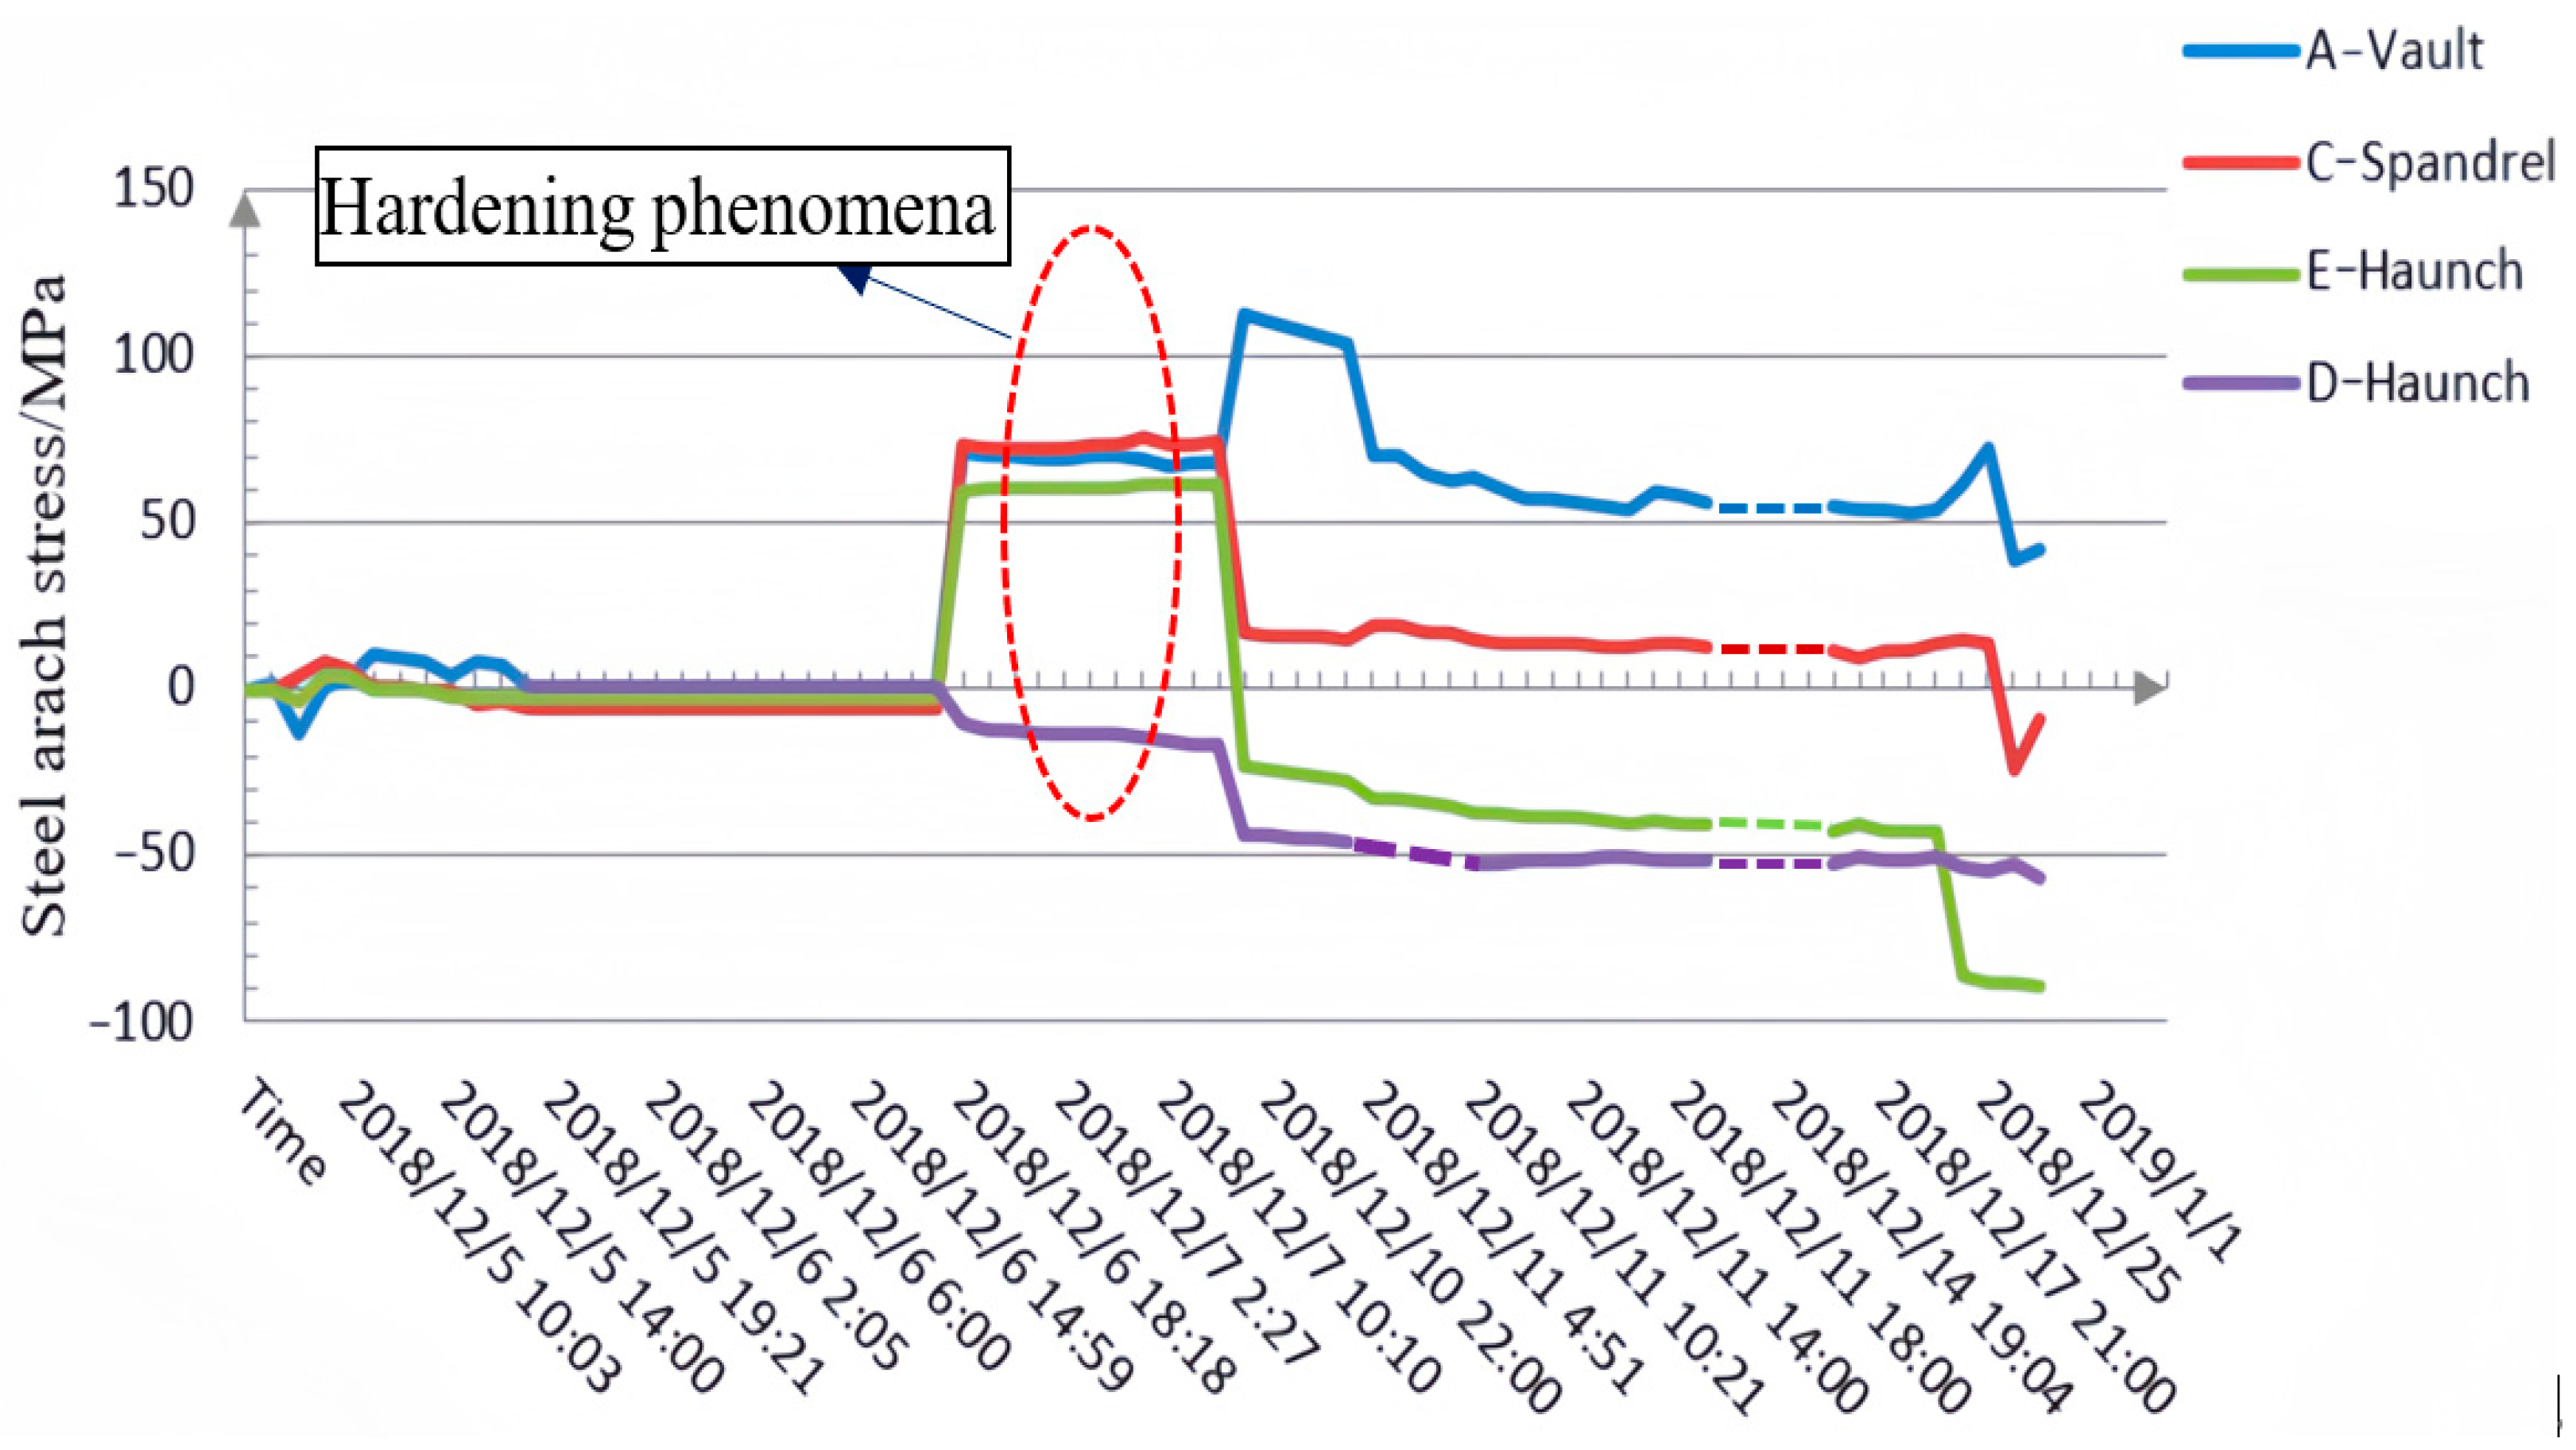
The variation curve of the stress of the initial steel arch with time is shown in Figure 27 (negative traction and positive pressure). In general, the stress of the steel arch is characterized by a shift to the right side. The stress in the left steel arch was initially mainly concentrated in the compressive stress area, and gradually transformed into the tensile stress concentration area. The maximum stress of the steel arch occurred at the vault (A) and was dominated by compressive stress, while the primary stress at the spandrel (C) was compressive stress. The overall trend was similar to that of the vault (A). The arch waist (E) was more complex, and the compressive stress was mainly concentrated before 10 December 2018. Subsequently, the tensile stress gradually increased to about 100 MPa. The arch waist (D) was mainly subjected to tensile stress, and the fluctuation range was between 0 and 50 MPa. It could be observed that the steel arch stress of all of the measuring points in this section did not exceed the yield strength of 235 MPa of the I-beam, which was beneficial to illustrate the beneficial effect of the NPR anchor cable coupling support technology in soft rock tunnels.

Figure 27.
Steel arch stress–time curve.
4.6. Stress State Analysis of Steel Arches Based on Material Science
According to the material–metal strengthening theory, steel-based materials undergo work hardening during tension, compression tests, or processing. During the deformation process, the deformation of the cross section of the I-beam was not synchronized. Usually, the center line of the I-beam is used as the dividing line, and the tension and compression are alternately carried out. It can be seen from Figure 27 that when the steel arch was initially in contact with the surrounding rock, the values of the four measuring points fluctuated slightly due to the influences of blasting disturbance and shotcrete. In the second stage, with the passage of time, the steel arch began to bear the pressure of surrounding rock, and the values at the vault (A), spandrel (C), and haunch (D/E) increased sharply. According to the characteristics of the steel itself, when the steel arch was subjected to surrounding rock stress and plastic deformation (stress lower than its yield strength), the material crystallized due to internal grain slip, edge dislocation, and screw dislocation. The deformation and fragmentation of grains led to hardening. As shown in Figure 27, the steel arch could not withstand large deformation, but the stress value remained basically unchanged and stable. In the subsequent deformation curve analysis, the A, C, D, and E curves demonstrated multiple hardening phenomena, reflecting cycle fatigue characteristics similar to steel. However, the fluctuation range tended to decrease over time, and finally, the deformation at the four measuring points tended towards stability.
4.7. Engineering Countermeasures
Given that the stress value of the steel arch at the E point fluctuated immensely, the pressing action on this point was apparent. To improve the stability of the weak link, the locking foot catheter was set at the arch foot (Φ42, L = 4.5 m, quantity: 2). It was demonstrated that when the angle of the locking foot catheter was set at 40°–50°, the combined bearing effect with the steel arch was most effective [29]. The ends were firmly welded to the steel arch and finished with grouting (Figure 28) to ensure that most of the surrounding rock loads transmitted by the upper steel arches could be withstood before the lower steel arches were lowered. The principle of the joint action of the locking foot catheter, steel arch, and surrounding rock was that under the stress of surrounding rock load, the locking foot catheter and steel arch formed a cohesive structural unit. The steel arch was supported by the end of the locking foot catheter, and the surrounding rock load was transferred to the locking foot catheter. The locking foot catheter was subjected to the lateral and axial support reaction force. Correspondingly, the locking foot catheter was deflected by the lateral load (bending moment and shear force) at the end, while the end load diffused into the surrounding rock. Under the action of the axial load (main dynamic) at the end, the surrounding rock would provide the support reaction force and inhibit the axial displacement of the lock tube.

Figure 28.
Locking foot catheter arrangement.
In the process of interaction between the surrounding rock and the support, the steel arch was affected by the stress fluctuation of the surrounding rock, which led to periodic tensile and plastic deformation. This process could be approximately regarded as the cyclic fatigue of steel. Therefore, given that the tunnel had high stress properties and weak surrounding rock, when designing the support, it was necessary to fully consider cracks caused by fatigue, and at the same time pay attention to the fatigue life of steel when selecting materials, so as to prolong the service life of the steel structure and ensure the safety of the project.
5. Conclusions
In the process of tunnel construction, problems such as high-stress rockbursts, soft rock deformation, water inrush, secondary lining cracking, blasting interference, man-made damage, and mechanical damage are often encountered. These all pose great challenges to the installation of monitoring equipment and line protection. However, the short aperture of fiber material itself, the brittleness of its texture, and the difficulty of disconnection limit the wide application of fiber grating technology. In view of these problems, the 2# inclined shaft of Muzhailing Tunnel in Gansu Province of China, with high stress, water bearing, and bias properties, was taken as the research object in this paper. The results of the study were as follows:
- (1)
- This paper adopted FBG technology to realize the first application of a high ground stress tunnel in deep and long-distance water-rich weak surrounding rock. It overcame the problems of the short aperture of the fiber itself, the brittleness of its texture, and the difficulty of disconnection.
- (2)
- New methods for optical fiber multi-point displacement sensor installation and steel arch meter installation were proposed, which could realize surrounding rock deformation monitoring and continuous strain monitoring. The methods were proven reliable. Associated stability problems provided new ideas for ongoing research into complex soft rock large deformation tunnels under high stress, water bearing, and bias conditions.
- (3)
- Through the analysis of the convergence curve characteristics of deep surrounding rock and the stress characteristics of the steel arch, the beneficial effect of NPR bolt harness coupling support technology in a soft rock tunnel was verified.
- (4)
- Through analysis of the displacement rate velocity of the measuring point, it was judged whether the measuring point was in the loose circle, and the range of the loose circle was further inferred. It was verified that the surrounding rock loose circle was basically stable at a depth of about 1 m after the application of the NPR anchor cable coupling support. Through analysis of the relationship between the displacement fluctuation caused by blasting and the working face, it was concluded that the main influence range of blasting was at a depth of 0–5 m in the surrounding rock, 25 m away from the working face.
- (5)
- In view of the weak link in the steel arch frame, a locking foot catheter (Φ42, L = 4.5 m, quantity 2, placement angle 45°~50°) was set at the arch frame, and this combined bearing of the steel arch frame was the most effective. By further analyzing the stress variation characteristics of the steel arch, it was deduced that the fatigue life of the steel caused by the fatigue cracking factor should be fully considered in the fatigue design of the support. In this case, it was suggested that the fatigue life of the steel should be used to inform the selection index of the steel arch in support design to ensure the stability of surrounding rock and the long-term safety of the tunnel.
Author Contributions
Conceptualization, C.R.; methodology, C.R.; Investigation, C.R.; resources, M.H.; data curation, C.R.; writing—review and editing, C.R.; project administration, X.S. and Z.T.; funding acquisition, X.S. and Z.T. All authors have read and agreed to the published version of the manuscript.
Funding
This project was supported by the National Key R&D Program of China (Grant No.: 2016YFC0600901), the National Natural Science Foundation of China (Grant No.: 51874311), the Yueqi Outstanding Scholars Award of China University of Mining and Technology (Beijing), the Key R&D Program of Zhejiang Province (No. 2019C03104) and the Basic Research Funds of Central Universities (Grant No.: 2015QB02). We sincerely thank the anonymous reviewers for their constructive comments and the editors for their careful and patient work.
Institutional Review Board Statement
Not applicable.
Informed Consent Statement
Not applicable.
Data Availability Statement
All data included in this study are available upon request by contact with the corresponding author.
Conflicts of Interest
The authors declare no conflict of interest.
References
- Li, S.J.; Feng, X.T.; Li, Z.H.; Chen, B.R.; Zhang, C.Q.; Zhou, H. In Situ Monitoring of Rockburst Nucleation and Evolution in the Deeply Buried Tunnels of Jinping II Hydropower Station. Eng. Geol. 2012, 137–138, 85–86. [Google Scholar] [CrossRef]
- Hirata, A.; Kameoka, Y.; Hirano, T. Safety Management Based on Detection of Possible Rock Bursts by AE Monitoring during tunnel excavation. Rock Mech. Rock Eng. 2007, 40, 563–576. [Google Scholar] [CrossRef]
- Zhou, H.; Qu, C.K.; Hu, D.W.; Zhang, C.Q.; Azhar, M.U.; Shen, Z.; Chen, J. In Situ Monitoring of Tunnel Deformation Evolutions from Auxiliary Tunnel in Deep Mine. Eng. Geol. 2017, 221, 10–15. [Google Scholar] [CrossRef]
- Zheng, Z.P.; Lei, Y. Structural Monitoring Techniques for the Largest Excavation Section Subsea Tunnel: Xiamen Xiang’an Subsea Tunnel. J. Aerosp. Eng. 2017, 30, 341. [Google Scholar] [CrossRef]
- Li, Y.H.; Xu, S.D.; Liu, J.P. A New Convergence Monitoring System for Tunnel or Drift based on Draw-wire Displacement Sensors. Tunn. Undergr. Space Technol. 2015, 49, 92–97. [Google Scholar] [CrossRef]
- Fernandez, A.; Palacio, G.; Ordonez, M.D. Measurement System with Angular Encoders for Continuous Monitoring of Tunnel Convergence. Tunn. Undergr. Space Technol. 2016, 56, 176–185. [Google Scholar] [CrossRef]
- Tang, Z.L.; Liu, X.L.; Xu, Q.J.; Li, C.Y.; Qin, P.X. Stability Evaluation of Deep-buried TBM Construction Tunnel Based on Microseismic Monitoring Technology. Tunn. Undergr. Space Technol. 2018, 81, 512–524. [Google Scholar] [CrossRef]
- Gao, Z.Z.; Ge, M.; Li, Y.; Shen, W.; Zhang, H.; Schuh, H. Railway Irregularity Measuring using Rauch–Tung–Striebel Smoothed Multi-Sensors Fusion System: Quad-GNSS PPP, IMU, Odometer, and Track Gauge. GPS Solut. 2018, 22, 36. [Google Scholar] [CrossRef]
- Lato, M.J.; Matthew, J.; Diederichs, M.S. Mapping Shotcrete Thickness using LiDAR and Photogrammetry Data: Correcting for Over-calculation due to Rockmass Convergence. Tunn. Undergr. Space Technol. 2014, 41, 234–240. [Google Scholar] [CrossRef]
- Li, C.; He, D.C.; Li, J.Q.; Xu, Q.; Wan, X.R.; Su, J.N. Assessment of Tunnel Lining Stability through Integrated Monitoring of Fiber Bragg Grating Strain and Structural Deformation. Sensors 2024, 24, 3824. [Google Scholar] [CrossRef]
- Liang, Z.H.; Liu, D.B.; Wang, X.; Zhang, J.; Wu, H.Q.; Qing, X.L.; Wang, Y.S. FBG-based strain monitoring and temperature compensation for composite tank. Aerosp. Sci. Technol. 2022, 127, 107724. [Google Scholar] [CrossRef]
- Wang, X.J.; Jiang, Y.M.; Xu, S.Y.; Liu, H.; Li, X.Z. Fiber Bragg grating-based smart garment for monitoring human body temperature. Sensors 2022, 11, 4252. [Google Scholar] [CrossRef] [PubMed]
- Pendao, C.; Silva, I. Optical fiber sensors and sensing networks: Overview of the main principles and applications. Sensors 2022, 22, 7554. [Google Scholar] [CrossRef]
- Zhang, J.W.; Zhao, Q.; Du, D.W.; Zhu, Y.X.; Zheng, S.N.; Chen, D.Y.; Cui, J.L. High flexibility fbg inscribing by point-by-point method via femtosecond laser: Technology, progress, and challenges. Mater. Today Commun. 2024, 39, 2–5. [Google Scholar] [CrossRef]
- Klar, A.; Dromy, I.; Raphael, R.L. Linker Monitoring Tunneling induced Ground Displacements using Distributed Fiber-optic Sensing. Tunn. Undergr. Space Technol. 2014, 40, 141–150. [Google Scholar] [CrossRef]
- Zhu, C.; Zhang, K.; Cai, H.; Tao, Z.G.; An, B.; He, M.C.; Xia, X.; Liu, J.K. Combined Application of Optical Fibers and CRLD Bolts to Monitor Deformation of a Pit-in-Pit Foundation. Adv. Civ. Eng. 2019, 2019, 2572034. [Google Scholar] [CrossRef]
- Ye, X.W.; Ni, Y.Q.; Yin, J.H. Safety Monitoring of Railway Tunnel Construction Using FBG Sensing Technology. Adv. Struct. Eng. 2013, 16, 1401–1409. [Google Scholar] [CrossRef]
- Lu, Z.; Zhang, C.; Ni, Y.Q.; Wang, C.Y. Real-time Condition Assessment of Railway Tunnel Deformation using an FBG-based Monitoring System. Smart Struct. Syst. 2018, 21, 537–548. [Google Scholar]
- Bursi, O.S.; Tondini, N.; Fassin, M.; Bonelli, A. Structural Monitoring for the Cyclic Behaviour of Concrete Tunnel Lining Sections using FBG Sensors. Struct. Control Health Monit. 2016, 23, 749–763. [Google Scholar] [CrossRef]
- Zhou, H.J.; Wang, Y.J.; Zhou, Z.L.; Ma, C. Effects of bonding on Fiber Bragg Grating (FBG) sensor for monitoring steel corrosion condition in concretes. Measurement 2023, 222, 113565. [Google Scholar] [CrossRef]
- Khan, U.H.; Mitri, H.S.; Jones, D. Full scale testing of steel arch tunnel supports. Int. J. Rock Mech. Min. Sci. 1996, 33, 219–232. [Google Scholar] [CrossRef]
- Wang, Y.Q.; Xing, Y.X.; Xie, Y.L.; Li, J.; Wang, Z.F. Investigation of mechanical performance of prestressed steel arch in tunnel. Front. Struct. Civ. Eng. 2017, 11, 360–367. [Google Scholar] [CrossRef]
- Chen, L.J.; Zhang, Y.L.; Ma, Z.Y.; Bai, S.G. Joint bearing analysis for feet-lock bolt and steel arch in weak rock tunnel. Chin. J. Rock Mech. Eng. 2015, 34, 129. [Google Scholar]
- Wen, J.Z.; Zhang, Y.X.; Wang, C.; Jiang, Z.H. Back analysis for the mechanical properties of initial tunnel support based on steel arch stresses. Chin. J. Civ. Eng. 2012, 45, 170–175. [Google Scholar]
- Shen, C.H.; Tong, L.Y. Discussions on predicting the stability of flexible shotcrete and steel arch frame support for tunnels. Chin. J. Civ. Eng. 2007, 40, 88. [Google Scholar]
- Chen, J.X.; Hu, J.; Xu, C.; Luo, Y.B. Method for stress measurement on tunnel steel arch. J. Chang. Univ. (Nat. Sci. Ed.) 2013, 33, 47–53. [Google Scholar]
- Tao, Z.G.; Zhang, H.J.; Chen, Y.F.; Jiang, C.C. Support Principles of NPR bolt/cable and Control Techniques of Large-deformation Disasters. Int. J. Min. Sci. Technol. 2016, 26, 967–973. [Google Scholar] [CrossRef]
- Dong, F.T.; Song, H.W.; Guo, Z.H.; Lu, S.M.; Liang, S.J. Support Theory of Loose Circle of Roadway Surrounding Rock. Acta Coal Sin. 1994, 1, 21–32. [Google Scholar]
- Chen, L.J.; Zhang, Y.L.; Ma, Z.Y. Theoretical research on reasonable installation angle of feet-lock pipes. J. Rock Mech. Eng. 2015, 34, 1335–1337. [Google Scholar]
Disclaimer/Publisher’s Note: The statements, opinions and data contained in all publications are solely those of the individual author(s) and contributor(s) and not of MDPI and/or the editor(s). MDPI and/or the editor(s) disclaim responsibility for any injury to people or property resulting from any ideas, methods, instructions or products referred to in the content. |
© 2024 by the authors. Licensee MDPI, Basel, Switzerland. This article is an open access article distributed under the terms and conditions of the Creative Commons Attribution (CC BY) license (https://creativecommons.org/licenses/by/4.0/).