

Co-Precipitation Synthesized Ag-Doped Ceria Redox Material (ACRM) for the Thermochemical Conversion of CO2 into Solar Fuels

Abstract
:1. Introduction
2. Experimental
2.1. Materials
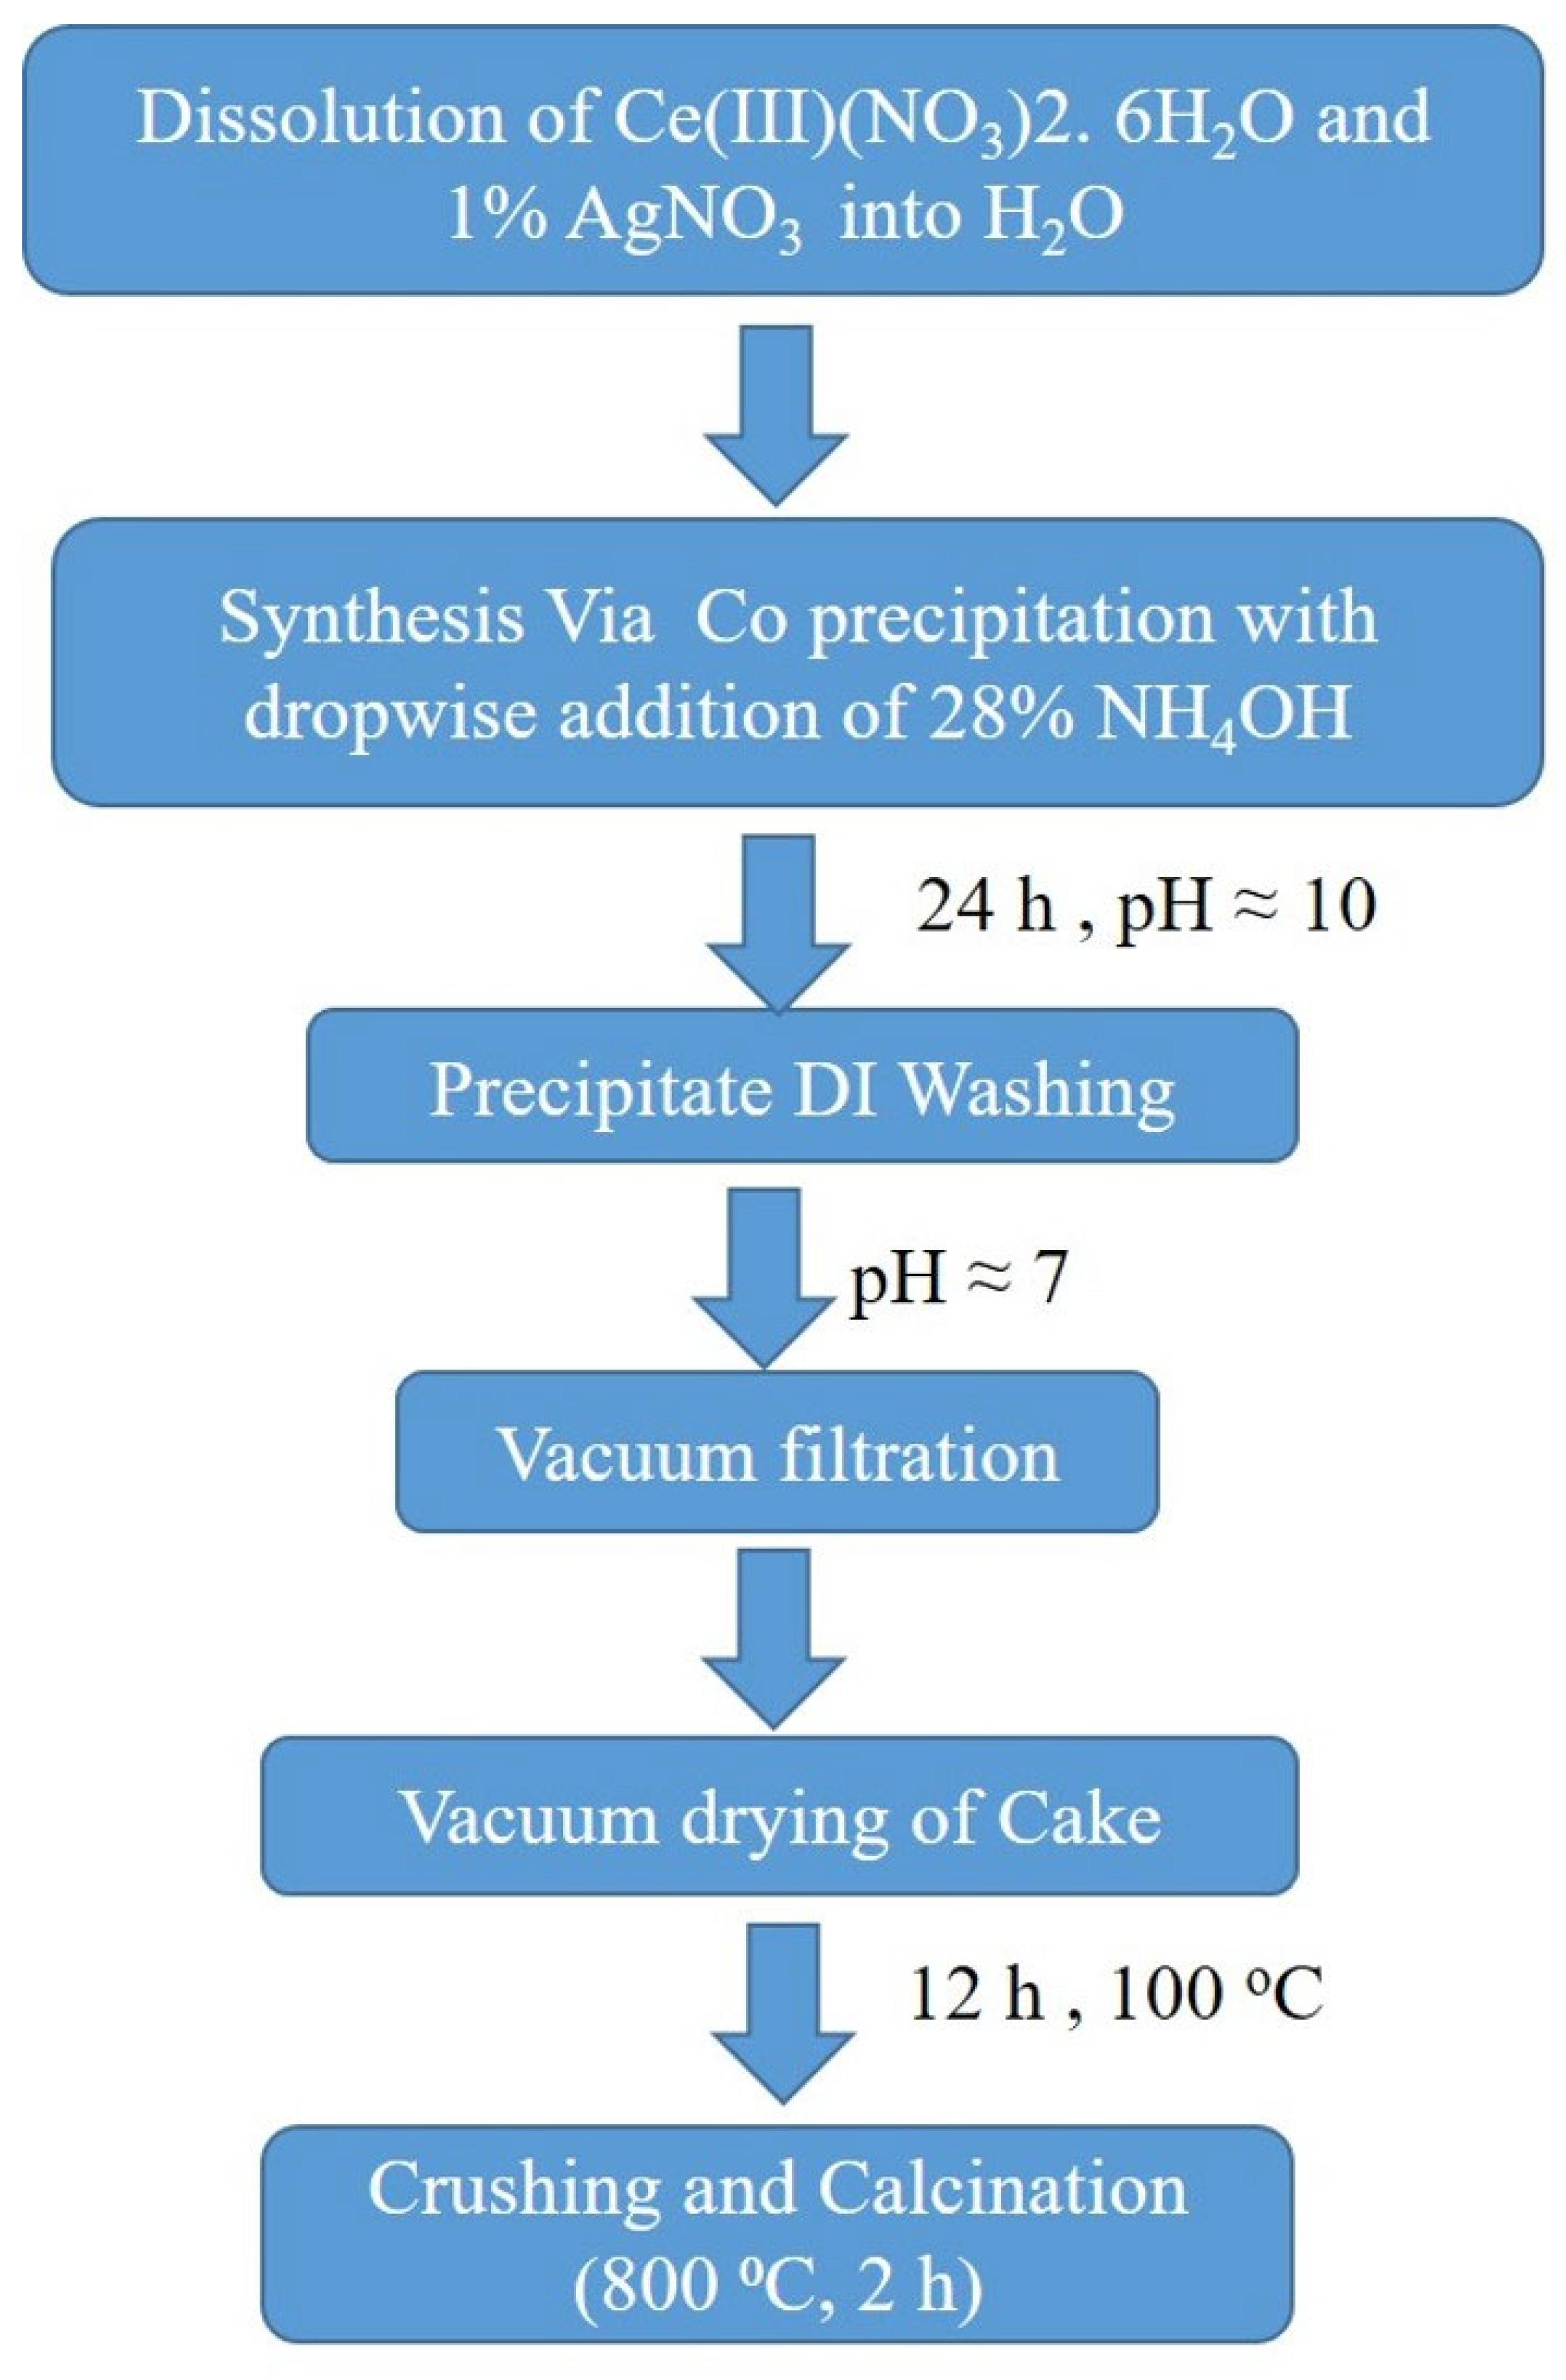
2.2. Synthesis of ACRM
2.3. Characterization of ACMR
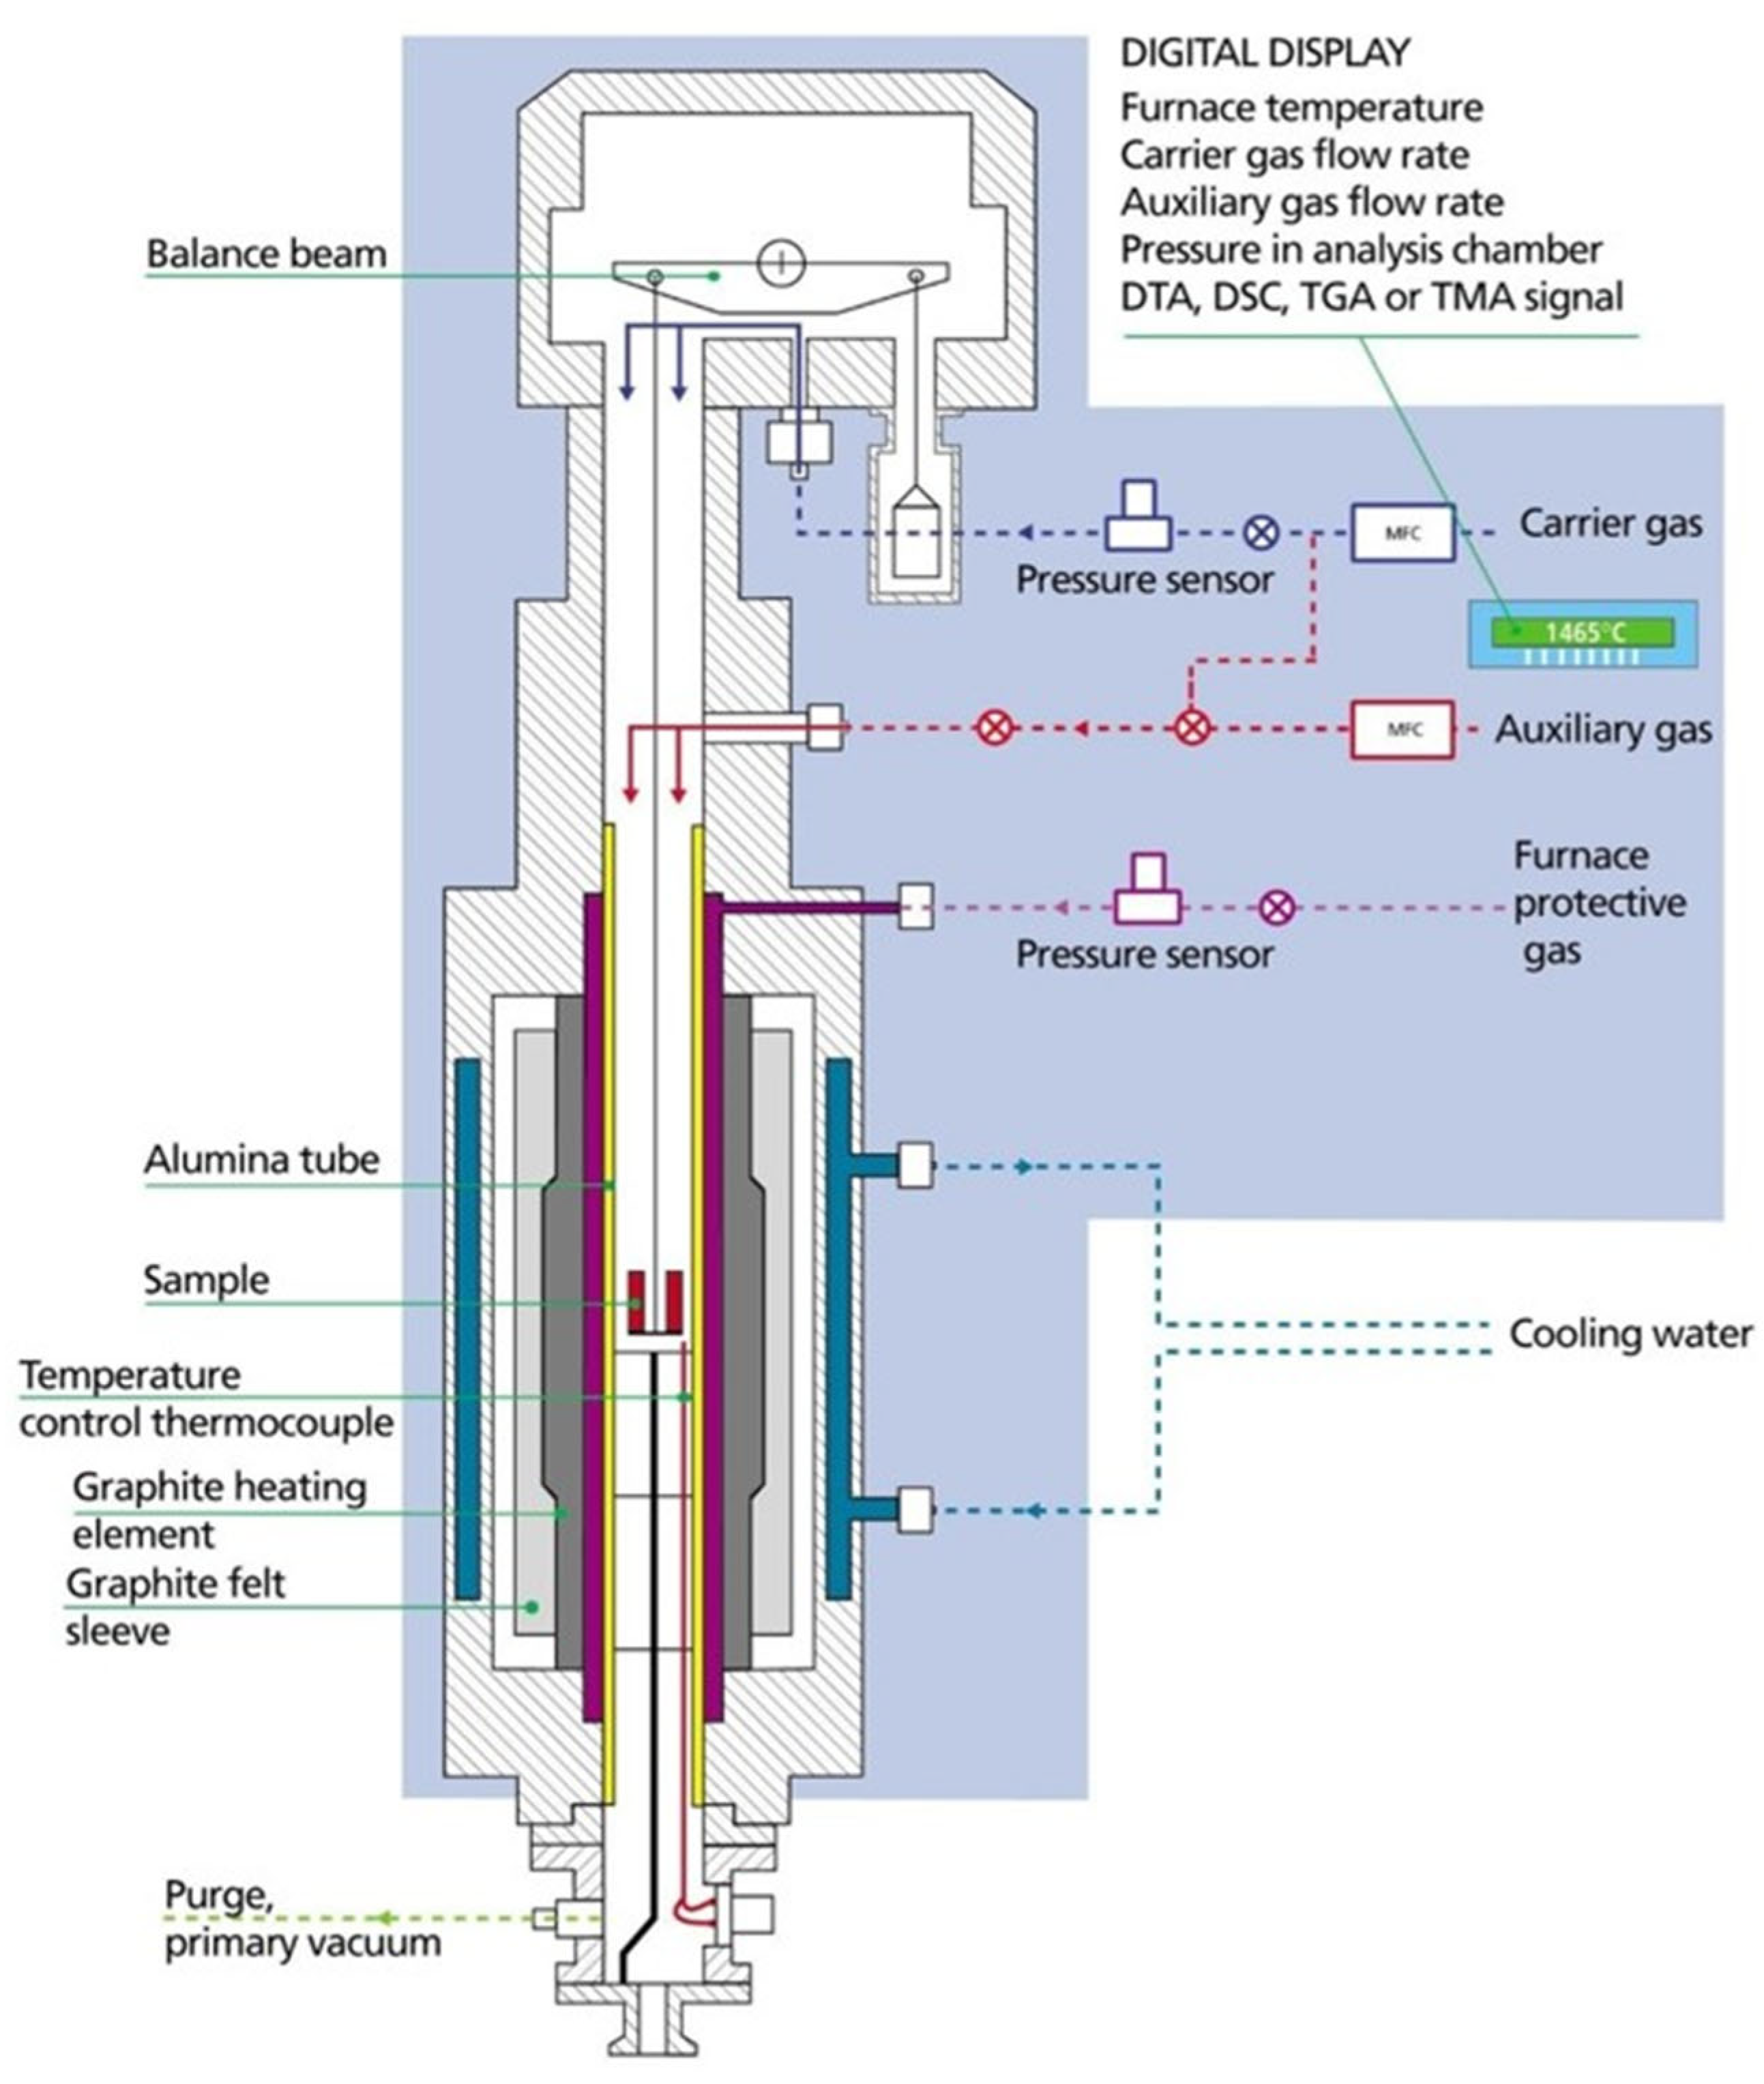
2.4. Thermochemical Redox Cycles
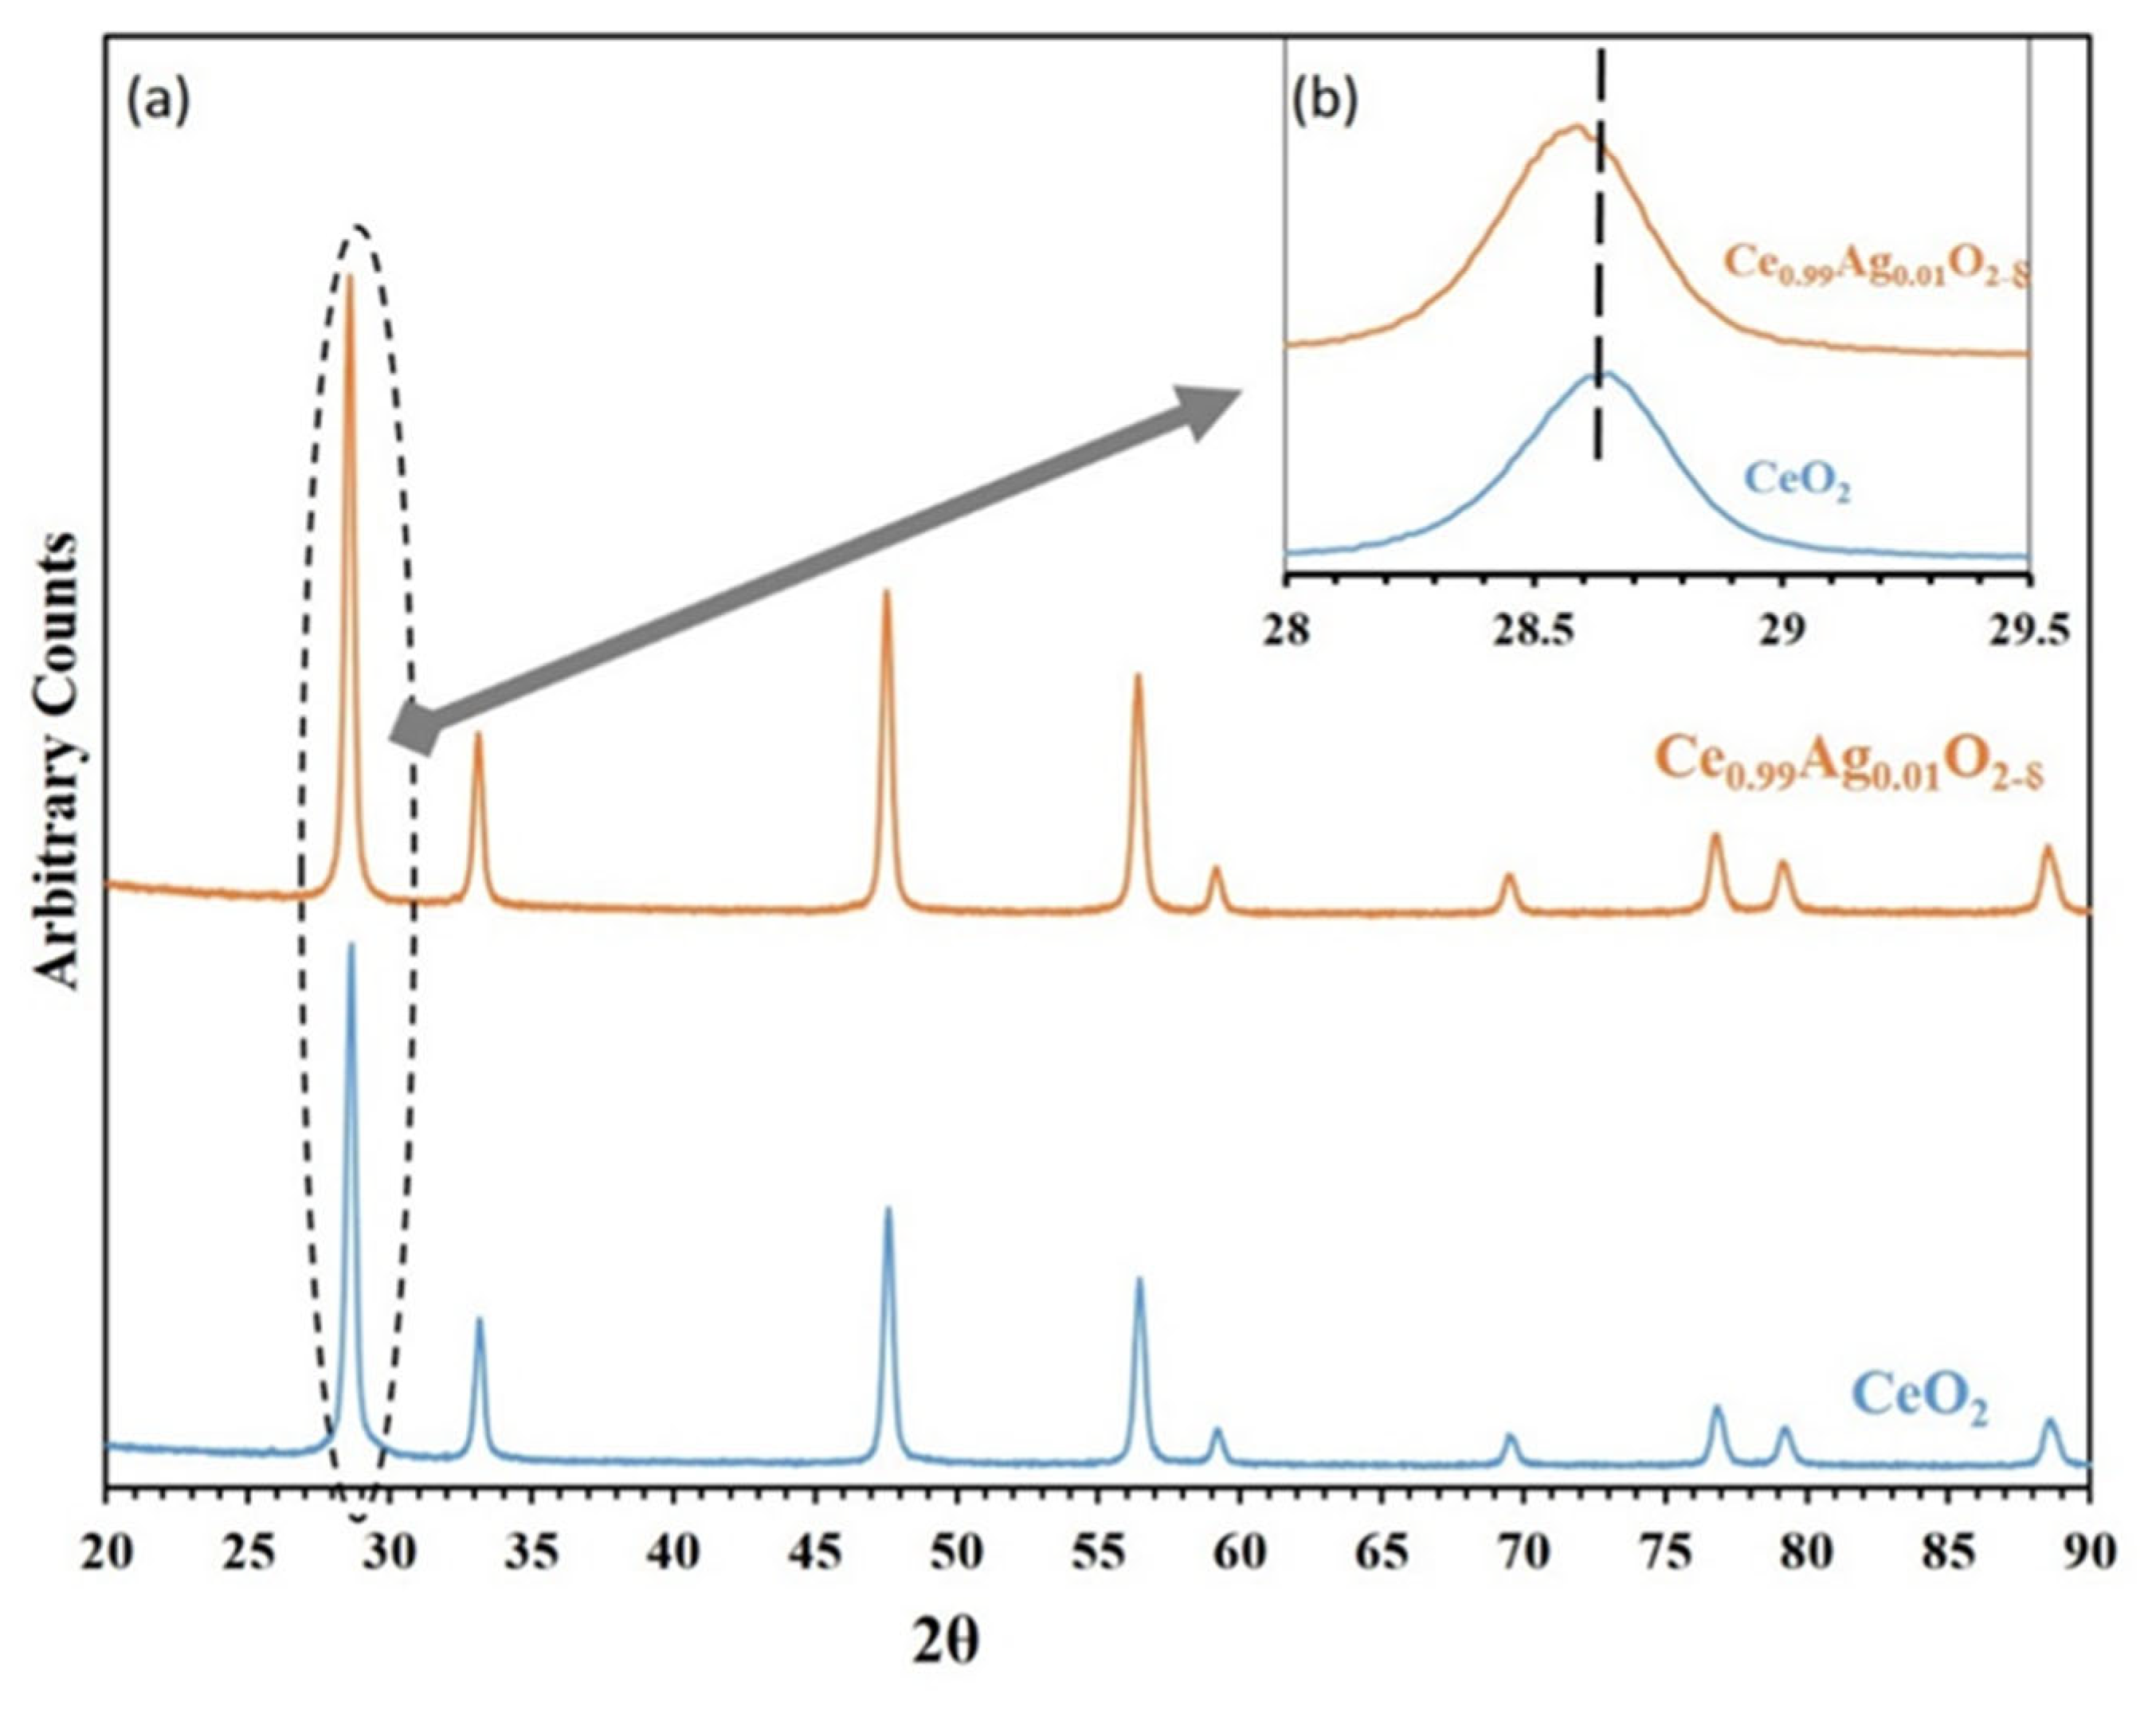
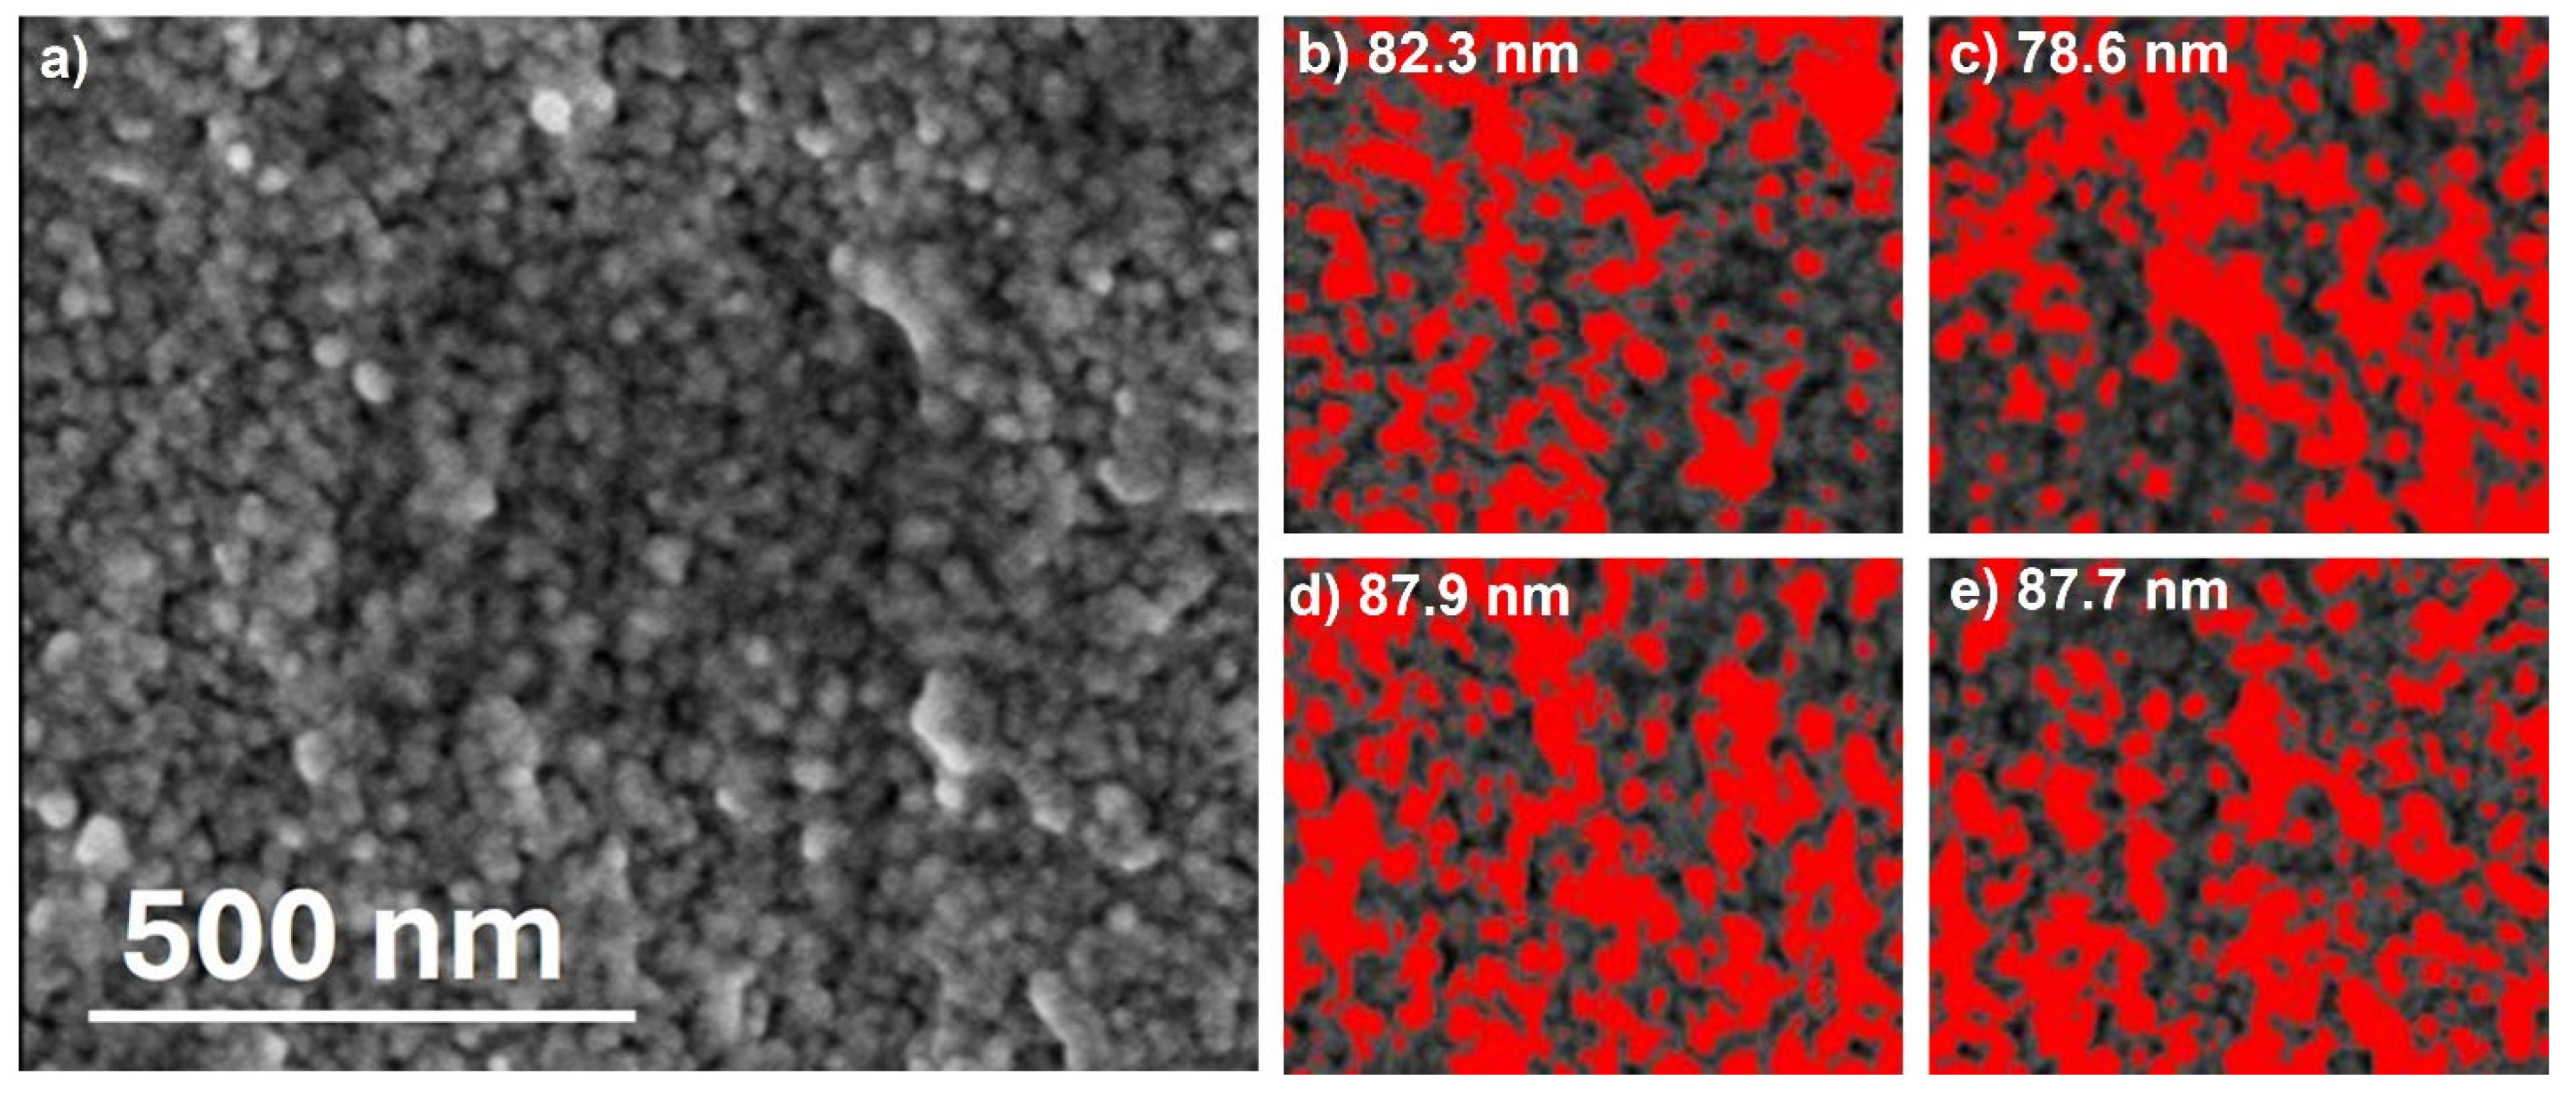
3. Results and Discussions
4. Summary and Conclusions
Author Contributions
Funding
Institutional Review Board Statement
Informed Consent Statement
Data Availability Statement
Acknowledgments
Conflicts of Interest
References
- Dincer, I.; Acar, C. Review and evaluation of hydrogen production methods for better sustainability. Int. J. Hydrogen Energy 2014, 40, 11094–11111. [Google Scholar] [CrossRef]
- Zoller, S.; Koepf, E.; Nizamian, D.; Stephan, M.; Patané, A.; Haueter, P.; Romero, M.; González-Aguilar, J.; Lieftink, D.; de Wit, E.; et al. A solar tower fuel plant for the thermochemical production of kerosene from H2O and CO2. Joule 2022, 6, 1606–1616. [Google Scholar] [CrossRef] [PubMed]
- Jia, B.; Xian, C.; Tsau, J.-S.; Zuo, X.; Jia, W. Status and Outlook of Oil Field Chemistry-Assisted Analysis during the Energy Transition Period. Energy Fuels 2022, 36, 12917–12945. [Google Scholar] [CrossRef]
- Sun, D.; Xu, X.; Qin, Y.; Jiang, S.P.; Shao, Z. Rational Design of Ag-Based Catalysts for the Electrochemical CO2 Reduction to CO: A Review. ChemSusChem 2020, 13, 39–58. [Google Scholar] [CrossRef]
- Herron, J.A.; Kim, J.; Upadhye, A.A.; Huber, G.W.; Maravelias, C.T. A general framework for the assessment of solar fuels technologies. Energy Environ. Sci. 2014, 8, 126–157. [Google Scholar] [CrossRef]
- Loutzenhiser, P.G.; Meier, A.; Steinfeld, A. Review of the Two-Step H2O/CO2-Splitting Solar Thermochemical Cycle Based on Zn/ZnO Redox Reactions. Materials 2010, 3, 4922–4938. [Google Scholar] [CrossRef]
- Schäppi, R.; Hüsler, V.; Steinfeld, A. Solar Thermochemical Production of Syngas from H2O and CO2─Experimental Parametric Study, Control, and Automation. Ind. Eng. Chem. Res. 2024, 63, 3563–3575. [Google Scholar] [CrossRef]
- Amar, V.S.; Puszynski, J.A.; Shende, R.V. H2 generation from thermochemical water-splitting using yttria stabilized NiFe2O4 core-shell nanoparticles. J. Renew. Sustain. Energy 2015, 7, 023113. [Google Scholar] [CrossRef]
- Agrafiotis, C.; Zygogianni, A.; Pagkoura, C.; Kostoglou, M.; Konstandopoulos, A.G. Hydrogen production via solar-aided water splitting thermochemical cycles with nickel ferrite: Experiments and modeling. AIChE J. 2013, 59, 1213–1225. [Google Scholar] [CrossRef]
- Diver, R.B.; Miller, J.E.; Allendorf, M.D.; Siegel, N.P.; Hogan, R.E. Solar Thermochemical Water-Splitting Ferrite-Cycle Heat Engines. J. Sol. Energy Eng. 2008, 130, 041001. [Google Scholar] [CrossRef]
- Bhosale, R.R. Thermodynamic analysis of Ni-ferrite based solar thermochemical H2O splitting cycle for H2 production. Int. J. Hydrogen Energy 2019, 44, 61–71. [Google Scholar] [CrossRef]
- Mostrou, S.; Büchel, R.; Pratsinis, S.E.; van Bokhoven, J.A. Improving the ceria-mediated water and carbon dioxide splitting through the addition of chromium. Appl. Catal. A Gen 2017, 537, 40–49. [Google Scholar] [CrossRef]
- Takalkar, G.; Bhosale, R.R.; Rashid, S.; AlMomani, F.; Shakoor, R.A.; Al Ashraf, A. Application of Li-, Mg-, Ba-, Sr-, Ca-, and Sn-doped ceria for solar-driven thermochemical conversion of carbon dioxide. J. Mater. Sci. 2020, 55, 11797–11807. [Google Scholar] [CrossRef]
- Bare, Z.J.L.; Morelock, R.J.; Musgrave, C.B. A Computational Framework to Accelerate the Discovery of Perovskites for Solar Thermochemical Hydrogen Production: Identification of Gd Perovskite Oxide Redox Mediators. Adv. Funct. Mater. 2022, 32, 2200201. [Google Scholar] [CrossRef]
- Takalkar, G.; Bhosale, R.R. Solar thermocatalytic conversion of CO2 using PrxSr(1−x)MnO3−δ perovskites. Fuel 2019, 254, 115624. [Google Scholar] [CrossRef]
- Steinfeld, A. Solar hydrogen production via a two-step water-splitting thermochemical cycle based on Zn/ZnO redox reactions. Int. J. Hydrogen Energy 2002, 27, 611–619. [Google Scholar] [CrossRef]
- Scheffe, J.R.; Steinfeld, A. Oxygen exchange materials for solar thermochemical splitting of H2O and CO2: A review. Mater. Today 2014, 17, 341–348. [Google Scholar] [CrossRef]
- Chueh, W.C.; Haile, S.M. A thermochemical study of ceria: Exploiting an old material for new modes of energy conversion and CO2 mitigation. Philosophical Transactions of the Royal Society A: Mathematical. Phys. Eng. Sci. 2010, 368, 3269–3294. [Google Scholar] [CrossRef]
- Rhodes, N.R.; Bobek, M.M.; Allen, K.M.; Hahn, D.W. Investigation of long term reactive stability of ceria for use in solar thermochemical cycles. Energy 2015, 89, 924–931. [Google Scholar] [CrossRef]
- Dry, M.E. The Fischer-Tropsch process: 1950–2000. Catal. Today 2002, 71, 227–241. [Google Scholar] [CrossRef]
- Abanades, S.; Flamant, G. Thermochemical hydrogen production from a two-step solar-driven water-splitting cycle based on cerium oxides. Sol. Energy 2006, 80, 1611–1623. [Google Scholar] [CrossRef]
- Chueh, W.C.; Falter, C.; Abbott, M.; Scipio, D.; Furler, P.; Haile, S.M.; Steinfeld, A. High-Flux Solar-Driven Thermochemical Dissociation of CO2 and H2O Using Nonstoichiometric Ceria. Science 2010, 330, 1797–1801. [Google Scholar] [CrossRef]
- Venstrom, L.J.; De Smith, R.M.; Hao, Y.; Haile, S.M.; Davidson, J.H. Efficient splitting of CO2 in an isothermal redox cycle based on ceria. Energy Fuels 2014, 28, 2732–2742. [Google Scholar] [CrossRef]
- Scheffe, J.R.; Steinfeld, A. Thermodynamic analysis of cerium-based oxides for solar thermochemical fuel production. Energy Fuels 2012, 26, 1928–1936. [Google Scholar] [CrossRef]
- Kaneko, H.; Miura, T.; Ishihara, H.; Taku, S.; Yokoyama, T.; Nakajima, H.; Tamaura, Y. Reactive ceramics of CeO2-MOx (M=Mn, Fe, Ni, Cu) for H2 generation by two-step water splitting using concentrated solar thermal energy. Energy 2007, 32, 656–663. [Google Scholar] [CrossRef]
- Bhosale, R.R.; Kumar, A.; AlMomani, F.; Ghosh, U.; Al-Muhtaseb, S.; Gupta, R.; Alxneit, I. Assessment of CexZryHfzO2 based oxides as potential solar thermochemical CO2 splitting materials. Ceram. Int. 2016, 42, 9354–9362. [Google Scholar] [CrossRef]
- Meng, Q.-L.; Lee, C.-I.; Ishihara, T.; Kaneko, H.; Tamaura, Y. Reactivity of CeO2-based ceramics for solar hydrogen production via a two-step water-splitting cycle with concentrated solar energy. Int. J. Hydrogen Energy 2011, 36, 13435–13441. [Google Scholar] [CrossRef]
- Takalkar, G.; Bhosale, R.; Kumar, A.; AlMomani, F.; Khraisheh, M.; Shakoor, R.; Gupta, R. Transition metal doped ceria for solar thermochemical fuel production. Sol. Energy 2018, 172, 204–211. [Google Scholar] [CrossRef]
- Lin, F.; Rothensteiner, M.; Alxneit, I.; van Bokhoven, J.A.; Wokaun, A. First demonstration of direct hydrocarbon fuel production from water and carbon dioxide by solar-driven thermochemical cycles using rhodium-ceria. Energy Environ. Sci. 2016, 9, 2400–2409. [Google Scholar] [CrossRef]
- Xu, X.; Wang, W.; Zhou, W.; Shao, Z. Recent Advances in Novel Nanostructuring Methods of Perovskite Electrocatalysts for Energy-Related Applications. Small Methods 2018, 2, 1800071. [Google Scholar] [CrossRef]
- Guan, D.; Zhong, J.; Xu, H.; Huang, Y.-C.; Hu, Z.; Chen, B.; Zhang, Y.; Ni, M.; Xu, X.; Zhou, W.; et al. A universal chemical-induced tensile strain tuning strategy to boost oxygen-evolving electrocatalysis on perovskite oxides. Appl. Phys. Rev. 2022, 9, 011422. [Google Scholar] [CrossRef]
- Liu, Z.; Bai, Y.; Sun, H.; Guan, D.; Li, W.; Huang, W.-H.; Pao, C.-W.; Hu, Z.; Yang, G.; Zhu, Y.; et al. Synergistic dual-phase air electrode enables high and durable performance of reversible proton ceramic electrochemical cells. Nat. Commun. 2024, 15, 472. [Google Scholar] [CrossRef] [PubMed]


| Materials | Cycle 1 | Cycle 2 | Cycle 3 | |||
|---|---|---|---|---|---|---|
| Released (μmol/g) | Produced (μmol/g) | Released (μmol/g) | Produced (μmol/g) | Released (μmol/g) | Produced (μmol/g) | |
| CeO2 | 47.1 | 94.2 | 47.8 | 95.6 | 46.9 | 93.8 |
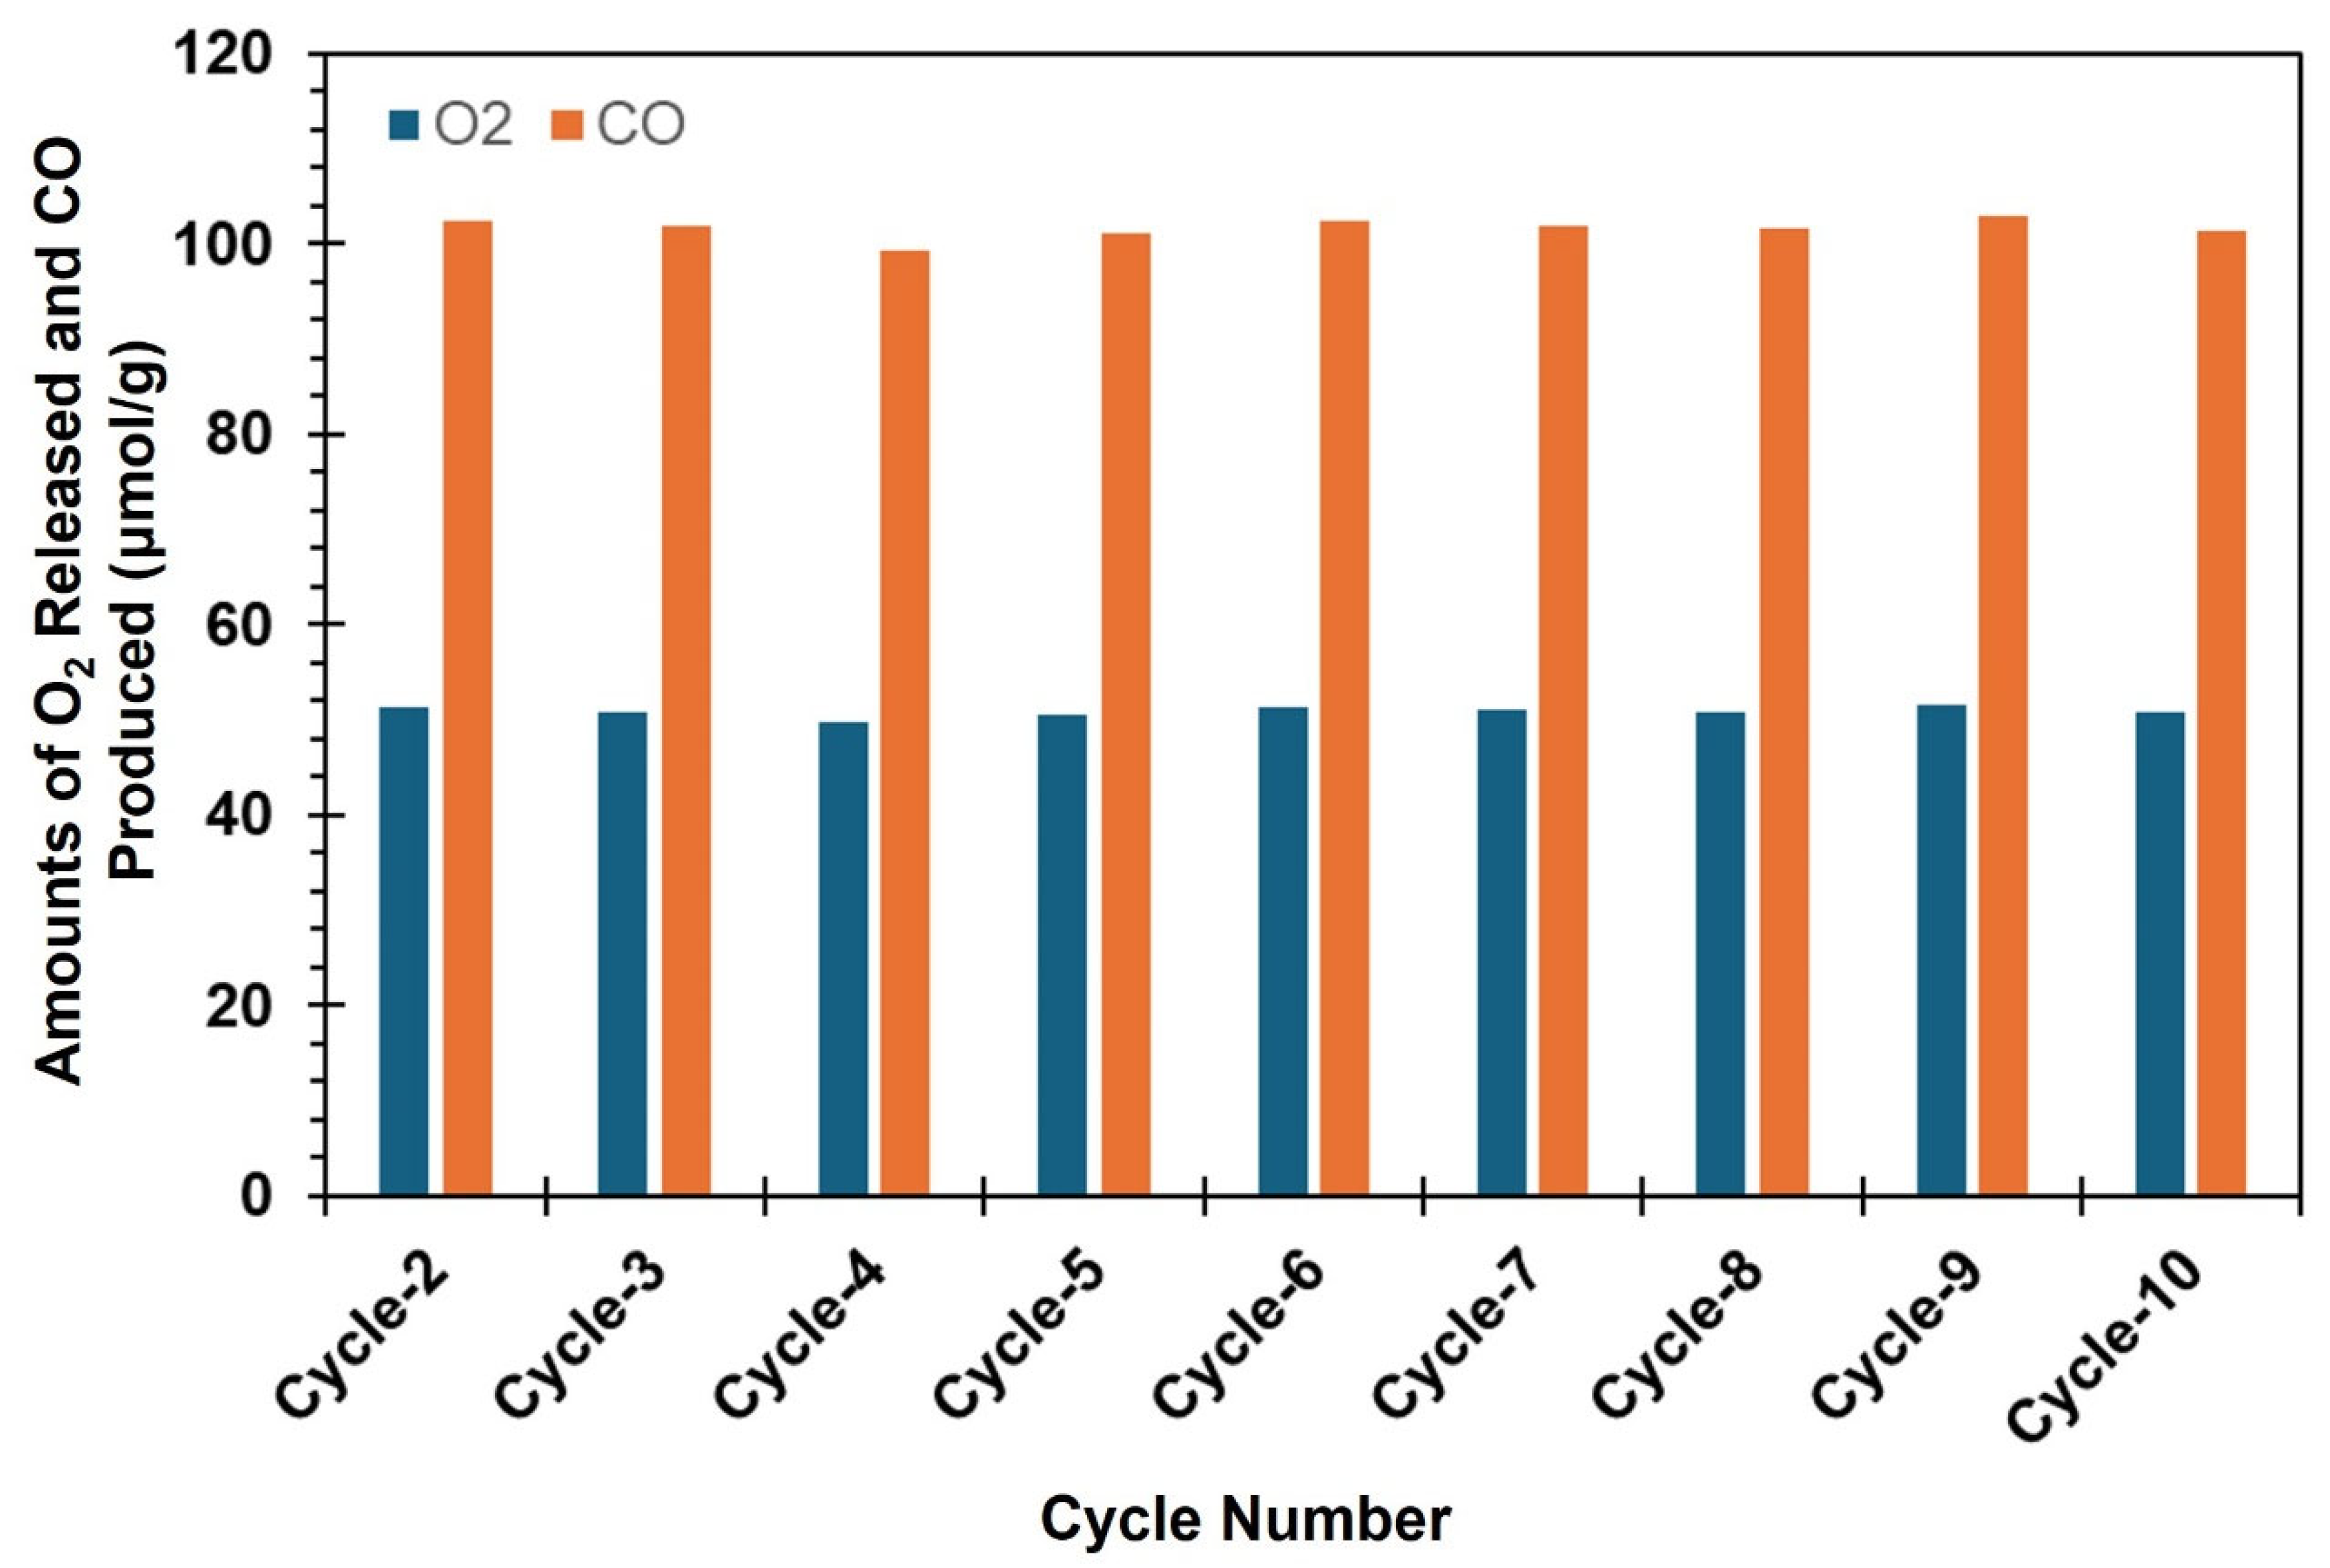
| ACRM | 199.8 | 123.2 | 51.2 | 102.4 | 50.9 | 101.8 |
Disclaimer/Publisher’s Note: The statements, opinions and data contained in all publications are solely those of the individual author(s) and contributor(s) and not of MDPI and/or the editor(s). MDPI and/or the editor(s) disclaim responsibility for any injury to people or property resulting from any ideas, methods, instructions or products referred to in the content. |
© 2024 by the authors. Licensee MDPI, Basel, Switzerland. This article is an open access article distributed under the terms and conditions of the Creative Commons Attribution (CC BY) license (https://creativecommons.org/licenses/by/4.0/).
Share and Cite
Takalkar, G.; Akhter, S.; Bhosale, R.R. Co-Precipitation Synthesized Ag-Doped Ceria Redox Material (ACRM) for the Thermochemical Conversion of CO2 into Solar Fuels. Appl. Sci. 2024, 14, 8272. https://doi.org/10.3390/app14188272
Takalkar G, Akhter S, Bhosale RR. Co-Precipitation Synthesized Ag-Doped Ceria Redox Material (ACRM) for the Thermochemical Conversion of CO2 into Solar Fuels. Applied Sciences. 2024; 14(18):8272. https://doi.org/10.3390/app14188272
Chicago/Turabian StyleTakalkar, Gorakshnath, Sayma Akhter, and Rahul R. Bhosale. 2024. "Co-Precipitation Synthesized Ag-Doped Ceria Redox Material (ACRM) for the Thermochemical Conversion of CO2 into Solar Fuels" Applied Sciences 14, no. 18: 8272. https://doi.org/10.3390/app14188272