Abstract
Owing to the low detection accuracy of camera-based object detection models, various fusion techniques with Light Detection and Ranging (LiDAR) have been attempted. This has resulted in improved detection of objects that are difficult to detect due to partial occlusion by obstacles or unclear silhouettes. However, the detection performance remains limited in low-light environments where small pedestrians are located far from the sensor or pedestrians have difficult-to-estimate shapes. This study proposes an object detection model that employs a Gaussian–Sobel filter. This filter combines Gaussian blurring, which suppresses the effects of noise, and a Sobel mask, which accentuates object features, to effectively utilize depth maps generated by LiDAR for object detection. The model performs independent pedestrian detection using the real-time object detection model You Only Look Once v4, based on RGB images obtained using a camera and depth maps preprocessed by the Gaussian–Sobel filter, and estimates the optimal pedestrian location using non-maximum suppression. This enables accurate pedestrian detection while maintaining a high detection accuracy even in low-light or external-noise environments, where object features and contours are not well defined. The test evaluation results demonstrated that the proposed method achieved at least 1–7% higher average precision than the state-of-the-art models under various environments.
1. Introduction
Autonomous driving technology has recently gained widespread acceptance among consumers and is becoming increasingly integrated into our daily lives, while making significant contributions to improving the quality of human life. It is projected to become a ubiquitous technology that will be easily accessible everywhere in the near future. Furthermore, it can overcome the physical or mental human limitations, improve safety and reliability, reduce the accident rate, and cut labor costs, thereby reducing social costs and increasing commercial value [1,2]. For autonomous driving in the mobility domain, a camera-based object detection system is fundamental for identifying lanes, vehicles/pedestrians, traffic signals, and other obstacles. However, in some environments, object detection becomes impossible owing to the difficulty of acquiring high-quality images using a camera. Moreover, object detection models that solely utilize visual data from cameras have exhibited considerably poor performance in pedestrian detection tasks, which is attributable to the inherent challenges in representing the diverse appearances of pedestrians within a unified shape [3,4].
Hsu and Yang [5] developed a two-stage pipeline to mitigate the inherent limitations in camera-based object detection systems. First, they leveraged Super-Resolution Generative Adversarial Networks to upscale low-resolution images obtained from cameras. The resulting high-resolution images were subsequently fed into a faster region-based convolutional neural network (Faster R-CNN) for pedestrian detection, demonstrating considerable enhancement in detection accuracy. Zhang et al. [6] improved pedestrian detection performance in occluded environments by suppressing feature extraction from object-free background images. Mushtaq et al. [7] proposed a single-image super-resolution network model based on CNNs, combining conventional autoencoders with residual neural network approaches. By removing the noise present in images, they improved the image quality and enhanced detection accuracy. Xu et al. [8] also proposed a method to enhance image quality by directly embedding a physical lighting model into a deep neural network to improve object detection performance in low-light conditions. This method captures the difference between the local content of an object and the preferred region of its local neighborhood. However, these techniques exhibit shortcomings in object detection when parts of objects are obscured by other objects, or when noise induced by light reflection, scattering, and other low-light conditions results in the loss of some contour information.
Given the limitations of camera-based object detection systems due to various external environmental factors such as low-light conditions, supplementary sensors have been incorporated into these systems to enhance their performance. Gilroy et al. [9] enhanced pedestrian detection performance in low-light conditions by generating a depth map based on Light Detection and Ranging (LiDAR) and stereovision sensors, mitigating the effects of light noise. Lin et al. [10] explored the use of CNNs to improve small object detection performance based on both three-dimensional (3D) point cloud data (PCD) and two-dimensional (2D) images. Qi et al. [11] predicted the location of objects in 2D images based on CNNs and converted the corresponding regions into three dimensions, thus improving the detection performance. Although all the aforementioned studies demonstrated enhanced detection accuracy of invisible objects by employing multiple sensors, their performance in detecting small objects in low-light environments and at a large distance from the sensor remained suboptimal, primarily owing to the challenges associated with object shape estimation in such environments. Although LiDAR was additionally used, object detection in low-light scenarios continued to be challenging because of the low-resolution depth maps produced by the LiDAR, which hindered accurate object detection. Hence, to improve the performance, supplementary image processing is essential to highlight the features of an object. A sharpening filter presents a viable option for this enhancement. Additionally, the PCD generated by LiDAR is susceptible to particle-based external noise, which is another factor to be considered when choosing a sharpening filter.
Over the years, researchers have explored various methods of image enhancement using sharpening filters. Maragos and Pessoa [12] achieved image enhancement by expanding pixels at the presumed locations of objects in all directions through morphological operations, thereby highlighting object contours. The image quality was enhanced by centering the structural elements on the foreground pixels. If a foreground pixel was present in the area where the elements overlapped, the central pixel of that area was designated as the foreground pixel, thereby enlarging the size and outline of the objects. Deng [13] enhanced the sharpness of objects by applying an unsharp mask filter that increases object density. This filter was created using a mask obtained from the difference between a blurred image and the original image, thereby increasing the contrast between pixels. Ali and Clausi [14] utilized a Canny edge filter to identify pixels with the greatest rate of change as edges and employed hysteresis edge tracking to reduce noise effects and eliminate isolated edges, thereby enhancing the sharpness of object contours. The application of reconstructed images using these filters to object detection models is expected to lead to considerable performance improvements. However, object detection performance could be degraded instead if some object information is missing owing to image filtering or if nearby objects appear to be overlapped. Furthermore, the inadvertent amplification of external noise may also adversely affect object detection performance.
To mitigate the aforementioned adverse effect, we propose a novel object detection model that employs a Gaussian–Sobel filter as a preprocessor. This filter effectively combines Gaussian blurring to suppress noise effects and the Sobel mask to accentuate object features, enabling effective object detection from LiDAR-derived depth maps. The proposed model employs RGB images and depth maps, preprocessed with the Gaussian–Sobel filter, to obtain respective detection results using the real-time object detection model, You Only Look Once (YOLO). The YOLO object detection model has been widely used to date. Moreover, new versions of the model are being continuously developed, which exhibit overall better performance in terms of speed and accuracy compared with other object detection models, including single-shot multibox detector (SSD) and Faster R-CNN. Furthermore, YOLO is a lightweight model that can be embedded into on-board systems with limited resources while maintaining a high detection performance. In particular, YOLOv4 is best suited for real-time object detection in real-world environments, as it enables real-time object detection through on-board systems and can detect objects, including small objects, in complex environments [15,16]. Optimal object locations are estimated by eliminating redundant bounding boxes through non-maximum suppression (NMS). This enables robust object detection, even under challenging conditions such as low-light environments or high-speckle-noise environments, by preserving a high detection accuracy despite the lack of distinct object features or contours. Our test evaluation results demonstrated that the proposed model outperformed existing state-of-the-art models by achieving a 1–7% improvement in average precision (AP), depending on the experimental conditions. The contributions of this study are as follows:
- -
- We improved image resolution and enhanced object–background segmentation by preprocessing LiDAR-derived depth maps using a fusion of Gaussian blurring and the Sobel mask.
- -
- We proposed a versatile object detection model that effectively combines RGB images from cameras and depth maps preprocessed by the Gaussian–Sobel filter. This convergence enables robust object detection in diverse lighting conditions, ranging from bright daylight to low-light environments, complementing the strengths and weaknesses of cameras and LiDAR.
- -
- By applying the Gaussian–Sobel filter, we enhanced the robustness of LiDAR, leading to improved detection performance in environments with speckle noise, which is commonly found in adverse weather conditions.
2. Materials and Methods
2.1. Object Detection
Object detection models can be broadly classified into one-stage and two-stage detectors. One-stage detectors, which jointly learn to localize and classify objects using CNNs, are generally faster but less accurate than two-stage detectors. This makes them ideal for real-time object detection applications [17,18]. Representative one-stage detectors include SSD [19] and YOLO [20]. YOLO, which is the most commonly used one-stage detector, excels at extracting and detecting object and background features, as it learns from individual objects as well as the surrounding information and entire image domain.
The image input to YOLO is partitioned into a grid, , to extract object features through a convolutional layer and generate predicted tensors through a fully connected layer. Subsequently, for each partitioned grid cell, localization and classification are performed simultaneously to produce candidate bounding boxes, along with the corresponding confidence score () for each bounding box. Each bounding box contains information of , where refers to the coordinates of the center point of the bounding box normalized to each grid cell, and refers to the width and height of the bounding box. reflects the probability that the bounding box contains an object, i.e., the accuracy of the predicted box, and is defined as follows:
Here, refers to the probability that the bounding box contains the object, with a value of 1 if the grid cell correctly contains the object and 0 otherwise. refers to the Intersection over Union (IoU) between the ground truth and predicted box, which is the width of the overlapping area and indicates how accurately the bounding box predicts the geometric information of the object. Moreover, the grid cell is expressed as a conditional probability of belonging to one of the object classes within the bounding box, as presented below.
The class-specific confidence score (), which represents the probability of an object being contained within each bounding box and the probability that the detected object matches the ground truth, is calculated as follows:
The bounding box with the maximum among the predicted bounding boxes is chosen as the final bounding box for the target object.
2.2. Proposed Multi-Sensor-Based Detection Model
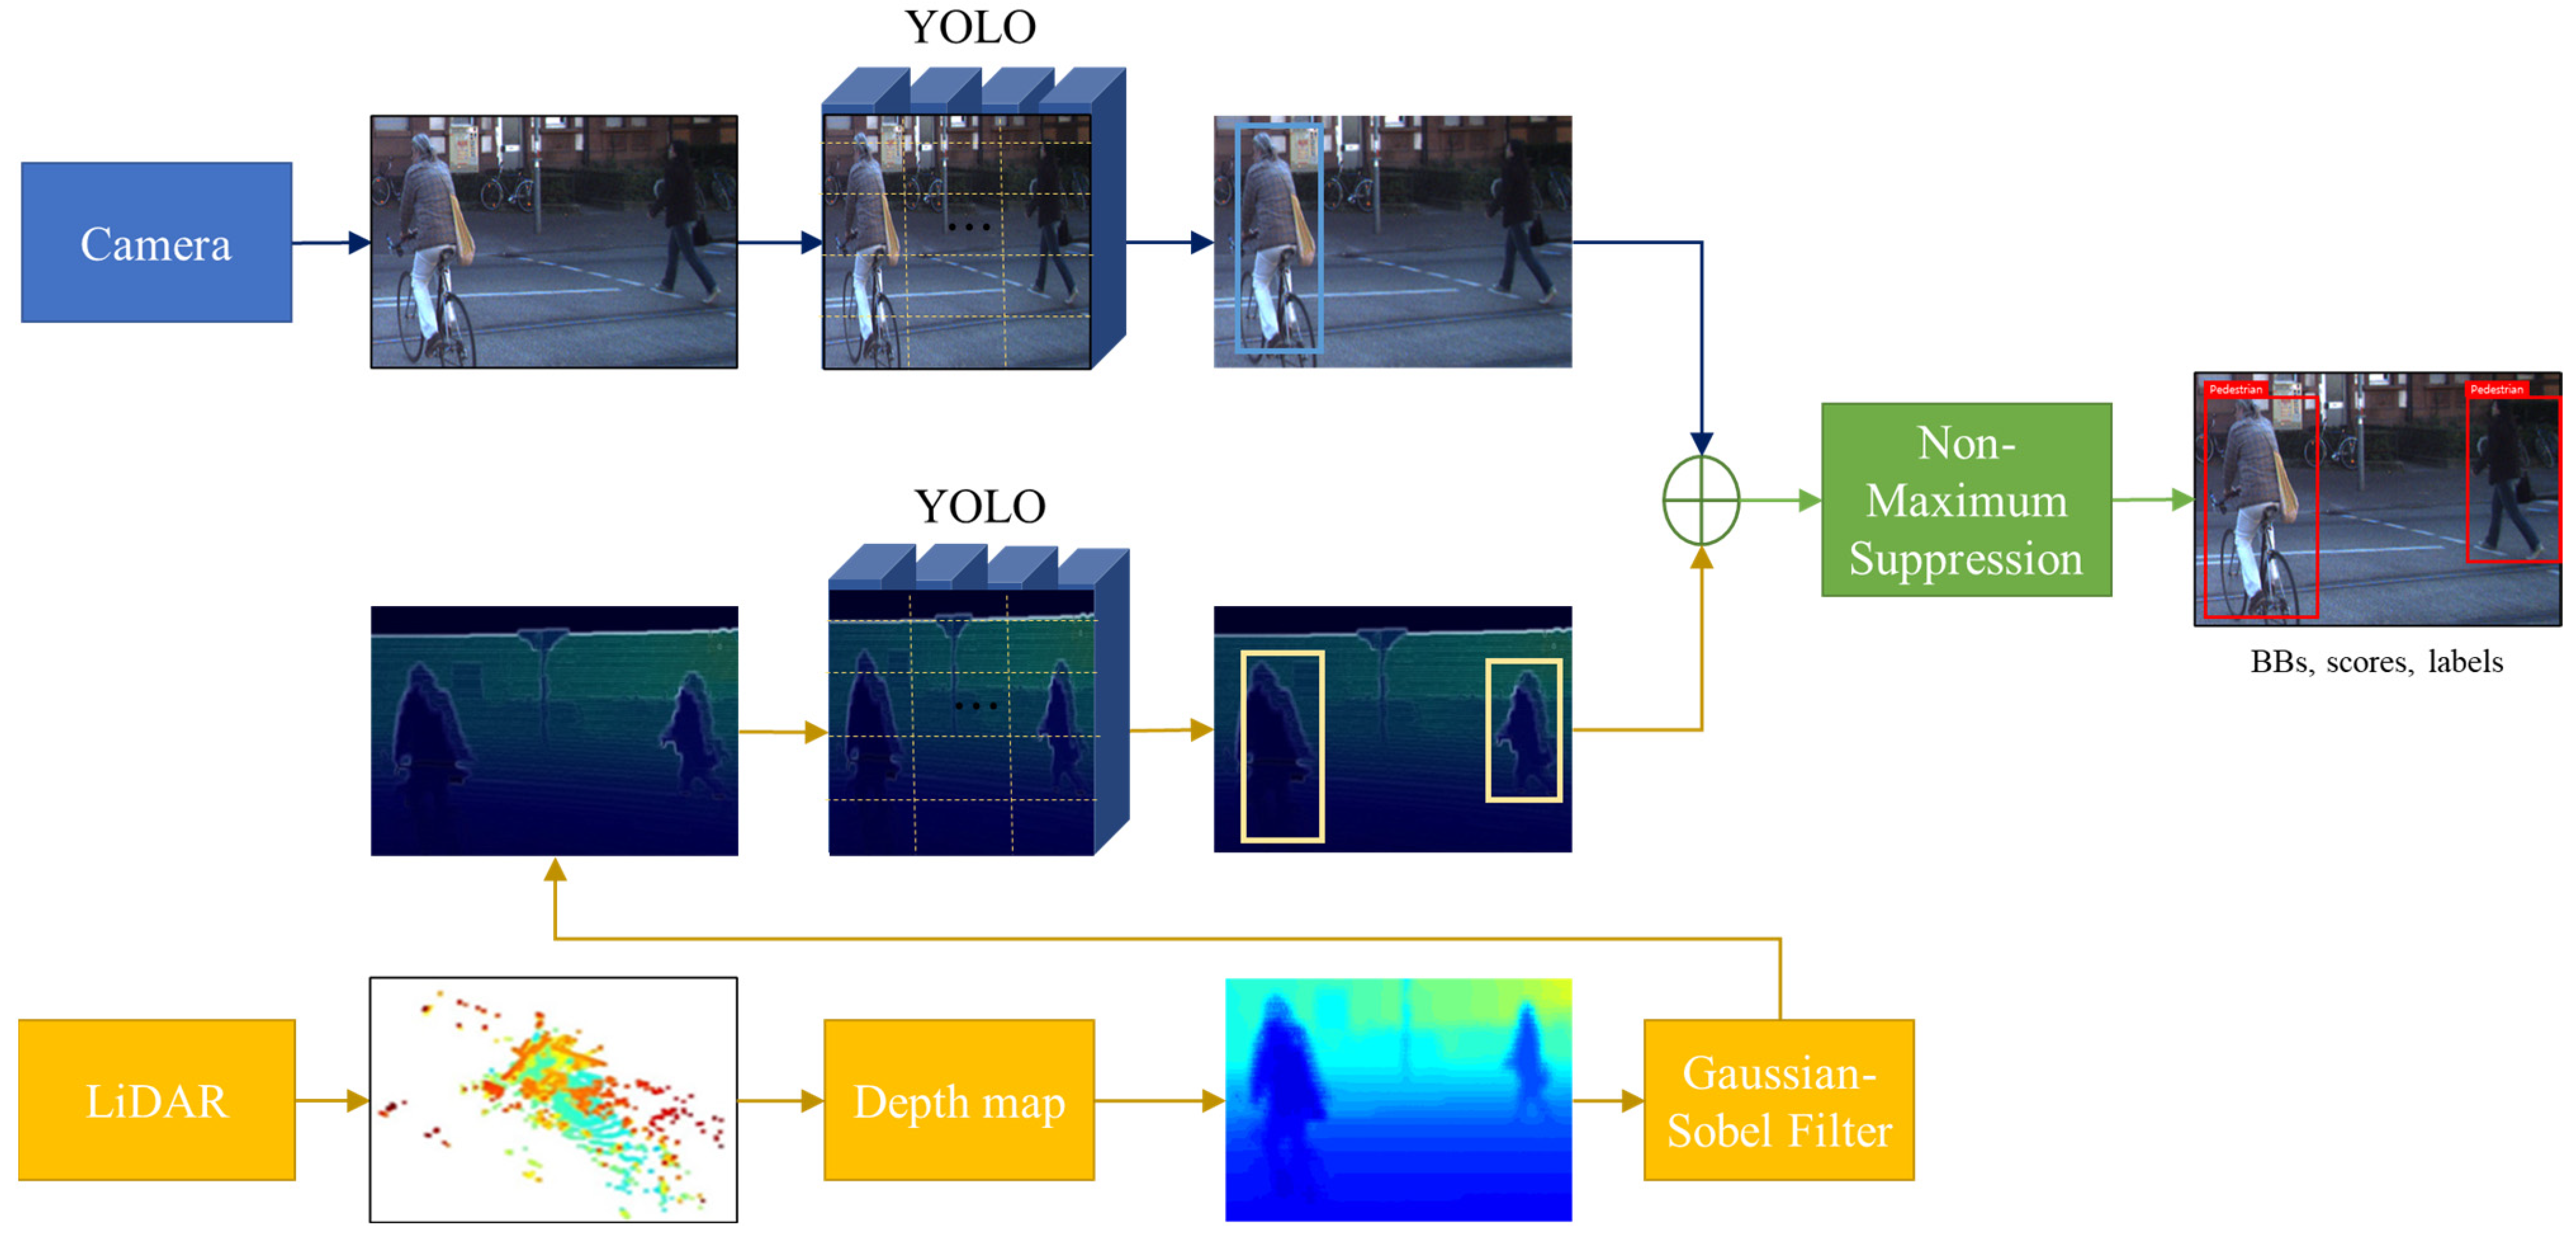
We propose a robust multi-sensor-based object detection model to prevent potential safety accidents caused by pedestrian detection failures in low-light or unexpected external noise environments. The proposed model performs object detection on RGB images using YOLO and simultaneously preprocesses the depth map generated by LiDAR using the proposed Gaussian–Sobel filter to increase the clarity of object contours; subsequently, this model performs object detection through a separate YOLO. At this time, to sensor-fuse the 2D image of the camera and the 3D PCD of LiDAR in parallel, a registration process is required to unify the type of image used for learning individual YOLO. Thereafter, NMS is applied to the individual detection results from the two sensors to determine the final object, as depicted in the block diagram presented in Figure 1. The proposed model is summarized by Algorithm 1.
| Algorithm 1 Image Processing and Object Detection |
| 1: Input: List of images (camera images and LiDAR Depth Maps) 2: Output: Performance metrics for each image 3: for each image in image_list do 4: if image is camera_image then 5: bboxes←YOLO(image) 6: filtered_bboxes←NMS(bboxes, threshold) 7: else 8: filtered_depth_map←GAUSSIAN_SOBEL_FILTER(image) 9: bboxes←YOLO(filtered_depth_map) 10: filtered_bboxes←NMS(bboxes, threshold) 11: end if 12: performance←EVALUATE_PERFORMANCE(filtered_bboxes) 13: PRINT performance 14: end for |

Figure 1.
Block diagram of the proposed multi-sensor-based detection model.
2.2.1. Creating a Depth Map for Image Registration
To effectively fuse data from heterogeneous sensors like cameras and LiDAR for object detection, it is essential to align the dimensions of 2D images and 3D PCD. This is typically achieved by transforming 3D PCD into a depth map. Furthermore, 3D PCD represent a set of 3D coordinate points, generated when laser signals emitted from LiDAR bounce off surrounding objects. To apply this transformation to a 2D setting, a calibration process is necessary to reconcile the disparate viewpoints of the two sensors beyond dimension transformation. This allows the coordinate of the PCD to be mapped to the coordinate of a 2D image, as expressed in the following equation [21]:
Here, and are the eigenvalues of the camera, representing the focal lengths in the horizontal and vertical directions, respectively; and denote the principal points of the 2D image; and and denote the rotational transformation and parallel translation matrices, respectively. They are computed using singular value decomposition as described in [22]. Consequently, a depth map, aligning with the camera’s viewpoint, is created and employed for training YOLO. Figure 2 depicts the process of creating a depth map by aligning a LiDAR-acquired PCD point with a camera. Figure 2a presents an image acquired by an RGB camera, while Figure 2b displays a point map projected onto the image by aligning the 2D-transformed PCD with the camera. Moreover, Figure 2c illustrates the resulting depth map.
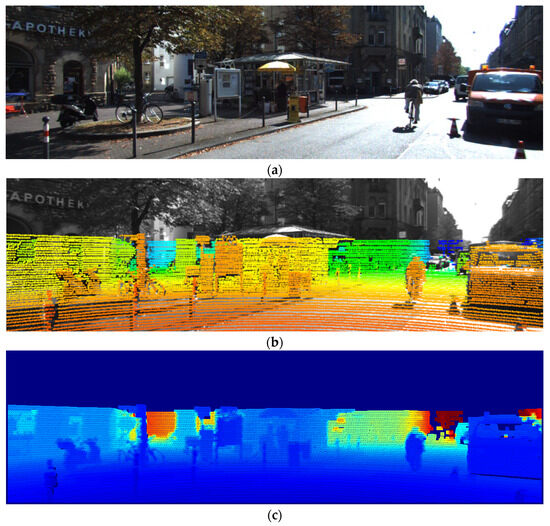
Figure 2.
Process for generating a depth map for image registration: (a) RGB image; (b) PCD projected on RGB image; (c) depth map.
2.2.2. Preprocessing with the Gaussian–Sobel Filter
Object detection with RGB cameras suffers from significant performance degradation in night-time environments compared with daytime environments. To address this limitation, we propose a method that leverages depth maps obtained from LiDAR to enhance pedestrian detection in low-light conditions. Given that the depth map is derived from low-resolution PCD, object contours exhibit reduced sharpness. Consequently, an enhancement process is necessary, and a sharpening filter is additionally applied to address this issue. First, a Gaussian filter is applied to suppress the variance of depth information caused by the different sampling intervals of PCD depending on the LiDAR channel. Subsequently, a Sobel filter is utilized to accentuate the line edges of objects whose boundaries with the background become blurred owing to Gaussian blurring, thereby facilitating feature extraction of objects. By doing so, the model most effectively preserves pixel values of the depth information while further accentuating object contours.
A Gaussian filter generates a natural blurring effect on images by using a filter mask created by approximating a Gaussian distribution [23,24]. A 2D Gaussian distribution function with a mean of and standard deviations of and along the and axes, respectively, is defined as follows:
The depth map, , can be expressed as follows after undergoing preprocessing by a Gaussian filter:
The Gaussian function peaks at and decreases as the distance from the center increases. Furthermore, in the filter mask, pixels near the filtering target receive higher weights, whereas those further away receive lower weights, which helps mitigate the effects of noise pixels in the depth map.
Thus, the Gaussian filter suppresses the effects of noise in the depth map and blurs the overall image, resulting in a decrease in contrast. To compensate for this drawback, a Sobel filter is directly applied to preserve as much depth information of the object as possible while still accentuating object contours. The Sobel filter uses two 3 × 3 kernels to detect edges: one is for finding changes along the horizontal direction, while the other is for finding changes in the vertical direction. Edges are points where the instantaneous rate of change of a function is large. Therefore, if a value exceeding a certain threshold is derived by calculating the differential value at each pixel of the image, the corresponding point is determined as an edge [25,26]. The two kernels are convolved with the original image to approximate the rate of change; if we define and as two images containing approximations of the horizontal and vertical derivatives, respectively, then the corresponding calculation is as follows:
Here, the x-coordinate is defined as increasing to the right, and the y-coordinate is defined as increasing downward. Furthermore, at each pixel in the image, and are combined to determine the size, , and direction, , of the gradient. Consequently, the variance and noise of LiDAR PCD’s depth information are suppressed, and the object is simultaneously separated from the background. This can be verified by referring to Figure 3, which shows an example of the sequential application of two filters to the depth map.
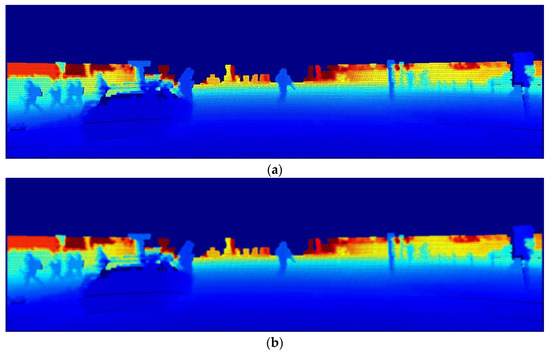
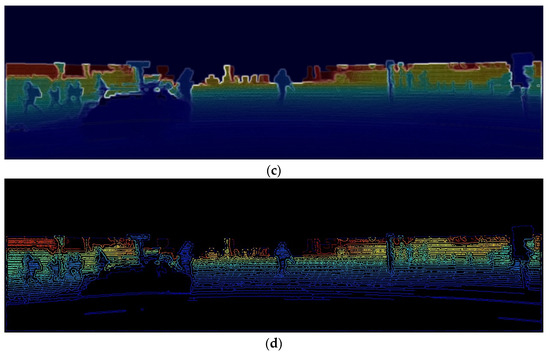
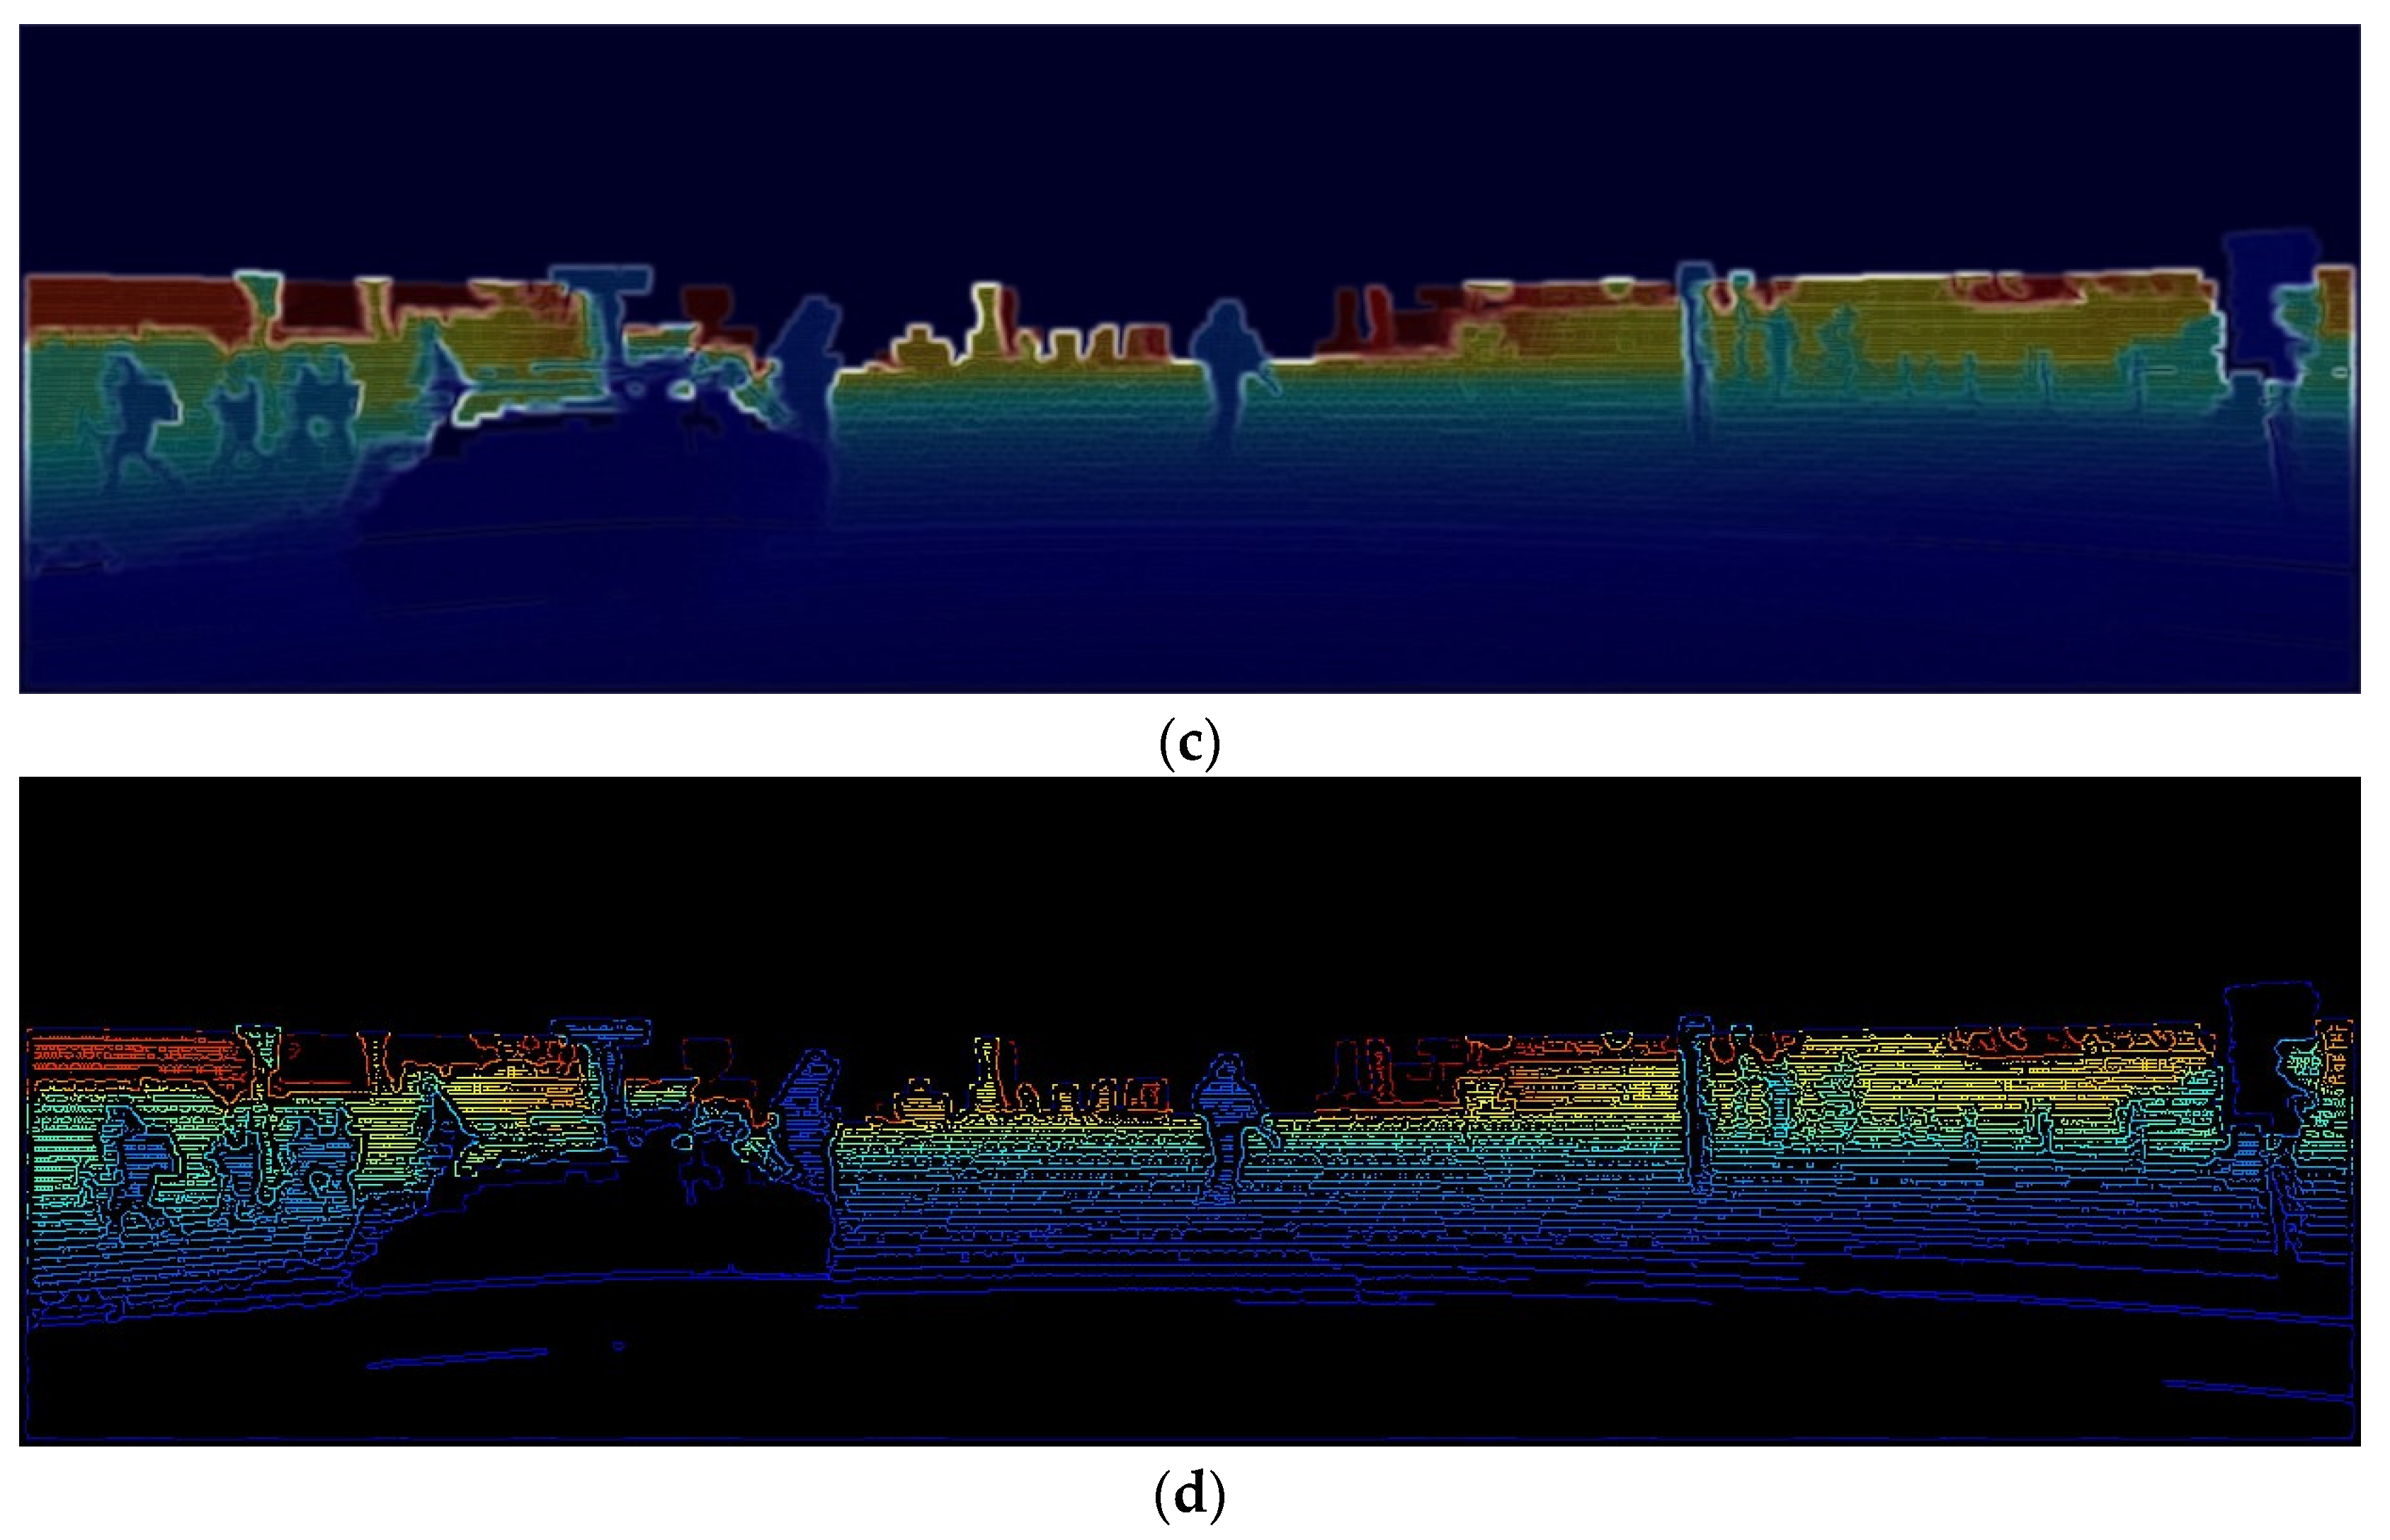
Figure 3.
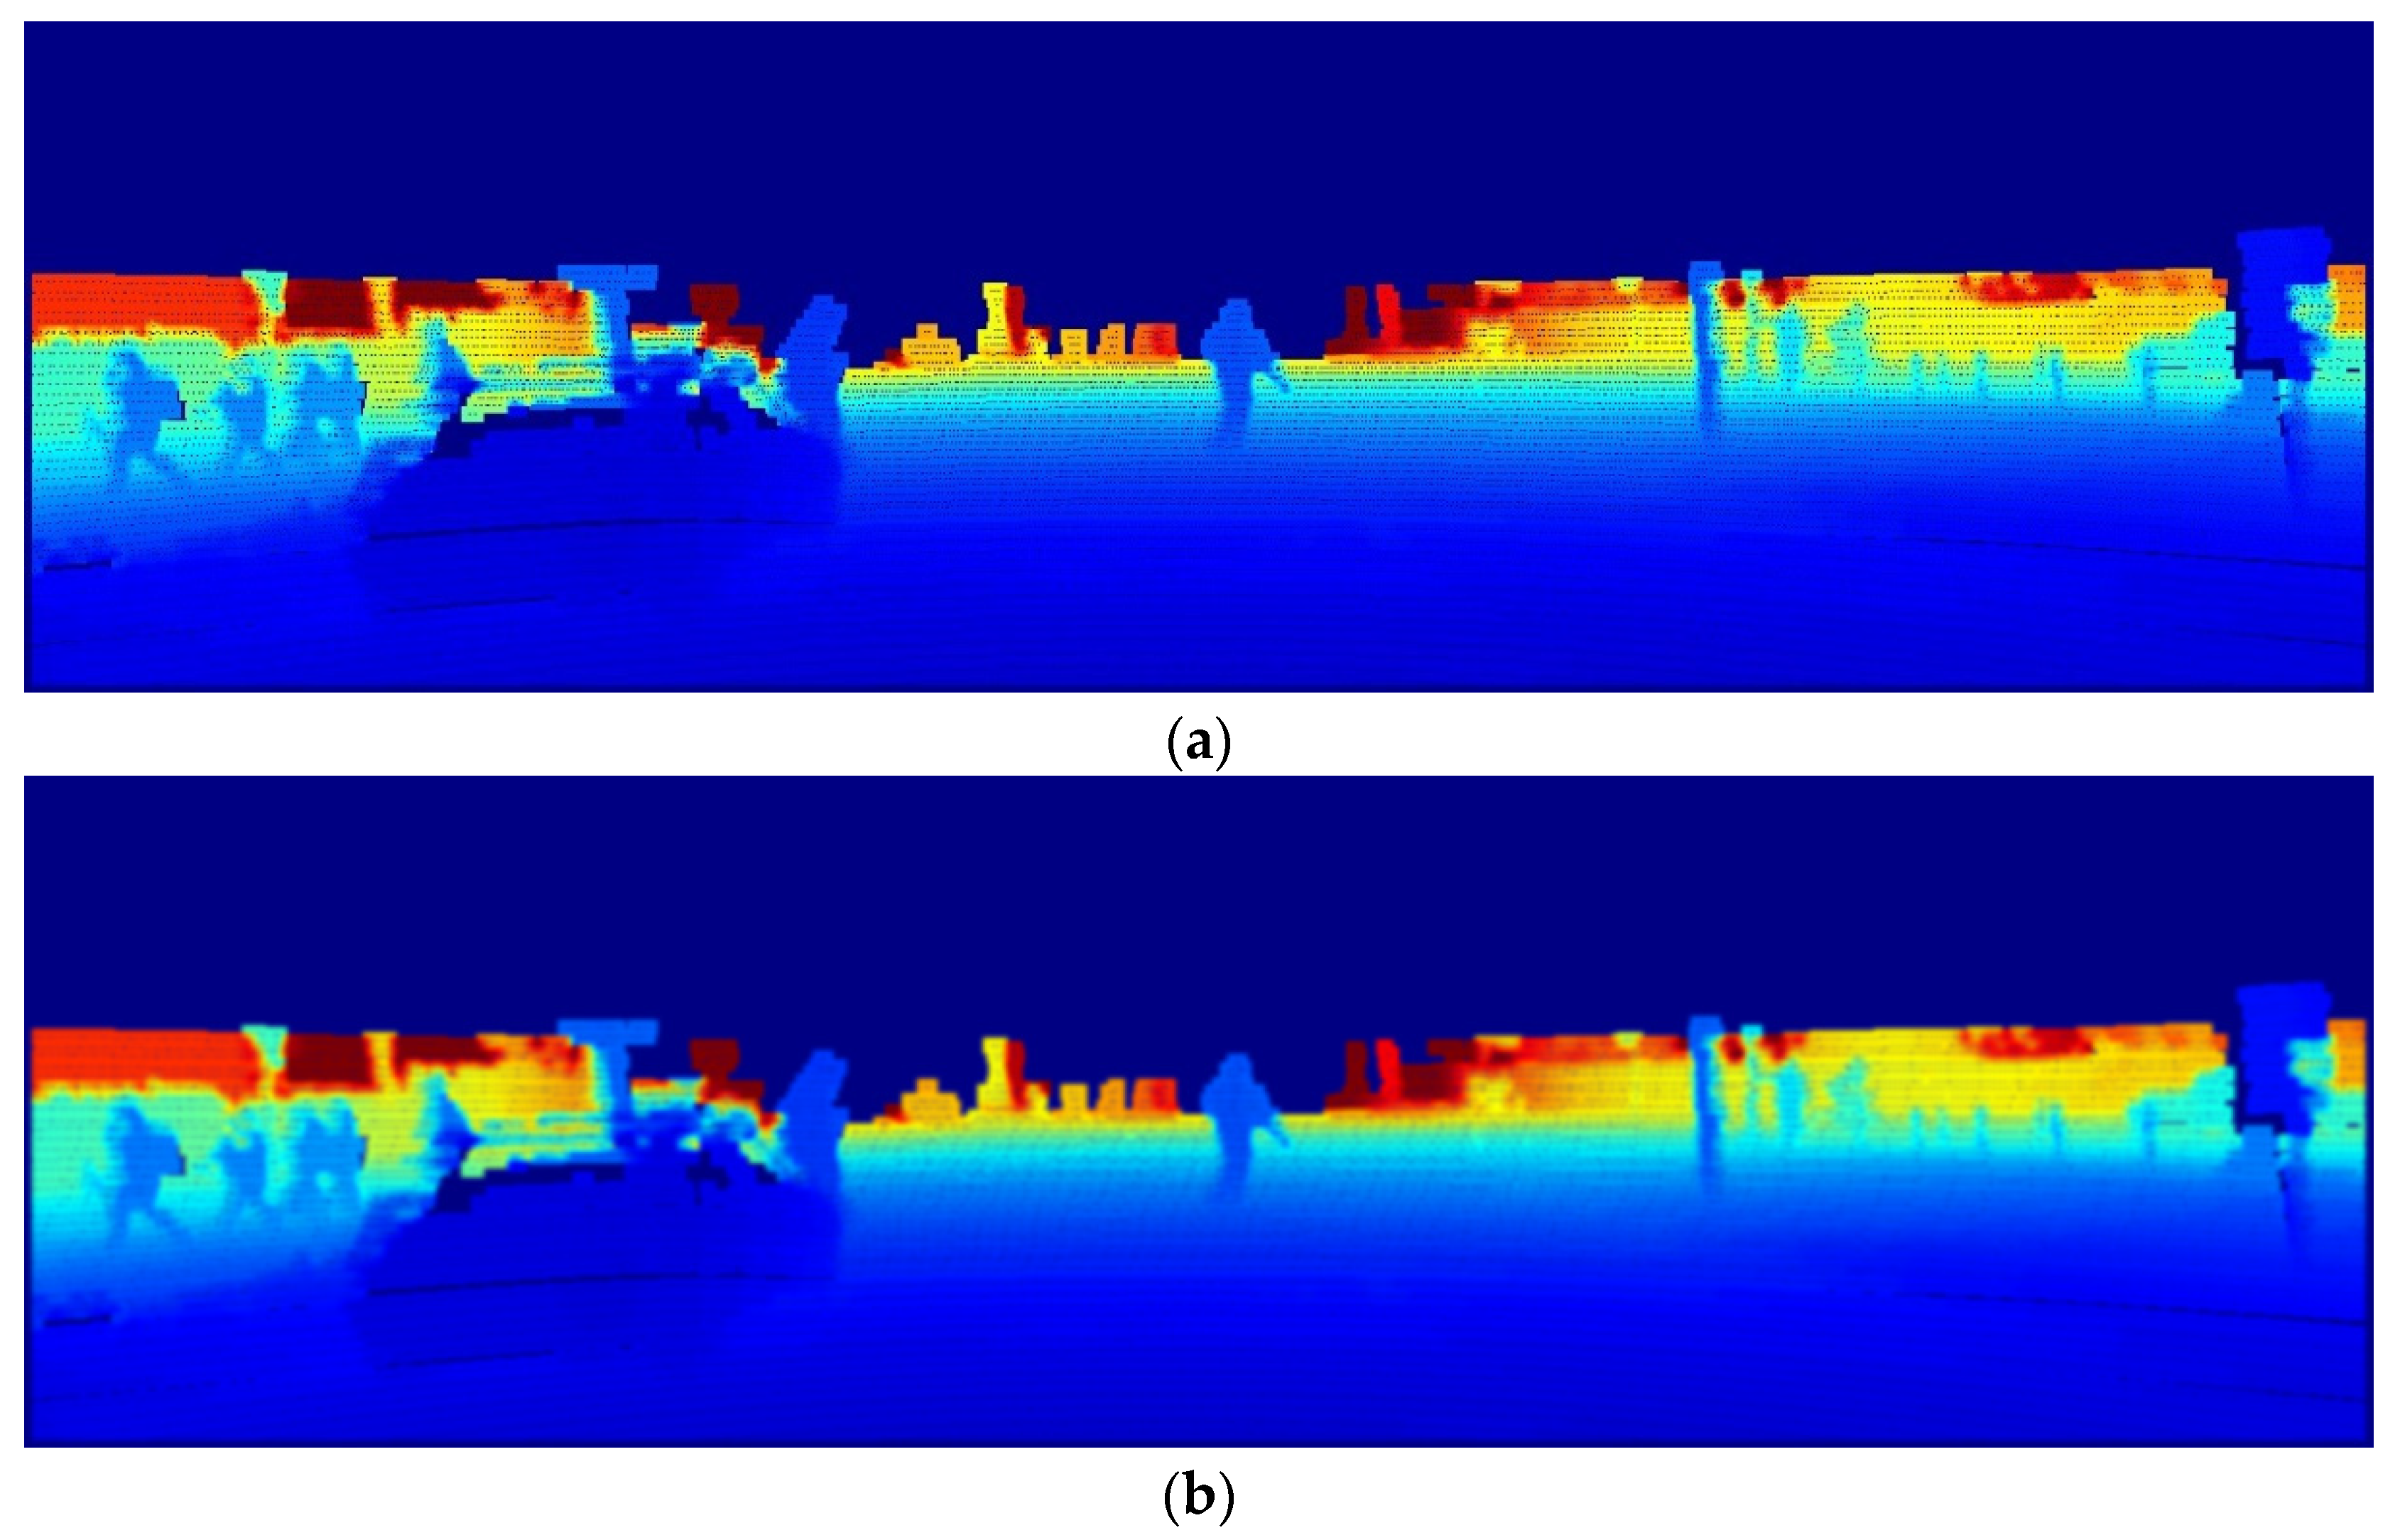
Preprocessing of depth maps using the Gaussian–Sobel filter: (a) depth map; (b) depth map after Gaussian filtering; (c) depth map after Gaussian–Sobel filtering; (d) depth map after Canny edge filtering.
As mentioned earlier, Figure 3a illustrates the variance of depth information in PCD, which varies with the data generation interval. To suppress this, we applied a Gaussian filter (Figure 3b), which suppresses the effects of noise and smooths out the contour information of the object. Moreover, we applied an additional Sobel filter, resulting in a clearer delineation of object contours, as shown in Figure 3c.
Notably, the use of Gaussian blurring and Sobel operators is also a process included in the Canny edge filter. Furthermore, the reasons for the mandatory use of the Gaussian–Sobel filter are as follows: after Gaussian blurring and Sobel masking, the Canny edge filter [27] further applies NMS and hysteresis edge tracking. However, the noise from the LiDAR channel is mistakenly enhanced along with the edges, resulting in a failure to properly segment objects from the background, thereby leading to inaccurate object detection. This phenomenon is illustrated in Figure 3d. Thus, by applying a Gaussian filter and Sobel operator, it is possible to suppress the effects of noise that deteriorates the object detection performance of the depth map; moreover, more accurate object detection is possible while maintaining the original pixel values for object contours.
2.2.3. Object Estimation Using NMS
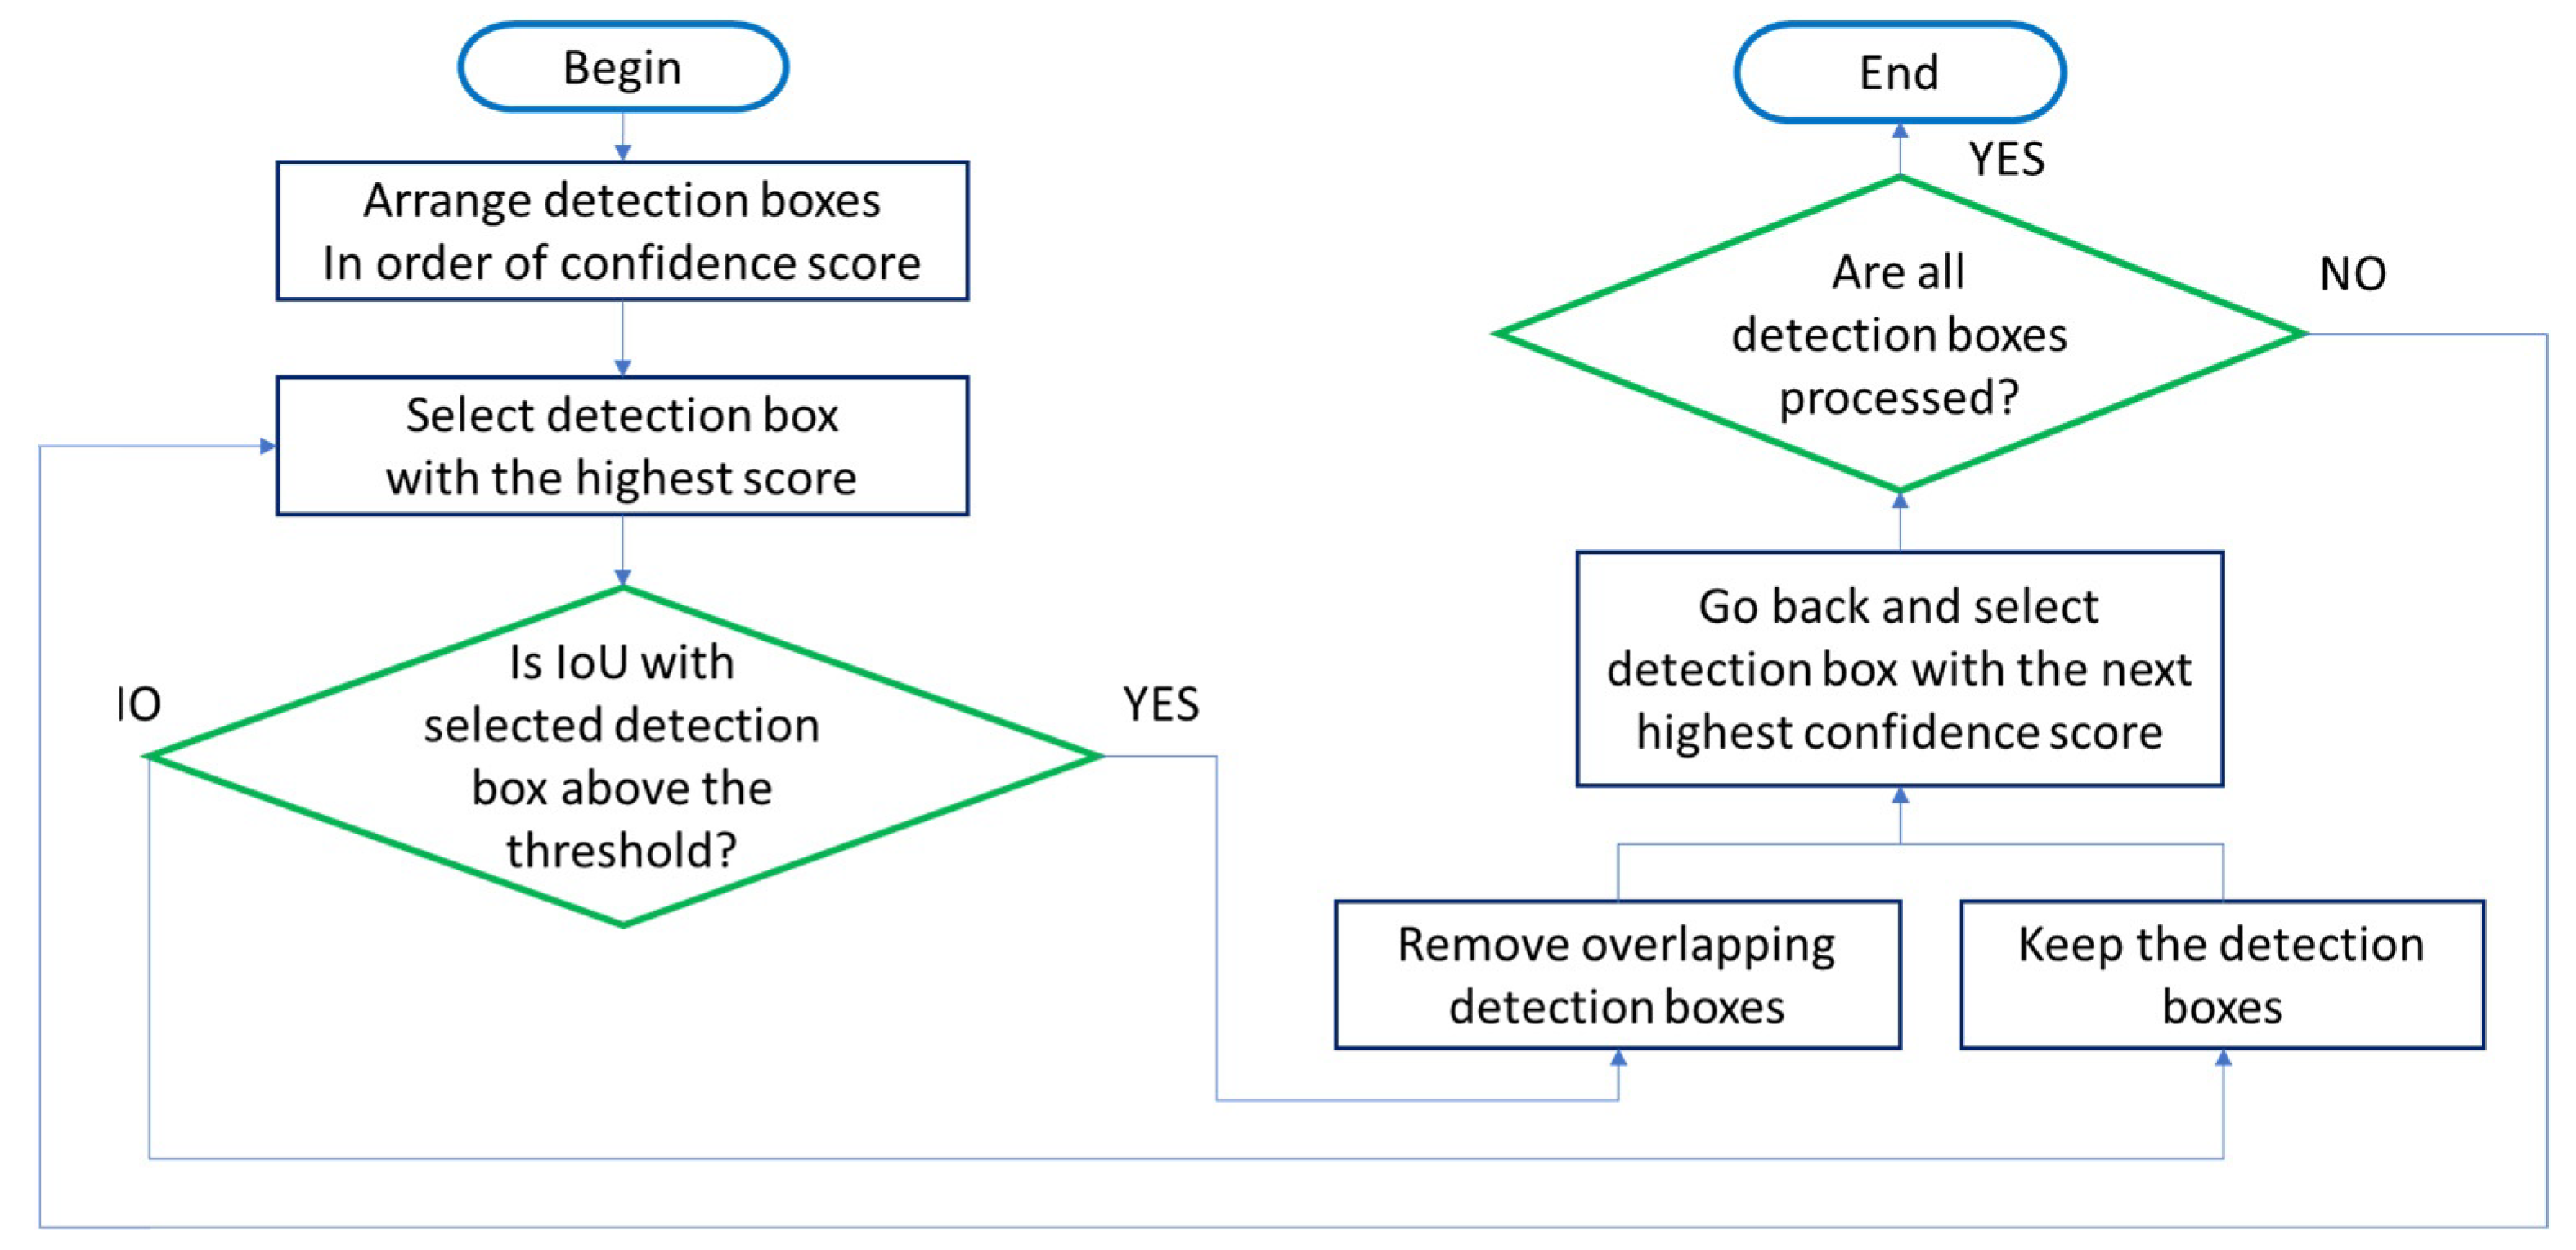
We obtain object detection results from a YOLO model applied to RGB images and another YOLO model applied to preprocessed depth maps. By fusing these results, we achieve optimized object estimation. The bounding boxes of objects detected through two independent YOLOs have , and the degree of overlap of each bounding box is determined based on the IoU. To fuse the results of individually performed object detection and ensure higher object estimation performance, it is necessary to select bounding boxes with high confidence by recognizing overlapping bounding boxes and their respective values; NMS is performed for this purpose [28]. If the IoU value between two bounding boxes is greater than a specified threshold, it is determined that the bounding boxes have detected the same object, and the bounding box with a higher is selected. This process is repeated until there are no more remaining bounding boxes (Figure 4), thereby selecting the bounding box with the highest from the remaining bounding boxes each time.
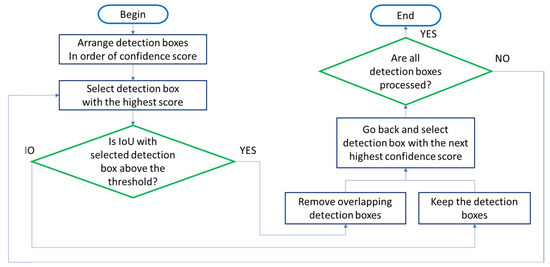
Figure 4.
Flowchart for non-maximum suppression (NMS).
3. Experimental Results
To evaluate the performance of the proposed method, we generated RGB images, images with various filters applied to the LiDAR depth map, and simulated images considering the presence of noise in LiDAR. Based on this, we aimed to verify the superiority of the proposed object detection model through comparisons with existing models that utilize RGB images or LiDAR depth maps for object detection, as well as models that fuse preprocessed depth maps.
3.1. Experimental Environment
Our proposed model is designed to reliably detect pedestrians under challenging conditions such as low light and adverse weather. It employs YOLOv4 for object detection and is implemented on an NVIDIA RTX 3060 (Santa Clara, CA, USA) and an Intel Core i7-12700 CPU (Santa Clara, CA, USA). YOLOv4 [15] is compatible with a range of deep learning frameworks, including TensorFlow and PyTorch, and offers versatility and scalability in various environments. This is particularly relevant in domains such as autonomous driving and CCTV monitoring, where real-time pedestrian detection is of paramount importance. The selection of YOLOv4 as our detection model was driven by the necessity to detect pedestrians of varying shapes in complex environments. Furthermore, there is a potential for extending its capabilities to embedded systems in the future. For the test evaluation, we used the KITTI Open Dataset [29], which consists of 1467 RGB camera images and LiDAR PCD acquired at the same time and location. Of these images, 1200 (approximately 80%) were employed for model training, with the remaining 267 being used for testing. All images were resized to 1242 pixels × 375 pixels, ensuring consistency between the RGB and depth maps. Moreover, the dataset was restricted to pedestrian-class instances.
The proposed object detection model, trained on various environments of autonomous driving scenarios, was evaluated using AP as a performance metric. AP evaluates the model performance by calculating the area under the precision–recall curve. Precision is defined as TP/(TP + FP), representing the proportion of correctly detected instances among all detected instances, while recall is defined as TP/(TP + FN), representing the proportion of correctly detected instances among those that need to be detected. Here, TP, FP, and FN stand for True Positive, False Positive, and False Negative, respectively [30].
3.2. Performance Evaluation of Object Detection under Varying Brightness Levels
To evaluate the performance of our proposed model, we compared it with state-of-the-art models that fuse RGB cameras and LiDAR data and share similar architectures. The comparative results are tabulated in Table 1. The experimental results indicate that the RGB-LiDAR fusion models, which represent the most common architecture, and the novel model proposed in this study achieved high performance levels during daytime scenarios, with the brightness set to 100%. No significant performance gap was observed between the RGB-LiDAR fusion models and the proposed model. However, the performance of both models gradually deteriorated as the lighting conditions worsened, primarily due to the RGB camera’s hypersensitivity to low light. When the image brightness was reduced to 40% of its original level, the proposed model demonstrated a slightly higher average AP compared to the baseline model, with a performance gap of approximately 1.5%. We also compared our proposed model with models that apply preprocessing filters to depth maps with a similar architecture, such as Maragos and Pessoa [12], Deng [13], and Ali and Clausi [14]. It was found that all models perform well in daylight and do not seem to differ significantly, while in darkness, our proposed model shows 1–2% higher APs and a relatively small improvement in detection accuracy.

Table 1.
Comparison of pedestrian detection performance based on average precision (AP) [%] between the proposed model and similar models under varying brightness levels.
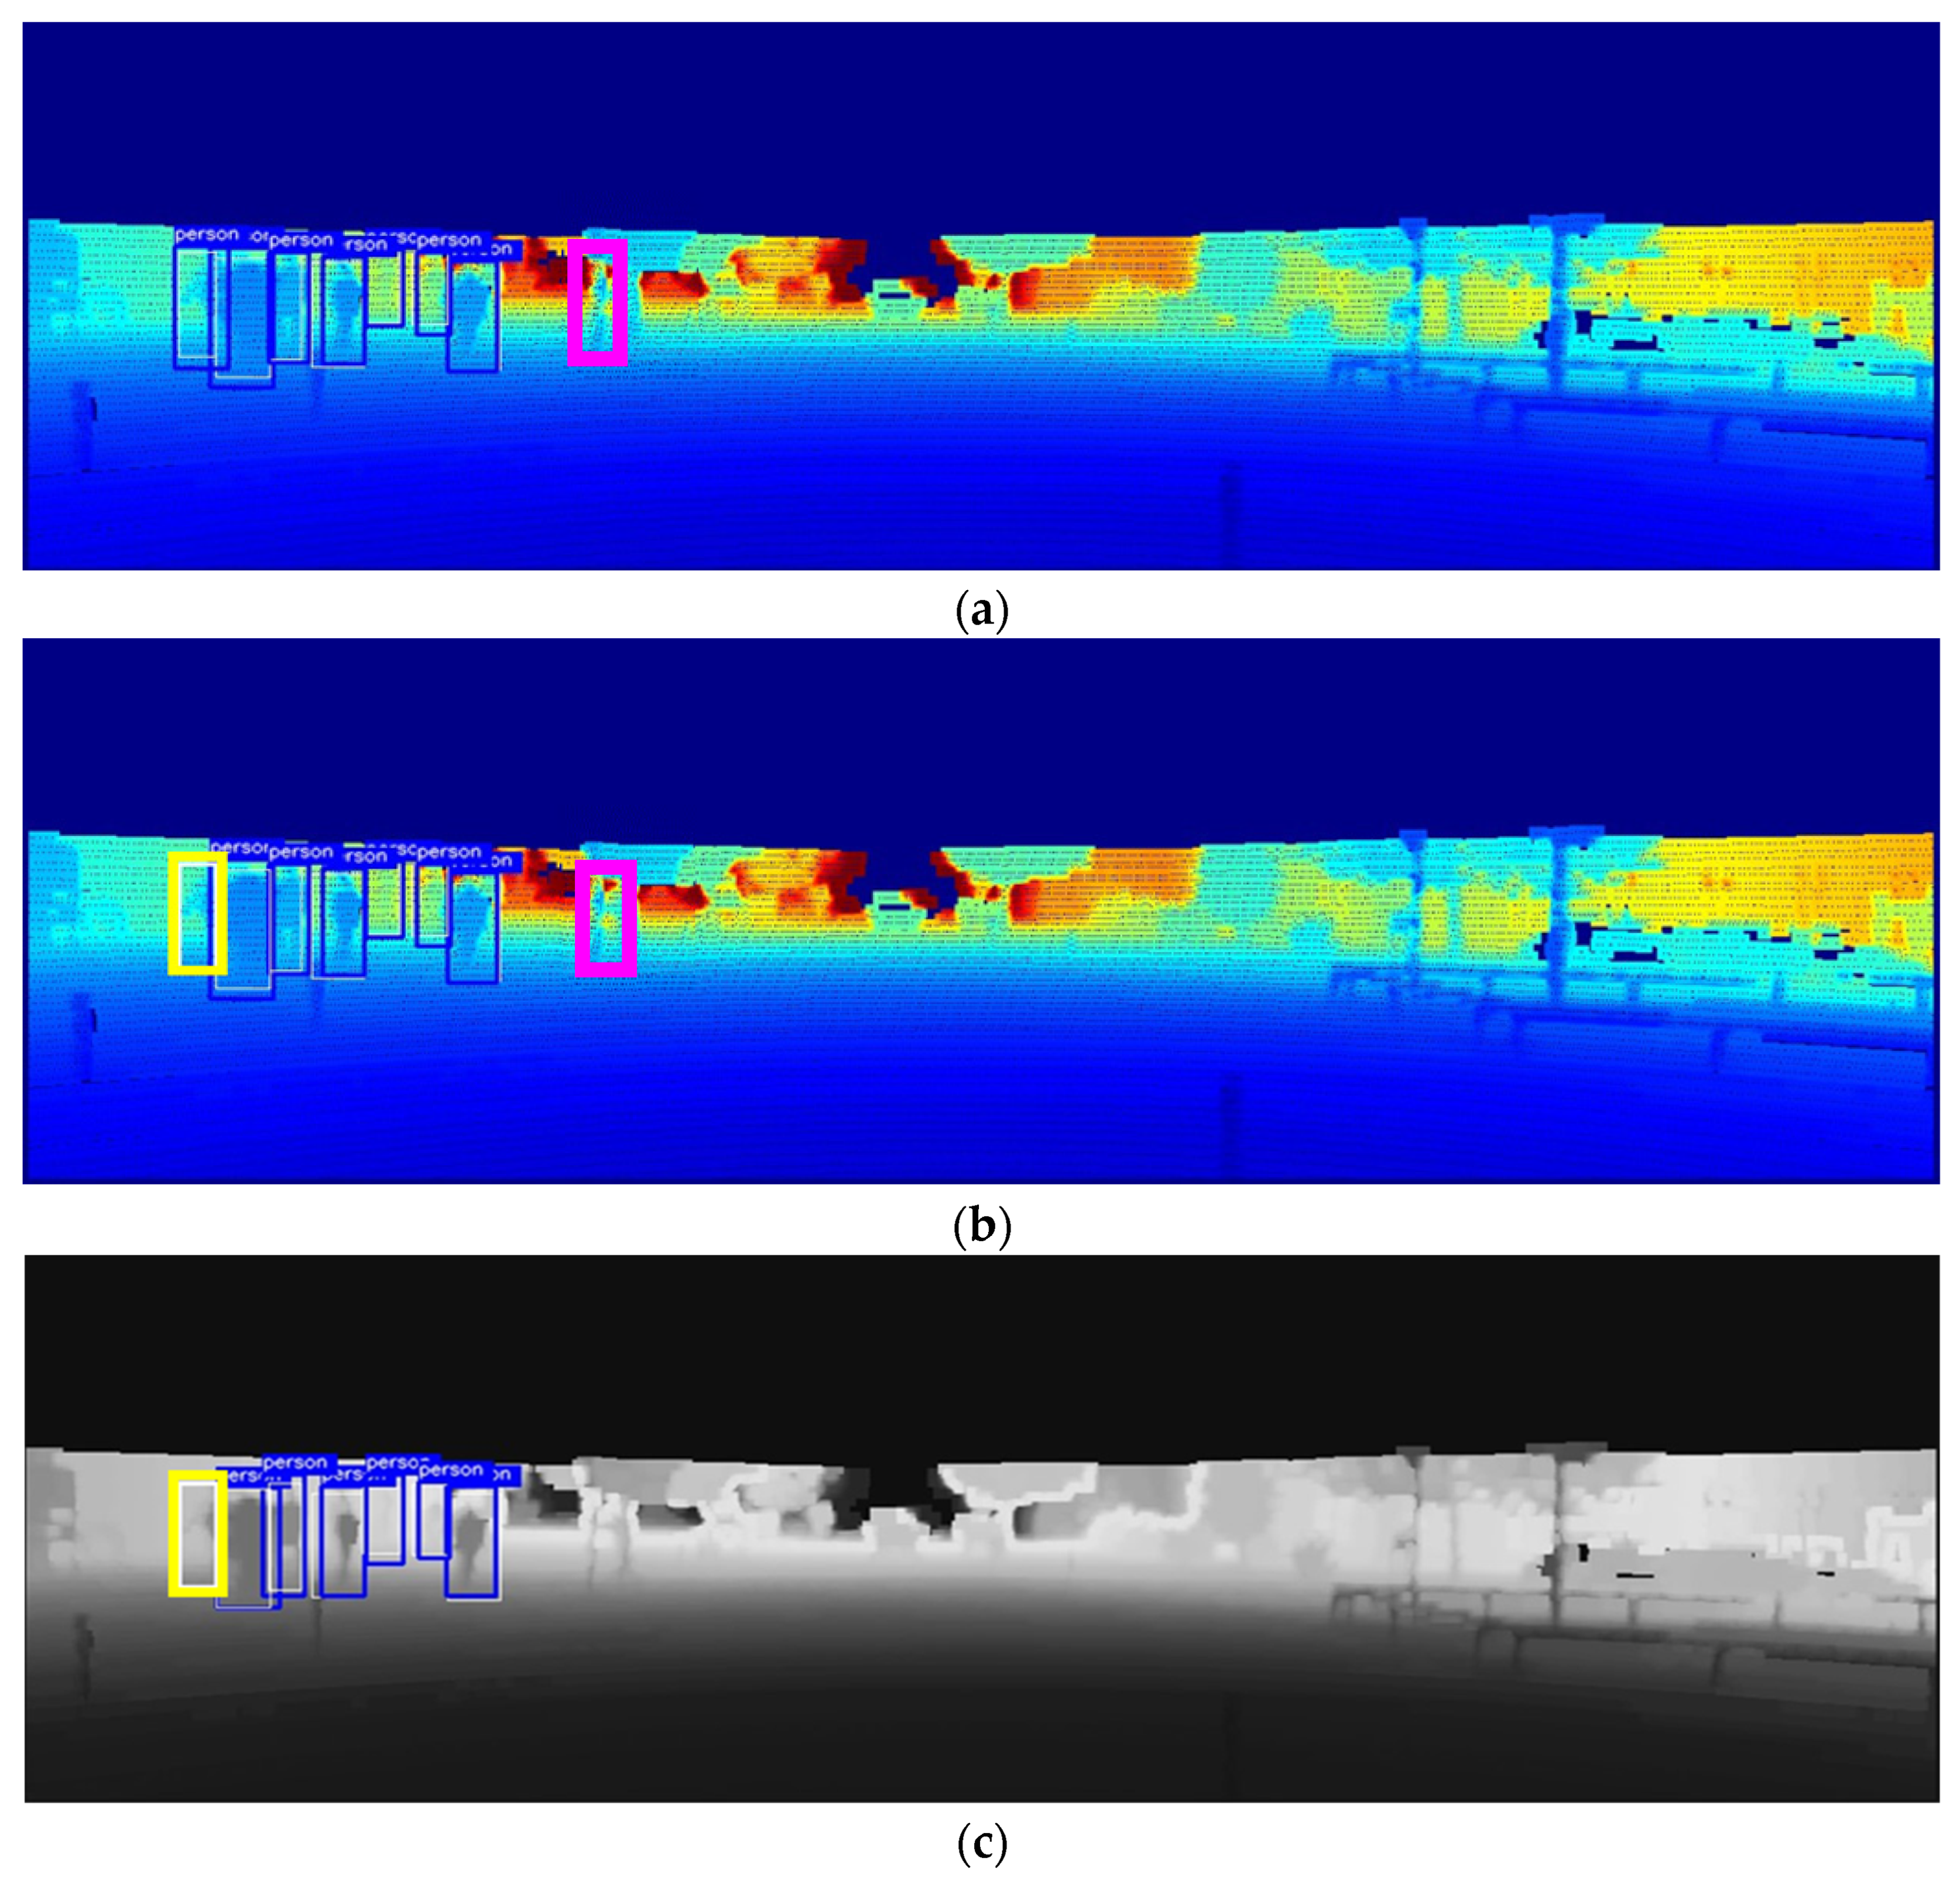
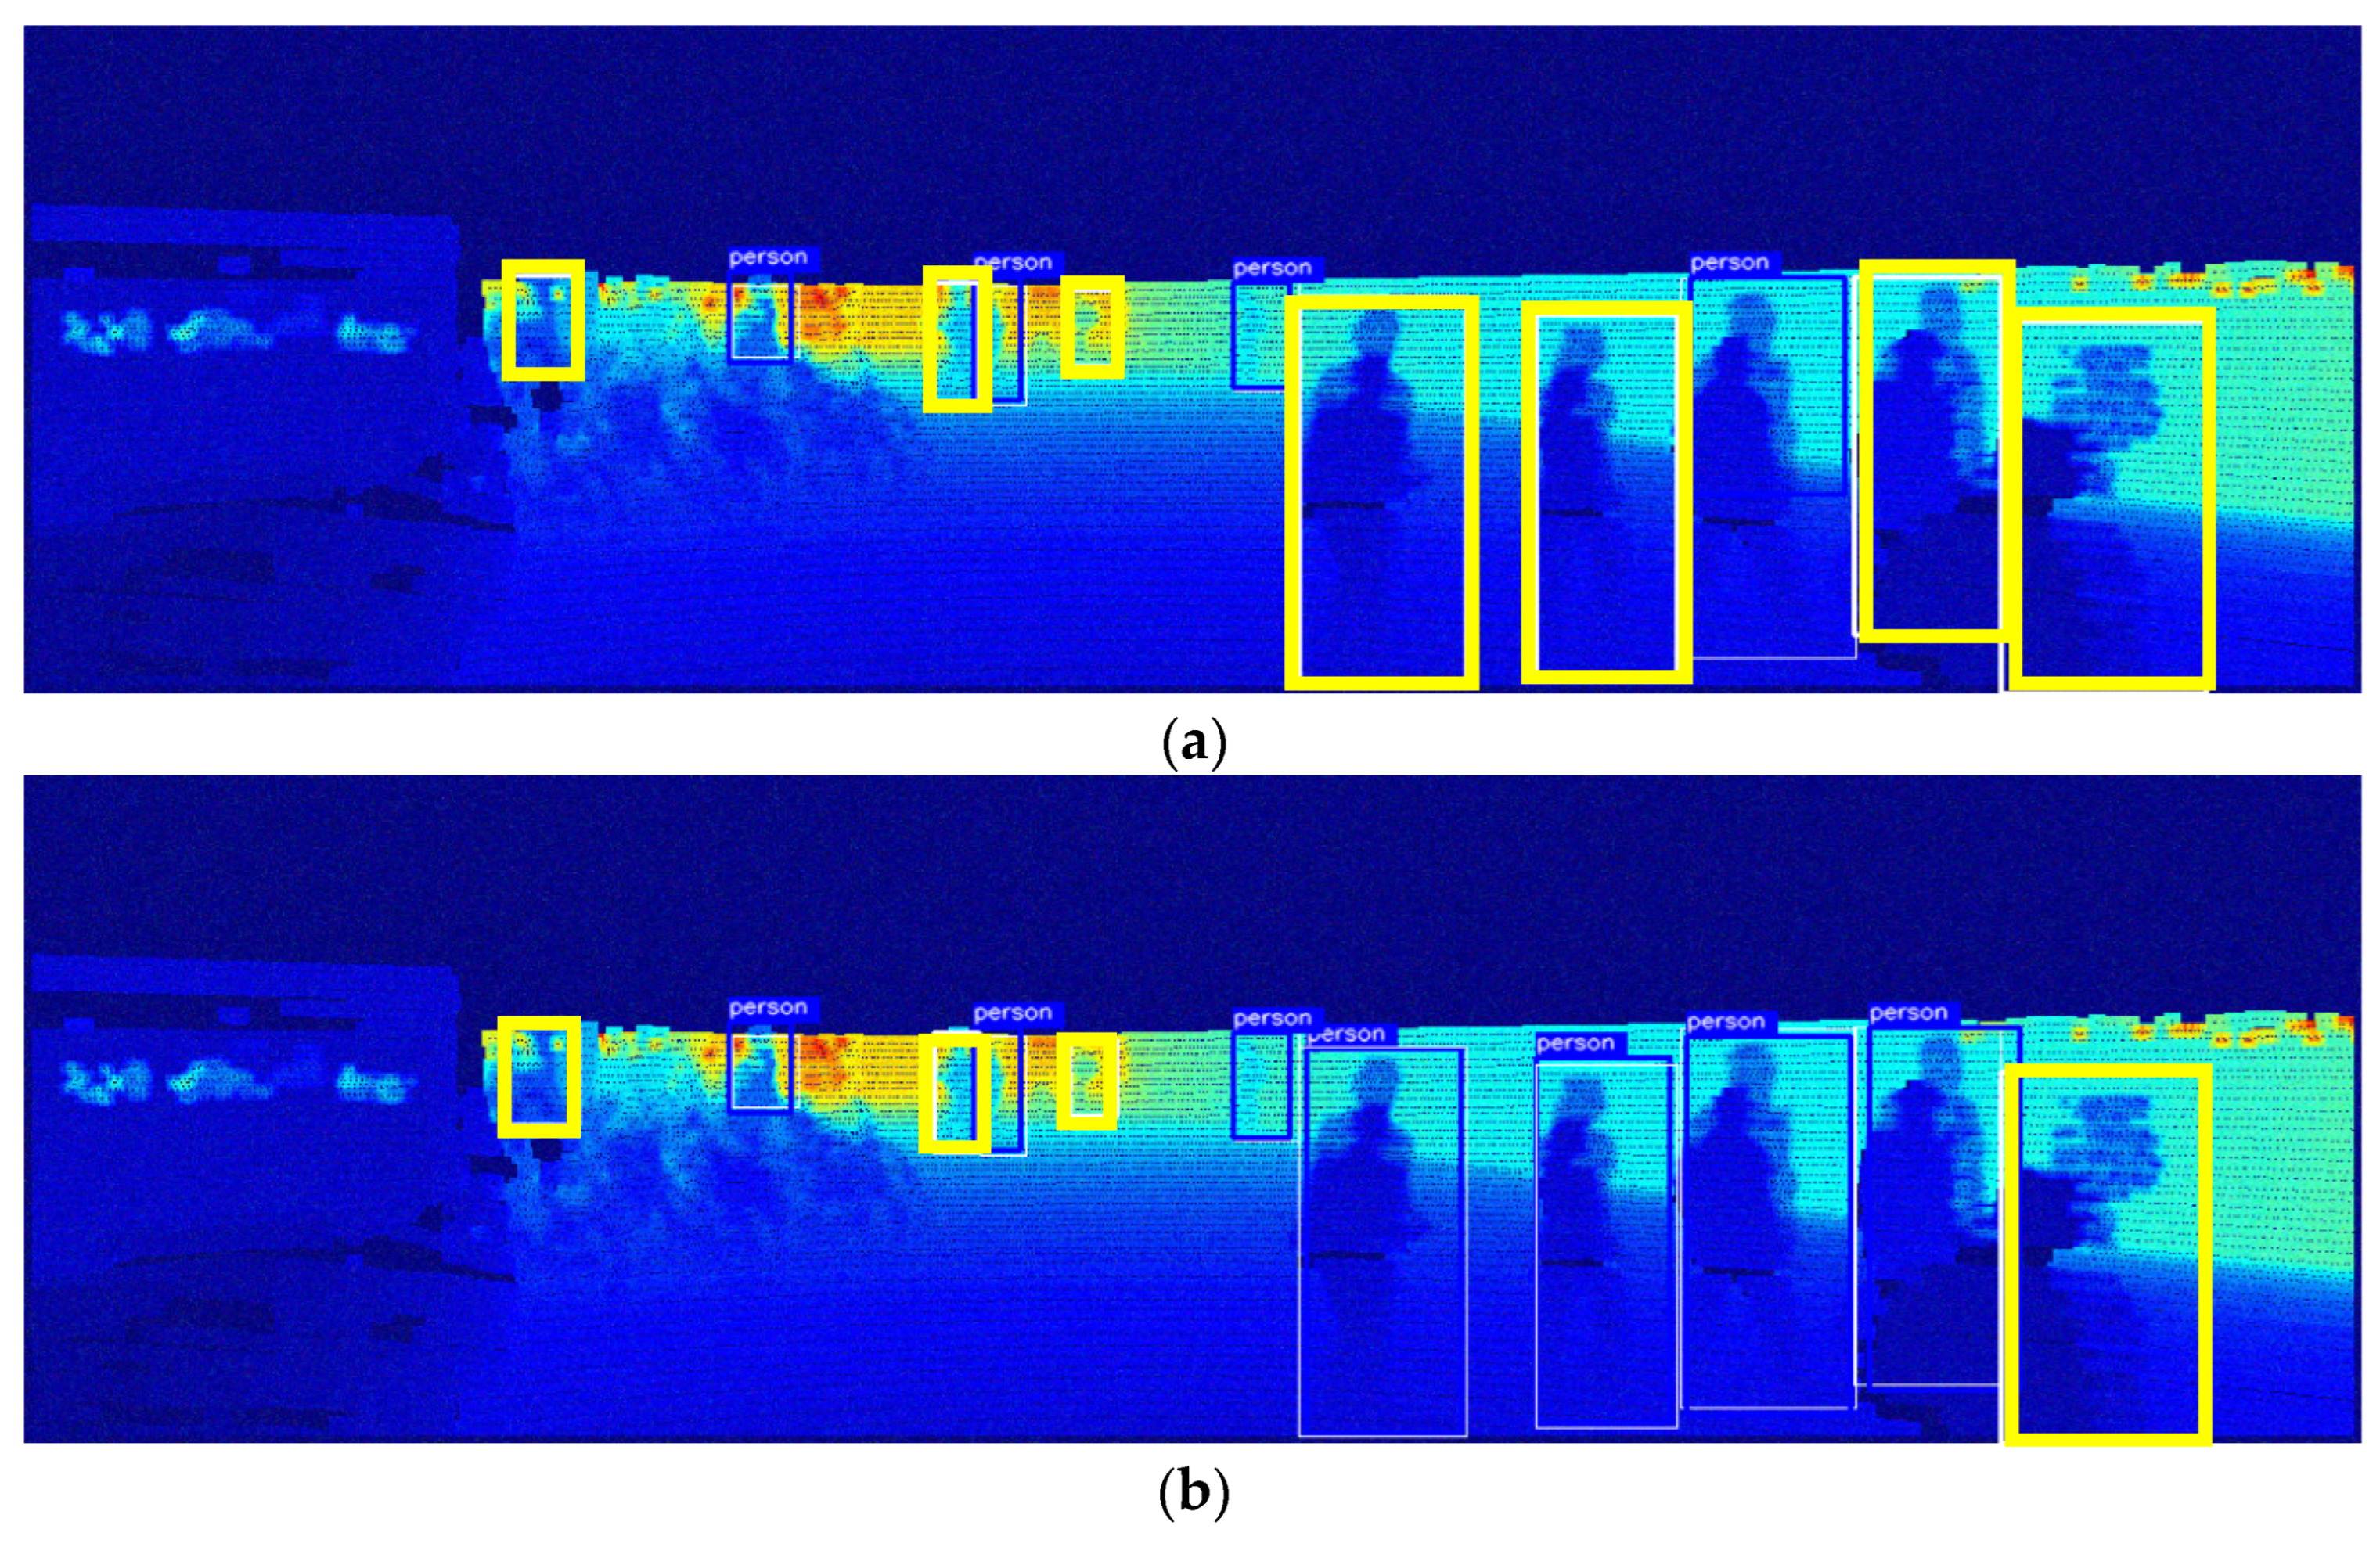
Figure 5 shows an example of pedestrian detection results in daylight, i.e., when the brightness level is 100%. In the figure, the white bounding box indicates the ground truth, the blue box indicates a successful pedestrian detection, and the thick yellow box indicates a missed detection. Figure 5a shows the result of detecting pedestrians using only the depth map obtained from LiDAR, while Figure 5b shows the result of fusing LiDAR with an RGB camera to detect pedestrians. Figure 5c–f show the detection results of the Maragos and Pessoa [12] model, which sequentially accentuates the contours of objects with the Dilation filter; the Deng [13] model, which emphasizes the density of objects with the unsharp mask filter; the Ali and Clausi [14] model applied with the Canny edge filter; and the proposed model, respectively. As can be seen, when the illumination was sufficiently high, both existing models with similar architectures detected most of the objects except for one or two, and no substantial difference was observed in their performance. However, a closer inspection reveals that the proposed model distinctly identifies a pedestrian located centrally in the scene, which is overlooked by all other methods. The proposed model’s superior reconstruction quality facilitates more accurate detection.
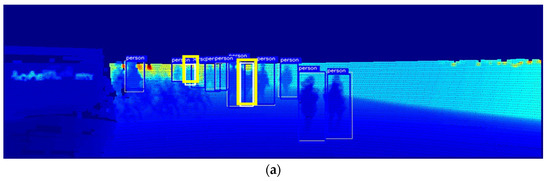
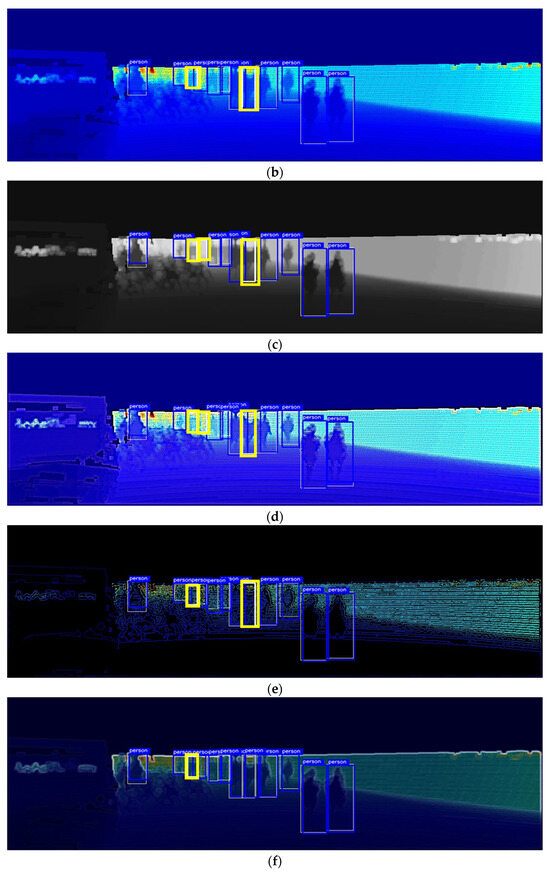
Figure 5.
Comparison of pedestrian detection performance of the proposed model and similar models at 100% brightness: (a) depth map; (b) RGB + depth map; (c) Maragos and Pessoa [12]; (d) Deng [13]; (e) Ali and Clausi [14]; (f) proposed model.
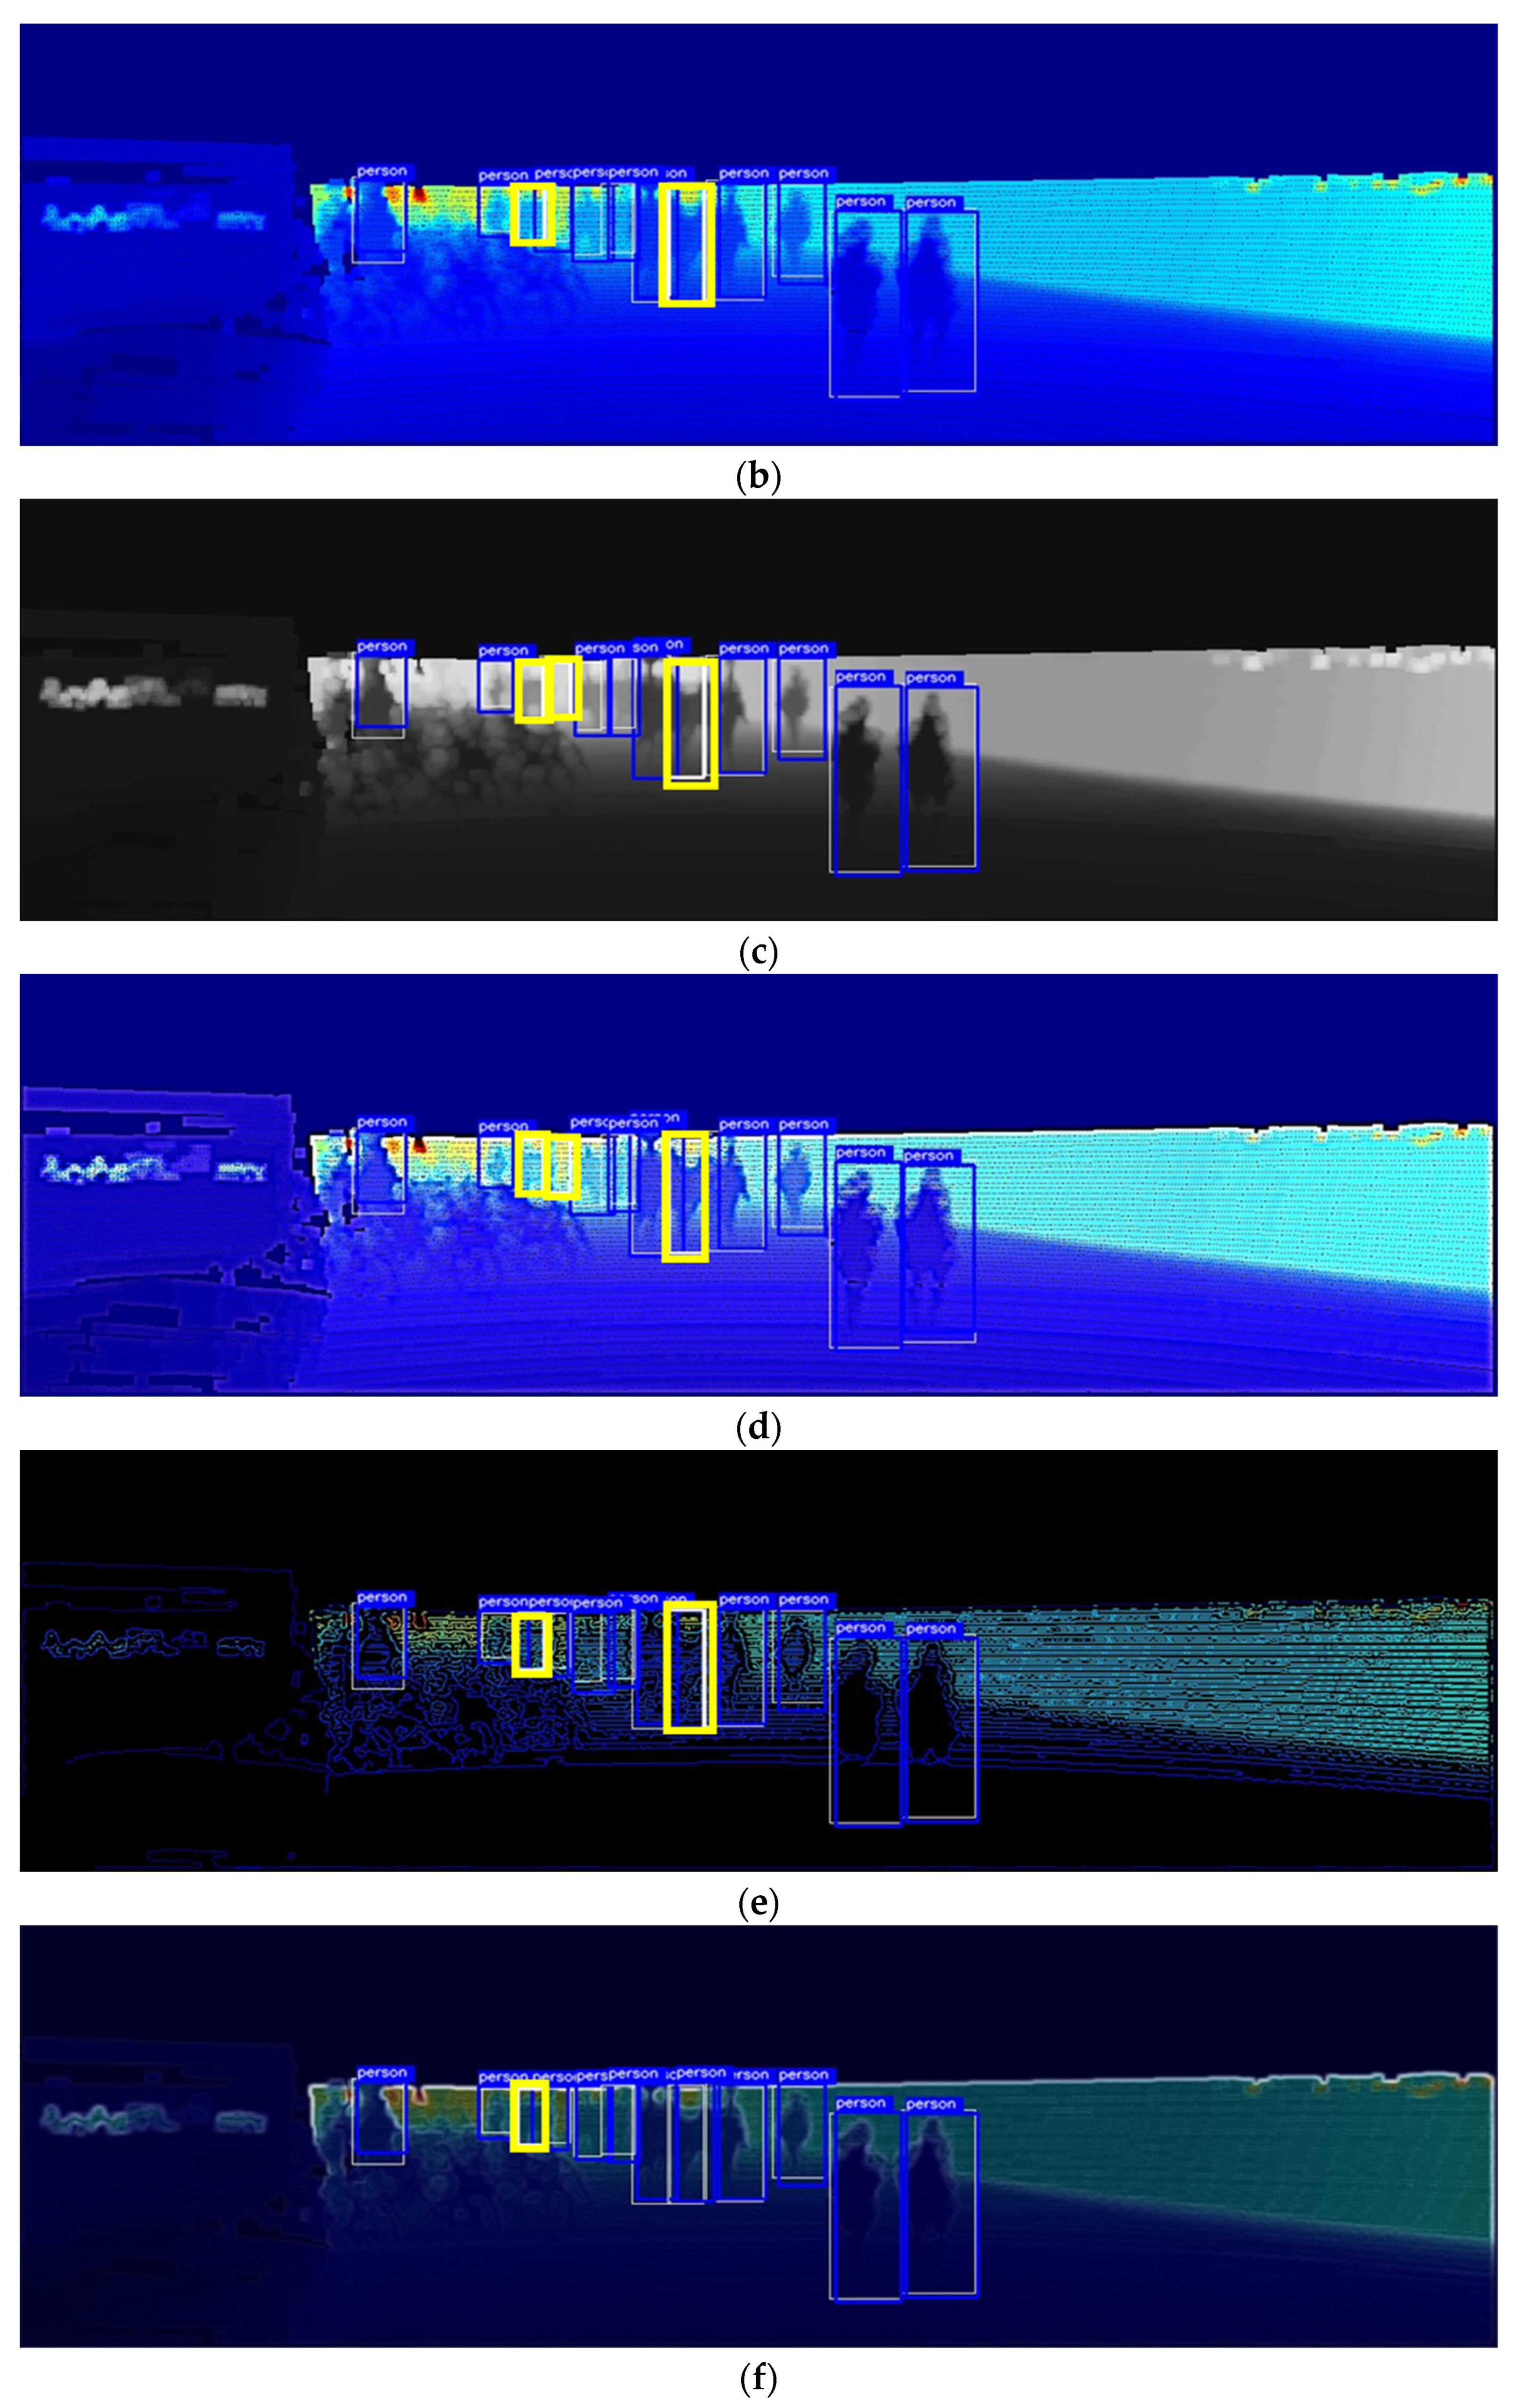
To evaluate the effectiveness of the proposed model for detecting objects in low-light environments, we conducted a pedestrian detection experiment by artificially manipulating the image to decrease its brightness to <40% of the brightness of the original image; an example of the results is shown in Figure 6. The false alarms represented by the thick pink boxes shown in Figure 6a,b were generated by models that did not apply a sharpening filter to the depth map, which can be attributed to the difficulty of distinguishing inaccurate pedestrian shapes with the depth map alone, or to the fact that the camera’s role considerably decreases with decreasing illumination. However, Figure 6c–f show that by sharpening the objects with a preprocessing filter on the depth map, the false alarm issue disappears altogether. Furthermore, Figure 6c,e show that the preprocessing of the depth map actually blurs the contours of some objects, resulting in non-detections. This demonstrates that the use of a sharpening filter can positively affect the shape of certain objects, while adversely affecting others, leading to blurred object contours. Nevertheless, the proposed model solved the problems of missed detection and false alarms of other models by making object contours clearer compared with other models and stably detected all pedestrians.
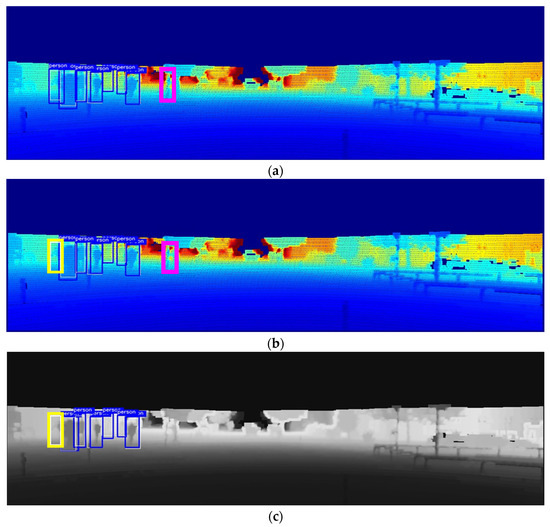
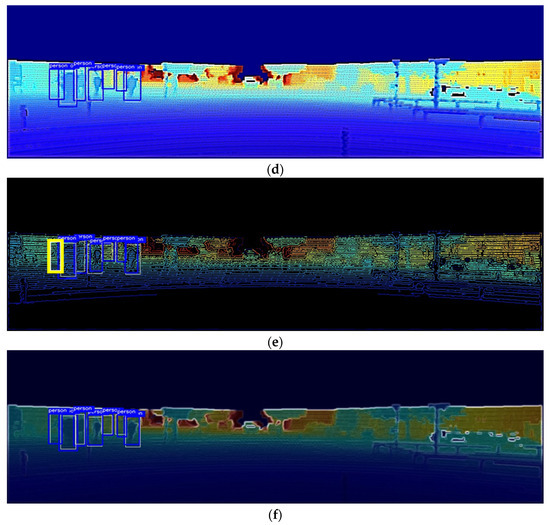
Figure 6.
Comparison of pedestrian detection performance of the proposed model and similar models at 40% brightness level: (a) depth map; (b) RGB + depth map; (c) Maragos and Pessoa [12]; (d) Deng [13]; (e) Ali and Clausi [14]; (f) proposed model.
3.3. Evaluation of Detection Performance under Varying Noises
As shown by the aforementioned experimental results, the performance of the proposed model is slightly better than the existing models in various low-light environments. Owing to its robustness against external factors such as light reflection, shadows, and darker conditions, LiDAR is far more reliable in low-light environments than cameras are. However, as LiDAR data are generated in the form of point clouds, the model may be susceptible to adverse weather conditions such as snow, rain, and fog. Therefore, to evaluate the proposed model’s coping ability when LiDAR is exposed to external environmental noise, additional experiments were carried out by adding Gaussian noise, a common type of noise encountered in real-world conditions, to the original images. To isolate the impact of low-light conditions on detection performance, we conducted experiments by varying the Gaussian noise variance in an environment with 40% ambient brightness. The pedestrian detection performance of our proposed model was compared with those of similar models. The results are summarized in Table 2. Our findings indicate that the object detection model relying solely on depth maps exhibited a substantial decline in detection performance as the noise levels increased, with its accuracy reaching as low as 50%. By integrating this model with camera data, this performance degradation was mitigated. Similarly, models that incorporated additional preprocessing on depth maps suffered from performance degradation due to increased noise. However, a camera mitigated this issue, ensuring that the detection performance remained at a reasonable 60–70% level. Compared with other models, our proposed model exhibited superior robustness to noise, maintaining approximately 80% of its performance even under increased noise. Existing models are deficient in noise effect suppression and solely focus on the contour information of all objects. Alternatively, our proposed model, which smoothens the scale of LiDAR by considering it to be noise and further overlaying the contour information of potentially occluded objects, demonstrates the most superior performance.
Table 2.
Comparison of pedestrian detection performance based on AP [%] with the proposed model and similar models under noise variation in a 40% brightness environment.
Figure 7 shows the object detection results based on an image generated by assuming that Gaussian noise with a variance of 0.5% can be introduced through LiDAR. Figure 7a shows that in the case of detecting objects using only the depth map, most objects cannot be detected, and it completely fails to function as a detection model. In contrast, Figure 7b–f show a considerable decrease in the number of undetected objects by fusing RGB images and applying preprocessing to the depth map. In particular, the proposed model had a higher detection performance than other models and detected all objects. These results indicate that the proposed model exhibits strong noise robustness, demonstrating its reliability in various low-light night-time scenarios and noisy environments.
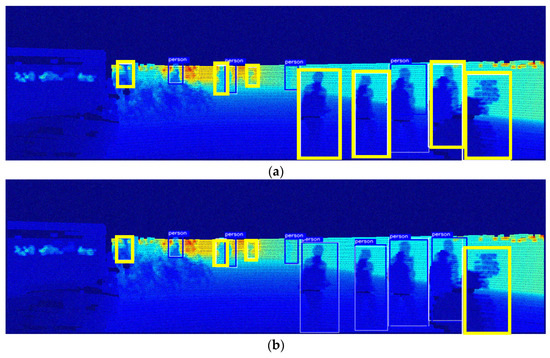
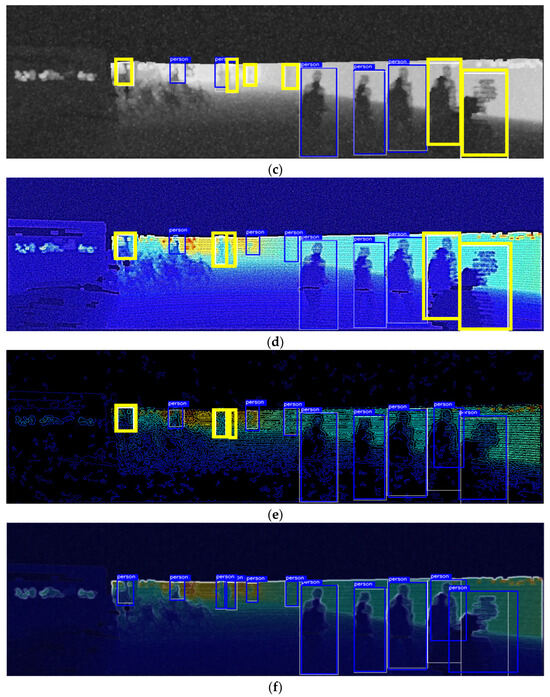
Figure 7.
Comparison of the pedestrian detection performance of the proposed model and similar models at 40% brightness and 0.5% noise level: (a) depth map; (b) RGB + depth map; (c) Maragos and Pessoa [12]; (d) Deng [13]; (e) Ali and Clausi [14]; (f) proposed model.
4. Discussion
Despite advancements in autonomous vehicle technology and increasing utilization rates, object detection models that are reliant on cameras and LiDAR remain susceptible to causing pedestrian collision accidents under adverse conditions such as night-time or inclement weather. Therefore, this study proposes a new pedestrian detection model utilizing multiple sensors and fusion filters to improve pedestrian detection performance by compensating for the weaknesses of such detection models, thereby demonstrating an innovative method for enhancing object identification in low-light conditions. To effectively utilize depth maps created through LiDAR for object detection, we combined three key elements: a Gaussian blurring function to suppress the effects of noise, in combination with the Sobel operator to accentuate pedestrian features, and optimization of pedestrian detection estimation through the fusion of heterogeneous sensors, camera, and LiDAR. Through experimentation, we verified the potential of this combination to considerably improve pedestrian detection accuracy. Our results indicate that this approach outperforms traditional methods in terms of detection accuracy. In particular, this approach maintains a remarkable detection accuracy even in low-light and noisy environments where object features and contours are not clearly visible. Moreover, this approach demonstrates its efficiency by achieving at least a 7% improvement in AP compared with previously reported approaches. Future research will focus on overcoming these limitations and enhancing the robustness of the system. Furthermore, we aim to implement the proposed model on embedded systems and reduce its size for deployment on devices with limited computing resources, thereby facilitating practical applications. To address these limitations and explore future possibilities, we anticipate advancements in approaches for developing more robust low-light object detection models that can be deployed on a wider range of devices.
Author Contributions
M.J. and J.C. took part in the discussion of the work described in this paper. All authors have read and agreed to the published version of the manuscript.
Funding
This research was funded by a National Research Foundation of Korea (NRF) grant funded by the Korean government (MOE) (No. 2021R1I1A3055973) and the Soonchunhyang University Research Fund.
Institutional Review Board Statement
Not applicable.
Informed Consent Statement
Not applicable.
Data Availability Statement
The raw data supporting the conclusions of this article will be made available by the authors on request.
Acknowledgments
The authors thank the editor and anonymous reviewers for their helpful comments and valuable suggestions.
Conflicts of Interest
The authors declare no conflicts of interest.
References
- Claussmann, L.; Revilloud, M.; Gruyer, D.; Glaser, S. A Review of Motion Planning for Highway Autonomous Driving. IEEE Trans. Intell. Transp. Syst. 2020, 21, 1826–1848. [Google Scholar] [CrossRef]
- Bresson, G.; Alsayed, Z.; Yu, L.; Glaser, S. Simultaneous Localization and Mapping: A Survey of Current Trends in Autonomous Driving. IEEE Trans. Intell. Veh. 2017, 2, 194–220. [Google Scholar] [CrossRef]
- Jhong, S.; Chen, Y.; Hsia, C.; Wang, Y.; Lai, C. Density-Aware and Semantic-Guided Fusion for 3-D Object Detection Using LiDAR-Camera Sensors. IEEE Sens. J. 2023, 23, 22051–22063. [Google Scholar] [CrossRef]
- Cheng, L.; He, Y.; Mao, Y.; Liu, Z.; Dang, X.; Dong, Y.; Wu, L. Personnel Detection in Dark Aquatic Environments Based on Infrared Thermal Imaging Technology and an Improved YOLOv5s Model. Sensors 2024, 24, 3321. [Google Scholar] [CrossRef] [PubMed]
- Hsu, W.; Yang, P. Pedestrian Detection Using Multi-Scale Structure-Enhanced Super-Resolution. IEEE Trans. Intell. Transp. Syst. 2023, 24, 12312–12322. [Google Scholar] [CrossRef]
- Zhang, T.; Ye, Q.; Zhang, B.; Liu, J.; Zhang, X.; Tian, Q. Feature Calibration Network for Occluded Pedestrian Detection. IEEE Trans. Intell. Transp. Syst. 2022, 23, 4151–4163. [Google Scholar] [CrossRef]
- Mushtaq, Z.; Nasti, S.; Verma, C.; Raboaca, M.; Kumar, N.; Nasti, S. Super Resolution for Noisy Images Using Convolutional Neural Networks. Mathematics 2022, 10, 777. [Google Scholar] [CrossRef]
- Xu, X.; Wang, S.; Wang, Z.; Zhang, X.; Hu, R. Exploring Image Enhancement for Salient Object Detection in Low Light Images. ACM Trans. Multimed. Comput. Commun. Appl. 2021, 17, 1–19. [Google Scholar] [CrossRef]
- Gilroy, S.; Jones, E.; Glavin, M. Overcoming Occlusion in the Automotive Environment—A Review. IEEE Trans. Intell. Transp. Syst. 2020, 22, 23–35. [Google Scholar] [CrossRef]
- Lin, T.; Tan, D.; Tang, H.; Chien, S.; Chang, F.; Chen, Y.; Cheng, W. Pedestrian Detection from Lidar Data via Cooperative Deep and Hand-Crafted Features. In Proceedings of the IEEE International Conference on Image Processing, Athens, Greece, 7–10 October 2018; pp. 1922–1926. [Google Scholar]
- Qi, C.; Liu, W.; Wu, C.; Su, H.; Guibas, L. Frustum PointNets for 3D Object Detection from RGB-D Data. In Proceedings of the IEEE Conference on Computer Vision and Pattern Recognition, Salt Lake City, UT, USA, 18–23 June 2018; pp. 918–927. [Google Scholar]
- Maragos, P. Morphological Filtering for Image Enhancement and Feature Detection. In The Image and Video Processing Handbook, 2nd ed.; Bovik, A.C., Ed.; Elsevier Academic Press: Cambridge, MA, USA, 2005; pp. 135–156. [Google Scholar]
- Deng, G. A Generalized Unsharp Masking Algorithm. IEEE Trans. Image Process. 2011, 20, 1249–1261. [Google Scholar] [CrossRef]
- Ali, M.; Clausi, D. Using the Canny Edge Detector for Feature Extraction and Enhancement of Remote Sensing Images. In Proceedings of the IEEE International Geoscience and Remote Sensing Symposium, Sydney, Australia, 9–13 July 2001; pp. 2298–2300. [Google Scholar]
- Bochkovskiy, A.; Chien, W.; Hong, L. Yolov4: Optimal Speed and Accuracy of Object Detection. arXiv 2020, arXiv:2004.10934. [Google Scholar]
- Ravpreet, K.; Sarbjeet, S. A Comprehensive Review of Object Detection with Deep Learning. Digit. Signal Process. 2023, 132, 203812. [Google Scholar]
- Pham, M.; Courtrai, L.; Friguet, C.; Lefèvre, S.; Baussard, A. YOLO-Fine: One-Stage Detector of Small Objects Under Various Backgrounds in Remote Sensing Images. Remote Sens. 2020, 12, 2501. [Google Scholar] [CrossRef]
- Chen, K.; Li, J.; Lin, W.; See, J.; Wang, J.; Duan, L.; Chen, Z.; He, C.; Zou, J. Towards Accurate One-Stage Object Detection with AP-Loss. In Proceedings of the IEEE/CVF Conference on Computer Vision and Pattern Recognition, Long Beach, CA, USA, 15–20 June 2019; pp. 5114–5122. [Google Scholar]
- Liu, W.; Anguelov, D.; Erhan, D.; Szegedy, C.; Reed, S.; Fu, C.; Berg, A. SSD: Single Shot Multibox Detector. In Proceedings of the European Conference on Computer Vision, Amsterdam, The Netherlands, 8–16 October 2016; pp. 21–37. [Google Scholar]
- Redmon, J.; Divvala, S.; Girshick, R.; Farhadi, A. You Only Look Once: Unified, Real-Time Object Detection. In Proceedings of the IEEE Conference on Computer Vision and Pattern Recognition, Las Vegas, NV, USA, 27–30 June 2016; pp. 779–788. [Google Scholar]
- Cai, H.; Pang, W.; Chen, X.; Wang, Y.; Liang, H. A Novel Calibration Board and Experiments for 3D LiDAR and Camera Calibration. Sensors 2020, 20, 1130. [Google Scholar] [CrossRef] [PubMed]
- Xie, X.; Wang, C.; Li, M. A Fragile Watermark Scheme for Image Recovery Based on Singular Value Decomposition, Edge Detection and Median Filter. Appl. Sci. 2019, 9, 3020. [Google Scholar] [CrossRef]
- Tang, D.; Xu, Y.; Liu, X. Application of an Improved Laplacian-of-Gaussian Filter for Bearing Fault Signal Enhancement of Motors. Machines 2024, 12, 389. [Google Scholar] [CrossRef]
- Popkin, T.; Cavallaro, A.; Hands, D. Accurate and Efficient Method for Smoothly Space-Variant Gaussian Blurring. IEEE Trans. Image Process. 2010, 19, 1362–1370. [Google Scholar] [CrossRef]
- Ma, Y.; Ma, H.; Chu, P. Demonstration of Quantum Image Edge Extraction Enhancement through Improved Sobel Operator. IEEE Access 2020, 8, 210277–210285. [Google Scholar] [CrossRef]
- Kanopoulos, N.; Vasanthavada, N.; Baker, R. Design of an Image Edge Detection Filter Using the Sobel Operator. IEEE J. Solid-State Circuits 1988, 23, 358–367. [Google Scholar] [CrossRef]
- Pawar, K.; Nalbalwar, S. Distributed Canny Edge Detection Algorithm Using Morphological Filter. In Proceedings of the IEEE International Conference on Recent Trends in Electronics, Information & Communication Technology, Bangalore, India, 20–21 May 2016; pp. 1523–1527. [Google Scholar]
- Zaghari, N.; Fathy, M.; Jameii, S.; Shahverdy, M. The improvement in obstacle detection in autonomous vehicles using YOLO non-maximum suppression fuzzy algorithm. J. Supercomput. 2021, 77, 13421–13446. [Google Scholar] [CrossRef]
- Geiger, A.; Lenz, P.; Urtasun, R. Are we ready for autonomous driving? The kitti vision benchmark suite. In Proceedings of the IEEE Conference on Computer Vision and Pattern Recognition, Providence, RI, USA, 16–21 June 2012; pp. 3354–3361. [Google Scholar]
- Behl, A.; Mohapatra, P.; Jawahar, C.; Kumar, M. Optimizing Average Precision Using Weakly Supervised Data. IEEE Trans. Pattern Anal. Mach. Intell. 2015, 37, 2545–2557. [Google Scholar] [CrossRef] [PubMed]


Disclaimer/Publisher’s Note: The statements, opinions and data contained in all publications are solely those of the individual author(s) and contributor(s) and not of MDPI and/or the editor(s). MDPI and/or the editor(s) disclaim responsibility for any injury to people or property resulting from any ideas, methods, instructions or products referred to in the content. |
© 2024 by the authors. Licensee MDPI, Basel, Switzerland. This article is an open access article distributed under the terms and conditions of the Creative Commons Attribution (CC BY) license (https://creativecommons.org/licenses/by/4.0/).