
Prediction of Leakage Flow Rate and Blow-Down in Brush Seals via 2D CFD Simulation with Porosity Correction


Abstract
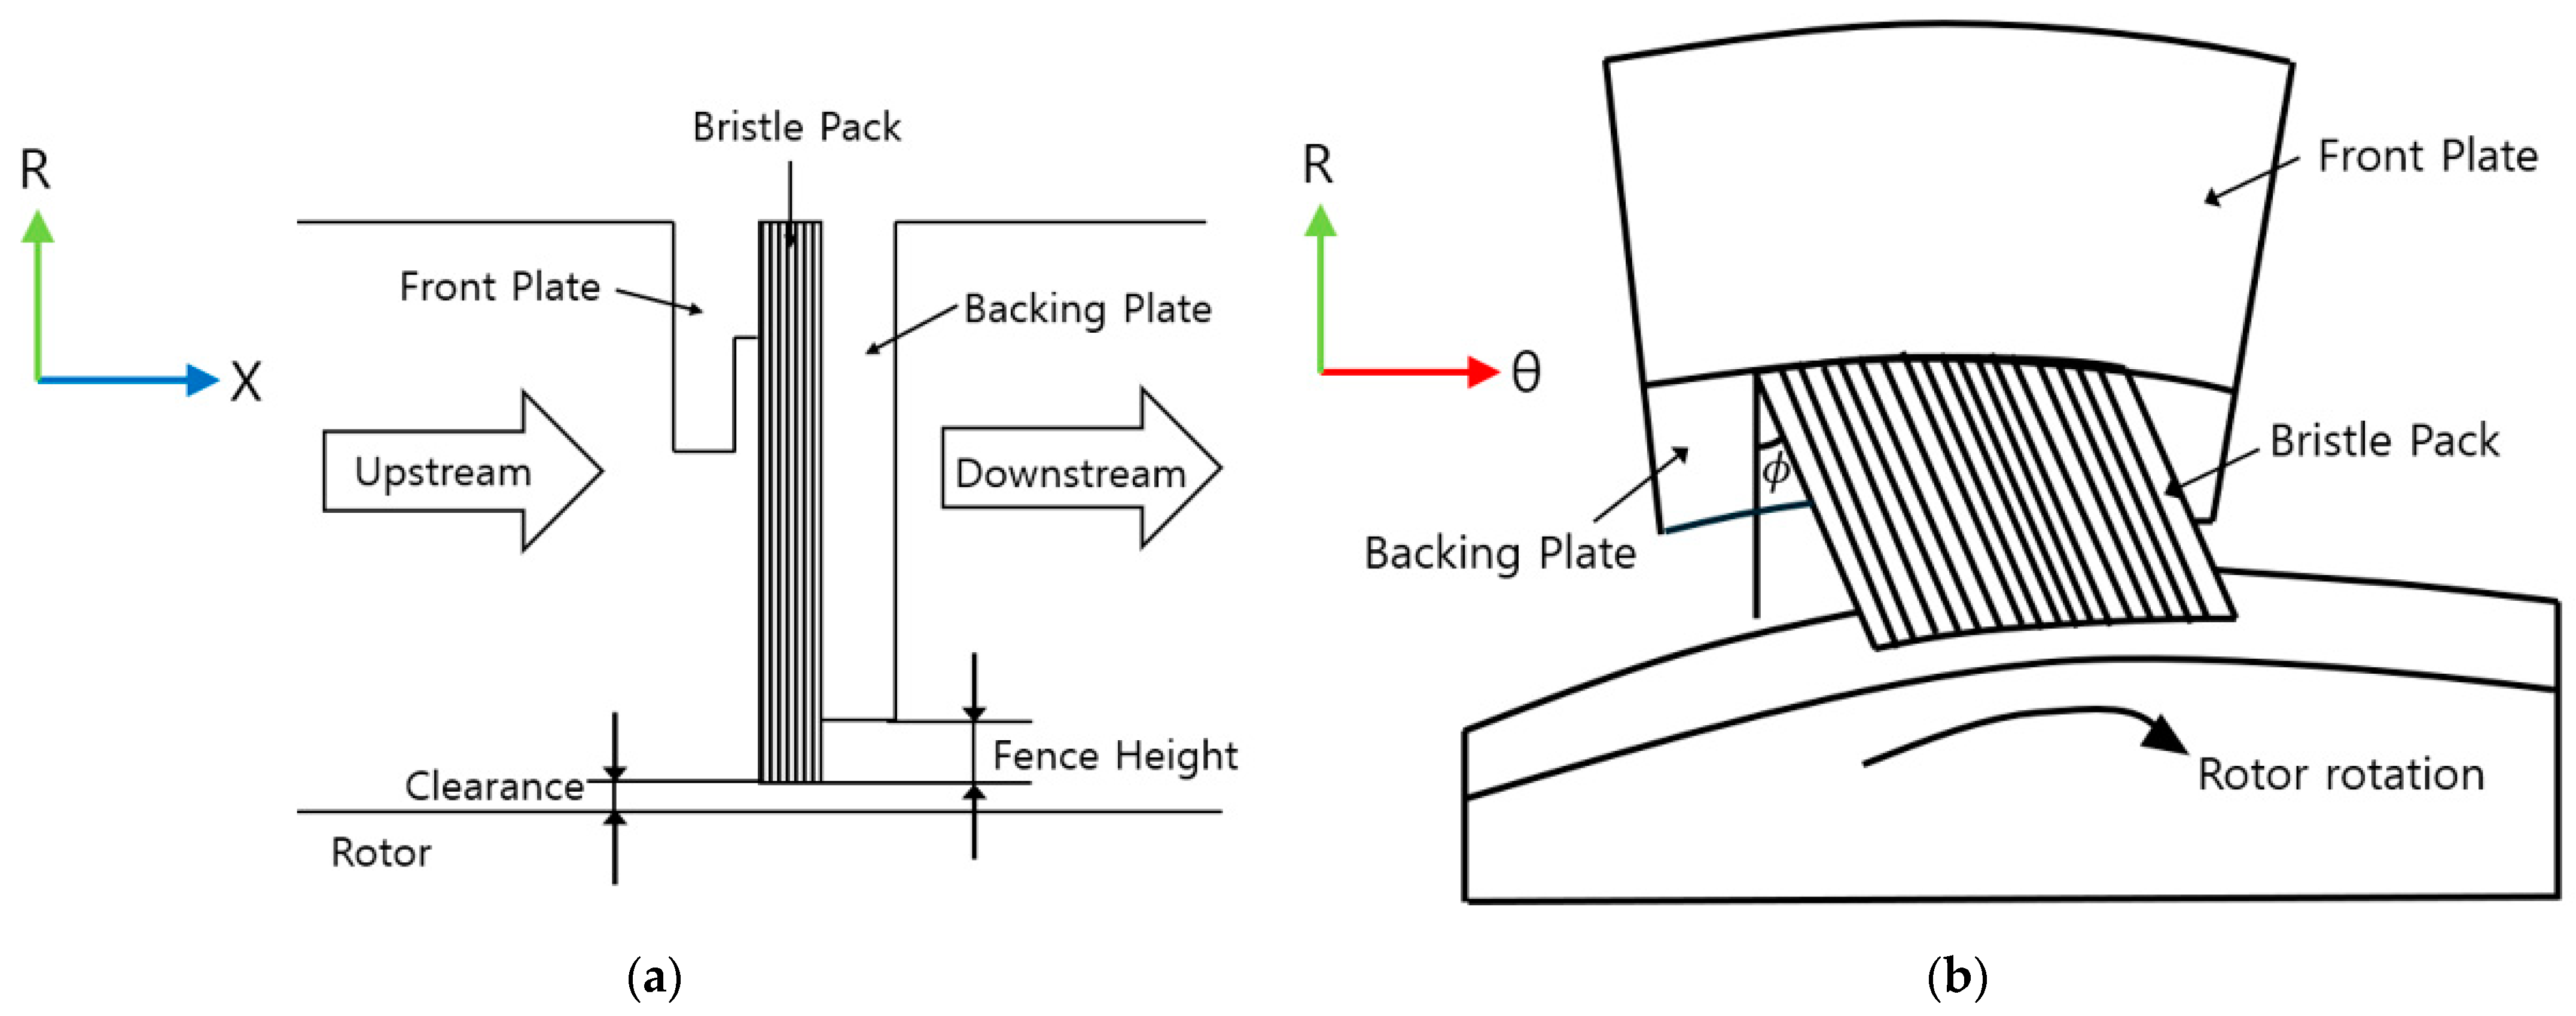
:1. Introduction
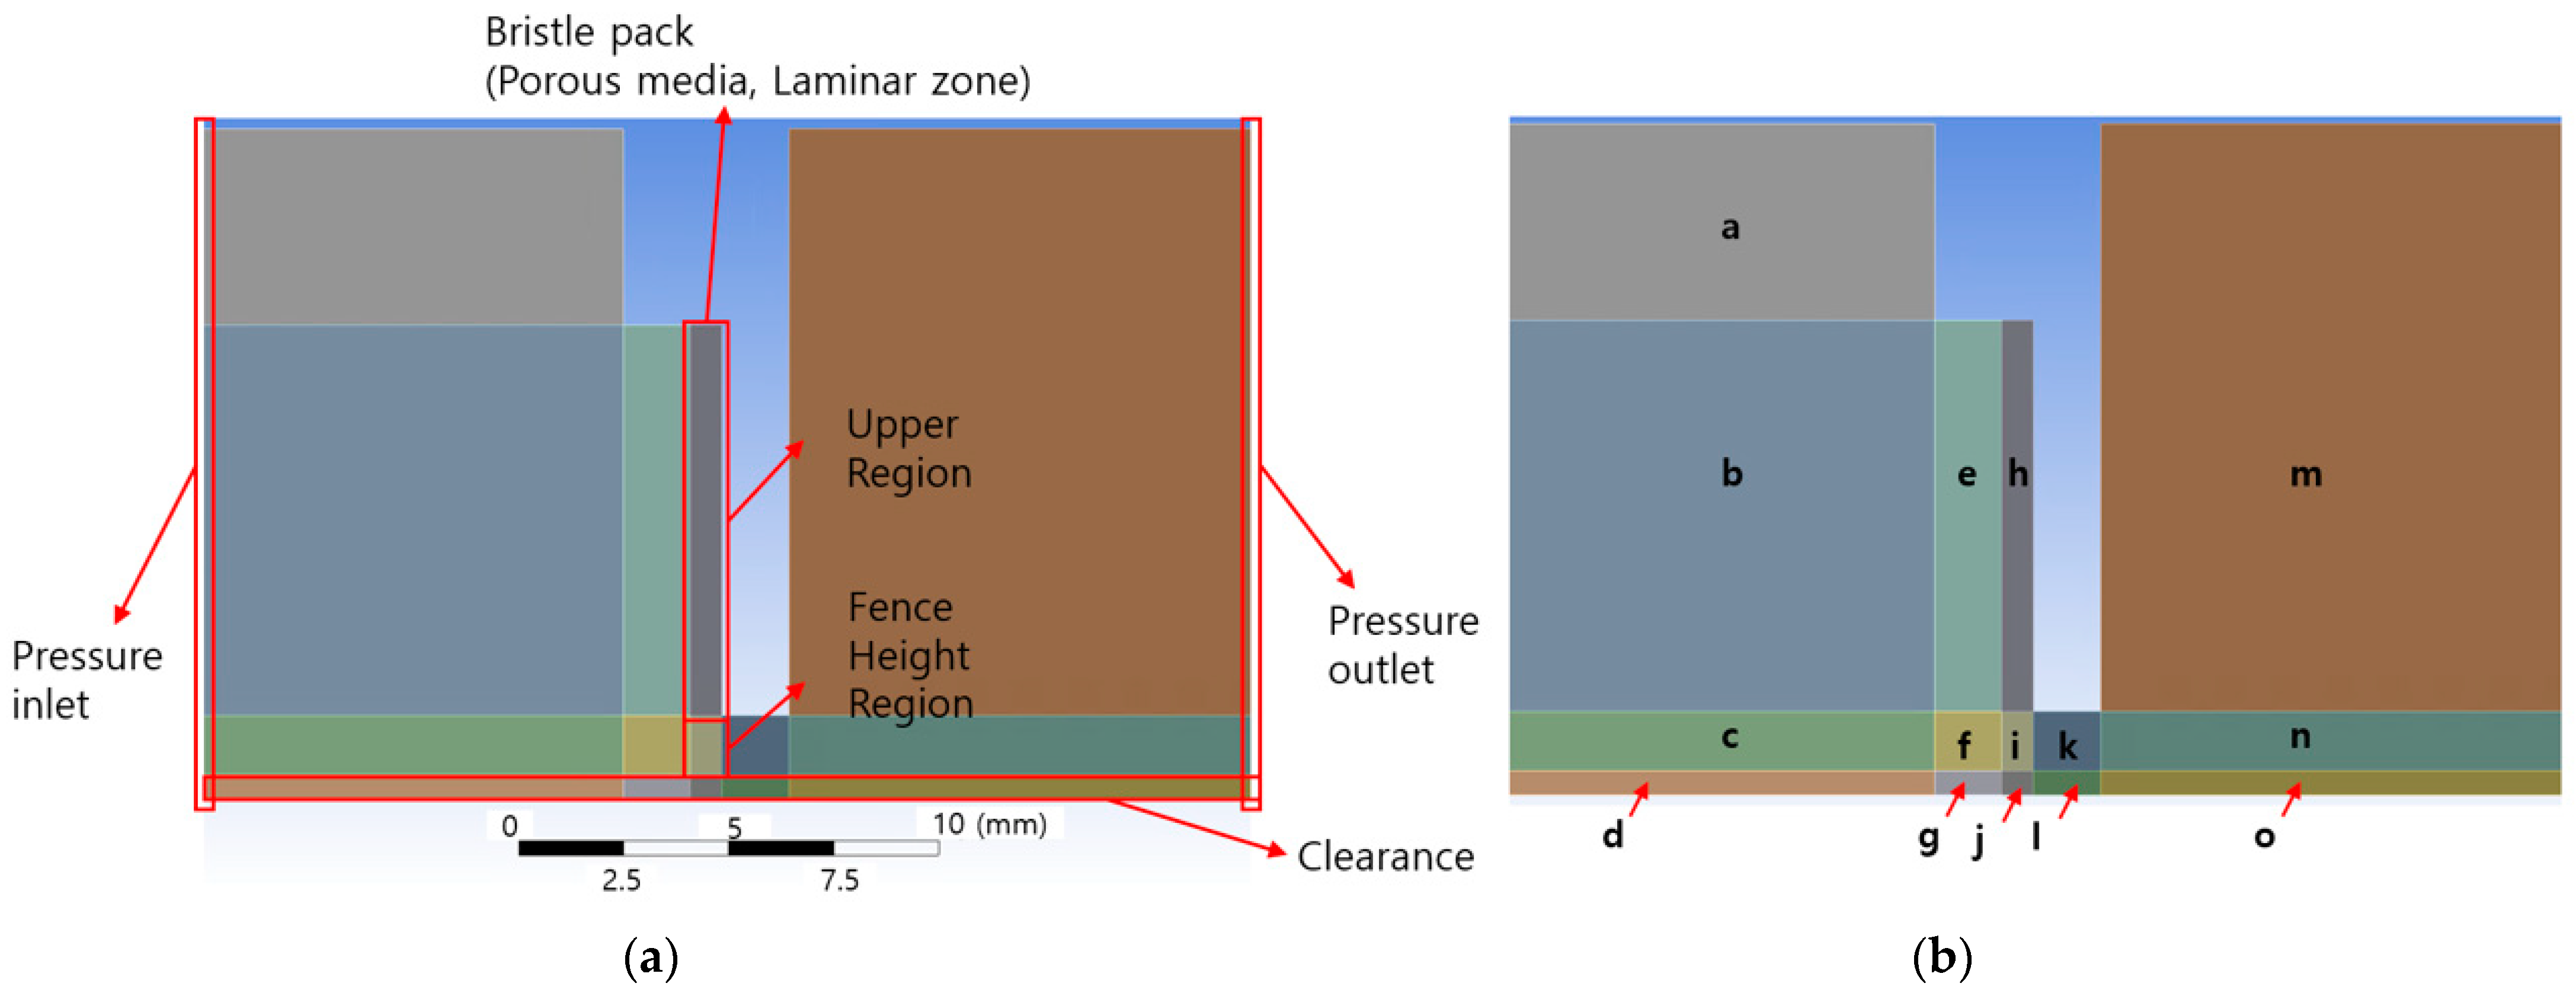
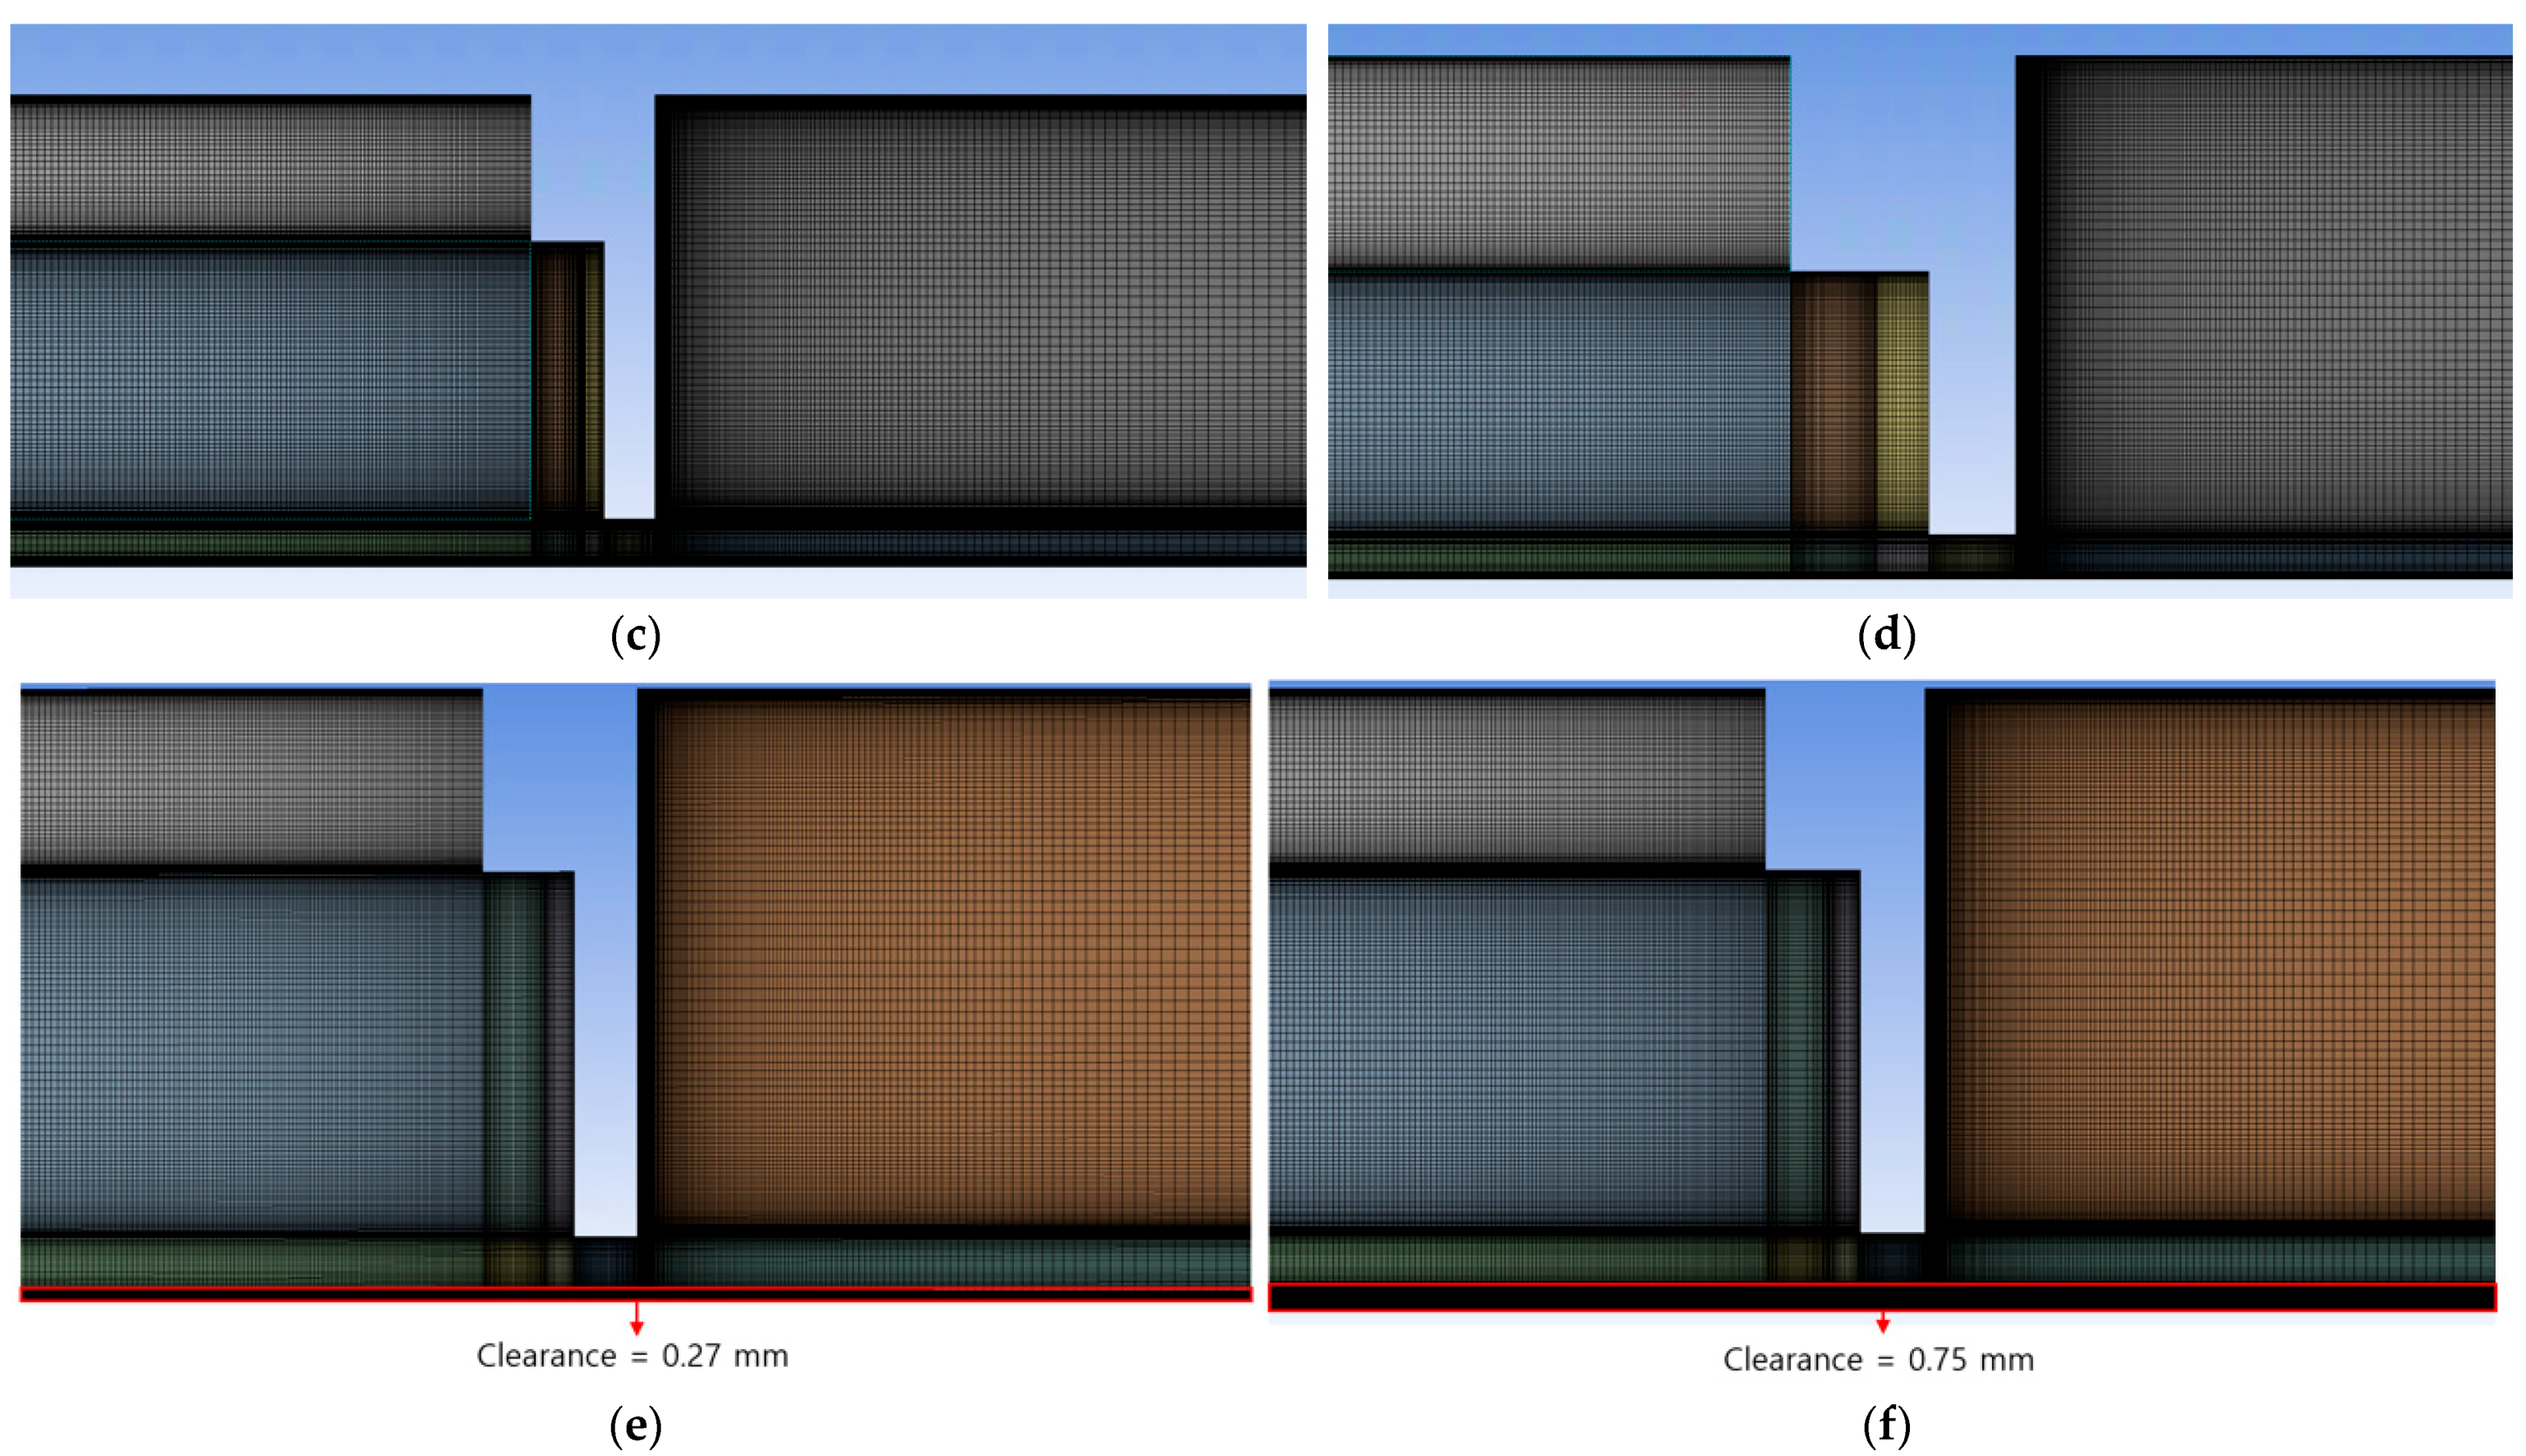
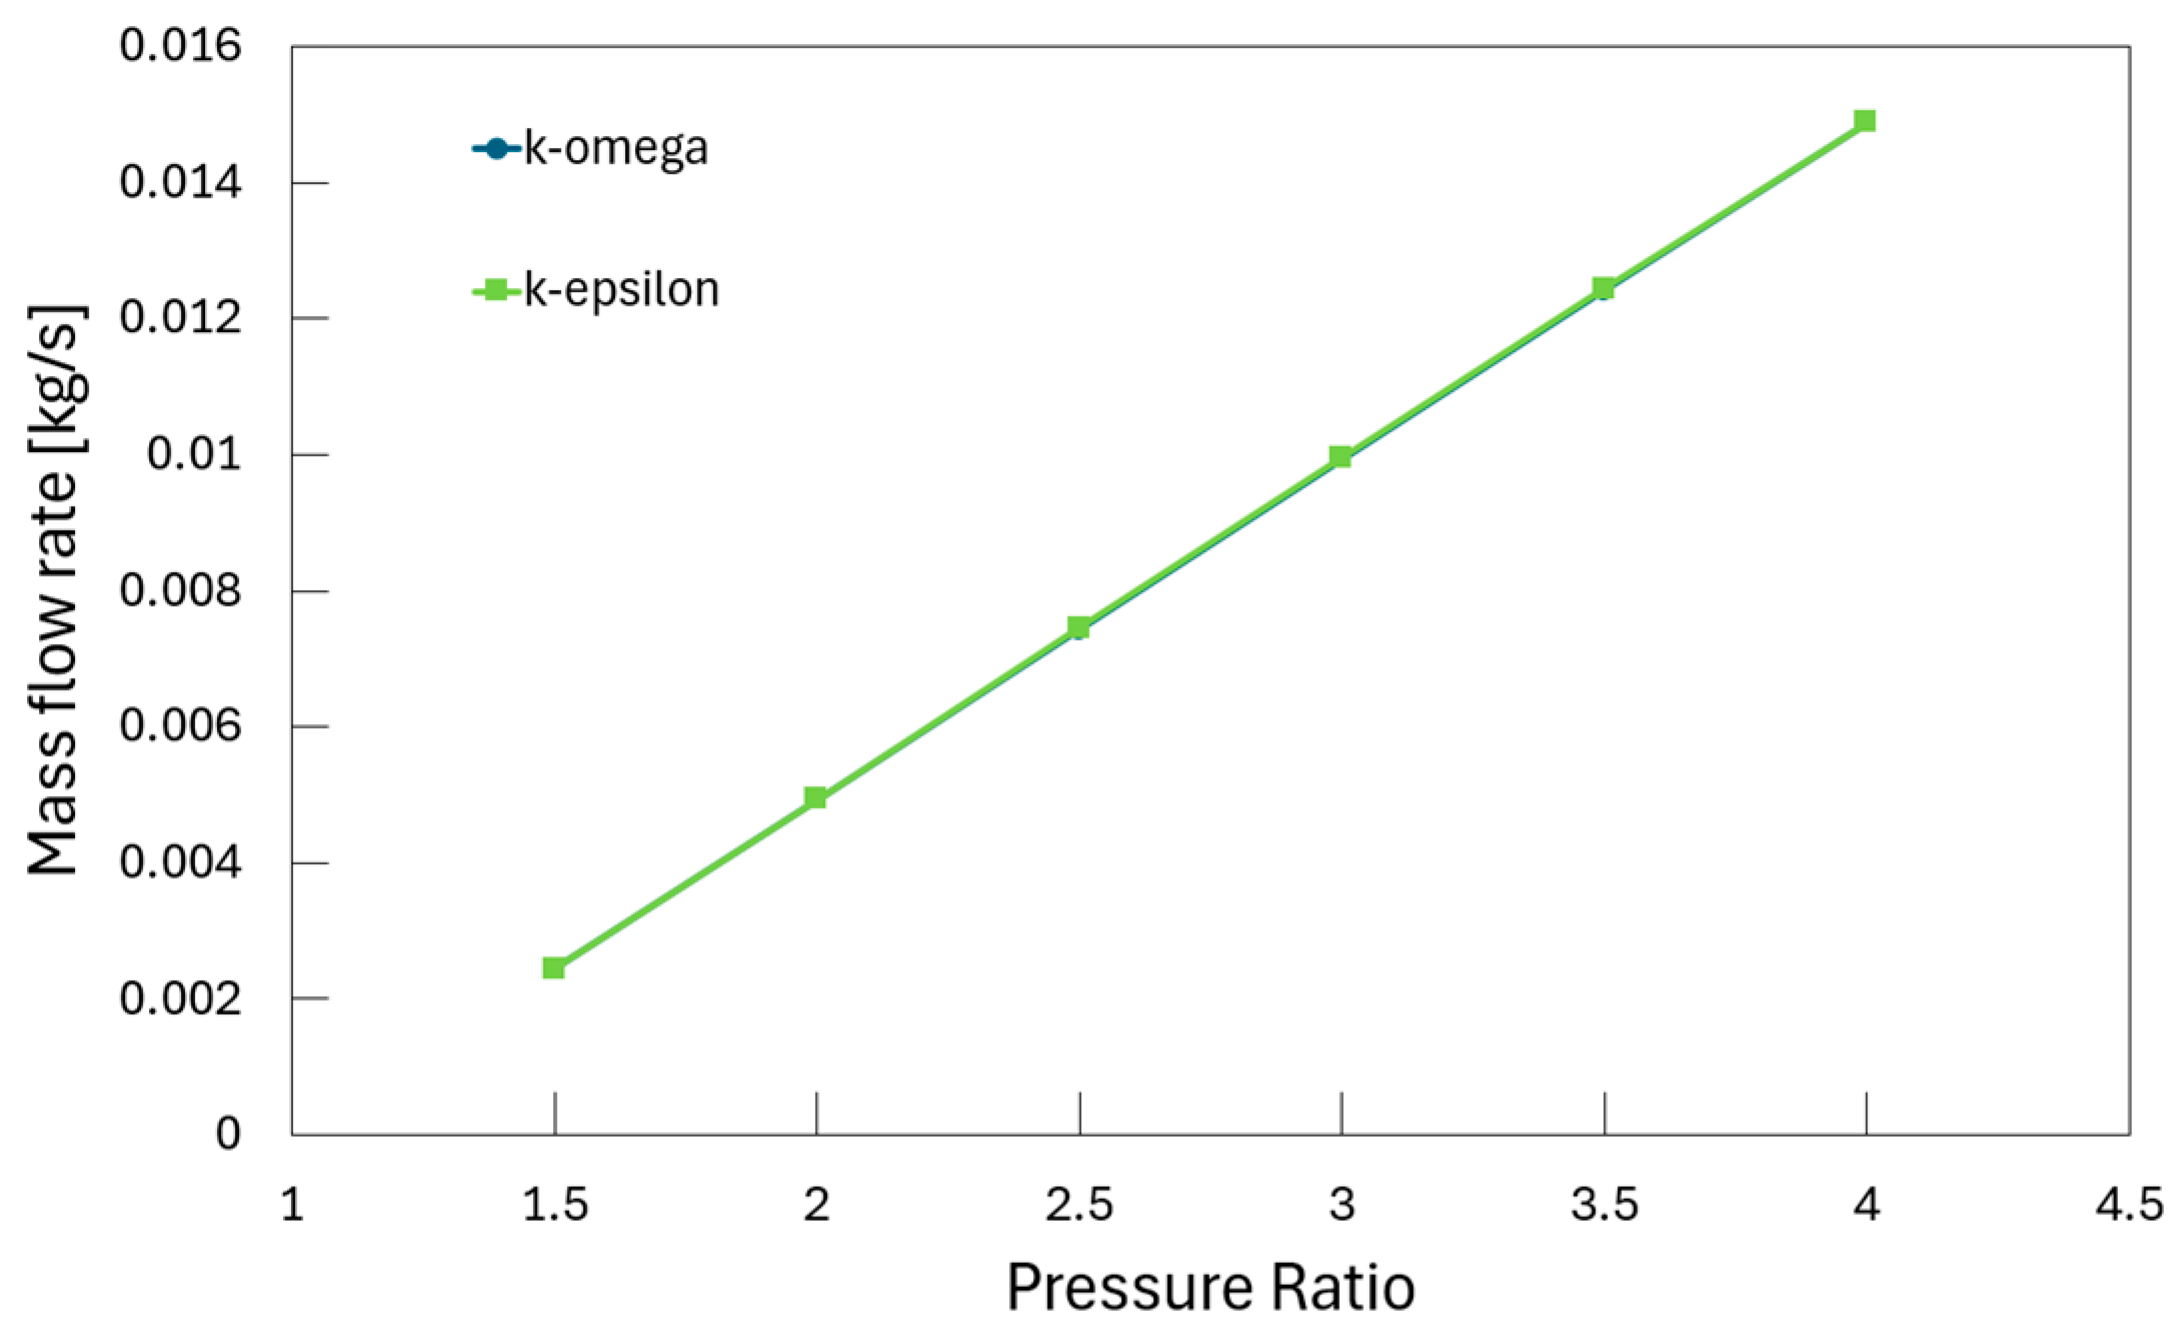
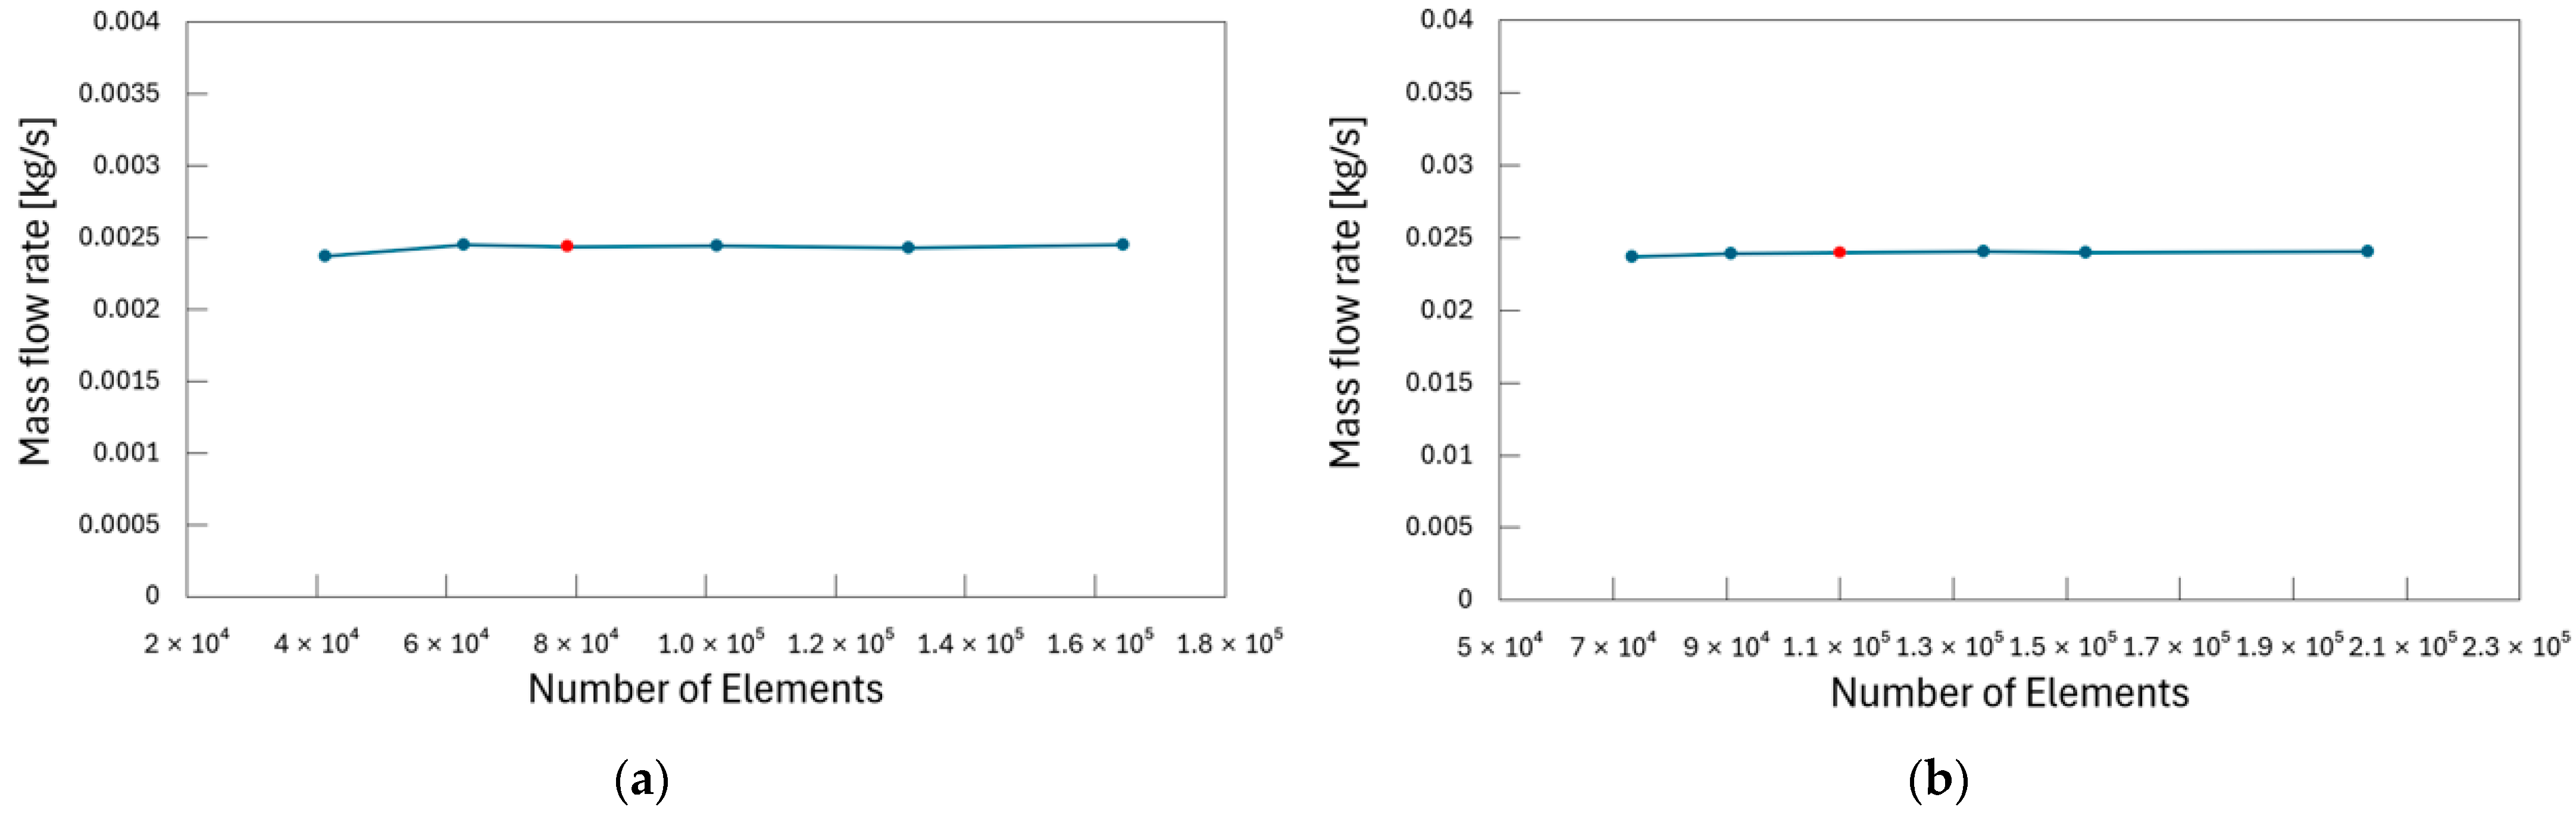
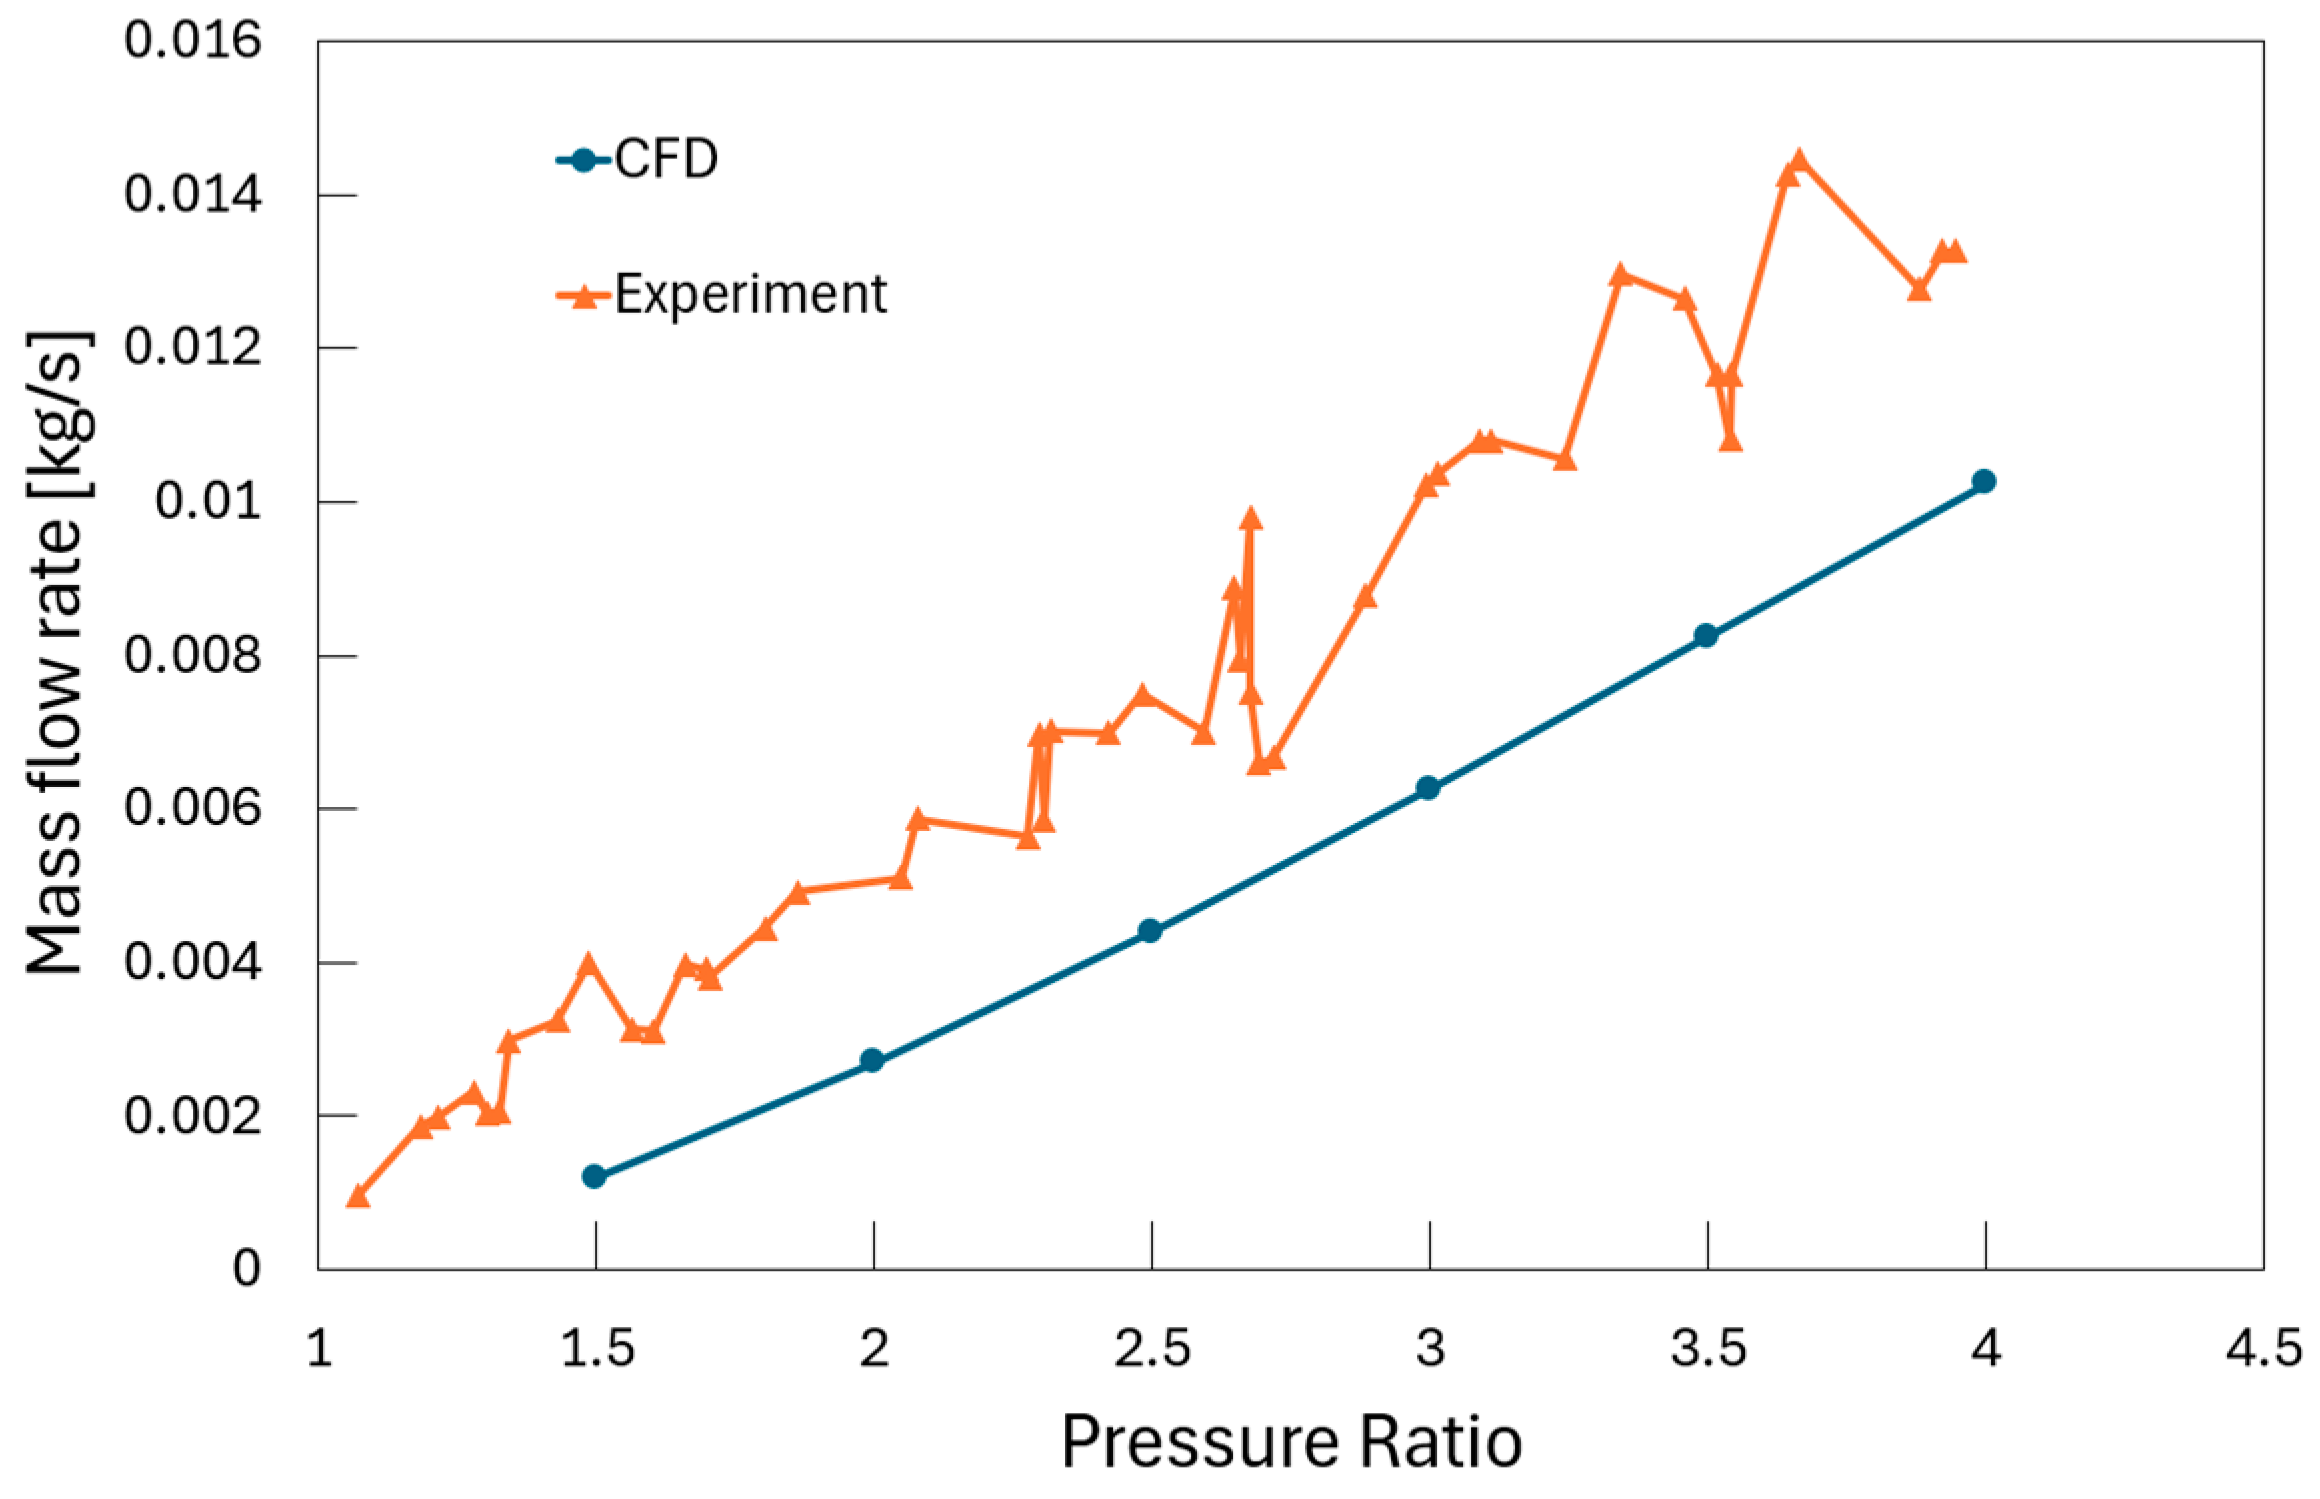
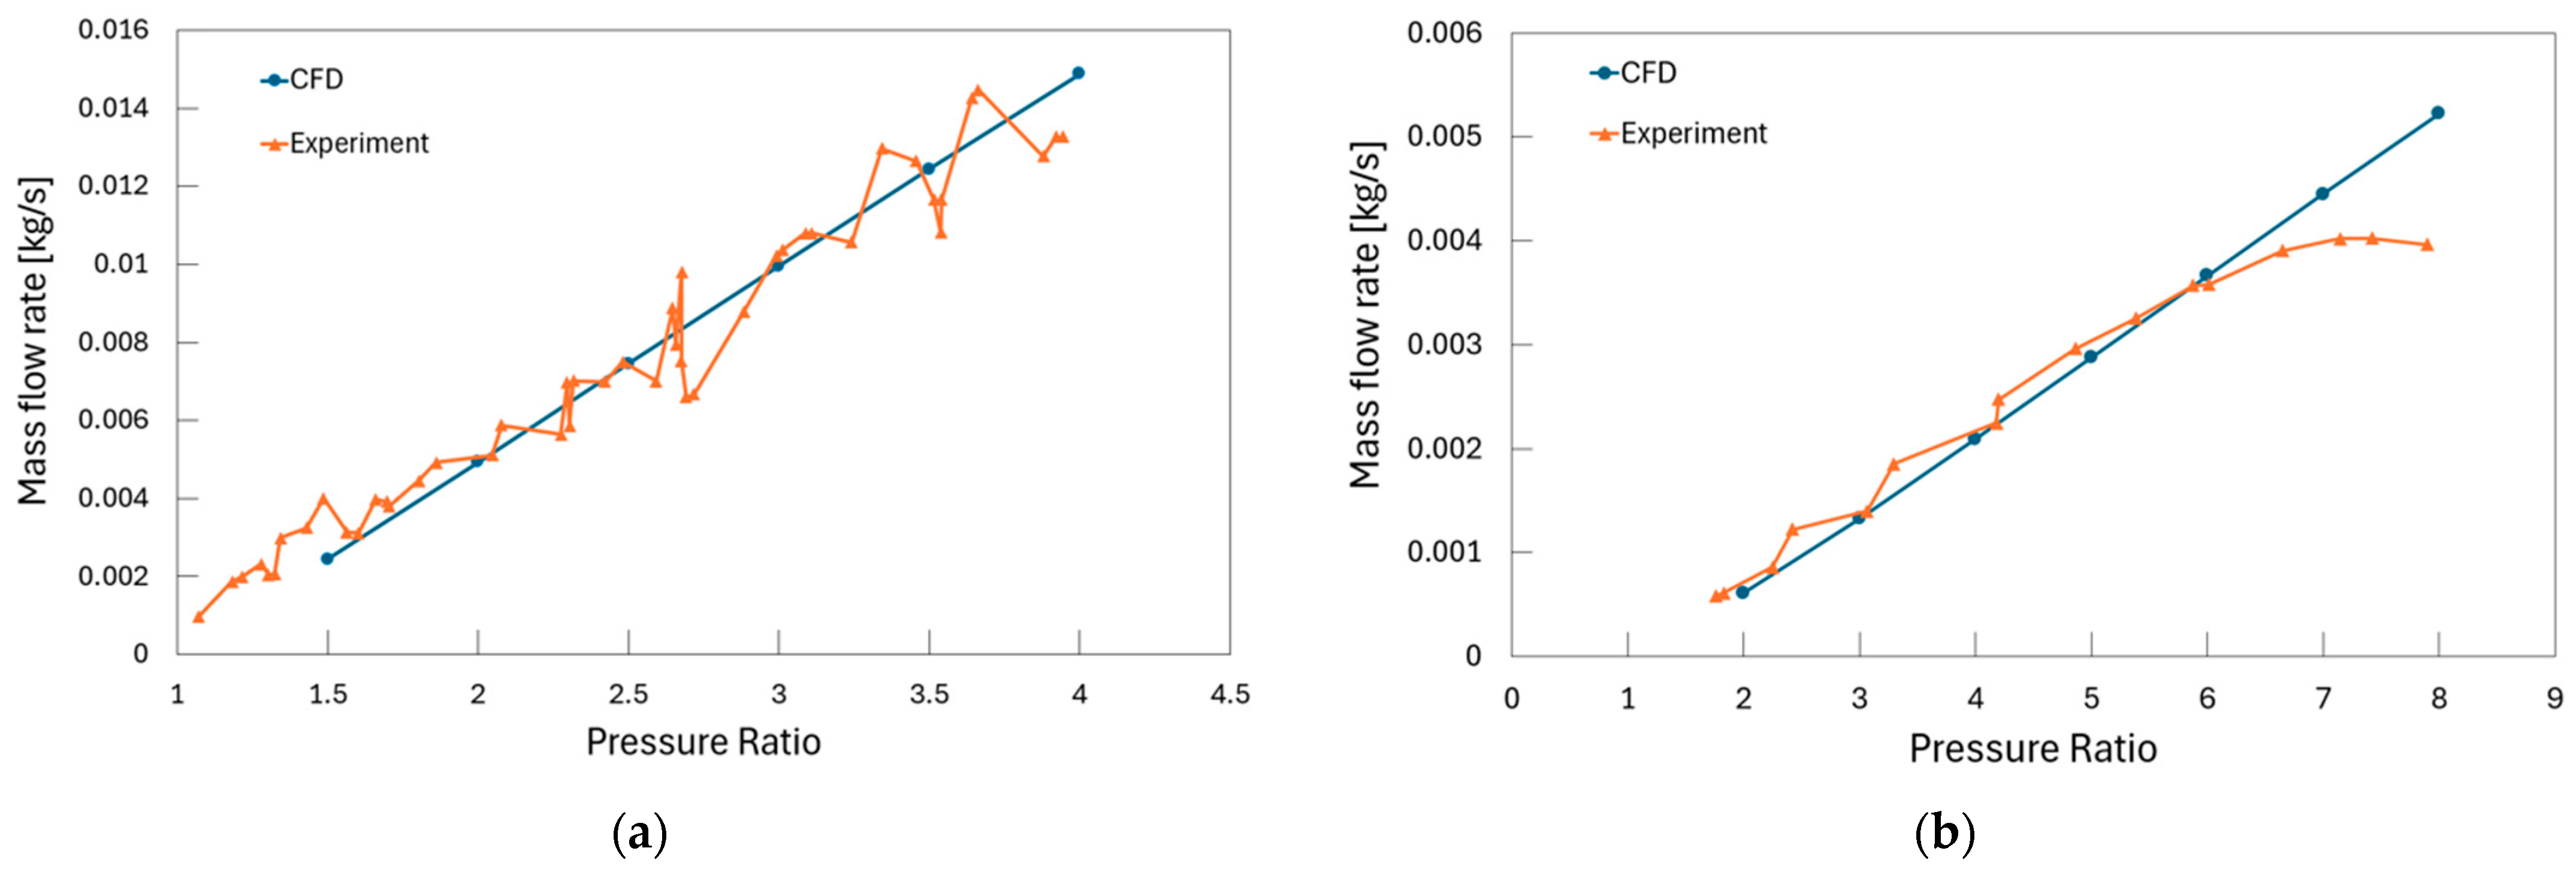
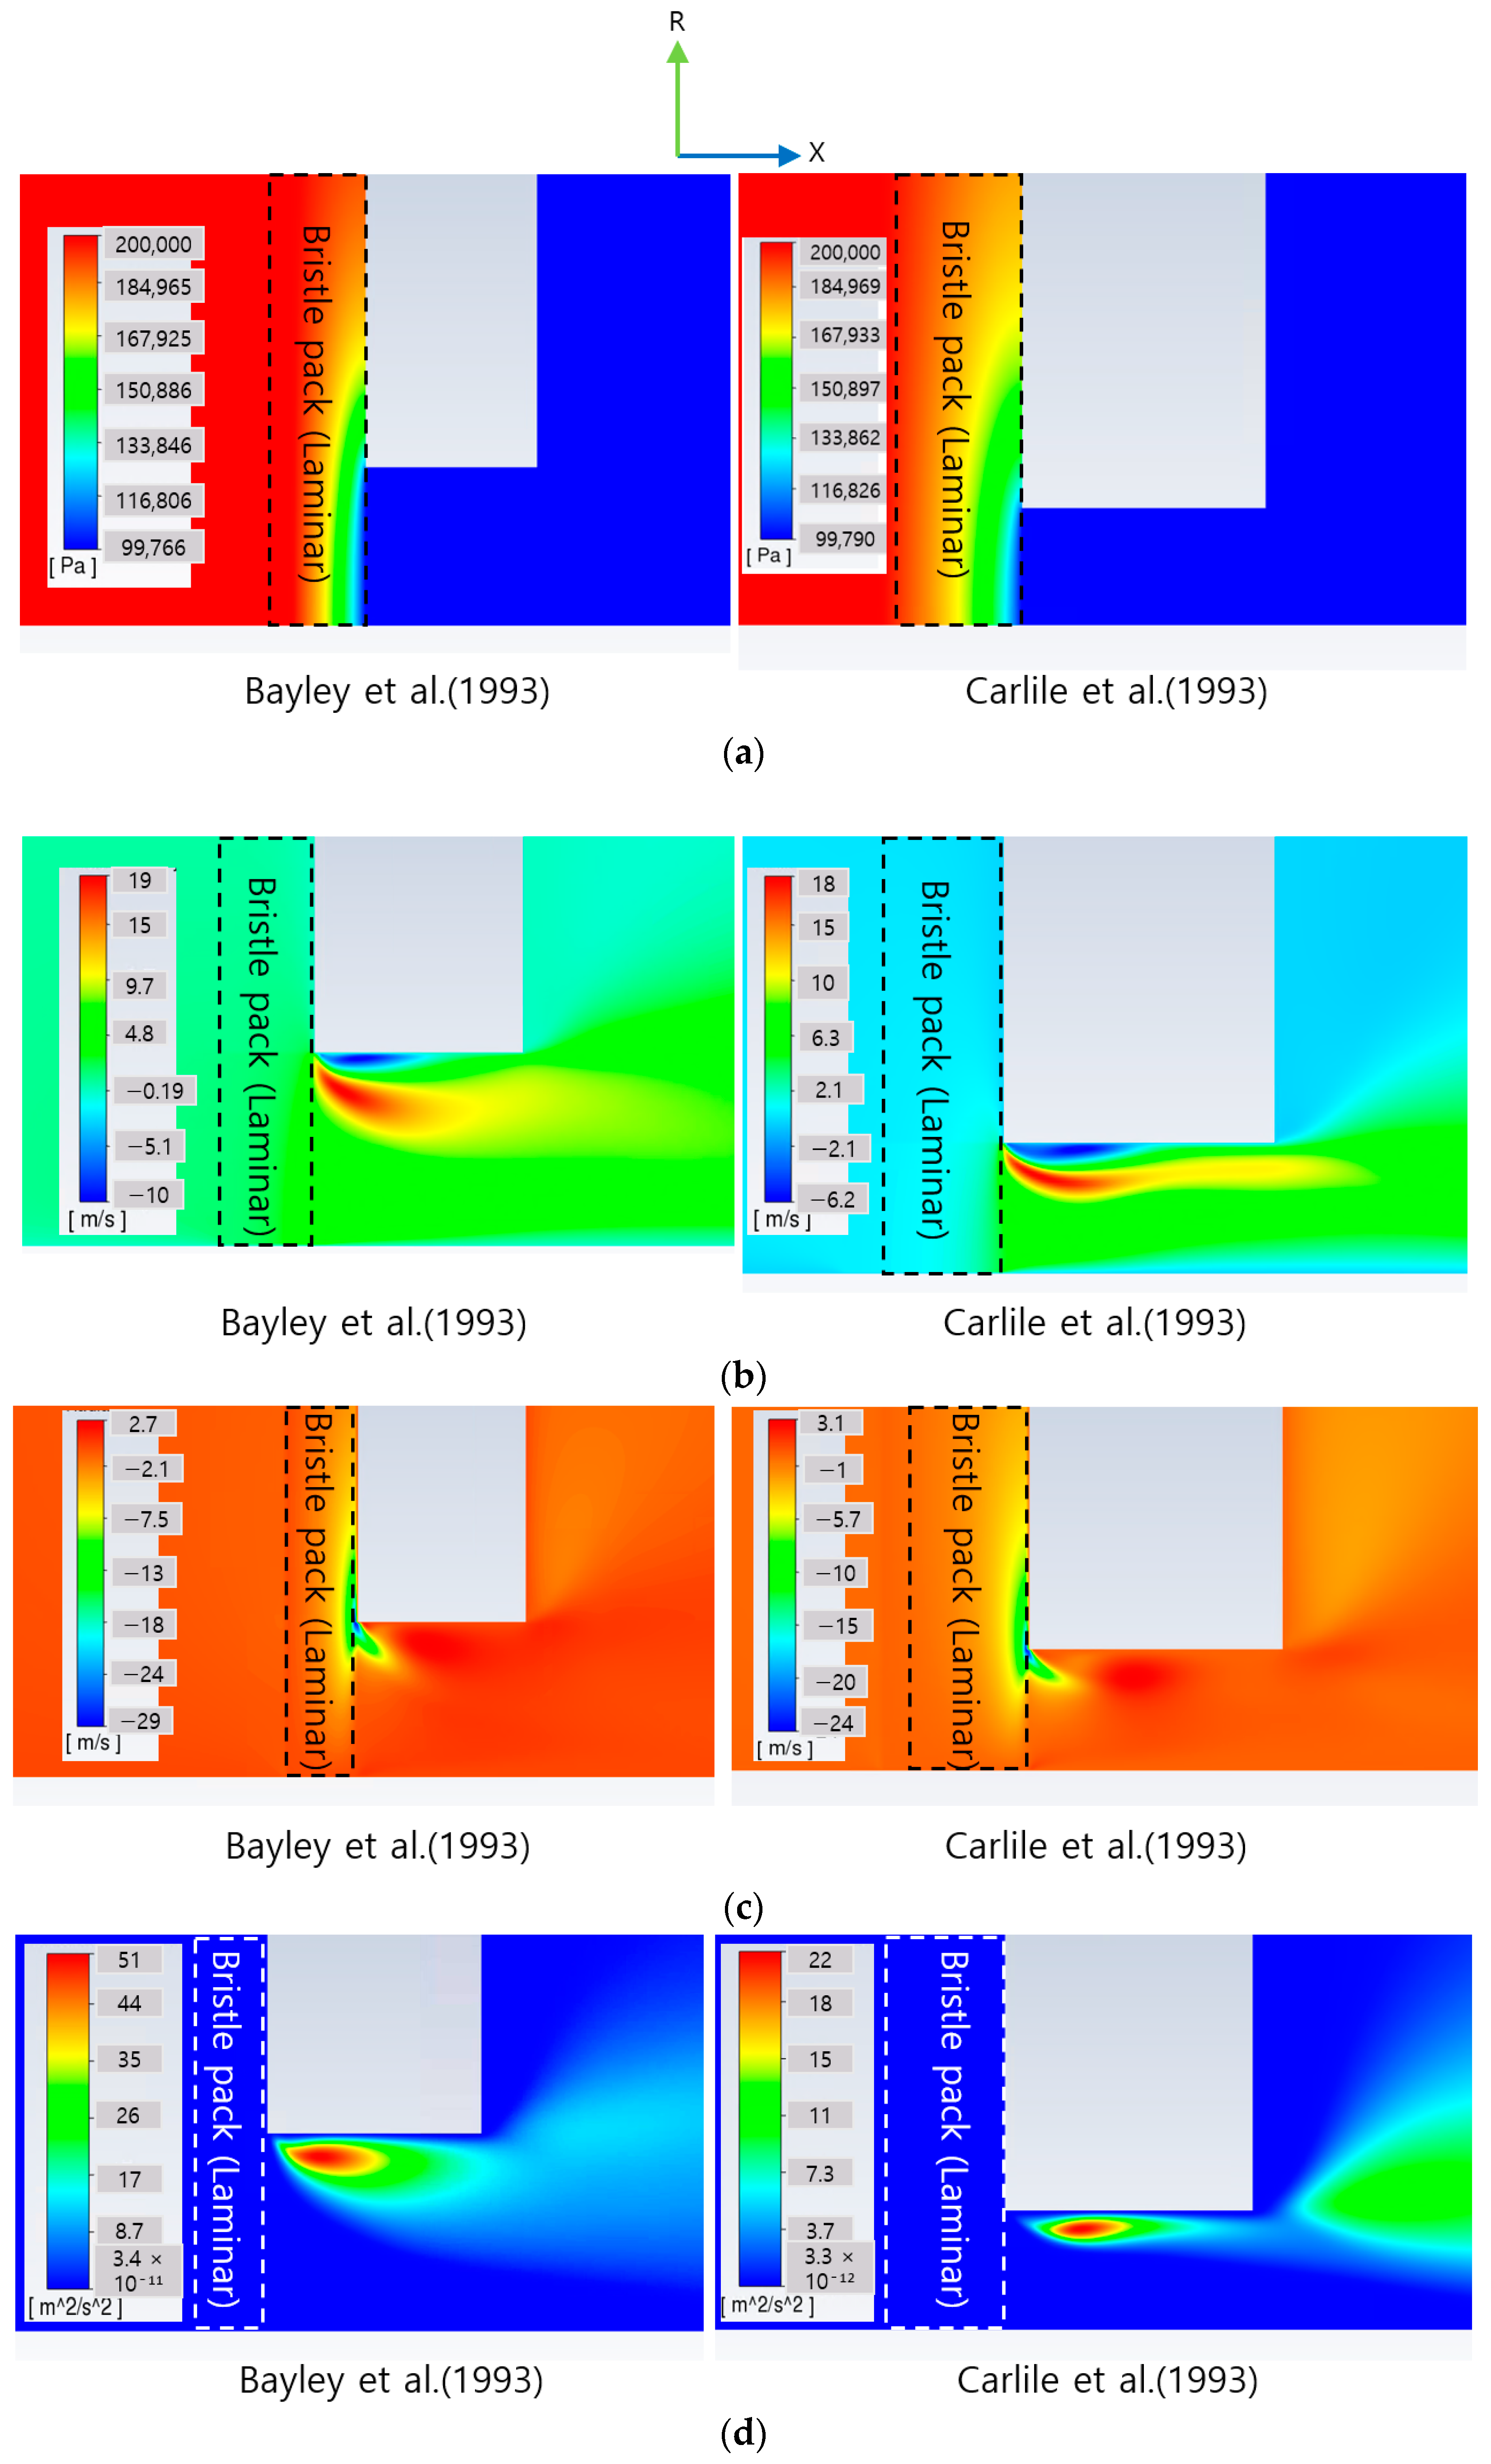
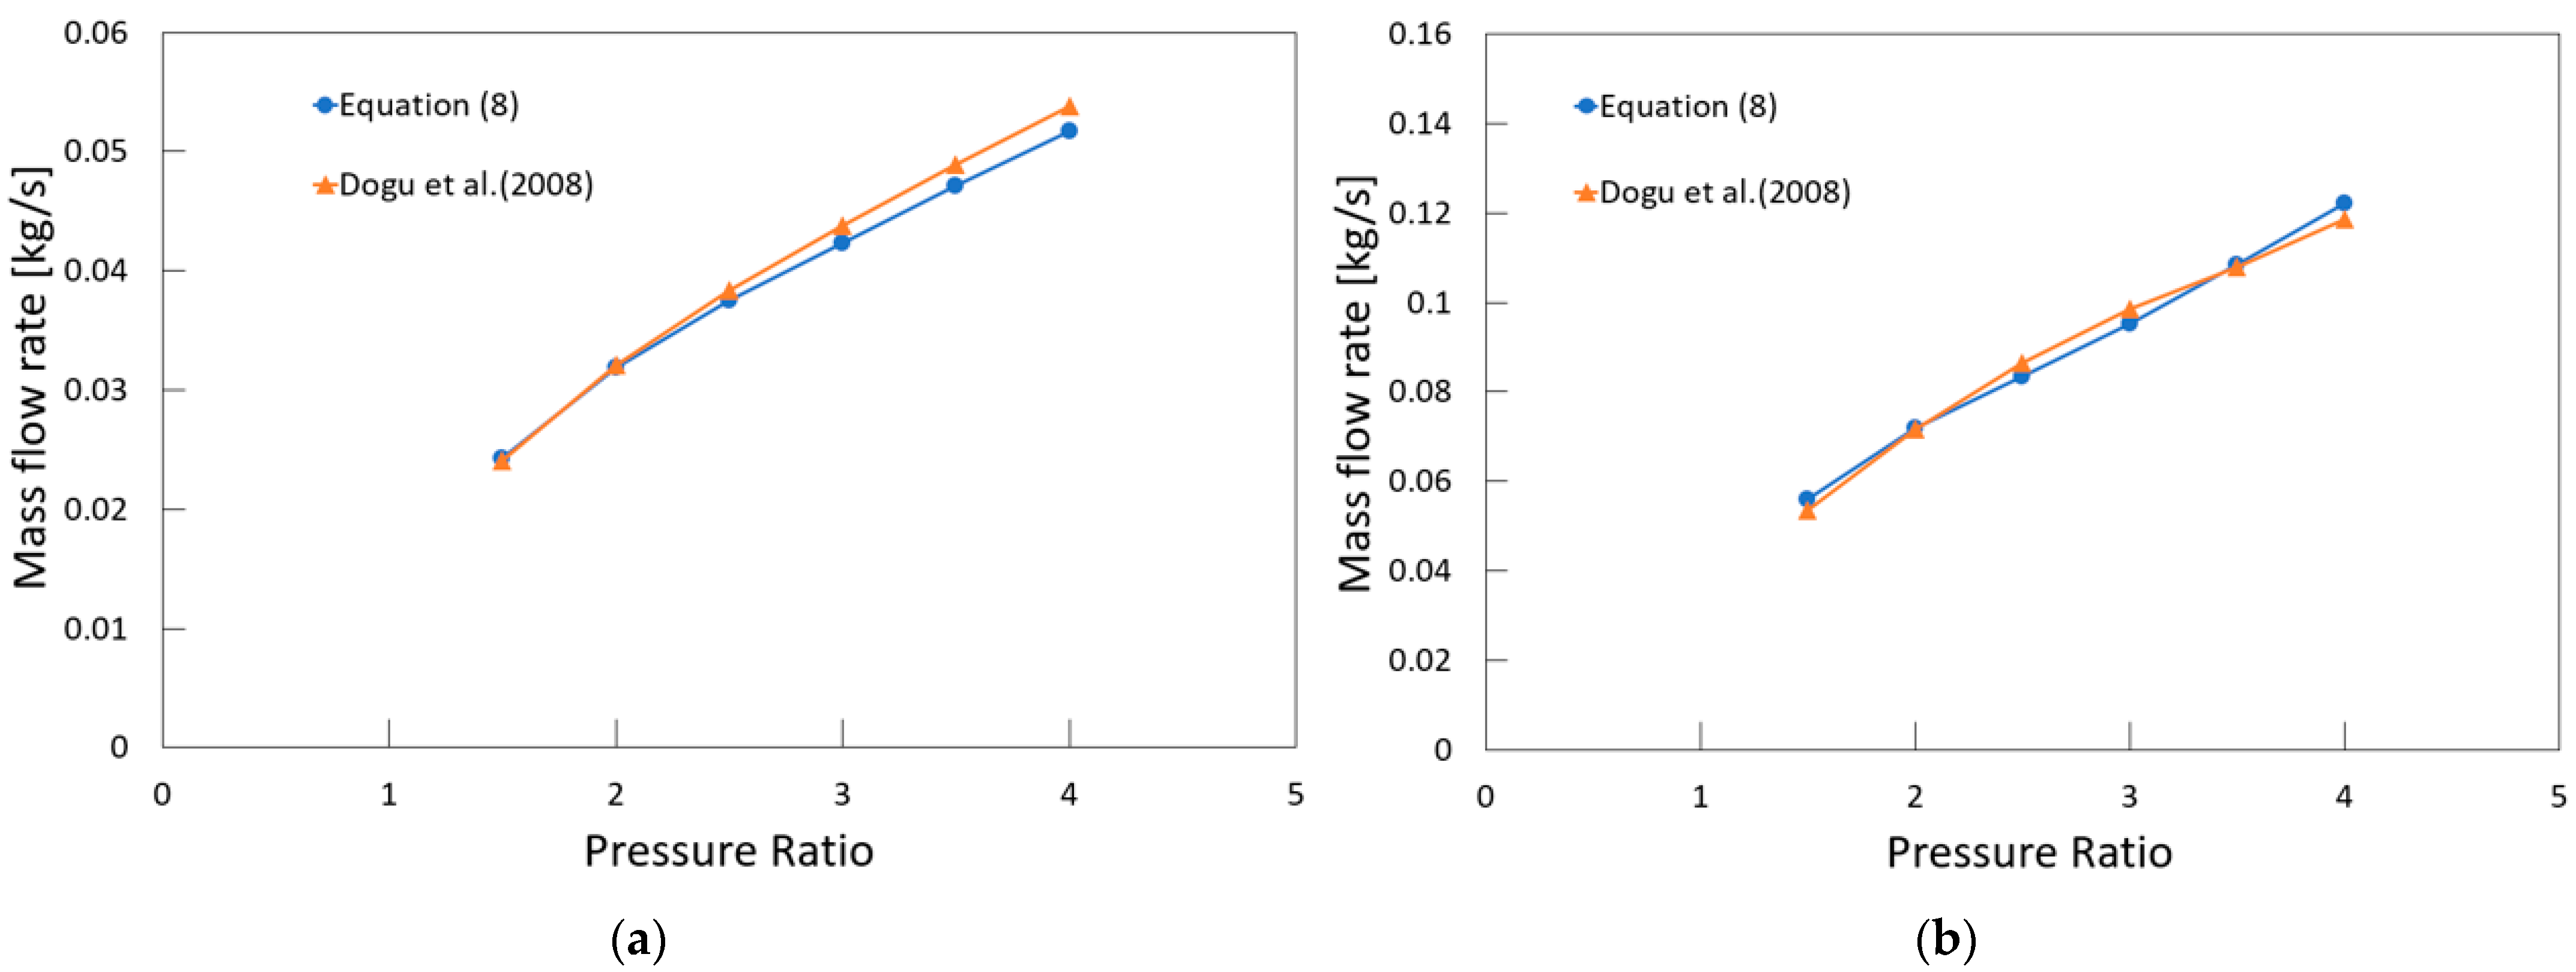
2. Numerical Method and Validation
3. Results and Discussion
3.1. Porosity Correction Factor
3.2. Simulation of Contact Brush Seal with Porosity Correction
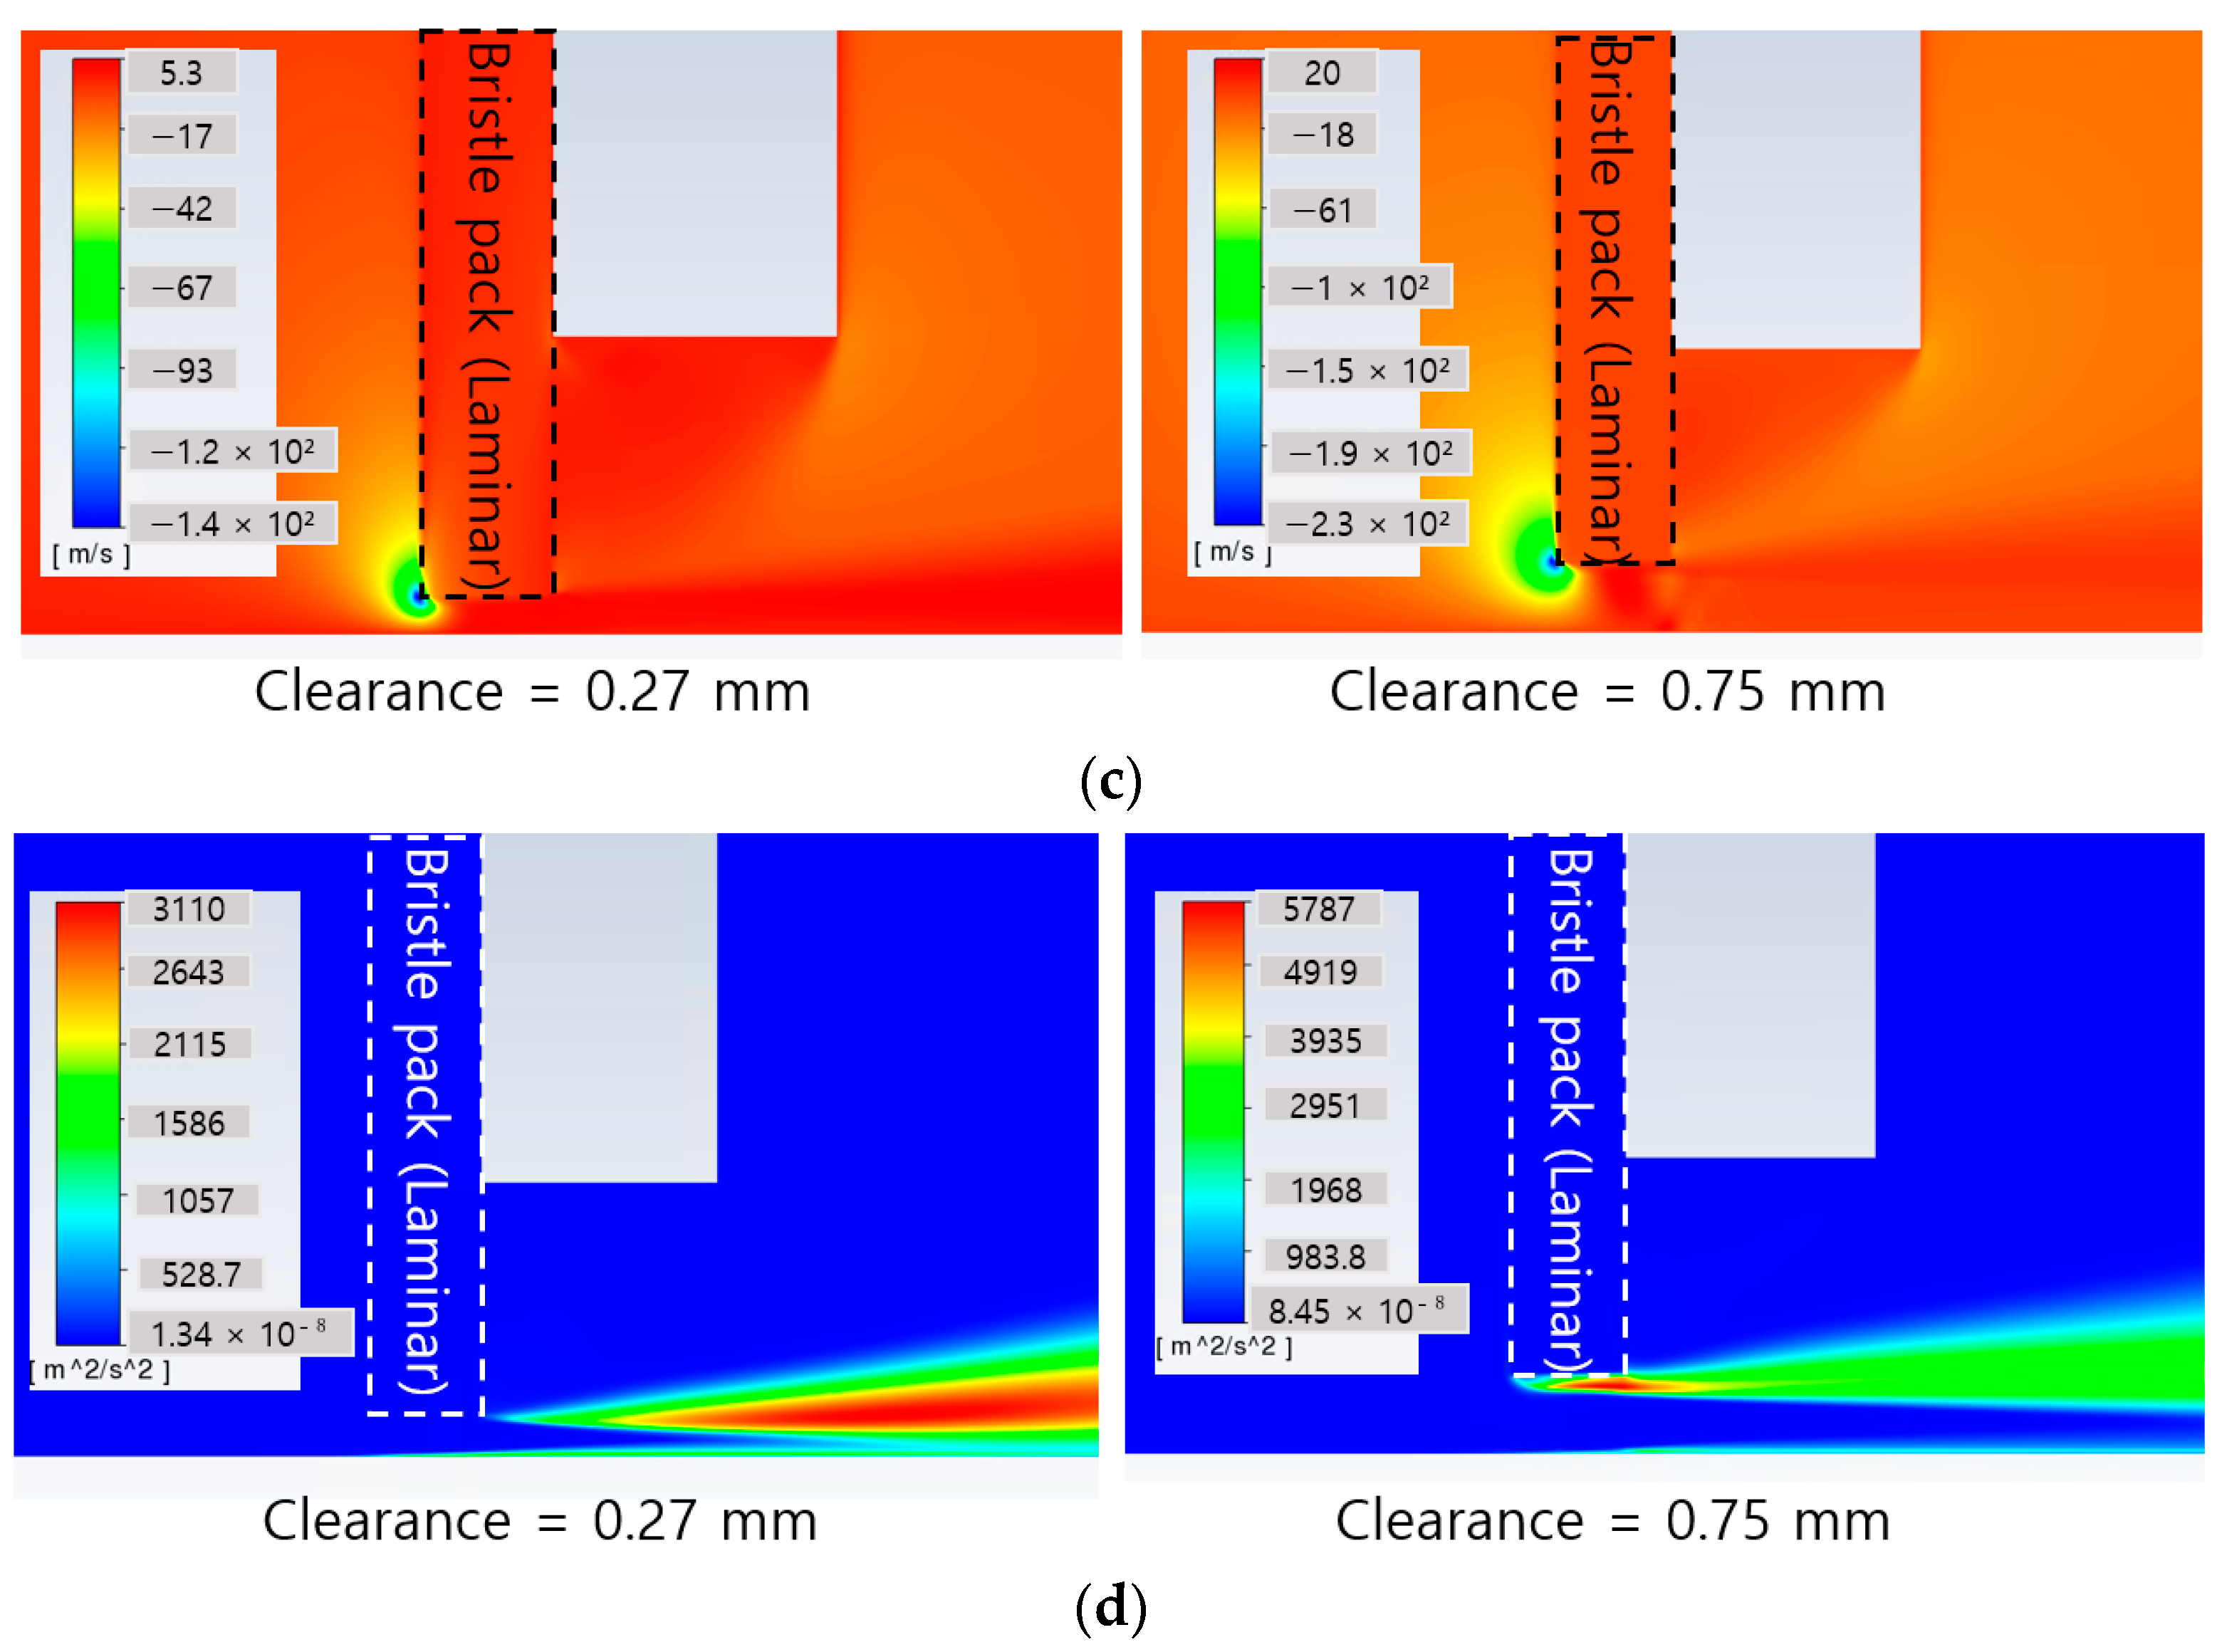
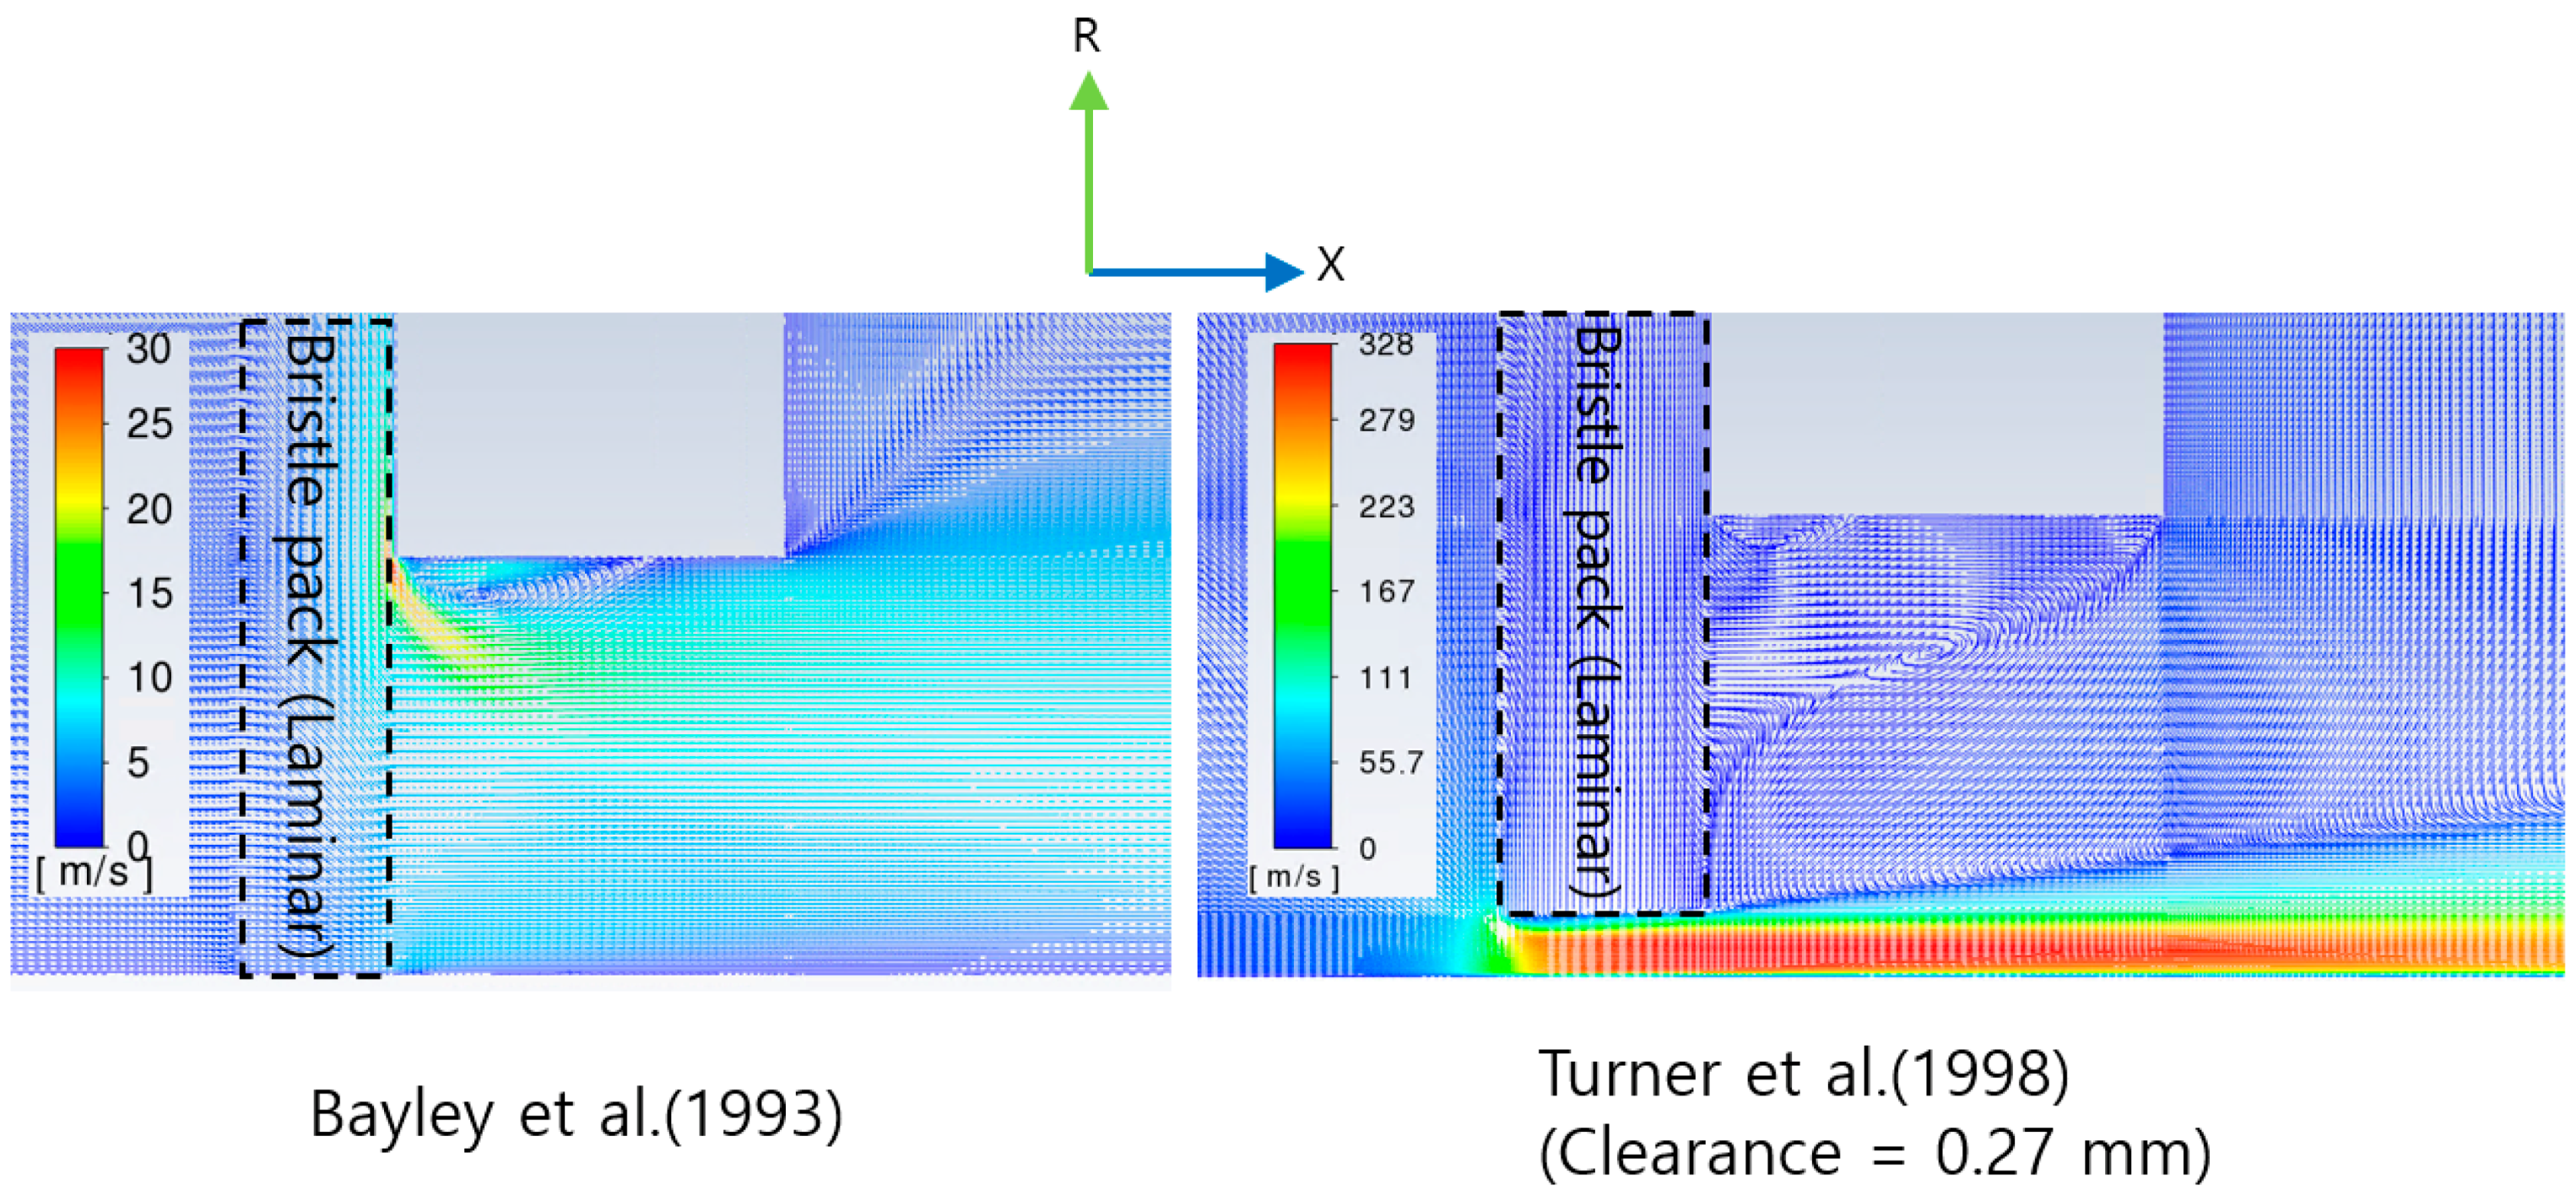
3.3. Simulation of Brush Seal with Clearance
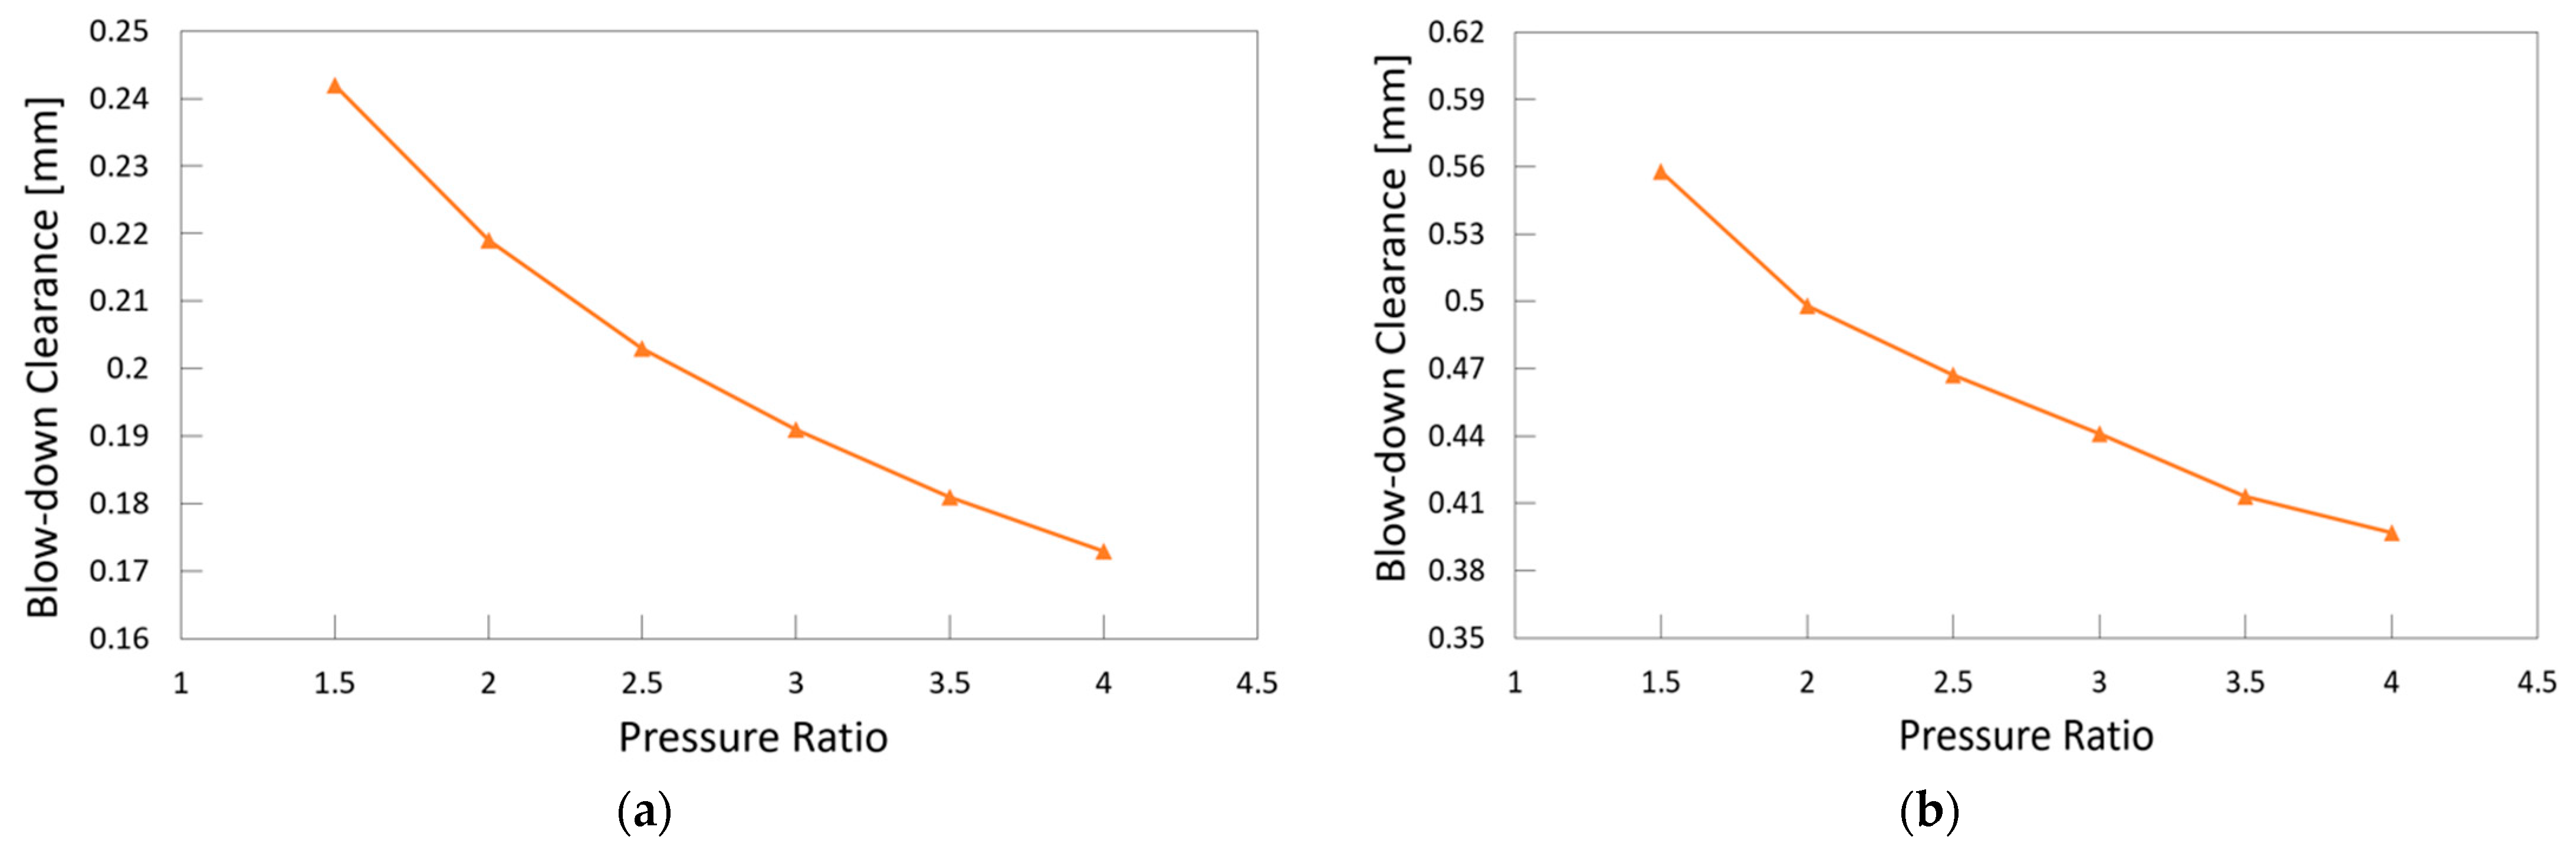
3.4. Blow-Down Prediction
4. Conclusions
Author Contributions
Funding
Institutional Review Board Statement
Informed Consent Statement
Data Availability Statement
Conflicts of Interest
Nomenclature
| Mass flow rate [kg/s] | |
| Velocity vector of the fluid [m/s] | |
| Differential area vector [m2] | |
| Bristle diameter [mm] | |
| Rotor diameter [m] | |
| Bristle pack thickness [mm] | |
| Viscous resistance constant [1/m2] | |
| Inertial resistance constant [1/m] | |
| Viscous resistance coefficient in the direction normal to the bristles [1/m2] | |
| Viscous resistance coefficient in the lengthwise direction of the bristles [1/m2] | |
| Inertial resistance coefficient in the direction normal to the bristles [1/m] | |
| Inertial resistance coefficient in the lengthwise direction of the bristles [1/m] | |
| Fence height [mm] | |
| Pressure ratio | |
| Clearance [mm] | |
| Bristle density [1/mm] | |
| Temperature [K] | |
| Flow function [s·K0.5/m] | |
| Pressure [kPa] | |
| Specific gas constant [J/kg·K] | |
| Effective clearance [mm] | |
| Fluid–structure interaction | |
| Axial co-ordinate | |
| Radial co-ordinate | |
| Greek Symbols | |
| Circumferential co-ordinate | |
| Isentropic coefficient | |
| Bristle Lay angle [°] | |
| Porosity | |
| Porosity correction factor | |
| Fluid density [kg/m3] | |
| Subscripts | |
| Upstream | |
| Downstream | |
References
- Boyce, M.P. Gas Turbine Engineering Handbook; Elsevier: Amsterdam, The Netherlands, 2011. [Google Scholar]
- Goldstein, R.J.; Eckert, E.R.G.; Ramsey, J.W. Film cooling with injection through Holes: Adiabatic wall temperatures down-394 stream of a circular hole. J. Eng. Power 1968, 90, 384–393. [Google Scholar] [CrossRef]
- Ahn, J.; Song, J.C.; Lee, J.S. Fully coupled large eddy simulation of conjugate heat transfer in a ribbed channel with a 0.1 blockage ratio. Energies 2021, 14, 2096. [Google Scholar] [CrossRef]
- Pugachev, A.O.; Michael, D. Experimental and theoretical rotordynamic stiffness coefficients for a three-stage brush seal. Mech. Syst. Signal Process. 2012, 31, 143–154. [Google Scholar] [CrossRef]
- Dogu, Y. Investigation of brush seal flow characteristics using bulk porous medium approach. J. Eng. Gas Turbines Power 2005, 127, 136–144. [Google Scholar] [CrossRef]
- Yue, C.; Bitian, S.; Lanzhu, Z. Leakage performance predictions of a brush seal based on fluid–solid coupling method. Sci. Prog. 2020, 103, 1–17. [Google Scholar] [CrossRef] [PubMed]
- Chupp, R.E.; Hendricks, R.C.; Lattime, S.B.; Steinetz, B.M.; Aksit, M.F. Turbomachinery clearance control. In Turbine Aerodynamics, Heat Transfer, Materials, and Mechanics; American Institute of Aeronautics and Astronautics, Inc.: Reston, VA, USA, 2014; pp. 61–188. [Google Scholar]
- Schwarz, H.; Friedrichs, J.; Flegler, J. Axial inclination of the bristle pack, a new design parameter of brush seals for improved operational behavior in Steam turbines. Turbo Expo Power Land Sea Air 2014, 1B, V01BT27A036. [Google Scholar]
- Bowsher, A.; Crudgington, P.; Kirk, T.; Chupp, R. Aspects of Brush Seal Design. In Proceedings of the 51st AIAA/SAE/ASEE Joint Propulsion Conference, Orlando, FL, USA, 27–29 July 2015; p. 4230. [Google Scholar]
- Mehta, J.; Holloway, G.; Rosado, L.; Doak, D.; Hubley, C.; Askew, J.; Krawiecki, S. Innovative Rotating Intershaft Brush Seal for Sealing between Rotating Shafts Part II: Modeling of the Brush Seal Leakage Flows. In Proceedings of the 42nd AIAA/ASME/SAE/ASEE Joint Propulsion Conference & Exhibit, Sacramento, CA, USA, 9–12 July 2006; p. 4752. [Google Scholar]
- Liu, Y.; Dong, W.; Chew, J.; Pekris, M.; Yue, B.; Kong, X. Flow conditioning to control the effects of inlet swirl on brush seal performance in gas turbine engines. Front. Energy Res. 2022, 9, 815152. [Google Scholar] [CrossRef]
- Neef, M.; Sulda, E.; Sürken, N.; Walkenhorst, J. Design features and performance details of brush seals for turbine applications. Turbo Expo Power Land Sea Air 2006, 4238, 1385–1392. [Google Scholar]
- Pekris, M.J.; Gervas, F.; David, R.G. An investigation of flow, mechanical, and thermal performance of conventional and pressure-balanced brush seals. J. Eng. Gas Turbines Power 2014, 136, 062502. [Google Scholar] [CrossRef]
- Wei, Y.; Ran, X.; Xiong, B.; Liu, S. Influence of brush seal hysteresis effect on the nonlinear characteristics of rotor system. Commun. Nonlinear Sci. Numer. Simul. 2023, 121, 107239. [Google Scholar] [CrossRef]
- Cieślewicz, S.M. CFD-Simulations for Advanced Turbomachinery Sealing Technologies: Brush Seals; Vienna University of Technology: Vienna, Austria, 2004. [Google Scholar]
- Dogu, Y.; Sertcakan, M.C.; Gezer, K.; Kocagul, M. Flow resistance coefficients of porous brush seal as a function of pressure load. J. Eng. Gas Turbines Power 2018, 140, 082504. [Google Scholar] [CrossRef]
- Song, X.; Liu, M.; Yang, J. Numerical analysis of leakage performance of brush seal based on a 2-d tube bank model and porous medium model considering the effect of compressible gas. Int. J. Fluid Mach. Syst. 2022, 15, 329–343. [Google Scholar] [CrossRef]
- Hu, Y.; Chen, W.; Li, P.; Li, N.; Zhou, K.; Pan, J. Experimental investigation on the influence of bristle lay angle on the leakage characteristics of low hysteresis brush seals. AIP Adv. 2021, 11, 085012. [Google Scholar] [CrossRef]
- Ahmed, A.A.M.; Liu, M.; Kang, Y.; Wang, J.; Idriss, A.I.B.; Tin, N.T.T. Brush seal performance with ideal gas working fluid under static rotor condition. Machines 2024, 12, 476. [Google Scholar] [CrossRef]
- Aksit, M.F. Brush Seals and Common Issues in Brush Seal Applications; NATO: Brussels, Belgium, 2012. [Google Scholar]
- Bowen, J.P.; Bowsher, A.A.; Crudgington, P.F.; Bull, S.; Sangan, C.M.; Scobie, J.A. Tracking of bristle tip deflections to demonstrate blow-down in brush seals. Turbo Expo Power Land Sea Air 2024, 88001, V008T14A020. [Google Scholar]
- Bahadori, M.; Zirak, S. Effect of a ring type barrier and rotational speed on leakage flow of gas turbine brush seal. Energy Equip. Syst. 2019, 7, 389–399. [Google Scholar]
- Kwon, J.W.; Ahn, J. Evaluation of gas turbine brush seal performance using a one-dimensional code. Trans. Korean Soc. Mech. Eng. B 2024, 48, 589–598. [Google Scholar] [CrossRef]
- Lee, J.J.; Kang, S.Y.; Kim, T.S.; Byun, S.S. Thermo-economic analysis on the impact of improving inter-stage packing seals in a 500 MW class supercritical steam turbine power plant. Appl. Therm. Eng. 2017, 121, 974–983. [Google Scholar] [CrossRef]
- Bayley, F.J.; Long, C.A. A combined experimental and theoretical study of flow and pressure distributions in a brush seal. J. Eng. Gas Turbines Power 1993, 115, 404–410. [Google Scholar] [CrossRef]
- Carlile, J.A.; Hendrics, R.C.; Yoder, D.A. Brush seal leakage performance with gaseous working fluids at static and low rotor speed conditions. J. Eng. Gas Turbines Power 1993, 115, 397–403. [Google Scholar] [CrossRef]
- Turner, M.T.; Chew, J.W.; Long, C.A. Experimental investigation and mathematical modeling of clearance brush seals. J. Eng. Gas Turbines Power 1998, 120, 573–579. [Google Scholar] [CrossRef]
- Zhang, Y.; Li, J.; Yan, X.; Li, Z. Experimental and numerical investigations on leakage flow characteristics of two kinds of brush seals. Turbo Expo Power Land Sea Air 2018, 51098, V05BT15A026. [Google Scholar]
- Sun, D.; Liu, N.N.; Fei, C.W.; Hu, G.Y.; Ai, Y.T.; Choy, Y.S. Theoretical and numerical investigation on the leakage characteristics of brush seals based on fluid–structure interaction. Aerosp. Sci. Technol. 2016, 58, 207–216. [Google Scholar] [CrossRef]
- Kvamsdal, T.; Jenssen, C.; Okstad, K.; Amundsen, J. Fluid-structure interaction for structural design. In Proceedings of the International Symposium on Computational Methods for Fluid-Structure Interaction (FSI’99); Tapir Publishers: Trondheim, Norway, 1999; pp. 211–238. [Google Scholar]
- Li, J.; Qiu, B.; Jiang, S.; Kong, X.; Feng, Z. Experimental and numerical investigations on the leakage flow characteristics of the labyrinth brush seal. Turbo Expo Power Land Sea Air 2012, 44700, 2201–2210. [Google Scholar]
- Abbas, A.M.; Pekris, M.J.; Chew, J.W. Investigation of grooved front plate for inlet swirl reduction in brush seals. Turbo Expo Power Land Sea Air 2024, 88001, V008T14A015. [Google Scholar]
- Huang, S.Q.; Suo, S.F.; Du, K.B.; Li, Y.J.; Wang, Y.M. Study on a type of low-leakage brush seal porous media model. Appl. Mech. Mater. 2013, 312, 345–349. [Google Scholar] [CrossRef]
- Germen, M. Porous Medium Flow Simulation in a Brush Seal with Radial Clearance; Vienna University of Technology: Vienna, Austria, 2012. [Google Scholar]
- Görgün, E. A Study of Porous Media Resistance Coefficients for Brush Seals. Ph.D. Thesis, Sabancı University, Tuzla, Türkiye, Sabanci University, Istanbul, Turkey, 2014. [Google Scholar]
- Qiu, B.; Li, J.; Feng, Z. Investigation of conjugate heat transfer in brush seals using porous media approach under local thermal non-equilibrium conditions. Turbo Expo Power Land Sea Air 2015, 56734, V05CT15A009. [Google Scholar]
- Li, J.; Huang, Y.; Li, Z.; Feng, Z.; Yang, H.; Yang, J.; Shi, L. Effects of clearances on the leakage flow characteristics of two kinds of brush seals and referenced labyrinth seal. Turbo Expo Power Land Sea Air 2010, 43994, 1133–1142. [Google Scholar]
- Park, D.S.; Ha, T.W. Rotordynamic characteristic analysis of brush seal using CFD. KSFM J. Fluid Mach. 2018, 21, 21–27. [Google Scholar] [CrossRef]
- Song, X.; Liu, M.; Sun, J.; Wang, J.; Wang, K. Temperature field and performance analysis of brush seals based on FEA-CFD and the porous medium of anisotropic heat transfer models. Energies 2023, 16, 7306. [Google Scholar] [CrossRef]
- Dogu, Y.; Bahar, A.S.; Sertçakan, M.C.; Pişkin, A.; Arıcan, E.; Kocagül, M. Computational fluid dynamics investigation of brush seal leakage performance depending on geometric dimensions and operating conditions. J. Eng. Gas Turbines Power 2016, 138, 032506. [Google Scholar] [CrossRef]
- Varma, K.K.; Varma, B.S.; Kumari, K.R. CFD analysis of a heat exchanger using enhanced wall treatment function to capture the laminar sub-layer close to the wall. Int. J. Mech. Eng. Res. Dev. 2019, 9, 263–278. [Google Scholar]
- Johnson, R.W. Validation Studies for Numerical Simulations of Flow Phenomena Expected in the Lower Plenum of a Prismatic VHTR Reference Design; Idaho National Lab.(INL): Idaho Falls, ID, USA, 2005. [Google Scholar]
- Chun, Y.H.; Ahn, J. Optimizing the geometric parameters of a stepped labyrinth seal to minimize the discharge coefficient. Processes 2022, 10, 2019. [Google Scholar] [CrossRef]
- Chew, J.W.; Hogg, S.I. Porosity modeling of brush seals. J. Tribol. 1997, 119, 769–775. [Google Scholar] [CrossRef]
- Pröstler, S. Modellierung und numerische Berechnung von Wellenabdichtungen in Brstenbauart. Ph.D. Thesis, Ruhr-Universität, Bochum, Germany, 2005. [Google Scholar]
- Pugachev, A.O.; Deckner, M. CFD prediction and test results of stiffness and damping coefficients for brush-labyrinth gas seals. Turbo Expo Power Land Sea Air 2010, 44014, 175–185. [Google Scholar]
- Ma, D.; Li, Z.; Li, J. A three-dimensional tube bundle model analysis for leakage flow characteristics of variable bristle diameter brush seals with bristle pack stratification. J. Eng. Gas Turbines Power 2021, 143, 051014. [Google Scholar] [CrossRef]
- Zhang, Y.; Dengqian, M.; Jun, L.; Yuan, H.; Jingjin, J.; Bo, S.; Zhigang, L.; Xin, Y. Effect of the fence height on the leakage flow characteristics of brush seals. Glob. Power Propuls. Soc. 2019. [Google Scholar] [CrossRef]
- Bowen, J.P.; Jenkins, M.R.; Bowsher, A.A.; Crudgington, P.F.; Sangan, C.M.; Scobie, J.A. The inter-bristle pressure field in a large-scale brush seal. J. Eng. Gas Turbines Power 2022, 144, 111022. [Google Scholar] [CrossRef]
- Qiu, B.; Jun, L. Numerical investigations on the heat transfer behavior of brush seals using combined computational fluid dynamics and finite element method. J. Heat Transfer 2013, 135, 122601. [Google Scholar] [CrossRef]
- Chen, L.H.; Wood, P.E.; Jones, T.V.; Chew, J.W. An iterative CFD and mechanical brush seal model and comparison with experimental results. Turbo Expo Power Land Sea Air 1998, 78651, V004T09A067. [Google Scholar]
- Dogu, Y.; Aksit, M.F.; Demiroglu, M.; Dinc, O.S. Evaluation of flow behavior for clearance brush seals. J. Eng. Gas Turbines Power 2008, 130, 012507. [Google Scholar] [CrossRef]
- Crudgington, P.; Bowsher, A. Brush seal blow down. In Proceedings of the 39th AIAA/ASME/SAE/ASEE Joint Propulsion Conference and Exhibit, Huntsville, AL, USA, 20–23 July 2003; p. 4697. [Google Scholar]
- Jolly, P.; Arghir, M.; Bonneau, O.; Coirier, R.; Fiore, G. Experimental characterization of a two stage brush seals: Leakage and torque measurements. Turbo Expo Power Land Sea Air 2023, 11A, V11AT22A021. [Google Scholar]


| Label | Maximum Element Size (mm) | Minimum Element Size (mm) | Boundary Condition | Material | Geometry |
|---|---|---|---|---|---|
| a | 0.5 | 0.04 | Pressure_inlet | Fluid | Left edge |
| b | 0.48 | 0.038 | Pressure_inlet | Fluid | Left edge |
| c | 0.45 | 0.035 | Pressure_inlet | Fluid | Left edge |
| d | 0.25 | 0.015 | Pressure_inlet | Fluid | Left edge |
| e | 0.52 | 0.042 | - | Fluid | - |
| f | 0.4 | 0.032 | - | Fluid | - |
| g | 0.25 | 0.015 | - | Fluid | - |
| h | 0.47 | 0.039 | Bristle_Upper | Porous medium | Body |
| i | 0.45 | 0.035 | Bristle_FenceHeight | Porous medium | Body |
| j | 0.3 | 0.02 | - | Fluid | - |
| k | 0.31 | 0.0254 | - | Fluid | - |
| l | 0.3 | 0.02 | - | Fluid | - |
| m | 0.45 | 0.035 | Pressure_outlet | Fluid | Right edge |
| n | 0.45 | 0.035 | Pressure_outlet | Fluid | Right edge |
| o | 0.3 | 0.02 | Pressure_outlet | Fluid | Right edge |
| Parameter | Bayley et al. [25] | Carlile et al. [26] |
|---|---|---|
| Bristle diameter () | 0.0762 mm | 0.051 mm |
| Bristle pack thickness () | 0.7 mm | 0.8 mm |
| Bristle lay angle () | 45° | 40° |
| Fence height () | 1.5 mm | 0.655 mm |
| Clearance () | 0 mm | 0 mm |
| Bristle density () | 94.5 per mm | 180 per mm |
| Upstream temperature | 293.15 K | 290 K |
| Downstream pressure | 100 kPa | 100 kPa |
| Pressure patio | 1.07–3.8 | 2–8 |
| Porosity () | 0.129 | 0.285 |
| Parameter | Turner et al. [27] |
|---|---|
| Bristle diameter () | 0.076 mm |
| Bristle pack thickness () | 0.75 mm |
| Bristle lay angle () | 45° |
| Fence height () | 1.4 mm |
| Clearance () | 0.27 mm, 0.75 mm |
| Bristle density () | 94.5 per mm |
| Upstream temperature | 293.15 K |
| Downstream pressure | 100 kPa |
| Pressure ratio | 1.07–3.8 |
| Porosity () | 0.192 |
Disclaimer/Publisher’s Note: The statements, opinions and data contained in all publications are solely those of the individual author(s) and contributor(s) and not of MDPI and/or the editor(s). MDPI and/or the editor(s) disclaim responsibility for any injury to people or property resulting from any ideas, methods, instructions or products referred to in the content. |
© 2024 by the authors. Licensee MDPI, Basel, Switzerland. This article is an open access article distributed under the terms and conditions of the Creative Commons Attribution (CC BY) license (https://creativecommons.org/licenses/by/4.0/).
Share and Cite
Kwon, J.W.; Ahn, J. Prediction of Leakage Flow Rate and Blow-Down in Brush Seals via 2D CFD Simulation with Porosity Correction. Appl. Sci. 2024, 14, 8821. https://doi.org/10.3390/app14198821
Kwon JW, Ahn J. Prediction of Leakage Flow Rate and Blow-Down in Brush Seals via 2D CFD Simulation with Porosity Correction. Applied Sciences. 2024; 14(19):8821. https://doi.org/10.3390/app14198821
Chicago/Turabian StyleKwon, Jeong Woo, and Joon Ahn. 2024. "Prediction of Leakage Flow Rate and Blow-Down in Brush Seals via 2D CFD Simulation with Porosity Correction" Applied Sciences 14, no. 19: 8821. https://doi.org/10.3390/app14198821