
Eco-Friendly Shield Muck-Incorporated Grouting Materials: Mix Optimization and Property Evaluation for Silty Clay Tunnel Construction


Abstract
:1. Introduction
2. Test Design and Test Method
2.1. Test Material
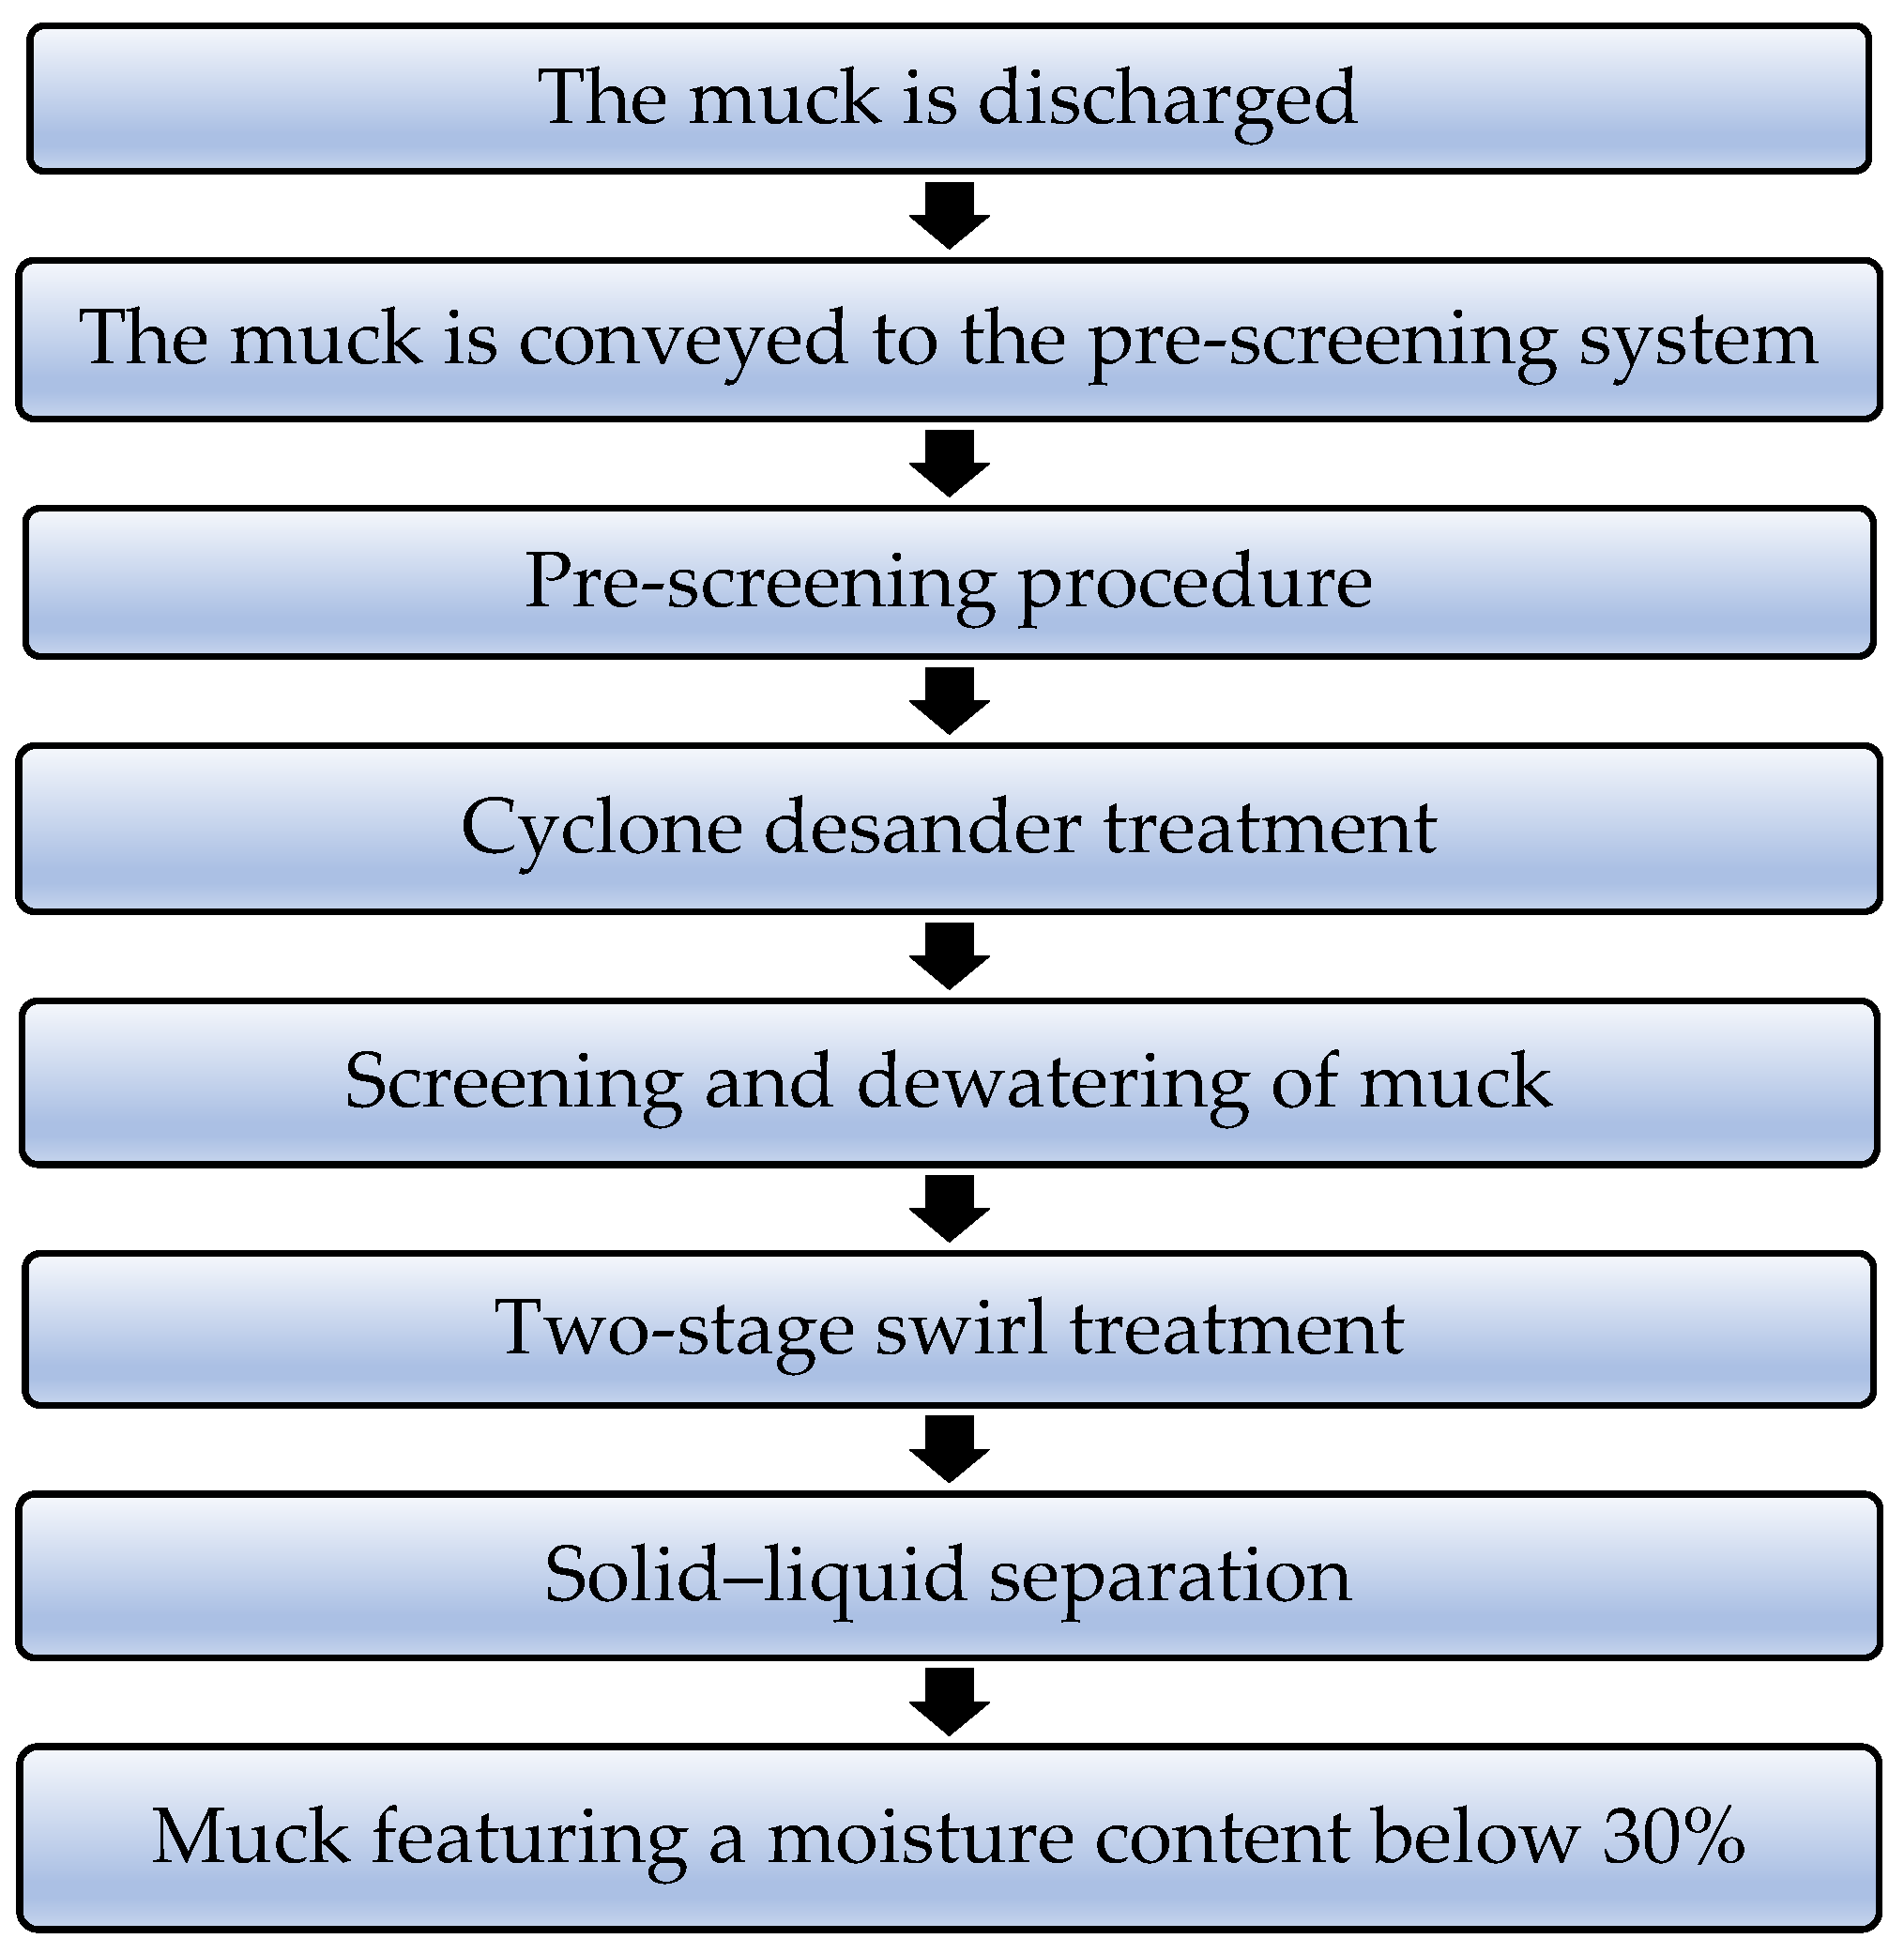
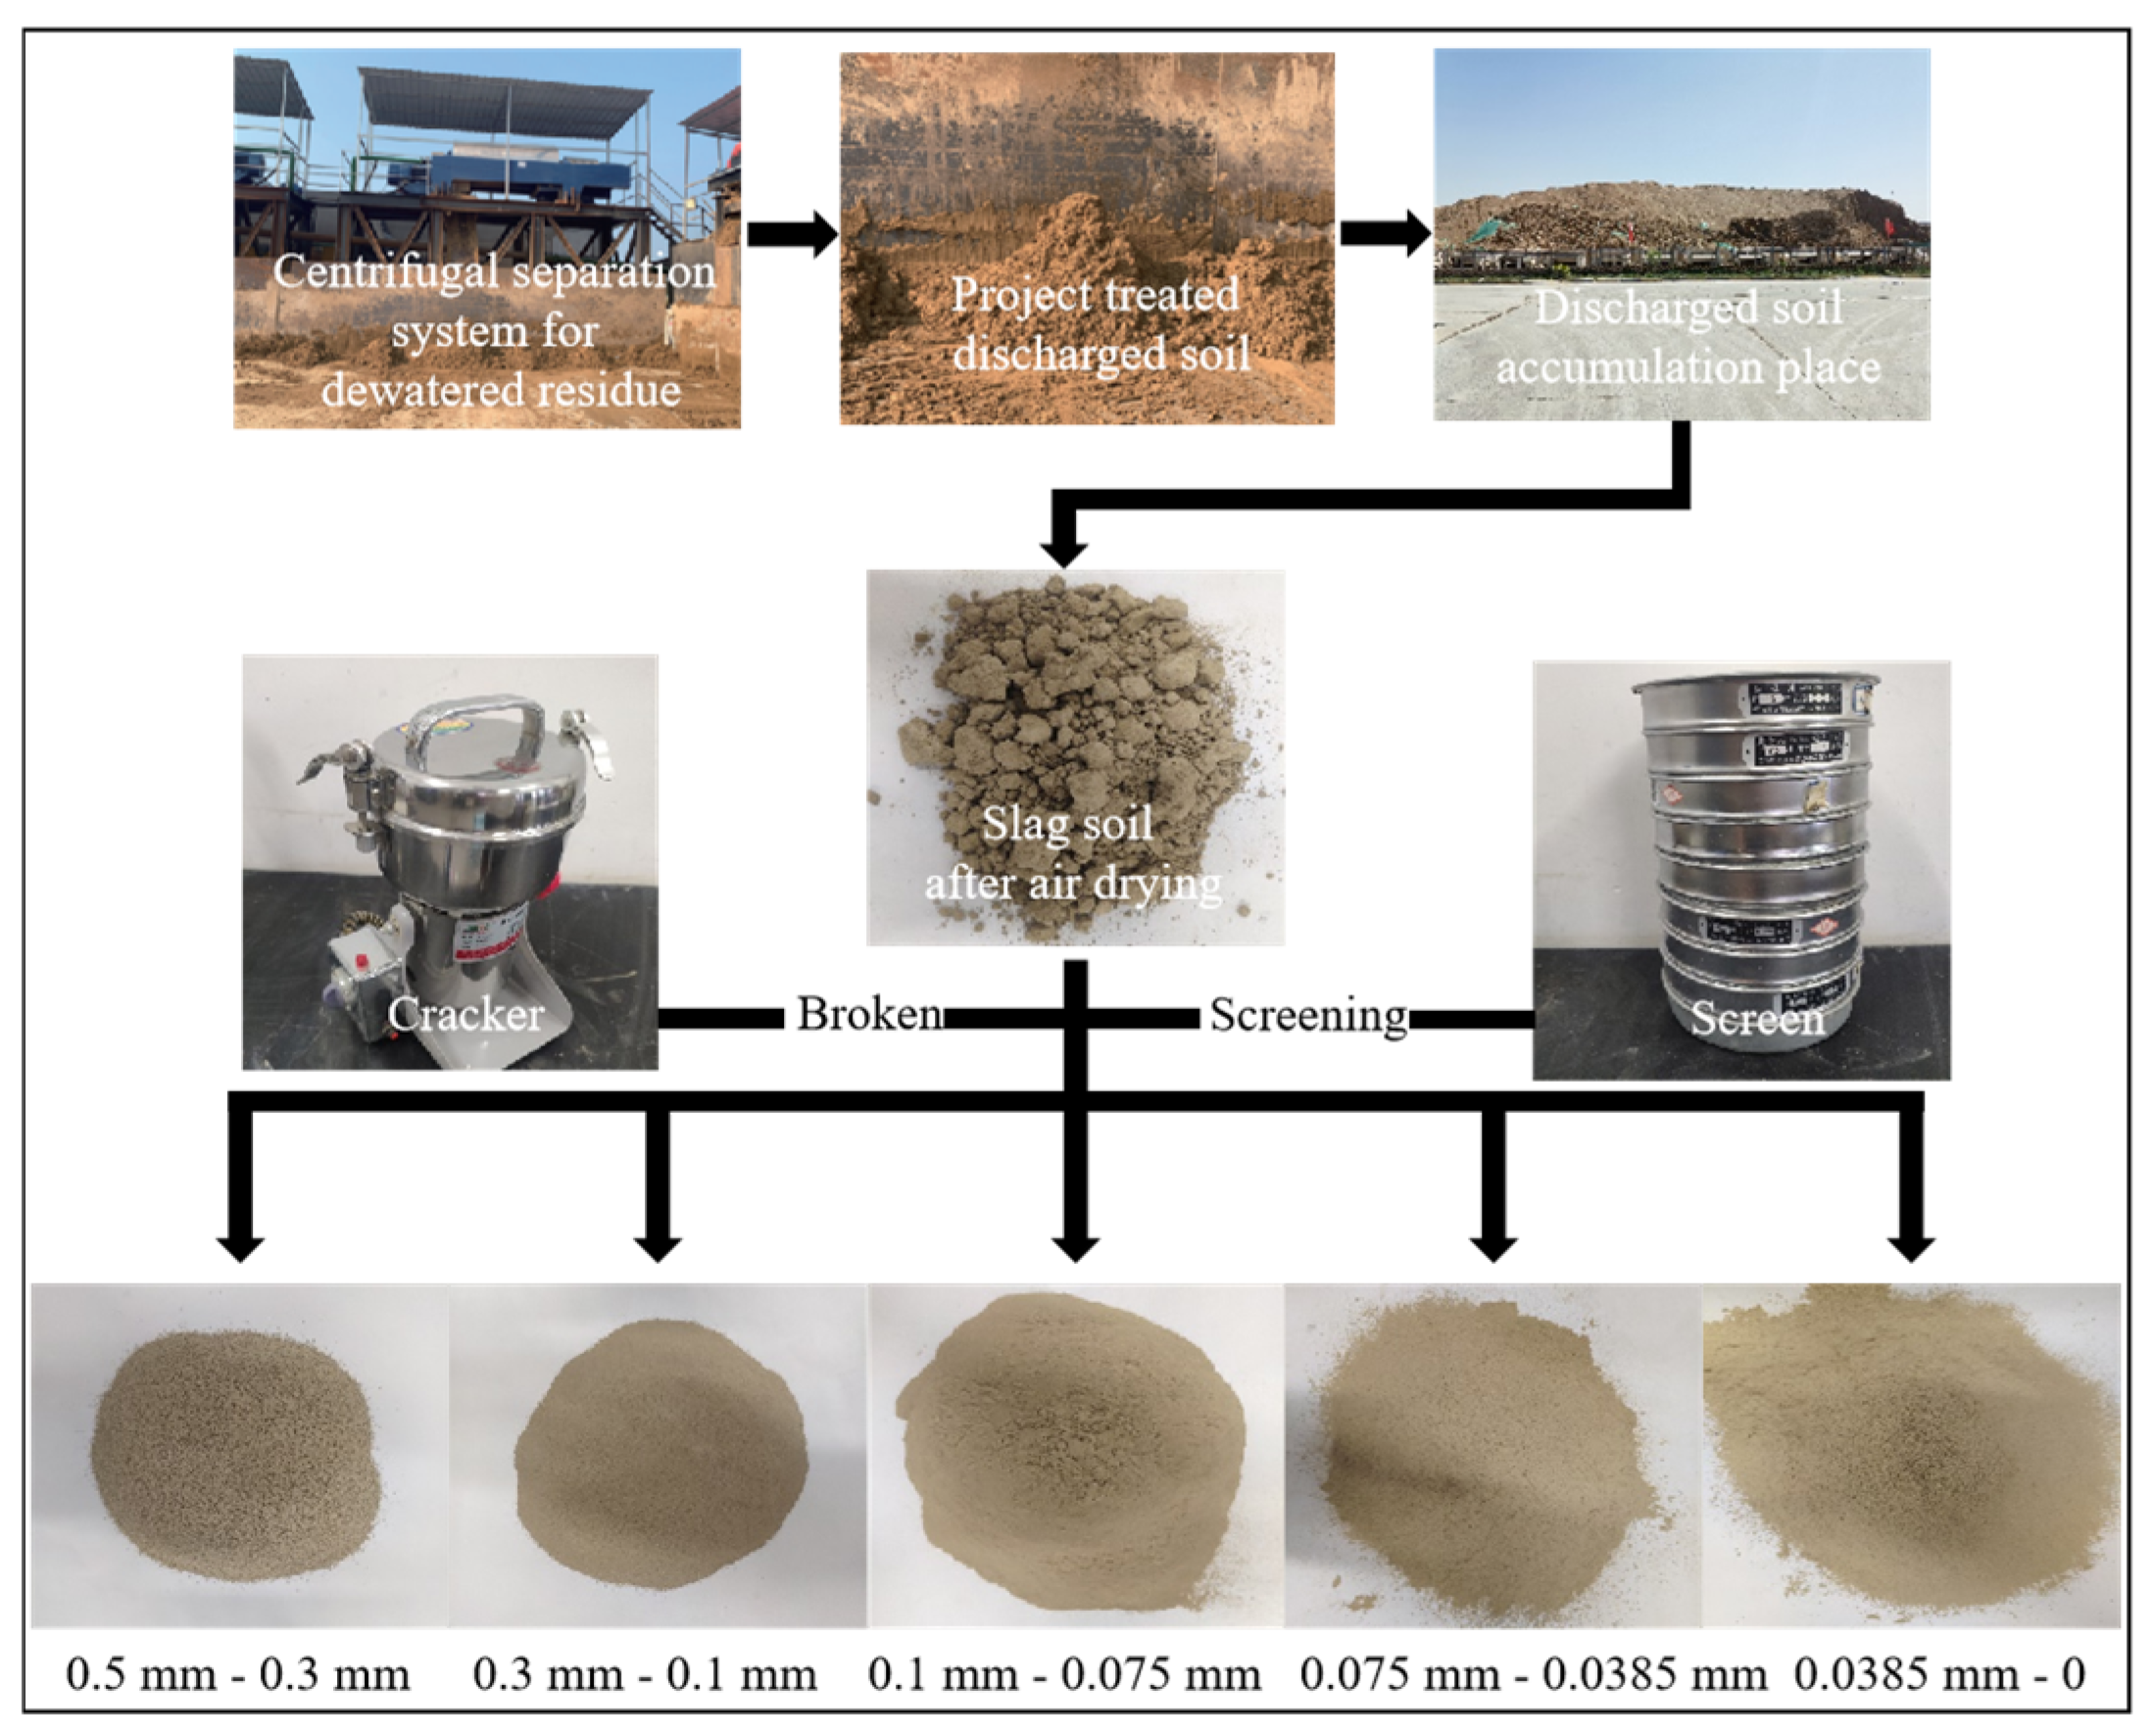
2.1.1. Shield Muck
2.1.2. Cement
2.1.3. Fly Flash
2.1.4. Sand and Water
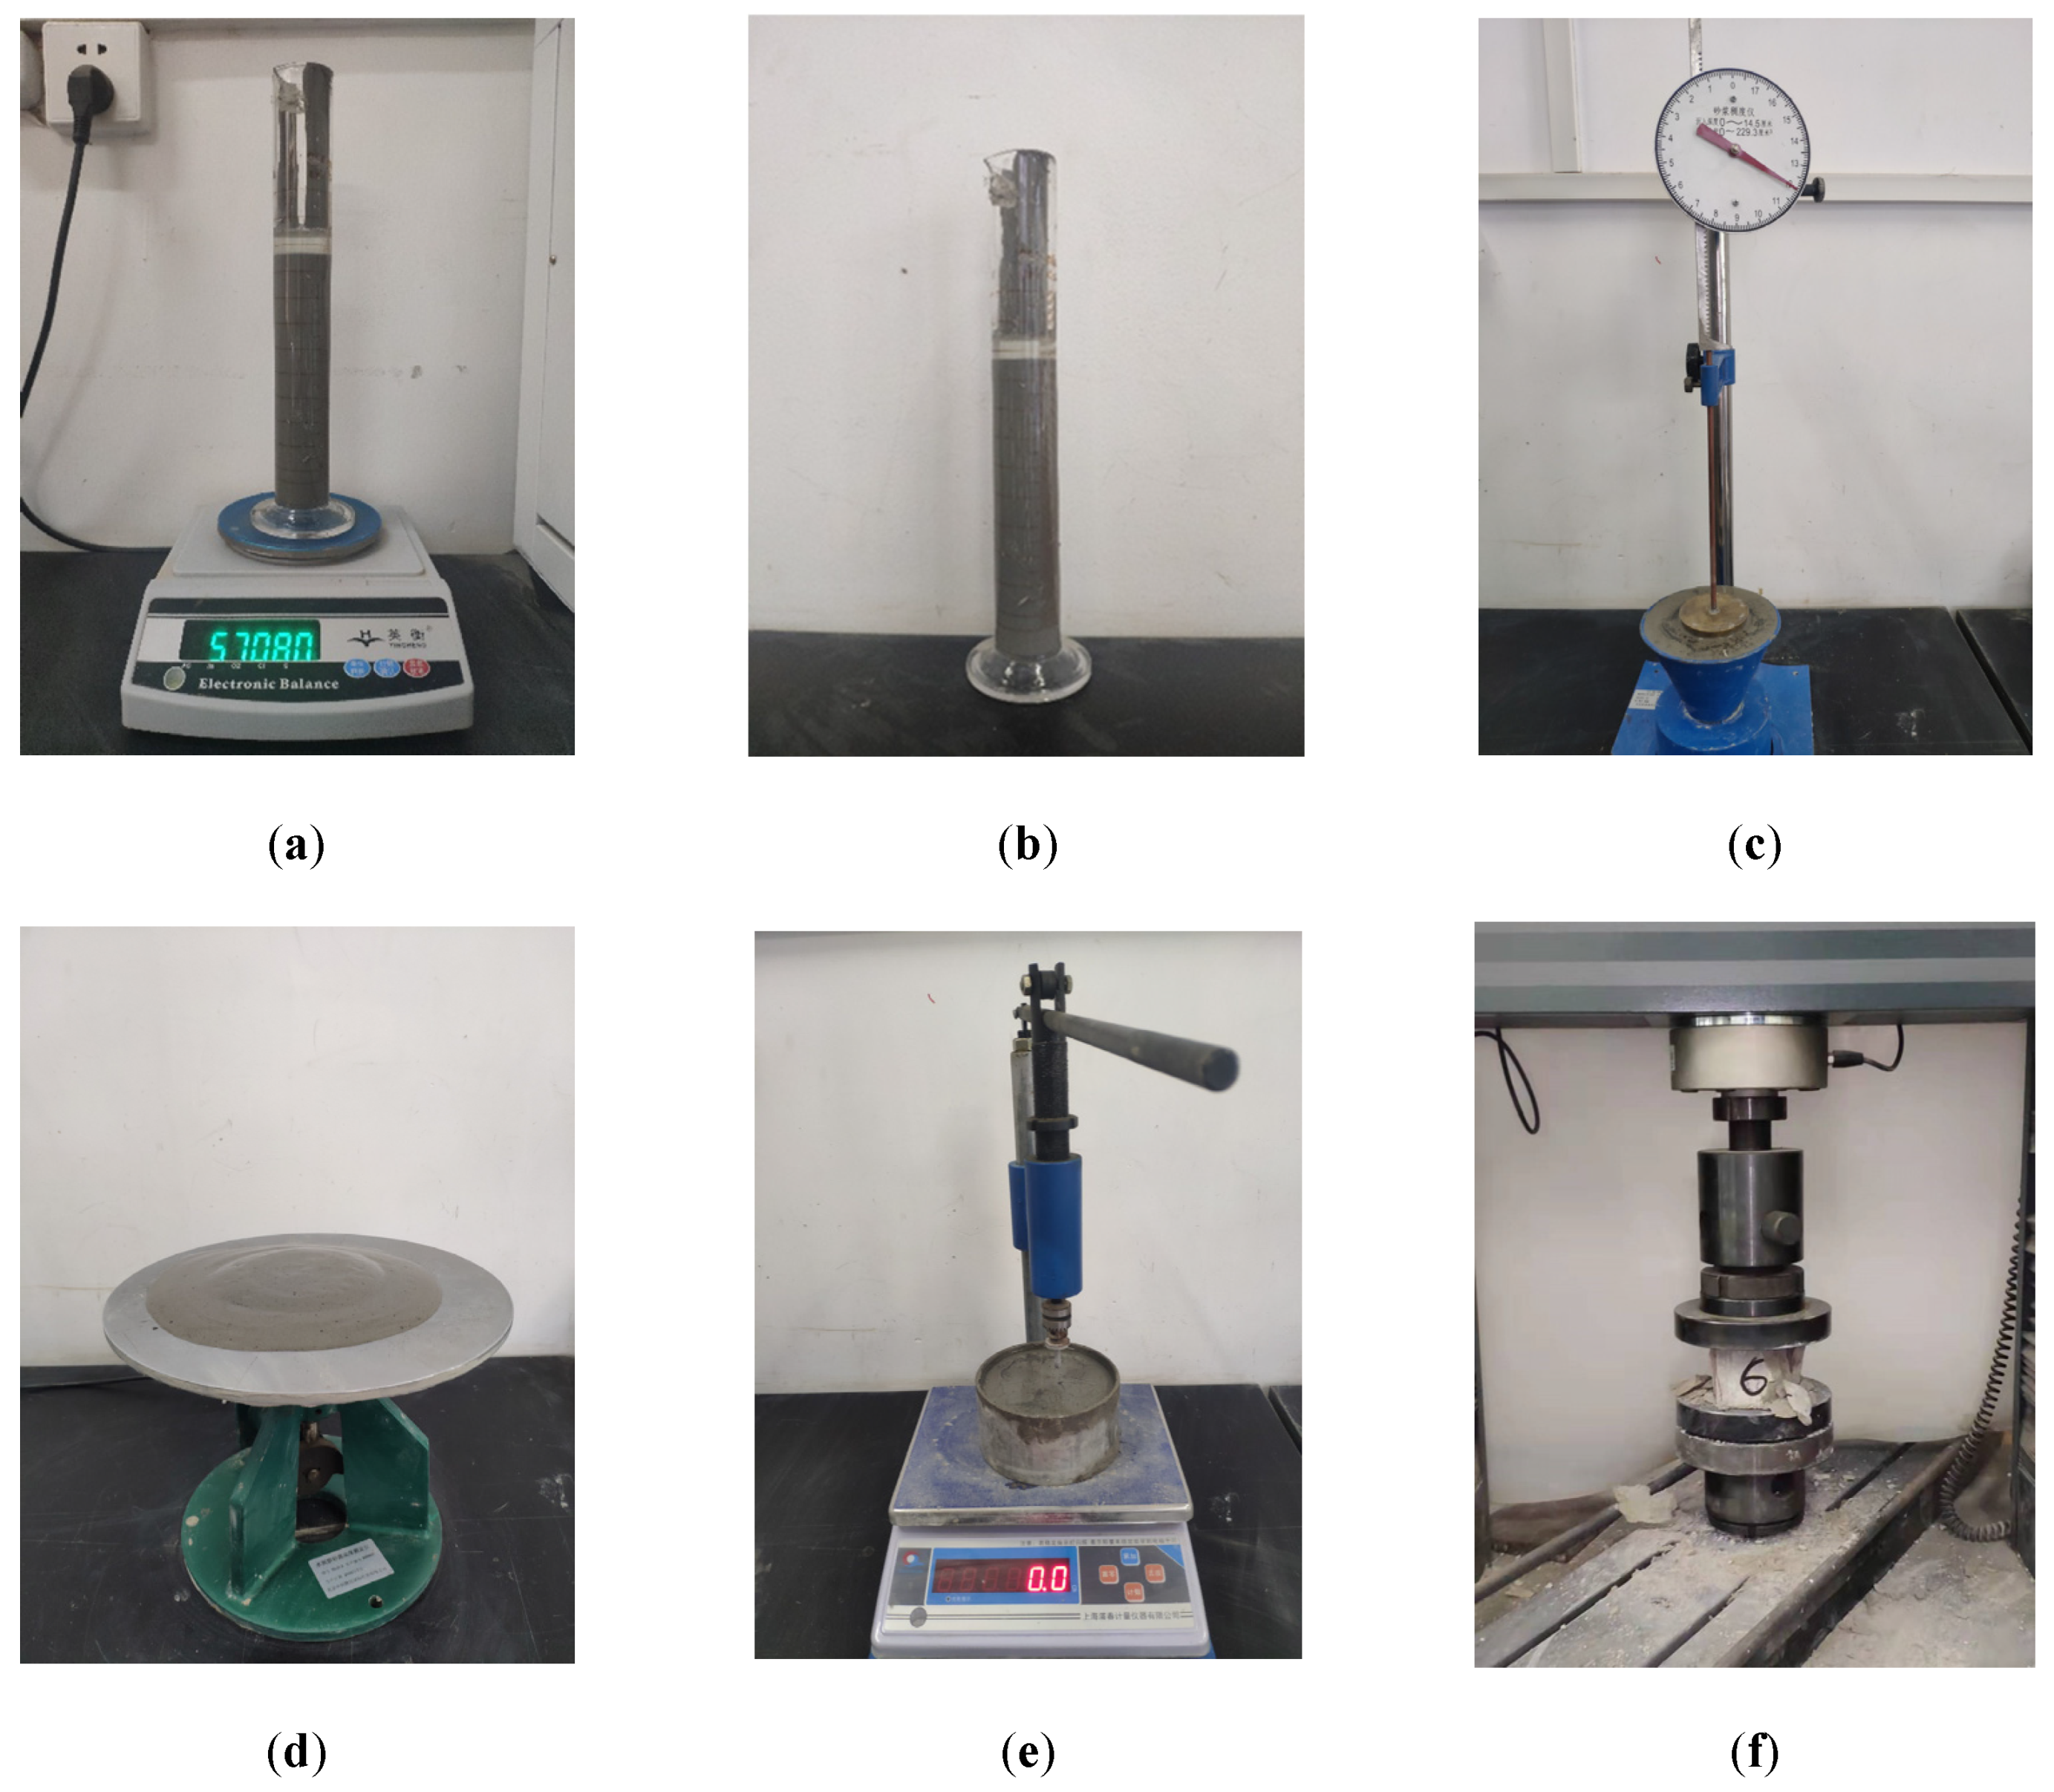
2.2. Test Process
3. Analysis of Test Results
3.1. Test Results
3.2. Single-Factor Analysis
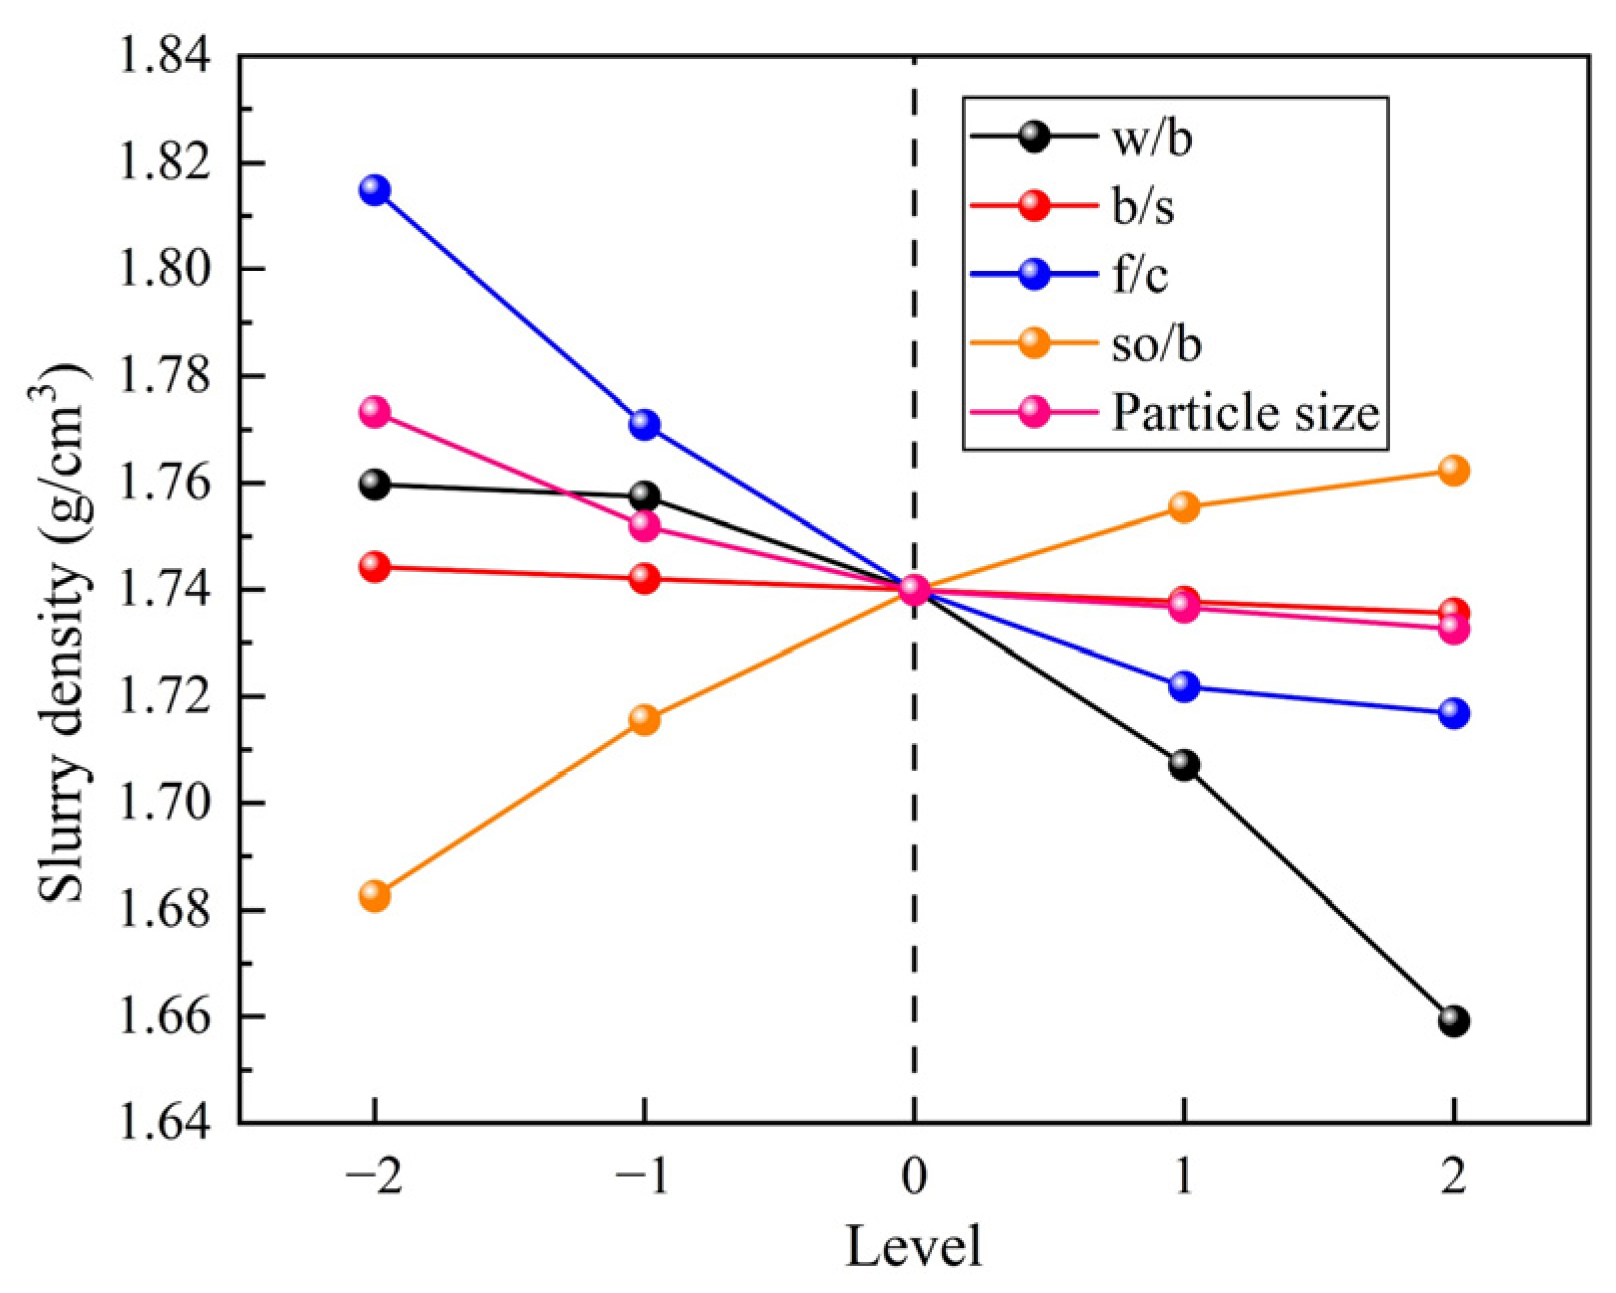
3.2.1. Density
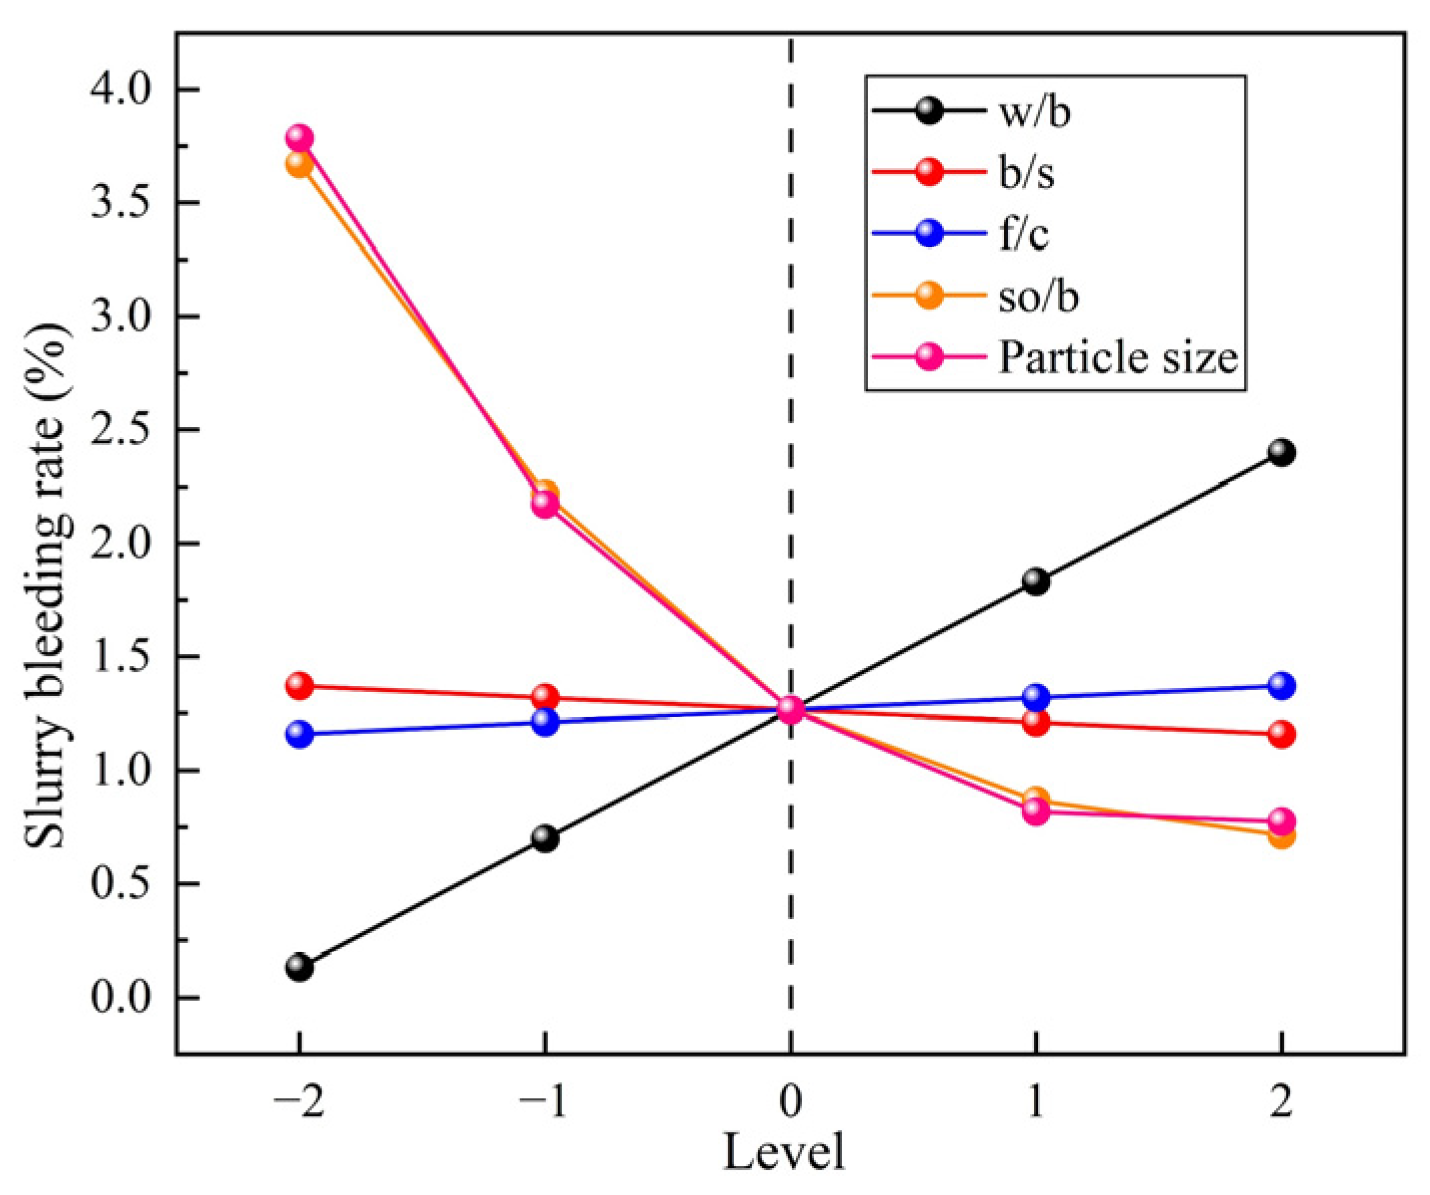
3.2.2. Bleeding Rate
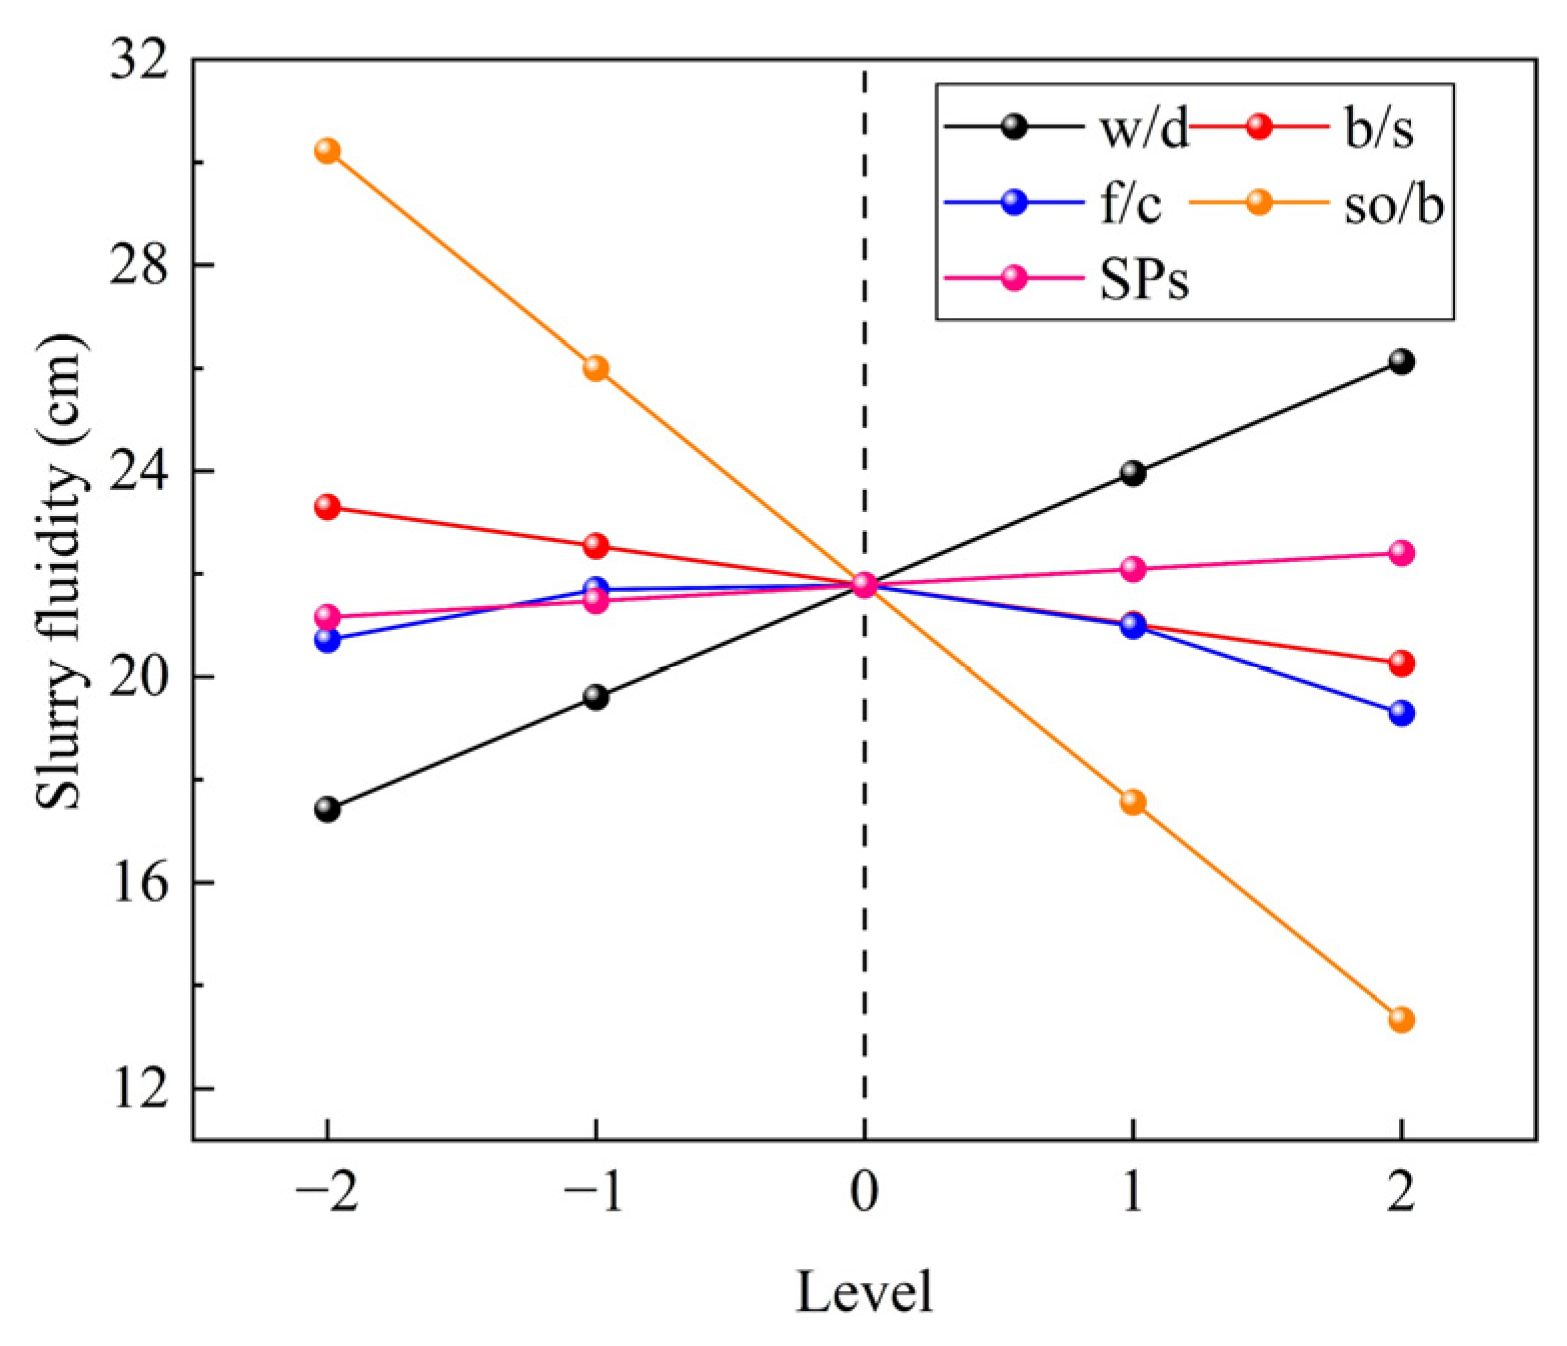
3.2.3. Fluidity
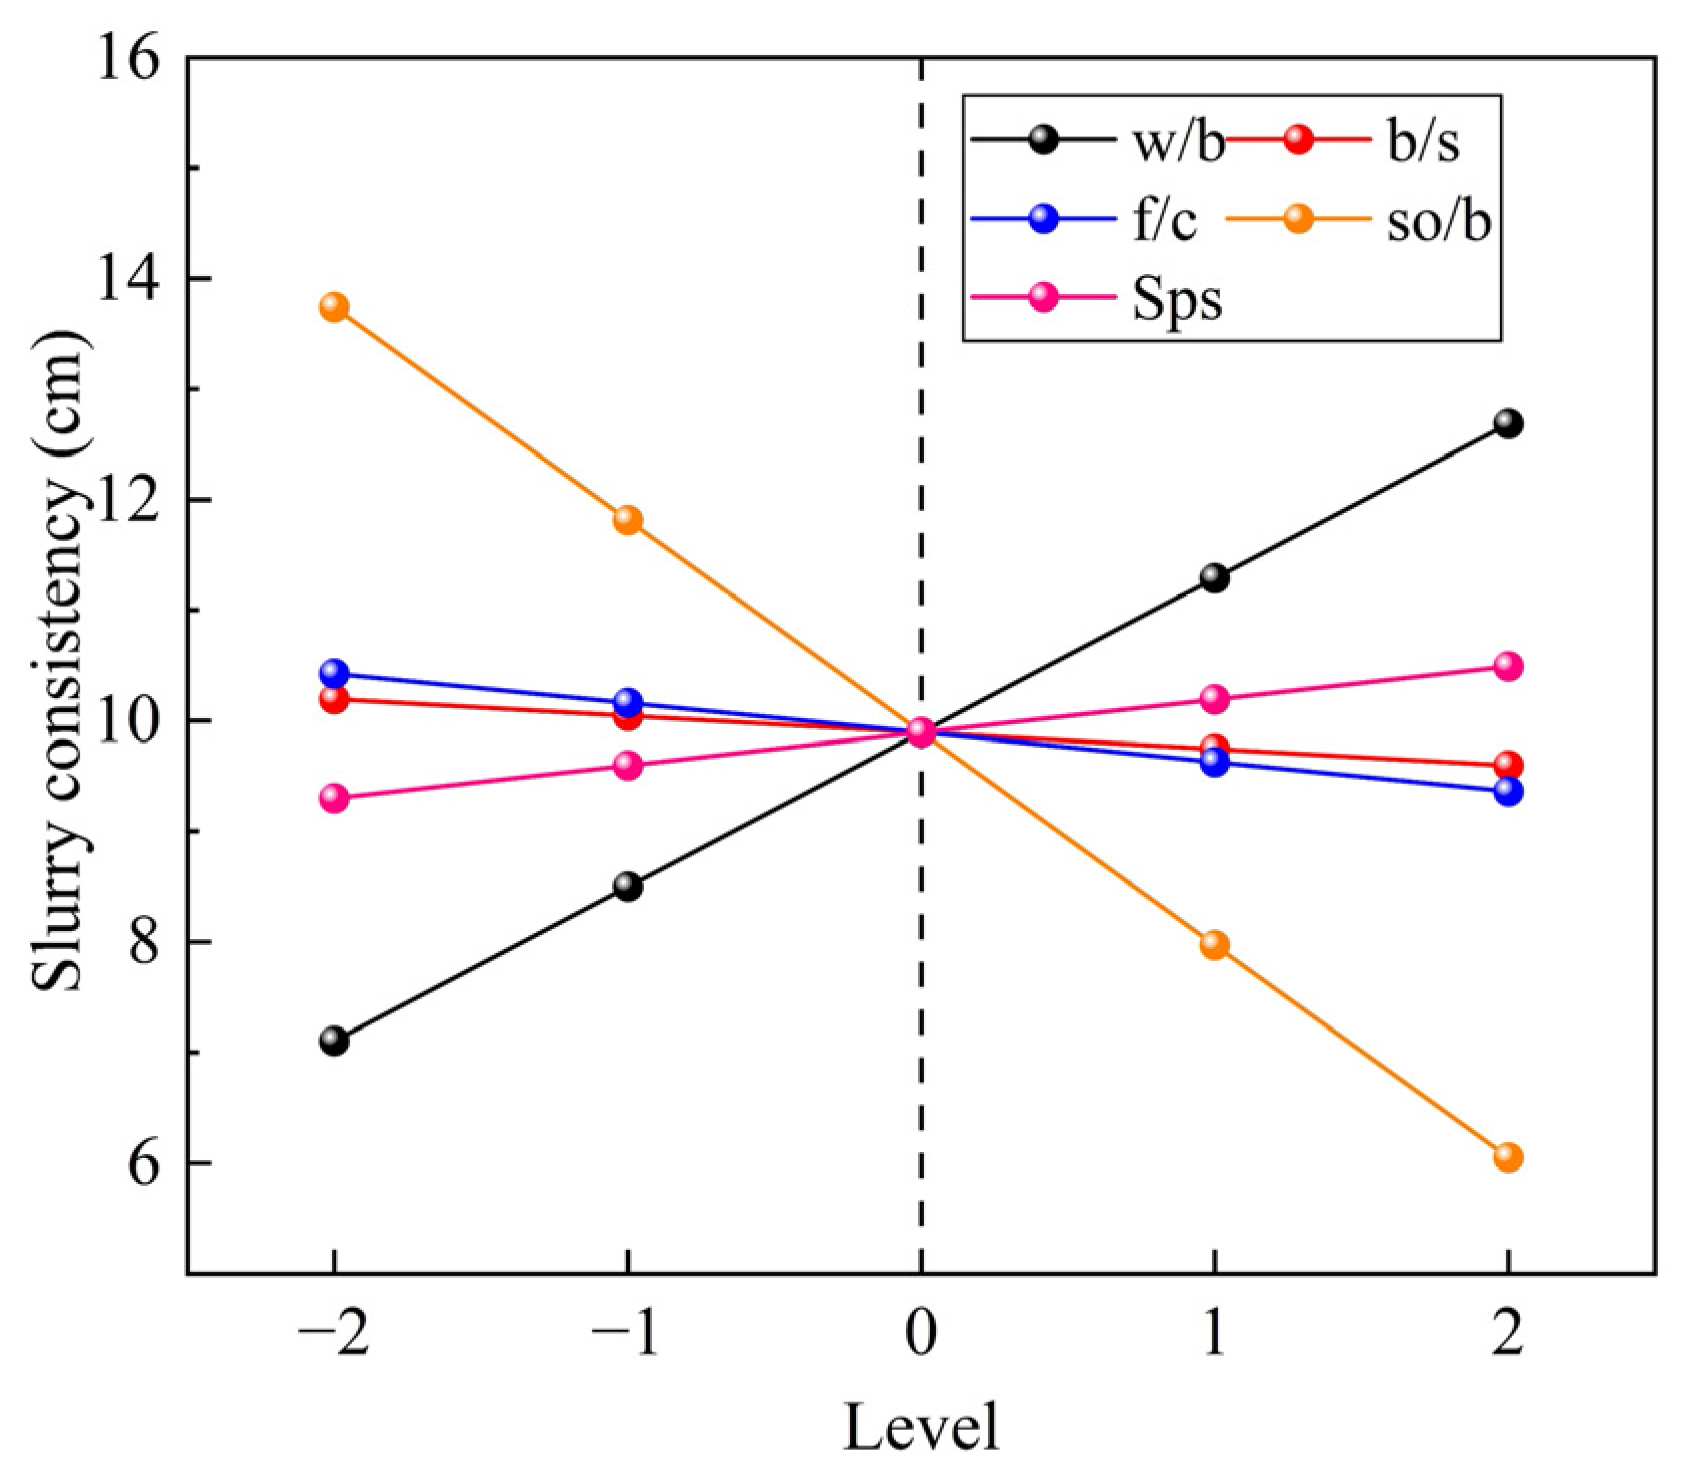
3.2.4. Consistency
3.2.5. Setting Time
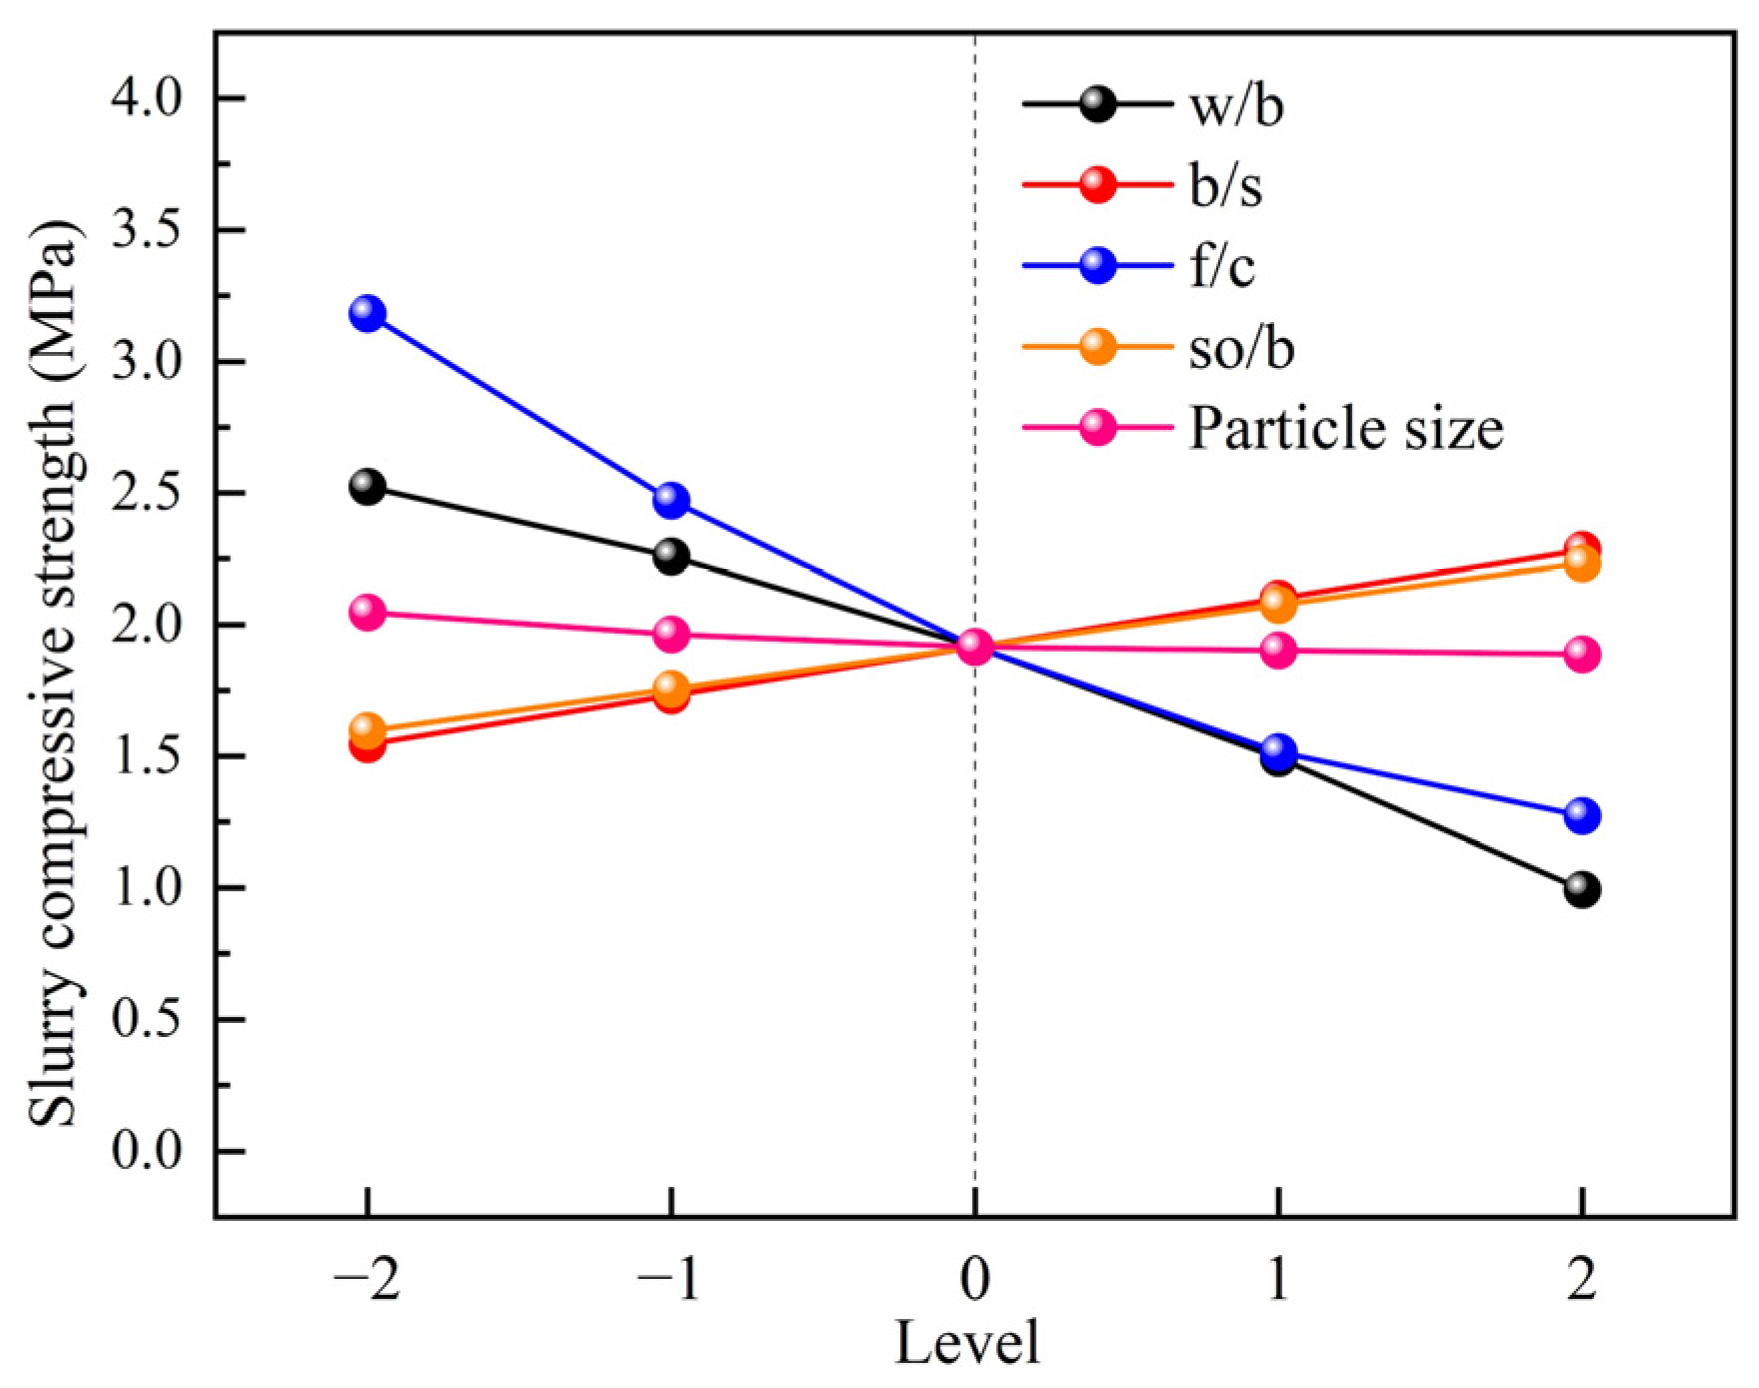
3.2.6. Compressive Strength
3.3. Response Surface Analysis
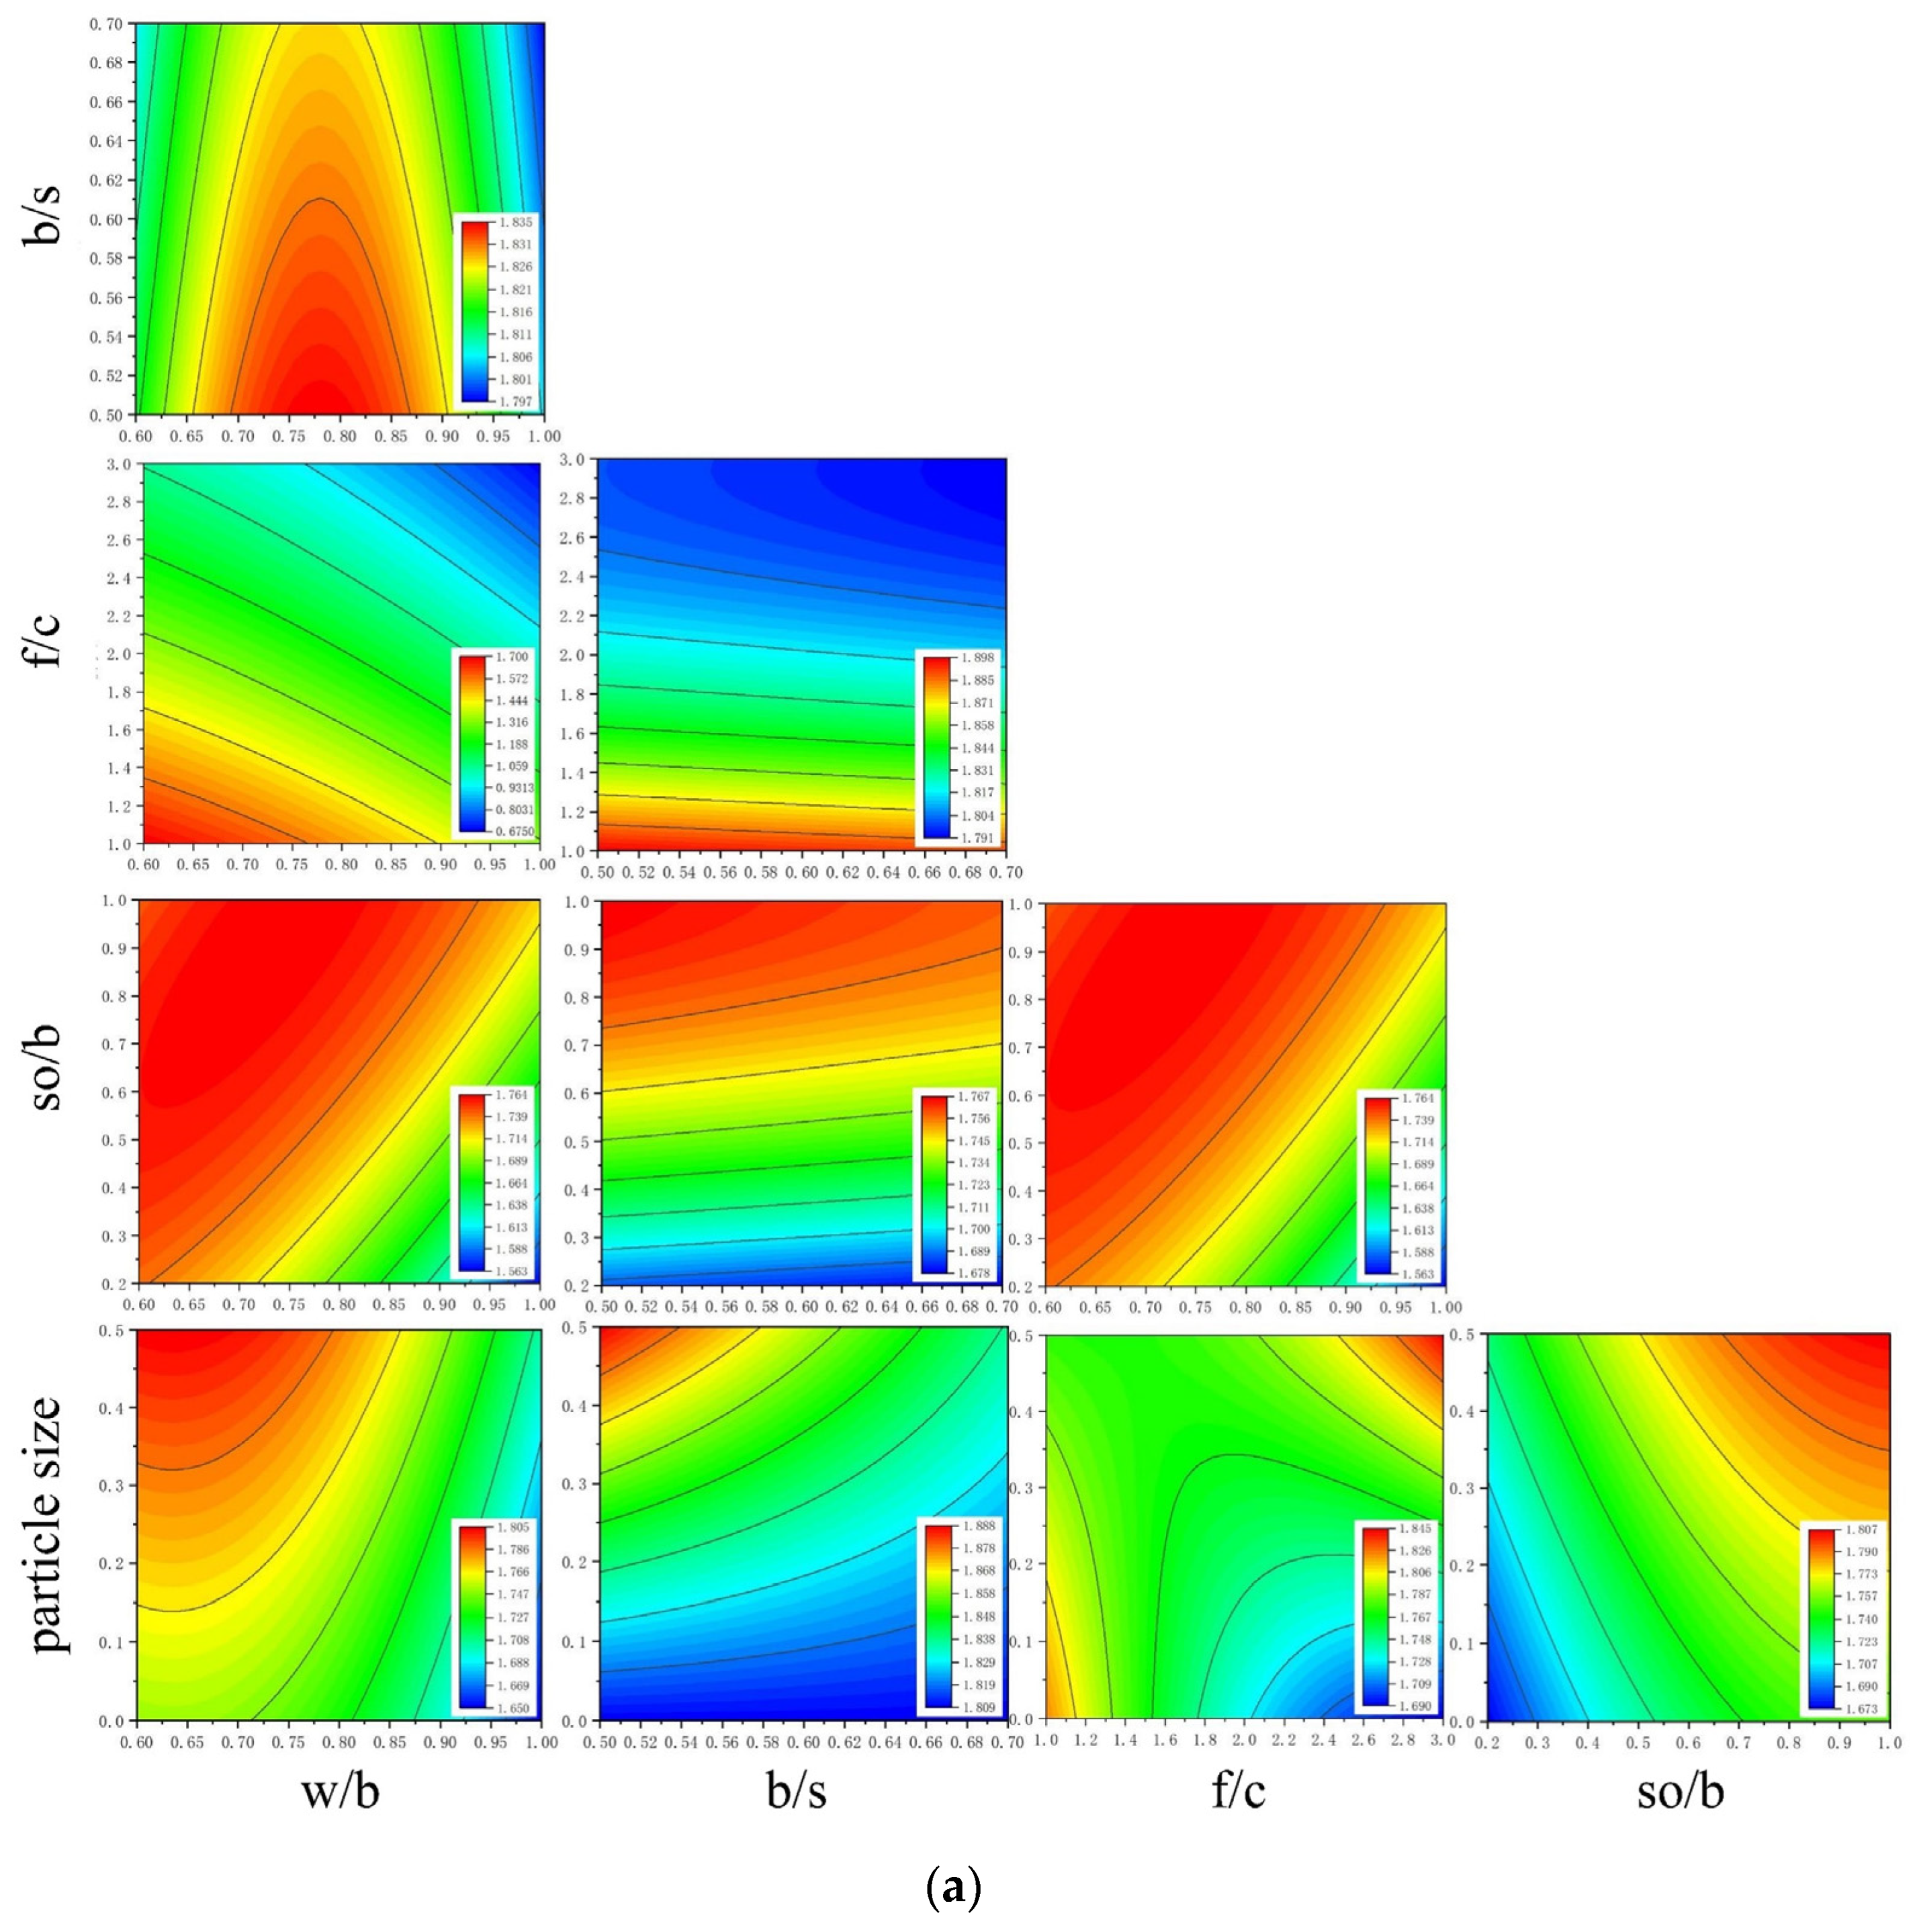
3.3.1. The Interaction Effect of Multiple Factors on Slurry Density
3.3.2. The Interaction Effect of Multiple Factors on Slurry Bleeding Rate
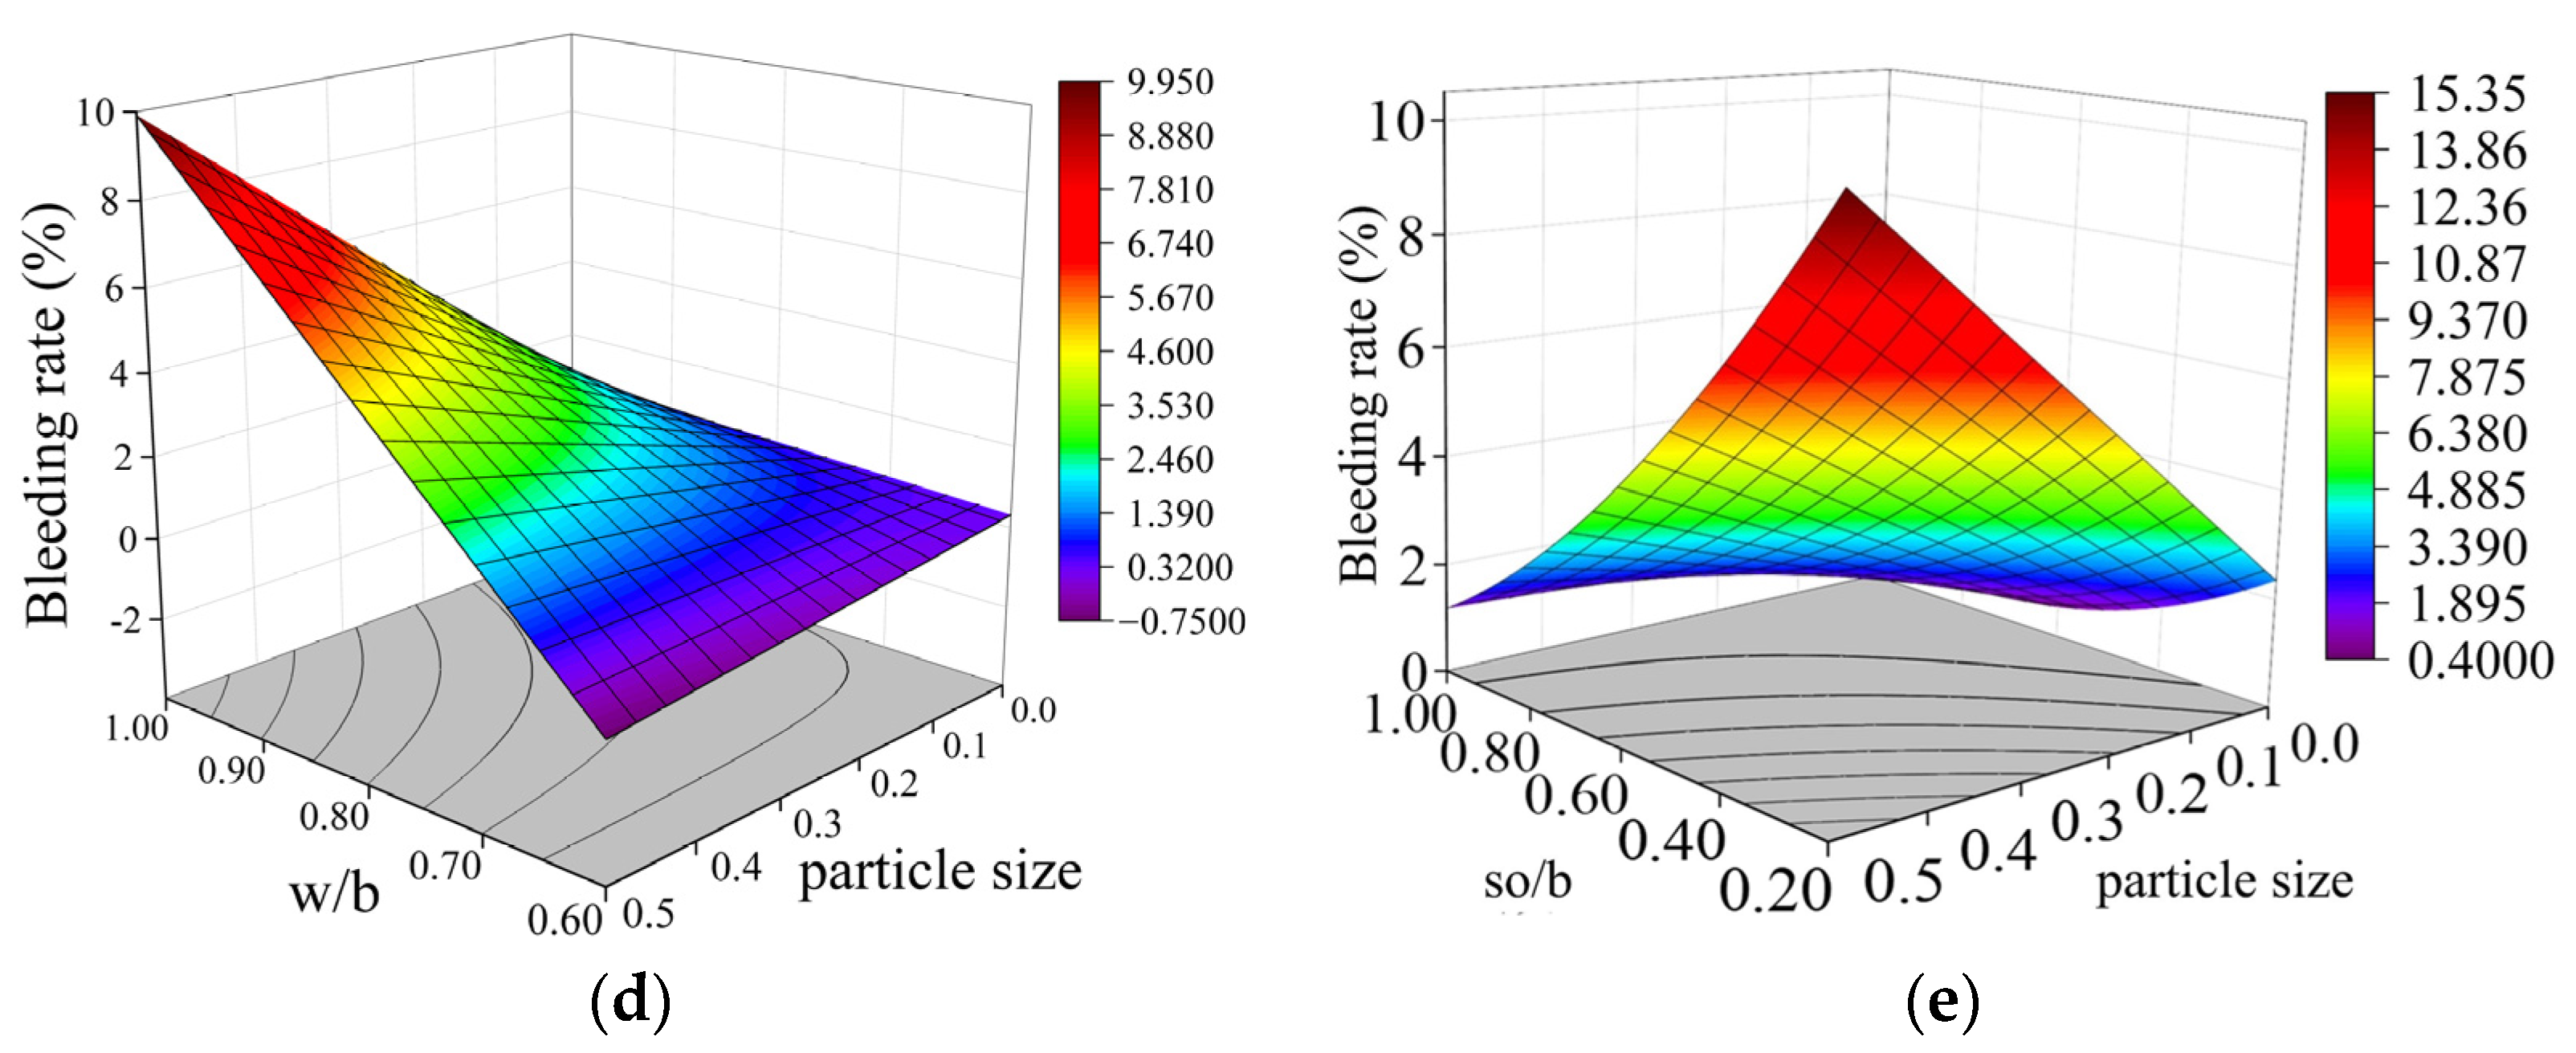
3.3.3. The Interaction Effect of Multiple Factors on Slurry Fluidity
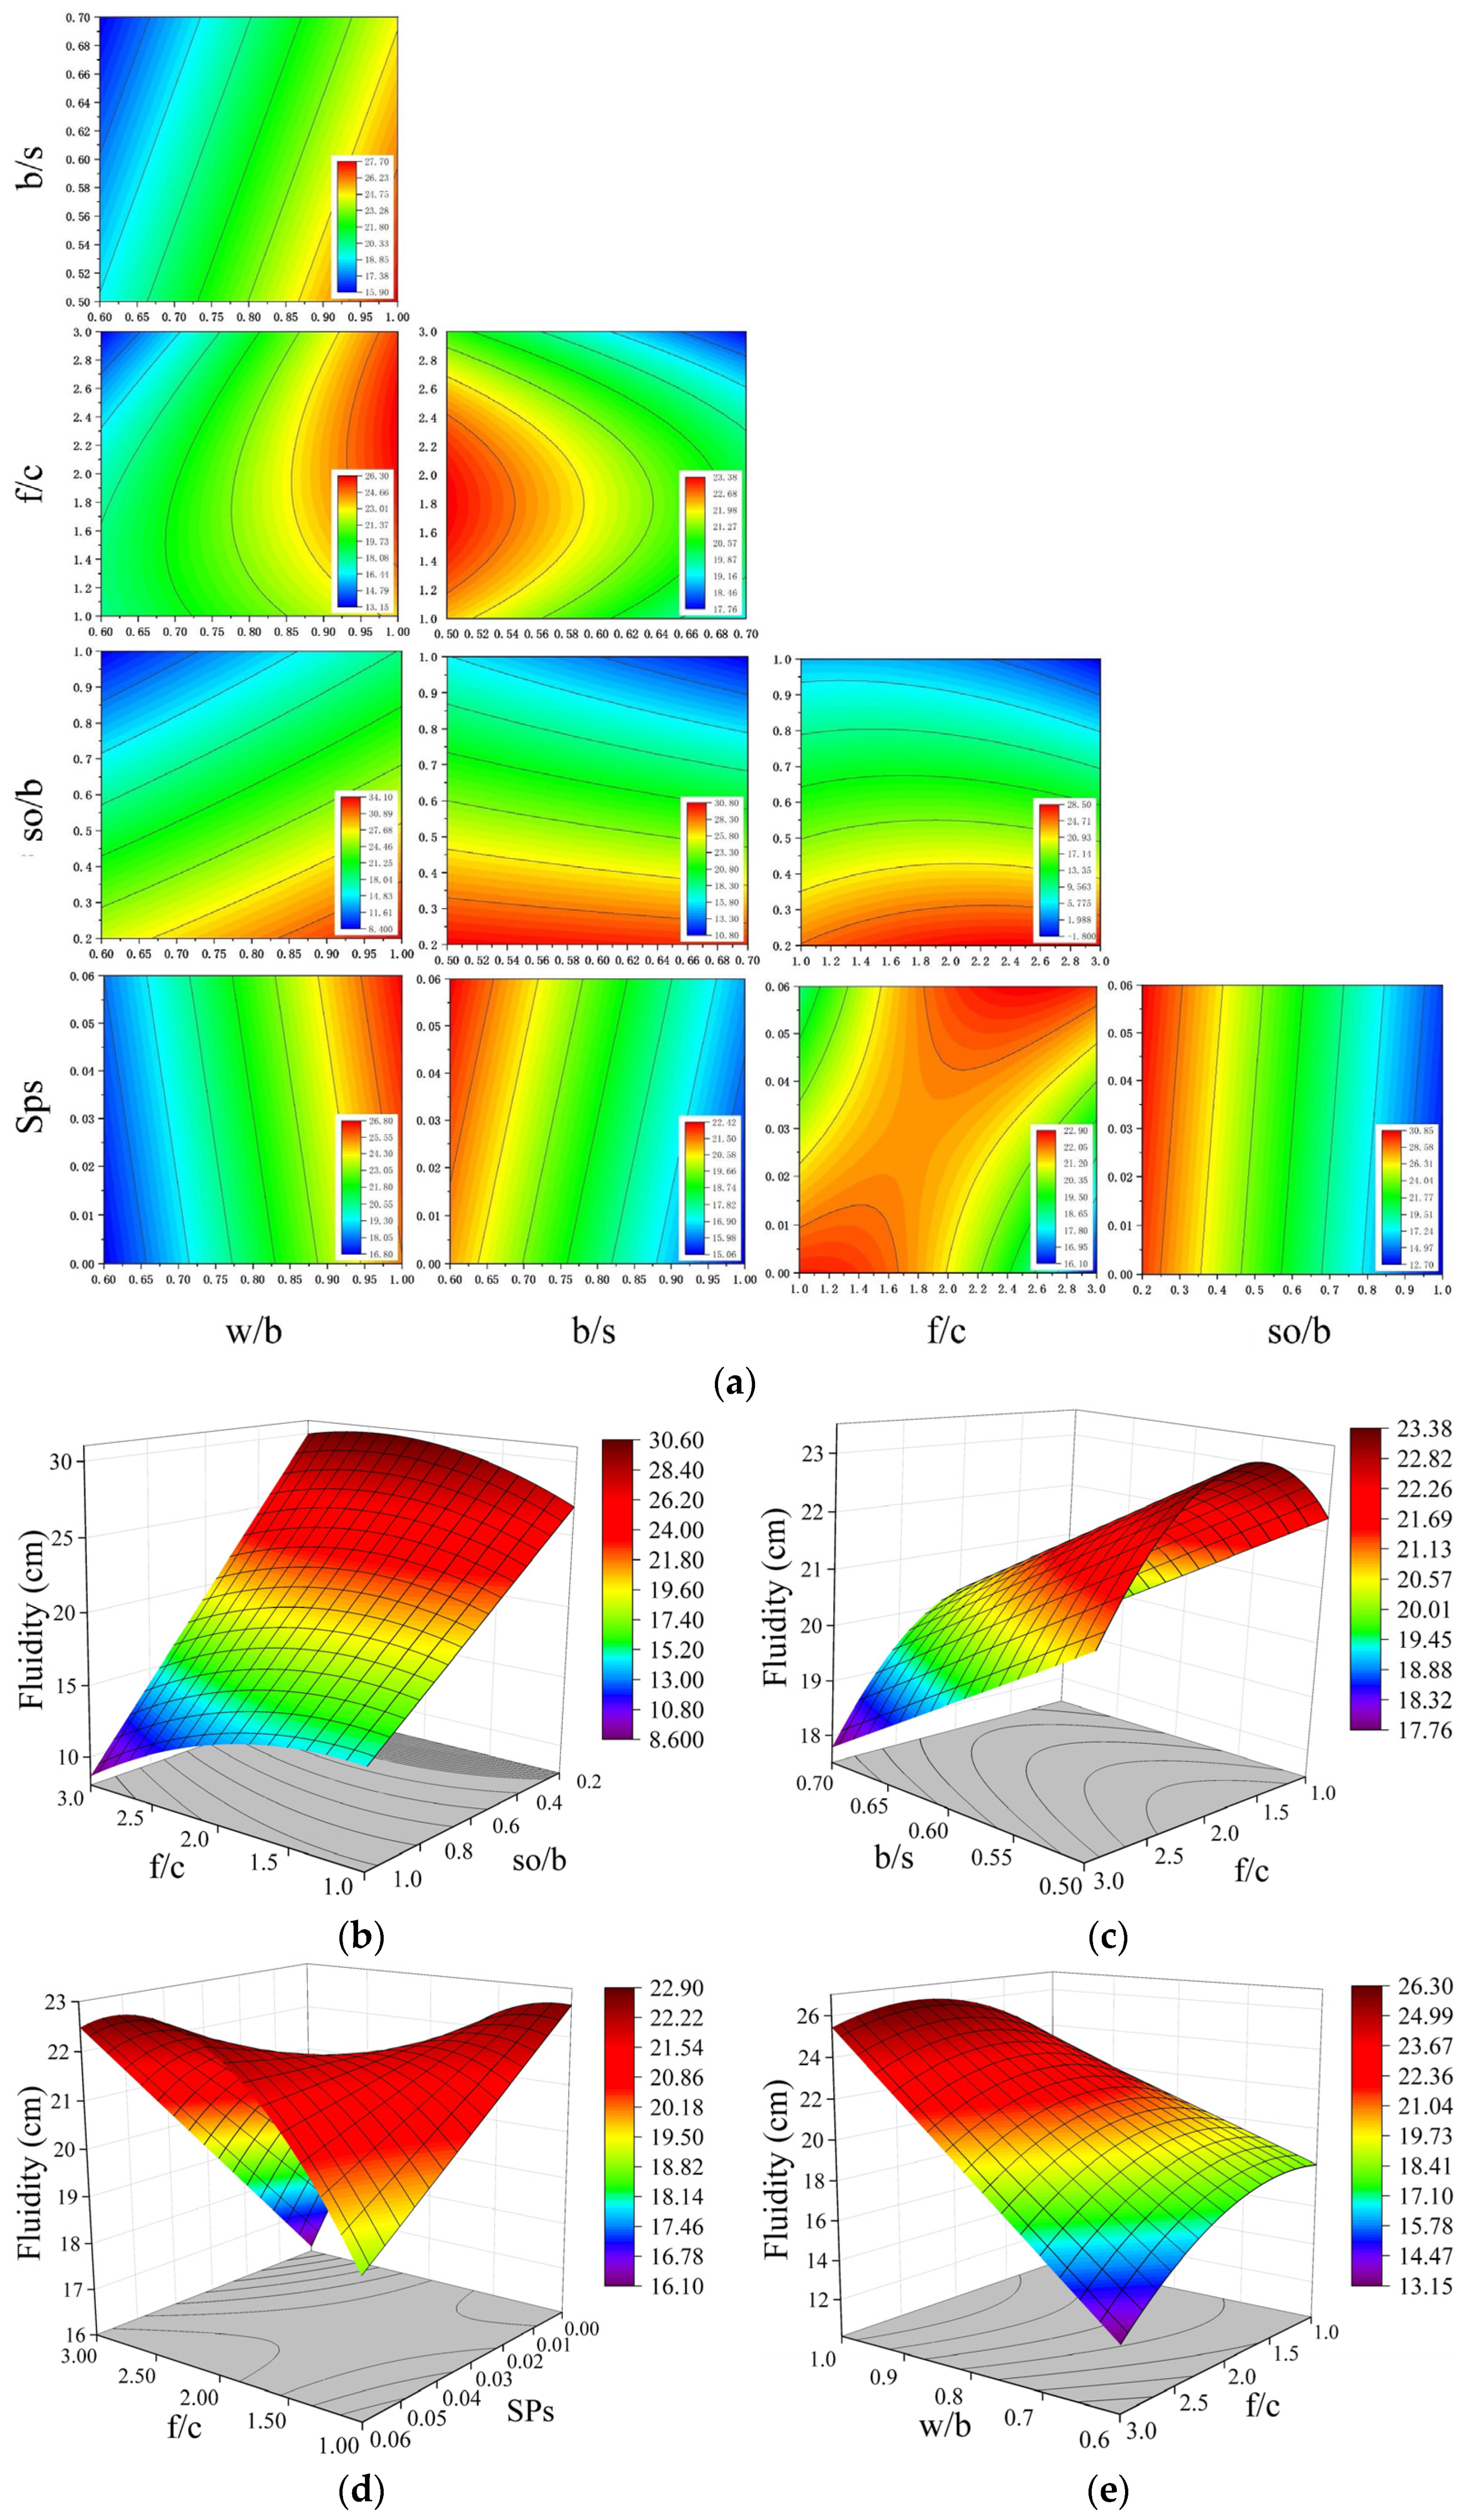
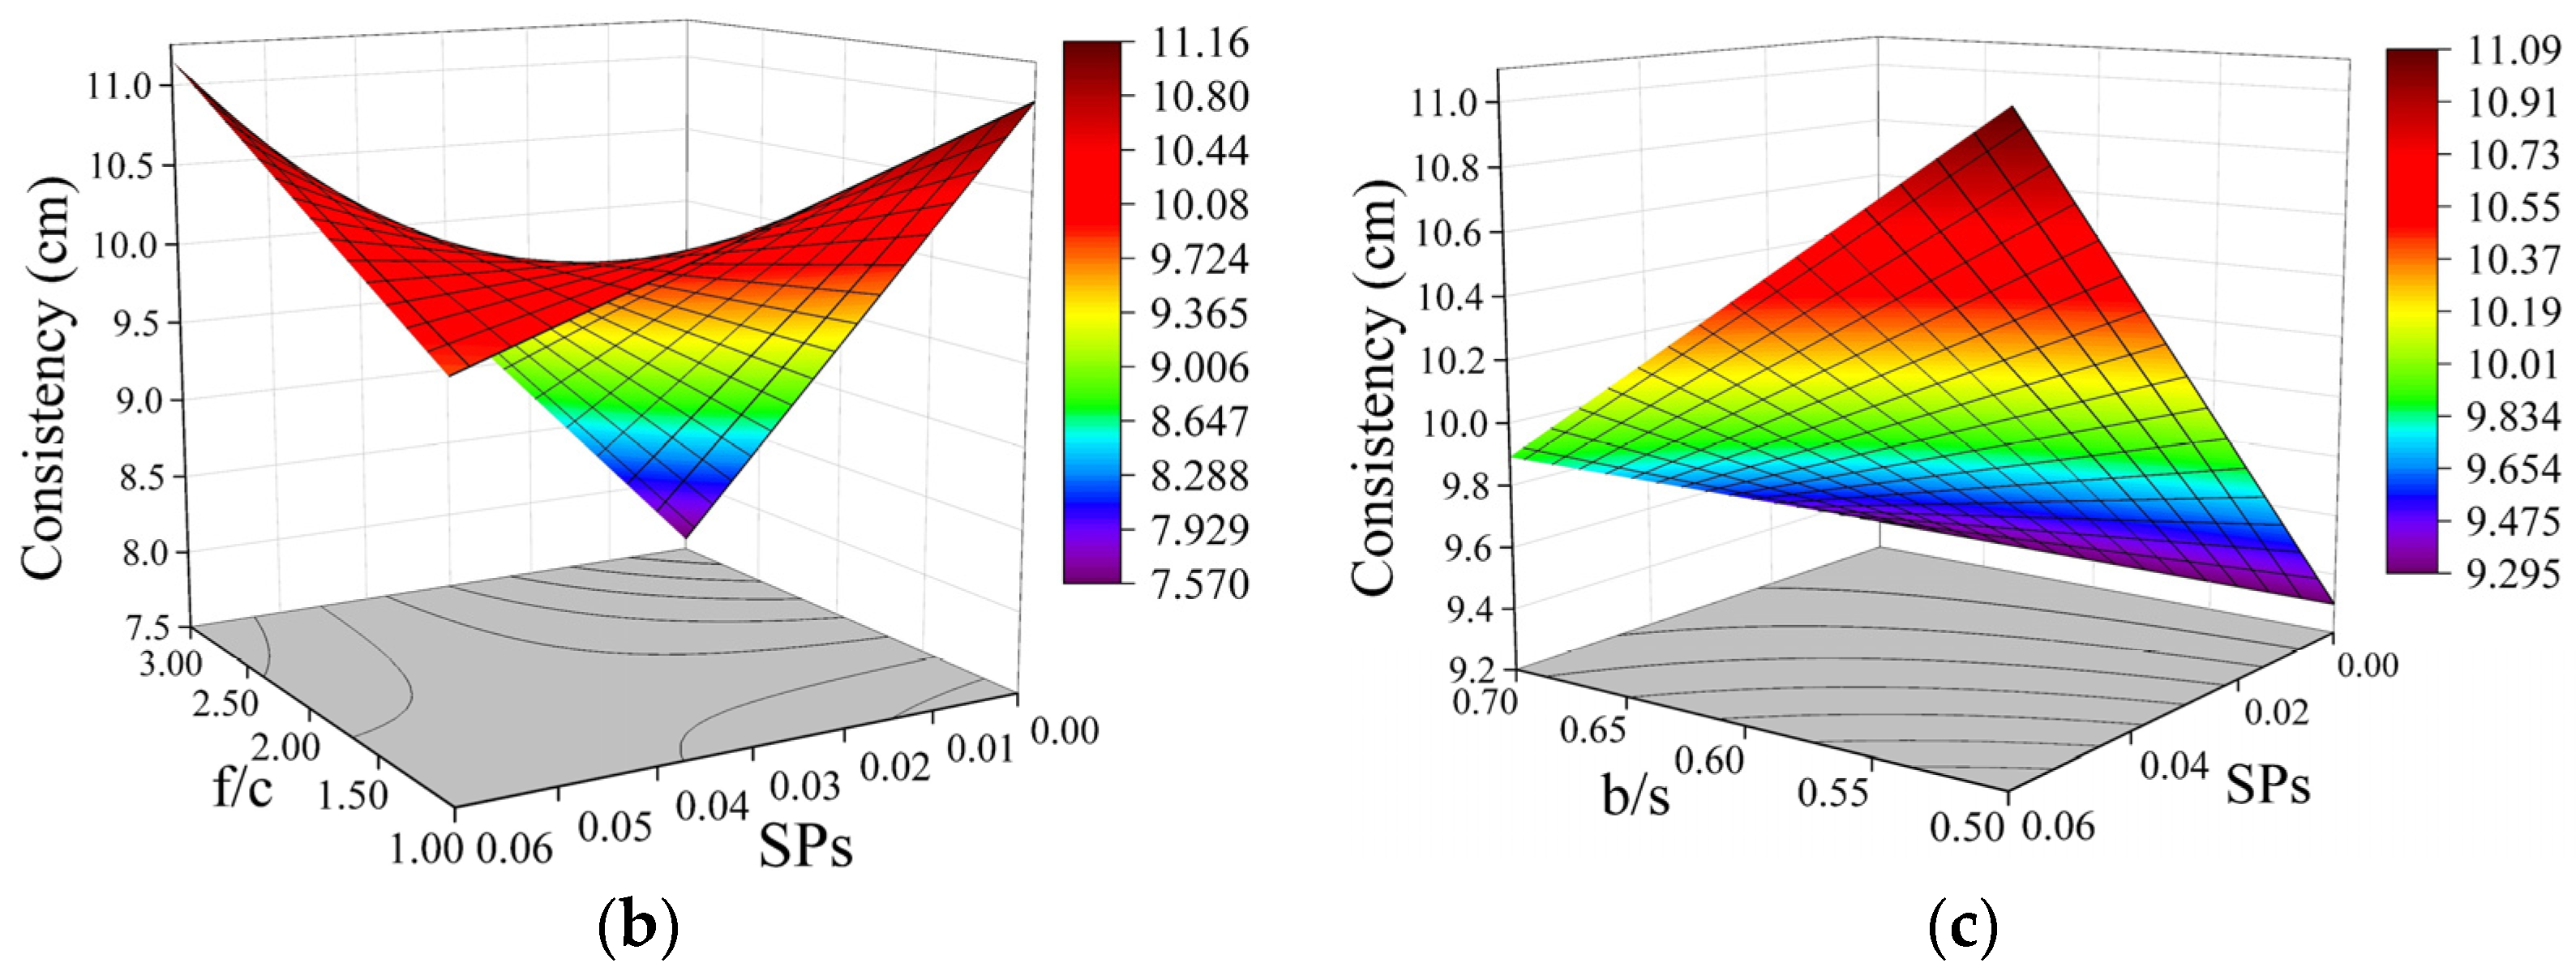
3.3.4. The Interaction Effect of Multiple Factors on Slurry Consistency
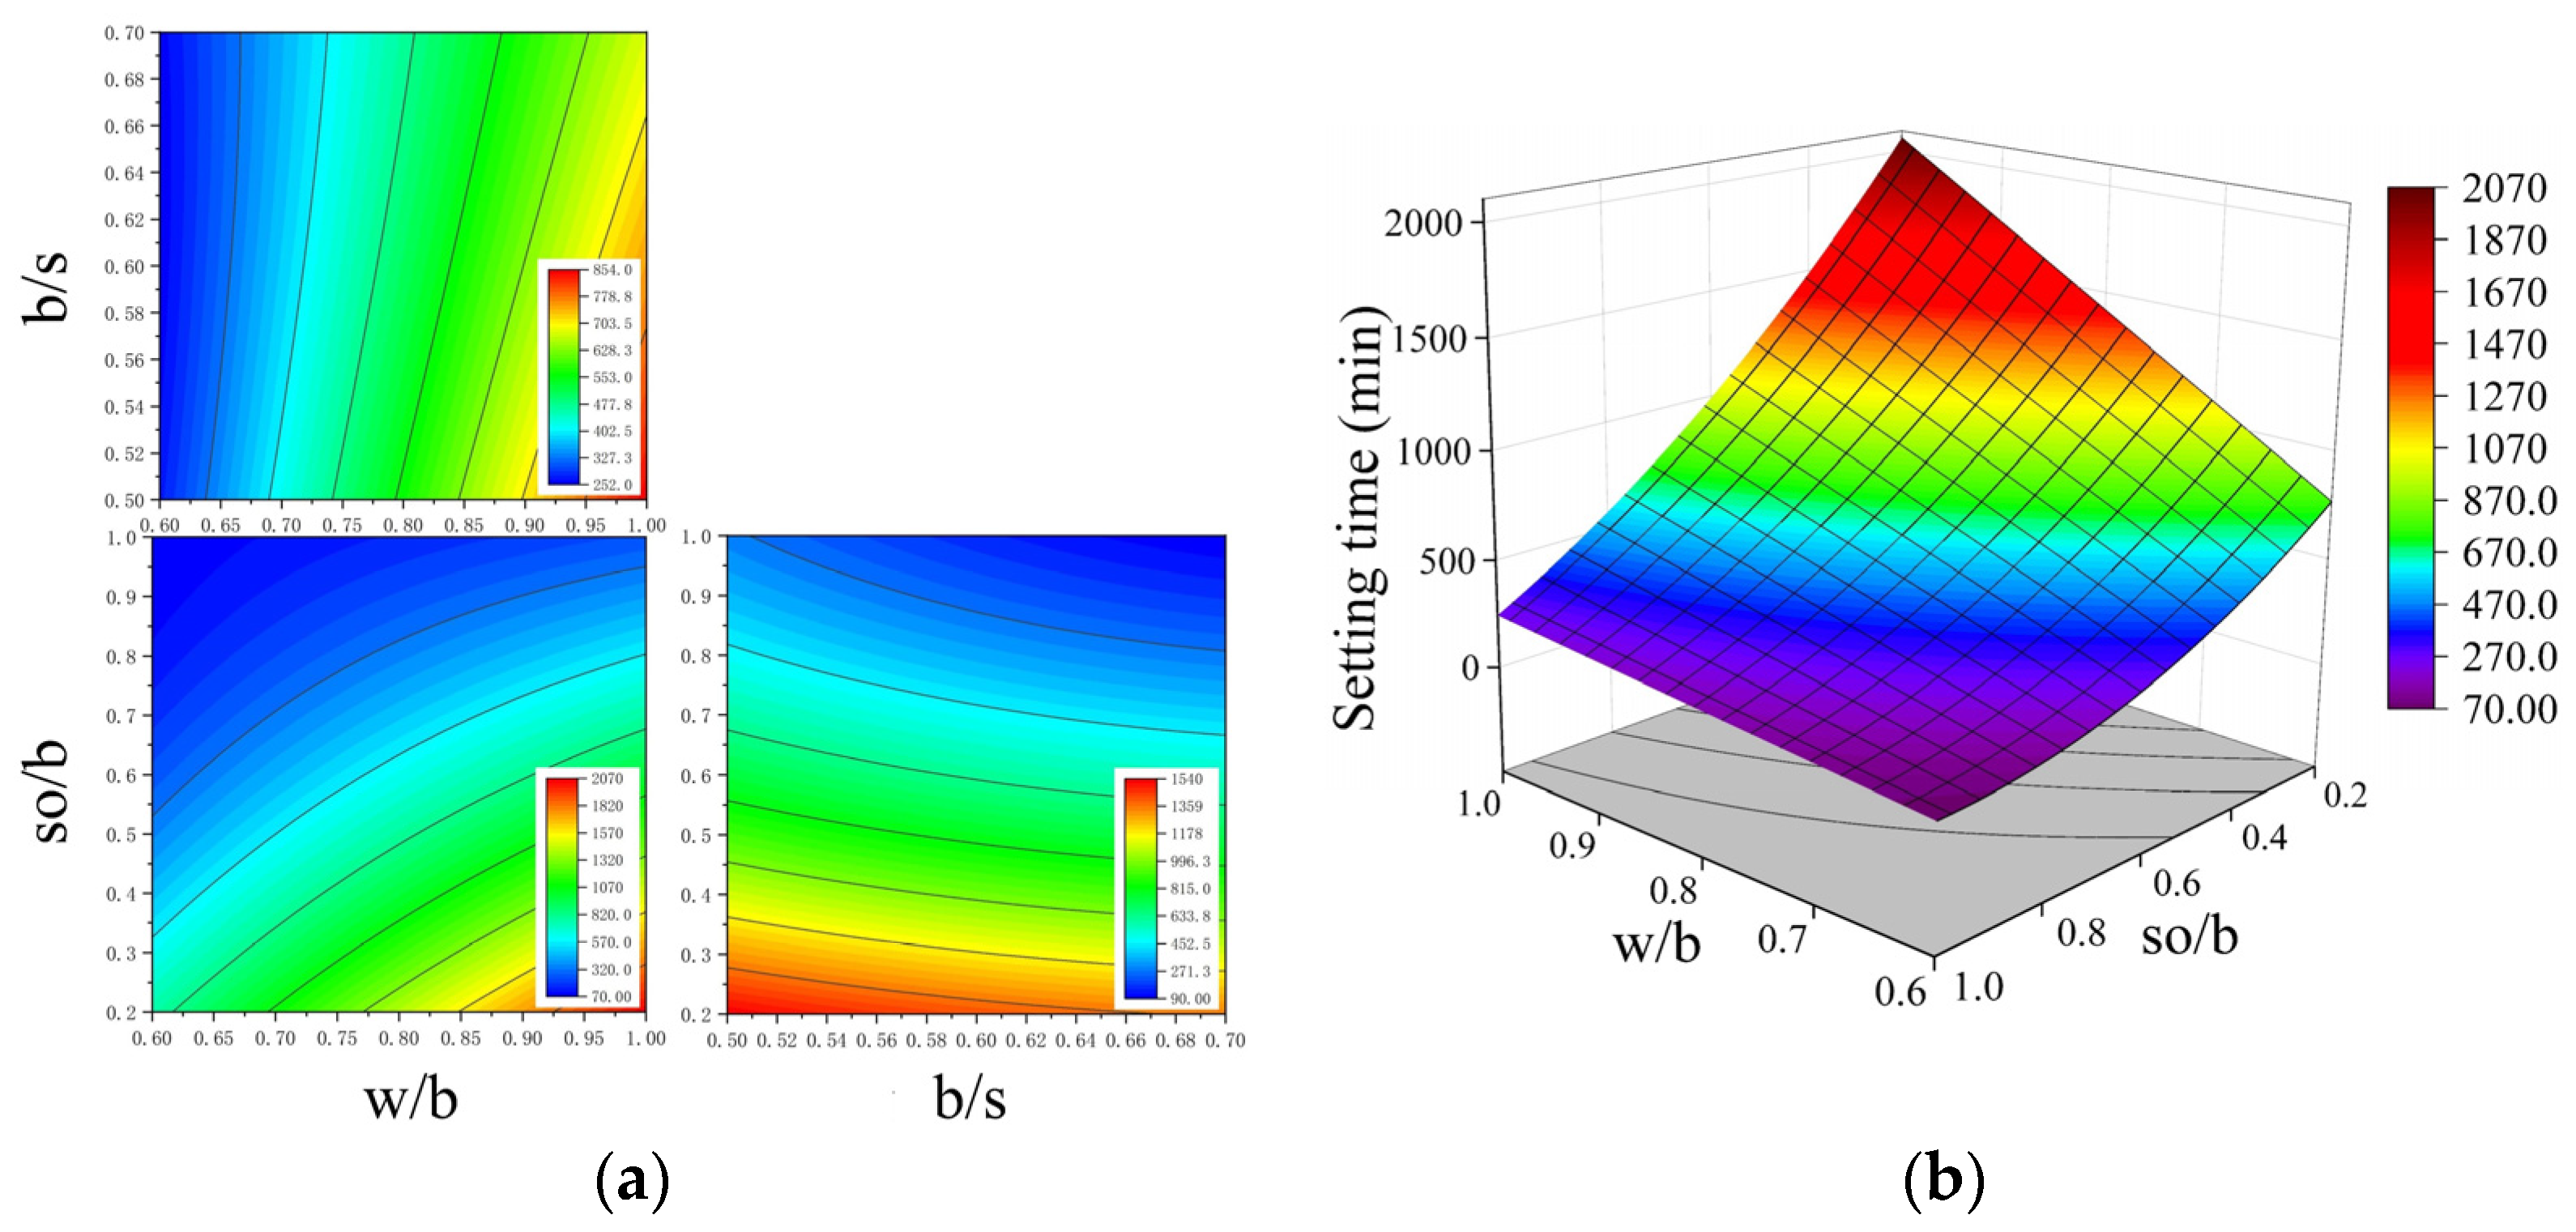
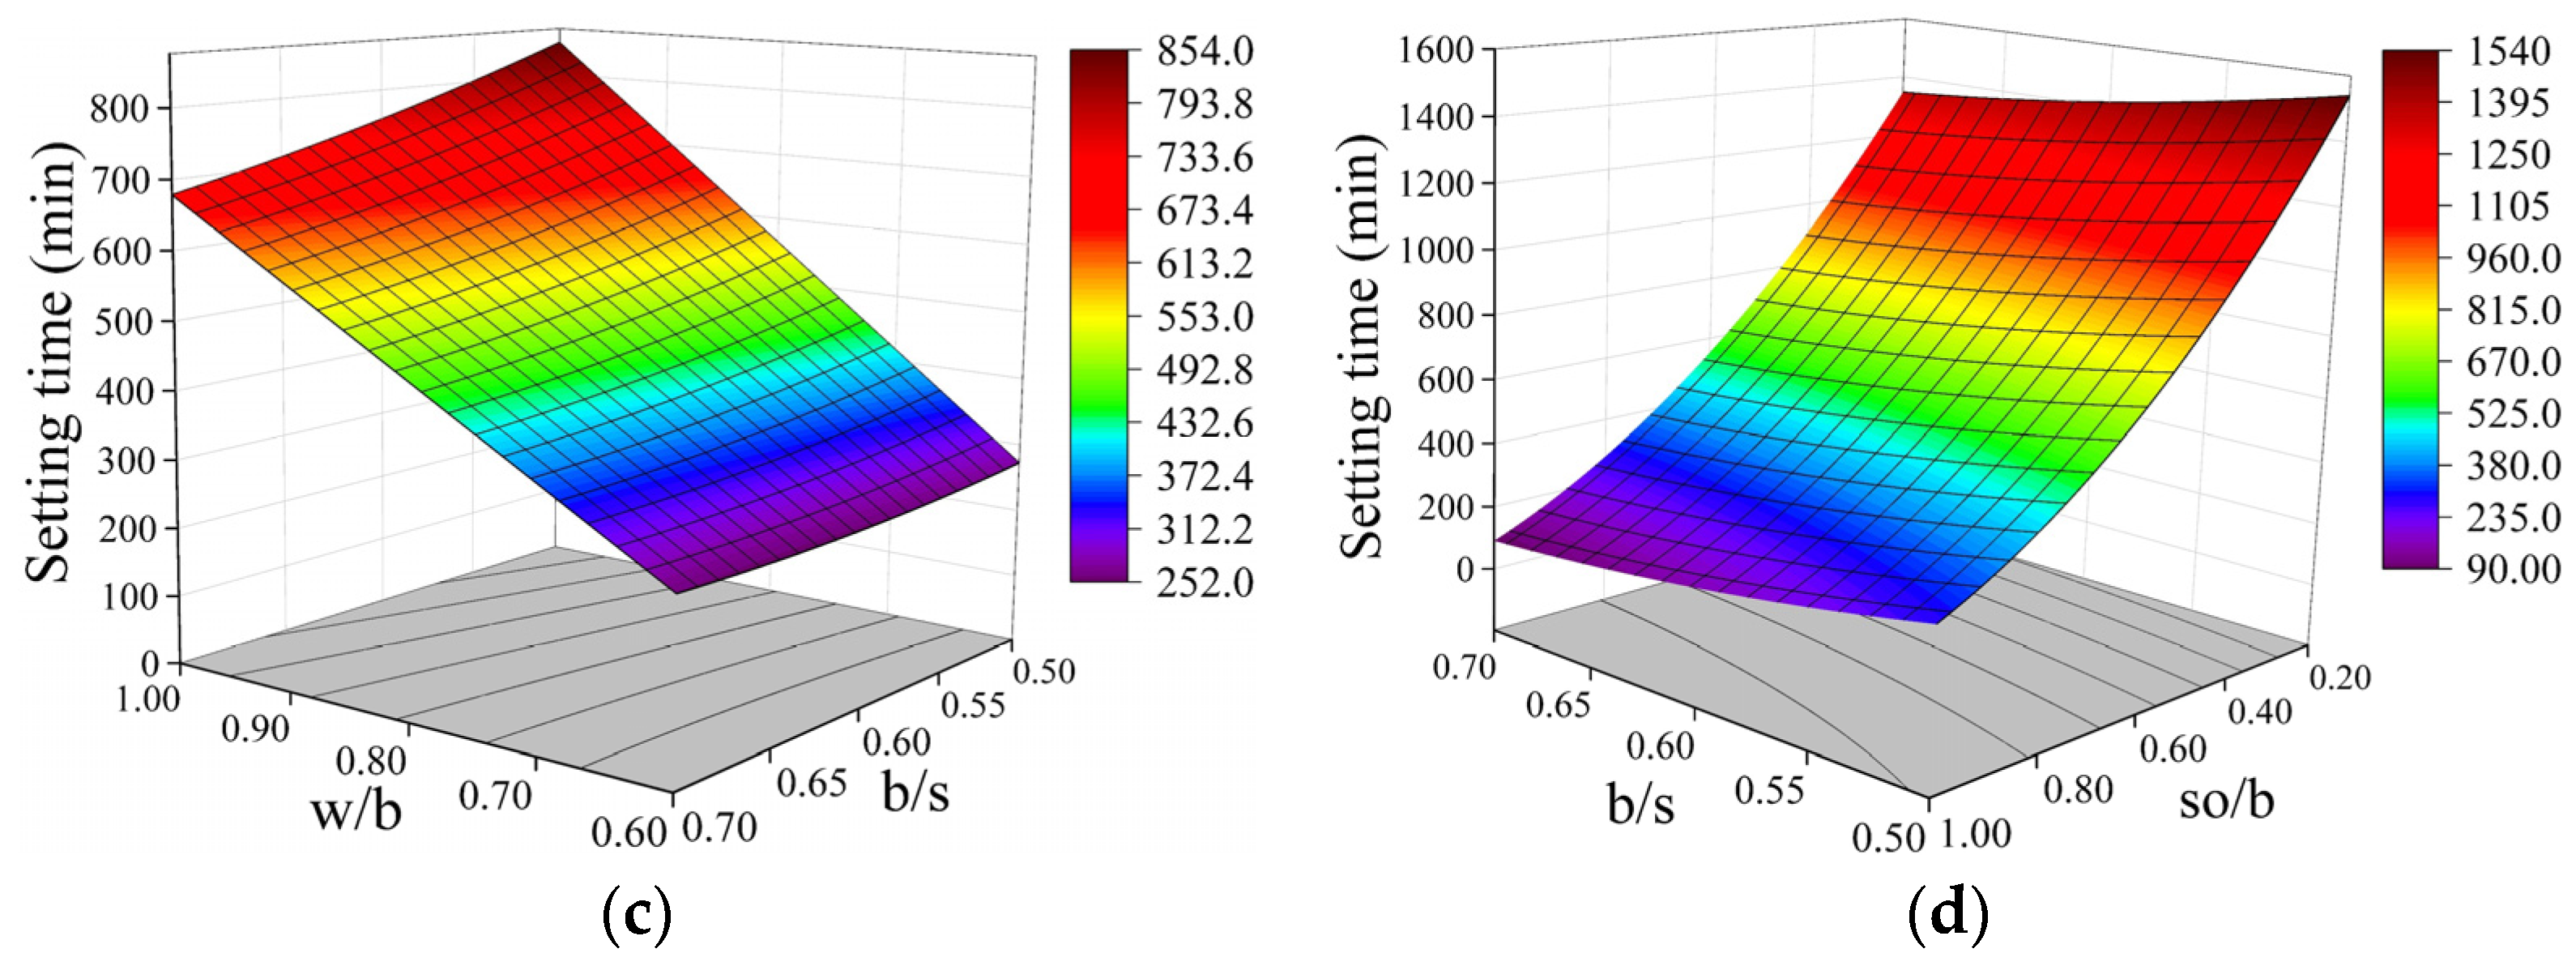
3.3.5. The Interaction Effect of Multiple Factors on Slurry Setting Time
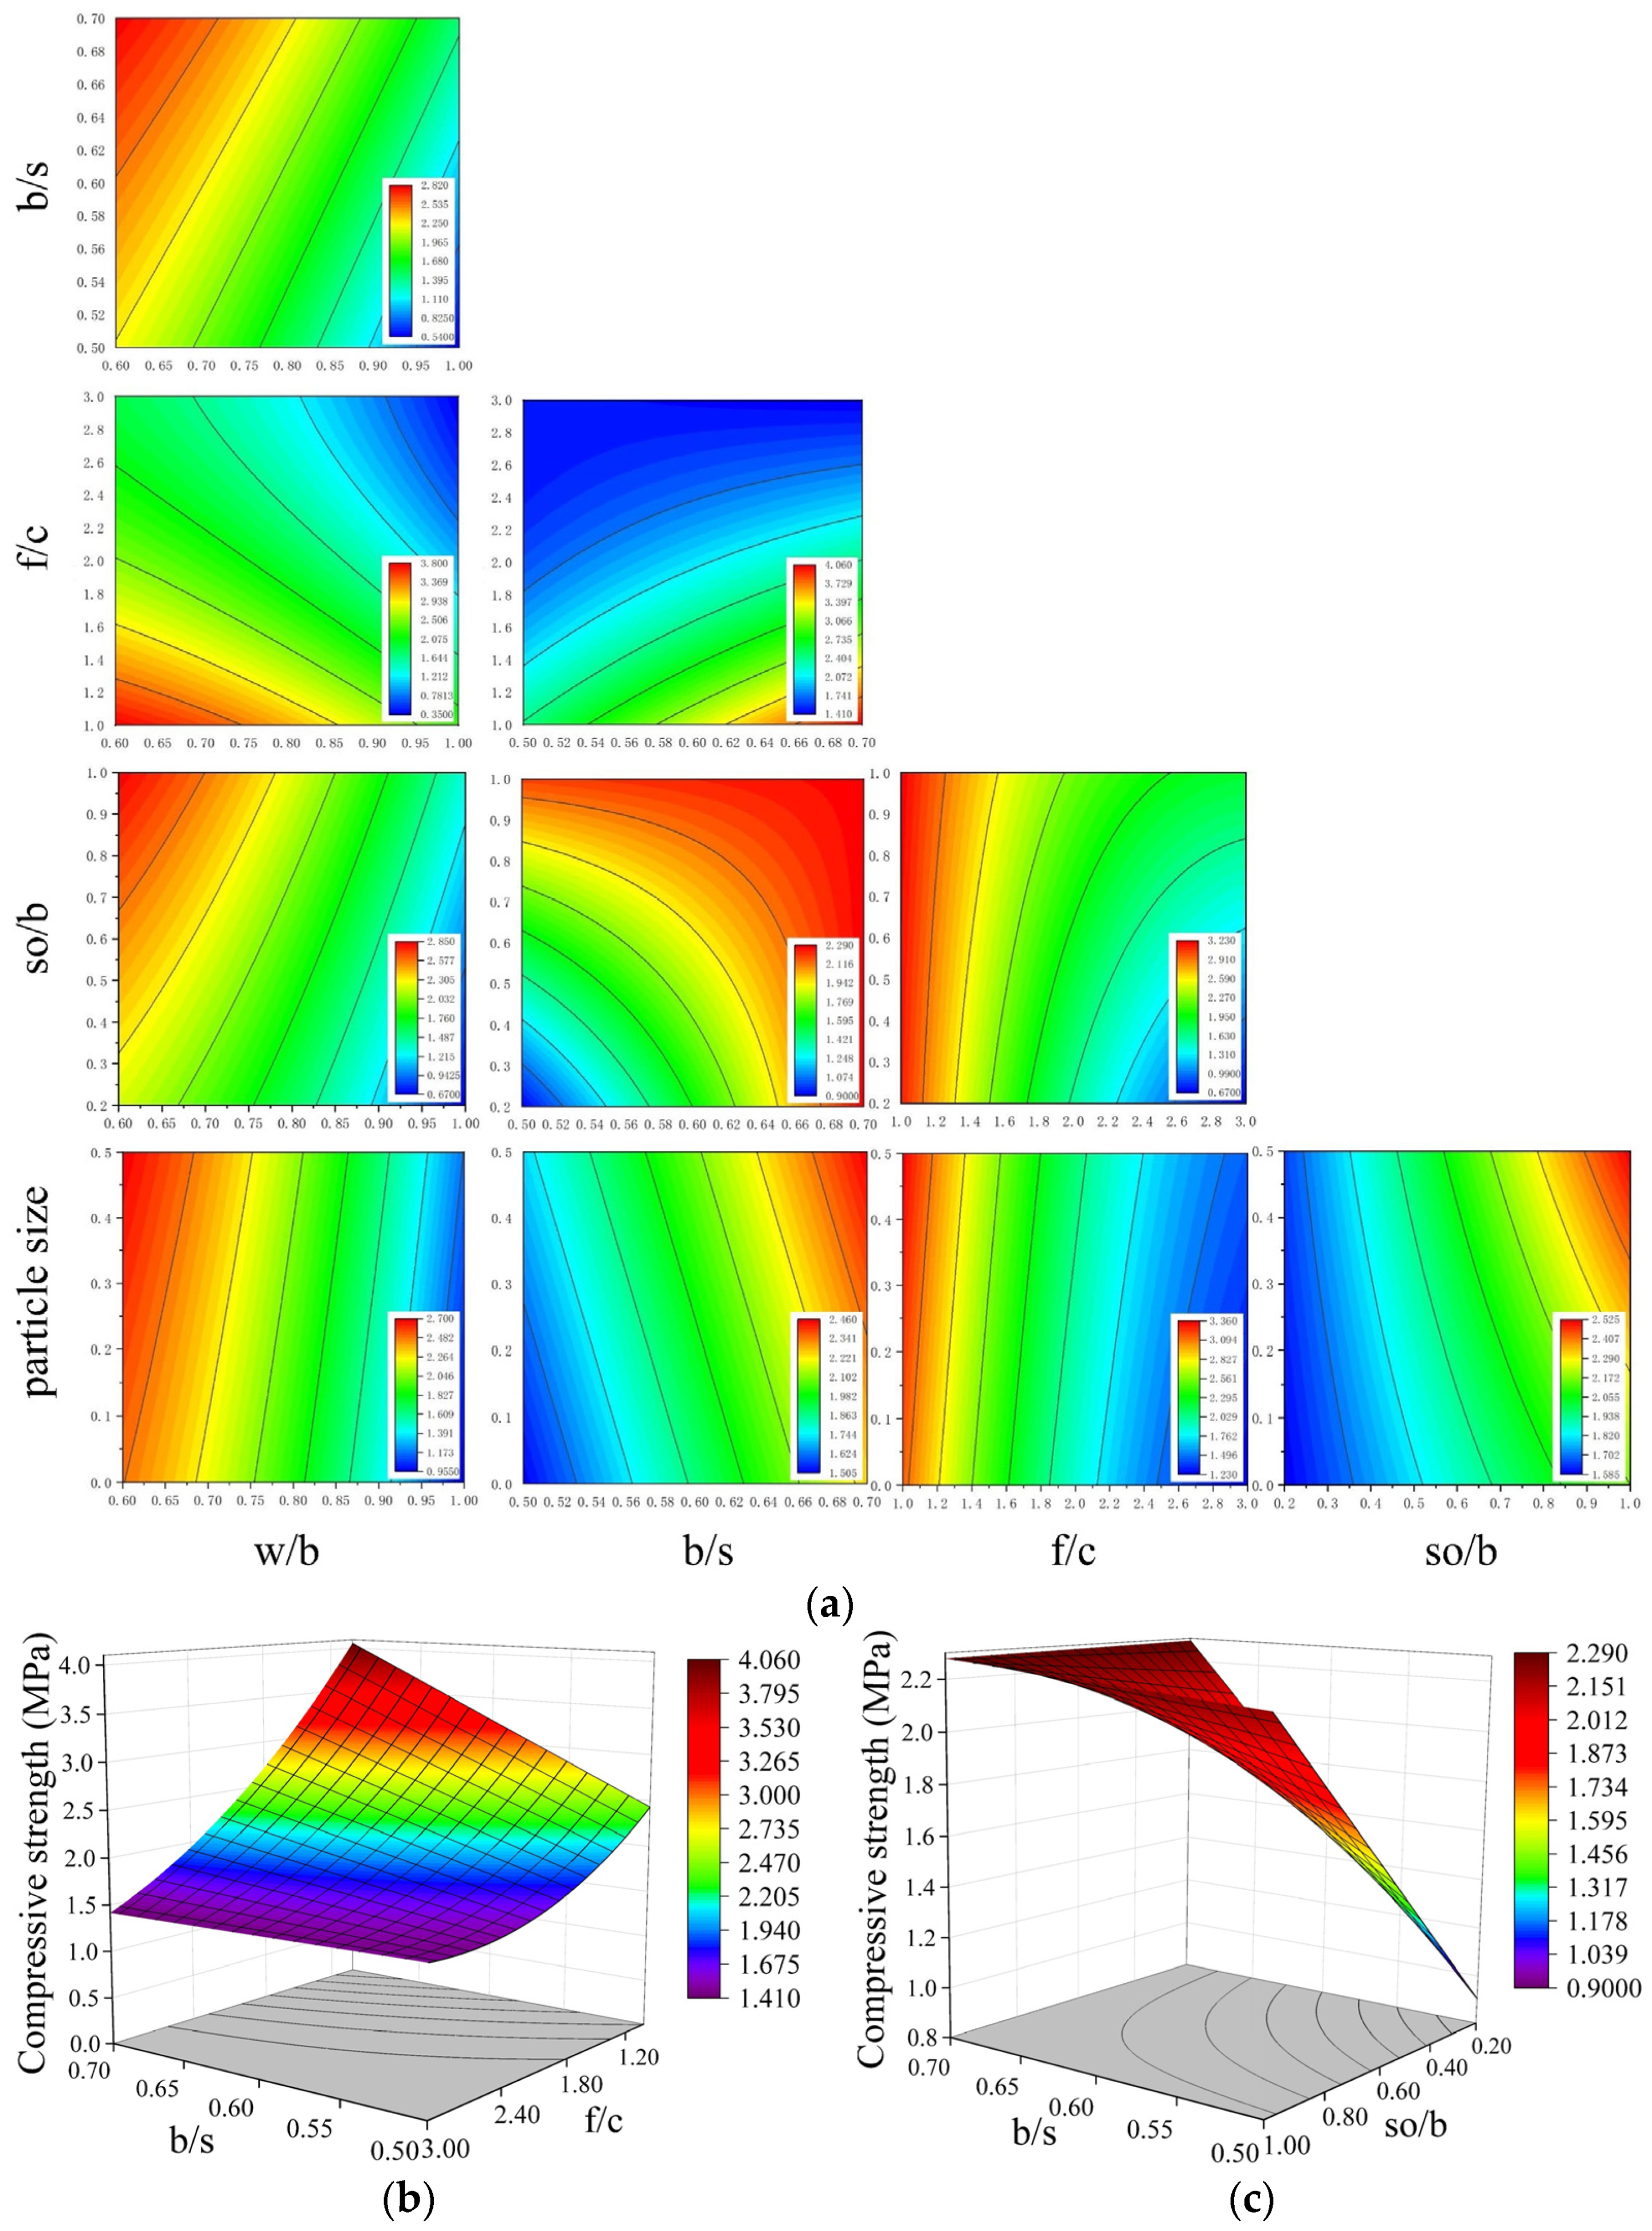
3.3.6. The Interaction Effect of Multiple Factors on Slurry Compressive Strength
4. Optimize the Proportion of the Slurry for Synchronous Grouting
4.1. Model Constrained
4.2. Objective Function
4.3. Solving Model
4.4. Result Verification
5. Discussion
6. Conclusions
Author Contributions
Funding
Institutional Review Board Statement
Informed Consent Statement
Data Availability Statement
Conflicts of Interest
References
- Han, B.M.; Yu, Y.R.; Xi, Z.; Sun, Y.J.; Lu, F.; Li, S.W.; Li, Z.Y.; Huang, S.Q.; Hu, J.F.; Sang, Y.L.; et al. Statistical Analysis of Urban Rail Transit Operations Worldwide in 2023: A Review. Urban Rapid Rail Transit. 2024, 37, 1–9. (In Chinese) [Google Scholar] [CrossRef]
- Xu, G.Y.; Fang, Y.; Wang, Y.B.; Dou, L.P.; Deng, R.Y.; Geng, F.C. Experimental Investigation of the Effects of Aperture Ratio, Chamber Pressure and Soil Conditioning on the Clogging Behavior of EPB Shields. KSCE J. Civ. Eng. 2023, 27, 4508–4519. [Google Scholar] [CrossRef]
- Cheng, W.; Ye, W.; Zheng, X. Soil Improvement Technology and Dynamic Control of a Large Diameter Shield in Sandy Cobble Stratum. Soil Mech. Found. Eng. 2022, 59, 459–466. [Google Scholar] [CrossRef]
- Lee, H.; Kwak, J.; Choi, J.; Hwang, B.; Choi, H. A lab-scale experimental approach to evaluate rheological properties of foam-conditioned soil for EPB shield tunnelling. Tunn. Undergr. Space Technol. 2022, 128, 104667. [Google Scholar] [CrossRef]
- Cao, W.; Zhao, J.; Jiang, Z.Y.; Li, Y.Z.; Che, C. Reuse of Abandoned Shield Mucks Stabilized by a Sustainable Binder: Assessment of Strength, Durability, and Environmental Properties. Buildings 2023, 13, 738. [Google Scholar] [CrossRef]
- Su, X.T.; Yu, L.C.; Chen, J.; Li, H.F.; Liu, Q.; Zhang, H.G.; Liu, T. Mechanical properties and microstructure of SWGA-BF improved rock muck discharged from slurry pressure balanced shield tunnels. Constr. Build. Mater. 2023, 409, 133969. [Google Scholar] [CrossRef]
- Ke Zierkailedi, B.H.; Bian, L.; Wang, X.; Hu, X.; Liu, X.; Zhang, Z. Properties of slurry pressure balanced shield tunnel sand and its application in large flow concrete. Materials 2022, 15, 5131. [Google Scholar] [CrossRef] [PubMed]
- Wang, J.; Fan, Y.; Xiong, X.; Zhao, F. Stabilization of Shield Muck Treated with Calcium Carbide Slag-Fly flash. Buildings 2023, 13, 1707. [Google Scholar] [CrossRef]
- Yin, Y.; Li, B.; Wang, W.; Zhan, L.; Xue, Q.; Gao, Y.; Zhang, N.; Chen, H.; Liu, T.; Li, A. Mechanism of the December 2015 Catastrophic Landslide at the Shenzhen Landfill and Controlling Geotechnical Risks of Urbanization. Engineering 2016, 2, 230–249. [Google Scholar] [CrossRef]
- Huang, F.C.; Li, S.H.; Liu, Y. Research on Stratum Reinforcement and Resource Utilization Technology of Shield-Discarded Soil Based on New Cementitious Materials. J. Test. Eval. 2023, 51, JTE20220481. [Google Scholar] [CrossRef]
- Zhu, K.F.; Zhang, Y.Y.; Xue, Z.F.; Hu, D.; Zhang, K.N. Environmental issues and green treatment of shield. Urban. Archit. 2018, 29, 108–110. [Google Scholar] [CrossRef]
- Saing, Z.; Samang, L.; Harianto, T.; Patanduk, J. Study on Characteristic of Laterite Soil with Lime Stabilization as a Road Foundation. Int. J. Appl. Eng. Res. 2017, 12, 4687–4693. [Google Scholar]
- Gertsch, L.; Fjeld, A.; Nilsen, B.; Gertsch, R. Use of TBM Muck as Construction Material. Tunn. Undergr. Space Technol. 2000, 15, 379–402. [Google Scholar] [CrossRef]
- Wu, J.Y.; Lee, M.Z. Beneficial reuse of construction surplus clay in CLSM. Int. J. Pavement Res. Technol. 2011, 4, 293–300. [Google Scholar] [CrossRef]
- Lee, K.; Kim, J. Performance evaluation of modified marine dredged soil and recycled in-situ soil as controlled low strength materials for underground pipe. KSCE J. Civ. Eng. 2013, 17, 674–680. [Google Scholar] [CrossRef]
- Finney, A.J.; Shorey, E.F.; Anderson, J. Use of native soil in place of aggregate in controlled low strength material (CLSM). In Proceedings of the Pipelines 2008: Pipeline Asset Management: Maximizing Performance of our Pipeline Infrastructure, Atlanta, GA, USA, 22–27 July 2008; American Society of Civil Engineers: Reston, VA, USA, 2008; pp. 1–13. [Google Scholar] [CrossRef]
- Ling, T.C.; Kaliyavaradhan, S.K.; Poon, C.S. Global perspective on application of controlled low-strength material (CLSM) for trench backfilling-An overview. Constr. Build. Mater. 2018, 158, 535–548. [Google Scholar] [CrossRef]
- Yang, D.; Xi, Z.Q.; Chen, Q.; Li, S.S. Mechanical properties of tunnel muck with fly-ash geopolymer. Adv. Civ. Eng. 2020, 2020, 1–10. [Google Scholar] [CrossRef]
- Abu-Taqa, A.G.; Al-Ansari, M.; Taha, R.; Senouci, A.; Al-Marwani, H.A.; Al-Zubi, G.M.; Mohsen, M.O. Characterization of TBM Muck for Construction Applications. Appl. Sci. 2021, 11, 8623. [Google Scholar] [CrossRef]
- Chen, S.B.; Jiang, H.; Xing, H.T.; Wang, J.; Huang, Y.L.; Wei, G.B.; Zhang, Y.J.; Hou, D.S. Research on Preparation and Performance of Clay-Based Shield Tunnel Nonsintered Bricks. Adv. Mater. Sci. Eng. 2021, 2021, 8186851. [Google Scholar] [CrossRef]
- Seco, A.; Omer, J.; Marcelino, S.; Espuelas, S.; Prieto, E. Sustainable Unfired Bricks Manufacturing from Construction and Demolition Wastes. Constr. Build. Mater. 2018, 167, 154–165. [Google Scholar] [CrossRef]
- Zhang, C.; Liu, X.; Fu, J.; Yang, J.; Li, L.; Xie, Y. Evaluating the feasibility of muck from slurry pressure balanced shield tunnels as a growth medium for landscaping. Air Waste Manage. Assoc. 2022, 72, 455–462. [Google Scholar] [CrossRef] [PubMed]
- Ayati, B.; Ferrándiz-Mas, V.; Newport, D.; Cheeseman, C. Use of clay in the manufacture of lightweight aggregate. Constr. Build. Mater. 2018, 162, 124–131. [Google Scholar] [CrossRef]
- Zhang, D.; Fang, Q.; Lou, H. Grouting techniques for the unfavorable geological conditions of Xiang’ an subsea tunnel in China. J. Rock Mech. Geotech. Eng. 2014, 6, 438–446. [Google Scholar] [CrossRef]
- Yu, H. Tests on the Vacuum-Aided Casting Technique for Concrete in Tubes of Concrete-Filled Steel Tube Arch Bridges and Its Engineering Applications. Struct. Eng. Int. 2018, 28, 28–34. [Google Scholar] [CrossRef]
- Liu, J.W.; Feng, H.; Zhang, Y.X.; Zheng, K.Q. Performance Investigation of Geopolymer Grouting Material with Varied Mix Proportions. Sustainability 2022, 14, 13046. [Google Scholar] [CrossRef]
- Li, W.; Shaikh, F.U.A.; Wang, L.; Lu, Y.; Wang, B.; Jiang, C.; Su, Y. Experimental Study on Shear Property and Rheological Characteristic of Superfine Cement Grouts with Nano-SiO2 Addition. Constr. Build. Mater. 2019, 228, 117046. [Google Scholar] [CrossRef]
- Zhou, S.; Li, X.; Ji, C.; Xiao, J. Back-fill grout experimental test for discharged soils reuse of the large-diameter size slurry pressure balanced shield tunnel. KSCE J. Civ. Eng. 2017, 21, 725–733. [Google Scholar] [CrossRef]
- Wang, T. Experiment of shield synchronized grouting slurry using waste sand in sand layer. Appl. Mech. Mater. 2014, 638, 1600–1605. [Google Scholar] [CrossRef]
- Zhang, J.; Lu, S.; Feng, T.; Yi, B.; Liu, J. Research on reuse of silty fine sand in backfill grouting material and optimization of backfill grouting material proportions. Tunn. Undergr. Space Technol. 2022, 130, 104751. [Google Scholar] [CrossRef]
- Cui, Y.; Tan, Z. Experimental study of high performance synchronous grouting materials prepared with clay. Materials 2021, 14, 1362. [Google Scholar] [CrossRef]
- Wang, X.; Zhang, Y.D.; Zhao, W.; Wang, Z.P.; Wang, Z.G.; Wang, Y. Research on optimizing performance of new slurries for EPBS soil conditioning based on response surface method. Constr. Build. Mater. 2023, 375, 130818. [Google Scholar] [CrossRef]
- Wang, X.; Zhao, W.; Liu, K.Q.; Li, S.G.; He, P.; Qi, P. Experimental study on the workability of sands conditioned with bentonite-silty clay modified slurry. Constr. Build. Mater. 2024, 439, 137352. [Google Scholar] [CrossRef]
- Zhang, C.; Yang, J.; Fu, J.; Wang, S.; Yin, J.; Xie, Y. Recycling of discharged soil from EPB shield tunnels as a sustainable raw material for synchronous grouting. J. Clean. Prod. 2020, 268, 121947. [Google Scholar] [CrossRef]
- Wang, X.; Zhao, W.; Wang, Z.; Wang, Z.; Sun, D.; Tang, X. Recycling the Discharged Soil from EPBS Tunnels as a Soil Conditioner and Its Rheological Behaviors. J. Clean. Prod. 2023, 418, 138224. [Google Scholar] [CrossRef]
- Xu, J.; Xiao, C.; Wu, H.-N.; Kang, X. Reuse of Excavated Clayey Silt in Cement–Fly Ash–Bentonite Hybrid Back-fill Grouting during Shield Tunneling. Sustainability 2020, 12, 1017. [Google Scholar] [CrossRef]
- Zhang, K.J.; Zhang, Z.Q.; Chen, H.; Hu, Z.C. Experimental investigation on rheological properties and diffusion-related performance of clay shock slurry for excavation gap filling during shield tunnelling. Tunn. Undergr. Space Technol. 2024, 146, 105660. [Google Scholar] [CrossRef]
- Wang, J.; Fan, K.; Du, J.; Xu, J.; Dong, X.; Li, X.; Ding, Y. Effect of organosilicon modified epoxy resin on slurry viscosity and mechanical properties of polyurethane grouting materials. Constr. Build. Mater. 2023, 387, 131585. [Google Scholar] [CrossRef]
- GB/T 1346-2011; Test Methods for Water Requirement of Normal Consistency, Setting Time and Soundness of the Portland Cement. Inspection and Quarantine of the People’s Republic of China: Beijing, China, 2011.
- GB/T 1596-2017; Fly Flash Used for Cement and Concrete. General Administration of Quality Supervision, Inspection and Quarantine of the People’s Republic of China: Beijing, China, 2017.
- JGJ 52-2006; Standard for Technical Requirements and Test Method of Sand and Crushed Stone (or Gravel) for Ordinary Concrete. Standardization Administration of the People’s Republic of China: Beijing, China, 2006.
- Jiang, Y.L.; Xu, Z.Z.; Geng, D.X.; Dong, J.L.; Liao, Y.Q. Optimization of grouting material for shield tunnel antifloating in full-face rock stratum in Nanchang metro construction in China. Int. J. Geomech. 2022, 22, 04022009. [Google Scholar] [CrossRef]
- Fang, K.T.; Ma, C.X. Orthogonal and Uniform Experimental Design; China Science Publing & Media Ltd.: Beijing, China, 2001. [Google Scholar]
- T/CECS 563-2018; Technical Specification for Simultaneous Grouting Material in Shield Projects. Standardization Administration of the People’s Republic of China: Beijing, China, 2018.
- Yim, H.J.; Kim, J.H.; Kwak, H.G. Experimental simulation of bleeding under a high concrete column. Cem. Concr. Res. 2014, 57, 61–69. [Google Scholar] [CrossRef]
- JGJ/T 70-2009; Standard for Test Method of Basic Properties of Construction Mortar. Standardization Administration of the People’ s Republic of China: Beijing, China, 2009.
- Cao, Z.Z.; Jia, Y.L.; Li, Z.H.; Du, F. Research on slurry diffusion and seepage law in mining overburden fractures based on CFD numerical method. Sci. Rep. 2023, 13, 21302. [Google Scholar] [CrossRef]
- GB/T 2419-2005; Test Method for Fluidity of Cement Mortar. Standardization Administration of the People’s Republic of China: Beijing, China, 2005.
- Bala, N.; Napiah, M.; Kamaruddin, I. Nanosilica composite asphalt mixtures performance-based design and optimisation using response surface methodology. Int. J. Pavement Eng. 2020, 21, 29–40. [Google Scholar] [CrossRef]
- Khan, M.I.; Sutanto, M.H.; Bin Napiah, M.; Khan, K.; Rafiq, W. Design optimization and statistical modeling of cementitious grout containing irradiated plastic waste and silica fume using response surface methodology. Constr. Build. Mater. 2021, 271, 121504. [Google Scholar] [CrossRef]
- Zhang, C.; Yang, J.; Ou, X.; Fu, J.; Xie, Y.; Liang, X. Clay dosage and water/cement ratio of clay-cement grout for optimal engineering performance. Appl. Clay Sci. 2018, 163, 312–318. [Google Scholar] [CrossRef]
- Sha, F.; Li, S.; Liu, R.; Li, Z.; Zhang, Q. Experimental study on performance of cement-based grouts admixed with fly flash, bentonite, superplasticizer and water glass. Constr. Build. Mater. 2018, 161, 282–291. [Google Scholar] [CrossRef]
- Venkiteela, G.; Sun, Z. In situ observation of cement particle growth during setting. Cem. Concr. Compos. 2010, 32, 211–218. [Google Scholar] [CrossRef]
- Zheng, J.J.; Zhang, J.; Scherer, G.W. Prediction of the degree of hydration at initial setting time of cement paste with particle agglomeration. Cem. Concr. Res. 2012, 42, 1280–1285. [Google Scholar] [CrossRef]
- Myers, R.H. Response surface methodology-current status and future directions. J. Qual. Tech. 1999, 31, 30–44. [Google Scholar] [CrossRef]
- Ni, Z.; Wang, S.; Zheng, X. Application of geopolymer in synchronous grouting for reusing of the shield muck in silty clay layer. Constr. Build. Mater. 2024, 419, 135345. [Google Scholar] [CrossRef]
- GB/T 2419-2007; Bentonite. Standardization Administration of the People’s Republic of China: Beijing, China, 2007.
- Liang, X.; Ying, K.; Ye, F.; Su, E.; Xia, T.; Han, X. Selection of Backfill Grouting Materials and Ratios for Shield Tunnel Considering Stratum Suitability. Constr. Build. Mater. 2022, 314, 125431. [Google Scholar] [CrossRef]


| Physical Parameter | Water Content | Density | Dry Density | Void Ratio | Saturation | Liquid Limit | Plastic Limit |
|---|---|---|---|---|---|---|---|
| Value | 23.7% | 1.95 g/cm3 | 1.58 g/cm3 | 41.6% | 87.2% | 32.5% | 19.4% |
| Chemical Constituent | SiO2 | Al2O3 | Fe2O3 | CaO | MgO | Na2O | K2O |
|---|---|---|---|---|---|---|---|
| Content | 67.75% | 12.79% | 5.34% | 6.42% | 2.35% | 1.74% | 2.28% |
| Chemical Constituent | CaO | SiO2 | Al2O3 | Fe2O3 | MgO | SO3 | LOI |
|---|---|---|---|---|---|---|---|
| Content | 65.81% | 18.32% | 1.72% | 5.41% | 3.48% | 2.45% | <4% |
| Chemical Constituent | SiO2 | Al2O3 | Fe2O3 | CaO | MgO | SO3 | Na2O | K2O | LOI |
|---|---|---|---|---|---|---|---|---|---|
| Content | 49.23% | 30.17% | 3.86% | 5.41% | 2.46% | 3.00% | 2.66% | 1.28% | 1.93% |
| No. | Ratio Level | w/b | b/s | f/c | so/b | Particle Size | SPs |
|---|---|---|---|---|---|---|---|
| 1 | −2 | 0.6 | 0.5 | 1 | 0.2 | 0.5 mm–0.3 mm | 0 |
| 2 | −1 | 0.7 | 0.55 | 1.5 | 0.4 | 0.3 mm–0.1 mm | 1.5% |
| 3 | 0 | 0.8 | 0.6 | 2 | 0.6 | 0.1 mm–0.075 mm | 3% |
| 4 | 1 | 0.9 | 0.65 | 2.5 | 0.8 | 0.075 mm–0.0385 mm | 4.5% |
| 5 | 2 | 1 | 0.7 | 3 | 1.0 | 0.0385 mm–0 mm | 6% |
| No. | w/b | b/s | f/c | so/b | Particle Size | SPs | Sequence Combination | Density (g/cm3) | Setting Time (h) | Bleeding Rate | Fluidity (cm) | Consistency (cm) | Strength (MPa) |
|---|---|---|---|---|---|---|---|---|---|---|---|---|---|
| 1 | 0.6 | 0.55 | 3 | 0.6 | 0.5–0.3 | 0.015 | 125,312 | 1.78 | 3.9 | 0.60% | 12.5 | 4.78 | 2.07 |
| 2 | 0.7 | 0.6 | 1 | 0.4 | 0.0385–0 | 0.045 | 231,254 | 1.85 | 10.82 | 1.00% | 21.94 | 11.25 | 3.54 |
| 3 | 0.8 | 0.65 | 2 | 0.8 | 0.075–0.0385 | 0 | 343,441 | 1.77 | 4.56 | 0.41% | 13.23 | 6.75 | 2.49 |
| 4 | 0.9 | 0.7 | 1.5 | 0.2 | 0.3–0.1 | 0.03 | 452,123 | 1.65 | 22.25 | 7.45% | 30 | 13.01 | 2.63 |
| 5 | 1 | 0.5 | 1 | 0.8 | 0.1–0.075 | 0.015 | 511,452 | 1.71 | 14.24 | 1.29% | 22.82 | 12.2 | 1.66 |
| 6 | 0.6 | 0.55 | 2 | 1 | 0.3–0.1 | 0.06 | 123,525 | 1.73 | 1.58 | 0.00% | 10 | 2.21 | 3.16 |
| 7 | 0.7 | 0.6 | 2.5 | 0.2 | 0.075–0.0385 | 0.015 | 234,142 | 1.70 | 22.28 | 1.82% | 28.93 | 11.3 | 1.20 |
| 8 | 0.8 | 0.7 | 3 | 0.8 | 0.1–0.075 | 0.045 | 355,434 | 1.72 | 7.05 | 1.70% | 14.41 | 8.14 | 1.25 |
| 9 | 0.9 | 0.5 | 1.5 | 0.2 | 0.1–0.075 | 0.06 | 412,135 | 1.62 | 34.89 | 6.48% | 30 | 14.5 | 0.92 |
| 10 | 1 | 0.5 | 3 | 1 | 0.0385–0 | 0.03 | 515,553 | 1.72 | 6.35 | 0.64% | 16.86 | 9.45 | 0.99 |
| 11 | 0.6 | 0.65 | 2.5 | 0.4 | 0.5–0.3 | 0.06 | 144,215 | 1.75 | 7.81 | 1.06% | 21.75 | 10.75 | 1.99 |
| 12 | 0.7 | 0.7 | 1 | 0.6 | 0.5–0.3 | 0 | 251,311 | 1.79 | 6.93 | 0.50% | 19.69 | 9.85 | 4.79 |
| 13 | 0.8 | 0.55 | 1.5 | 0.4 | 0.0385–0 | 0 | 322,251 | 1.69 | 17.13 | 2.27% | 28.63 | 12.72 | 2.09 |
| 14 | 0.9 | 0.55 | 2.5 | 0.6 | 0.075–0.0385 | 0.045 | 424,344 | 1.69 | 12.09 | 1.58% | 26.48 | 11.51 | 0.99 |
| 15 | 1 | 0.6 | 2.5 | 1 | 0.3–0.1 | 0 | 534,521 | 1.72 | 5.08 | 2.52% | 16.63 | 9.52 | 1.36 |
| 16 | 0.6 | 0.65 | 1 | 1 | 0.075–0.0385 | 0.03 | 141,543 | 1.93 | 1.21 | 0.00% | 10 | 2.32 | 3.70 |
| 17 | 0.7 | 0.5 | 2 | 0.4 | 0.3–0.1 | 0.03 | 213,223 | 1.78 | 12.28 | 1.29% | 23 | 11.45 | 1.55 |
| 18 | 0.8 | 0.6 | 1.5 | 0.8 | 0.5–0.3 | 0.045 | 332,414 | 1.82 | 5.23 | 1.80% | 19.46 | 8.05 | 2.20 |
| 19 | 0.9 | 0.65 | 3 | 0.2 | 0.1–0.075 | 0.015 | 445,132 | 1.65 | 28.22 | 3.18% | 30 | 14.27 | 0.68 |
| 20 | 1 | 0.7 | 2 | 0.6 | 0.0385–0 | 0.06 | 553,355 | 1.65 | 16.04 | 0.53% | 25.1 | 12.52 | 1.18 |
| Density | Setting Time | Bleeding Rate | Fluidity | Consistency | Strength | |
|---|---|---|---|---|---|---|
| MS | 0.033 | 3,235,534.279 | 24.512 | 195.477 | 359.354 | 14.575 |
| SS | 0.296 | 16,177,671.393 | 220.612 | 1172.859 | 2515.481 | 131.173 |
| DF | 9 | 5 | 9 | 6 | 7 | 9 |
| R2 | 0.920 | 0.953 | 0.948 | 0.964 | 0.967 | 0.953 |
| Adjusted R2 | 0.905 | 0.948 | 0.939 | 0.962 | 0.963 | 0.949 |
| F value | 63.727 | 216.872 | 101.825 | 416.272 | 220.845 | 249.961 |
| p value | <0.0001 | <0.0001 | <0.0001 | <0.0001 | <0.0001 | <0.0001 |
| Significance | Significant | Significant | Significant | Significant | Significant | Significant |
| Density (g/cm3) | Setting Time (h) | Bleeding Rate | Fluidity (cm) | Consistency (cm) | |
|---|---|---|---|---|---|
| Model results | 1.73 | 600.00 | 0 | 24.61 | 12.00 |
| Test results | 1.70 | 534.07 | 1.2 | 25.23 | 13.12 |
Disclaimer/Publisher’s Note: The statements, opinions and data contained in all publications are solely those of the individual author(s) and contributor(s) and not of MDPI and/or the editor(s). MDPI and/or the editor(s) disclaim responsibility for any injury to people or property resulting from any ideas, methods, instructions or products referred to in the content. |
© 2024 by the authors. Licensee MDPI, Basel, Switzerland. This article is an open access article distributed under the terms and conditions of the Creative Commons Attribution (CC BY) license (https://creativecommons.org/licenses/by/4.0/).
Share and Cite
Yang, J.; Li, M.; Ma, S.; Xiao, M.; Jin, J. Eco-Friendly Shield Muck-Incorporated Grouting Materials: Mix Optimization and Property Evaluation for Silty Clay Tunnel Construction. Appl. Sci. 2024, 14, 8830. https://doi.org/10.3390/app14198830
Yang J, Li M, Ma S, Xiao M, Jin J. Eco-Friendly Shield Muck-Incorporated Grouting Materials: Mix Optimization and Property Evaluation for Silty Clay Tunnel Construction. Applied Sciences. 2024; 14(19):8830. https://doi.org/10.3390/app14198830
Chicago/Turabian StyleYang, Jinghui, Mingyu Li, Shuai Ma, Mingzhe Xiao, and Junwei Jin. 2024. "Eco-Friendly Shield Muck-Incorporated Grouting Materials: Mix Optimization and Property Evaluation for Silty Clay Tunnel Construction" Applied Sciences 14, no. 19: 8830. https://doi.org/10.3390/app14198830
APA StyleYang, J., Li, M., Ma, S., Xiao, M., & Jin, J. (2024). Eco-Friendly Shield Muck-Incorporated Grouting Materials: Mix Optimization and Property Evaluation for Silty Clay Tunnel Construction. Applied Sciences, 14(19), 8830. https://doi.org/10.3390/app14198830