Article

Leveraging IoT Devices for Atrial Fibrillation Detection: A Comprehensive Study of AI Techniques

by
Alicia Pedrosa-Rodriguez
,
Carmen Camara
*,† and
Pedro Peris-Lopez
*,†
Computer Science Department, Carlos III University of Madrid, Avda de la Universidad, 30, 28911 Leganés, Madrid, Spain
*
Authors to whom correspondence should be addressed.
These authors contributed equally to this work.
Appl. Sci. 2024, 14(19), 8945; https://doi.org/10.3390/app14198945
Submission received: 25 July 2024 / Revised: 24 September 2024 / Accepted: 27 September 2024 / Published: 4 October 2024

Abstract

:
Internet of Things (IoT) devices play a crucial role in the real-time acquisition of photoplethysmography (PPG) signals, facilitating seamless data transmission to cloud-based platforms for analysis. Atrial fibrillation (AF), affecting approximately 1–2% of the global population, requires accurate detection methods due to its prevalence and health impact. This study employs IoT devices to capture PPG signals and implements comprehensive preprocessing steps, including windowing, filtering, and artifact removal, to extract relevant features for classification. We explored a broad range of machine learning (ML) and deep learning (DL) approaches. Our results demonstrate superior performance, achieving an accuracy of 97.7%, surpassing state-of-the-art methods, including those with FDA clearance. Key strengths of our proposal include the use of shortened 15-second traces and validation using publicly available datasets. This research advances the design of cost-effective IoT devices for AF detection by leveraging diverse ML and DL techniques to enhance classification accuracy and robustness.

1. Introduction and Related Work

Atrial Fibrillation (AF) is a prevalent cardiac arrhythmia characterized by rapid and disorganized electrical activity in the atria, leading to an irregular and rapid heart rate [1]. This disorder occurs when the atria beat chaotically and out of coordination with the ventricles, resulting in symptoms such as palpitations, shortness of breath, and fatigue, while significantly increasing the risk of stroke and other complications. Traditional methods for AF classification often rely on manual analysis of electrocardiogram (ECG) signals, which are time-consuming, require expertise, and involve the use of costly sensors with multiple electrodes, complicating their integration into IoT systems. In contrast, leveraging machine learning (ML) and deep learning (DL) algorithms for the real-time processing and analysis of photoplethysmography (PPG) signals offers a more efficient alternative. This facilitates continuous monitoring and enhancing both the accuracy and efficiency of AF classification [2].
PPG signals, which measure blood volume changes in peripheral tissues, can be non-invasively acquired through wearable devices like smartwatches and fitness trackers [3]. IoT devices equipped with PPG sensors capture variations in blood volume in the skin, providing real-time data on heart rate and other cardiovascular metrics. These signals are analyzed using time-domain and frequency-domain methods. Time-domain methods focus on statistical features of the PPG signal, such as mean, standard deviation, skewness, and kurtosis. In contrast, frequency-domain methods use Fourier transform and spectral analysis to convert the PPG signal into its frequency components for AF detection [4,5,6,7,8]. Combining these methods with ML or DL algorithms, such as Support Vector Machine (SVM) [9], decision tree [6], Convolutional Neural Networks (CNN) [10], and Recurrent Neural Networks (RNN) [11], further improves detection accuracy.
Recent research has explored converting PPG signals into images for AF detection or classification, demonstrating promising results. For instance, Pereira et al. [12], Nguyen et al. [13], and Han et al. [14] utilize ML or DL approaches such as Random Forest (RF) or CNN to classify the converted images into AF or normal sinus rhythm (NSR). Nguyen et al. and Han et al. specifically convert PPG signals into Poincaré images for classification, while Pereira et al. convert the PPG waveform into a 2D RGB image.
Similarly, ECG-based AF detection methods, such as those proposed by Petmezas et al. [15] and Chen et al. [16], employ hybrid approaches combining CNN and Long Short-Term Memory (LSTM) networks or multi-feature extraction methods based on CNN for AF classification. However, these ECG-based solutions generally require more complex and expensive sensors, multiple electrodes, and face challenges in IoT integration. In contrast, PPG-based systems benefit from being lower-cost, non-invasive, and easier to integrate into wearable devices and IoT platforms.
The integration of AI into remote healthcare enhances AF management by optimizing ML-based AF classification systems within telemedicine platforms. While remote monitoring, timely intervention, and personalized healthcare management have been successfully implemented in the past, AI improves the accuracy and efficiency of these processes. Current consumer technology devices, such as smartwatches (e.g., Apple Watch, Fitbit) and fitness trackers, offer minimally obtrusive solutions for PPG signal acquisition. These devices incorporate advanced optical sensors and utilize sophisticated algorithms to provide real-time cardiovascular monitoring, including heart rate variability and arrhythmia detection like AF. Data collected from these devices can be seamlessly transmitted to cloud-based platforms for AI-driven analysis, offering healthcare professionals timely, actionable insights.
The collected data from these IoT devices can be seamlessly transmitted to cloud-based platforms for AI-driven analysis, allowing healthcare professionals to access vital information at anytime, enhancing their ability to diagnose and respond to cardiac conditions promptly [17,18]. This approach not only supports continuous heart rate monitoring but also promotes proactive cardiovascular health management, ultimately improving patient outcomes through continuous, non-invasive monitoring and timely medical interventions [2,19,20]. The increasing availability of wearable technologies, including FDA-approved devices, is expanding the scope of remote AI-driven healthcare, improving the timeliness of medical interventions and promoting preventive care strategies.
Contribution: Integrating Internet of Things (IoT) devices is crucial for capturing photoplethysmography (PPG) signals, enabling real-time data collection and monitoring of atrial fibrillation (AF) in a non-invasive and accessible manner. This study introduces a novel approach that harnesses IoT technology for effective AF detection, employing both machine learning (ML) and deep learning (DL) methodologies. Extensive experimentation demonstrated competitive performance, achieving an accuracy of 97.7%, which exceeds that of some FDA-cleared devices. Our system utilizes short traces of only 15 seconds, in contrast to the typical requirement of 30 seconds or more in existing methods. To ensure reproducibility, we validated our results using a publicly available dataset, highlighting the potential for developing efficient and cost-effective solutions for AF detection through PPG signals acquired with IoT devices.
Organization: We will outline the organization of this paper as follows: Section 2 introduces the dataset used, explains the preprocessing steps, describes the three approaches for feature extraction, and introduces the ML and DL models. Section 3 presents and interprets the results obtained from the four experiments and conducts a comparative analysis. Finally, Section 4 draws conclusions, compares our proposal with the state of the art, and discusses future work.

2. Materials and Methods

2.1. Dataset and Pre-Processing

To prototype the acquisition of PPG signals using an IoT device, a Pulse Sensor connected to an Arduino board is suitable [17], as depicted in Figure 1. With the sensor in place, we can collect signals from various patients over an extended period. While this setup demonstrates the feasibility of acquiring PPG signals in real-time using low-cost hardware, to minimize reliance on private datasets and ensure the reproducibility of our results, we utilized the MIMIC PERform AF Dataset [21], a well-known and widely referenced resource in the literature. Although consumer devices, such as smartwatches and fitness trackers, can also acquire PPG signals minimally obtrusively, the MIMIC dataset provides a controlled environment for signal acquisition, ensuring consistency in the data used for training and testing our models.
The chosen dataset includes recordings from 35 adults in intensive care units (ICUs) during routine care, including 19 subjects with atrial fibrillation (AF) and 16 control subjects. Each participant contributed a 20-minute PPG recording sampled at 125 Hz. These data are extracted from the MIMIC-III Waveform Database [22,23], which contains thousands of recordings of multiple physiologic signals collected from bedside patient monitors of adults (aged 16 years or older) admitted to ICUs between 2001 and 2012.
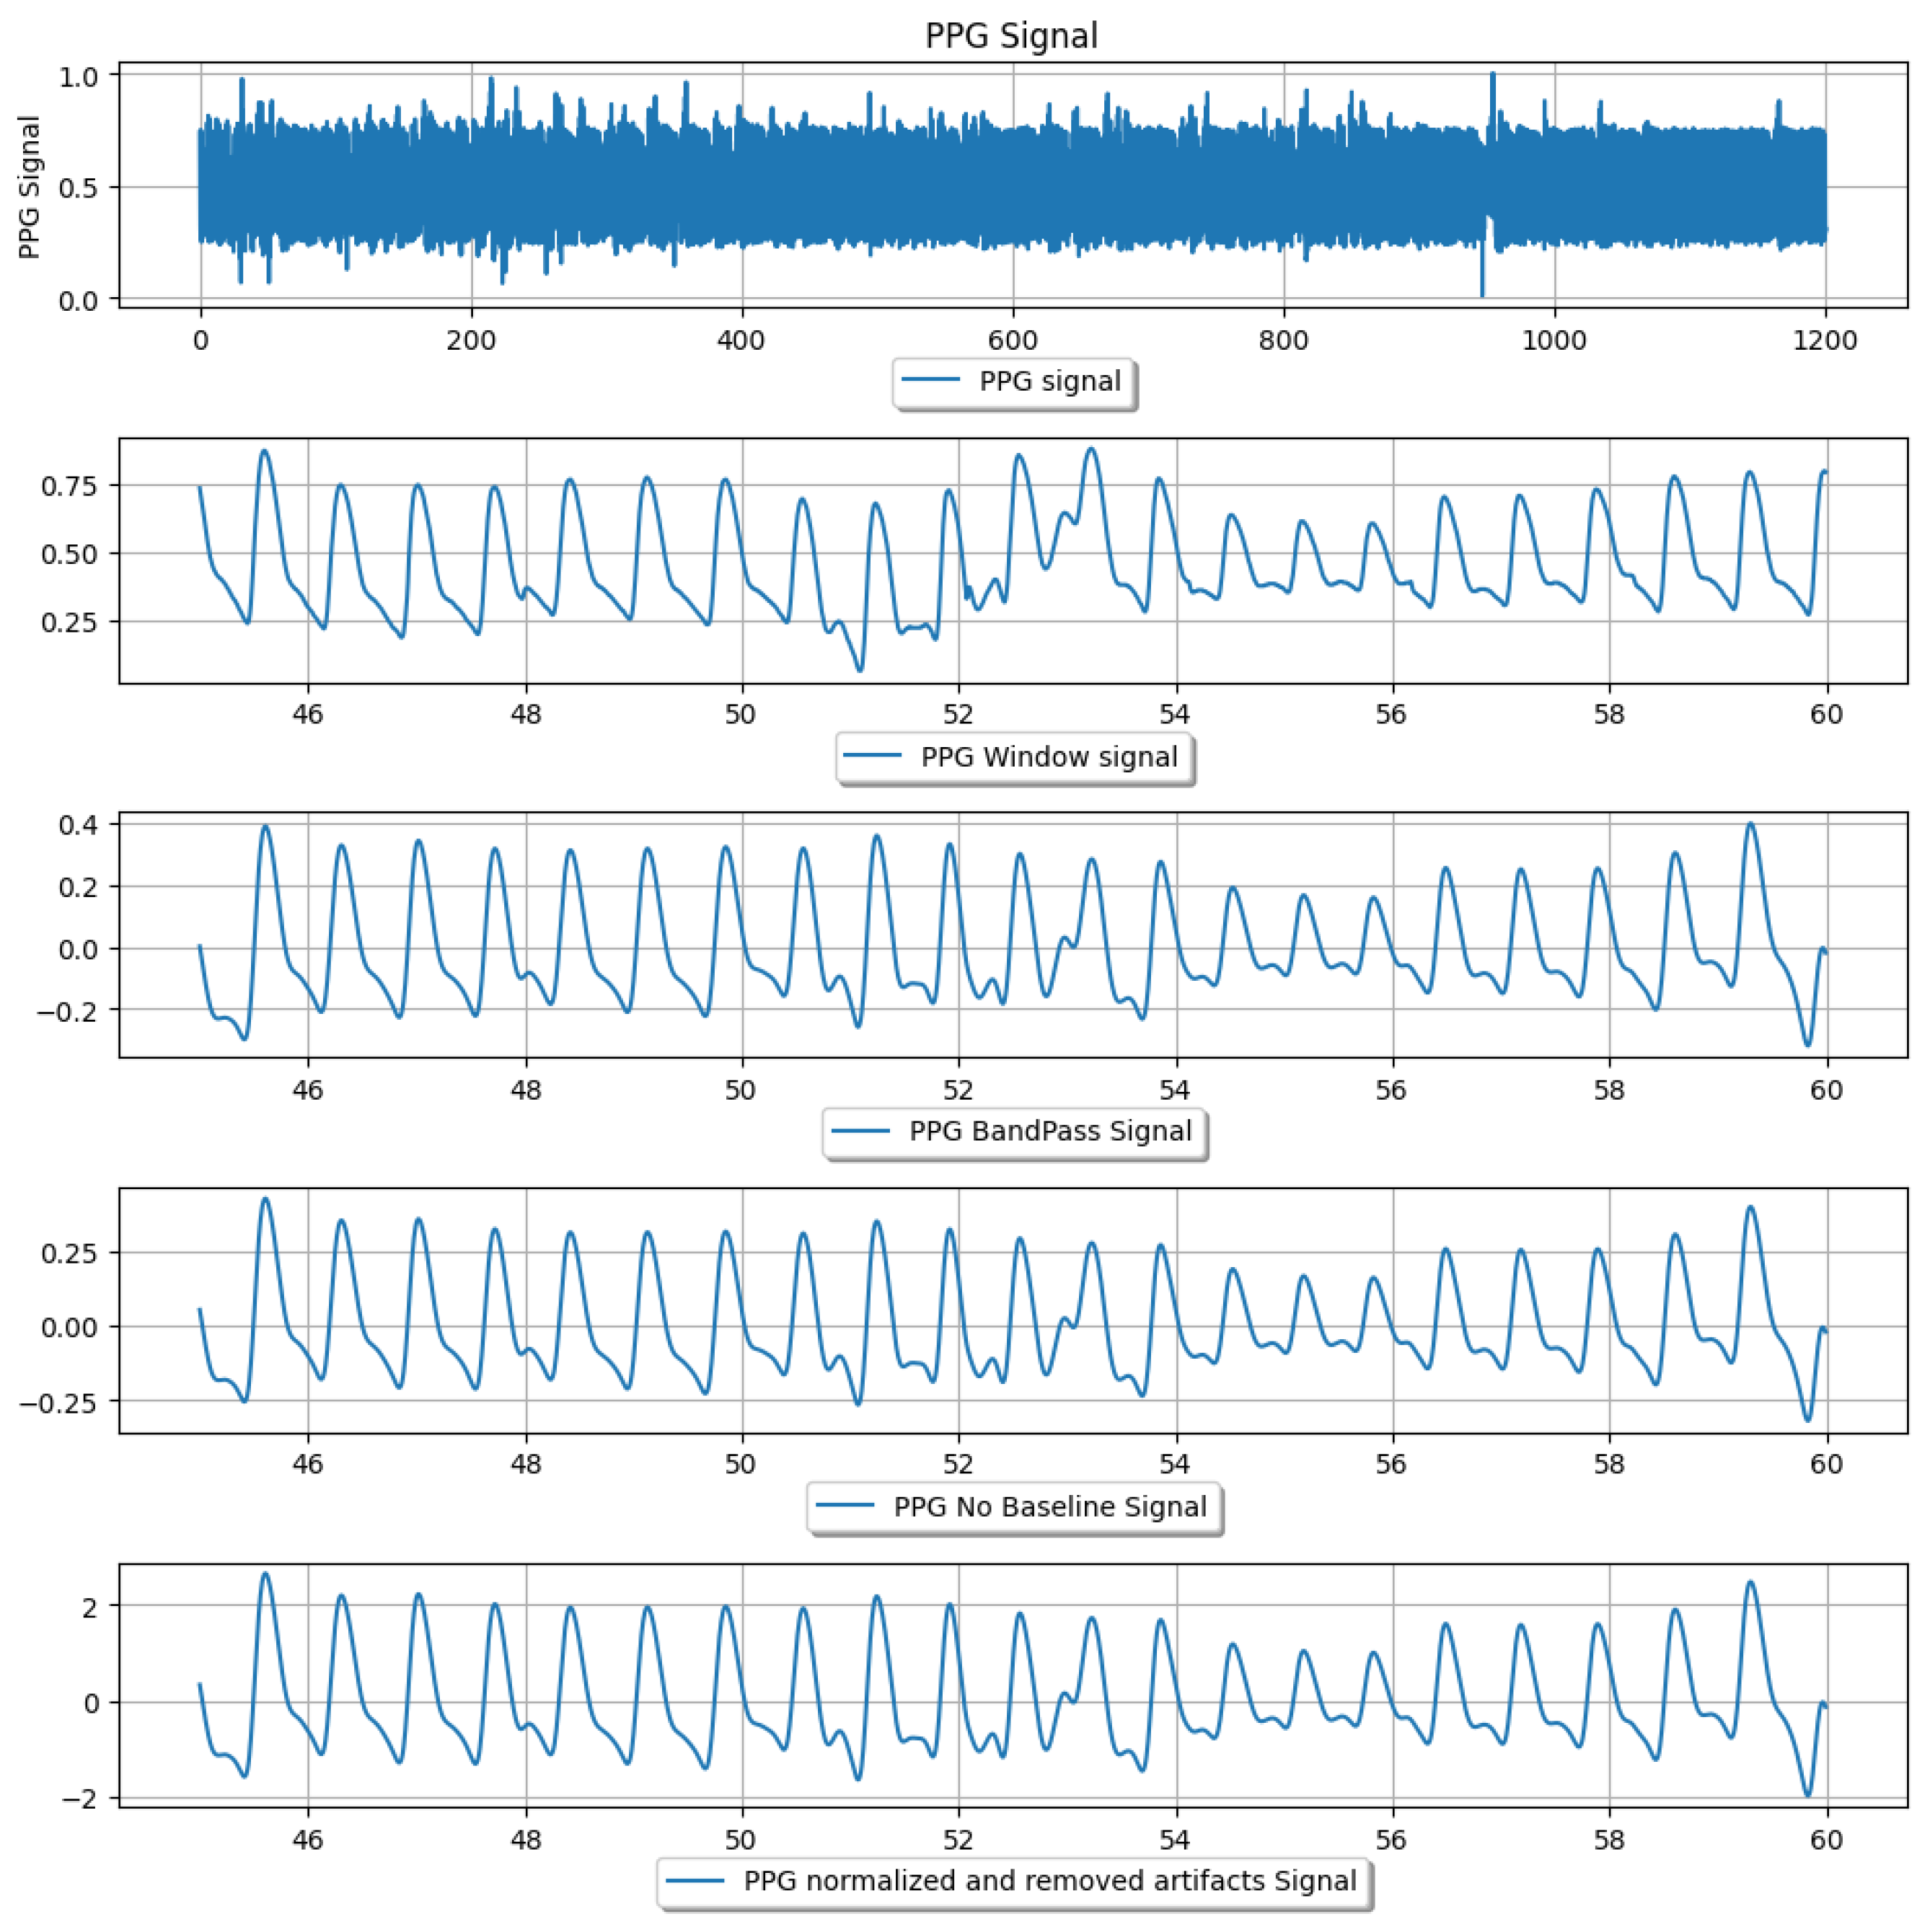
Several data preprocessing steps applied to PPG signals are essential for enhancing signal quality, which is crucial for accurate atrial fibrillation (AF) detection and analysis. The techniques utilized [24,25] include windowing, band-pass filtering, baseline correction, normalization, and artifact removal. The entire preprocessing pipeline is illustrated in Figure 2.
In detail, the PPG signals were initially segmented into non-overlapping 15-s windows. This was a critical step for capturing the temporal variations essential for identifying atrial fibrillation (AF)-related features. To ensure the robustness and reliability of the dataset, any windows containing missing values were excluded from further analysis. This resulted in a refined dataset comprising 2722 clean window samples. Subsequently, a band-pass filter with a cutoff frequency of 5.5 Hz was applied to the PPG signals. This filtering process was vital for preserving cardiovascular-related frequency components while effectively removing unwanted noise, thereby enhancing the quality of the data for subsequent examination.
To improve the clarity of the pulse waveforms, baseline drift and low-frequency components were eliminated using a polynomial fitting technique of degree five. This approach effectively mitigated these unwanted elements from the signals. Additionally, to facilitate consistent comparisons across different subjects and recordings, a normalization process was applied to standardize the amplitudes of the PPG signals. Finally, an artifact removal procedure was implemented to further enhance data quality. This involved identifying and removing extreme data points based on a threshold-based method. This comprehensive preprocessing strategy significantly refined the dataset, preparing it for subsequent analysis and ensuring the integrity of the results.

2.2. Features Extraction

This section addresses the essential task of feature extraction in the context of atrial fibrillation (AF) classification. It presents three distinct methods for extracting meaningful information from photoplethysmography (PPG) signals, thereby enhancing the accuracy of AF classification. These approaches are designed to produce compact and informative representations of PPG signal patterns, which enable subsequent models to effectively differentiate between AF and normal sinus rhythm. This exploration of feature extraction techniques is part of a broader initiative aimed at improving AF classification by systematically evaluating the effectiveness of various feature representations.

2.2.1. Signal-Based Features

This procedure involves the extraction of 14 features from the preprocessed PPG signal data. These features were selected based on their capacity to capture essential information regarding heart rate variability (HRV), waveform morphology, spectral characteristics, adaptive organization, and other discriminative properties of the PPG signal [26,27]. The selected features include statistical measures such as mean, standard deviation, and median, as well as waveform characteristics like waveform width and crest times, as detailed in Table 1. By integrating these features, a more comprehensive representation of the underlying cardiac dynamics is achieved, enhancing the effectiveness of subsequent classification models.

2.2.2. Wavelet Spectrogram-Based Features

The wavelet spectrogram is generated from preprocessed photoplethysmography (PPG) signals, providing a time-frequency representation that facilitates the extraction of significant features. This spectrogram is obtained by applying the Morlet wavelet transform within the frequency range of 0.1 to 5.5 Hz, allowing for detailed analysis of the PPG signals. The resulting wavelet spectrogram serves as a robust basis for feature extraction, enabling the identification of critical patterns relevant to atrial fibrillation (AF) detection.
From the spectrogram matrix, a total of 1808 features are derived using various statistical and energy functions, as indicated in prior studies [2,11]. These features encompass a comprehensive overview of the spectrogram’s energy distribution, shape, and spectral content, providing essential insights into both the spectral characteristics and temporal fluctuations of the PPG signals. This rich feature set is instrumental in enhancing the accuracy of AF detection, as detailed in Table 2.

2.2.3. CNN-Based Features from Wavelet Spectrogram Images

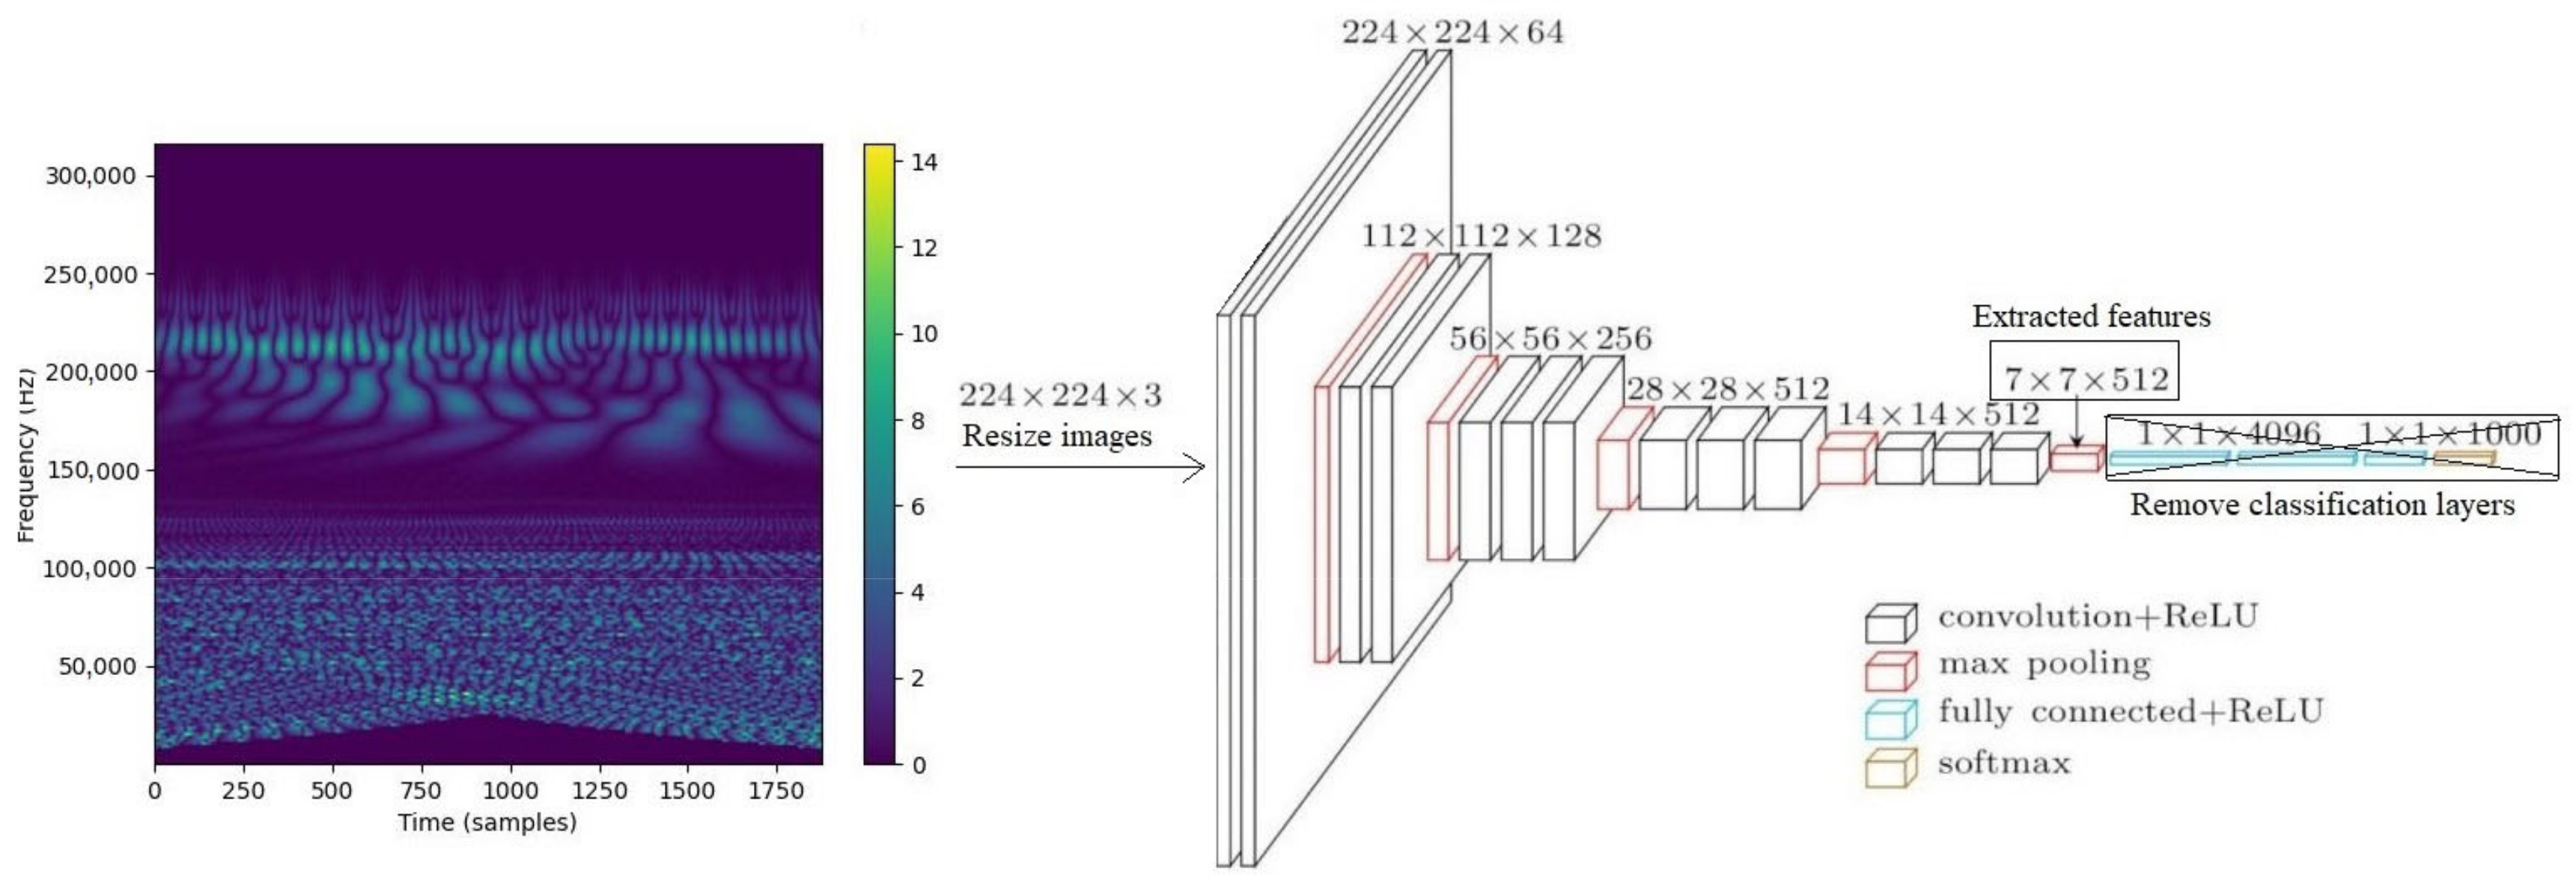
In this approach, wavelet spectrogram images are generated from the wavelet transform of photoplethysmography (PPG) signals. These images are then utilized as inputs to a modified convolutional neural network (CNN), specifically the VGG16 model [28]. The CNN is employed to extract high-level features from these images, capturing global patterns, spatial relationships, and spectral characteristics relevant to atrial fibrillation detection.
To adapt the VGG16 model for feature extraction rather than classification, the fully connected layers responsible for classification tasks were removed. The architecture was modified so that the output is derived from the last convolutional layer, which provides the activations or feature maps generated during the processing of resized spectrogram images. The network structure is illustrated in Figure 3.

2.3. Classification

In this phase, we focus on the classification of photoplethysmography (PPG) data utilizing the extracted features alongside various Machine Learning (ML) models. Additionally, we investigate the implementation of Deep Learning (DL) techniques through neural networks.

2.3.1. ML Models Applied to Extracted Features

We employed three distinct feature extraction methods for the PPG data: signal-based Features, wavelet spectrogram-based features, and CNN-based features derived from wavelet spectrogram images. For each method, we applied a consistent set of machine learning models, including Support Vector Machines (SVM), Random Forests (RF), and Multi-Layer Perceptrons (MLP) for classification. These models were selected due to their effectiveness in handling classification tasks, their ability to generalize well to unseen data, as well as their complementary strengths.
SVM is particularly effective in handling binary classification problems while excelling in high-dimensional spaces and managing non-linearly separable data, making it ideal for capturing complex patterns. RF, a robust ensemble method, is well-suited to handling a large number of features and avoiding overfitting by averaging the predictions of multiple decision trees. MLP, a neural network approach, is capable of capturing complex patterns and non-linear relationships in the data, making it adaptable to the binary classification of PPG signals.
To further enhance predictive performance, we implemented a stacking model that combined the predictions of multiple promising models using logistic regression as the final estimator. This approach aimed to leverage the strengths of multiple models to improve overall predictive performance.. A standardized pipeline was established for each feature extraction and ML model combination in order to ensure consistent and fair evaluation. This encompased data scaling, dimensionality reduction via Principal Component Analysis (PCA), hyperparameter optimization through grid search, and performance evaluation using accuracy metrics based on stratified K-fold cross-validation.

2.3.2. Deep Learning

We explore two distinct approaches. First, the time series data (PPG) is directly input into a custom convolutional neural network (CNN). Second, we assess a transfer learning approach, utilizing spectrogram images derived from the PPG data as input.
Signal time series and custom CNN
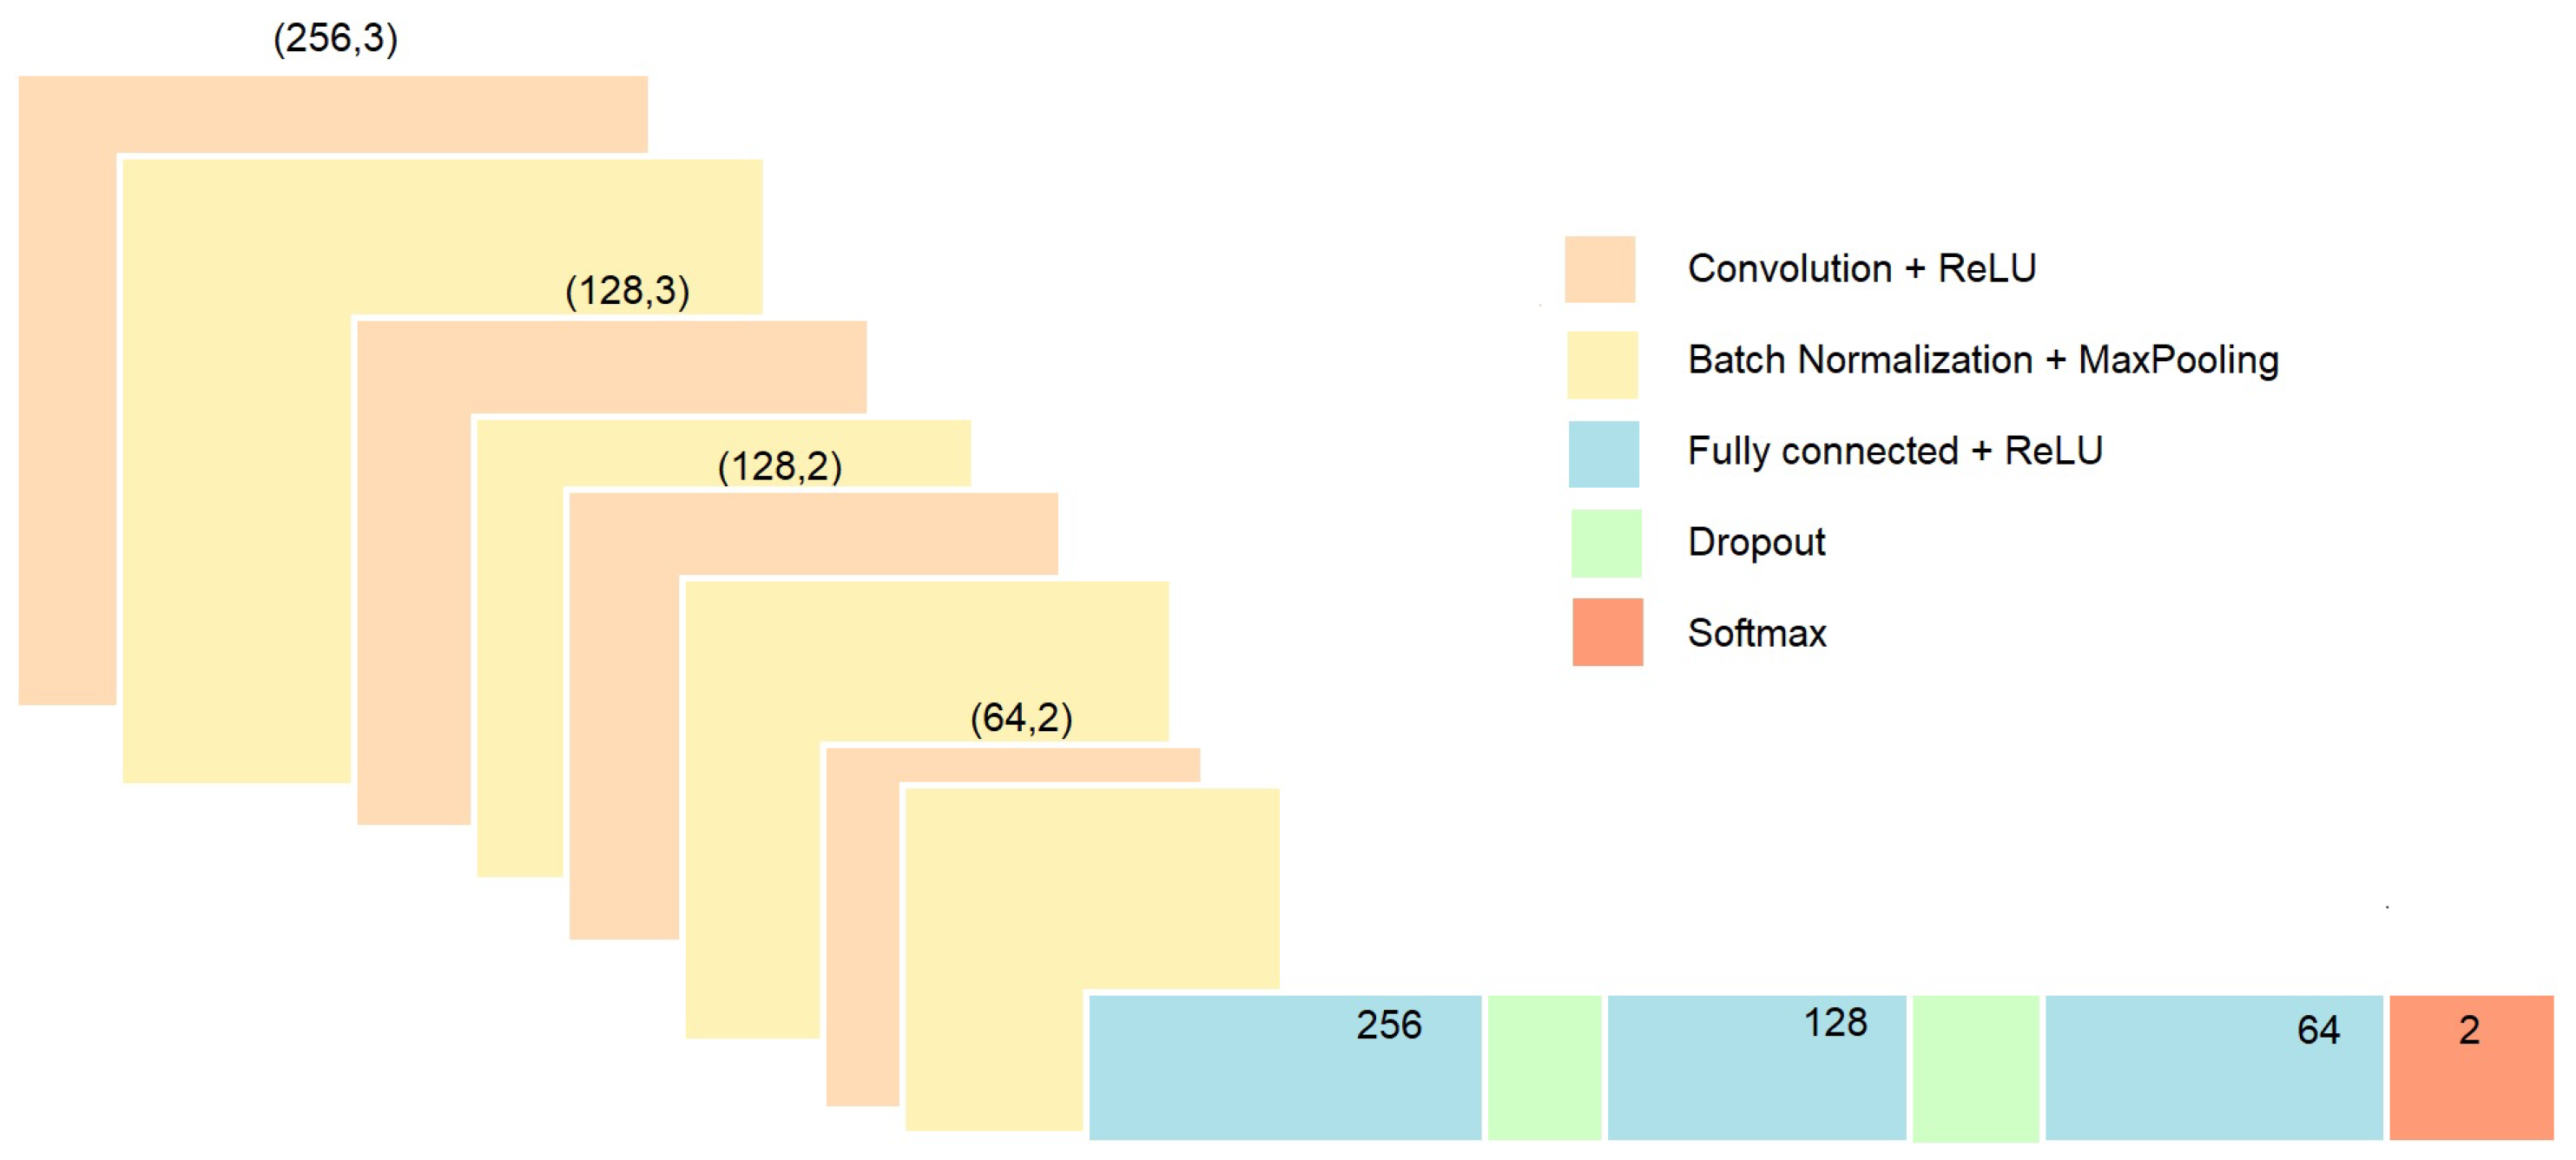
A CNN was specifically designed to classify PPG time series data. The CNN architecture was tailored for feature extraction from PPG signals, employing a series of convolution, pooling, and normalization layers, as illustrated in Figure 4. The model begins with a convolutional layer containing 256 filters with a kernel size of 3, followed by batch normalization and max pooling operations. Subsequent convolutional layers, featuring 128 filters of varying sizes, are added to capture more complex patterns in the data. Each of these layers is also followed by batch normalization and max pooling to enhance stability and reduce dimensionality.
The output from the final convolutional layer is flattened and passed through densely connected layers for final classification. To mitigate overfitting, dropout regularization is applied throughout the dense layers, which decrease in size progressively toward the output layer. The output layer consists of two units utilizing a Softmax activation function, enabling the classification of PPG signals into two distinct classes: atrial fibrillation (AF) and non-AF.
After the initial training, transfer learning was employed to enhance model performance. The existing model, which already included a suitable classifier for the task, underwent further customization to optimize classification accuracy. New layers were integrated into the pre-trained model, consisting of an additional dense layer with 64 units and ReLU activation to capture complex patterns, a dropout layer to mitigate overfitting, and a final classification layer with 2 units using Softmax activation. Finally, fine-tuning was applied to adapt the model further, enabling improvements in classification accuracy.
Spectrograms and Transfer Learning
We employed the DenseNet121 model [29] for the classification of spectrogram images derived from PPG data. To enhance variability, data augmentation techniques were applied to the images prior to training. The transfer learning process involved replacing the original classifier of the network with a custom multi-layer perceptron (MLP) tailored for our specific task. This custom classifier comprised two fully connected layers, each utilizing ReLU activation (refer to Figure 5 for the network structure). Additionally, the majority of the model parameters were frozen, while the remaining parameters of the custom classifier were adjusted to optimize performance for spectrogram classification.
This change makes it clear that only certain parts of the model (likely the DenseNet backbone) were frozen, while other parts (like the newly added MLP classifier) were fine-tuned.

2.4. Model Evaluation

This section focuses on a comprehensive evaluation of model performance using various metrics, with a primary emphasis on accuracy, which quantifies the proportion of correct classifications. To enrich the assessment, supplementary metrics such as the F1-score, Area Under the Curve (AUC), and the confusion matrix were employed. Stratified K-fold cross-validation (with 5 folds) was implemented to ensure an unbiased estimation of model performance by maintaining the distribution of classes across folds.
Data partitioning involved allocating 70% of the dataset for training and 30% for testing. The GridSearchCV technique was utilized to identify the best-performing model based on the training data. Subsequently, the test data was classified using the optimal estimator obtained from cross-validation. Finally, the model’s effectiveness was evaluated through calculations of accuracy, the confusion matrix, and the F1-score.

3. Results

The results of various feature extraction techniques and transfer learning methods for atrial fibrillation (AF) classification are presented in this section. Specifically, three feature extraction methods (Options 1–3) and two deep learning approaches (Options 4–5) were evaluated (Regarding the computational cost, it should be noted that all experiments were conducted on an ASUS ZenBook 14 UM425QA-KI174W, ASUS, Taiwan, China equipped with an AMD Ryzen 7 5800H processor, 16GB of RAM, and 512GB of storage, AMD (Advanced Micro Devices, lnc.), Santa Clara, CA, USA).
For the initial three approaches, a consistent set of machine learning models—including Support Vector Machines (SVM), Random Forests (RF), and Multi-Layer Perceptrons (MLP)—was utilized to conduct the classification task. Each model underwent cross-validation and hyperparameter optimization (HPO) to identify the optimal hyperparameter combinations, with performance assessed primarily using accuracy as the evaluation metric. Furthermore, a stacking model was implemented to combine the predictions of individual estimators, thereby enhancing overall predictive performance.

3.1. Option 1: ML Applied to Statistical Features

The SVM achieved a cross-validated accuracy of 0.9528, while the RF recorded an accuracy of 0.9407, and the MLP scored 0.9518. Among these, SVM, with optimized hyperparameters (C = 1, gamma = 0.1, and kernel = rbf), was identified as the best model. Its final accuracy on the test set was 0.9438, as indicated by a confusion matrix comprising 434 true negatives, 16 false positives, 30 false negatives, and 338 true positives. The F1-score for this model was 0.9437, and the Area Under the Curve (AUC) was 0.9872.
Furthermore, the stacking model, which combined the predictions from SVM, RF, and MLP, also achieved an accuracy of 0.9438, matching that of the SVM. This stacking model maintained consistent F1-score and AUC values, demonstrating its effectiveness in enhancing predictive performance.
In terms of computational cost, the extraction of statistical features took on average 0.0034 s per 15-s sample. Training times varied significantly between models, with SVM requiring 31.26 s, RF 257.60 s, and MLP 104.96 s. However, once trained, inference times were much lower, with SVM requiring 0.000081 s per sample and the stacking model taking 0.017837 s per sample.

3.2. Option 2: ML Applied to Wavelet Spectrogram

The MLP model achieved the highest cross-validated accuracy score of 0.9621 with optimized hyperparameters: activation = relu, alpha = 0.001, hidden layer sizes = (200), learning rate = adaptive, and solver = adam. The SVM model obtained an accuracy score of 0.9499, while RF recorded an accuracy of 0.957.
The final accuracy score of MLP, the best-performing model, on the test set was 0.9621, with a confusion matrix indicating 441 true negatives, 9 false positives, 22 false negatives, and 346 true positives. The F1-score was 0.9620, and the Area Under the Curve (AUC) was 0.9908.
Additionally, the stacking model, which combined the predictions of MLP, SVM, and RF (in that order), achieved an accuracy score of 0.9707, demonstrating an improvement over the individual models. The F1-score of 0.9706 and AUC of 0.9974 were also superior to those of the individual models.
Regarding computational time, the feature extraction process took an average of 17.5224 s per sample, making it a more computationally expensive method compared to Option 1. Training times for this approach were considerably longer, with SVM taking 475.90 s, RF 20,520.08 s, and MLP 703.23 s. The best model (MLP) achieved a total inference time of 0.0277 s, or 0.000034 s per sample, whereas the stacking model required 75.2242 s, or 0.091961 s per sample.

3.3. Option 3: ML Applied to CNN-Based Wavelet Spectrogram Features

The SVM model achieved the highest cross-validated accuracy score of 0.9707 with optimized hyperparameters (i.e., c = 1, gamma = 0.001, and kernel = rbf). The MLP model attained an accuracy score of 0.9649, while the RF model recorded an accuracy of 0.9407.
Based on these accuracy scores, the SVM model was selected as the best-performing model for this approach. Its final accuracy on the test set was 0.9707, with a confusion matrix indicating 439 true negatives, 11 false positives, 13 false negatives, and 355 true positives. The F1-score was 0.9707, and the Area Under the Curve (AUC) was 0.9872.
Furthermore, the stacking model, which combined the predictions of the SVM, RF, and MLP models, achieved an accuracy score of 0.9768, an F1-score of 0.9768, and an AUC of 0.9968, indicating a significant improvement over the individual models.
For computational efficiency, feature extraction took an average of 0.0306 s per sample. However, training times for SVM, RF, and MLP were significantly longer, requiring 3200.16 s, 13,222.45 s, and 1183.51 s, respectively. Inference times for the best-performing model (SVM) were 0.6581 s in total, or 0.000805 s per sample, while the stacking model required 173.42 s, or 0.212 s per sample.

3.4. Option 4: Deep Learning on Signal Time Series Using a Custom CNN

The fine-tuned model trained on noisy data achieved an accuracy of 0.9462 and an F1-score of 0.9463. These results outperformed the model trained on original data, which recorded an accuracy of 0.9108 and an F1-score of 0.9106. This improvement can be attributed to the model’s ability to learn task-specific patterns from the noisy PPG data, thereby enhancing its classification capability.
In terms of computational efficiency, training the model required 2095.78 s, while transfer learning took an additional 213.33 s. The evaluation time was 1.67 s, with an inference time of 0.0020 s per sample.

3.5. Option 5: Transfer Learning on Spectrogram Images Using DenseNet121

The classification of spectrogram images using DenseNet121 with a custom classifier achieved a training accuracy of 0.9375 and a testing accuracy of 0.9406.
Regarding computational time, training DenseNet required 836.46 s, with a total inference time of 124.14 s, which equates to 0.152 s per sample for evaluation on the test set.

3.6. Comparative Analysis of the Results

Table 3 summarizes the results of the various feature extraction approaches. A comparative analysis indicated that the ML models applied to CNN-based wavelet spectrogram features (Option 3) achieved the highest accuracy scores, with the SVM model attaining an accuracy of 0.9707, effectively capturing relevant patterns for accurate AF classification. Overall, the SVM model demonstrated strong performance across different approaches, consistently yielding high accuracy scores, underscoring its effectiveness in classifying AF.
Additionally, the stacking model for Option 3 achieved an accuracy of 0.9768, reflecting a significant enhancement in performance. The stacking models consistently demonstrated notable improvements over their individual counterparts. Specifically, the stacking model in Option 1 attained an accuracy score of 0.9438, matching the performance of the SVM model alone, while the stacking model in Option 2 reached an accuracy of 0.9707, surpassing that of the MLP model. These findings underscore the potential of combining multiple models to enhance classification accuracy.
Regarding computational cost, Option 2 had the highest feature extraction time of 1401.80 s, significantly higher than Option 1 (0.27 s) and Option 3 (2.45 s). Option 3 offered a middle ground, being more efficient than Option 2 but still slower than Option 1.
Training times depend heavily on available resources, so the focus here is on inference times, which were fast for all options. Option 1 had the quickest inference times, with the SVM model taking 0.000081 s per sample, while Options 2 and 3 were slightly slower but still efficient. The primary bottleneck lies in feature extraction rather than classification. Option 1 is well-suited for resource-constrained environments, whereas Option 3, despite longer preprocessing times, offers the highest accuracy and is ideal for high-stakes applications.
Furthermore, an analysis of the deep learning approaches (Table 4) revealed that fine-tuning improved accuracy; however, these values generally remained lower compared to those obtained through feature extraction methods. This discrepancy may stem from variations in task complexity and feature selection.
It is important to highlight a significant finding in Option 5, where transfer learning was utilized with wavelet spectrogram features. Despite the wavelet spectrogram features combined with SVM achieving the highest accuracy in Option 3, the performance of the transfer learning approach in Option 5, while close, did not reach the same level of accuracy. This discrepancy underscores the necessity of carefully selecting and integrating the appropriate models and techniques during the transfer learning process.
In terms of computational costs, Options 4 and 5 had slower inference times than Options 1 and 2. Although these deep learning models reduce the need for manual feature extraction, they did not outperform traditional methods in efficiency or accuracy.
In conclusion, after evaluating the various approaches, Option 3—combining neural networks for feature extraction with SVM for classification—emerges as a promising solution. This approach effectively leverages the strengths of deep learning’s feature extraction capabilities while maintaining computational efficiency, making it suitable for resource-constrained devices.

4. Conclusions and Discussion

In conclusion, this study focuses on the classification of atrial fibrillation (AF) using photoplethysmography (PPG) data, a non-invasive and widely available technique for measuring blood volume variations through optical sensors. The integration of Internet of Things (IoT) devices is crucial for acquiring PPG signals, as they enable real-time data collection and seamless transmission to cloud-based platforms for analysis. The primary objective was to explore diverse approaches and assess their effectiveness in accurately classifying AF.
To prepare the PPG data for analysis, a series of preprocessing steps were implemented, including windowing, missing value removal, band-pass filtering, baseline correction, normalization, and artifact removal. These techniques facilitated the extraction of relevant features from the PPG signals, resulting in feature vectors crucial for effective classification. Various methodologies were explored for feature extraction, such as signal-based statistical features, wavelet spectrogram features, and features derived from convolutional neural networks (CNN). Subsequently, multiple machine learning models—including Support Vector Machine (SVM), Random Forest (RF), and Multi-Layer Perceptron (MLP)—were evaluated individually, with stacking models used to combine their predictions for enhanced performance.
The findings revealed that CNN-based wavelet spectrogram features, when paired with the SVM model, consistently achieved the highest accuracy scores among the different feature extraction methods. This highlights the capability of CNN-based wavelet spectrograms to capture significant patterns within PPG signals, leading to accurate classification of AF. Additionally, the use of stacking models demonstrated substantial performance improvements over individual models, reinforcing the effectiveness of ensemble techniques in boosting classification accuracy and robustness.
While deep learning approaches were explored, fine-tuning did enhance accuracy to some degree; however, the overall results remained lower compared to the feature extraction methods. This suggests that the complexity and nature of the classification tasks may have influenced the performance of the deep learning techniques, indicating a need for further investigation in this area to optimize their effectiveness. Specifically, developing models better tailored to PPG signals, rather than relying on transfer learning, could potentially lead to better performance.
In summary, this study underscores the efficacy of utilizing PPG data, combined with feature extraction methods and machine learning models, for accurate AF classification. PPG serves as a non-invasive and easily accessible means for detecting and monitoring AF, and the role of IoT devices is pivotal in this process, as they facilitate real-time acquisition and transmission of PPG signals. Preprocessing techniques, such as wavelet transforms, help extract informative features from PPG signals. The application of machine learning models, including SVM, RF, and MLP, offers robust classification capabilities. Additionally, the exploration of deep learning approaches highlights the potential for leveraging pretrained models to enhance AF classification. While further investigation is required to optimize the deep learning process for PPG data, this approach holds promise for improving classification accuracy.
In relation to the state of the art, several studies have evaluated the effectiveness of electrocardiography (ECG) and photoplethysmography (PPG) techniques for atrial fibrillation (AF) detection. ECG-based studies typically involve longer trace durations, often spanning several minutes to hours, which allows for a comprehensive analysis of cardiac rhythm [30]. These studies have reported high accuracy rates, ranging from 85% to 99% in detecting AF [31,32,33]. In contrast, PPG-based studies generally utilize shorter trace durations, typically limited to 30 seconds or a few minutes. Despite the brevity of these recordings, PPG studies have demonstrated promising results, with accuracy rates between 80% and 99% for AF detection, as detailed in [2,12,13,14,34,35,36,37,38].
Our results demonstrate a competitive performance of 97.7% when benchmarked against state-of-the-art methods, including those with FDA clearance approval [39]. Additionally, our system exhibits three key strengths. First, we utilize shortened traces of 15 seconds, as opposed to the more commonly employed longer durations of 30 seconds or several minutes. Second, our findings are validated using a publicly available dataset. Third, we investigate a comprehensive range of machine learning (ML) and deep learning (DL) approaches. While the study benefits from using a publicly available dataset, it is worth noting that such datasets may not fully capture the diversity of real-world patients, potentially limiting the generalizability of the results. Additionally, while IoT devices offer significant advantages for real-time monitoring, practical applications may encounter challenges with data privacy and device reliability. In summary, this paper aims to advance the design of modern and cost-effective IoT devices for atrial fibrillation (AF) detection.

Author Contributions

A.P.-R.: Conceptualization, Methodology, Experimentation, Validation, Writing, C.C.: Conceptualization, Methodology, Experimentation, Validation, Supervision, Funding, Writing, P.P.-L.: Methodology, Experimentation, Validation, Supervision, Funding, Writing. All authors contributed equally to this work and have read and agreed to the published version of the manuscript.

Funding

This work was supported by grants TED2021-131681B-I00 (CIOMET) and PID2022-140126OB-I00 (CYCAD) from the Spanish Ministry of Science, Innovation and Universities, as well as by the INCIBE under the project VITAL-IoT in the context of the funds from the Recovery, Transformation, and Resilience Plan, financed by the European Union (Next Generation).

Institutional Review Board Statement

Not applicable.

Informed Consent Statement

Not applicable.

Data Availability Statement

We utilized the MIMIC PERform AF Dataset [21].

Conflicts of Interest

The authors declare that they have no known competing financial interests or personal relationships that could have influenced the work reported in this paper.

References

  1. January, C.T.; Wann, L.S.; Alpert, J.S.; Calkins, H.; Cigarroa, J.E.; Cleveland, J.C., Jr.; Conti, J.B.; Ellinor, P.T.; Ezekowitz, M.D.; Field, M.E.; et al. 2014 AHA/ACC/HRS guideline for the management of patients with atrial fibrillation: Executive summary: A report of the American College of Cardiology/American Heart Association Task Force on practice guidelines and the Heart Rhythm Society. Circulation 2014, 130, 2071–2104. [Google Scholar] [CrossRef] [PubMed]
  2. Pereira, T.; Tran, N.; Gadhoumi, K.; Pelter, M.M.; Do, D.H.; Lee, R.J.; Colorado, R.; Meisel, K.; Hu, X. Photoplethysmography based atrial fibrillation detection: A review. NPJ Digit. Med. 2020, 3, 3. [Google Scholar] [CrossRef] [PubMed]
  3. Allen, J. Photoplethysmography and its application in clinical physiological measurement. Physiol. Meas. 2007, 28, R1. [Google Scholar] [CrossRef] [PubMed]
  4. Tarniceriu, A.; Harju, J.; Yousefi, Z.R.; Vehkaoja, A.; Parak, J.; Yli-Hankala, A.; Korhonen, I. The accuracy of atrial fibrillation detection from wrist photoplethysmography. A study on post-operative patients. In Proceedings of the 2018 40th Annual International Conference of the IEEE Engineering in Medicine and Biology Society (EMBC), Honolulu, Hawaii, 17–21 July 2018; IEEE: Piscataway Township, NJ, USA, 2018; pp. 1–4. [Google Scholar]
  5. Eerikäinen, L.M.; Bonomi, A.G.; Schipper, F.; Dekker, L.R.; Vullings, R.; de Morree, H.M.; Aarts, R.M. Comparison between electrocardiogram-and photoplethysmogram-derived features for atrial fibrillation detection in free-living conditions. Physiol. Meas. 2018, 39, 084001. [Google Scholar] [CrossRef]
  6. Fallet, S.; Lemay, M.; Renevey, P.; Leupi, C.; Pruvot, E.; Vesin, J.M. Can one detect atrial fibrillation using a wrist-type photoplethysmographic device? Med. Biol. Eng. Comput. 2019, 57, 477–487. [Google Scholar] [CrossRef]
  7. Fan, Y.Y.; Li, Y.G.; Li, J.; Cheng, W.K.; Shan, Z.L.; Wang, Y.T.; Guo, Y.T. Diagnostic performance of a smart device with photoplethysmography technology for atrial fibrillation detection: Pilot study (Pre-mAFA II registry). JMIR mHealth uHealth 2019, 7, e11437. [Google Scholar] [CrossRef]
  8. Reiss, A.; Schmidt, P.; Indlekofer, I.; Van Laerhoven, K. PPG-based heart rate estimation with time-frequency spectra: A deep learning approach. In Proceedings of the 2018 ACM International Joint Conference and 2018 International Symposium on Pervasive and Ubiquitous Computing and Wearable Computers, Singapore, 8–12 October 2018; pp. 1283–1292. [Google Scholar]
  9. Schäck, T.; Harb, Y.S.; Muma, M.; Zoubir, A.M. Computationally efficient algorithm for photoplethysmography-based atrial fibrillation detection using smartphones. In Proceedings of the 2017 39th Annual International Conference of the IEEE Engineering in Medicine and Biology Society (EMBC), Jeju Island, Republic of Korea, 11–15 July 2017; IEEE: Piscataway Township, NJ, USA, 2017; pp. 104–108. [Google Scholar]
  10. Poh, M.Z.; Poh, Y.C.; Chan, P.H.; Wong, C.K.; Pun, L.; Leung, W.W.C.; Wong, Y.F.; Wong, M.M.Y.; Chu, D.W.S.; Siu, C.W. Diagnostic assessment of a deep learning system for detecting atrial fibrillation in pulse waveforms. Heart 2018, 104, 1921–1928. [Google Scholar] [CrossRef]
  11. Shashikumar, S.P.; Shah, A.J.; Clifford, G.D.; Nemati, S. Detection of Paroxysmal Atrial Fibrillation using Attention-based Bidirectional Recurrent Neural Networks. arXiv 2018, arXiv:1805.09133. [Google Scholar]
  12. Pereira, T.; Ding, C.; Gadhoumi, K.; Tran, N.; Colorado, R.A.; Meisel, K.; Hu, X. Deep learning approaches for plethysmography signal quality assessment in the presence of atrial fibrillation. Physiol. Meas. 2019, 40, 125002. [Google Scholar] [CrossRef]
  13. Nguyen, D.H.; Chao, P.C.P.; Chung, C.C.; Horng, R.H.; Choubey, B. Detecting Atrial Fibrillation in Real Time Based on PPG via Two CNNs for Quality Assessment and Detection. IEEE Sens. J. 2022, 22, 24102–24111. [Google Scholar] [CrossRef]
  14. Han, D.; Bashar, S.K.; Zieneddin, F.; Ding, E.; Whitcomb, C.; McManus, D.D.; Chon, K.H. Digital image processing features of smartwatch photoplethysmography for cardiac arrhythmia detection. In Proceedings of the 2020 42nd Annual International Conference of the IEEE Engineering in Medicine & Biology Society (EMBC), Montreal, QC, Canada, 20–24 July 2020; IEEE: Piscataway Township, NJ, USA, 2020; pp. 4071–4074. [Google Scholar]
  15. Petmezas, G.; Haris, K.; Stefanopoulos, L.; Kilintzis, V.; Tzavelis, A.; Rogers, J.A.; Katsaggelos, A.K.; Maglaveras, N. Automated atrial fibrillation detection using a hybrid CNN-LSTM network on imbalanced ECG datasets. Biomed. Signal Process. Control 2021, 63, 102194. [Google Scholar] [CrossRef]
  16. Chen, X.; Cheng, Z.; Wang, S.; Lu, G.; Xv, G.; Liu, Q.; Zhu, X. Atrial fibrillation detection based on multi-feature extraction and convolutional neural network for processing ECG signals. Comput. Methods Programs Biomed. 2021, 202, 106009. [Google Scholar] [CrossRef] [PubMed]
  17. Sai Kumar, S.; Rinku, D.R.; Pradeep Kumar, A.; Maddula, R.; Anna Palagan, C. An IOT framework for detecting cardiac arrhythmias in real-time using deep learning resnet model. Meas. Sens. 2023, 29, 100866. [Google Scholar] [CrossRef]
  18. Cinotti, E.; Centracchio, J.; Parlato, S.; Andreozzi, E.; Esposito, D.; Muto, V.; Bifulco, P.; Riccio, M. A Narrowband IoT Personal Sensor for Long-Term Heart Rate Monitoring and Atrial Fibrillation Detection. Sensors 2024, 24, 4432. [Google Scholar] [CrossRef] [PubMed]
  19. Kavsaoğlu, A.R.; Polat, K.; Hariharan, M. Non-invasive prediction of hemoglobin level using machine learning techniques with the PPG signal’s characteristics features. Appl. Soft Comput. 2015, 37, 983–991. [Google Scholar] [CrossRef]
  20. Njoum, H.; Kyriacou, P. Investigation of finger reflectance photoplethysmography in volunteers undergoing a local sympathetic stimulation. In Journal of Physics: Conference Series; IOP Publishing: Bristol, UK, 2013; Volume 450, p. 012012. [Google Scholar]
  21. Charlton, P.H. MIMIC PERform Datasets (1.01) [Data Set]. Zenodo. 2022. Available online: https://zenodo.org/records/6807403 (accessed on 24 September 2024).
  22. Charlton, P.H.; Kotzen, K.; Mejía-Mejía, E.; Aston, P.J.; Budidha, K.; Mant, J.; Pettit, C.; Behar, J.A.; Kyriacou, P.A. Detecting beats in the photoplethysmogram: Benchmarking open-source algorithms. Physiol. Meas. 2022, 43, 085007. [Google Scholar] [CrossRef]
  23. Moody, B.; Moody, G.; Villarroel, M.; Clifford, G.D.; Silva, I. MIMIC-III Waveform Database Matched Subset (version 1.0); PhysioNet: 2020. Available online: https://physionet.org/content/mimic3wdb-matched/1.0/ (accessed on 24 September 2024).
  24. Bashar, S.K.; Ding, E.; Walkey, A.J.; McManus, D.D.; Chon, K.H. Noise Detection in Electrocardiogram Signals for Intensive Care Unit Patients. IEEE Access 2019, 7, 88357–88368. [Google Scholar] [CrossRef]
  25. Clifford, G.D.; Azuaje, F.; McSharry, P. Advanced Methods and Tools for ECG Data Analysis; Artech House Boston: Norwood, MA, USA, 2006; Volume 10. [Google Scholar]
  26. Shan, S.M.; Tang, S.C.; Huang, P.W.; Lin, Y.M.; Huang, W.H.; Lai, D.M.; Wu, A.Y.A. Reliable PPG-based algorithm in atrial fibrillation detection. In Proceedings of the 2016 IEEE Biomedical Circuits and Systems Conference (BioCAS), Shanghai, China, 17–19 October 2016; IEEE: Piscataway Township, NJ, USA, 2016; pp. 340–343. [Google Scholar]
  27. Park, J.; Seok, H.S.; Kim, S.S.; Shin, H. Photoplethysmogram Analysis and Applications: An Integrative Review. Front. Physiol. 2022, 12, 2511. [Google Scholar] [CrossRef]
  28. Simonyan, K.; Zisserman, A. Very deep convolutional networks for large-scale image recognition. arXiv 2014, arXiv:1409.1556. [Google Scholar]
  29. Ruiz, P. Understanding and Visualizing DenseNets. 2018. Available online: http://www.pabloruizruiz10.com/resources/CNNs/DenseNets.pdf (accessed on 24 September 2024).
  30. Tihak, A.; Konjicija, S.; Boskovic, D. Deep learning models for atrial fibrillation detection: A review. In Proceedings of the 30th Telecommunications Forum (TELFOR), Belgrade, Serbia, 15–16 November 2022; pp. 1–4. [Google Scholar] [CrossRef]
  31. Huang, C.W.; Ding, J.J. Atrial Fibrillation Detection Algorithm with Ratio Variation-Based Features. In Proceedings of the 4th Eurasia Conference on IOT, Communication and Engineering (ECICE), Yunlin, Taiwan, 28–30 October 2022; pp. 16–21. [Google Scholar] [CrossRef]
  32. Abdelazez, M.; Rajan, S.; Chan, A.D.C. Transfer Learning for Detection of Atrial Fibrillation in Deterministic Compressive Sensed ECG. In Proceedings of the 42nd Annual International Conference of the IEEE Engineering in Medicine & Biology Society (EMBC), Montreal, QC, Canada, 20–24 July 2020; pp. 5398–5401. [Google Scholar] [CrossRef]
  33. Salinas-Martínez, R.; De Bie, J.; Marzocchi, N.; Sandberg, F. Automatic Detection of Atrial Fibrillation Using Electrocardiomatrix and Convolutional Neural Network. In Proceedings of the 2020 Computing in Cardiology, Rimini, Italy, 13–16 September 2020; pp. 1–4. [Google Scholar] [CrossRef]
  34. Bashar, S.K.; Han, D.; Hajeb-Mohammadalipour, S.; Ding, E.; Whitcomb, C.; McManus, D.D.; Chon, K.H. Atrial fibrillation detection from wrist photoplethysmography signals using smartwatches. Sci. Rep. 2019, 9, 15054. [Google Scholar] [CrossRef]
  35. Mohagheghian, F.; Han, D.; Peitzsch, A.; Nishita, N.; Ding, E.; Dickson, E.L.; DiMezza, D.; Otabil, E.M.; Noorishirazi, K.; Scott, J.; et al. Optimized signal quality assessment for photoplethysmogram signals using feature selection. IEEE Trans. Biomed. Eng. 2022, 69, 2982–2993. [Google Scholar] [CrossRef] [PubMed]
  36. Aldughayfiq, B.; Ashfaq, F.; Jhanjhi, N.; Humayun, M. A Deep Learning Approach for Atrial Fibrillation Classification Using Multi-Feature Time Series Data from ECG and PPG. Diagnostics 2023, 13, 2442. [Google Scholar] [CrossRef] [PubMed]
  37. Pachori, D.; Tripathy, R.K.; Jain, T.K. Detection of Atrial Fibrillation from PPG Sensor Data using Variational Mode Decomposition. IEEE Sens. Lett. 2024, 8, 1472–2475. [Google Scholar] [CrossRef]
  38. Talukdar, D.; de Deus, L.F.; Sehgal, N. Evaluation of Atrial Fibrillation Detection in short-term Photoplethysmography (PPG) signals using artificial intelligence. Cureus 2023, 15, e45111. [Google Scholar] [CrossRef]
  39. Voisin, M.; Shen, Y.; Aliamiri, A.; Avati, A.; Hannun, A.; Ng, A. Ambulatory Atrial Fibrillation Monitoring Using Wearable Photoplethysmography with Deep Learning. arXiv 2018, arXiv:1811.07774. [Google Scholar]
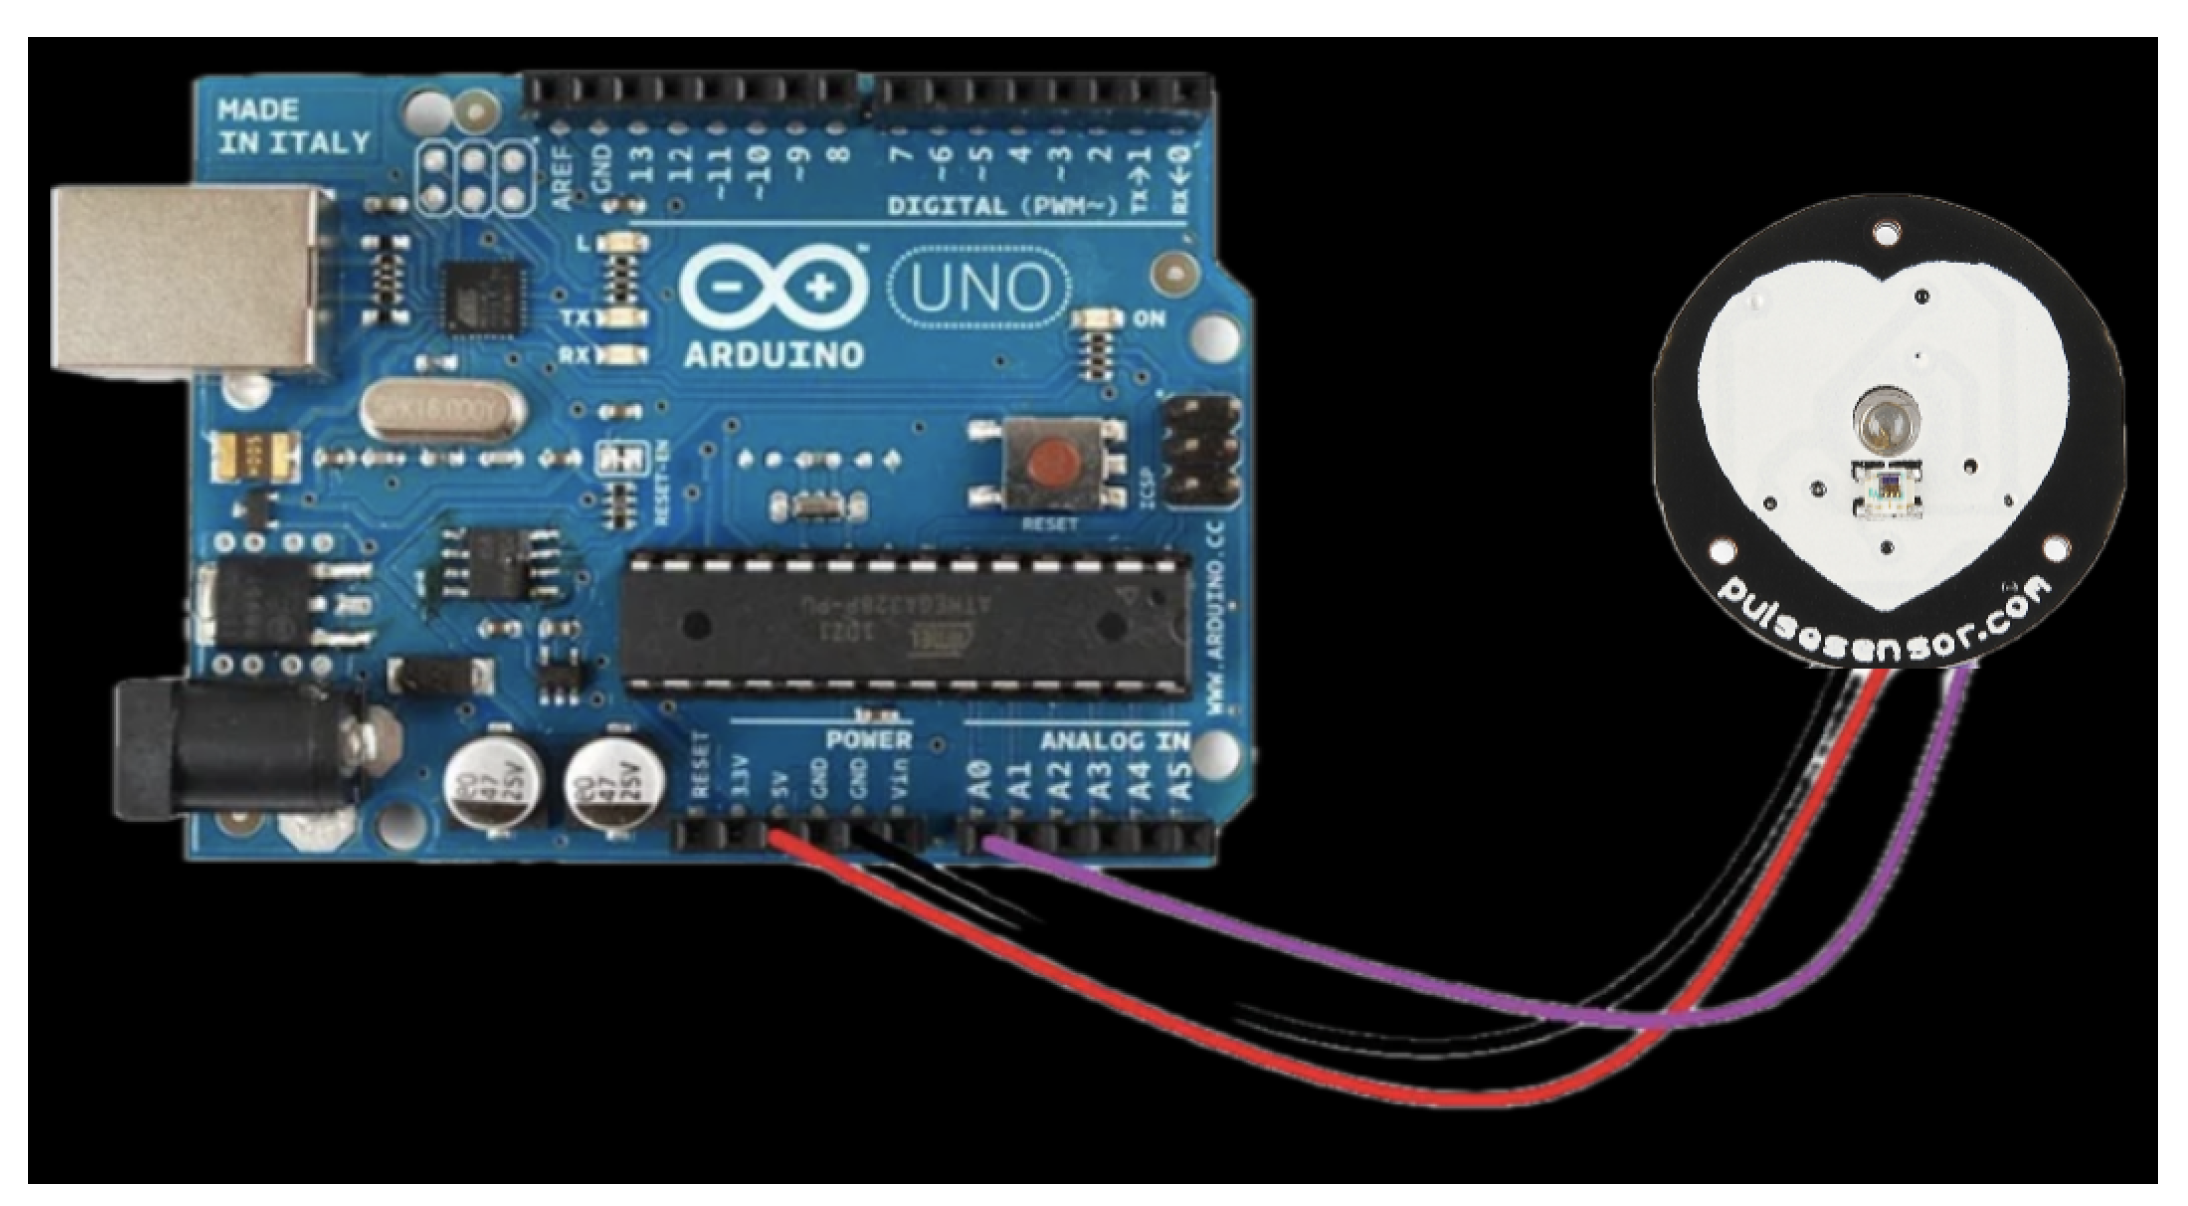
Figure 1. IoT Devices for PPG Acquisition: PulseSensor and Arduino Board.
Applsci 14 08945 g001
Figure 2. Preprocessing pipeline of a PPG signal.
Applsci 14 08945 g002
Figure 3. Pipeline of CNN-based feature extraction for spectrogram images.
Applsci 14 08945 g003
Figure 4. Custom CNN structure.
Applsci 14 08945 g004
Figure 5. Transfer Learning on DenseNet121 with MLP classifier.
Applsci 14 08945 g005
Table 1. Heart Parameters as Signal-Based Features.
ParameterDescription
Average Heart RateIndicates the overall heart rate level.
Heart Rate Standard DeviationCaptures heart rate variability over time.
Heart Rate MedianRepresents the middle heart rate value, robust to outliers.
NN Interval RatioMeasures irregularity in heart rate patterns, calculating the intervals greater than a threshold.
Root Mean Squared Successive Difference (RMSSD)Reflects short-term heart rate variability, computing the RMSSD between consecutive NN intervals.
Low-Frequency to High-Frequency Power RatioRelates to autonomic nervous system activity based on the signal frequency spectrum.
Inflection Point Ratio (TPR)Provides insights into waveform morphology.
Crest TimeCalculates time between the first peak and trough in the PPG signal.
Combined Peak-Rise and Fall HeightCaptures pulse waveform shape.
Waveform WidthMeasures the temporal extent of the pulse waveform.
Cross-correlation CoefficientEvaluates similarity between consecutive pulse segments, providing information about consistency.
Adaptive Organization Index (AOI)Quantifies adaptive organization in the PPG signal by measuring the changes in successive pulse segment differences.
Variance of Slope of Phase DifferenceCharacterizes variation in phase difference slope.
Spectral EntropyMeasures frequency spectrum complexity capturing the power distribution across different frequency bands.
Table 2. Wavelet Spectrogram-Based Features.
Statistical Measures
Mean ValuesReflects average energy distribution across different frequencies.
Variance ValuesCaptures energy distribution variability across frequencies.
Skewness ValuesMeasures asymmetry, revealing skewed frequency components.
Kurtosis ValuesCharacterizes energy distribution peakedness or flatness, showing sharp or broad frequency components.
Energy Distribution
Energy ValuesRepresents total energy contribution of various frequency components, giving insight into spectral content.
Wavelet Coefficient Analysis
Coefficient MeanCaptures average magnitude of spectral components.
Coefficient VarianceIndicates variability or spread of wavelet coefficients across frequencies.
Coefficient SkewnessReflects asymmetry, showing presence of skewed frequency components.
Coefficient KurtosisCharacterizes peakedness or flatness, revealing sharp or broad frequency components.
Table 3. Performance Comparison of Machine Learning Approaches.
OptionBest-ModelAccuracy ScoreF1-ScoreAUC
Option 1SVM0.94380.94370.9872
Stack Model0.94380.94370.9872
Option 2MLP0.96210.96200.9908
Stack Model0.97070.97060.9974
Option 3SVM0.97070.97070.9872
Stack Model0.97680.97680.9967
Option 1: ML applied to Statistical Features. Option 2: ML applied to Wavelet Spectrogram. Option 3: ML applied to CNN-based Wavelet Spectrogram Features.
Table 4. Performance Comparison of Deep Learning Approaches
OptionAccuracy Score
Option 40.9462
Option 50.9406
Option 4: Deep Learning on Signal Time Series using a Custom CNN. Option 5: Transfer learning on Spectrogram Images using DenseNet121.
Disclaimer/Publisher’s Note: The statements, opinions and data contained in all publications are solely those of the individual author(s) and contributor(s) and not of MDPI and/or the editor(s). MDPI and/or the editor(s) disclaim responsibility for any injury to people or property resulting from any ideas, methods, instructions or products referred to in the content.