Abstract
This study examined the relationship between body composition and on-field, in-game physical performance in female collegiate soccer players. Body composition, including total mass, fat mass, and lean tissue mass for the lower extremities and total body, was measured in 10 starting players using dual energy x-ray absorptiometry (DXA). On-field, in-game physical performance was tracked via a global positioning system (GPS) over 14 regular-season games, measuring total distance and distance covered in six speed zones. Players covered 4544.7 ± 495.2 m in the first half of the game and significantly less distance in the second half (3356.5 ± 1211.7 m, p = 0.004). A repeated measures ANOVA revealed decreased distances in jogging, low-, and moderate-intensity running during the second half compared to the first half of the game (p < 0.001). Lower total-body fat mass, total-body fat percentage, and lower-extremities fat mass were correlated with greater distances at moderate- and high-intensity running during the second half and entire game (r values from −0.644 to −0.745, p < 0.01 to 0.04). These findings suggest that body composition can influence the distance covered at moderate- and high-intensity running speed during competitive games. Training strategies aimed at reducing fat mass and incorporating high-intensity training may benefit female soccer players and enhance team success.
1. Introduction
Soccer involves both aerobic and anaerobic activities, with players frequently engaging in high-intensity efforts throughout a match [1]. Advances in technology, such as miniaturized tracking devices, have enhanced our understanding of the sport’s physical demands. These devices measure total distance and distance covered at various speeds, including walking, jogging, and sprinting. On average, elite players cover between 9 and 11 km per game [1,2,3,4,5]. Notably, more distance, especially at high intensities (>18 km/h for men and >15 km/h for women), is covered in the first half compared to the second [5,6,7,8,9,10,11]. Additionally, players at higher competition levels tend to cover greater distances at high intensities than those at lower levels [4,5]. While a decline in physical performance is observed in the second half at all levels [5,9,10,12,13], the exact cause remains unclear [5,14]. Fatigue is often suggested as a contributing factor, though it has not been directly measured [5,12,14,15]. For example, one study found that high-intensity running and repeated sprints can reduce sprint performance by up to 9% post-match, with fatigue lasting up to 72 h [15]. However, the relationships between on-field, in-game performance metrics and fatigue are not yet fully understood [5,14,15].
Previous research suggests that body composition significantly affects soccer players’ performance in physical tests. Players with higher fat mass tend to score lower on aerobic capacity, sprint, and vertical jump tests compared to those with lower fat mass [16,17]. Seasonal variations in body composition are common, with the lowest body fat observed at the end of the season and the highest at the start of the pre-season [18,19]. These fluctuations are associated with slower sprint times as body fat increases [18,19]. While fat mass clearly influences physical test results, its direct impact on on-field, in-game performance remains unproven. Although it is widely assumed that more lean mass enhances performance, studies show that athletes with greater lean mass do not always perform better in sprint or jump tests [17,20]. This underscores the need for further research to examine how body composition affects both physical test outcomes and on-field, in-game performance in soccer players [17,20,21].
A major challenge in comparing data between studies is the inconsistent methods used to measure body composition and its impact on performance. Many studies rely on skinfold equations or bioelectrical impedance analysis (BIA) [19,21,22], which, although practical and inexpensive, can have high variability when used to analyze athletes [23,24]. In contrast, dual-energy x-ray absorptiometry (DXA), which is considered the gold standard for body composition analysis, provides precise estimates of both regional and whole-body composition using a three-compartment model (bone mass, lean tissue mass, and fat mass). DXA is a valid and reliable method for athletes [25,26,27], especially when evaluating specific regions such as the lower extremities in soccer players [28,29,30].
Another challenge in using physical tests to assess soccer performance is their inability to differentiate high-level players from lower-level ones [1,17,31,32]. Similar sprint test results have been observed between National Collegiate Association (NCAA) and professional European players, as well as between starters and substitutes on professional teams [7,30]. One study even found that the top male NCAA soccer player had lower aerobic capacity than his teammates [32], suggesting that tests like VO2 max or sprints don’t always correlate with higher performance [17,32,33]. Players who excel in these tests may not necessarily perform better during games [13,17,32,33,34]. Physical tests assess isolated skills and fail to capture the complexities of competitive play [21]. While body composition may influence test results, its impact on on-field, in-game performance remains largely unstudied [17]. Objective assessments of on-field, in-game performance could offer more accurate insights than test scores [35].
The gap in the research is twofold. First, DXA is widely recognized as the gold standard for accurately measuring body composition and body fat percentage, but rarely used when analyzing athletes [25,26,27]. Second, previous studies have primarily relied on static performance tests, such as sprints and jumps, which fail to capture the complexity of on-field, in-game performance. Therefore, the purpose of our study was to examine the relationship between body composition, as measured by DXA, and on-field, in-game performance in female college soccer players, which to our knowledge has not been measured before. Specifically, we examined how total mass, fat mass, and lean mass correlated with total distance covered and distance covered at different speeds across an entire competitive season. We hypothesized that (i) players with lower body fat percentages would cover more total distance and more distance at high-intensity running, (ii) players with lower body fat would cover more distance in the second half, and (iii) players with greater lean mass in the lower extremities would cover more distance at high-intensity running.
2. Materials and Methods
2.1. Experimental Approach to the Problem
Each player’s body composition was measured at the beginning of the season using DXA (Lunar Prodigy Advance, HealthCare, Madison, WI, USA). We collected body composition measurements for the total body and the lower extremities, including total mass, fat mass (in kg and percentage), and lean tissue mass (in kg and percentage).
On-field, in-game physical performance data were collected over 14 regular season games, focusing on speed zones consistent with previous studies [13,36,37]. These zones were adjusted to reflect speeds typically observed in female soccer matches, ensuring our analysis accurately represents the demands on female athletes. We measured total distance covered, as well as distances for standing/walking (0–6.0 km/h), jogging (6.1–8.0 km/h), low-intensity running (8.1–12.0 km/h), moderate-intensity running (12.1–15.5 km/h), high-intensity running (15.6–20.0 km/h), and sprinting (>20.0 km/h) [36]. These speed zones were based on data from female soccer players competing in the NCAA and motion-analysis studies on high-level and professional female players [13,36,37].
We reduced the data from the 14 games, excluding any data obtained during warm-up, halftime, or cool-down. Only physical performance data collected during the first and second halves were analyzed. We focused on on-field, in-game physical performance measures from players who started and remained on the field for the entire game, thereby excluding the need to account for substitutions.
2.2. Subjects
Ten female university-level soccer players (age 20.3 ± 1.6 years, height 164.98 ± 6.87 cm, weight 64.22 ± 8.79 kg) participated in the study. While we acknowledge that 10 athletes is not a large sample size, we selected the starting players to create a homogeneous group, minimizing variability in performance metrics related to playing time and position. Goalkeepers were excluded due to their unique physical demands, which differ significantly from other players in terms of distance covered, high-intensity running, and overall energy expenditure. Including goalkeepers would introduce variability unrelated to the study’s focus on the relationship between body composition and consistent on-field, in-game performance metrics. Similarly, players who came off the bench were excluded because their inconsistent playing time would introduce variability in distance covered, which is more related to their limited minutes on the field rather than their fitness or fatigue levels. By focusing on starters who played full matches, we minimized variability related to playing time and position, allowing for a more controlled analysis of the body composition’s impact on on-field, in-game performance. Although larger sample sizes are preferable for generalizability, this approach was necessary to address our research question regarding the relationship between body composition and on-field, in-game performance.
We obtained approval for this protocol from the Human Research Ethics Committee (Cert# 30010037). All players were informed of the study’s purpose, risks, and benefits, and those who wished to participate completed the informed consent.
2.3. Procedures
2.3.1. Body Composition
All DXA scans were conducted by a certified technician following standardized procedures. Participants wore loose, non-metallic clothing, removed all jewelry, and maintained consistent hydration. Scans were scheduled at similar times of day to minimize diurnal variations. Participants were positioned supine in the center of the scanner with arms slightly away from the torso, thumbs pointing upward, legs straight, and feet slightly apart with toes pointing upward. This consistent positioning ensured uniformity across all scans. The lower-extremity boundary was defined by a line bisecting the hip joint from the iliac crest to the pubis. Participant data (age, height, weight, and ethnicity) were entered into the system for accurate calibration. The DXA machine was calibrated according to the manufacturer’s guidelines. Each scan took approximately 15 min, measuring both total and regional body composition using a three-compartment model (bone mass, lean tissue mass, and fat mass).
2.3.2. On-Field, In-Game Physical Performance Assessment
Before each game, players were equipped with a 10 Hz global positioning system (GPS) device (Polar Team System, Polar Electro, OY, Finland). GPS technology has been widely validated as a reliable and accurate tool for measuring distances, speeds, and movement patterns in field sports, particularly for soccer [38,39,40]. Players were already familiar with these devices, having used them in both training and competition during the previous season. Each GPS unit was securely placed below the chest using a strap, following the manufacturer’s guidelines to ensure consistent positioning across all players. After each game, the devices were collected, and performance data were downloaded to a computer. To focus solely on in-game activity, we excluded any data recorded during warm-up, halftime, or cool-down. We also removed all data recorded before the start of the game (see Figure 1). To ensure data reliability, each device’s signal strength was checked before the game. The 10 Hz sampling rate provided high-resolution data, effectively capturing dynamic soccer movements. Throughout the study, there were no issues with signal dropouts or data loss.
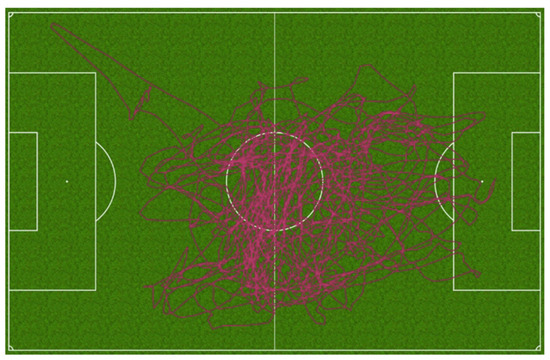
Figure 1.
An example of on-field, in-game physical performance data collected with the GPS device (raw data). The line represents the total distance covered by one participant during the second half of one game.
2.4. Statistical Analyses
We used a paired t-test to compare the total distance covered during the 1st and 2nd halves of the game. A repeated measures ANOVA with a Tukey post hoc test was performed to compare the distance covered in each speed zone between the two halves. Pearson product-moment correlations were employed to assess the relationships between each on-field, in-game performance variables and each body composition variable.
Normality tests were conducted to verify that the assumptions for parametric methods were met. Before performing the paired t-test, we assessed the normality of the difference in distances covered between the 1st and 2nd halves using the Shapiro–Wilk test, which confirmed that the data were normally distributed (W = 0.899, p = 0.212). The paired t-test revealed a significant difference between the halves (t(9) = 3.882, p = 0.004), with players covering an average of 1188.15 m more in the 1st half (M = 4544.69, SD = 495.27) compared to the 2nd half (M = 3356.53, SD = 1211.65). The effect size, measured by Cohen’s d, was 1.228, 95% CI [0.375; 2.043].
Before performing the repeated measures 2 × 6 ANOVA, we assessed the normality of the data for each speed zone in both halves using the Shapiro–Wilk test, confirming that the normality assumption was met, with p-values greater than 0.05 for each speed zone. Mauchly’s test indicated that the assumption of sphericity was violated for both the Zone effect (χ2(14) = 51.414, p < 0.001) and the Half × Zone interaction (χ2(14) = 66.627, p < 0.001). To account for this, the Greenhouse–Geisser correction was applied to adjust the degrees of freedom. The ANOVA revealed a significant interaction between halves and speed zones (F(1.364, 12.272) = 8.785, p = 0.008), with a partial eta squared (η2) of 0.494, indicating a medium to large effect size.
We categorized correlations based on the framework outlined by Hopkins et al. [41]. Correlations were considered small for values ≥0.3, moderate for values ≥0.5, large for values ≥0.7, and very large for values ≥0.9 [41]. This classification has been widely used in sports science to interpret the strength of relationships between variables [41]. The level of significance was set at p < 0.05, and all analyses were conducted using SPSS version 24.
3. Results
3.1. On-Field, In-Game Physical Performance
The distance covered in each speed zone, as well as the total distances covered in the first half, second half, and entire game, are presented in Table 1. On average, players covered 7901.2 ± 1577.9 m per game, with significantly less distance covered in the second half (3356.5 ± 1211.7 m) compared to the first half (4544.7 ± 495.2 m, p = 0.004). Players covered more distance at moderate-intensity running in the first half (696.9 ± 53.6 m) than in the second half (464.0 ± 86.5 m, p < 0.001). Additionally, significantly more distance was covered while jogging and during low-intensity running in the first half (jogging: 623.7 ± 28.8 m; low-intensity running: 1453.4 ± 88.1 m, p < 0.001) compared to the second half (jogging: 424.1 ± 48.3 m; low-intensity running: 988.0 ± 131.6 m, p < 0.001).

Table 1.
Average distances covered by starting female university soccer players in six speed zones per game throughout the season, comparing first half, second half, and the entire game distances.
3.2. Relationship between Body Composition and On-Field, In-Game Physical Performance
Players’ body composition measures are shown in Table 2, while correlations between body composition and on-field, in-game performance measures are presented in Table 3. Fat mass, percentage body fat, lower-extremity fat mass, and lower-extremity total mass were significantly correlated with the distance covered at moderate- and high-intensity running.
Table 2.
Demographic characteristics and body composition measures of 10 starting female university soccer players at the start of the season.
Table 3.
Pearson product-moment correlations between body composition measures and on-field, in-game physical performance, as indicated by distances covered at moderate- and high-intensity running, in starting female university soccer players during the first half, second half, and entire game.
3.3. Total Fat Mass and Percent Body Fat’s Relationship with On-Field, In-Game Performance
A significant correlation was observed between lower total fat mass and greater distances covered at moderate-intensity (r = −0.674, p = 0.03) and high-intensity running (r = −0.701, p = 0.02) during the second half. Similar correlations were found across the entire game for moderate-intensity (r = −0.653, p = 0.04) and high-intensity running (r = −0.658, p = 0.04). Additionally, players with lower total percentage body fat showed significant correlations with greater distances covered at moderate-intensity running (r = −0.704, p = 0.02) and high-intensity running (r = −0.718, p = 0.02) during the second half. Across the entire game, lower total percentage body fat was correlated with greater distances covered at moderate-intensity (r = −0.670, p = 0.03) and high-intensity running (r = −0.654, p = 0.04).
3.4. Lower-Extremities Fat Mass’s Relationship with On-Field, In-Game Performance
Significant correlations were found between lower fat mass in the lower extremities and greater distances covered at moderate-intensity (r = −0.669, p = 0.03) and high-intensity running (r = −0.745, p = 0.01) during the second half. Additionally, players with lower fat mass in the lower extremities showed significant correlations with more distance covered at moderate-intensity (r = −0.644, p = 0.04) and high-intensity running (r = −0.706, p = 0.02) over the entire game compared to players with more fat mass in the lower extremities.
3.5. Lower-Extremities Total Mass’s Relationship with On-Field, In-Game Performance
Significant correlations were observed between lower total mass in the lower extremities and greater distances covered at high-intensity during the first half of the game (r = −0.679, p = 0.03) and moderate-intensity during the second half (r = −0.669, p = 0.03). Throughout the 90-min game, players with lower total mass in the lower extremities covered more distance at moderate-intensity (r = −0.638, p < 0.01) and high-intensity running (r = −0.692, p = 0.03).
Players’ lower-extremities lean mass was negatively correlated with the distance covered at high-intensity running during the first half of the game (r = −0.644, p < 0.01). No other significant relationships were found between lean mass and measures of on-field, in-game physical performance.
4. Discussion
The purpose of this study was to examine the relationship between body composition and on-field, in-game measures of physical performance. We investigated how total-body and lower-extremities body composition related to the distance covered in different speed zones within a female university soccer team. The average total distance covered per game in our study (7901.2 ± 1577.9 m) was slightly higher than a previous study (7481.96 ± 958.57 m) [10]. Unlike Wells et al., who included in-game performance measures for players competing for over 55 min, our study focused on players competing for the full 90 min [10]. This difference in total playing time may explain why our players covered more distance on average. Our findings suggest that players covered more total distance and more distance at moderate-intensity running in the first half compared to the second half. The decline in total distance during the second half is consistent with previous reports on professional soccer players [4,6,7,8,10]. Additionally, the reduction in moderate-speed running (12.1–15.5 km/h) during the second half aligns with findings from previous research on female college soccer players [10,36].
The decline in on-field, in-game physical performance during the second half may be attributed to fatigue [5,14,15]. While our results, along with previous studies, noted a decrease in distance covered, no study has directly investigated the cause of this decline [5,14,15]. Players with higher fat mass may use energy less efficiently during horizontal movements like running, contributing to reduced performance throughout the game [42,43]. The ability to cover large distances at high intensity is crucial for elite soccer players [44]. Recent reports suggest that high-intensity running and sprinting occur during critical moments, such as winning the ball, maintaining possession, contributing to goals, or preventing opponents from scoring [11,45,46]. Body composition may influence performance in these decisive situations and throughout the game. Soccer players with higher total-body mass and fat mass tend to perform worse on sprint and aerobic capacity tests compared to those with lower body mass and fat [17,42,43]. Players with lower fat mass typically have faster sprint times, higher aerobic capacity, and improved agility and strength [47], which is consistent with our findings that lower fat mass is associated with greater distances covered at moderate and high intensities. Although physical tests don’t directly translate to in-game situations, slower sprint times and lower aerobic capacity may lead to less high-intensity running over a 90-min game [48].
Our study demonstrates significant relationships between body composition and on-field, in-game physical performance. The body composition values observed in this soccer team are slightly higher than those reported for female university players in the NCAA [31,49]. Players with lower total-body fat (both in kg and %) and lower fat in their lower extremities (kg) covered more distance at moderate- and high-intensity running during both the second half and the entire game. In contrast, players with higher body fat and more fat in their lower extremities covered less distance at these intensities. Coaches might aim to increase the distance players cover at high intensity, as this has been shown to enhance individual player performance. For example, top-class female soccer players on national teams perform 28% more high-intensity running (>18 km/h) compared to high-level players in domestic leagues [4]. Similar patterns have been observed in male professional players, suggesting that high-intensity running can distinguish players across different competition levels [2]. Maximizing high-intensity running and maintaining consistent performance throughout both halves of the game could give teams a competitive edge. Therefore, coaches might focus on increasing players’ high-intensity running distances to boost team success.
Very few studies have examined the factors influencing on-field, in-game physical performance in soccer players. One study found significant correlations between changes in body composition and on-field, in-game performance outcomes [50]. Specifically, a reduction in body fat percentage and an increase in fat-free mass were linked to improved squat and bench press performance [50]. Another study reported significant differences in body composition metrics, such as fat mass and fat-free mass, between elite and non-elite young soccer players [51]. Elite players had lower fat mass and higher fat-free mass, which were associated with better performance in physical tests, such as the 15-m sprint, repeated-sprint ability, and countermovement jumps [51]. However, physical tests like sprints do not always directly translate to higher on-field, in-game performance or competitive success [13,17,32,33,34]. Players who excel in these tests do not necessarily perform better in games [13,17,32,33,34]. Research suggests that high-intensity running distance during games is related to players’ aerobic capacity, vastus lateralis thickness, and vastus lateralis pennation angle in the dominant leg (R = 0.989, SEE = 115.5 m, p = 0.001) [31]. Muscle architecture may be a key predictor of on-field, in-game physical performance in female college soccer players [31,47]. Thus, body composition measurements can provide valuable insights into soccer players’ on-field, in-game physical performance.
While we found significant correlations between body composition and on-field, in-game performance metrics, other factors may also influence performance. These factors include overall fitness, technical and cognitive skills, psychological traits, tactical changes, match location, and match status, all of which can impact both body composition and performance. In our study, all participants were starters who consistently played full matches and followed a standardized training program that included endurance and strength sessions. Despite this, there was variability in overall fitness among the players. In addition to fitness, high-level soccer players must possess advanced technical and cognitive skills and may exhibit distinct physiological attributes [52]. Psychological traits, such as hope for success, task orientation, self-optimization, and self-efficacy, have been shown to influence recruitment in competitive academies [53]. Although no studies have directly examined the relationship between psychological factors and on-field, in-game physical performance, these factors are likely crucial. External influences such as the quality of the opponent, match location, and match status can also affect performance. Research shows that players tend to cover more distance and engage in more high-intensity running against higher-ranked opponents due to increased physical and tactical demands [6,54]. Similarly, players perform more high-intensity running when their team is winning compared to when they are losing, likely due to differing tactical strategies [6,55]. Additionally, match location can impact performance, as playing at home may provide psychological advantages, while away games can introduce unfamiliar environmental factors [6]. These external factors underscore the need to assess on-field, in-game performance across multiple games or an entire season to account for these variations and gain a more comprehensive understanding of player and team performance [6].
We did not find any significant relationships between total-body or lower-extremities lean mass and on-field, in-game physical performance. While DXA provides a precise estimation of total and regional lean mass distribution, it does not assess muscle quality or muscle fiber type. Specific muscle characteristics, such as muscle fiber composition, may influence aerobic and anaerobic capacities. Endurance athletes, for example, tend to have a higher proportion of slow-twitch fibers compared to athletes in sports that require speed, agility, and power [56]. Competitive soccer requires both large aerobic endurance and the ability to perform short, intense bouts of anaerobic activity. To our knowledge, only one study has measured muscle characteristics of the vastus lateralis in soccer players [57]. The relationship between muscle characteristics and on-field, in-game physical performance has not yet been established. Muscle fiber type may influence an athlete’s ability to perform both short-term intense running and long-distance efforts, which could explain why we did not find a significant relationship between lean mass and on-field, in-game performance.
While our findings suggest that reducing body fat can enhance performance at moderate and high intensities, it is crucial to adopt a holistic approach that considers the trade-offs involved in targeting body composition changes. Focusing solely on fat reduction without adequate attention to lean mass preservation, recovery, and overall health may result in unintended consequences such as muscle loss, increased injury risk, and diminished recovery capacity. Adhering to the principle of specificity and incorporating tailored nutritional strategies is essential for optimizing both performance and body composition. Additionally, body composition should be carefully monitored, especially in female athletes, as drastic changes can impact not only physical performance but also mental health and overall well-being. Excessive focus on body composition in female athletes may lead to issues such as disordered eating, menstrual dysfunction, and long-term health consequences. For a comprehensive review of how to address body composition in female athletes, Clemente-Suárez et al. (2024) provide an excellent analysis of the interplay between dietary practices, body composition, and sports performance, offering valuable insights and recommendations [58].
To our knowledge, this is the first study to assess the relationship between body composition and direct measurements of on-field, in-game physical performance in soccer players. Future research should begin by increasing the sample size through the inclusion of players from multiple teams, which would improve the generalizability of findings and allow for comparisons across different team environments and playing styles. Expanding the scope to include players in various positions (defenders, midfielders, attackers) could also provide valuable insights into how total and regional body composition correlates with on-field, in-game performance, as these factors can vary significantly by position [9,34,59]. Moreover, longitudinal studies tracking body composition changes across a single season or multiple seasons would be particularly useful in understanding how fluctuations in fat and lean mass correlate with performance. Measuring body composition at multiple points during the season would clarify the effects of fatigue, recovery, and training load on performance over time. Further research should explore muscle characteristics and psychological factors—such as mental fatigue, motivation, and resilience—that likely affect performance, particularly in the second half of games. Investigating these psychological aspects alongside physical metrics would offer a more comprehensive view of performance determinants. Finally, examining training regimens that optimize both physical and psychological factors could further improve our understanding of performance outcomes and provide practical strategies for enhancing player development and on-field, in-game performance.
5. Limitations
This study has several limitations that may affect the generalizability and interpretation of its findings. First, the sample size of ten female university soccer players is relatively small, limiting the statistical power and its applicability to larger or more diverse populations. By focusing solely on starters who consistently played full 90-min games, we ensured a homogeneous group but restricted the findings to this specific population. Importantly, while the study identified correlations, it does not imply causation. Future research with larger, more diverse samples is necessary to validate these findings and explore potential differences across player positions and sexes.
Second, although DXA is considered the gold standard for body composition measurement, it has certain limitations. It does not assess muscle quality, fiber type, or track changes throughout the season. Hydration status can influence lean mass estimates, and while we controlled for this by conducting scans during a recovery period with consistent hydration, the measurements still provide only a single snapshot. Additionally, DXA cannot differentiate between intracellular and extracellular water, which can impact the accuracy of lean mass estimates. Furthermore, future studies should adopt longitudinal designs to assess body composition changes over time.
Third, external factors such as tactical adjustments, environmental conditions, and psychological states (e.g., mental fatigue, motivation) were not considered but may influence performance. For instance, the second-half decline in performance could be attributed to fatigue or other factors like match status. Additionally, variability in adherence to recovery protocols and nutrition strategies was not controlled. Future research should assess psychological and cognitive factors, as they are increasingly recognized as critical to physical performance in competitive sports.
6. Conclusions
Body composition affects the distance players cover at moderate- and high-intensity running during games. Soccer players’ body composition fluctuates throughout the year, with significant increases in total-body mass and fat mass often reported during the off-season [60,61]. Our study emphasizes the importance of off-season training to maintain optimal body composition and physiological fitness. Players who adhere to proper off-season and pre-season training programs may experience improved on-field, in-game physical performance throughout the season. Following the principle of specificity, soccer training should incorporate anaerobic bouts that mimic the high-intensity efforts required during a 90-min game. Training strategies aimed at reducing excess body weight and fat mass may help players use energy more efficiently and maintain stable performance during the second half of the game. For instance, tailored nutritional strategies can significantly influence body composition and, consequently, athletic performance [62]. Additionally, high-intensity interval training and small-sided games have been shown to improve both body composition and performance metrics in youth female soccer players [63]. Maximizing total distance covered, particularly at moderate and high intensities during the second half, can provide players with a competitive advantage and contribute to team success.
Author Contributions
Conceptualization, S.D.L., G.D., R.D. and M.F.; methodology, S.D.L., G.D., R.D. and M.F.; validation, S.D.L., G.D., R.D. and M.F.; formal analysis, S.D.L. and G.D.; investigation, S.D.L., G.D., R.D., M.F., L.A. and T.C.; data curation, S.D.L. and G.D.; writing—original draft preparation, S.D.L., G.D. and L.A.; writing—review and editing, S.D.L., G.D., R.D., M.F., L.A. and T.C.; visualization, S.D.L., G.D., R.D. and M.F.; supervision, G.D.; project administration, G.D., R.D., M.F. and T.C. All authors have read and agreed to the published version of the manuscript.
Funding
This research received no external funding.
Institutional Review Board Statement
The study was conducted in accordance with the Declaration of Helsinki and approved by the Ethics Committee of Concordia University (Cert# 30010037, 2018).
Informed Consent Statement
Informed consent was obtained from all subjects involved in the study. Written informed consent has been obtained from the patients to publish this paper.
Data Availability Statement
The original contributions presented in this study are included in the article; further inquiries can be directed to the corresponding author/s.
Acknowledgments
The authors would like to express their sincere gratitude to all the participants of this study, the coaches who provided invaluable support, and those who assisted with data collection.
Conflicts of Interest
The authors declare no conflicts of interest.
References
- Stølen, T.; Chamari, K.; Castagna, C.; Wisløff, U. Physiology of soccer—An update. Sports Med. 2005, 35, 501–536. [Google Scholar] [CrossRef]
- Bradley, P.S.; Sheldon, W.; Wooster, B.; Olsen, P.; Boanas, P.; Krustrup, P. High-intensity running in English FA Premier League soccer matches. J. Sports Sci. 2009, 27, 159–168. [Google Scholar] [CrossRef] [PubMed]
- Krustrup, P.; Mohr, M.; Ellingsgaard, H.; Bangsbo, J. Physical demands during an elite female soccer game: Importance of training status. Med. Sci. Sports Exerc. 2005, 37, 1242–1248. [Google Scholar] [CrossRef]
- Mohr, M.; Krustrup, P.; Andersson, H.; Kirkendal, D.; Bangsbo, J. Match activities of elite women soccer players at different performance levels. J. Strength Cond. Res. 2008, 22, 341–349. [Google Scholar] [CrossRef]
- Mohr, M.; Krustrup, P.; Bangsbo, J. Match performance of high-standard soccer players with special reference to development of fatigue. J. Sports Sci. 2003, 21, 519–528. [Google Scholar] [CrossRef] [PubMed]
- Aquino, R.; Martins, G.H.M.; Vieira, L.H.P.; Menezes, R.P. Influence of match location, quality of opponents, and match status on movement patterns in Brazilian professional football players. J. Strength Cond. Res. 2017, 31, 2155–2161. [Google Scholar] [CrossRef]
- Bangsbo, J.; Norregaard, L.; Thorso, F. Activity profile of competition soccer. Can. J. Sport Sci. 1991, 16, 110–116. [Google Scholar]
- Rienzi, E.; Drust, B.; Reilly, T.; Carter, J.E.L.; Martin, A. Investigation of anthropometric and work-rate profiles of elite South American international soccer players. J. Sports Med. Phys. Fit. 2000, 40, 162–169. [Google Scholar]
- Di Salvo, V.; Gregson, W.; Atkinson, G.; Tordoff, P.; Drust, B. Analysis of High Intensity Activity in Premier League Soccer. Int. J. Sports Med. 2009, 30, 205–212. [Google Scholar] [CrossRef] [PubMed]
- Wells, A.J.; Hoffman, J.R.; Beyer, K.S.; Hoffman, M.W.; Jajtner, A.R.; Fukuda, D.H.; Stout, J.R. Regular- and postseason comparisons of playing time and measures of running performance in NCAA Division I women soccer players. Appl. Physiol. Nutr. Metab. 2015, 40, 907–917. [Google Scholar] [CrossRef]
- Rivilla-Garcia, J.; Calvo, L.C.; Jimenez-Rubio, S.; Paredes-Hernandez, V.; Munoz, A.; van den Tillaar, R.; Navandar, A. Characteristics of Very High Intensity Runs of Soccer Players in Relation to Their Playing Position and Playing Half in the 2013-14 Spanish La Liga Season. J. Hum. Kinet. 2019, 66, 214–223. [Google Scholar] [CrossRef] [PubMed]
- Barrett, S.; Midgley, A.; Reeves, M.; Joel, T.; Franklin, E.; Heyworth, R.; Garrett, A.; Lovell, R. The within-match patterns of locomotor efficiency during professional soccer match play: Implications for injury risk? J. Sci. Med. Sport 2016, 19, 810–815. [Google Scholar] [CrossRef] [PubMed]
- Vescovi, J.D. Sprint speed characteristics of high-level American female soccer players: Female Athletes in Motion (FAiM) Study. J. Sci. Med. Sport 2012, 15, 474–478. [Google Scholar] [CrossRef] [PubMed]
- Bangsbo, J.; Iaia, F.M.; Krustrup, P. Metabolic Response and Fatigue in Soccer. Int. J. Sports Physiol. Perform. 2007, 2, 111–127. [Google Scholar] [CrossRef]
- Silva, J.R.; Rumpf, M.C.; Hertzog, M.; Castagna, C.; Farooq, A.; Girard, O.; Hader, K. Acute and residual soccer match-related fatigue: A systematic review and meta-analysis. Sports Med. 2018, 48, 539–583. [Google Scholar] [CrossRef] [PubMed]
- Esco, M.R.; Fedewa, M.V.; Cicone, Z.S.; Sinelnikov, O.A.; Sekulic, D.; Holmes, C.J. Field-Based Performance Tests Are Related to Body Fat Percentage and Fat-Free Mass, But Not Body Mass Index, in Youth Soccer Players. Sports 2018, 6, 105. [Google Scholar] [CrossRef]
- Silvestre, R.; Kraemer, W.J.; West, C.; Judelson, D.A.; Spiering, B.A.; Vingren, J.L.; Hatfield, D.L.; Anderson, J.M.; Maresh, C.M. Body composition and physical performance during a National Collegiate Athletic Association Division I men’s soccer season. J. Strength Cond. Res. 2006, 20, 962–970. [Google Scholar] [CrossRef]
- Caldwell, B.P.; Peters, D.M. Seasonal variation in physiological fitness of a semiprofessional soccer team. J. Strength Cond. Res. 2009, 23, 1370–1377. [Google Scholar] [CrossRef] [PubMed]
- Ostojic, S. Seasonal alterations in body composition and sprint performance of elite soccer players. J. Exerc. Physiol. Online 2003, 6, 4. [Google Scholar]
- Stuempfle, K.J.; Katch, F.I.; Petrie, D.E. Body composition relates poorly to performance tests in NCAA division III football players. J. Strength Cond. Res. 2003, 17, 238–244. [Google Scholar]
- Arnason, A.; Sigurdsson, S.B.; Gudmundsson, A.; Holme, I.; Engebretsen, L.; Bahr, R. Physical fitness, injuries, and team performance in soccer. Med. Sci. Sports Exerc. 2004, 36, 278–285. [Google Scholar] [CrossRef]
- Sedano, S.; Vaeyens, R.; Philippaerts, R.M.; Redondo, J.C.; Cuadrado, G. Anthropometric and anaerobic fitness profile of elite and non-elite female soccer players. J. Sports Med. Phys. Fit. 2009, 49, 387–394. [Google Scholar]
- Modlesky, C.M.; Cureton, K.J.; Lewis, R.D.; Prior, B.M.; Sloniger, M.A.; Rowe, D.A. Density of the fat-free mass and estimates of body composition in male weight trainers. J. Appl. Physiol. 1996, 80, 2085–2096. [Google Scholar] [CrossRef] [PubMed]
- Silva, A.M.; Fields, D.A.; Quiterio, A.L.; Sardinha, L.B. Are skinfold-based models accurate and suitable for assessing changes in body composition in highly trained athletes? J. Strength Cond. Res. 2009, 23, 1688–1696. [Google Scholar] [CrossRef] [PubMed]
- Kohrt, W.M. Body-composition by DXA—Tried and true. Med. Sci. Sports Exerc. 1995, 27, 1349–1353. [Google Scholar] [CrossRef] [PubMed]
- Santos, D.A.; Silva, A.M.; Matias, C.N.; Fields, D.A.; Heymsfield, S.B.; Sardinha, L.B. Accuracy of DXA in estimating body composition changes in elite athletes using a four compartment model as the reference method. Nutr. Metab. 2010, 7, 22. [Google Scholar] [CrossRef]
- Van Loan, M.D. Is dual-energy X-ray absorptiometry ready for prime time in the clinical evaluation of body composition? Am. J. Clin. Nutr. 1998, 68, 1155–1156. [Google Scholar] [CrossRef]
- Bilsborough, J.C.; Greenway, K.; Opar, D.; Livingstone, S.; Cordy, J.; Coutts, A.J. The accuracy and precision of DXA for assessing body composition in team sport athletes. J. Sports Sci. 2014, 32, 1821–1828. [Google Scholar] [CrossRef] [PubMed]
- Calbet, J.A.L.; Dorado, C.; Diaz-Herrera, P.; Rodriguez-Rodriguez, L.P. High femoral bone mineral content and density in male football (soccer) players. Med. Sci. Sports Exerc. 2001, 33, 1682–1687. [Google Scholar] [CrossRef]
- Uzunca, K.; Birtane, M.; Durmus-Altun, G.; Ustun, F. High bone mineral density in loaded skeletal regions of former professional football (soccer) players: What is the effect of time after active career? Br. J. Sports Med. 2005, 39, 154–158. [Google Scholar] [CrossRef]
- McCormack, W.; Stout, J.; Wells, A.; Gonzalez, A.; Mangine, G.; Fragala, M.; Hoffman, J. Predictors of High-Intensity Running Capacity in Collegiate Women During a Soccer Game. J. Strength Cond. Res. 2014, 28, 964–970. [Google Scholar] [CrossRef] [PubMed]
- Sapp, R.M.; Aronhalt, L.; Landers-Ramos, R.Q.; Spangenburg, E.E.; Wang, M.Q.; Hagberg, J.M. Laboratory and match physiological data from an elite male collegiate soccer athlete. J. Strength Cond. Res. 2017, 31, 2645–2651. [Google Scholar] [CrossRef]
- Svensson, M.; Drust, B. Testing soccer players. J. Sports Sci. 2005, 23, 601–618. [Google Scholar] [CrossRef]
- Bush, M.D.; Archer, D.T.; Hogg, R.; Bradley, P.S. Factors influencing physical and technical variability in the English Premier League. Int. J. Sports Physiol. Perform. 2015, 10, 865–872. [Google Scholar] [CrossRef]
- Aughey, R.J. Applications of GPS Technologies to Field Sports. Int. J. Sports Physiol. Perform. 2011, 6, 295–310. [Google Scholar] [CrossRef] [PubMed]
- Vescovi, J.D. Motion Characteristics of Youth Women Soccer Matches: Female Athletes in Motion (FAiM) Study. Int. J. Sports Med. 2014, 35, 110–117. [Google Scholar] [CrossRef]
- Dwyer, D.B.; Gabbett, T.J. Global positioning system data analysis: Velocity ranges and a new definition of sprinting for field sport athletes. J. Strength Cond. Res. 2012, 26, 818–824. [Google Scholar] [CrossRef]
- Nikolaidis, P.T.; Clemente, F.M.; van der Linden, C.M.I.; Rosemann, T.; Knechtle, B. Validity and Reliability of 10-Hz Global Positioning System to Assess In-line Movement and Change of Direction. Front. Physiol. 2018, 9, 228. [Google Scholar] [CrossRef] [PubMed]
- Gray, A.J.; Jenkins, D.; Andrews, M.H.; Taaffe, D.R.; Glover, M.L. Validity and Reliability of GPS for Measuring Distance Travelled in Field-Based Team Sports. J. Sports Sci. 2010, 28, 1319–1325. [Google Scholar] [CrossRef]
- Gaudino, P.; Iaia, F.M.; Alberti, G.; Hawkins, R.D.; Strudwick, A.J.; Gregson, W. Systematic Bias Between Running Speed and Metabolic Power Data in Elite Soccer Players: Influence of Drill Type. Int. J. Sports Med. 2014, 35, 489–493. [Google Scholar] [CrossRef] [PubMed]
- Hopkins, W.G.; Marshall, S.W.; Batterham, A.M.; Hanin, J. Progressive Statistics for Studies in Sports Medicine and Exercise Science. Med. Sci. Sports Exerc. 2009, 41, 3–12. [Google Scholar] [CrossRef] [PubMed]
- Gil, S.M.; Gil, J.; Ruiz, F.; Irazusta, A.; Irazusta, J. Physiological and anthropometric characteristics of young soccer players according to their playing position: Relevance for the selection process. J. Strength Cond. Res. 2007, 21, 438–445. [Google Scholar] [CrossRef] [PubMed]
- Rico-Sanz, J. Body composition and nutritional assessments in soccer. Int. J. Sport Nutr. 1998, 8, 113–123. [Google Scholar] [CrossRef]
- McCurdy, K.; Walker, J.; Langford, G.; Kutz, M.; Guerrero, J.; McMillan, J. The relationship between kinematic determinants of jump and sprint performance in Division I women soccer players. J. Strength Cond. Res. 2010, 24, 3200–3208. [Google Scholar] [CrossRef] [PubMed]
- Faude, O.; Koch, T.; Meyer, T. Straight sprinting is the most frequent action in goal situations in professional football. J. Sports Sci. 2012, 30, 625–631. [Google Scholar] [CrossRef] [PubMed]
- Reilly, T.; Bangsbo, J.; Franks, A. Anthropometric and physiological predispositions for elite soccer. J. Sports Sci. 2000, 18, 669–683. [Google Scholar] [CrossRef] [PubMed]
- Sebastiá-Rico, J.; Soriano, J.M.; González-Gálvez, N.; Martínez-Sanz, J.M. Body composition of male professional soccer players using different measurement methods: A systematic review and meta-analysis. Nutrients 2023, 15, 1160. [Google Scholar] [CrossRef]
- Milsom, J.; Naughton, R.; O’Boyle, A.; Iqbal, Z.; Morgans, R.; Drust, B.; Morton, J.P. Body composition assessment of English Premier League soccer players: A comparative DXA analysis of first team, U21 and U18 squads. J. Sports Sci. 2015, 33, 1799–1806. [Google Scholar] [CrossRef]
- Minett, M.M.; Binkley, T.B.; Weidauer, L.A.; Specker, B.L. Changes in body composition and bone of female collegiate soccer players through the competitive season and off-season. J. Musculoskelet. Neuronal Interact. 2017, 17, 386–398. [Google Scholar]
- McFadden, B.A.; Walker, A.J.; Arent, M.A.; Bozzini, B.N.; Sanders, D.J.; Cintineo, H.P.; Bello, M.L.; Arent, S.M. Biomarkers correlate with body composition and performance changes throughout the season in women’s Division I collegiate soccer players. Front. Sports Act. Living 2020, 2, 74. [Google Scholar] [CrossRef]
- Toselli, S.; Mauro, M.; Grigoletto, A.; Cataldi, S.; Benedetti, L.; Nanni, G.; Di Miceli, R.; Aiello, P.; Gallamini, D.; Fischetti, F. Assessment of body composition and physical performance of young soccer players: Differences according to the competitive level. Biology 2022, 11, 823. [Google Scholar] [CrossRef] [PubMed]
- Williams, A.M.; Reilly, T. Talent identification and development in soccer. J. Sports Sci. 2000, 18, 657–667. [Google Scholar] [CrossRef]
- Musculus, L.; Lobinger, B.H. Psychological Characteristics in Talented Soccer Players—Recommendations on How to Improve Coaches’ Assessment. Front. Psychol. 2018, 9, 41. [Google Scholar] [CrossRef]
- Barrera, J.; Sarmento, H.; Clemente, F.M.; Field, A.; Figueiredo, A.J. The effect of contextual variables on match performance across different playing positions in professional Portuguese soccer players. Int. J. Environ. Res. Public Health 2021, 18, 5175. [Google Scholar] [CrossRef] [PubMed]
- Rampinini, E.; Coutts, A.J.; Castagna, C.; Sassi, R.; Impellizzeri, F.M. Variation in top level soccer match performance. Int. J. Sports Med. 2007, 28, 1018–1024. [Google Scholar] [CrossRef] [PubMed]
- Tesch, P.A.; Karlsson, J. Muscle-fiber types and size in trained and untrained muscles of elite athletes. J. Appl. Physiol. 1985, 59, 1716–1720. [Google Scholar] [CrossRef]
- Andersen, J.L.; Klitgaard, H.; Bangsbo, J.; Saltin, B. Myosin heavy-chain isoforms in single fibers from M. vastus lateralis of soccer players: Effects of strength training. Acta Physiol. Scand. 1994, 150, 21–26. [Google Scholar] [CrossRef] [PubMed]
- Martín-Rodríguez, A.; Belinchón-deMiguel, P.; Rubio-Zarapuz, A.; Tornero-Aguilera, J.F.; Martínez-Guardado, I.; Villanueva-Tobaldo, C.V.; Clemente-Suárez, V.J. Advances in Understanding the Interplay between Dietary Practices, Body Composition, and Sports Performance in Athletes. Nutrients 2024, 16, 571. [Google Scholar] [CrossRef] [PubMed]
- Di Salvo, V.; Baron, R.; Tschan, H.; Montero, F.J.; Bachl, N.; Pigozzi, F. Performance characteristics according to playing position in elite soccer. Int. J. Sports Med. 2007, 28, 222–227. [Google Scholar] [CrossRef] [PubMed]
- Devlin, B.L.; Kingsley, M.; Leveritt, M.D.; Belski, R. Seasonal changes in soccer players’ body composition and dietary intake practices. J. Strength Cond. Res. 2017, 31, 3319–3326. [Google Scholar] [CrossRef]
- Milanese, C.; Cavedon, V.; Corradini, G.; De Vita, F.; Zancanaro, C. Seasonal DXA-measured body composition changes in professional male soccer players. J. Sports Sci. 2015, 33, 1219–1228. [Google Scholar] [CrossRef] [PubMed]
- Hulton, A.T.; Malone, J.J.; Clarke, N.D.; MacLaren, D.P.M. Energy requirements and nutritional strategies for male soccer players: A review and suggestions for practice. Nutrients 2022, 14, 657. [Google Scholar] [CrossRef]
- Nayıroğlu, S.; Yılmaz, A.K.; Silva, A.F.; Silva, R.; Nobari, H.; Clemente, F.M. Effects of small-sided games and running-based high-intensity interval training on body composition and physical fitness in under-19 female soccer players. BMC Sports Sci. Med. Rehabil. 2022, 14, 119. [Google Scholar] [CrossRef] [PubMed]
Disclaimer/Publisher’s Note: The statements, opinions and data contained in all publications are solely those of the individual author(s) and contributor(s) and not of MDPI and/or the editor(s). MDPI and/or the editor(s) disclaim responsibility for any injury to people or property resulting from any ideas, methods, instructions or products referred to in the content. |
© 2024 by the authors. Licensee MDPI, Basel, Switzerland. This article is an open access article distributed under the terms and conditions of the Creative Commons Attribution (CC BY) license (https://creativecommons.org/licenses/by/4.0/).