
Relationship between Repeated Sprint Ability and Force–Velocity Profile in Elite and Subelite Female Field Hockey Players

 ,
,  ,
, 
Abstract
Featured Application
Abstract
1. Introduction
2. Materials and Methods
2.1. Participants
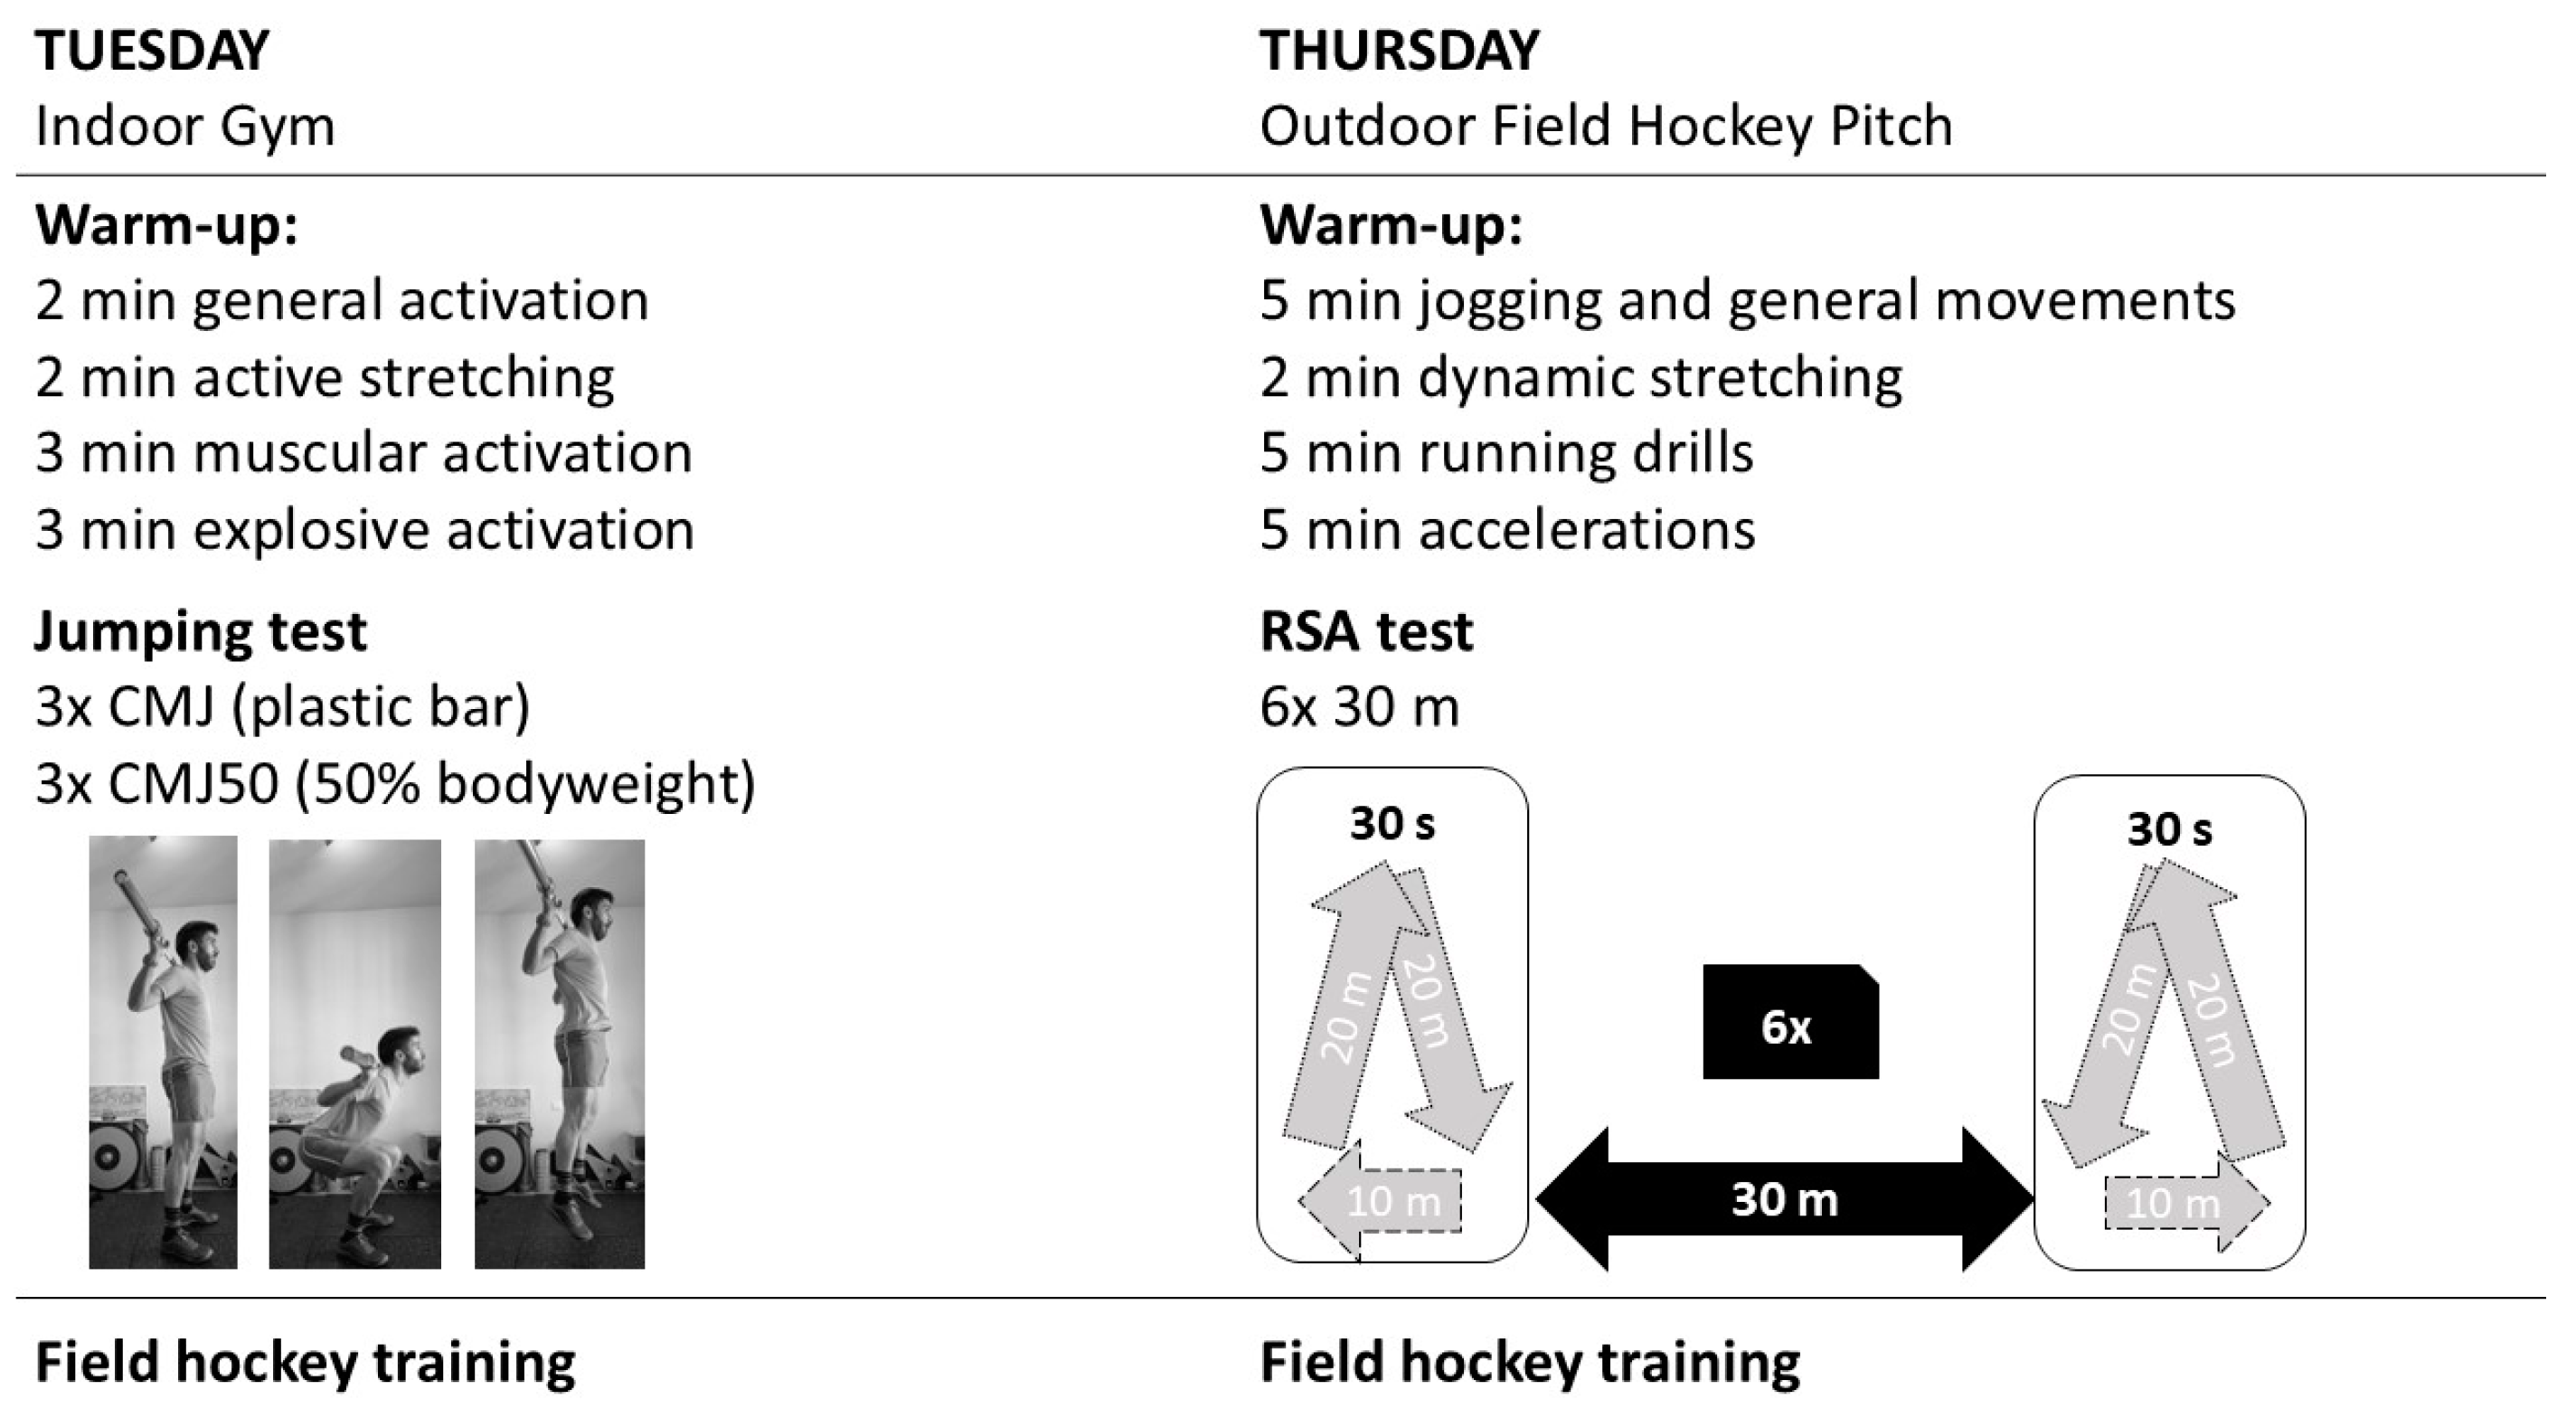
2.2. Design
2.3. Repeated Sprint Ability Test
2.4. Estimation of the Step Frequency (SF) and Length (SL)
2.5. Jump Test
2.6. Statistical Analysis
3. Results
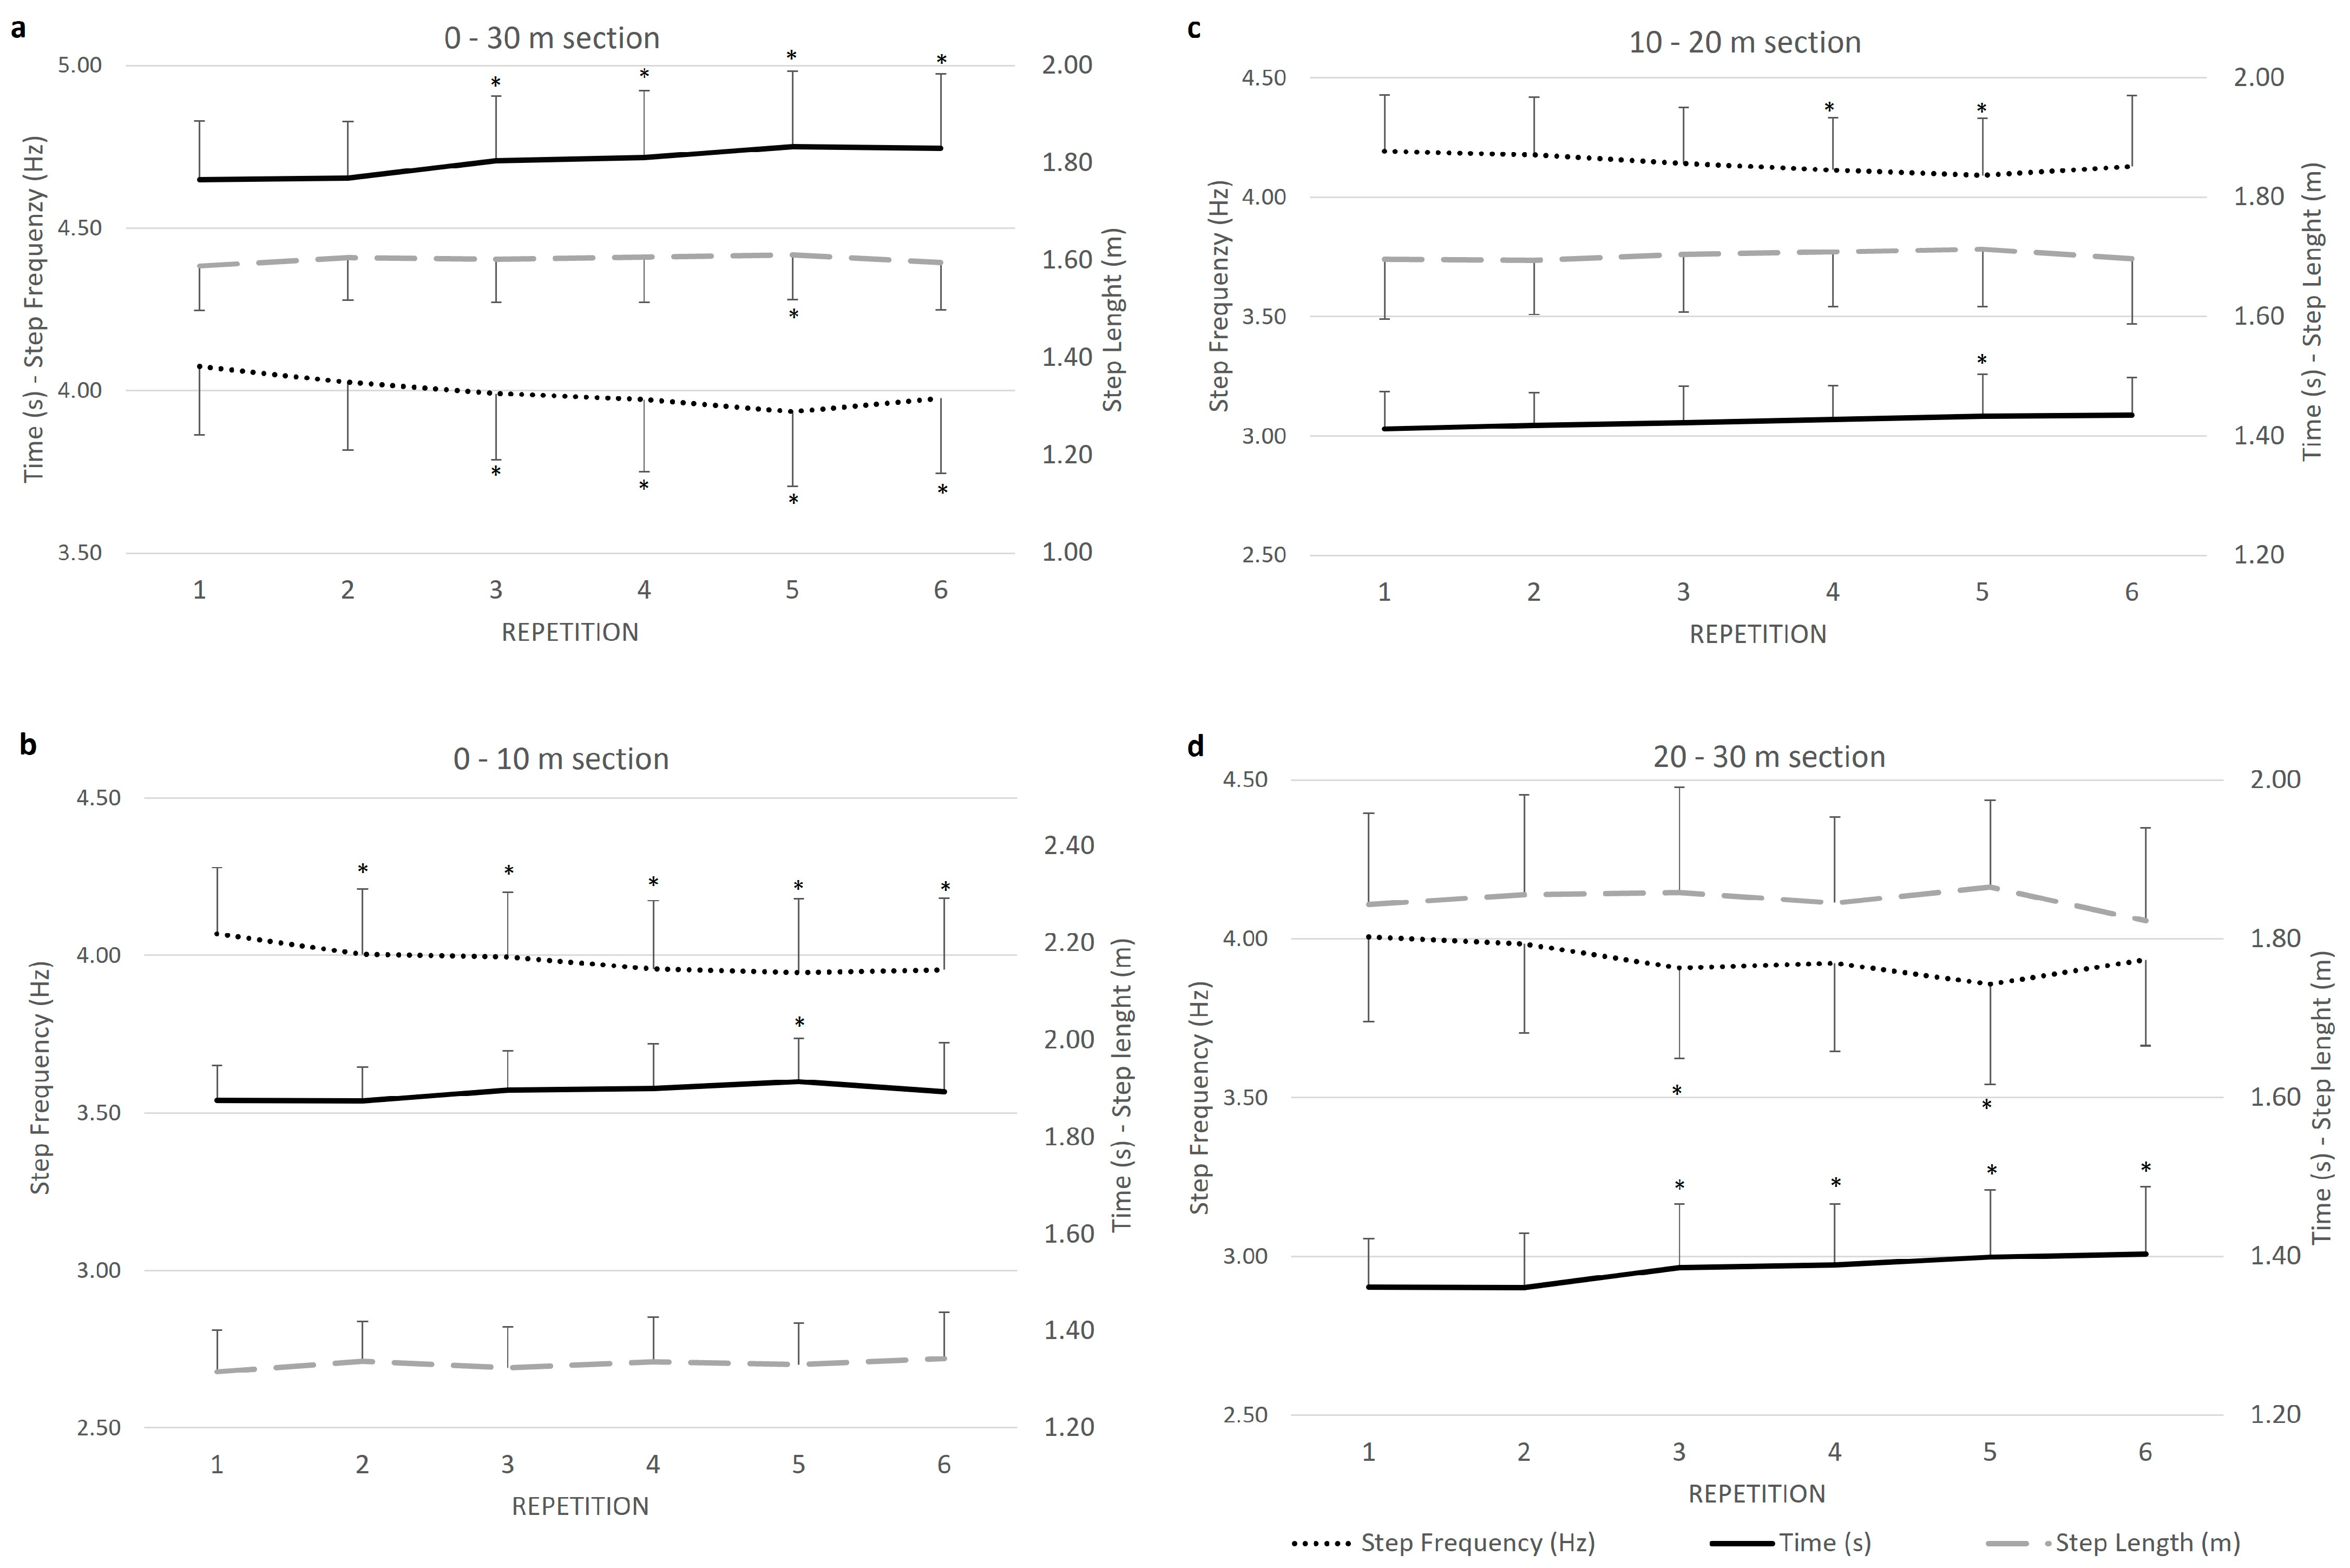
3.1. RSA Performance
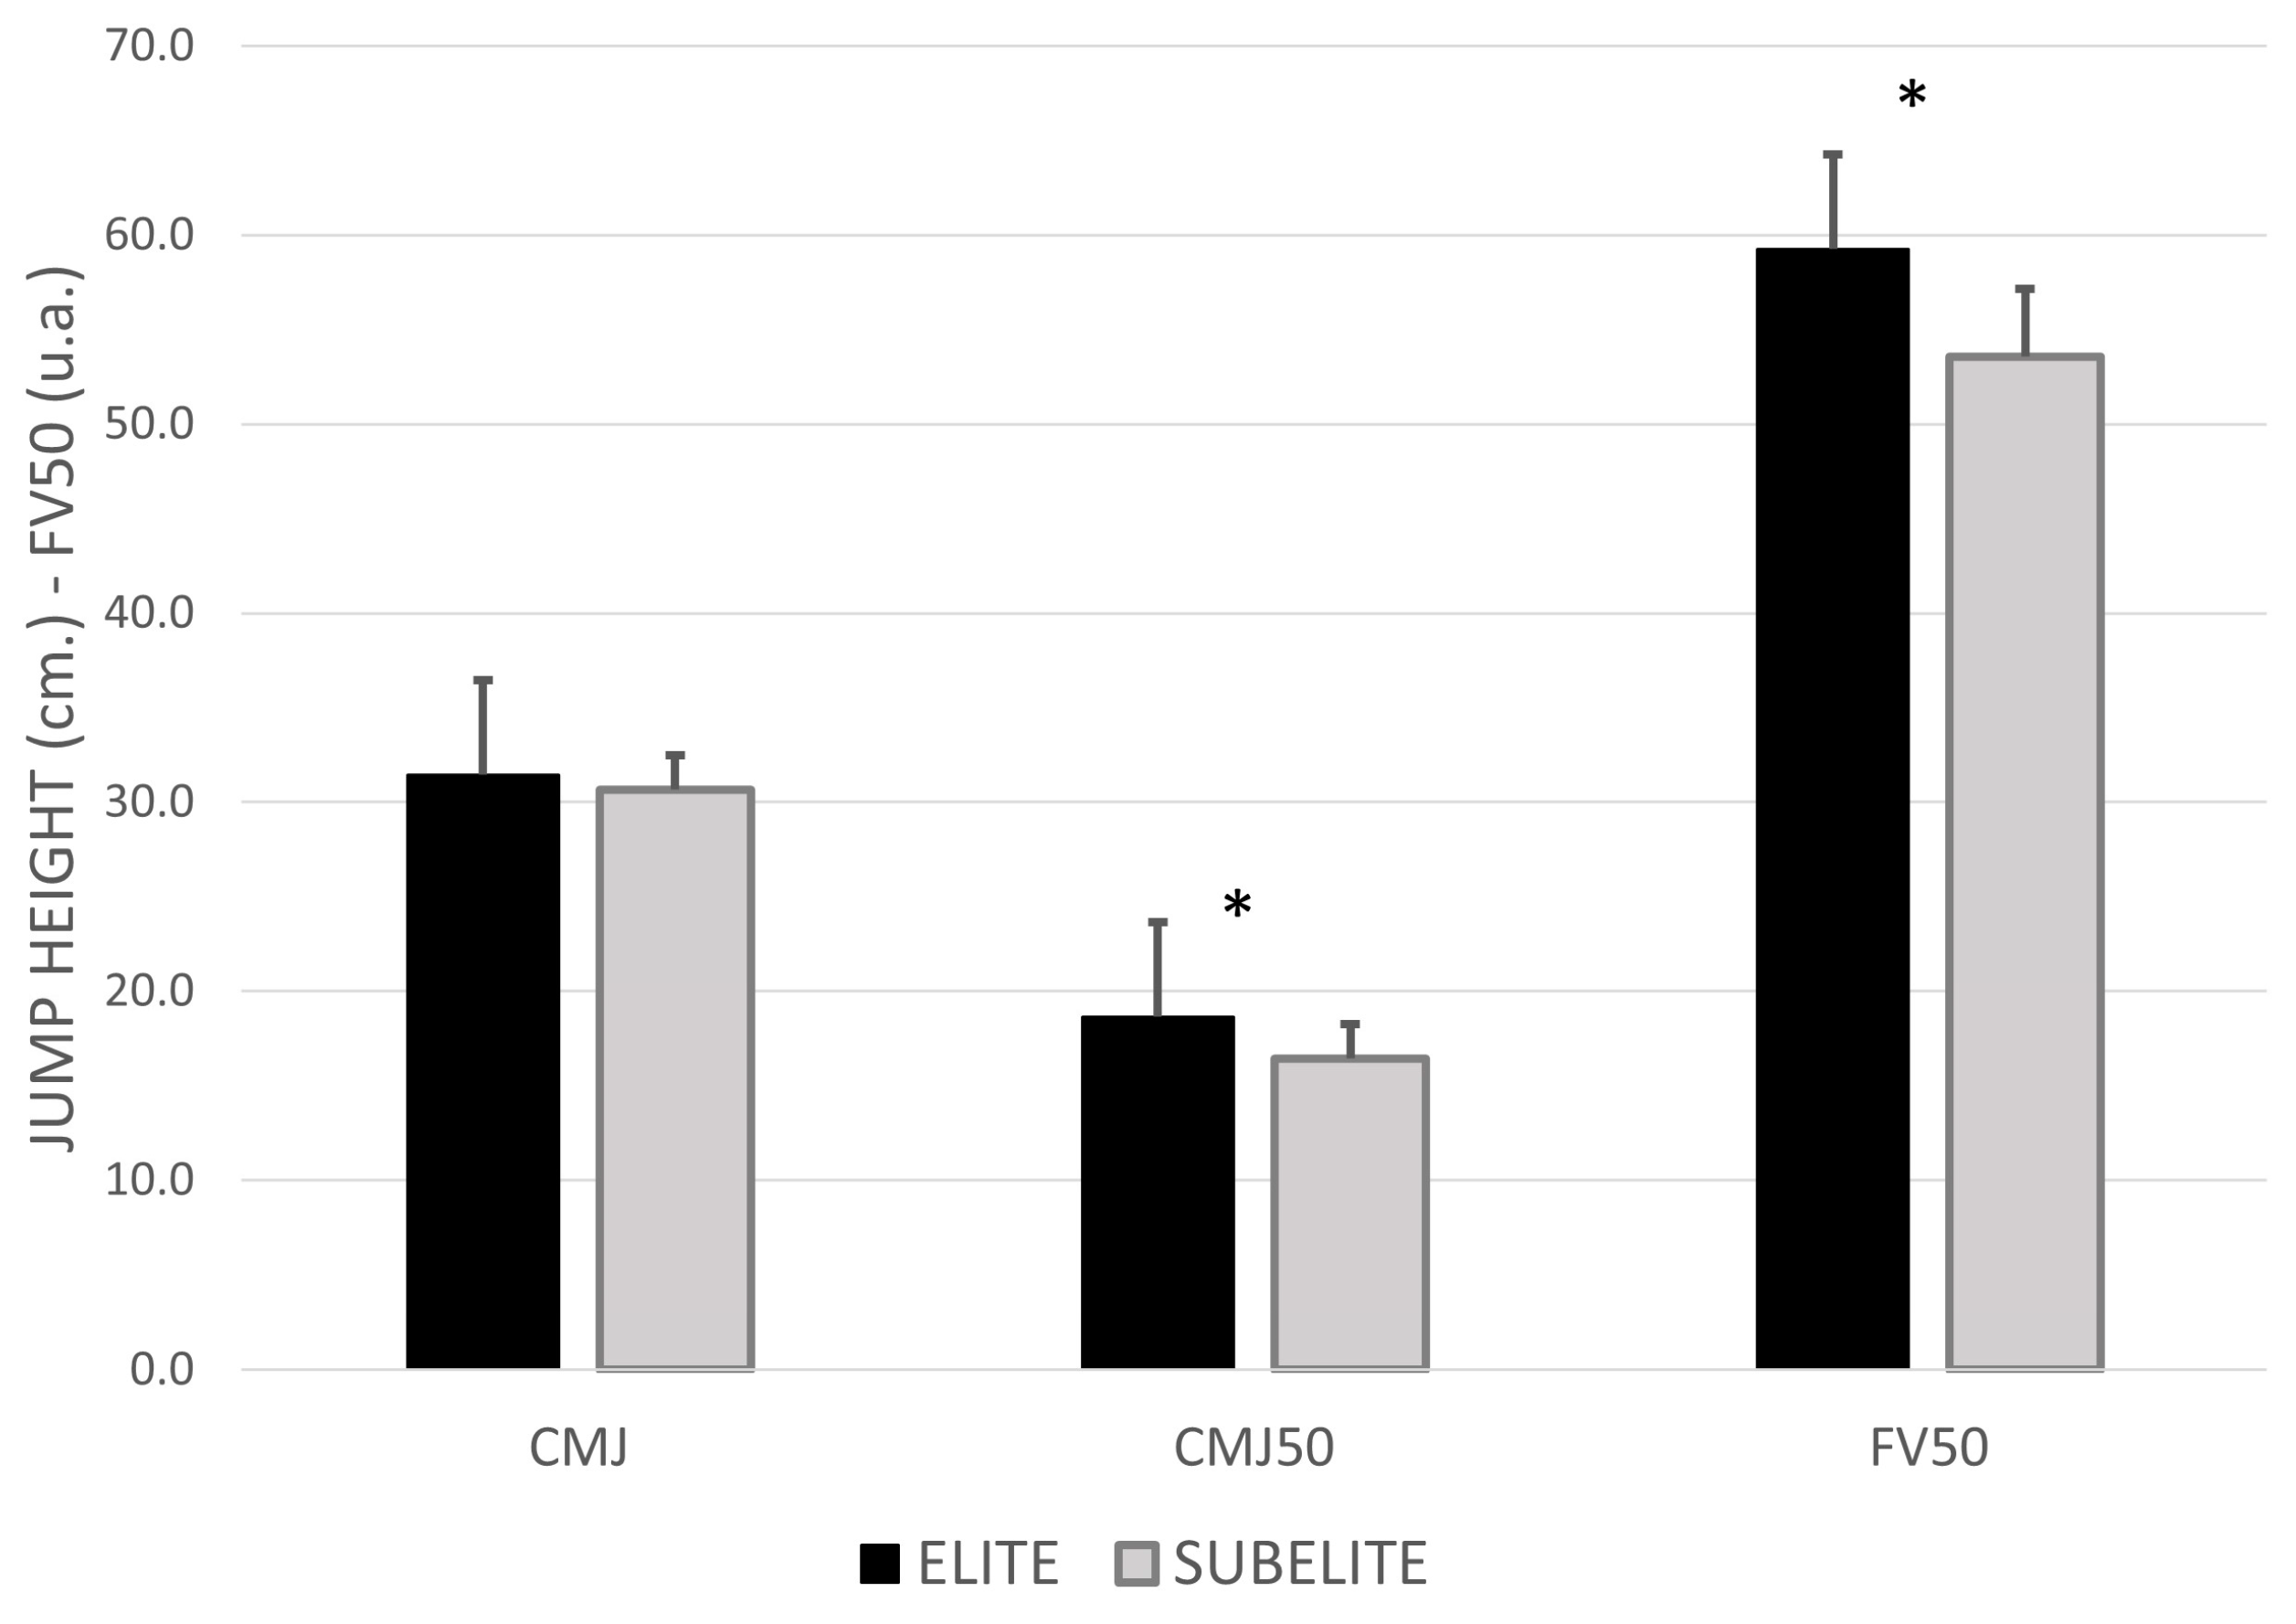
3.2. Jumping Performance
3.3. Performance Level
3.4. Correlation Coefficients
4. Discussion
4.1. Repeated Sprint Ability and Jumping Performance
4.2. Level of Competition
4.3. Correlations
4.4. Practical Applications
5. Conclusions
Author Contributions
Funding
Institutional Review Board Statement
Informed Consent Statement
Data Availability Statement
Acknowledgments
Conflicts of Interest
References
- McGuinness, A.; Malone, S.; Petrakos, G.; Collins, K. Physical and Physiological Demands of Elite International Female Field Hockey Players During Competitive Match Play. J. Strength Cond. Res. 2019, 33, 3105–3113. [Google Scholar] [CrossRef]
- McGuinness, A.; Passmore, D.; Malone, S.; Collins, K. Peak Running Intensity of Elite Female Field Hockey Players During Competitive Match Play. J. Strength Cond. Res. 2022, 36, 1064–1070. [Google Scholar] [CrossRef]
- Bishop, D.; Spencer, M.; Duffield, R.; Lawrence, S. The validity of a repeated sprint ability test. J. Sci. Med. Sport 2001, 4, 19–29. [Google Scholar] [CrossRef]
- Krustrup, P.; Mohr, M.; Nybo, L.; Draganidis, D.; Randers, M.B.; Ermidis, G.; Ørntoft, C.; Røddik, L.; Batsilas, D.; Poulios, A.; et al. Muscle metabolism and impaired sprint performance in an elite women’s football game. Scand. J. Med. Sci. Sports 2022, 32, 27–38. [Google Scholar] [CrossRef]
- González-Frutos, P.; Aguilar-Navarro, M.; Morencos, E.; Mallo, J.; Veiga, S. Relationships between strength and step frequency with fatigue index in repeated sprint ability. Int. J. Environ. Res. Public Health 2022, 19, 196. [Google Scholar] [CrossRef]
- Girard, O.; Brocherie, F.; Morin, J.B.; Degache, F.; Millet, G.P. Comparison of Four Sections for Analyzing Running Mechanics Alterations During Repeated Treadmill Sprints. J. Appl. Biomech. 2015, 31, 389–395. [Google Scholar] [CrossRef]
- Xu, D.; Quan, W.; Zhou, H.; Sun, D.; Baker, J.S.; Gu, Y. Explaining the differences of gait patterns between high and low-mileage runners with machine learning. Sci. Rep. 2022, 12, 2981. [Google Scholar] [CrossRef]
- Xu, D.; Zhou, H.; Quan, W.; Jiang, X.; Liang, M.; Li, S.; Ugbolue, U.C.; Baker, J.S.; Gusztav, F.; Ma, X.; et al. A new method proposed for realizing human gait pattern recognition: Inspirations for the application of sports and clinical gait analysis. Gait Posture 2024, 107, 293–305. [Google Scholar] [CrossRef]
- Brocherie, F.; Millet, G.P.; Girard, O. Neuro-mechanical and metabolic adjustments to the repeated anaerobic sprint test in professional football players. Eur. J. Appl. Physiol. 2015, 115, 891–903. [Google Scholar] [CrossRef] [PubMed]
- Figueira, B.; Goncąlves, B.; Abade, E.; Paulauskas, R.; Masiulis, N.; Kamarauskas, P.; Sampaio, J. Repeated Sprint Ability in Elite Basketball Players: The Effects of 10 × 30 m Vs. 20 × 15 m Exercise Protocols on Physiological Variables and Sprint Performance. J. Hum. Kinet. 2021, 77, 181–189. [Google Scholar] [CrossRef] [PubMed]
- Spencer, M.; Fitzsimons, M.; Dawson, B.; Bishop, D.; Goodman, C. Reliability of a repeated-sprint test for field-hockey. J. Sci. Med. Sport 2006, 9, 181–184. [Google Scholar] [CrossRef]
- Van den Tillaar, R. Comparison of Step-by-Step Kinematics in Repeated 30-m Sprints in Female Soccer Players. J. Strength Cond. Res. 2018, 32, 1923–1928. [Google Scholar] [CrossRef] [PubMed]
- Furlong, L.A.M.; Harrison, A.J.; Jensen, R.L. Measures of strength and jump performance can predict 30-m sprint time in rugby union players. J. Strength Cond. Res. 2021, 35, 2579–2583. [Google Scholar] [CrossRef]
- Philipp, N.M.; Cabarkapa, D.; Eserhaut, D.A.; Yu, D.; Fry, A.C. Repeat sprint fatigue and altered neuromuscular performance in recreationally trained basketball players. PLoS ONE 2023, 18, e0288736. [Google Scholar] [CrossRef]
- Pérez-Castilla, A.; Jaric, S.; Feriche, B.; Padial, P.; García-Ramos, A. Evaluation of muscle mechanical capacities through the two-load method: Optimization of the load selection. J. Strength Cond. Res. 2018, 32, 1245–1253. [Google Scholar] [CrossRef]
- Vélez Blasco, M. El entrenamiento de fuerza para la mejora del salto. Apunts Sports Med. 1992, 29, 139–156. Available online: https://www.apunts.org/es-el-entrenamiento-fuerza-mejora-del-articulo-X0213371792052916 (accessed on 20 December 2021).
- Chaabene, H.; Negra, Y.; Moran, J.; Prieske, O.; Sammoud, S.; Ramirez-Campillo, R.; Granacher, U. Plyometric Training Improves Not Only Measures of Linear Speed, Power, and Change-of-Direction Speed But Also Repeated Sprint Ability in Young Female Handball Players. J. Strength Cond. Res. 2021, 35, 2230–2235. [Google Scholar] [CrossRef]
- Jiménez-Reyes, P.; Samozino, P.; García-Ramos, A.; Cuadrado-Peñafiel, V.; Brughelli, M.; Morin, J.B. Relationship between vertical and horizontal force-velocity-power profiles in various sports and levels of practice. PeerJ 2018, 6, e5937. [Google Scholar] [CrossRef] [PubMed]
- Edwards, A.M.; Winter, E.; Drust, B. Sport-specific fitness testing differentiates professional from amateur soccer players where VO2max and VO2 kinetics do not. J. Sports Med. Phys. Fitness 2012, 52, 245–254. [Google Scholar]
- Massuça, L.M.; Fragoso, I.; Teles, J. Attributes of top elite team-handball players. J. Strength Cond. Res. 2014, 28, 178–186. [Google Scholar] [CrossRef] [PubMed]
- Ramos-Campo, D.J.; Rubio-Arias, J.; Carrasco-Poyatos, M.; Alcaraz-Ramón, P. Physical performance of elite and subelite Spanish female futsal players. Biol. Sport 2016, 33, 297–304. [Google Scholar] [CrossRef]
- Markovic, G.; Dizdar, D.; Jukic, I.; Cardinale, M. Reliability and Factorial Validity of Squat and Countermovement Jump Tests. J. Strength Cond. Res. 2004, 18, 551–555. [Google Scholar] [PubMed]
- Cohen, J. A power primer. Psychol. Bull. 1992, 112, 155–159. [Google Scholar] [CrossRef] [PubMed]
- Hopkins, W.G.; Marshall, S.W.; Batterham, A.M.; Hanin, J. Progressive statistics for studies in sports medicine and exercise science. Med. Sci. Sports Exerc. 2009, 41, 3–12. [Google Scholar] [CrossRef]
- Shalfawi, S.A.I.; Haugen, T.; Jakobsen, T.A.; Enoksen, E.; Tønnessen, E. The Effect of Combined Resisted Agility and Repeated Sprint Training vs. Strength Training on Female Elite Soccer Players. J. Strength Cond. Res. 2013, 27, 2966–2972. [Google Scholar] [CrossRef] [PubMed]
- González-Fimbres, R.A.; Hernández-Cruz, G.; Flatt, A.A. Ultrashort Versus Criterion Heart Rate Variability Among International-Level Girls’ Field Hockey Players. Int. J. Sports Physiol. Perform. 2021, 16, 985–992. [Google Scholar] [CrossRef]
- Kyles, A.; Oliver, J.L.; Cahill, M.J.; Lloyd, R.S.; Pedley, J. Linear and Change of Direction Repeated Sprint Ability Tests: A Systematic Review. J. Strength Cond. Res. 2023, 37, 1703–1717. [Google Scholar] [CrossRef]
- Goods, P.S.R.; McKay, A.K.; Appleby, B.; Veli, D.; Peeling, P.; Jennings, D. A repeated shuttle sprint test with female and male international field hockey players is reliable and associated with single sprint but not intermittent endurance performance. PLoS ONE 2022, 17. [Google Scholar] [CrossRef]
- Cuadrado-Peñafiel, V.; Castaño-Zambudio, A.; Martínez-Aranda, L.M.; González-Hernández, J.M.; Martín-Acero, R.; Jiménez-Reyes, P. Microdosing Sprint Distribution as an Alternative to Achieve Better Sprint Performance in Field Hockey Players. Sensors 2023, 23, 650. [Google Scholar] [CrossRef]
- Jimenez-Reyes, P.; Garcia-Ramos, A.; Parraga-Montilla, J.A.; Morcillo-Losa, J.A.; Cuadrado-Peñafiel, V.; Castaño-Zambudio, A.; Samozino, P.; Morin, J.B. Seasonal Changes in the Sprint Acceleration Force- Velocity Profile of Elite Male Soccer Players. J. Strength Cond. Res. 2022, 36, 70–74. [Google Scholar] [CrossRef]
- Paz-Franco, A.; Rey, E.; Barcala-Furelos, R. Effects of 3 Different Resistance Training Frequencies on Jump, Sprint, and Repeated Sprint Ability Performances in Professional Futsal Players. J. Strength Cond. Res. 2017, 31, 3343–3350. [Google Scholar] [CrossRef]
- Buchheit, M.; Mendez-Villanueva, A.; Delhomel, G.; Brughelli, M.; Ahmaidi, S. Improving Repeated Sprint Ability in Young Elite Soccer Players: Repeated Shuttle Sprints Vs. Explosive Strength Training. J. Strength Cond. Res. 2010, 24, 2715–2722. [Google Scholar] [CrossRef]
- Romero, V.; Lahti, J.; Castaño Zambudio, A.; Mendiguchia, J.; Jiménez Reyes, P.; Morin, J.B. Effects of Fatigue Induced by Repeated Sprints on Sprint Biomechanics in Football Players: Should We Look at the Group or the Individual? Int. J. Environ. Res. Public Health 2022, 19, 14643. [Google Scholar] [CrossRef] [PubMed]
- Runacres, A.; Mackintosh, K.A.; McNarry, M.A. Investigating the kinetics of repeated sprint ability in national level adolescent hockey players. J. Sports Sci. 2023. [Google Scholar] [CrossRef] [PubMed]
- Ettema, G. The Force–Velocity Profiling Concept for Sprint Running Is a Dead End. Int. J. Sports Physiol. Perform. 2023, 19, 88–91. [Google Scholar] [CrossRef] [PubMed]

| Team | Best | Mean | Worst | FImean | FIworst | |
|---|---|---|---|---|---|---|
| 0–30 m | ||||||
| Sprint Time (s) | Elite | 4.58 ± 0.22 | 4.67 ± 0.23 | 4.73 ± 0.25 | 1.87 ± 1.31 | 3.27 ± 1.97 |
| Subelite | 4.64 ± 0.13 | 4.74 ± 0.16 | 4.87 ± 0.19 | 2.16 ± 0.95 | 4.92 ± 2.06 * | |
| Step Frequency (Hz) | Elite | 4.13 ± 0.23 | 4.02 ± 0.25 | 3.93 ± 0.26 | −2.78 ± 1.45 | −4.95 ± 1.96 |
| Subelite | 4.07 ± 0.17 | 3.97 ± 0.16 | 3.87 ± 0.16 | −2.31 ± 1.02 | −4.68 ± 1.97 | |
| Step Length (m) | Elite | 1.63 ± 0.11 | 1.61 ± 0.11 | 1.58 ± 0.10 | −1.64 ± 0.74 | −3.45 ± 0.97 |
| Subelite | 1.63 ± 0.07 | 1.60 ± 0.07 | 1.56 ± 0.06 | −2.07 ± 1.00 | −4.45 ± 2.21 | |
| 0–10 m | ||||||
| Sprint Time (s) | Elite | 1.85 ± 0.09 | 1.89 ± 0.09 | 1.92 ± 0.08 | 2.28 ± 1.44 | 4.13 ± 2.05 |
| Subelite | 1.84 ± 0.07 | 1.90 ± 0.07 | 1.96 ± 0.09 | 3.39 ± 1.67 | 6.79 ± 2.20 * | |
| Step Frequency (Hz) | Elite | 4.13 ± 0.23 | 4.02 ± 0.25 | 3.93 ± 0.26 | −2.78 ± 1.45 | −4.95 ± 1.96 |
| Subelite | 4.05 ± 0.17 | 3.95 ± 0.16 | 3.86 ± 0.16 | −2.50 ± 0.84 | −4.78 ± 1.04 | |
| Step Length (m) | Elite | 1.36 ± 0.10 | 1.33 ± 0.09 | 1.30 ± 0.09 | −2.13 ± 0.78 | −4.37 ± 1.45 |
| Subelite | 1.39 ± 0.07 | 1.34 ± 0.07 | 1.29 ± 0.08 | −4.11 ± 2.24 * | −7.18 ± 2.95 * | |
| 10–20 m | ||||||
| Sprint Time (s) | Elite | 1.38 ± 0.07 | 1.41 ± 0.07 | 1.44 ± 0.08 | 2.02 ± 1.41 | 3.82 ± 2.13 |
| Subelite | 1.41 ± 0.04 | 1.44 ± 0.04 | 1.47 ± 0.05 | 1.84 ± 0.94 | 3.88 ± 1.58 | |
| Step Frequency (Hz) | Elite | 4.26 ± 0.27 | 4.17 ± 0.27 | 4.07 ± 0.29 | −2.32 ± 1.37 | −4.54 ± 1.99 |
| Subelite | 4.25 ± 0.27 | 4.11 ± 0.17 | 4.01 ± 0.17 | −3.02 ± 3.51 | −5.52 ± 4.48 | |
| Step Length (m) | Elite | 1.74 ± 0.11 | 1.71 ± 0.11 | 1.67 ± 0.12 | −1.95 ± 0.65 | −4.00 ± 1.45 |
| Subelite | 1.74 ± 0.06 | 1.69 ± 0.06 | 1.64 ± 0.08 | −2.79 ± 0.87 * | −6.14 ± 3.84 | |
| 20–30 m | ||||||
| Sprint Time (s) | Elite | 1.34 ± 0.08 | 1.37 ± 0.08 | 1.40 ± 0.09 | 2.55 ± 1.08 | 4.91 ± 1.78 |
| Subelite | 1.36 ± 0.05 | 1.40 ± 0.06 | 1.45 ± 0.06 | 3.05 ± 1.48 | 6.74 ± 3.60 | |
| Step Frequency (Hz) | Elite | 4.11 ± 0.30 | 4.01 ± 0.29 | 3.90 ± 0.30 | −2.48 ± 1.12 | −5.15 ± 2.41 |
| Subelite | 4.03 ± 0.20 | 3.85 ± 0.21 | 3.67 ± 0.24 * | −4.43 ± 1.87 * | −9.10 ± 4.21 * | |
| Step Length (m) | Elite | 1.88 ± 0.13 | 1.83 ± 0.12 | 1.79 ± 0.12 | −2.54 ± 0.65 | −4.92 ± 1.16 |
| Subelite | 1.94 ± 0.13 | 1.86 ± 0.10 | 1.79 ± 0.08 | −4.01 ± 1.91 * | −7.76 ± 3.57 * |
| Jump Test | 0–30 m | 0–10 m | 10–20 m | 20–30 m | ||||||||
|---|---|---|---|---|---|---|---|---|---|---|---|---|
| CMJ50 | FV50 | ST_ FIworst | ST_ FIworst | SL_ FImean | SL_ FIworst | SL_ FIworst | SF_ worst | SF_ FImean | SF_ FIworst | SL_ FImean | SL_ FIworst | |
| Jump Test | ||||||||||||
| CMJ50 | 1 | 0.697 * | −0.455 * | −0.292 | 0.141 | 0.062 | 0.104 | 0.448 * | 0.188 | 0.255 | 0.125 | 0.151 |
| FV50 | 1 | −0.490 * | −0.488 * | 0.312 | 0.257 | 0.095 | 0.464 * | 0.335 | 0.353 | 0.342 | 0.362 | |
| 0–30 m | ||||||||||||
| ST_FIworst | 1 | 0.656 * | −0.296 | −0.306 | −0.144 | −0.640 * | −0.252 | −0.580 * | −0.551 * | −0.385 | ||
| 0–10 m | ||||||||||||
| ST_FIworst | 1 | −0.727 * | −0.641 * | 0 | −0.207 | 0.006 | −0.243 | −0.229 | −0.086 | |||
| SL_FImean | 1 | 0.927 * | 0.042 | −0.017 | 0.142 | 0.238 | 0.213 | 0.162 | ||||
| SL_FIworst | 1 | 0.003 | 0.098 | 0.266 | 0.321 | 0.318 | 0.247 | |||||
| 10–20 m | ||||||||||||
| SL_FIworst | 1 | 0.068 | 0.147 | 0.175 | 0.165 | 0.276 | ||||||
| 20–30 m | ||||||||||||
| SF_worst | 1 | 0.513 * | 0.591 * | 0.509 * | 0.482 * | |||||||
| SF_FImean | 1 | 0.848 * | 0.685 * | 0.772 * | ||||||||
| SF_FIworst | 1 | 0.813 * | 0.807 * | |||||||||
| SL_FImean | 1 | 0.877 * | ||||||||||
| SL_FIworst | 1 | |||||||||||
Disclaimer/Publisher’s Note: The statements, opinions and data contained in all publications are solely those of the individual author(s) and contributor(s) and not of MDPI and/or the editor(s). MDPI and/or the editor(s) disclaim responsibility for any injury to people or property resulting from any ideas, methods, instructions or products referred to in the content. |
© 2024 by the authors. Licensee MDPI, Basel, Switzerland. This article is an open access article distributed under the terms and conditions of the Creative Commons Attribution (CC BY) license (https://creativecommons.org/licenses/by/4.0/).
Share and Cite
Rivera, C.; González-Frutos, P.; Naclerio, F.; Mallo, J.; Veiga, S. Relationship between Repeated Sprint Ability and Force–Velocity Profile in Elite and Subelite Female Field Hockey Players. Appl. Sci. 2024, 14, 9003. https://doi.org/10.3390/app14199003
Rivera C, González-Frutos P, Naclerio F, Mallo J, Veiga S. Relationship between Repeated Sprint Ability and Force–Velocity Profile in Elite and Subelite Female Field Hockey Players. Applied Sciences. 2024; 14(19):9003. https://doi.org/10.3390/app14199003
Chicago/Turabian StyleRivera, Carlos, Pablo González-Frutos, Fernando Naclerio, Javier Mallo, and Santiago Veiga. 2024. "Relationship between Repeated Sprint Ability and Force–Velocity Profile in Elite and Subelite Female Field Hockey Players" Applied Sciences 14, no. 19: 9003. https://doi.org/10.3390/app14199003
APA StyleRivera, C., González-Frutos, P., Naclerio, F., Mallo, J., & Veiga, S. (2024). Relationship between Repeated Sprint Ability and Force–Velocity Profile in Elite and Subelite Female Field Hockey Players. Applied Sciences, 14(19), 9003. https://doi.org/10.3390/app14199003