Abstract
Operational loads of an aircraft are the prerequisite for assessing its safety or fatigue life. Traditionally, numerous strain gauge sensors are installed to monitor the operational loads, which inevitably increase the weight and system complexity of the aircraft. Therefore, in order to decrease the maintenance costs and data redundancy, the number and location of strain sensors should be optimized for accurate and reliable operational load monitoring. In this paper, a novel two-stage strain gauge location optimization method is proposed to reduce the number of strain gauges while maintaining the operational load monitoring accuracy, which is validated by a numerical case study of an aircraft wing. In the first stage, the traditional Pearson correlation measure is harnessed to initially eliminate numerous correlated strain gauge monitoring points, reducing 996 original strain gauge measurement points to 13 for the aircraft wing box. In the second stage, an improved correlation measure method is proposed to further reduce the 13 strain gauge points to 2, which can evaluate the correlation degree of several variables and simultaneously determine the optimal strain monitoring locations for the two load actuators in this study. The relative errors between the predicted loads and the actual loads for both load actuators are less than 4% when only two optimized monitoring points are adopted. In addition, a comparison study with LASSO regression and principal component regression methods is conducted. The results demonstrate that the proposed method has the characteristics of less monitoring points and higher load prediction precision.
1. Introduction
The actual flight operational loads that are experienced by an aircraft play a crucial role in evaluating its fatigue life and structural integrity [1,2,3]. To measure the load environment, operational load monitoring devices are installed on an aircraft, and typically the strain gauge sensors are utilized for operational load monitoring. Their placement significantly affects the accuracy and reliability of the measurements, as the incorrect placement of strain gauges can lead to misinterpretation of stress distributions [4,5]. In order to acquire or monitor accurate aircraft operational loads, numerous sensors should be installed, as the more strain gauges installed on the aircraft, the more comprehensive the acquired aircraft operation load [6,7]. However, it is not realistic to install numerous stain gauges on an aircraft due to reasons such as sensor installation technology and increasing aircraft weight [8,9]. Moreover, a large number of strain gauges will generate a large amount of monitoring data, which will make it difficult to analyze and use the information of the aircraft structure effectively. In addition, if the positions of the strain gauges on the actual aircraft structure are not reasonable, it will not be possible to obtain the most effective monitoring data for the representation of the aircraft’s health state, which will decrease the accuracy and effectiveness of the structural health monitoring system [10,11]. Optimal placement minimizes the number of gauges needed, reducing costs while maintaining measurement accuracy [12,13]. Therefore, reasonable strain gauge monitoring locations for accurate operational load monitoring is a key problem that should be addressed first.
Recently, more and more researchers are becoming attracted to investigating the monitoring location optimization of structural sensor networks and have proposed a variety of methods for sensor network layout optimization [14,15]. Different strain gauge location optimization methods have their advantages and application scopes. Currently, the research objects of sensor network optimization mainly focus on structures such as bridges and large-scale buildings, and most of them are based on the dynamic characteristics of the optimal layout [16,17,18]. The optimization of strain gauge sensors for vibration modes, structural deflection, and damage identification and assessment has been widely investigated [19,20,21,22]. However, the strain gauge network based on the statics/fatigue characteristics of aircraft structures is normally installed based on the force transfer path of aircraft structures and the engineering experience.
Traditionally, strain gauge location optimization is achieved via optimization algorithms such as genetic algorithms or sensitivity analysis. The latter examines how variations in gauge placements affect measurement reliability [23]. Nevertheless, the optimization of strain sensor networks for an aircraft is rarely investigated [24,25]. In reference [24], a heuristic approach (genetic algorithm) with repeated deterministic local optimization was proposed for strain gauge placement optimization. A genetic algorithm is powerful optimization tool, but it also comes with several drawbacks, like slow convergence, dependence on fitness function, limited representation capability, or a lack of physical explanation. In reference [25], the strain monitoring locations are determined based on engineering intuition, which may not be sufficient.
Moreover, feature selection and feature extraction can be harnessed for strain gauge location optimization [26,27,28]. Feature extraction is the process of decreasing the dimension of the measured datasets. Projection approaches like principal component analysis (PCA) [29] or the unsupervised clustering algorithm [30] are normally adopted. Feature selection involves choosing a small number of useful features from numerous features [31]. The features that are not relevant to the problem or are insensitive to the problem should be removed, and a subset (i.e., the optimized monitoring points) of the most important features of the problem will be selected. Common feature selection methods include the correlation coefficient method [32,33] and the least absolute shrinkage and selection operator (LASSO) regression method [34,35]. Moreover, some popular optimization principles are typically harnessed, which are the gauge orthogonality criterion, strain gradient criterion, and distance constraint. When compared to the LASSO method, the correlation coefficient method examines the measured strain data for strain monitoring location optimization, which is more efficient. However, the traditional correlation method based on Pearson correlation can only evaluate the strain correlation degree between any two monitoring points. When the first two monitoring points are determined, it is impossible to select the third one. In order to optimize the strain monitoring points based on a minimum correlation criterion, an improved correlation method is proposed to estimate the correlation degree of a couple of strain monitoring points.
The major contribution of this study is that a strain gauge location optimization method based on a minimum correlation method is proposed. To overcome the drawback of the Pearson correlation method, an improved correlation method is proposed to measure the correlation degree of a couple of strain monitoring points. In this study, only the strain data are required for strain gauge location optimization, which can provide accurate load prediction results. The rest of this study is outlined as follows. In Section 2, a strain monitoring location optimization method is proposed based on a minimum correlation criterion. Instead of the traditional Pearson correlation method, an improved correlation method is defined to measure the correlation between a certain monitoring point and many other monitoring points. Moreover, based on an aircraft wing box, the proposed correlation method for strain gauge location optimization is validated and proven to be effective and accurate in Section 3. And then, a comparison with LASSO regression and principal component regression is conducted in Section 4 to demonstrate the advantages of the proposed correlation method. Finally, some key conclusions are summarized in Section 5.
2. Strain Gauge Location Optimization Based on a Minimum Correlation Criterion
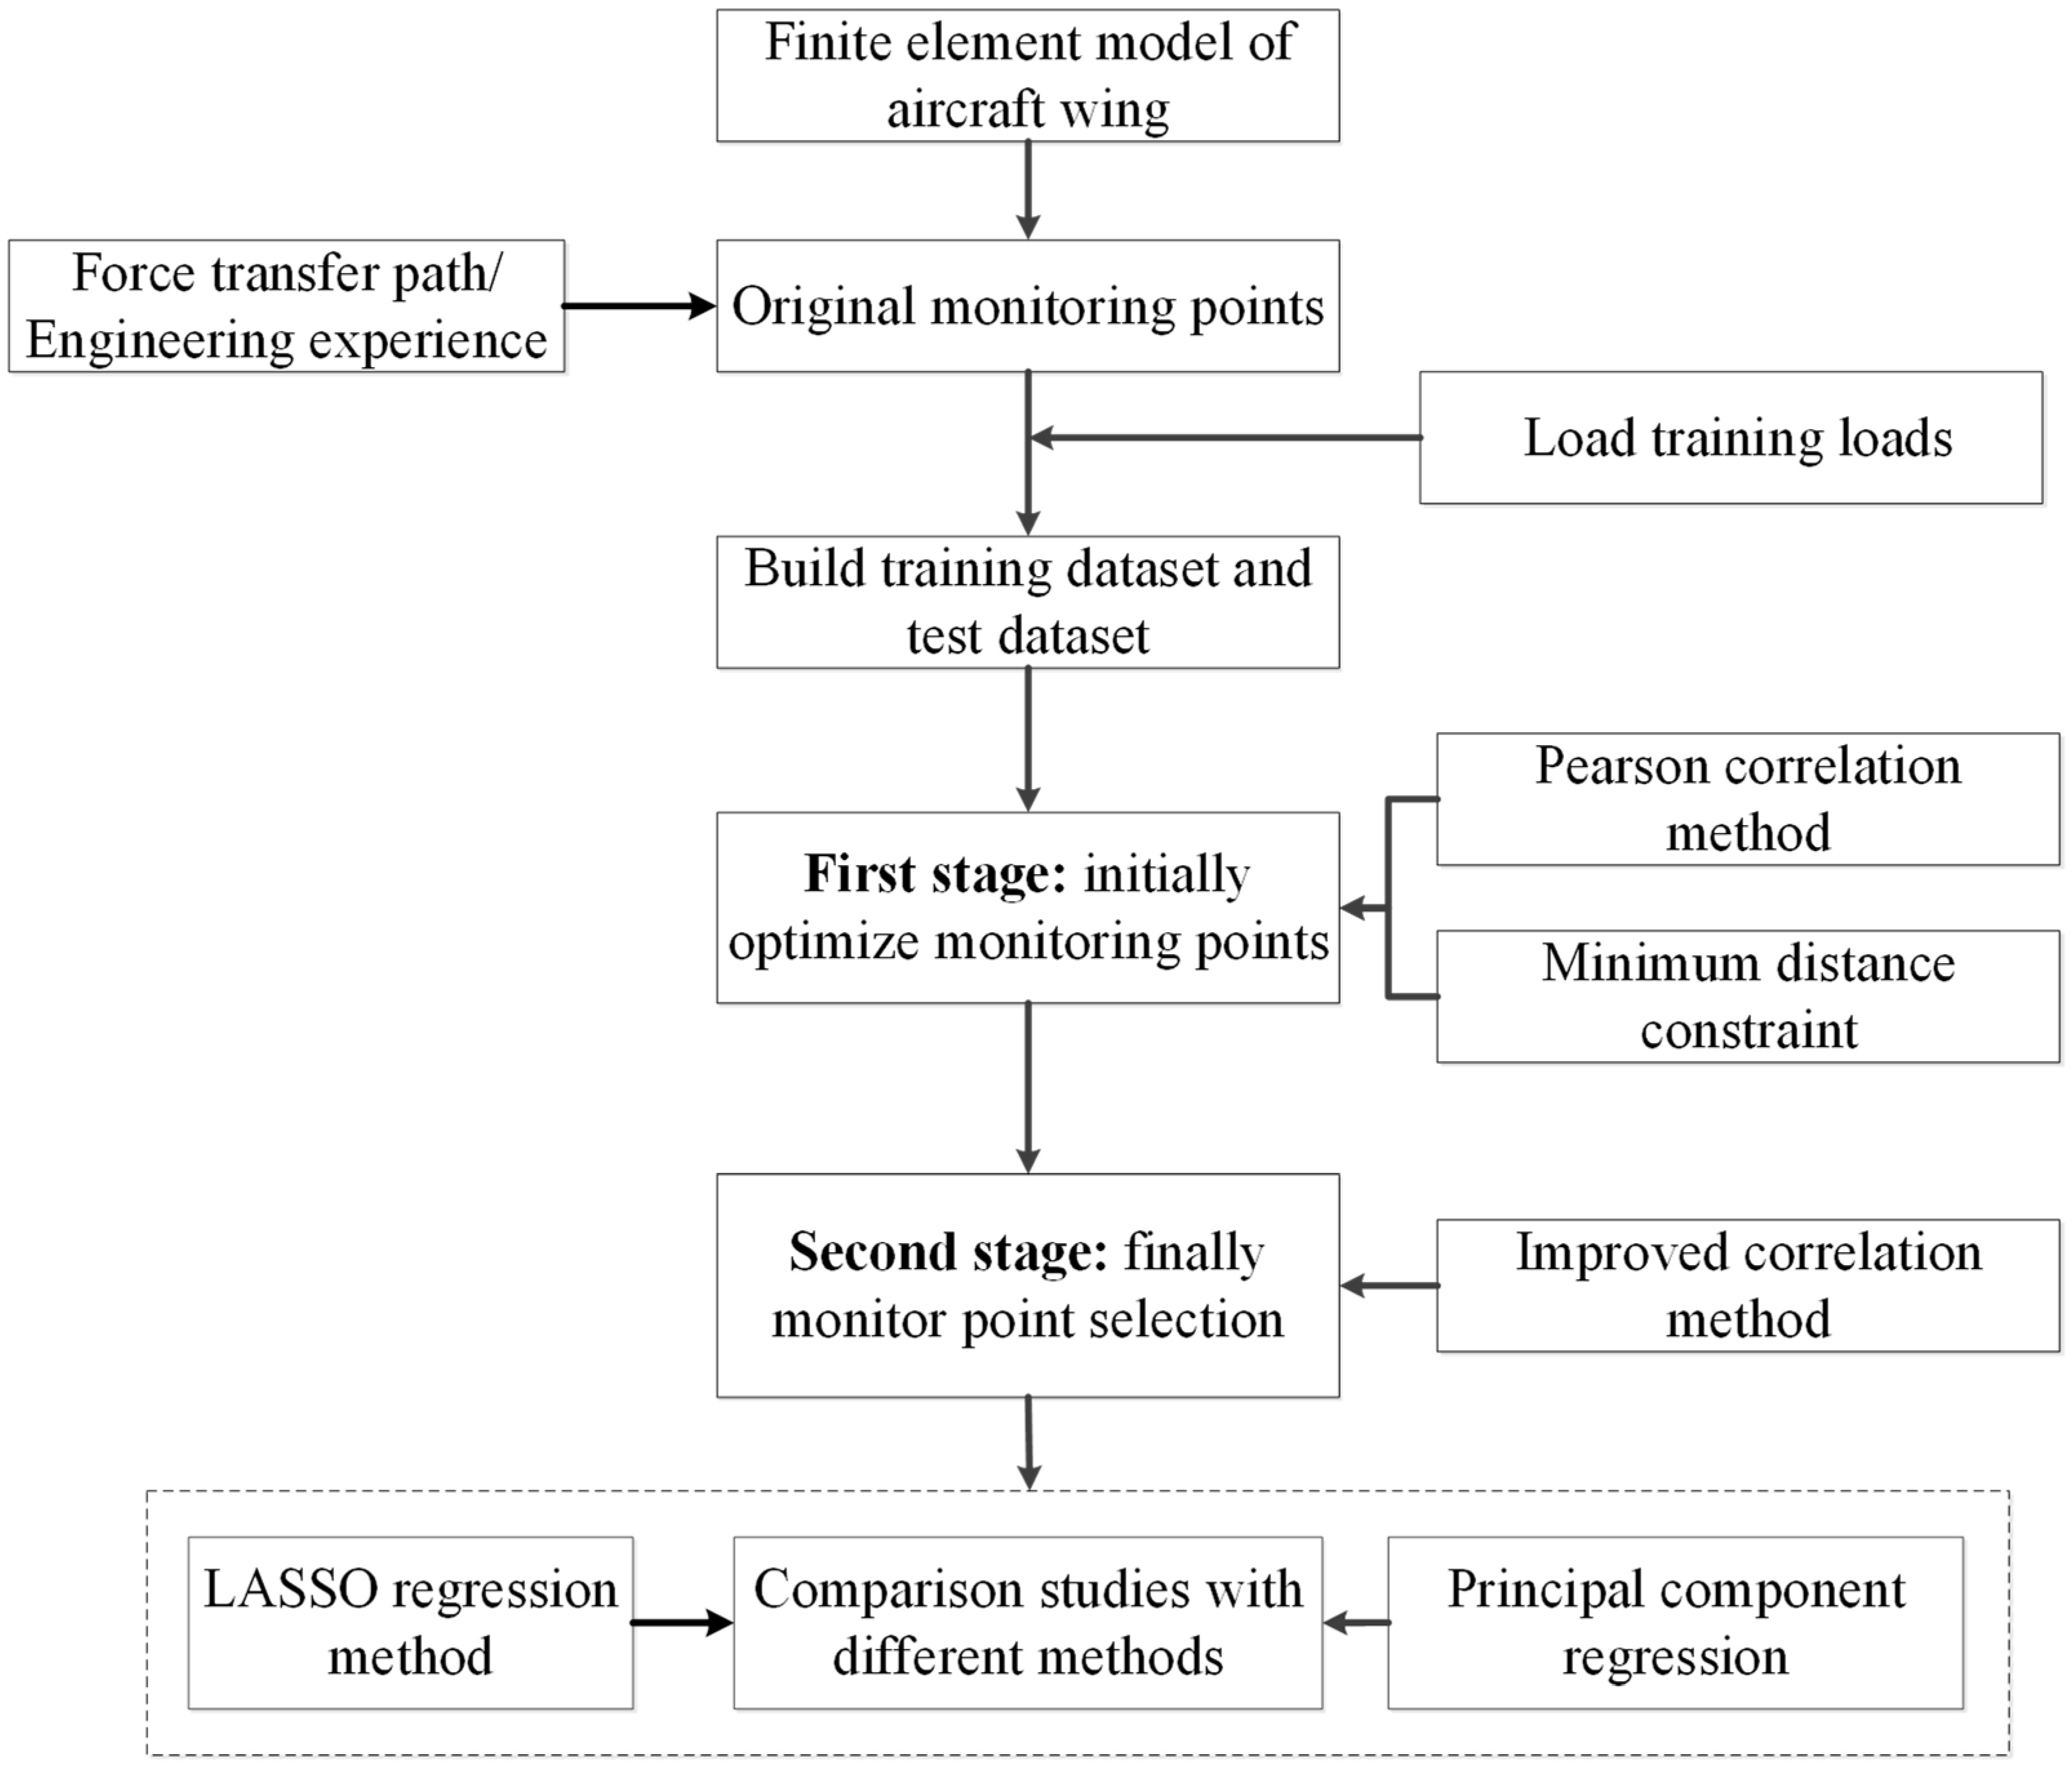
In order to estimate the aircraft wing servicing life, the main object is to monitor actual operational load/strain information, which is obtained by placing strain gauge sensors on the aircraft wings. By establishing the mapping relationship between the operational loads and the strain gauge data, the actual flight loads can be obtained by strain inversion. In this study, the optimization of the strain gauge locations of an aircraft wing box segment will be investigated based on a two-stage correlation measure method. The flowchart of this paper is given in Figure 1.
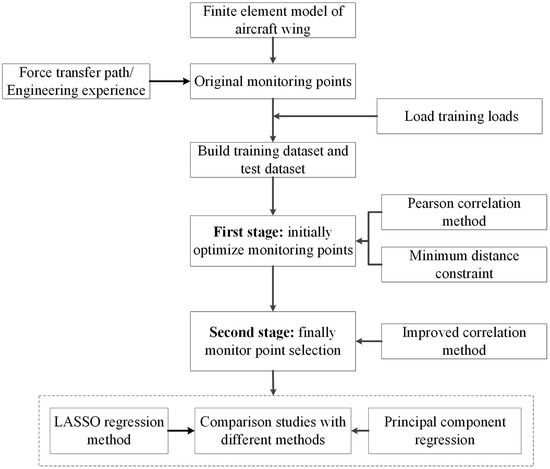
Figure 1.
Flowchart of two-stage strain gauge location optimization method.
The major steps of this study illustrated in Figure 1 are summarized here. Firstly, the flight operation loads of the aircraft wing are simulated based on the actual flight load condition, and then the training and testing datasets are obtained. The measured values of the strain gauges are obtained via the finite element model (FEM). For this proposed two-stage minimum correlation method, a Pearson correlation approach and a minimum distance constraint are taken to significantly decrease the strain gauge monitoring points in the first stage. Based on the above preliminary selection, an improved correlation coefficient method is proposed to further optimize the strain gauge locations in the second stage, in which a new strain gauge is determined by minimizing the average correlation with the preselected strain gauges. Many more details are presented in the following.
2.1. Traditional Pearson Correlation Method
Traditional Pearson correlation is a statistical means that can only be adopted to quantify the correlation degree between two different variables [36]. The linear correlation degree of two variables via Pearson correlation is defined as
in which indicates the correlation coefficient; denotes the covariance between variable and variable ; represents the variance of .
For operation load monitoring based on strain gauges, the corresponding strain values of a strain gauge under various flight loads are a vector. By computing the correlation coefficient between different strain monitoring points, the correlation degree between different pairs of strain monitoring points is obtained. Normally, a certain strain monitoring point can be adopted, and other highly correlated strain monitoring locations should be discarded. The aim of strain gauge location optimization is to maximally decrease the strain monitoring sensors while ensuring the accuracy of structural load identification. Therefore, it is necessary to select some strain gauge monitoring locations with the minimum correlation degree as the final strain gauge locations. In this case, the strain sensor network can be rationally arranged, and the operational loads of an aircraft wing will be accurately and efficiently estimated.
However, in this method, the correlation degree between the strain data of two locations are evaluated, but it is hard to simultaneously measure the strain data correlation degree of several strain gauge locations. To tackle this challenge, an improved correlation measure is proposed.
2.2. The Proposed Improved Correlation Method Based on a Minimum Correlation Criterion
The aim of this paper is to find the fewest number of strain gauge locations to satisfy the requirements of the accuracy of the inversion loads. The selection principle is that the first strain gauge location is primarily defined, and then the second strain gauge location is determined based on the minimum correlation criterion. But for the third or later strain gauge locations, traditional Pearson correlation cannot address this. The reason is that a third strain location is hard to be simultaneously uncorrelated with the first two strain gauge locations. Therefore, a new strain monitoring location should be selected, which has little correlation with all of the previously determined strain monitoring points and has almost identical Pearson correlation coefficients with all of them. In order to obtain the optimal third strain monitoring point and subsequent strain monitoring points, an improved correlation coefficient method is proposed in this study based on the minimum correlation criterion.
The proposed method should be able to evaluate the comprehensive correlation between several variables, which is defined as
where is the mean square root of the correlation coefficient between the k-th monitoring point and all previous selected monitoring points, and the strain monitoring point with the smallest will be adopted as the new monitoring point; , , …, are the Pearson correlation coefficients between the added strain monitoring point k with the pre-selected l monitoring points.
According to Equation (2), the equal sign is valid when and only when . When the strain monitoring point with the smallest is selected, it indicates that this monitoring point possesses nearly identical Pearson correlation degrees with each of the preselected monitoring points. In other words, when the sum of the Pearson correlation coefficient in Equation (2) is smaller, the Pearson correlation coefficients , , …, are small and tend to be close with each other. In this case, the proposed improved correlation coefficient method is capable of selecting a new monitoring point which is less correlated with the previous l characteristic strain monitoring points.
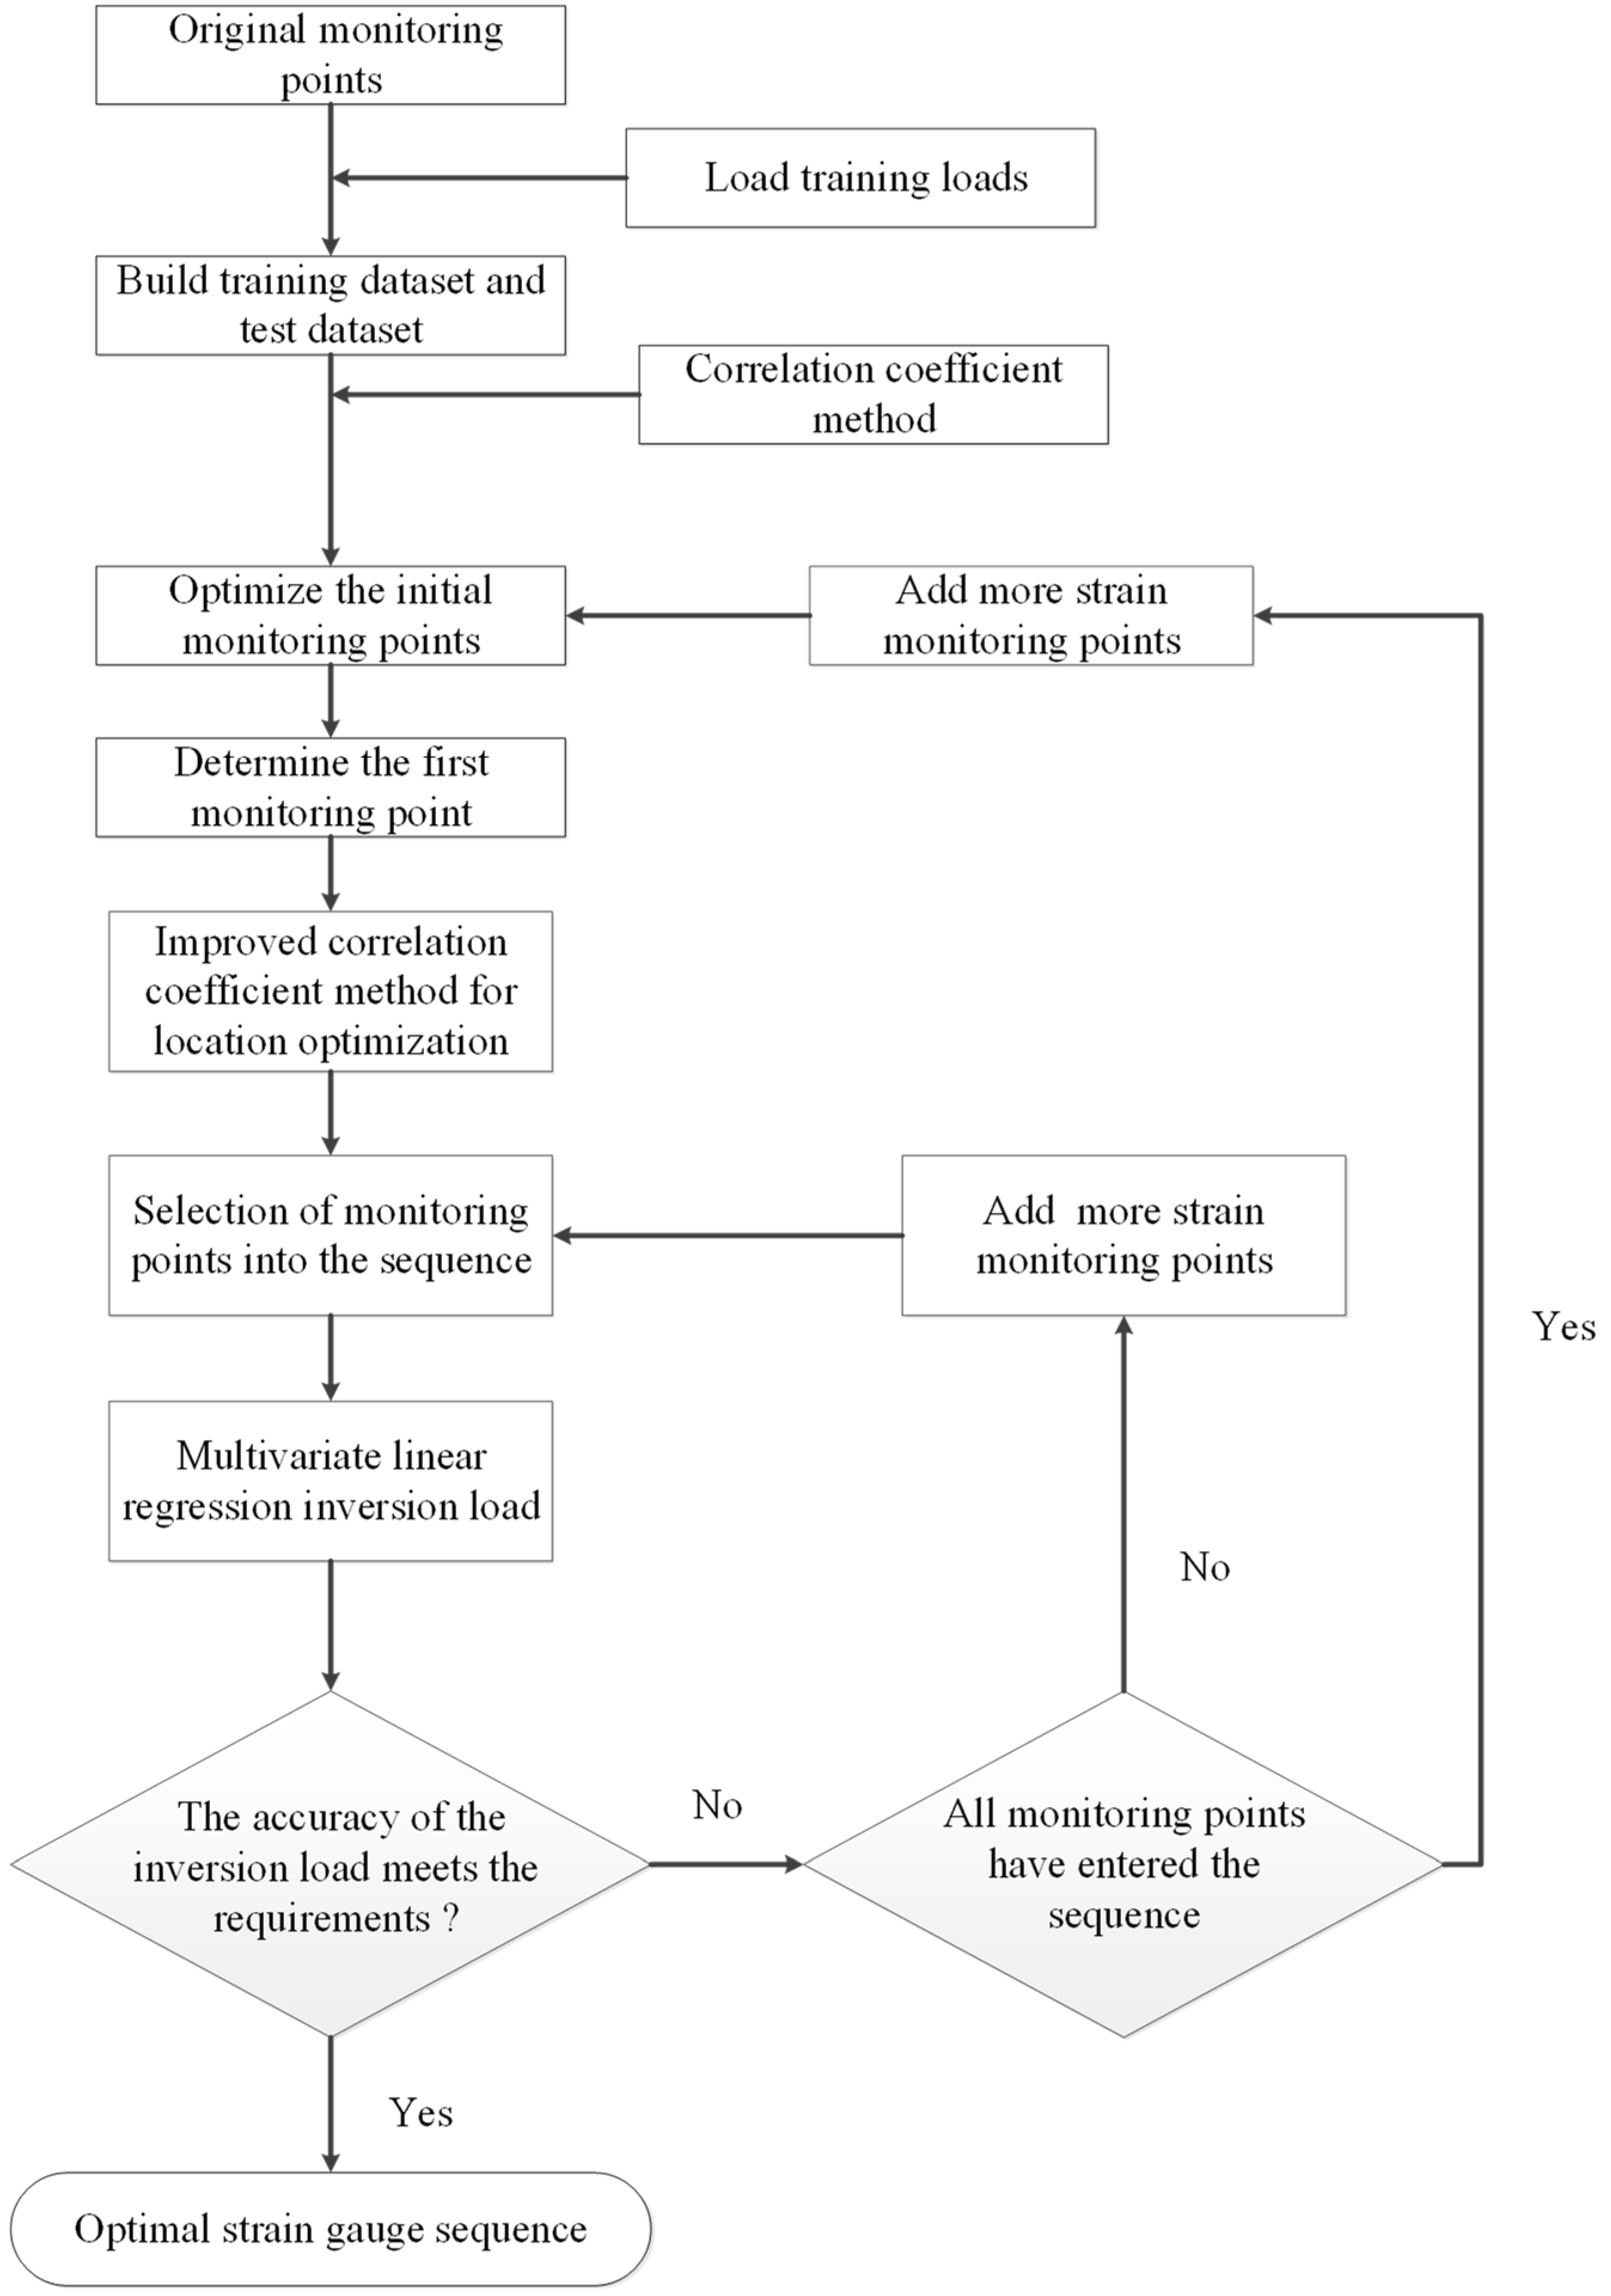
The objective of the optimized selection method via the improved correlation coefficient method is to select a set of least correlated strain monitoring locations, and the optimized strain monitoring points will be used as the final strain monitoring locations. At the selected strain monitoring point, the corresponding strain sensor is arranged to form the optimized strain sensor network. The specific flow of the optimal selection method of characteristic strain monitoring points using an enhanced correlation coefficient method is shown in Figure 2.
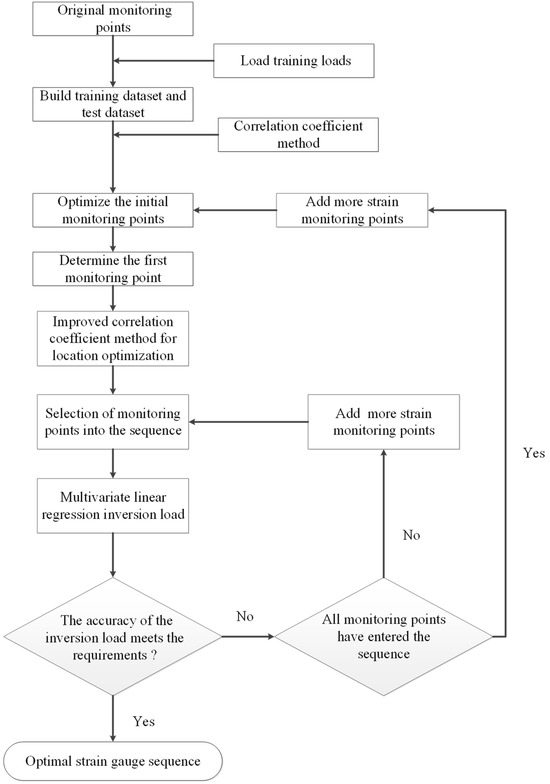
Figure 2.
Improved correlation method for strain monitoring point optimization.
As demonstrated in Figure 2, the four procedures of the proposed two-stage strain gauge location optimization method are described as follows:
- Step 1: Select the original monitoring points
For the different structures to be monitored on the aircraft, the strain distribution of the aircraft structure under various load conditions is obtained by using the finite element model. Based on engineering experience or force transfer path analysis, m (m is usually much larger than the actual monitoring requirement) monitoring points are adopted as the original monitoring points. The locations of the original monitoring strain gauges are usually the positions where the strain values are relatively large and the structural geometry is flat (the stress gradient cannot be too large).
- Step 2: Build the training dataset and test dataset
The training dataset should be as comprehensive as possible in response to the operational load characteristics of the aircraft wing structure. For a real aircraft, as many monitoring points as possible should be used to obtain the strain vector under a variety of combined loading conditions, but this requires a lot of costs, so the finite element model can be constructed through virtual loading measurement to obtain the strain vector matrix. The strain values of m original monitoring points under n combined loading conditions are evaluated, as illustrated in Table 1. A strain vector with n elements is obtained at each original monitoring location; some data are selected as the training dataset in n loading conditions, while some data are utilized as the testing set, and the sample number of the training dataset is much larger than that of the testing dataset.

Table 1.
Strain values of monitoring points under different load conditions (unit: ).
- Step 3: Initial selection of original monitoring points for the first stage
The strain values of each strain gauge are computed for various loading conditions via the FEM, and the strain monitoring point with the largest strain can be selected as the initial monitoring point. Then, the Pearson correlation coefficient of different monitoring points is calculated with the normalized column vector in Table 1, and the (redundant) monitoring points with a high correlation coefficient are removed, which is also considered the minimum distance constraint.
where indicates the coordinates of the i-th strain gauge location and is the threshold with a positive value.
- Step 4: Determine the optimal monitoring locations in the second stage
It is assumed that after the initial screening in the first stage, there are still p monitoring points; all of the p monitoring points will be taken as the first monitoring point successively, and the other monitoring points are sorted in turn. It should be noted that it is preferred that the monitoring point with the largest strain value is adopted as the first monitoring point to boost the efficiency. The improved correlation coefficient value between the remaining p-1 strain monitoring locations and the first strain monitoring point is evaluated. The second monitoring point is the monitoring point with the minimum absolute value of the improved correlation coefficient. Then, the improved correlation coefficient between the remaining p-2 strain monitoring locations and the first two strain monitoring points is computed. The strain monitoring point corresponding to the least improved correlation coefficient is the third monitoring point. In turn, the p monitoring points are screened and sorted. Based on the results of the above order, monitoring points 1, 2, 3, …, p are individually selected. The operational loads of the test set are predicted using multivariate linear regression to determine whether the p-monitoring point sequence meets the requirement of the load prediction accuracy. If the prediction accuracy does not satisfy the requirement, we must increase the monitoring points until the load prediction accuracy is satisfied.
It should be noted that this proposed correlation method requires numerous strain monitoring points for the initial selections. Moreover, in the second stage, the proposed method needs to compare the performance to select the optimal strain monitoring sequence when different first monitoring points are taken. In addition, the accessibility of the monitoring points for a real aircraft wing is not considered in this study. In this case, it will be hard to maintain the strain gauges. In addition, some strain gauges may be broken during service, and alternative sensors should be considered in advance, which is out of the scope of this study.
3. Strain Gauge Location Optimization of an Aircraft Wing
3.1. Finite Element Model of an Aircraft Wing
An aircraft wing specimen is fixed by the supporting box section and the loading actuators via the bolt connections at the end of wing tail. The flight operational loads are simulated and implemented by two loading actuator cells, as shown in Figure 3. The simulated operational loads are applied by inverting the wing characteristic box test piece (top wing surface is downward) on the supporting wall. The configuration of this aircraft wing model is depicted in Figure 3.
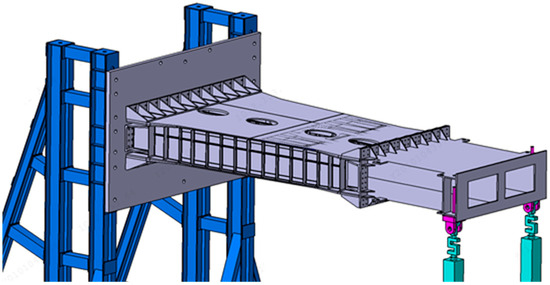
Figure 3.
The configuration of the aircraft wing specimen.
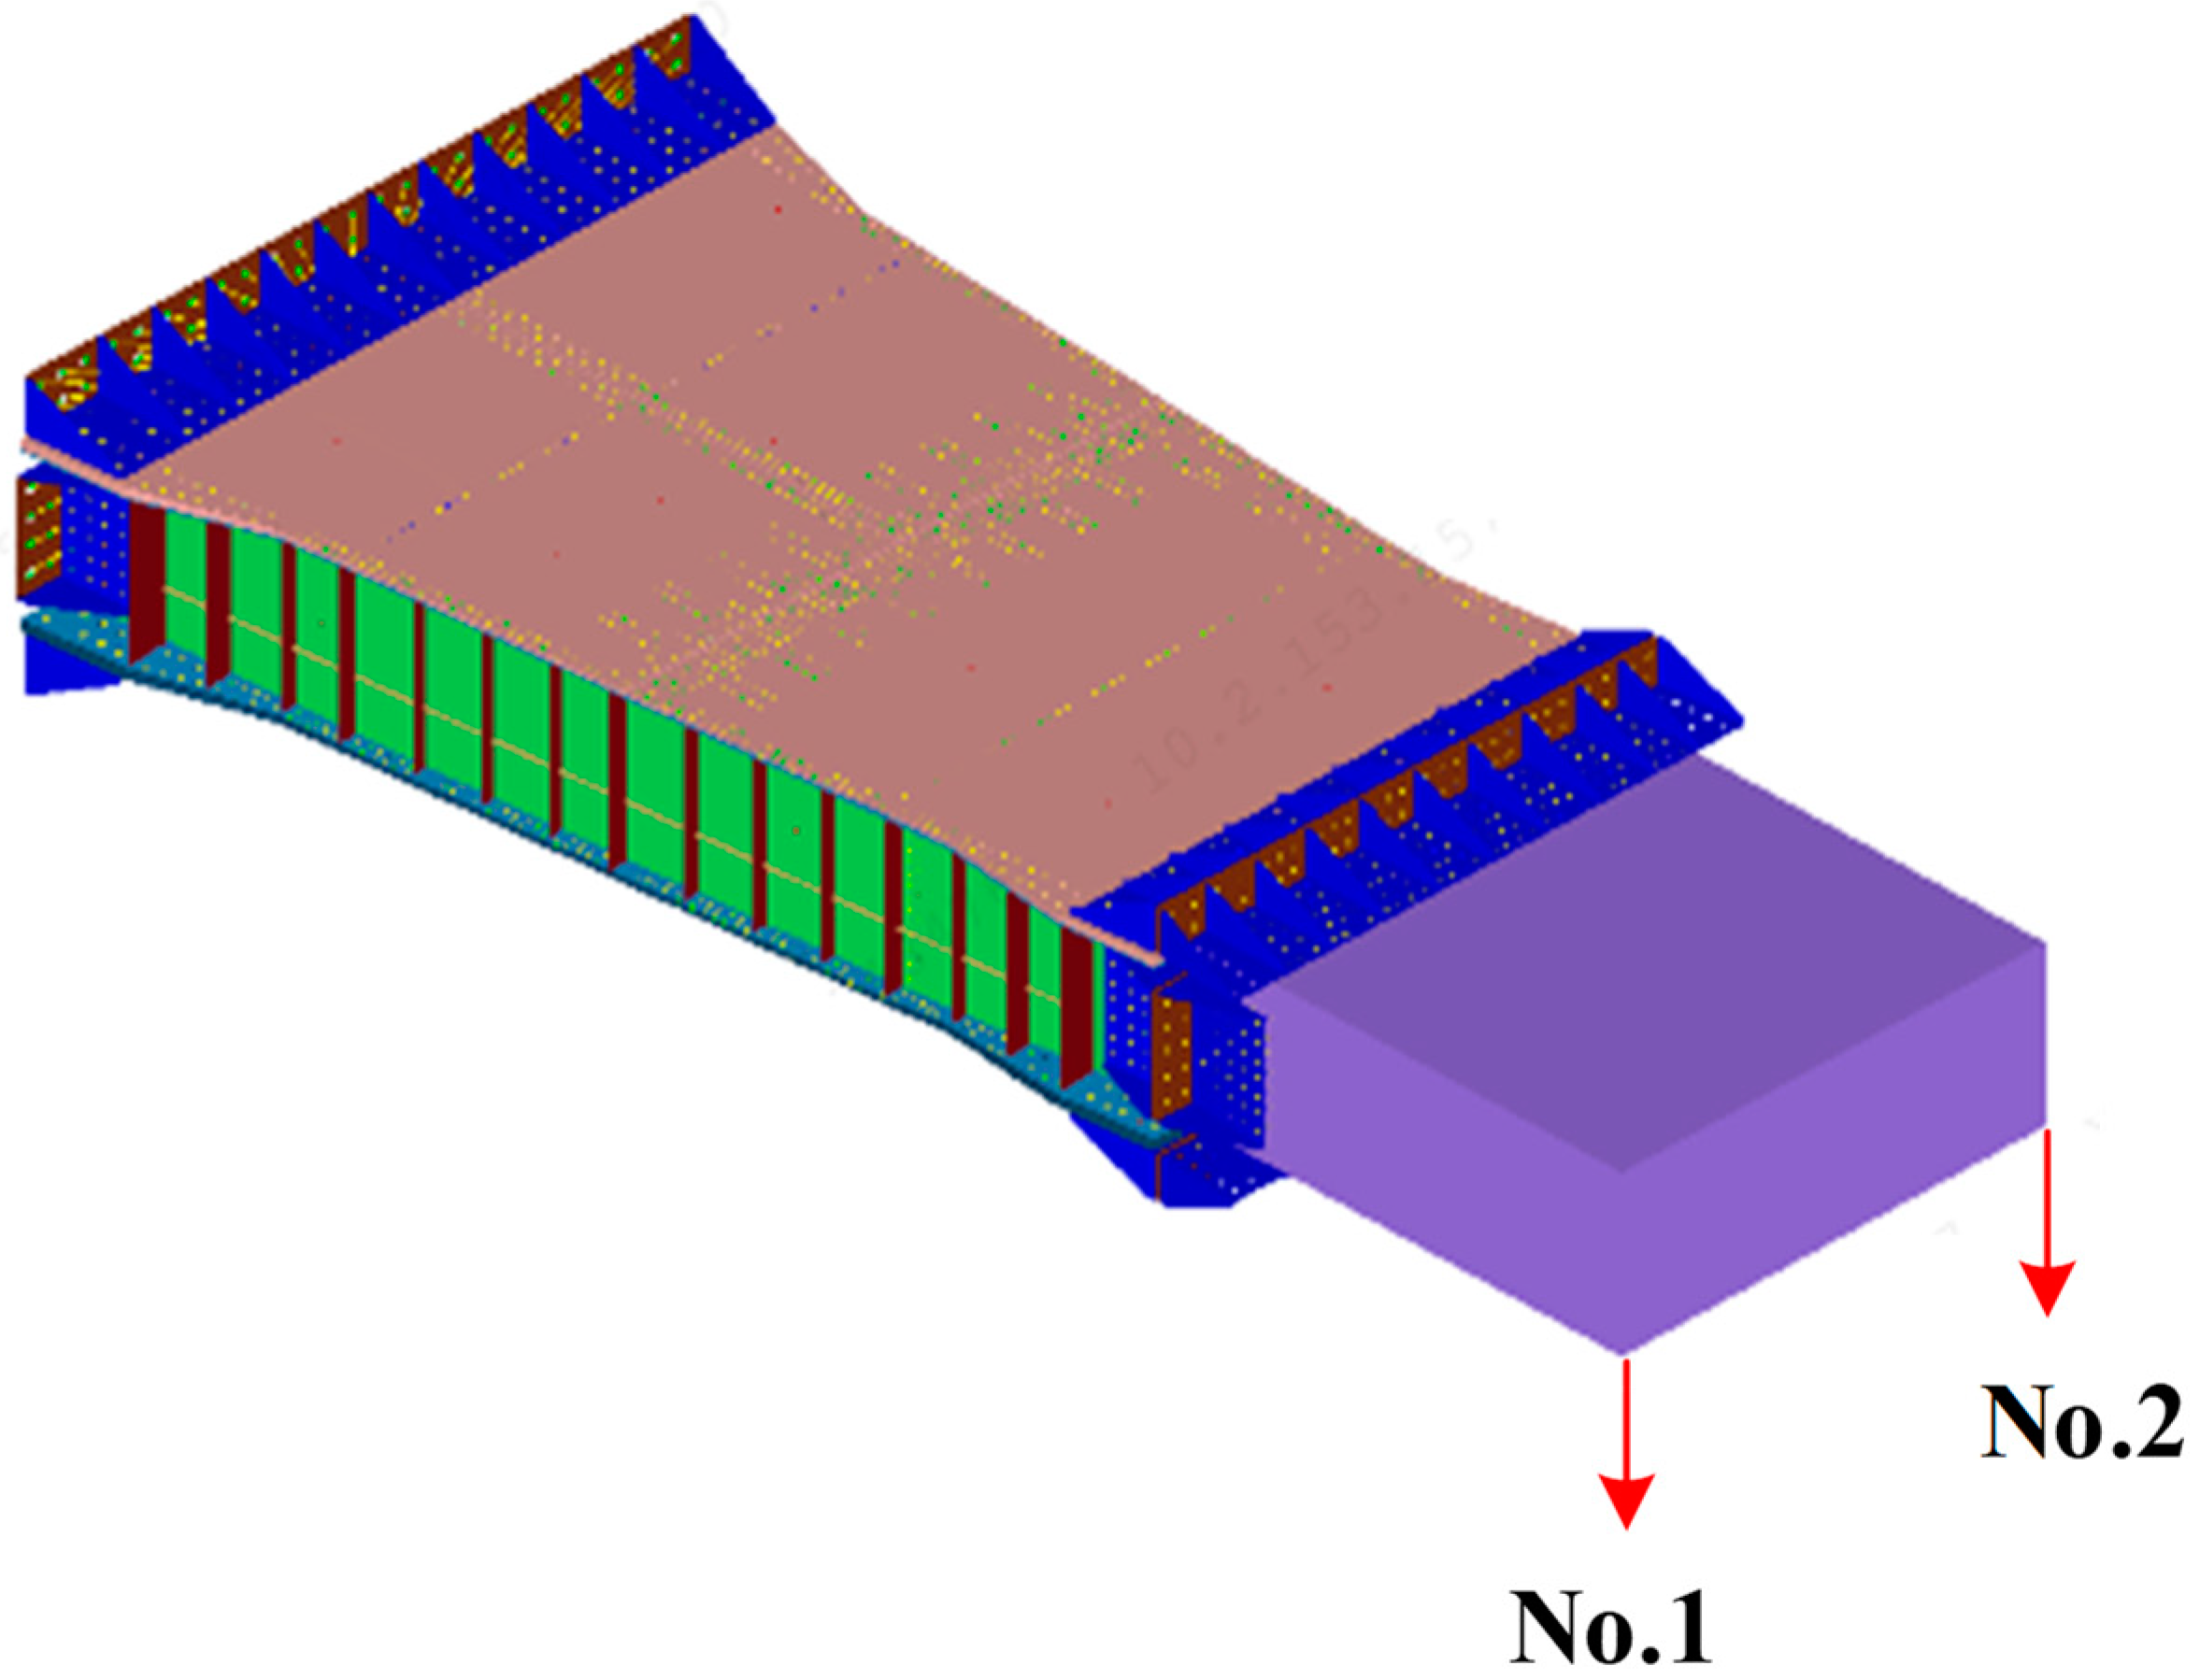
The finite element model of this aircraft wing was modeled using the commercial software Patran/Nastran. A total of 2615 finite elements were used (1375 plate elements and 1240 bars), which provided a convergence solution. Specifically, a CROD finite element is adopted to model the aircraft wing box, which is demonstrated in Figure 4. Moreover, the structural elements of each section are set and the information is as follows: a CQUAD4 element is used for the wall plate, the rib plate, the web plate of the front and rear beams, and the upper and lower edges of the front and rear beams; a CROD element is selected for the long girder, and the upper and lower ribs.
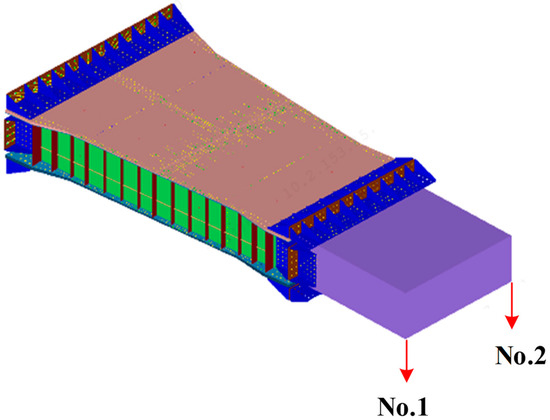
Figure 4.
A finite element model of an aircraft wing box with two load actuators.
3.2. Initial Strain Monitoring Points and Strain–Load Data
Based on the principle of determining the original strain monitoring points of the first step in Section 2.2, there are 228 plate elements (three directions) and 312 bars (a total of 996 strain monitoring points) which are adopted to monitor the strain and operational load of the aircraft wing box.
During the experiment, the strain values of the No. 1 loading actuator are in the range of −5811 N~53,761.4 N, and the strain values of the No. 2 loading actuator are in the range of −2241.1 N~20,761.3 N, as shown in Figure 4. For the simulation case study, the strain values of the No. 1 loading actuator are extended to the range of −39,000 N~60,000 N, and those for the No. 2 loading actuator are adjusted to the range of −20,000 N~45,000 N. A number of 90 load pairs of the No. 1 and No. 2 loading actuators are randomly generated according to Latin hypercube sampling. The load values of the training and test datasets are presented in Figure 5.
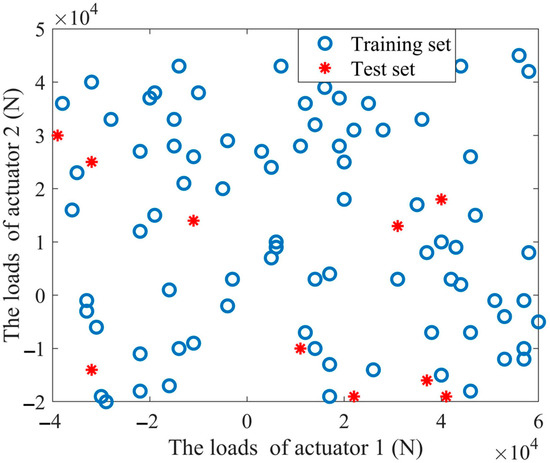
Figure 5.
Operational load distribution diagram of two loading actuators.
3.3. Preliminary Selection of Strain Monitoring Points
The corresponding strain values of the original 996 strain gauge locations under 90 operational load situations are obtained via the finite element model. Moreover, the strain monitoring locations are arranged in decreasing order according to the mean absolute strain value, and some strain monitoring points with small strain values are removed. In addition, the Pearson correlation between the remaining strain monitoring points are calculated. Those strain monitoring points with a correlation coefficient larger than 0.99 are merged, which is also considered the minimum distance constraint. Finally, a group of 13 strain monitoring locations are determined in the first stage of strain gauge optimization, which is illustrated in Figure 6.
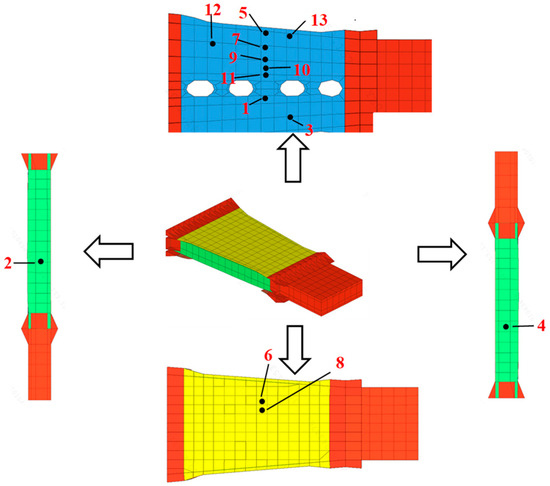
Figure 6.
Initially selected 13 strain monitoring points in first stage.
3.4. Strain Gauge Location Optimization Based on the Improved Correlation Measure
According to the proposed method in Section 2.2, 1~13 monitoring points are taken as the first monitoring point in turn, and the other monitoring points are sorted successively. The strain monitoring point sequence results for different first monitoring points are tabulated in Table 2.
Table 2.
Monitoring point sequence by proposed improved correlation method.
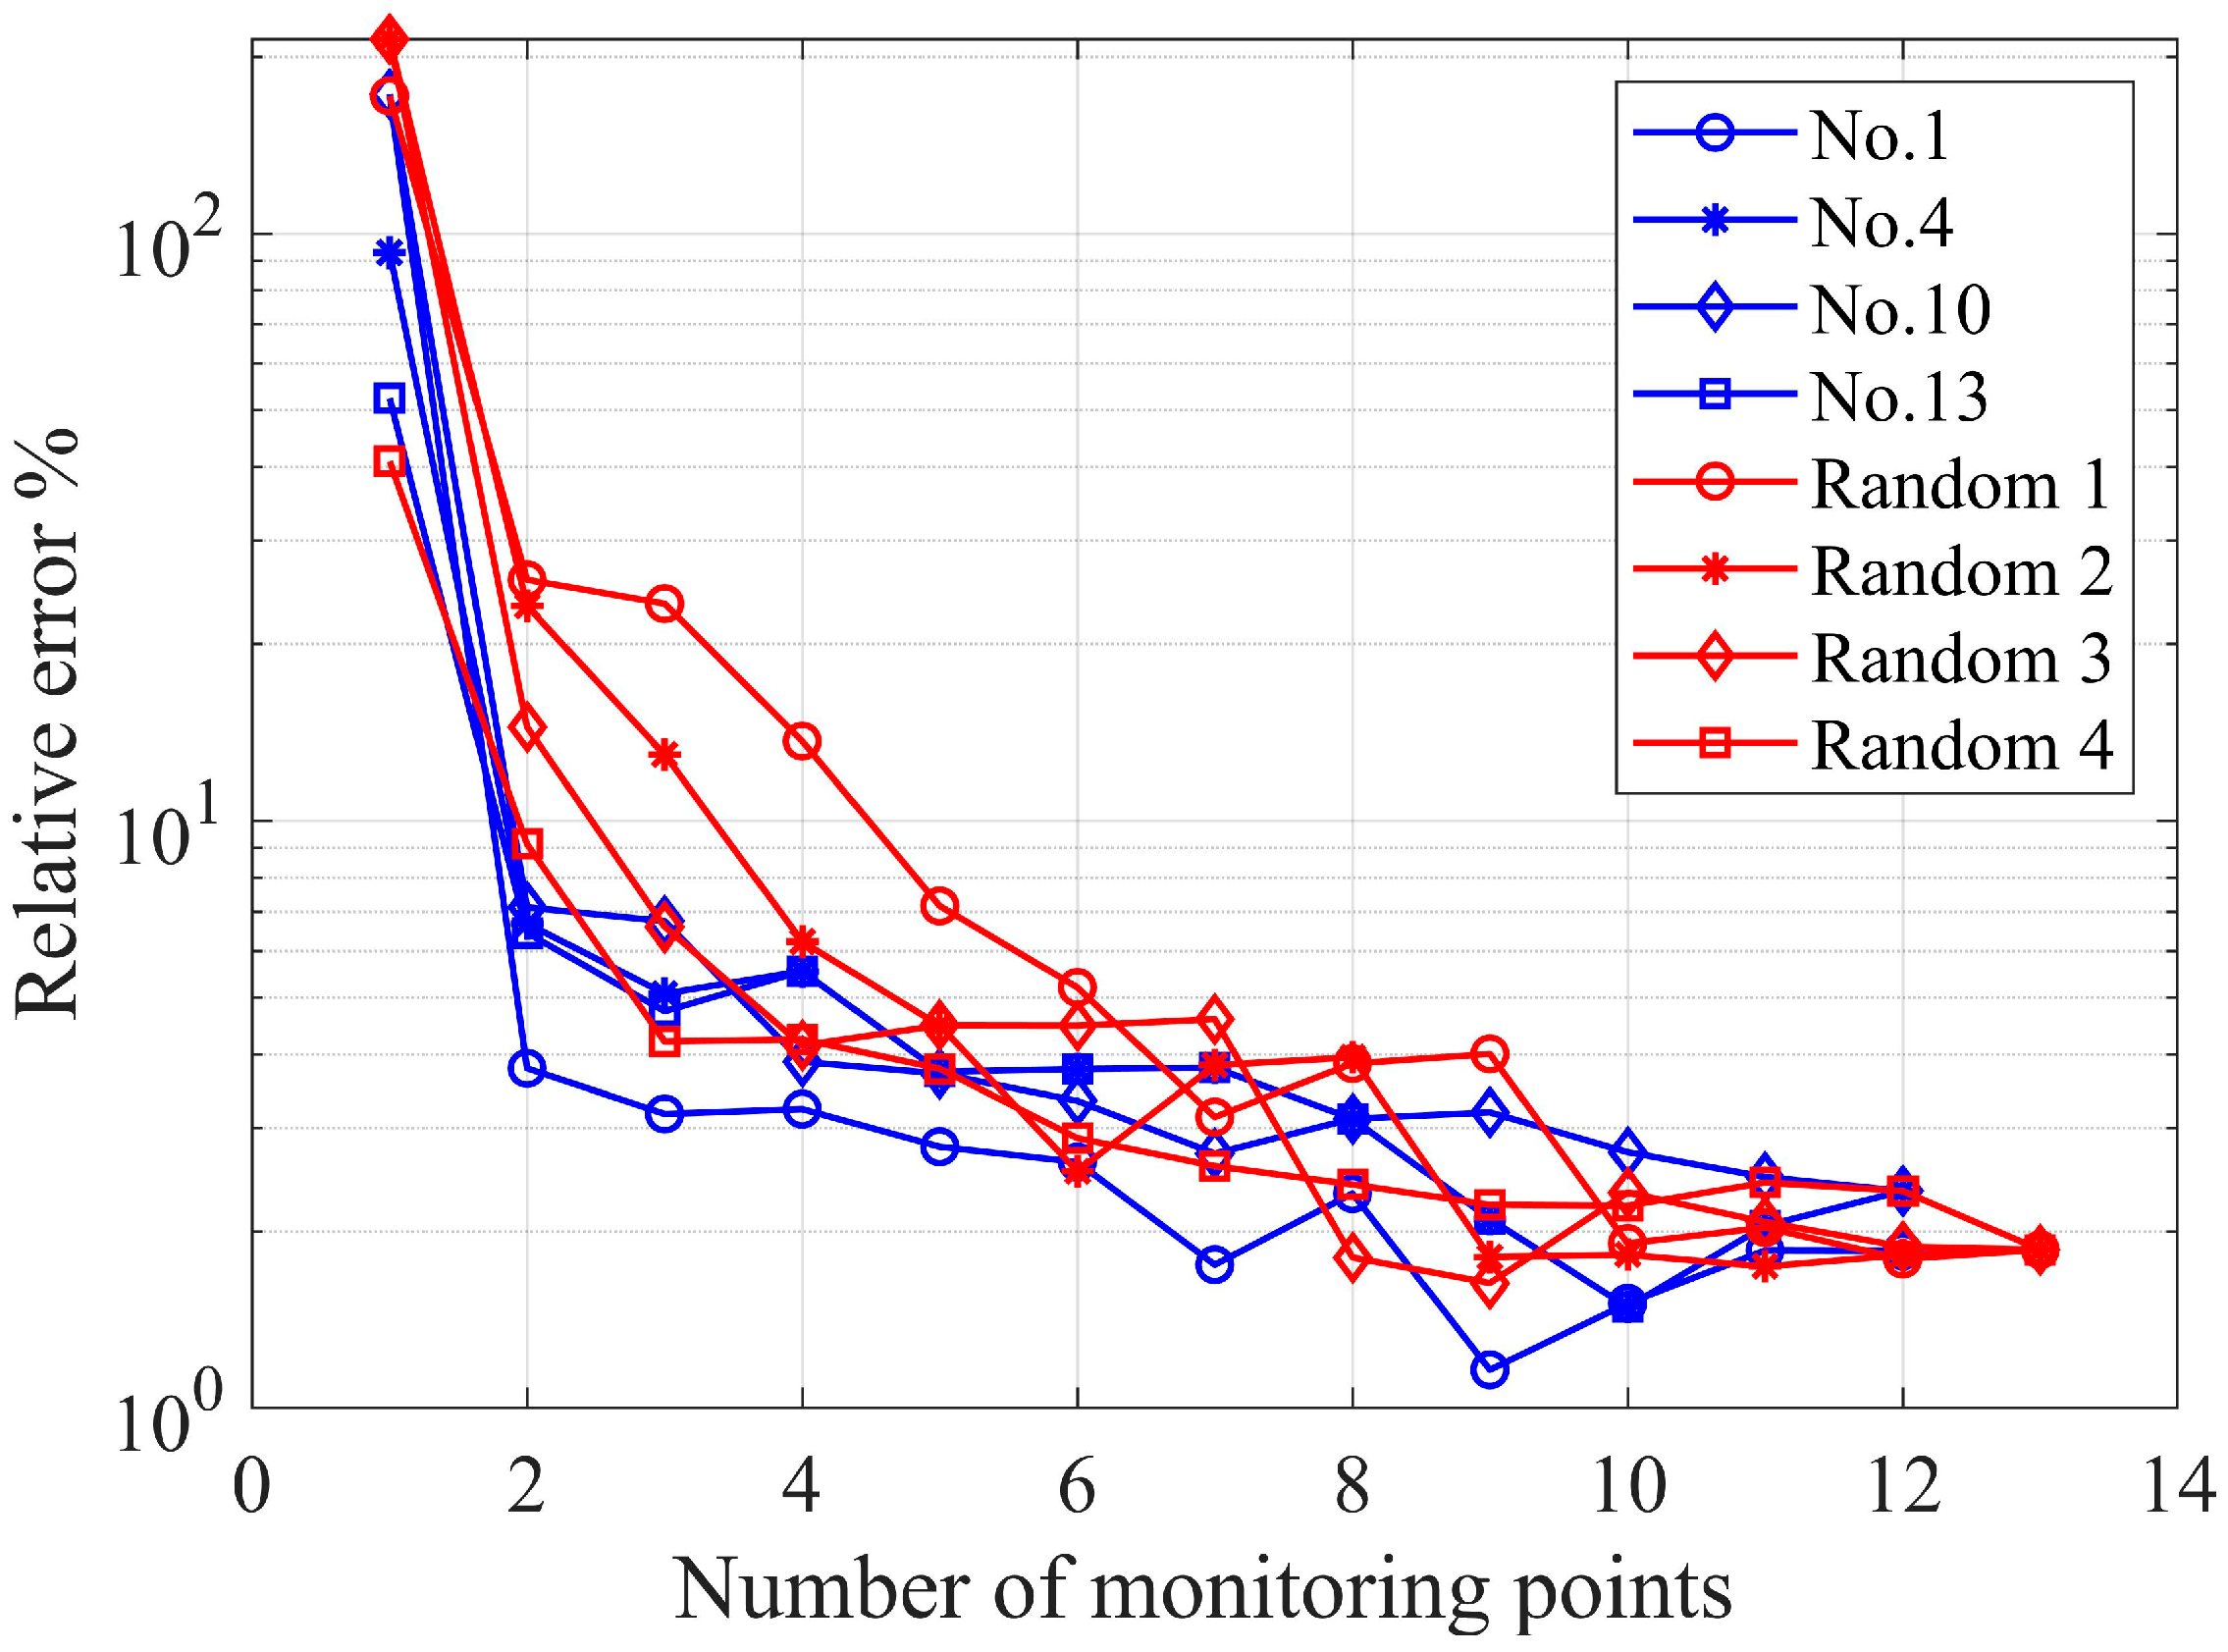
Taking the No. 2 loading actuator data as an example, the maximum relative errors between the predicted and the actual loads are plotted in Figure 7, which contains four random sequences and four sequences with the first monitoring point in the order 1, 4, 10, and 13.
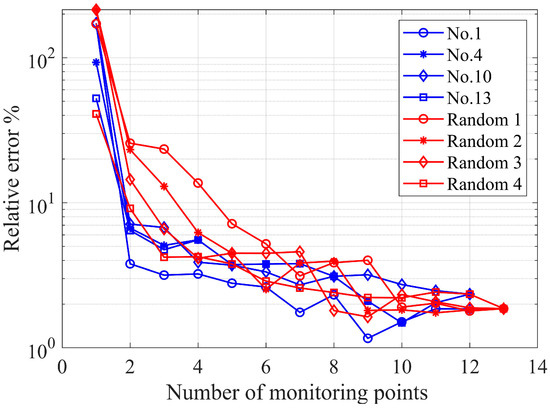
Figure 7.
Load prediction relative errors of loading actuator No. 2.
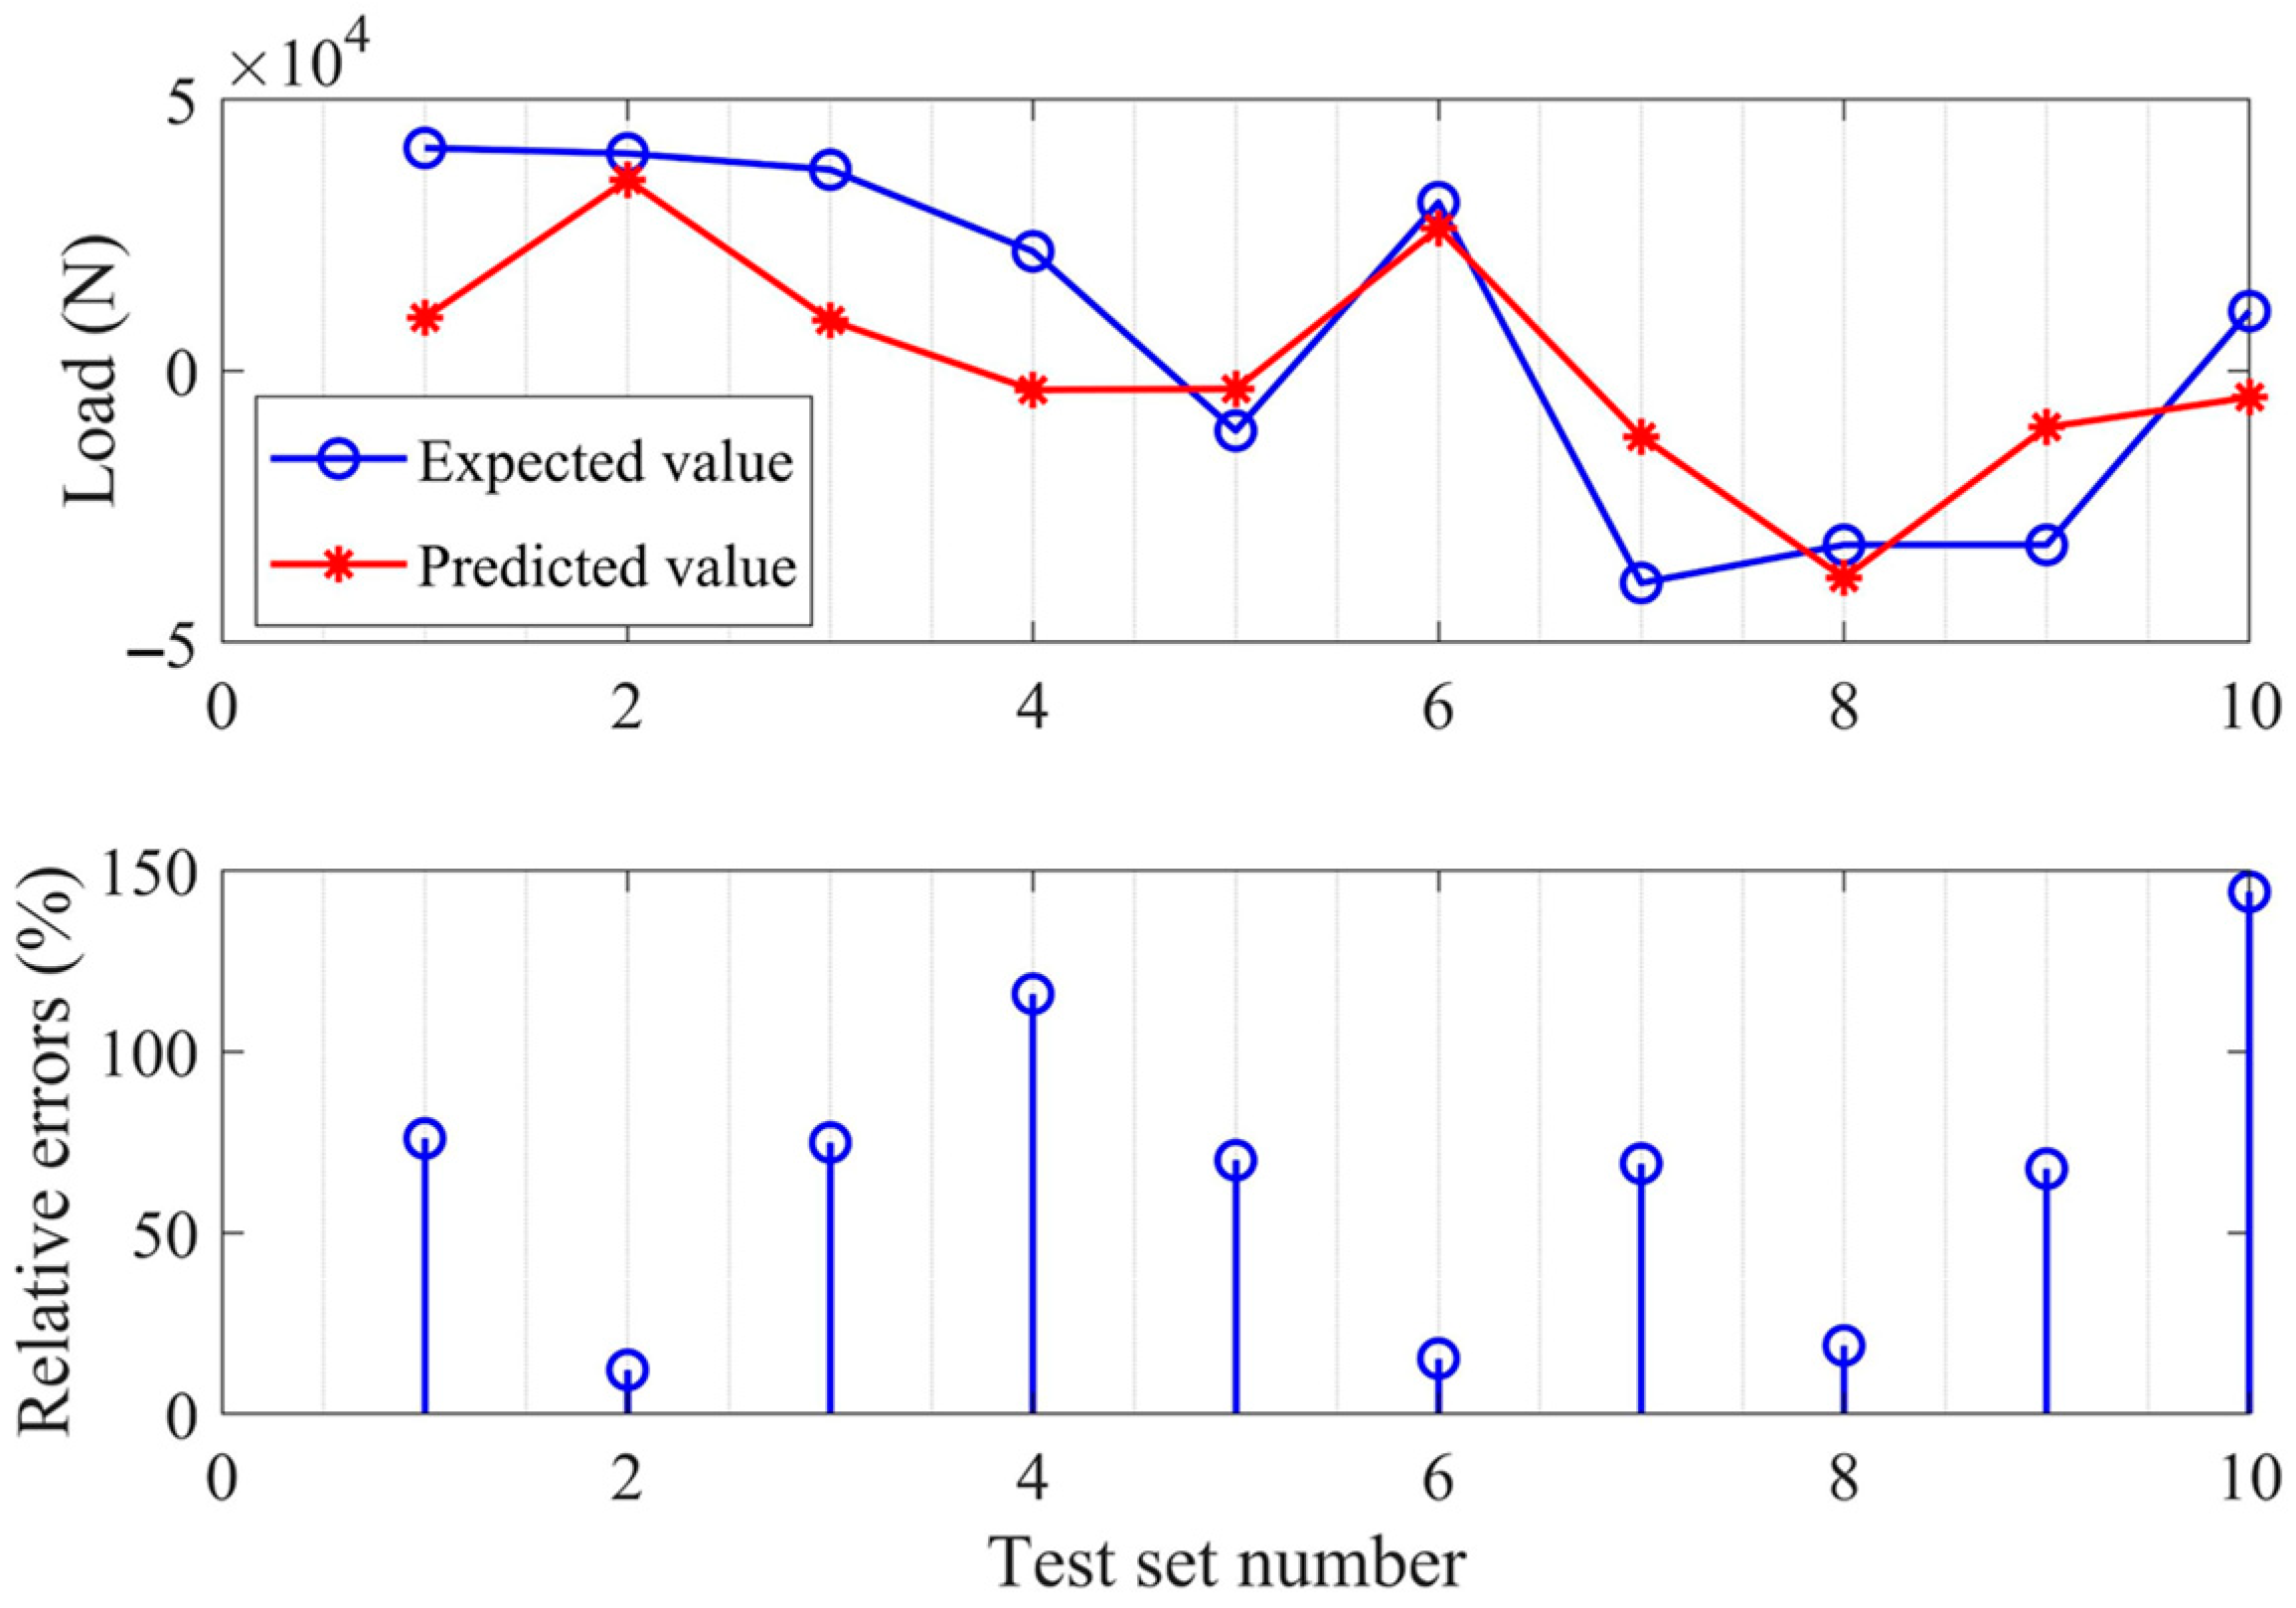
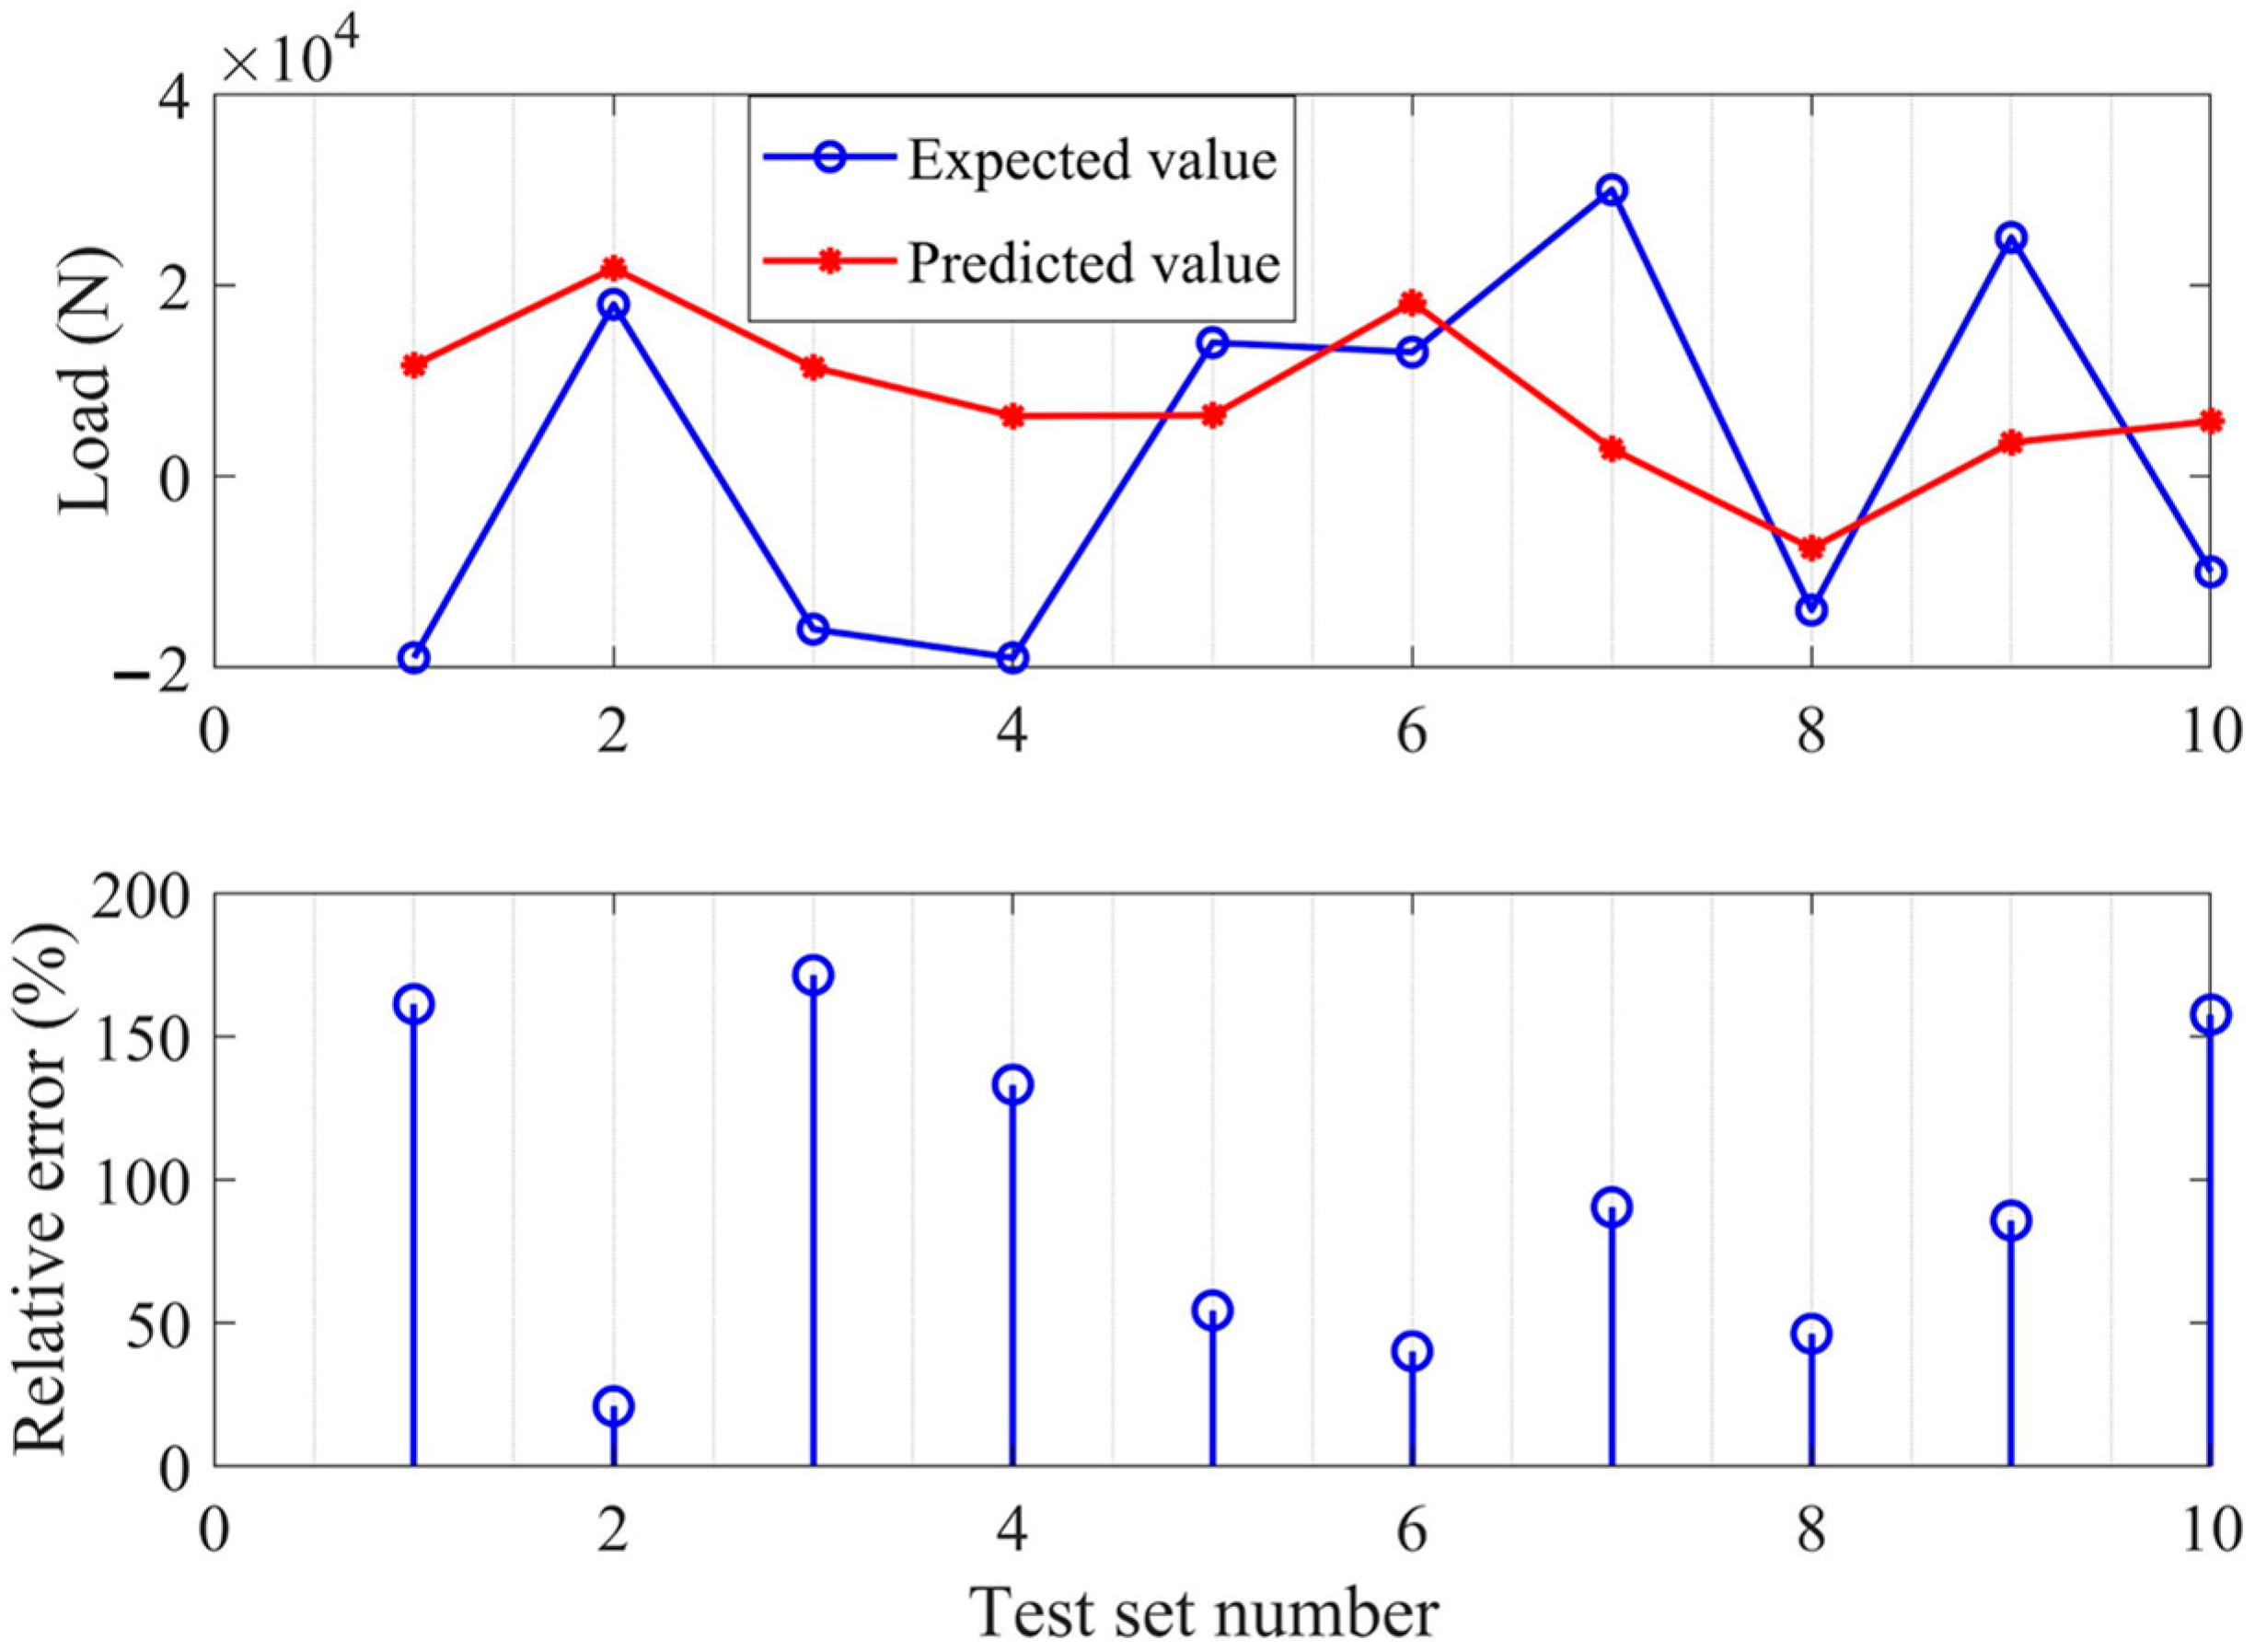
Figure 7 demonstrates that by increasing the strain monitoring points, the relative errors are gradually decreasing to the same value. When only one monitoring point is adopted, the relative errors of eight groups are relatively large, and the minimum relative error is about 40%, which cannot be applied for the actual operational load monitoring of this aircraft wing. Because the load prediction errors of choosing only one monitoring point, as shown in Figure 7, are too large, the relative errors of choosing two monitoring points will decrease significantly. It is shown from the comparison in Figure 7 that when the number of monitoring points is small, the relative errors of the proposed improved correlation coefficient method are smaller than those of the random sequences. In this case, it is proved that the proposed method of selecting monitoring points based on the improved correlation coefficient method can obtain a better load prediction accuracy while using fewer strain gauges. The error comparisons for the No. 1 loading actuator data and the No. 2 loading actuator data with only monitoring point No. 1 selected are shown in Figure 8 and Figure 9.
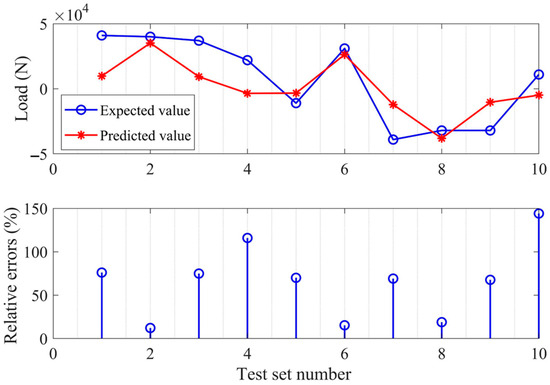
Figure 8.
Expected and predicted load errors of load actuator No. 1.
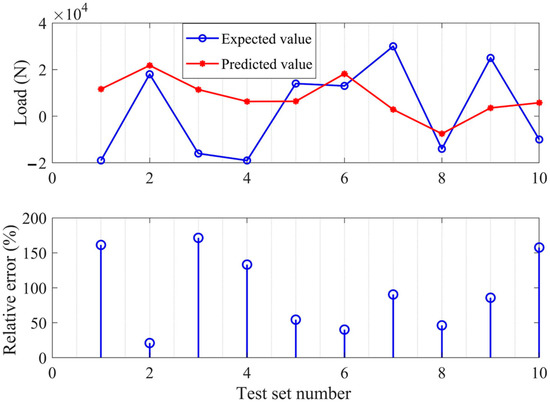
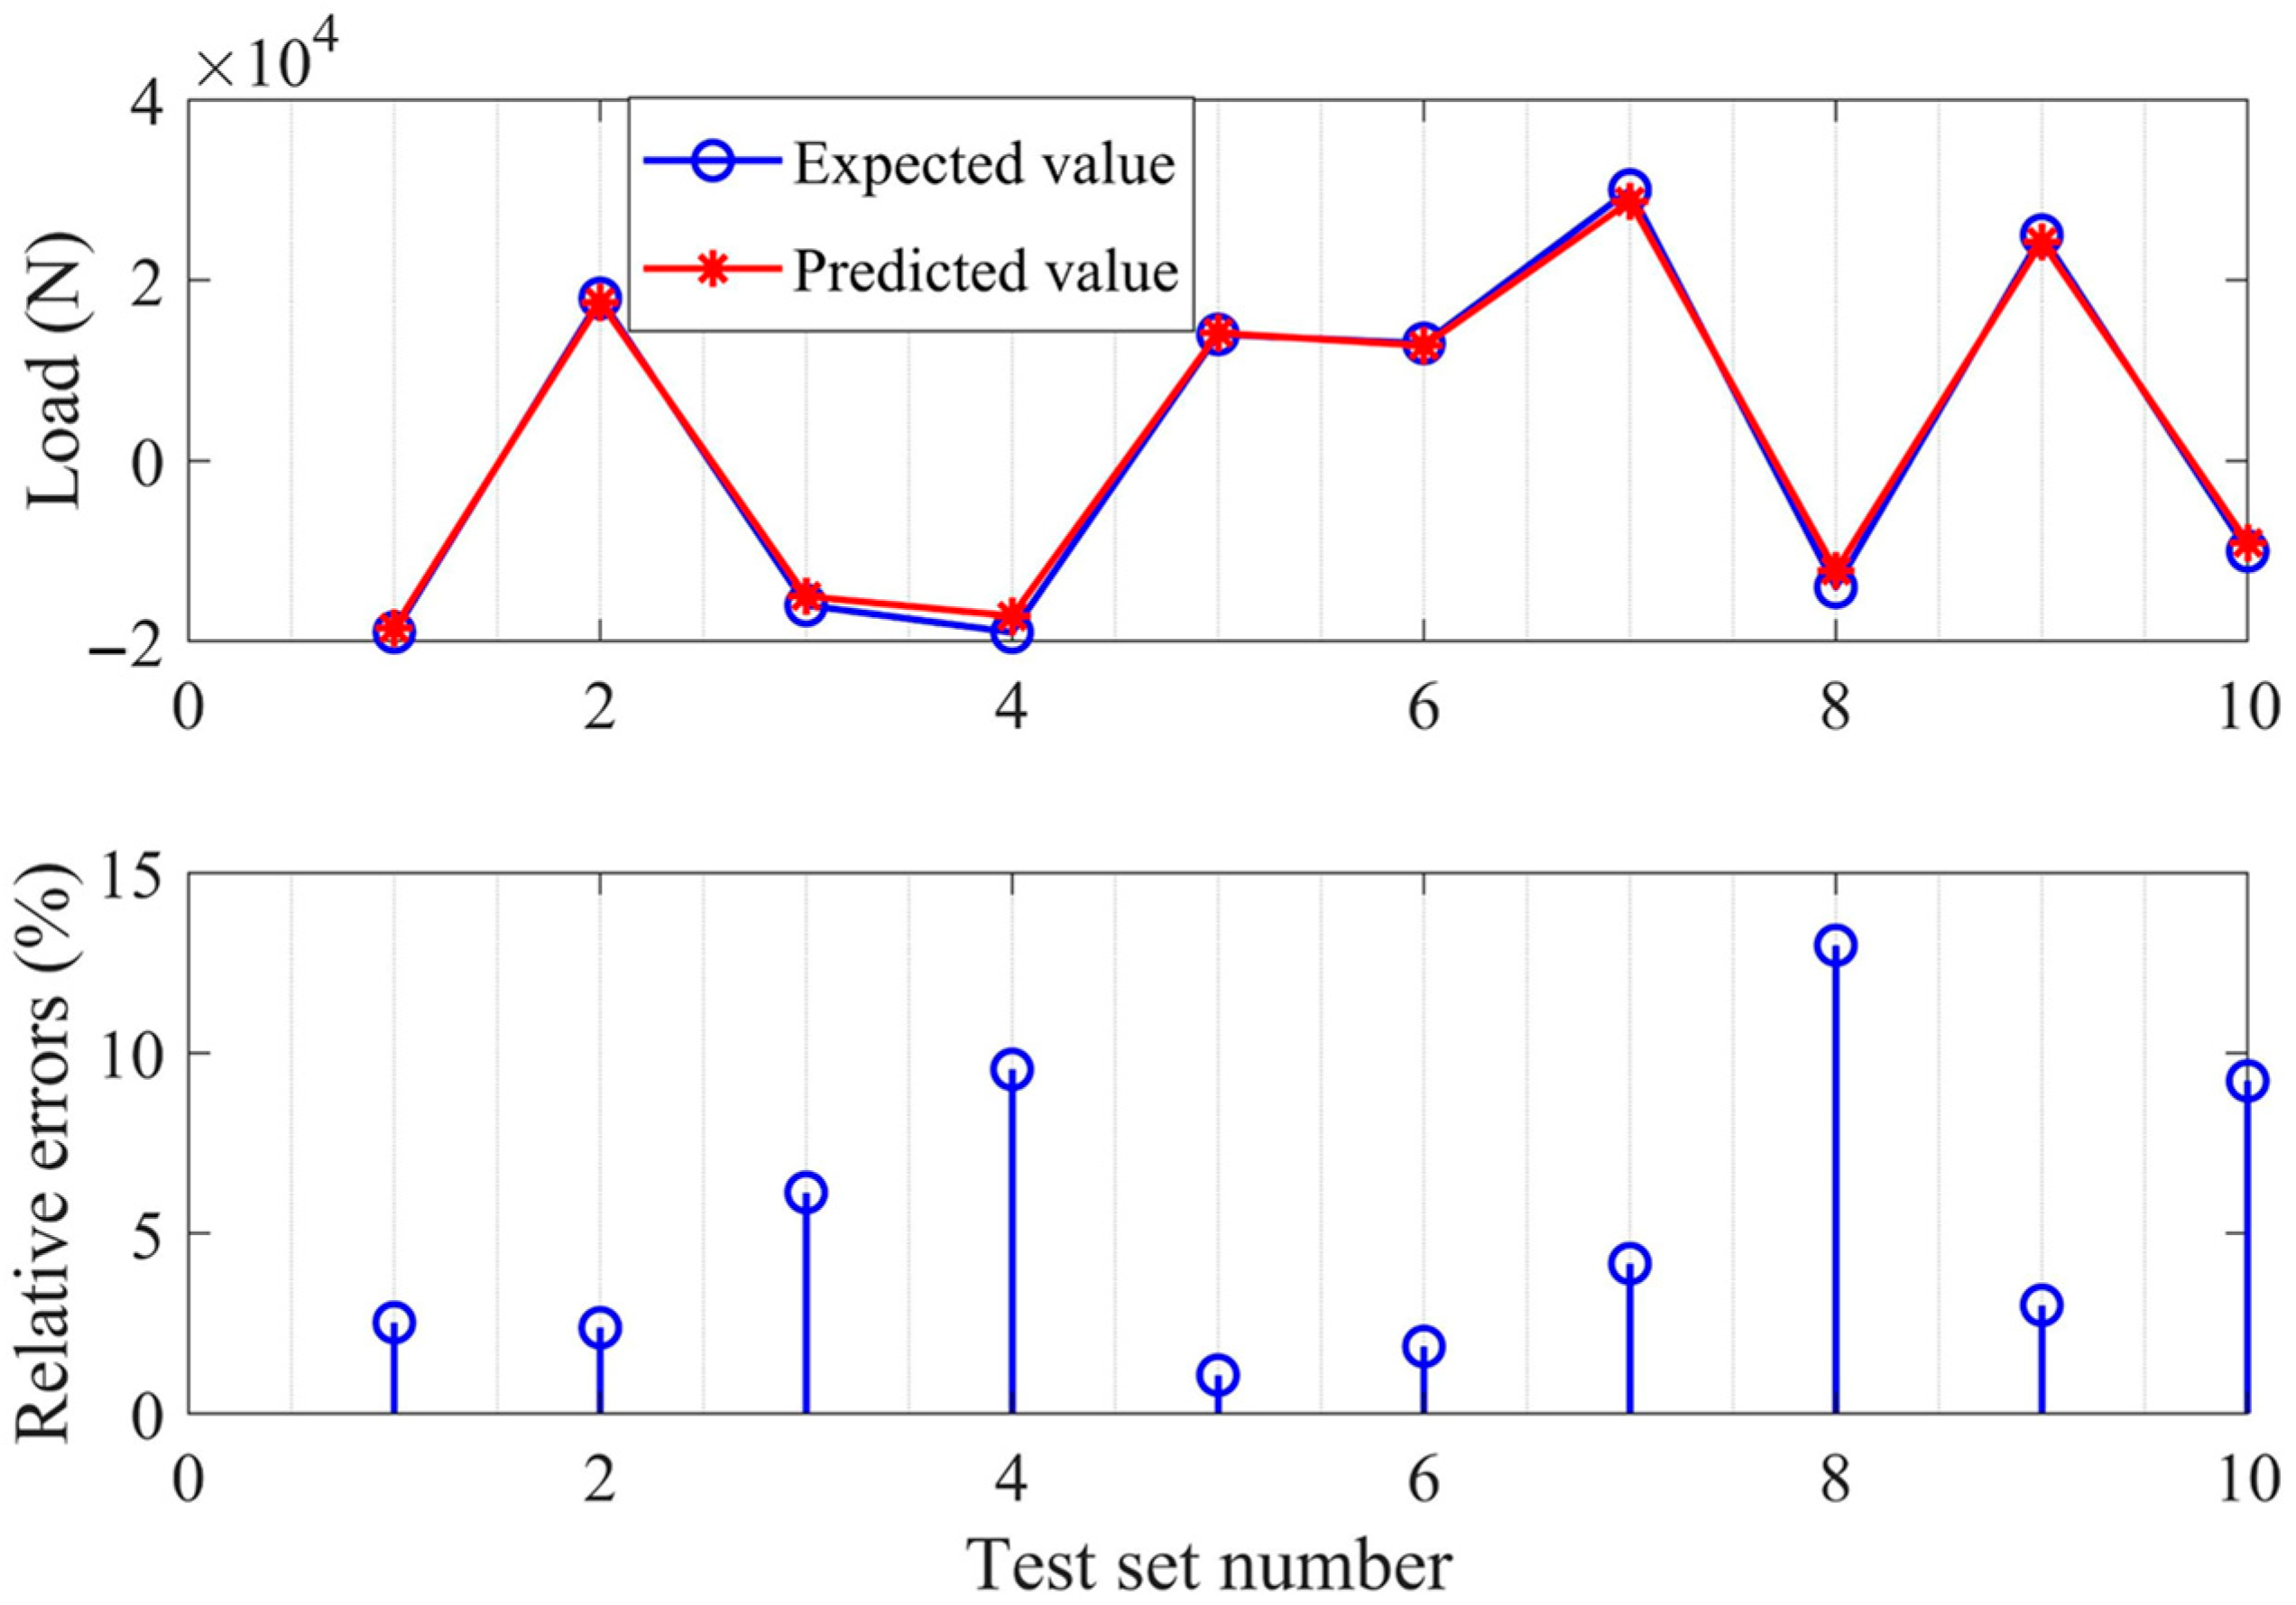
Figure 9.
Expected and predicted load errors of load actuator No. 2.
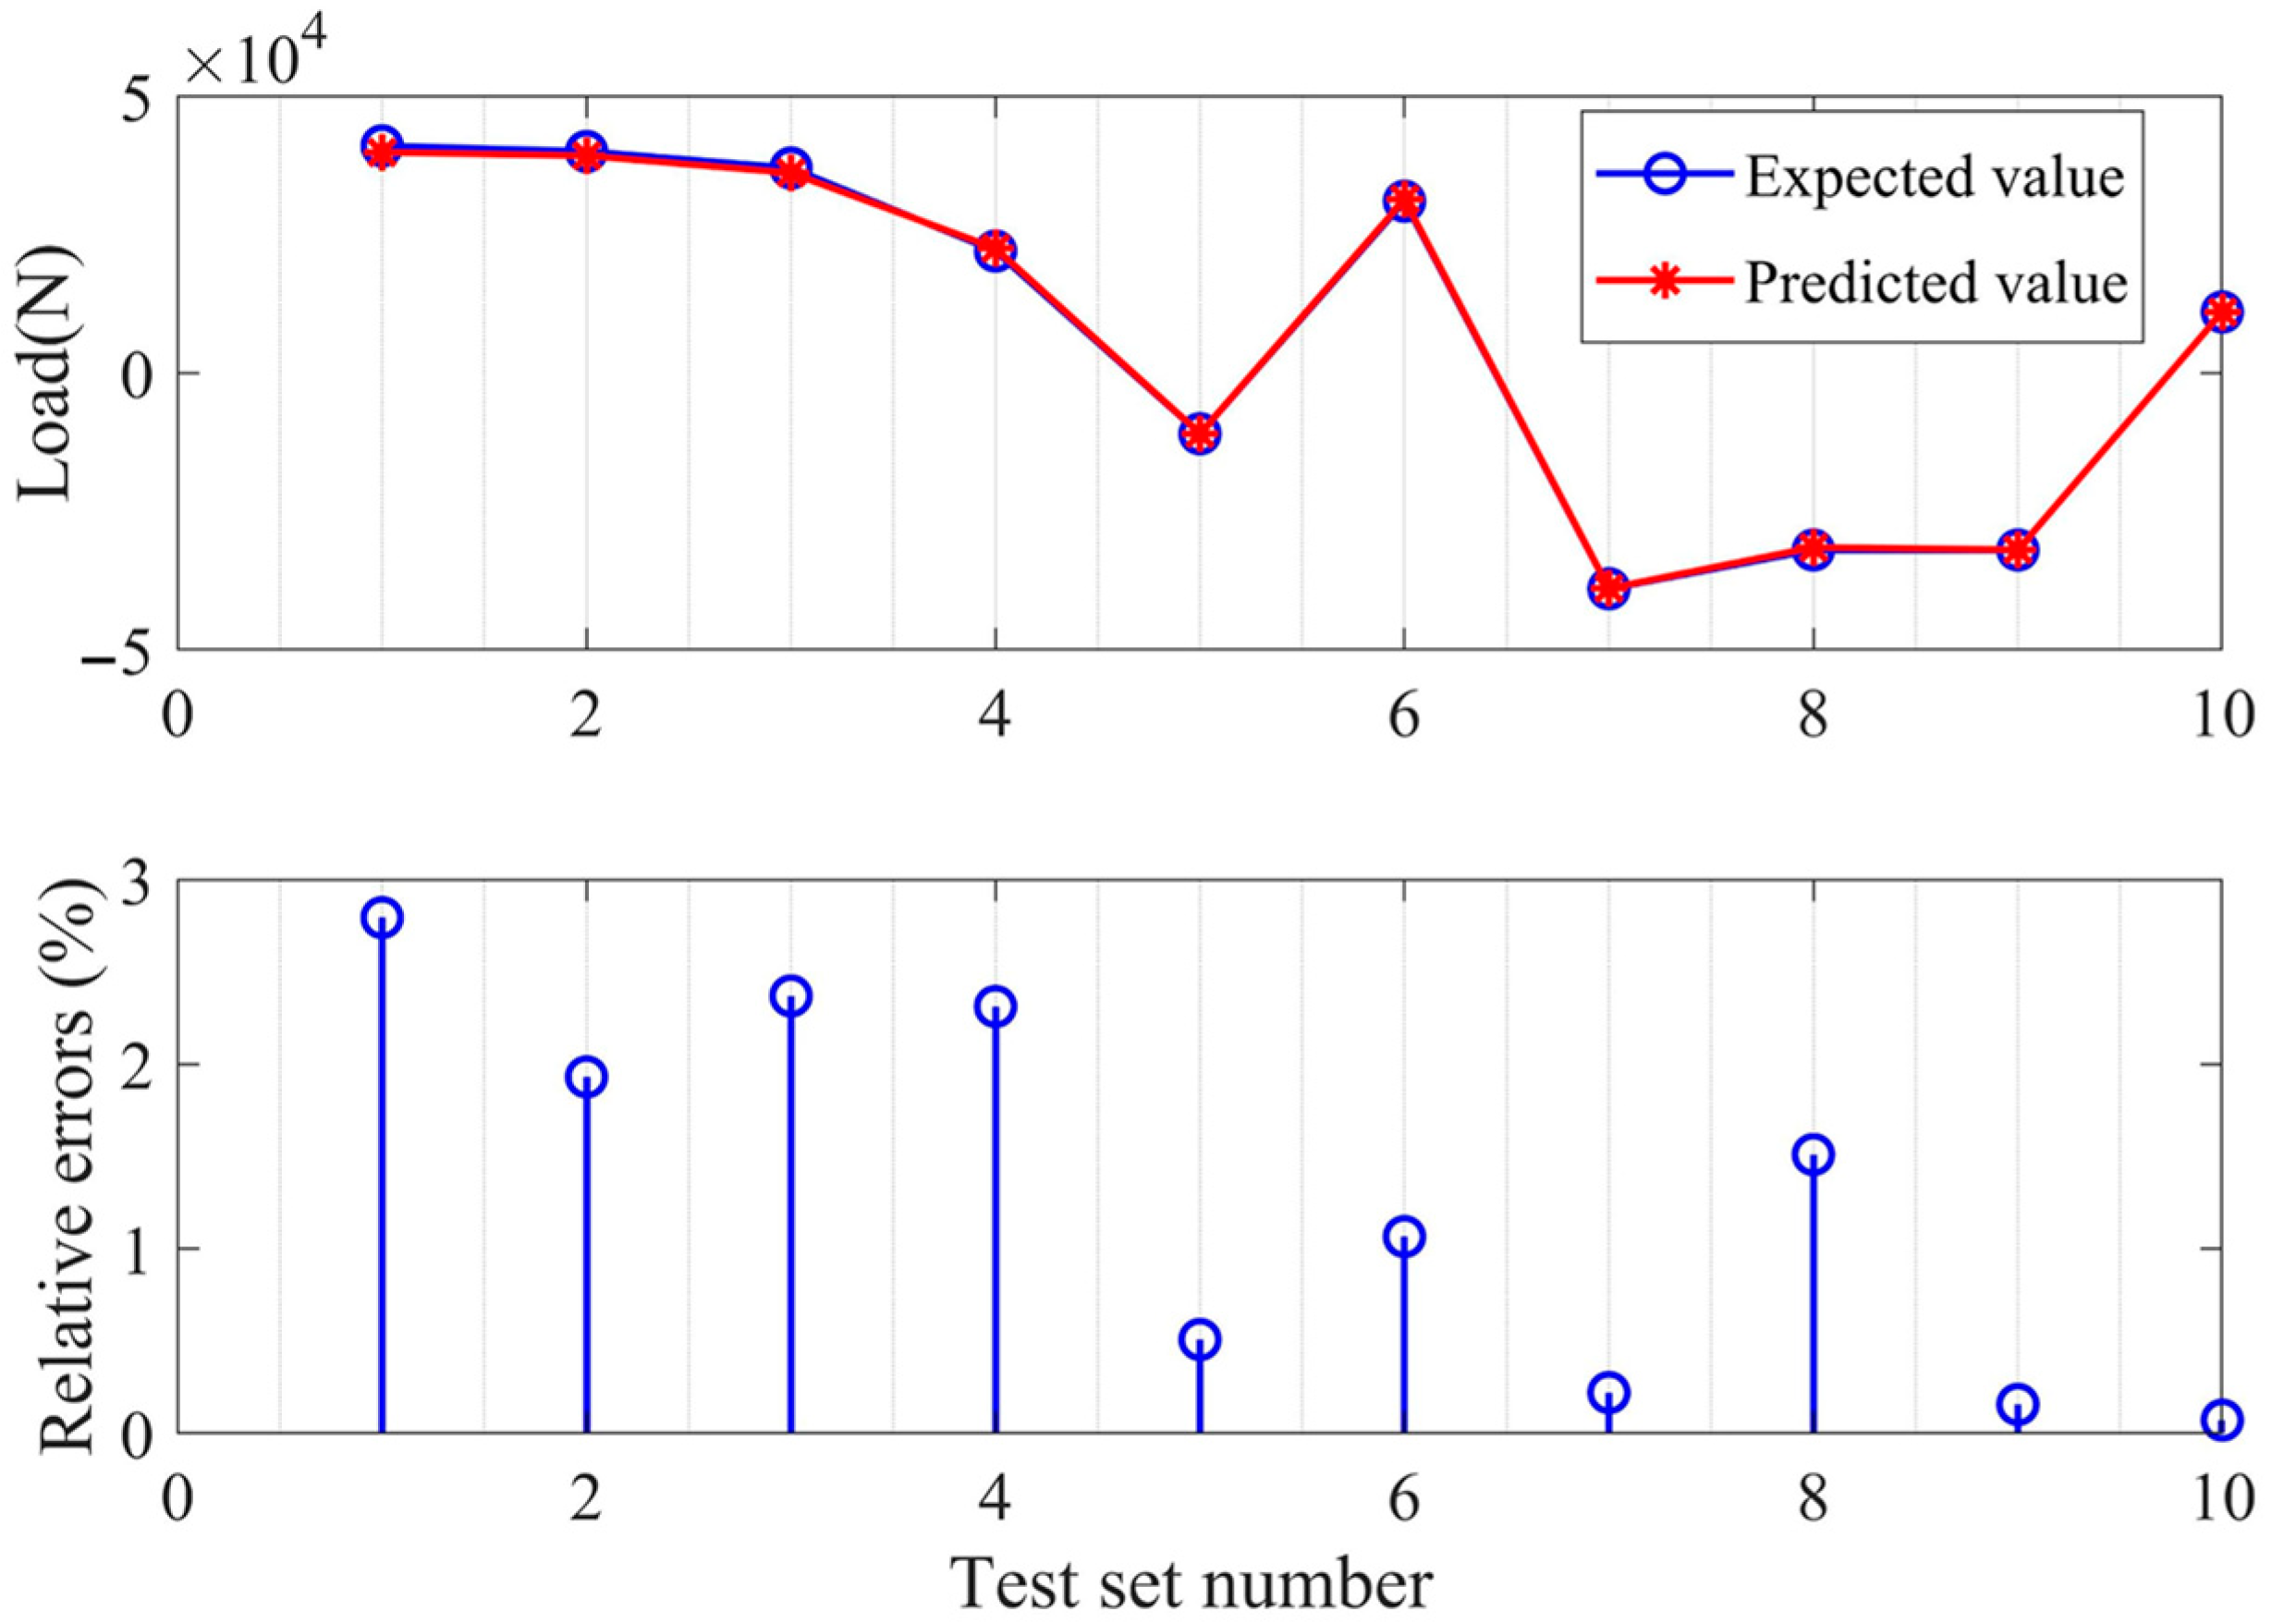
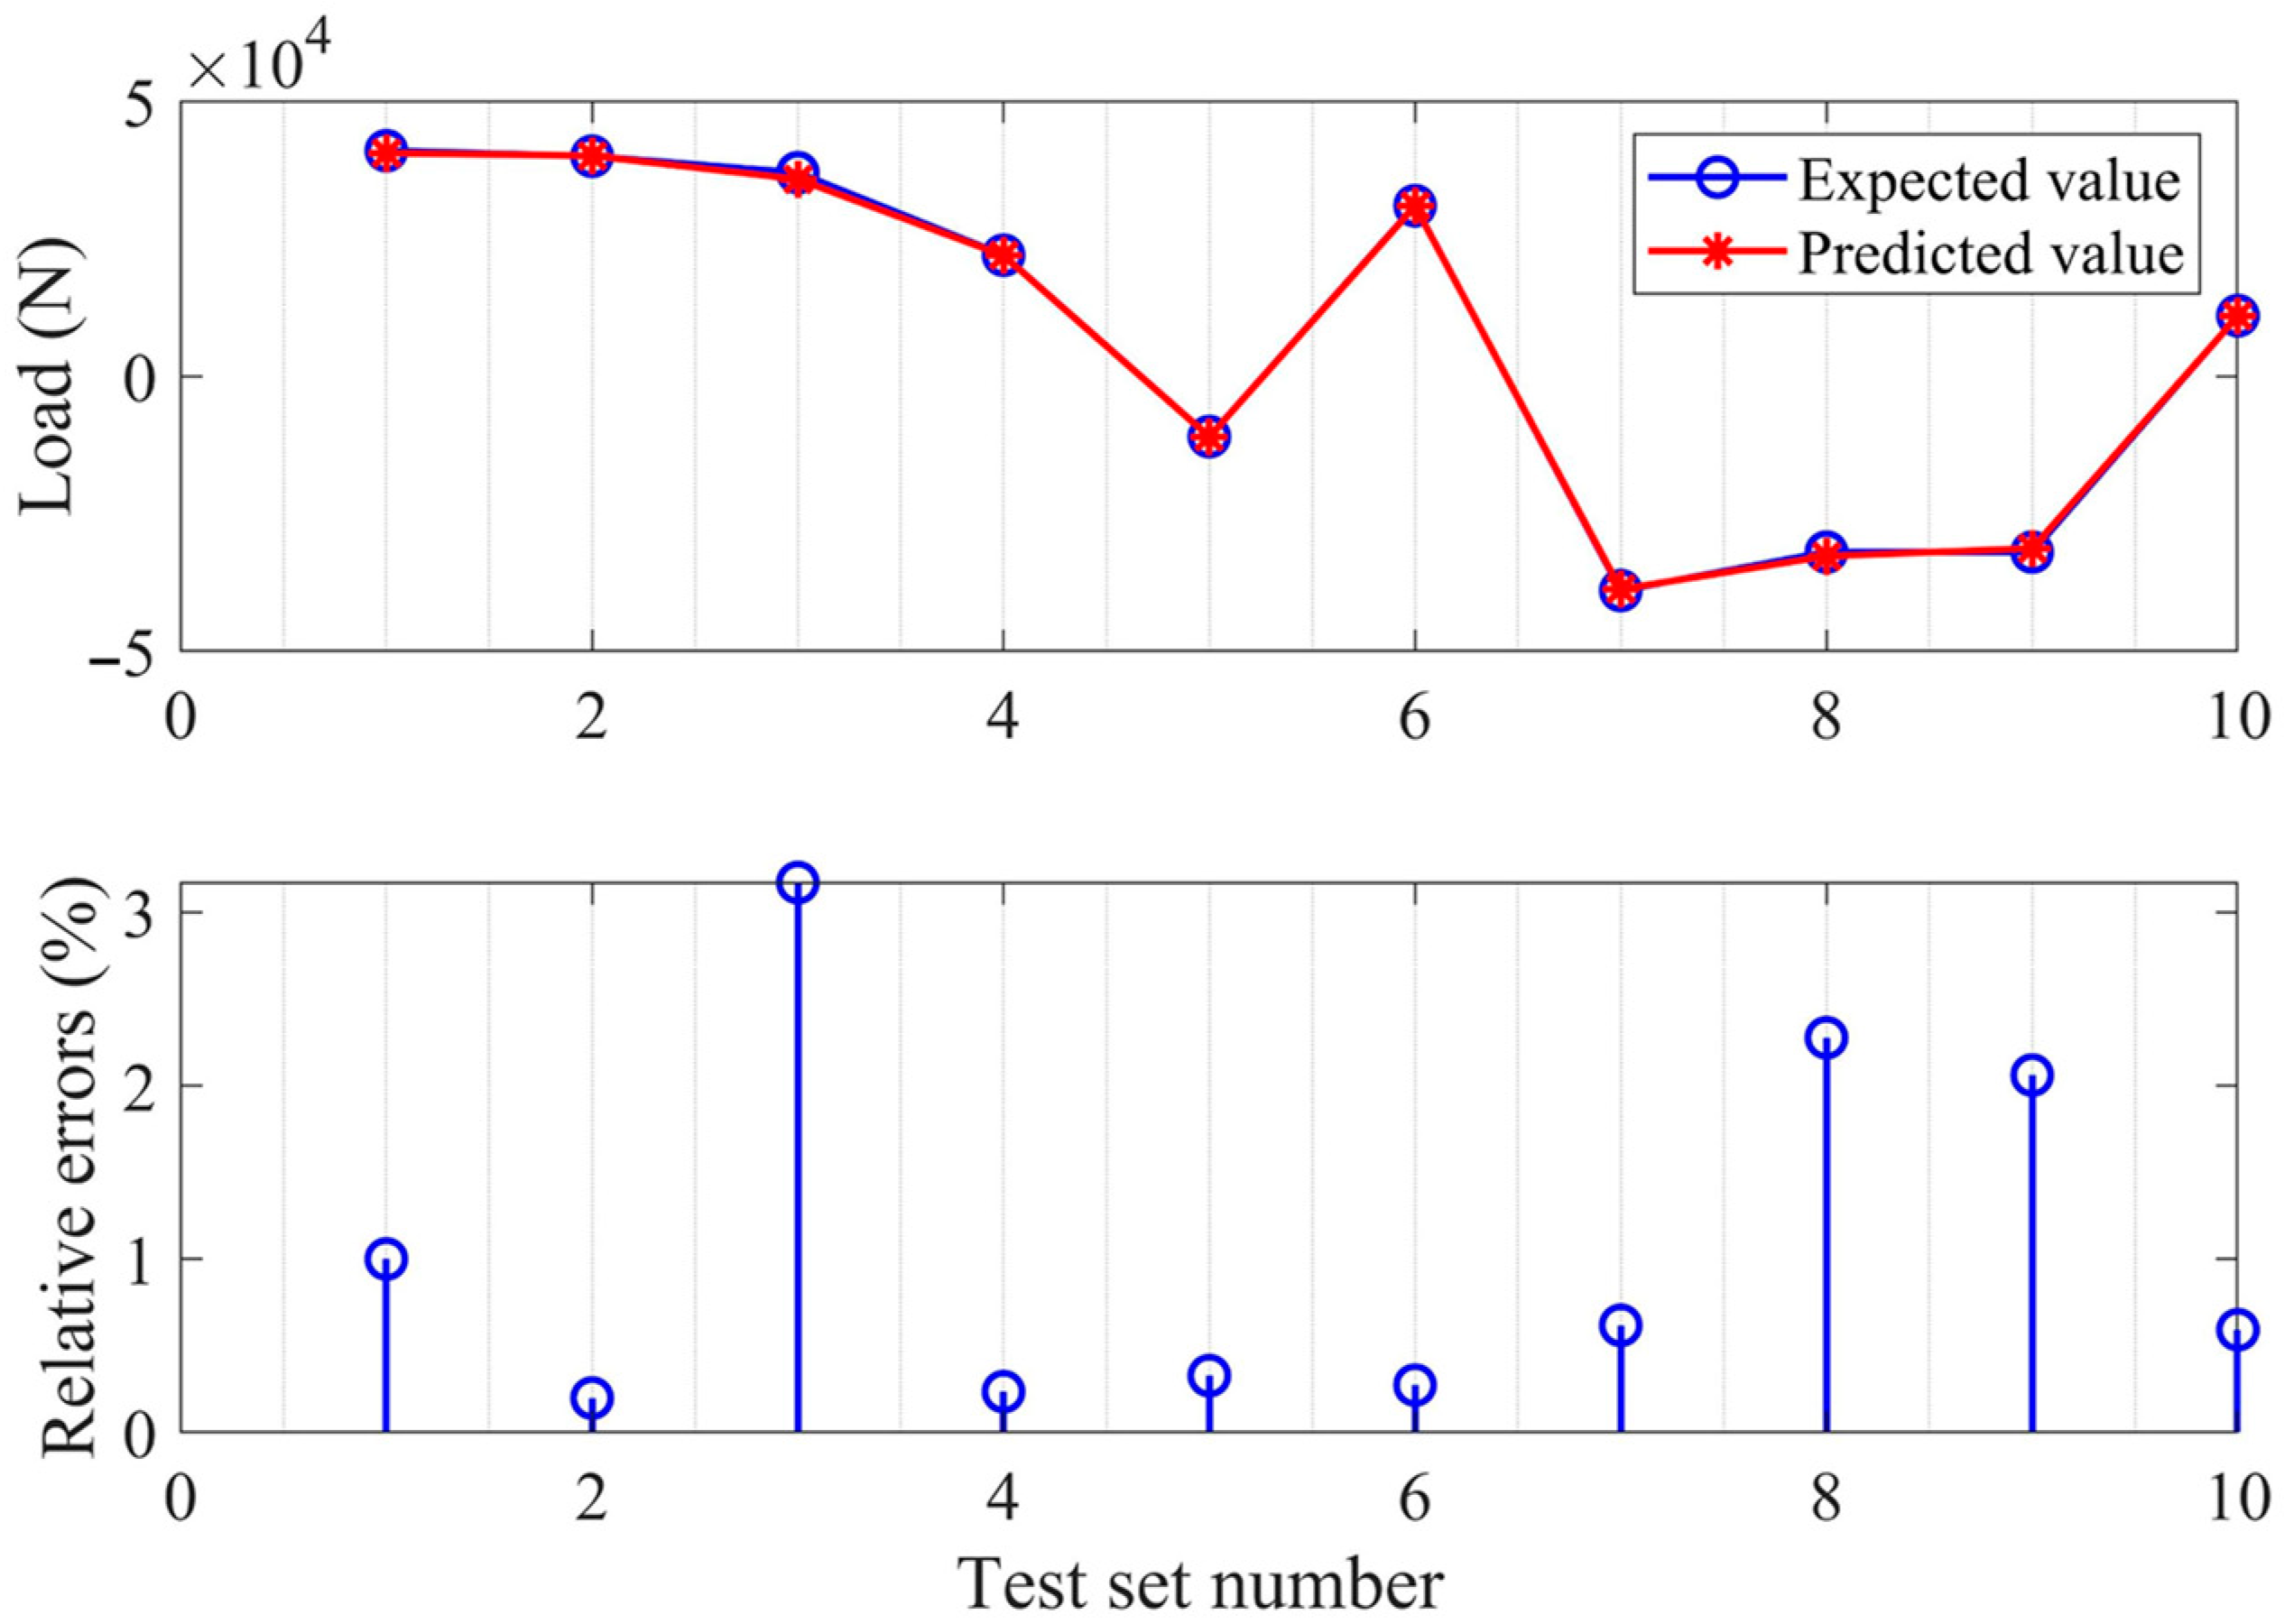
When monitoring points 1 and 10 are adopted, the load prediction accuracy of the No. 1 loading actuator is less than 3% and the relative error is less than 4% for the No. 2 loading actuator. The error comparisons are shown in Figure 10 and Figure 11 when point 1 is the first monitoring point and point 10 is the second monitoring point.
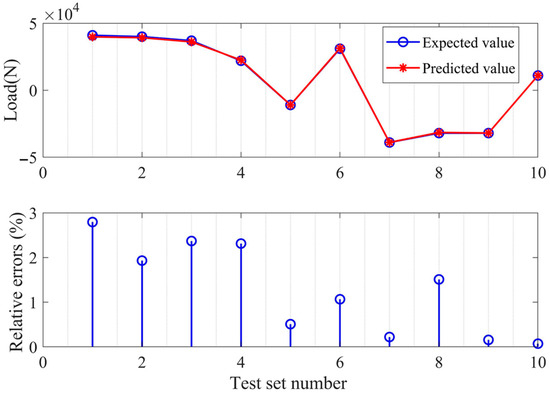
Figure 10.
Expected and predicted value errors of No. 1 load actuator.
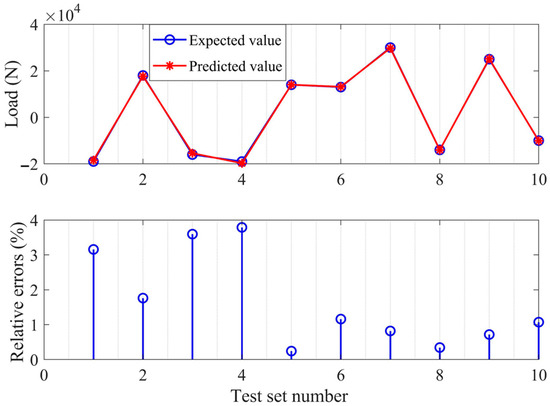
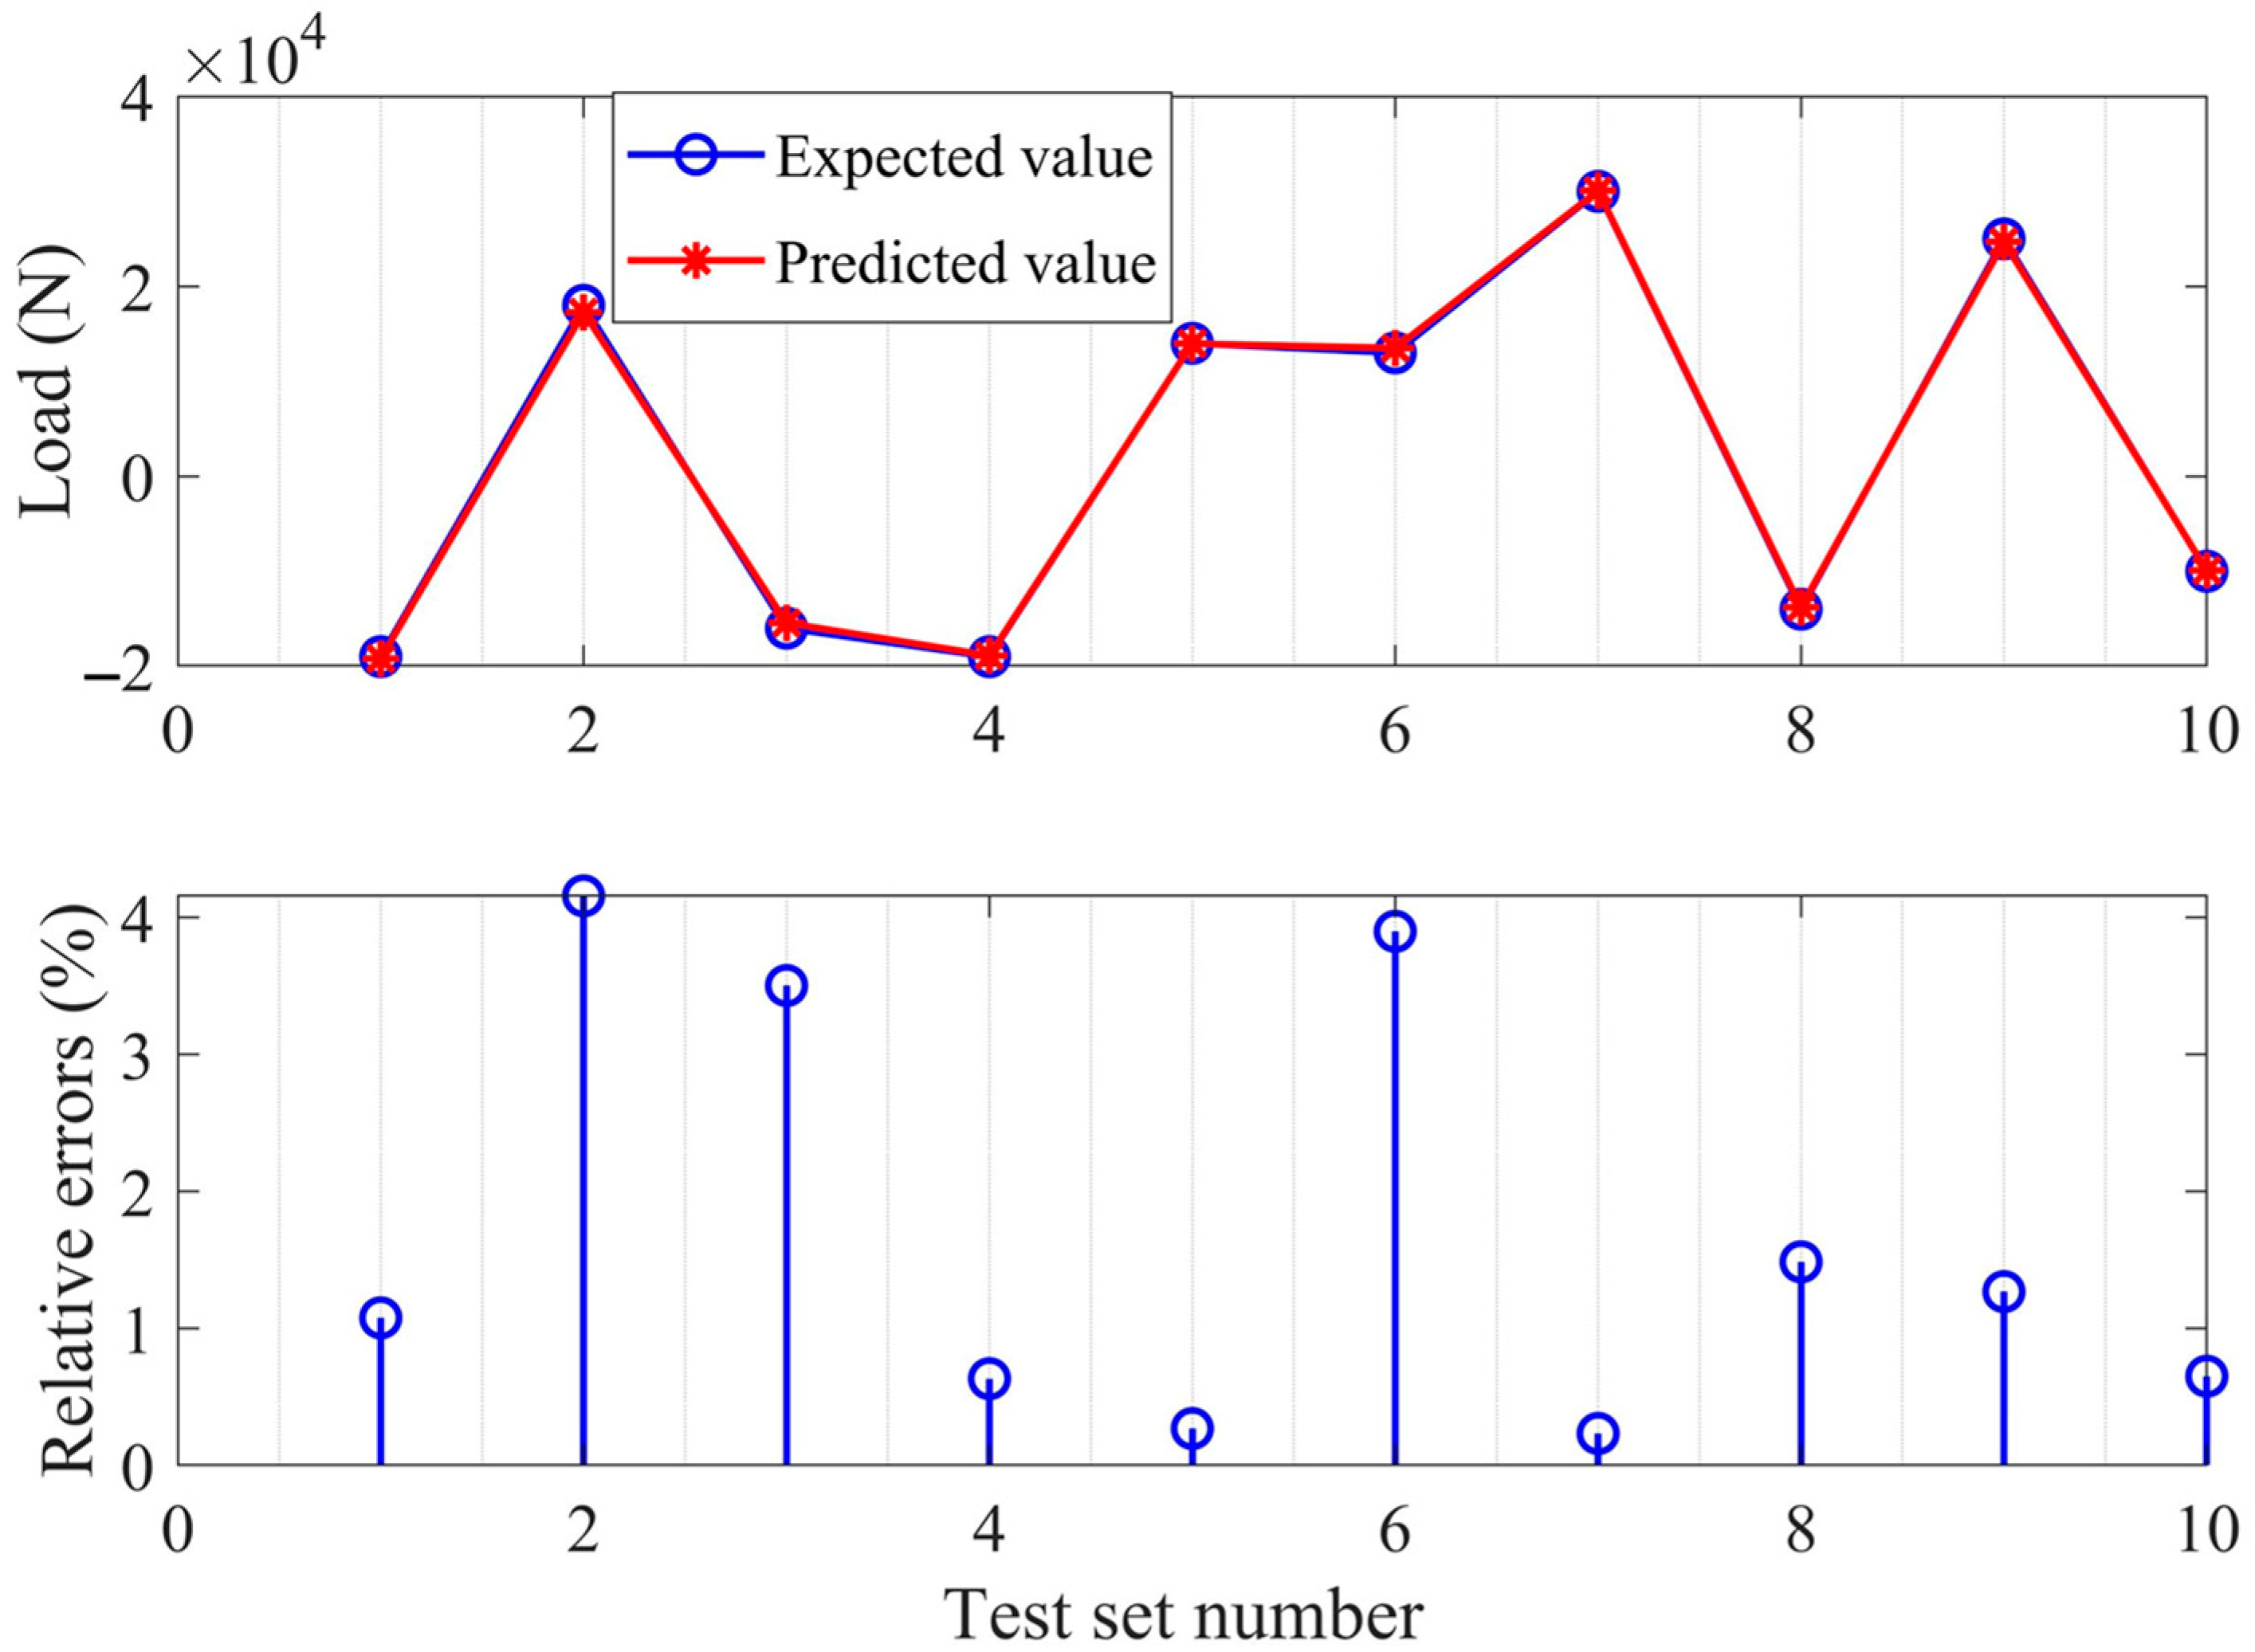
Figure 11.
Expected and predicted value errors of No. 2 load actuator.
From Figure 10 and Figure 11, it manifests that the two selected monitoring points based on the proposed improved correlation method can simultaneously achieve very high monitoring accuracy for the two loading actuators. Moreover, the proposed strain gauge location optimization method does not require the data of operational loads, which determine the optimal monitoring points just based on the strain data. For practical application in engineering, when it is hard to determine the first strain monitoring point, a comparison study of the performance of different first two monitoring points can be used to select the best first two strain gauge locations.
4. Comparison Studies with LASSO and PCR Methods
4.1. LASSO Regression Method
According to LASSO regression, as shown in Equation (4), the parameter controls the sparsity. The smaller the , the more features (strain gauge locations) are selected, which means the sparsity is low.
in which
where N is the number of observed objects (strain gauge locations in this study), and the coefficient is obtained by optimizing the minimum value of the loss function. and imply the strain data and the load data, respectively. When , the relative errors between the predicted and actual values of the No. 1 loading actuator are presented in Figure 12. Moreover, the normalized regression formula is given as follows:
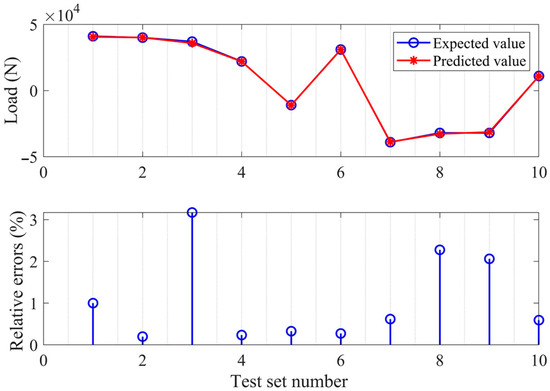
Figure 12.
Expected and predicted load errors of No. 1 load actuator.
Among them, represents the operation load of the No. 1 loading actuator, and are the strain value vectors corresponding to 1~13 monitoring points.
The predicted errors of the No. 2 loading actuator are given in Figure 13, and its normalized regression formula is as follows:

Figure 13.
Expected and predicted load errors of No. 2 load actuator.
Among them, indicates the predicted operation load of the No. 2 loading actuator, and are the strain value vectors corresponding to 1~13 monitoring points.
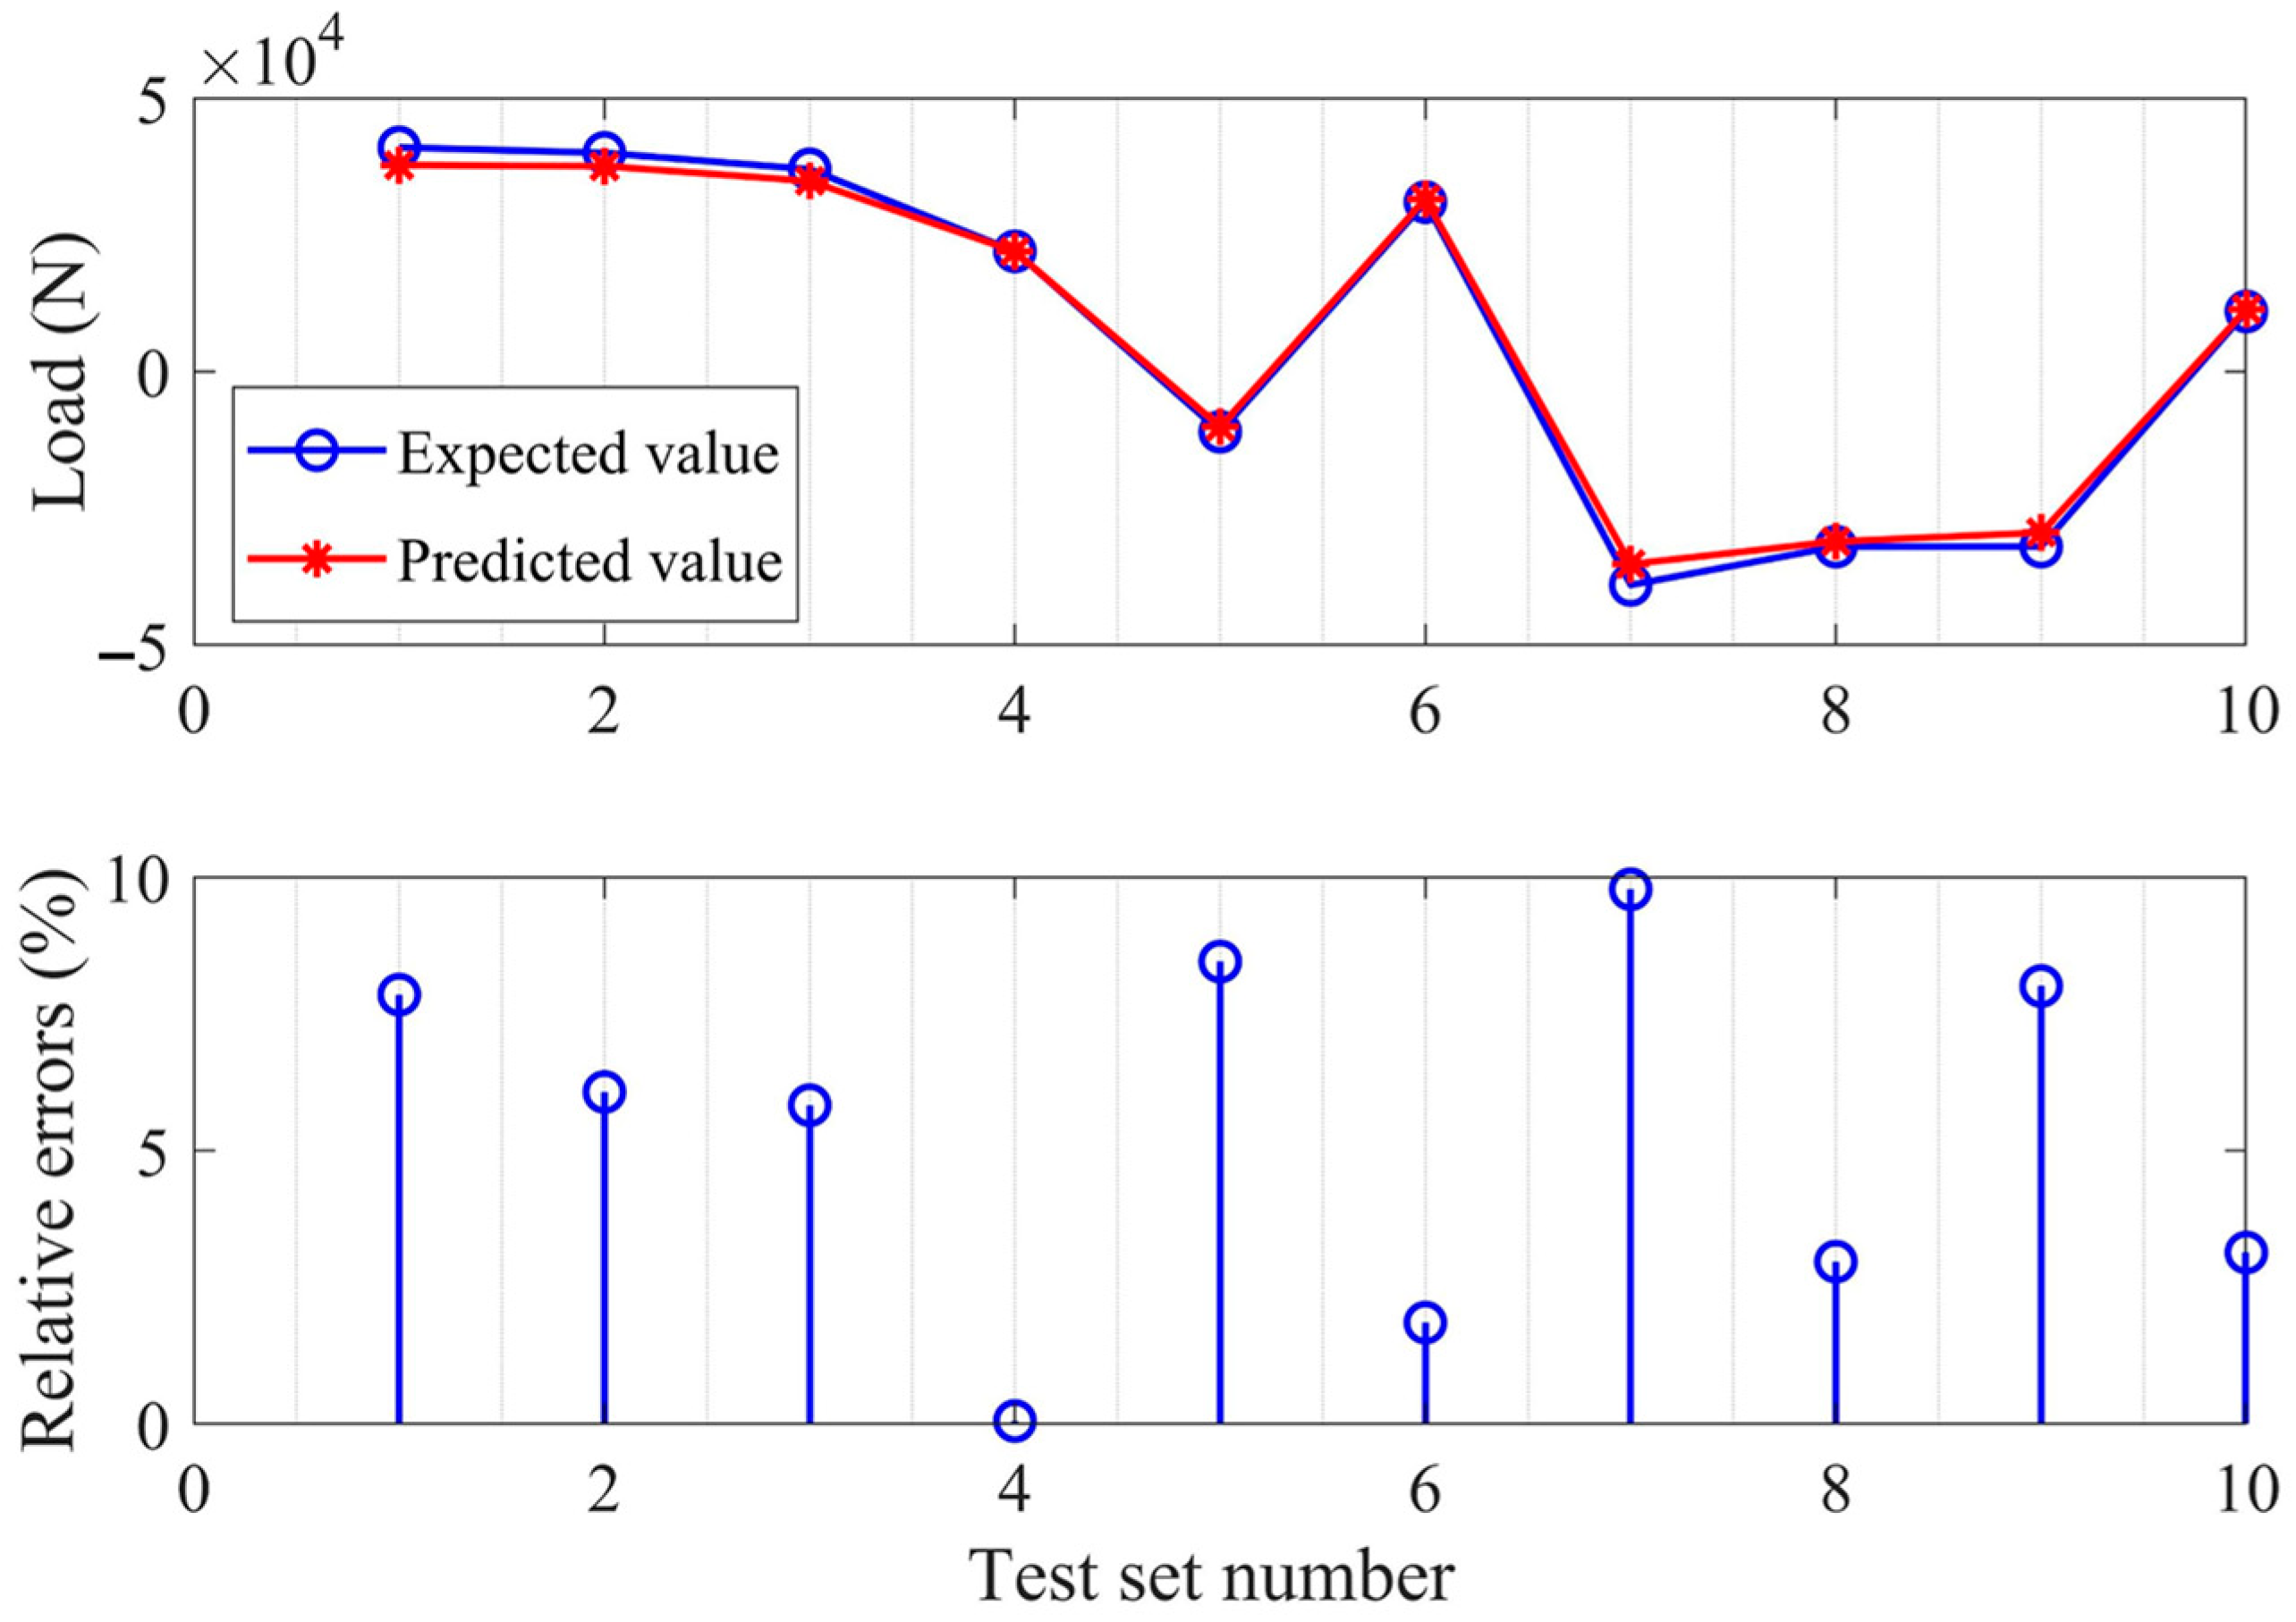
As it manifests from Figure 12 and Figure 13, the LASSO regression selection has many features; all 13 monitoring points are selected, and the load prediction accuracy meets the accuracy of engineering applications. When , the load predicted errors of the No. 1 loading actuator are depicted in Figure 14, and its normalized regression formula is
in which denotes the predicted loads of the No. 1 loading actuator, and imply the strain value vectors corresponding to strain monitoring points 6 and 8, respectively.
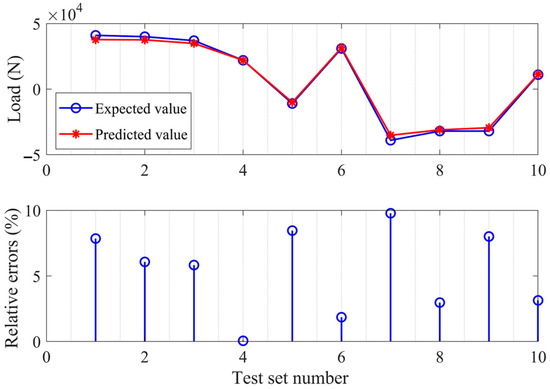
Figure 14.
Expected and predicted load errors of No. 1 load actuator.
The load predicted errors of the No. 2 loading actuator are illustrated in Figure 15, and its normalized regression formula is
in which is the predicted load of the No. 2 loading actuator, and are the strain value vectors corresponding to strain monitoring points 7 and 12, respectively.
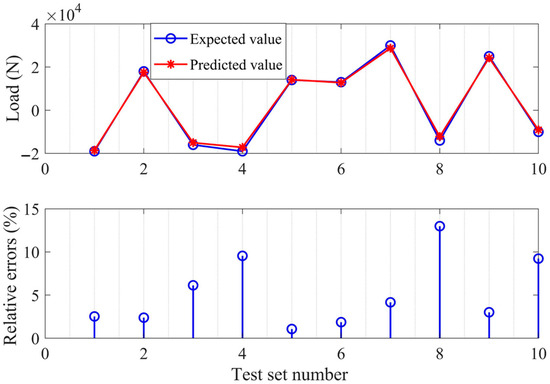
Figure 15.
Expected and predicted load errors of No. 2 load actuator.
The results of Figure 14 and Figure 15 show that the LASSO regression sparsity is larger when the value of is larger, which means that more strain gauge locations will be utilized. In comparison with the results of , the load prediction accuracy of the monitoring point is obviously degraded when the monitoring point is less. The load regression equation of the No. 1 loading actuator selects strain monitoring points 6 and 8, while the No. 2 loading actuator chooses strain monitoring points 7 and 12. It can be concluded that the LASSO method requires both the strain data and the loading data for strain monitoring point selection, which decreases its efficiency. Moreover, the LASSO method individually optimizes the strain monitoring locations for each load actuator. Thus, the determined optimal strain monitoring points are different for different load actuators and cannot simultaneously determine the strain monitoring points for all of the load actuators. By comparison, the proposed two-stage strain gauge location optimization method uses the strain data only and the determined monitoring points have good load prediction accuracy for all of the load actuators.
4.2. Principal Component Regression Method
The eigenvalues are calculated and arranged in order from large to small, and the corresponding eigenvectors are arranged accordingly. The principal component contribution rate is computed based on the eigenvalue results, as shown in Figure 16.
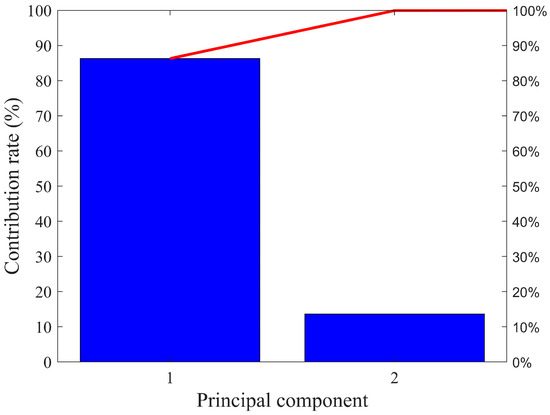
Figure 16.
Principal component contribution rate of first two components.
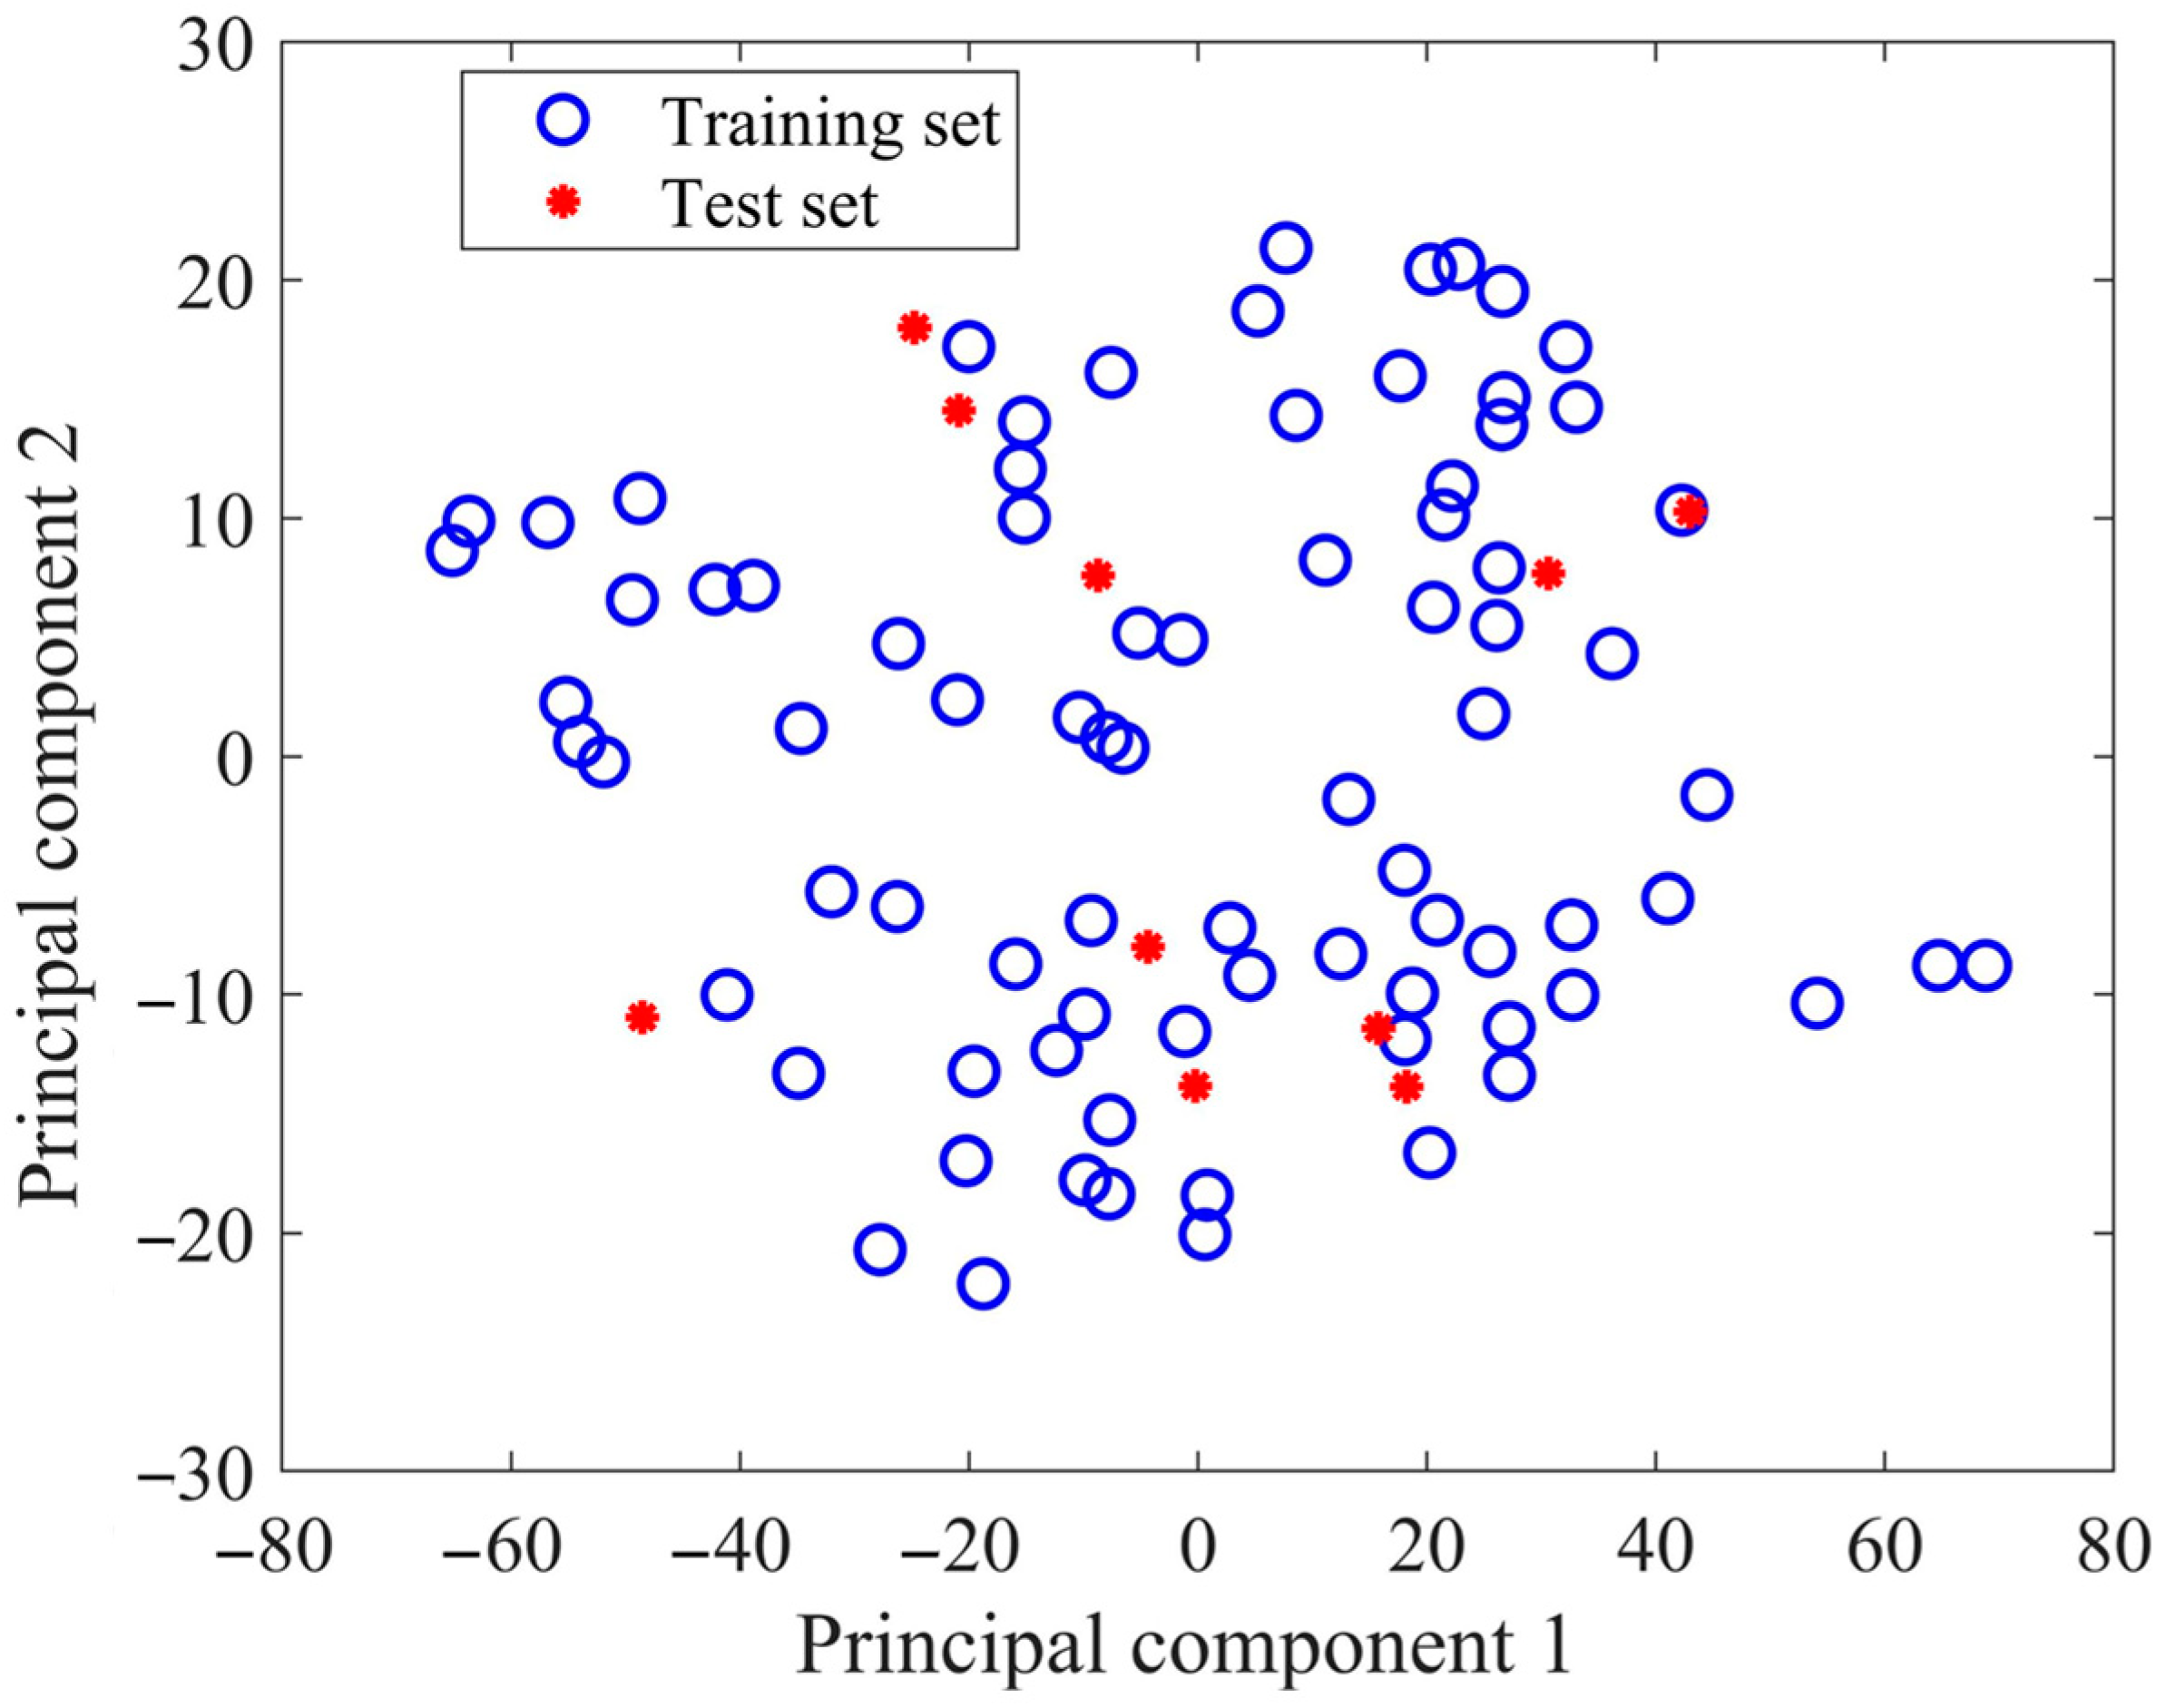
According to the results of Figure 16, principal component 1 and principal component 2 account for more than 95% of all components, which satisfies the requirement of principal component analysis of greater than a 85% contribution rate. Figure 17 shows the strain distribution of the training and testing dataset after projection in principal component 1 and principal component 2, and their distribution is used to determine whether the reduction is reasonable.
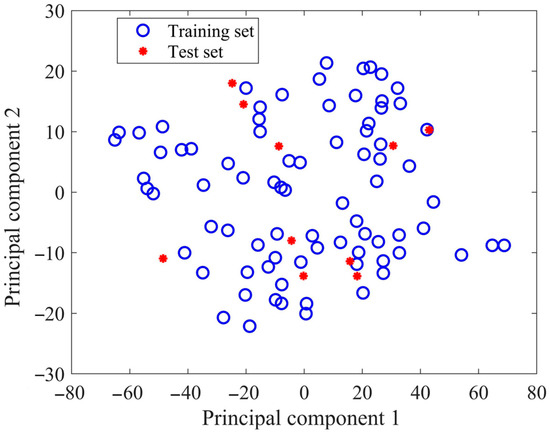
Figure 17.
Projection of training and test datasets in principal components 1 and 2.
From Figure 17, it manifests that the projection distribution of all training sets and test sets on principal component 1 and principal component 2 is scattered, and there is no obvious correlation between them. After the reduction from 13 dimensions to principal component 1 and principal component 2, the training sets and test sets can be clearly distinguished from each other.
The error comparison of the No. 1 loading actuator is shown in Figure 18.
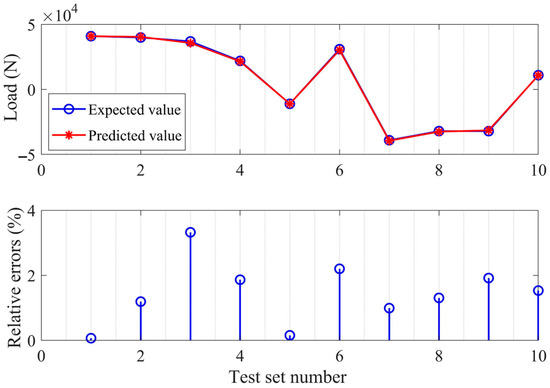
Figure 18.
Expected and predicted load errors of No. 1 load actuator.
The predicted errors of the No. 2 loading actuator are presented in Figure 19.
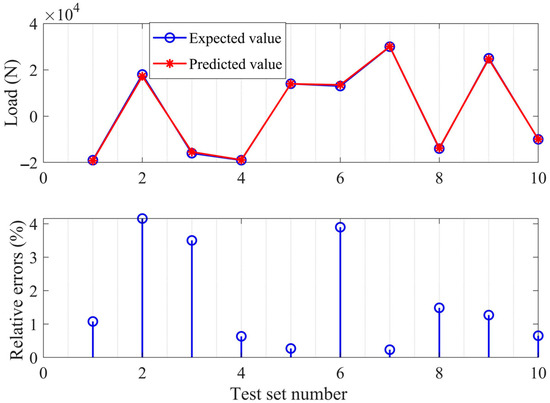
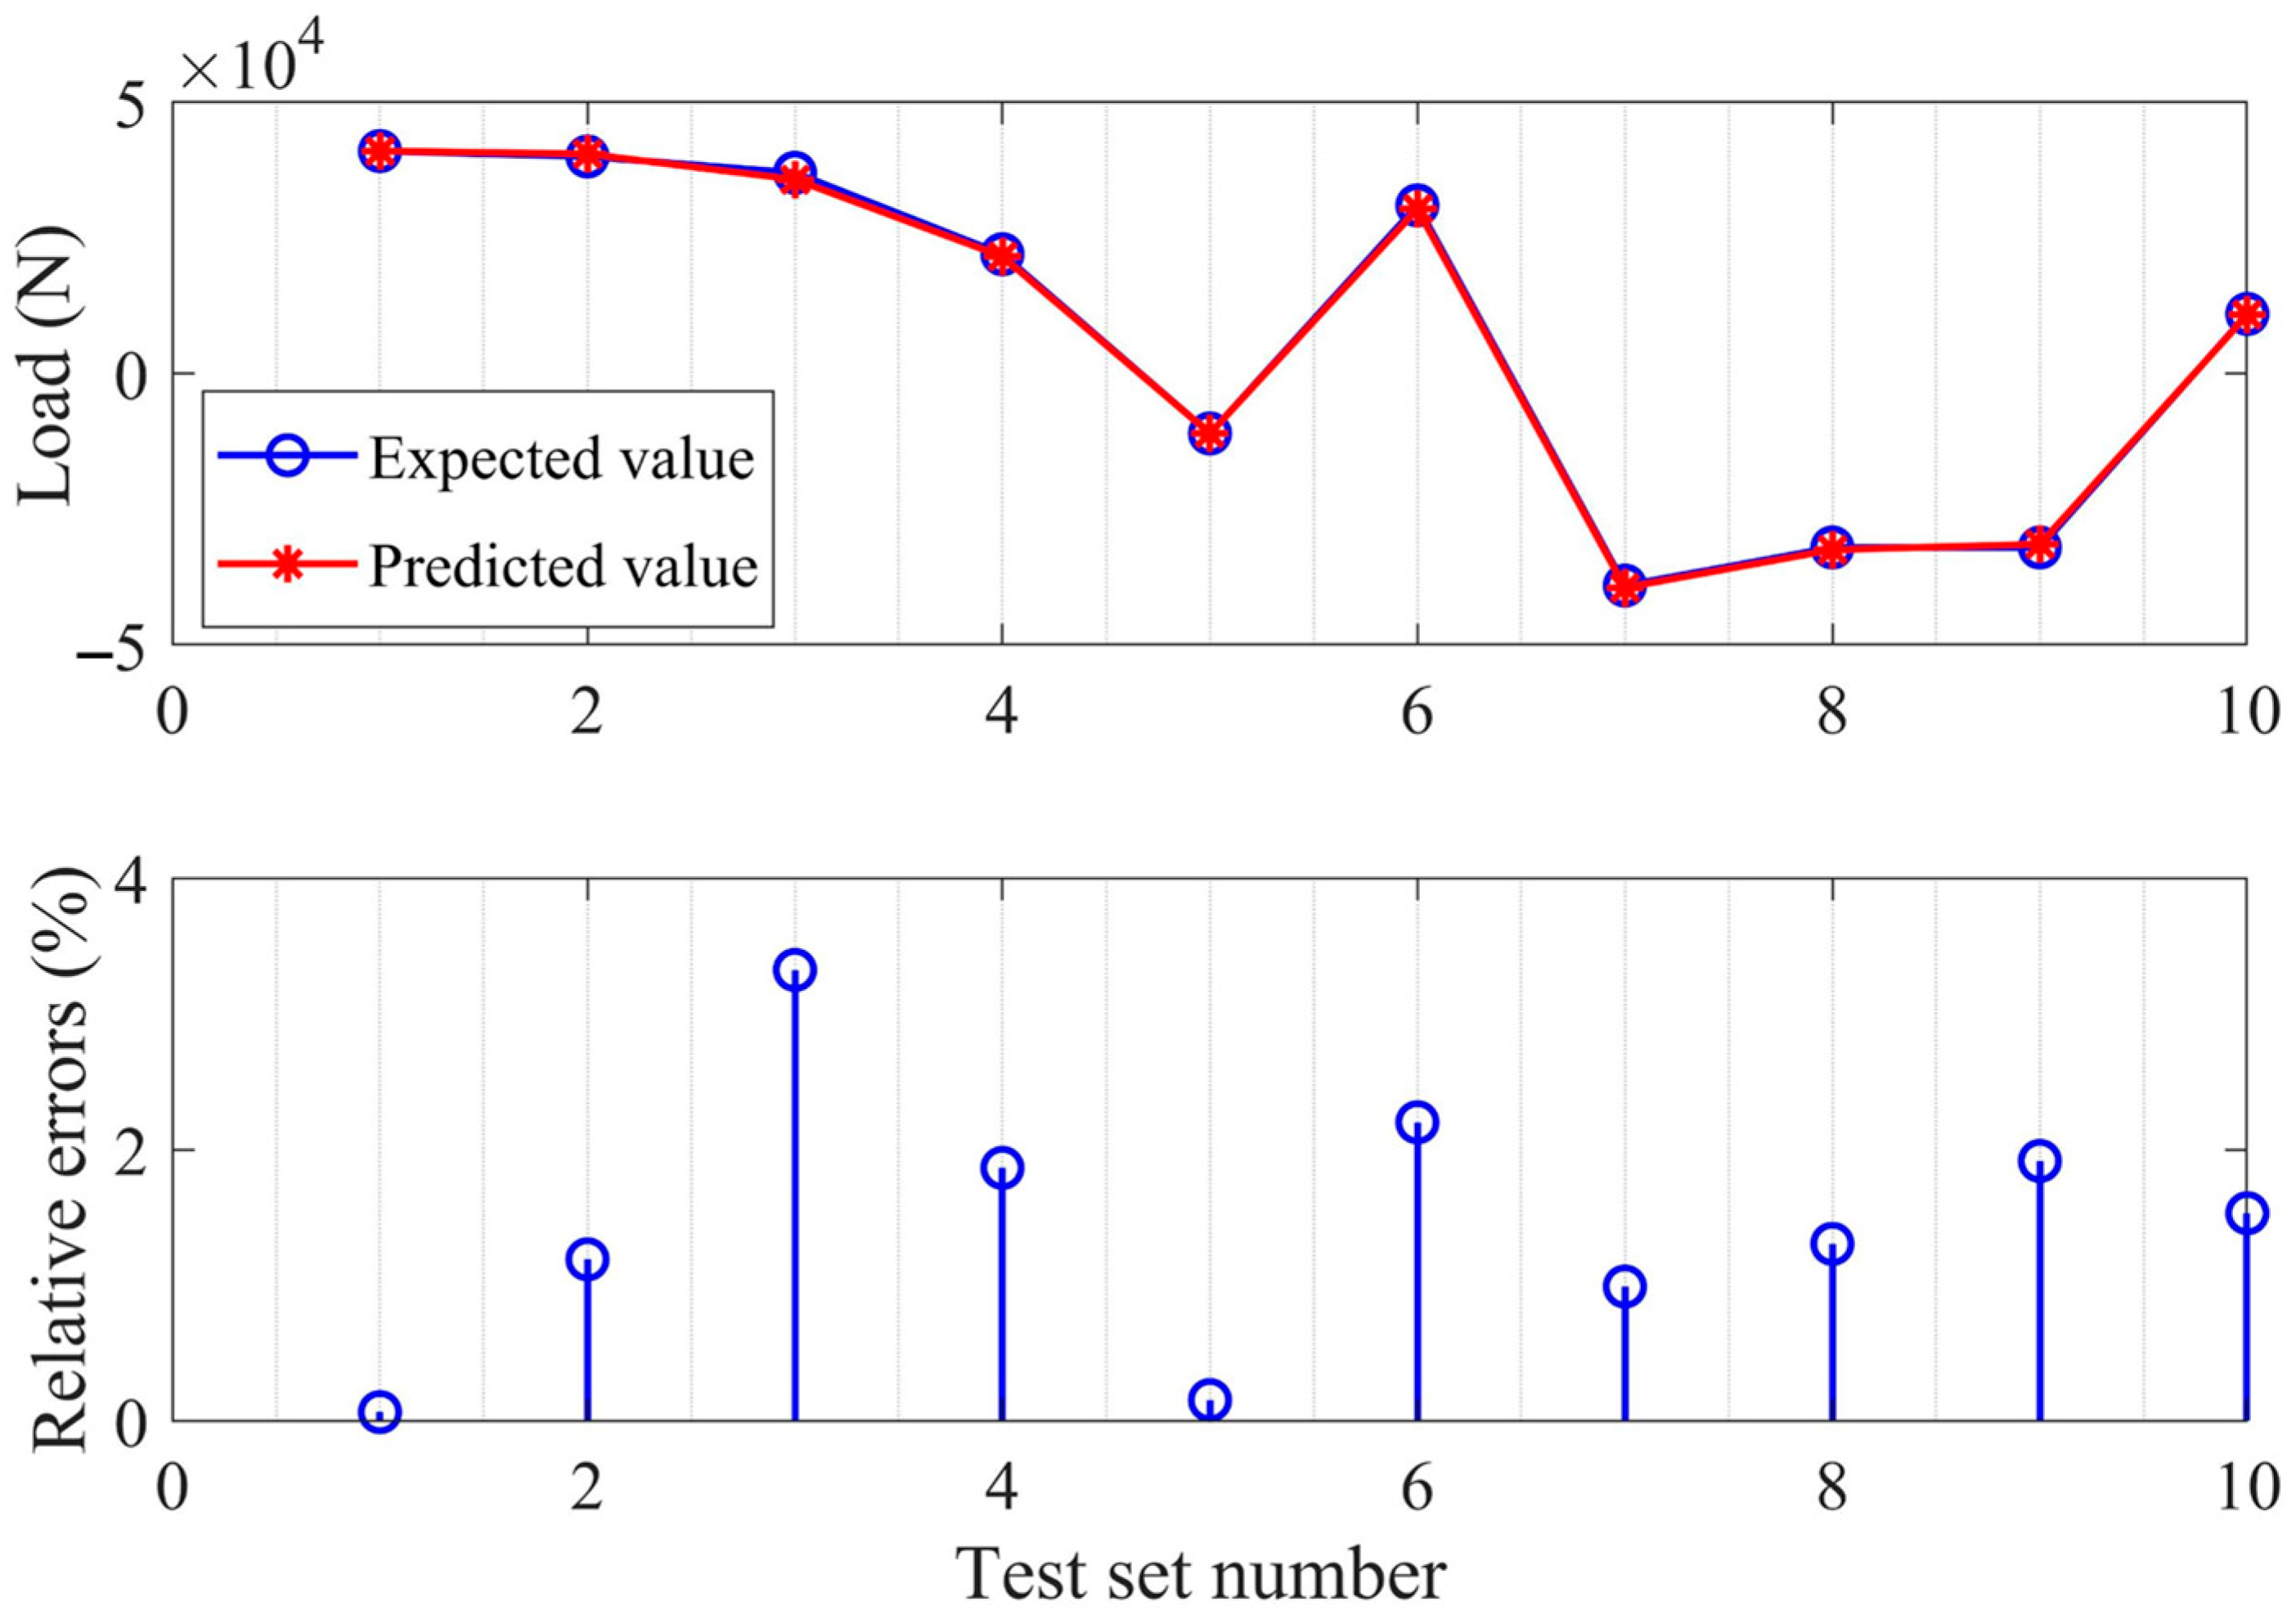
Figure 19.
Expected and predicted load errors of No. 2 load actuator.
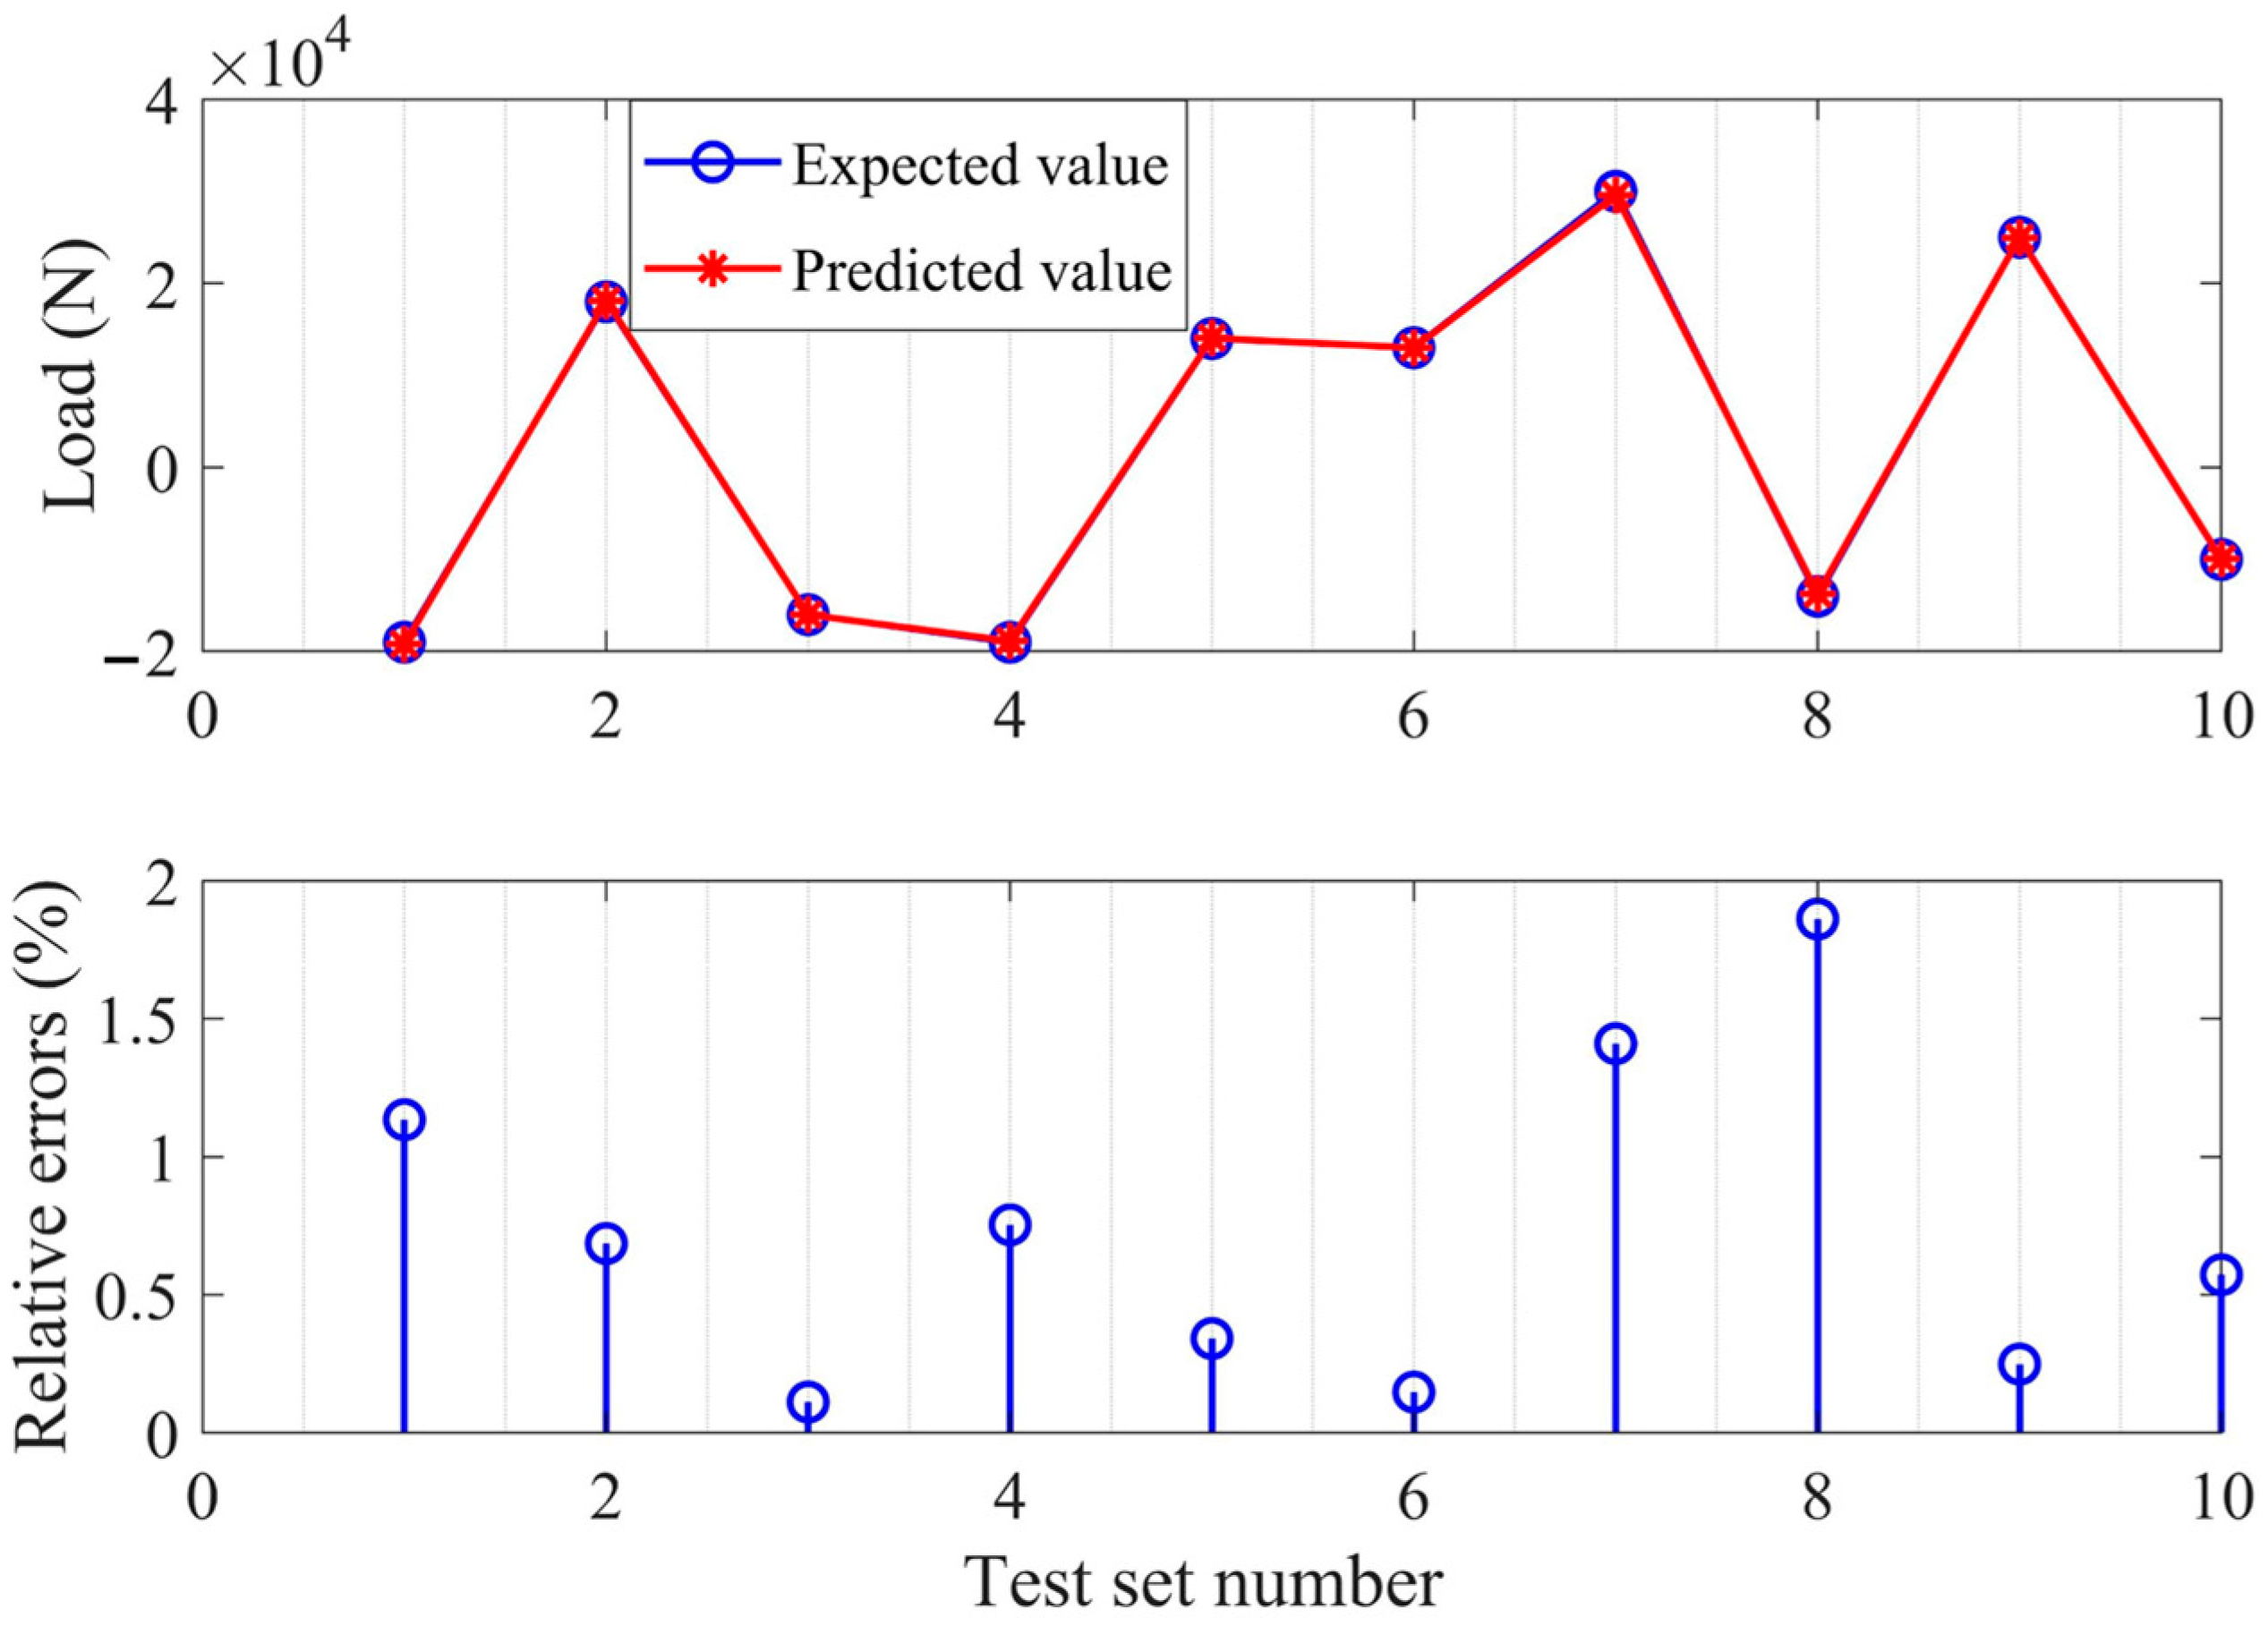
From the results of Figure 18 and Figure 19, the prediction error of principal component regression is less than 5%, and the accuracy is clearly improved when compared with two different monitoring points based on LASSO regression. However, the PCR method requires the information of all 13 monitoring points. Thus, it is not suitable for strain gauge location optimization.
5. Conclusions
In this study, a two-stage strain gauge location optimization method is proposed based on a minimum correlation criterion. In this method, an improved correlation coefficient method is defined to evaluate the correlation degree between multiple monitoring points. Moreover, the operational load prediction accuracy of the proposed method, LASSO regression, and principal component regression is compared to validate the advantages of the proposed method. Some other major conclusions are summarized as follows:
- The strain gauge location optimization method based on the proposed improved correlation method gives different combination sequences of monitoring points and the optimal strain monitoring location sequence can be readily determined.
- The proposed correlation method is reliable and robust in optimizing the strain gauge locations and providing accurate load prediction results.
- LASSO regression can select strain monitoring points by constructing a penalty function, but its performance depends on the monitored loads and can only deal with a single load variable condition each time.
- Principal component regression can yield two principal components to make its contribution rate reach 95%, with their load prediction errors being less than 5%, but it belongs to the feature extraction method, requiring the information of all monitoring points.
- For practical application of the proposed method, the optimal strain gauge locations are determined via finite element analysis of aircraft structures. Furthermore, the optimized strain gauge locations should be validated by a ground test before implementation in practical applications. In addition, backup strain gauge locations should be considered for practical application.
Author Contributions
Conceptualization, H.P. and M.L.; methodology, H.P.; validation, Y.N., S.C. and B.W.; formal analysis, S.C.; investigation, M.L.; resources, B.W.; data curation, S.C.; writing—original draft preparation, H.P.; writing—review and editing, S.C.; visualization, Y.N.; supervision, B.W.; project administration, M.L.; funding acquisition, Y.N. All authors have read and agreed to the published version of the manuscript.
Funding
This research was funded by the National Natural Science Foundation of China, grant number 12102346.
Institutional Review Board Statement
Not applicable.
Informed Consent Statement
Not applicable.
Data Availability Statement
The data will be made available upon request.
Conflicts of Interest
The authors declare no conflicts of interest.
References
- Rui, J.; He, X.; Li, Y. Individual aircraft life monitoring: An engineering approach for fatigue damage evaluation. Chin. J. Aeronaut. 2018, 31, 727–739. [Google Scholar]
- Ignatovich, S.; Menou, A.; Karuskevich, M.; Maruschak, P. Fatigue damage and sensor development for aircraft structural health monitoring. Theor. Appl. Fract. Mech. 2013, 65, 23–27. [Google Scholar] [CrossRef]
- Zhang, Y.; Wang, B.; Ning, Y.; Xue, H.; Lei, X. Study on health monitoring and fatigue life prediction of aircraft structures. Materials 2022, 15, 8606. [Google Scholar] [CrossRef] [PubMed]
- Dziendzikowski, M.; Kurnyta, A.; Reymer, P.; Kurdelski, M.; Klysz, S.; Leski, A.; Dragan, K. Application of operational load monitoring system for fatigue estimation of main landing gear attachment frame of an aircraft. Materials 2021, 14, 6564. [Google Scholar] [CrossRef]
- Molent, L.; Aktepe, B. Review of fatigue monitoring of agile military aircraft. Fatigue Fract. Eng. Mater. Struct. 2000, 23, 767–785. [Google Scholar] [CrossRef]
- Zhang, Y.; Cao, S.; Wang, B.; Yin, Z. A Flight Parameter-Based Aircraft Structural Load Monitoring Method Using a Genetic Algorithm Enhanced Extreme Learning Machine. Appl. Sci. 2023, 13, 4018. [Google Scholar] [CrossRef]
- Zhang, C.; Mousavi, A.A.; Masri, S.F.; Gholipour, G.; Yan, K.; Li, X. Vibration feature extraction using signal processing techniques for structural health monitoring: A review. Mech. Syst. Signal Process. 2022, 177, 109175. [Google Scholar] [CrossRef]
- Sofi, A.; Regita, J.J.; Rane, B.; Lau, H.H. Structural health monitoring using wireless smart sensor network—An overview. Mech. Syst. Signal Process. 2022, 163, 108113. [Google Scholar] [CrossRef]
- Hassani, S.; Dackermann, U. A systematic review of advanced sensor technologies for non-destructive testing and structural health monitoring. Sensors 2023, 23, 2204. [Google Scholar] [CrossRef]
- Ostachowicz, W.; Soman, R.; Malinowski, P. Optimization of sensor placement for structural health monitoring: A review. Struct. Health Monit. 2019, 18, 963–988. [Google Scholar] [CrossRef]
- Tan, Y.; Zhang, L. Computational methodologies for optimal sensor placement in structural health monitoring: A review. Struct. Health Monit. 2020, 19, 1287–1308. [Google Scholar] [CrossRef]
- Wang, S.; Lai, X.; He, X.; Li, K.; Lv, L.; Song, X. Optimal sensor placement for digital twin based on mutual information and correlation with multi-fidelity data. Eng. Comput. 2024, 40, 1289–1308. [Google Scholar] [CrossRef]
- Kružić, S.; Musić, J.; Papić, V.; Kamnik, R. Strain Gauge Neural Network-Based Estimation as an Alternative for Force and Torque Sensor Measurements in Robot Manipulators. Appl. Sci. 2023, 13, 10217. [Google Scholar] [CrossRef]
- Barthorpe, R.J.; Worden, K. Emerging trends in optimal structural health monitoring system design: From sensor placement to system evaluation. J. Sens. Actuator Netw. 2020, 9, 31. [Google Scholar] [CrossRef]
- Yi, T.H.; Li, H.N.; Gu, M. Optimal sensor placement for structural health monitoring based on multiple optimization strategies. Struct. Des. Tall Spec. Build. 2011, 20, 881–900. [Google Scholar] [CrossRef]
- Flah, M.; Nunez, I.; Ben Chaabene, W.; Nehdi, M.L. Machine learning algorithms in civil structural health monitoring: A systematic review. Arch. Comput. Methods Eng. 2021, 28, 2621–2643. [Google Scholar] [CrossRef]
- Sony, S.; Laventure, S.; Sadhu, A. A literature review of next-generation smart sensing technology in structural health monitoring. Struct. Control Health Monit. 2019, 26, e2321. [Google Scholar] [CrossRef]
- Jaya, M.M.; Ceravolo, R.; Fragonara, L.Z.; Matta, E. An optimal sensor placement strategy for reliable expansion of mode shapes under measurement noise and modelling error. J. Sound Vib. 2020, 487, 115511. [Google Scholar] [CrossRef]
- Zhou, K.; Wu, Z.Y. Strain gauge placement optimization for structural performance assessment. Eng. Struct. 2017, 141, 184–197. [Google Scholar] [CrossRef]
- Jiang, X.; Jiang, F. Optimal strain sensors placement to analyze the modal parameters of the sorting arm. J. Vibroeng. 2020, 22, 145–155. [Google Scholar] [CrossRef]
- Morris, B.K.; Davis, R.B. Optimal design of strain sensor placement for distributed static load determination. Inverse Probl. 2023, 39, 125017. [Google Scholar] [CrossRef]
- Zhou, J.; Cai, Z.; Zhao, P.; Tang, B. Efficient sensor placement optimization for shape deformation sensing of antenna structures with fiber Bragg grating strain sensors. Sensors 2018, 18, 2481. [Google Scholar] [CrossRef]
- König, C.; Helmi, A.M. Sensitivity analysis of sensors in a hydraulic condition monitoring system using CNN models. Sensors 2020, 20, 3307. [Google Scholar] [CrossRef] [PubMed]
- Růžička, J. Strain gauge placement optimization methodology to measure multiaxial loads of complex structure. J. Strain Anal. Eng. Des. 2022, 57, 614–628. [Google Scholar] [CrossRef]
- Święch, Ł. Calibration of a load measurement system for an unmanned aircraft composite wing based on fibre bragg gratings and electrical strain gauges. Aerospace 2020, 7, 27. [Google Scholar] [CrossRef]
- Hassani, S.; Dackermann, U. A systematic review of optimization algorithms for structural health monitoring and optimal sensor placement. Sensors 2023, 23, 3293. [Google Scholar] [CrossRef] [PubMed]
- Huang, Y.; Ludwig, S.A.; Deng, F. Sensor optimization using a genetic algorithm for structural health monitoring in harsh environments. J. Civ. Struct. Health Monit. 2016, 6, 509–519. [Google Scholar] [CrossRef]
- Yang, C. Sensor placement for structural health monitoring using hybrid optimization algorithm based on sensor distribution index and FE grids. Struct. Control Health Monit. 2018, 25, e2160. [Google Scholar] [CrossRef]
- Rodríguez, R.; Mexicano, A.; Bila, J.; Cervantes, S.; Ponce, R. Feature extraction of electrocardiogram signals by applying adaptive threshold and principal component analysis. J. Appl. Res. Technol. 2015, 13, 261–269. [Google Scholar] [CrossRef]
- Yan, X.; Nazmi, S.; Erol, B.A.; Homaifar, A.; Gebru, B.; Tunstel, E. An efficient unsupervised feature selection procedure through feature clustering. Pattern Recognit. Lett. 2020, 131, 277–284. [Google Scholar] [CrossRef]
- Tian, Y.; Zhang, J.; Li, L.; Liu, Z. A novel sensor-based human activity recognition method based on hybrid feature selection and combinational optimization. IEEE Access 2021, 9, 107235–107249. [Google Scholar] [CrossRef]
- Lu, W.; Wen, R.; Teng, J.; Li, X.; Li, C. Data correlation analysis for optimal sensor placement using a bond energy algorithm. Measurement 2016, 91, 509–518. [Google Scholar] [CrossRef]
- Shin, G.-H.; Hur, J.-W. Correlation coefficient based optimal vibration sensor placement and number. Sensors 2022, 22, 1207. [Google Scholar] [CrossRef] [PubMed]
- Zhang, M.; Ding, J.; Li, B. Sparse learning method with feature selection for sensor placement and response prediction. IEEE Trans. Aerosp. Electron. Syst. 2024, Early access. [Google Scholar] [CrossRef]
- Al-Obeidat, F.; Spencer, B.; Alfandi, O. Consistently accurate forecasts of temperature within buildings from sensor data using ridge and lasso regression. Future Gener. Comput. Syst. 2020, 110, 382–392. [Google Scholar] [CrossRef]
- Yu, H.; Hutson, A.D. Inferential procedures based on the weighted Pearson correlation coefficient test statistic. J. Appl. Stat. 2024, 51, 481–496. [Google Scholar] [CrossRef]


Disclaimer/Publisher’s Note: The statements, opinions and data contained in all publications are solely those of the individual author(s) and contributor(s) and not of MDPI and/or the editor(s). MDPI and/or the editor(s) disclaim responsibility for any injury to people or property resulting from any ideas, methods, instructions or products referred to in the content. |
© 2024 by the authors. Licensee MDPI, Basel, Switzerland. This article is an open access article distributed under the terms and conditions of the Creative Commons Attribution (CC BY) license (https://creativecommons.org/licenses/by/4.0/).