
Hydrochemical Characteristics and Suitability Assessment of Groundwater Quality for Irrigation


Abstract
:1. Introduction
2. Materials and Methods
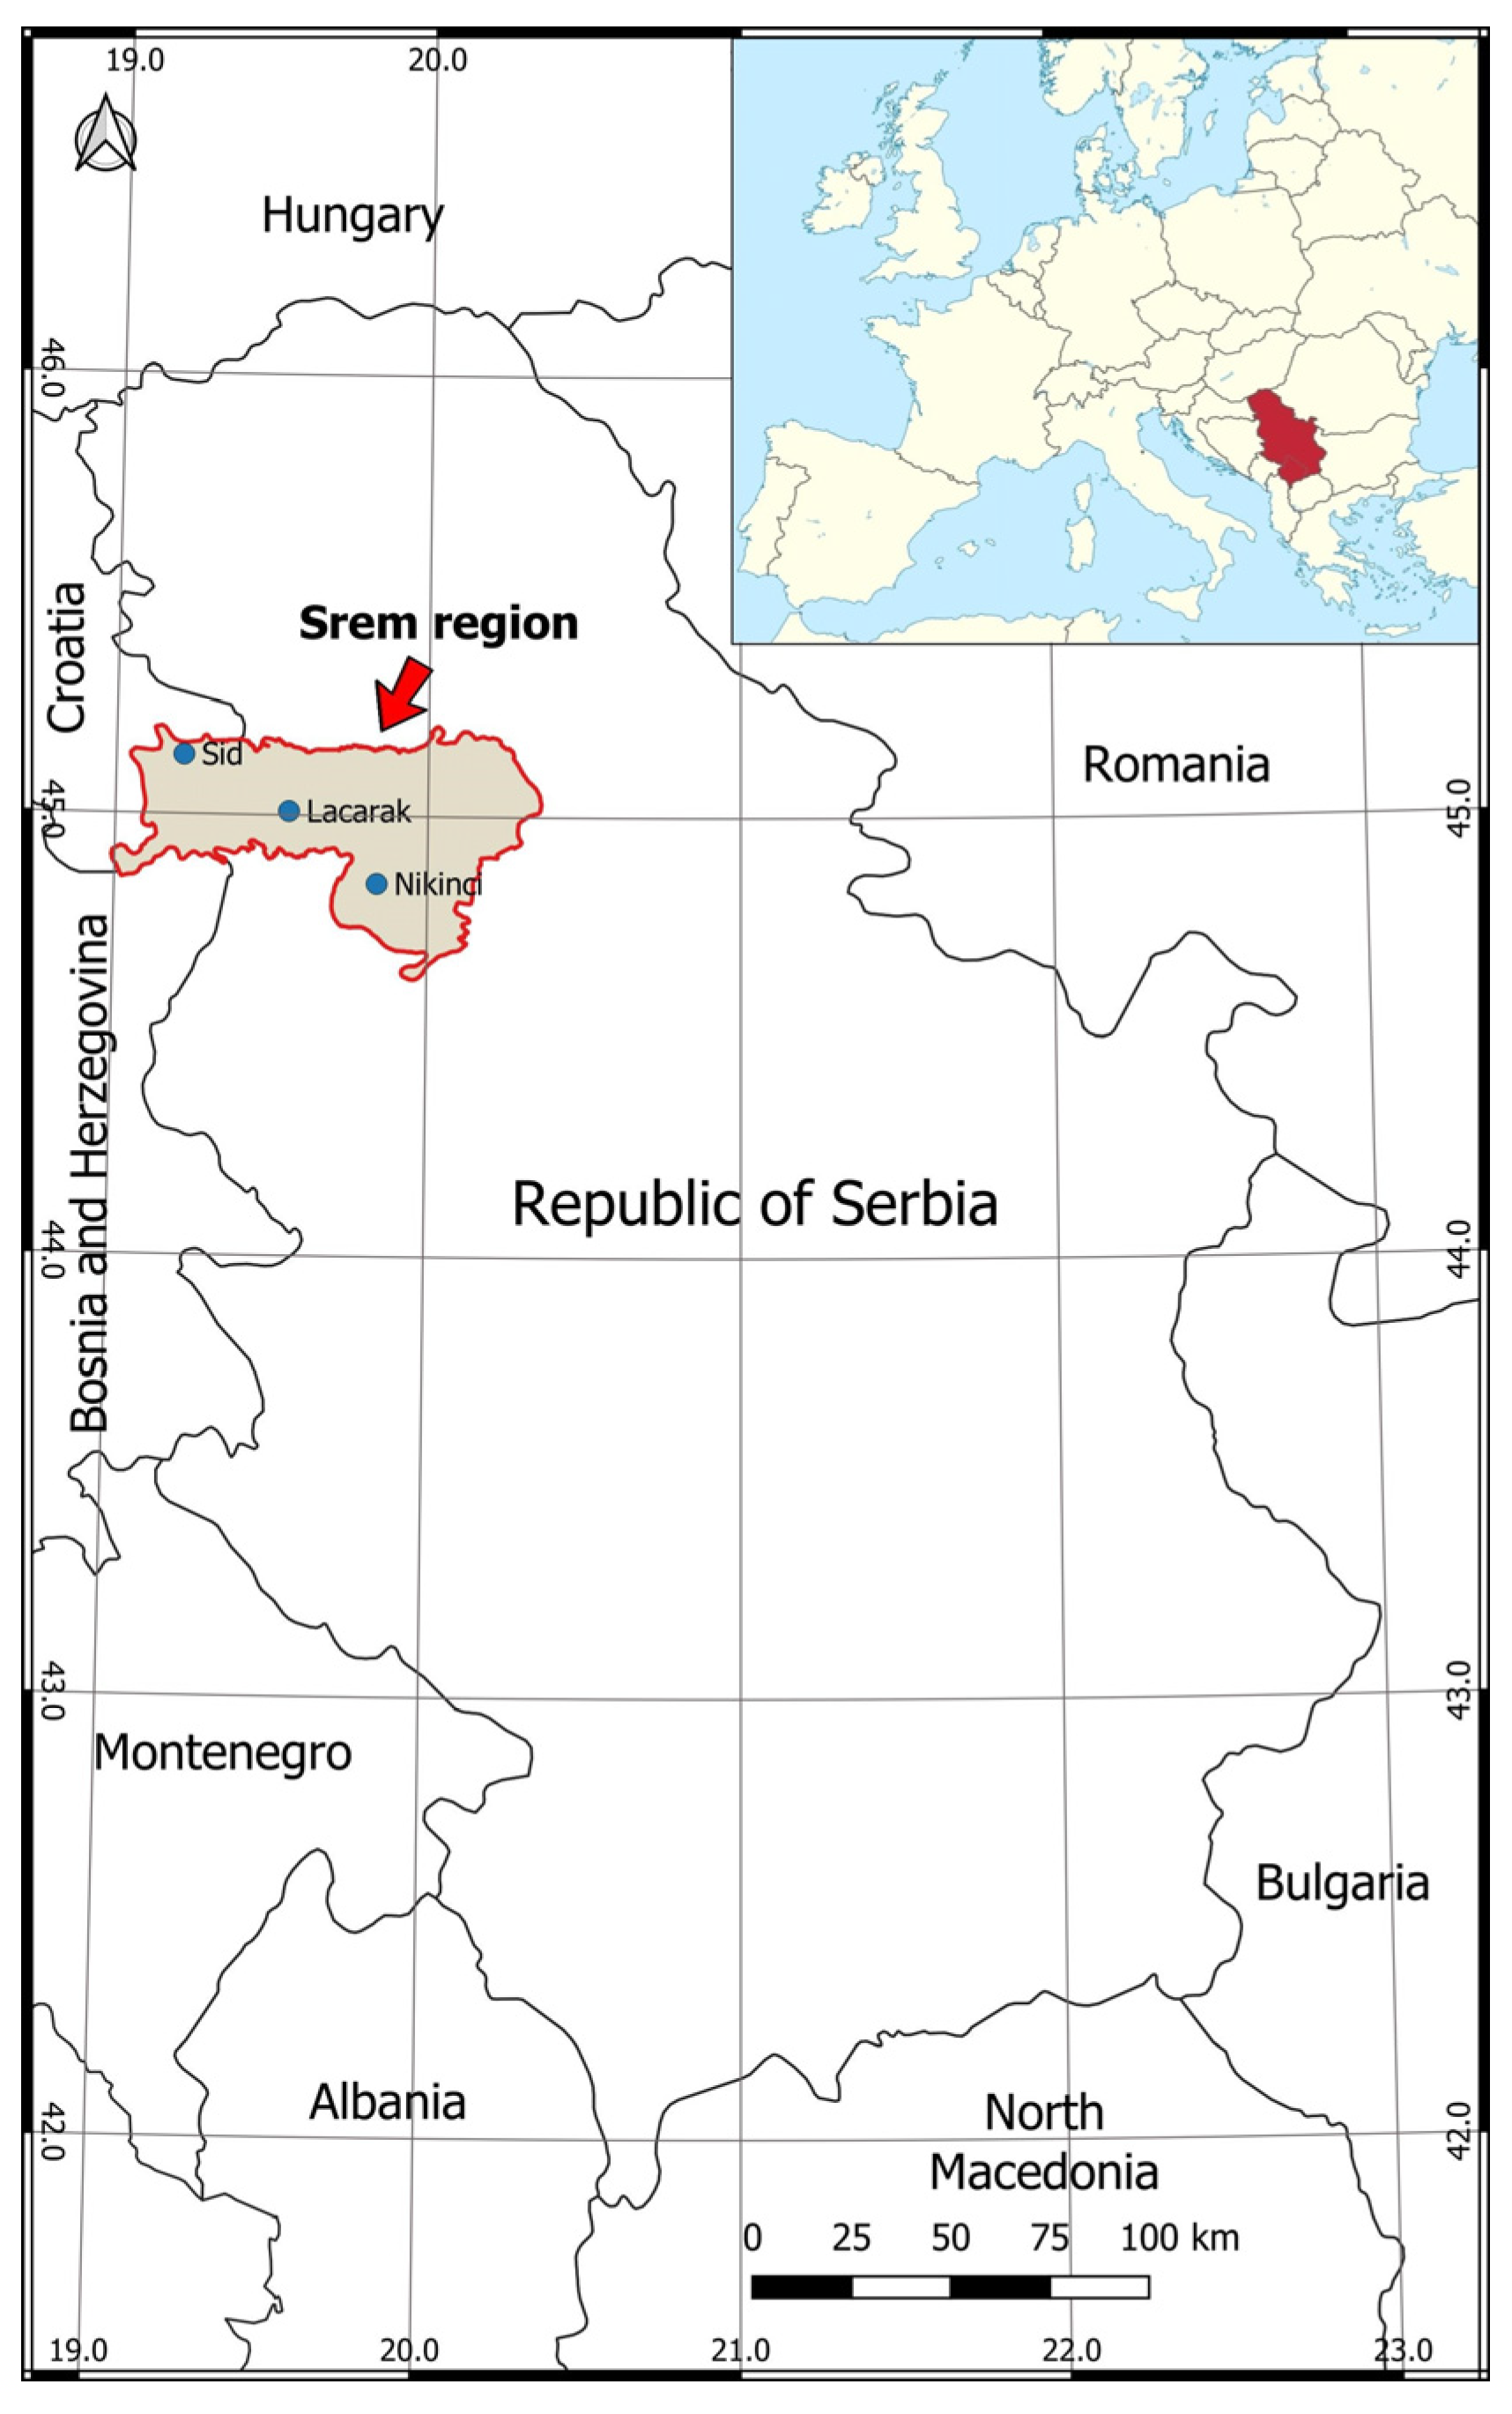
2.1. Study Area
2.2. Collection of Water Samples and Data Analysis
2.3. Irrigation Water Quality Indices
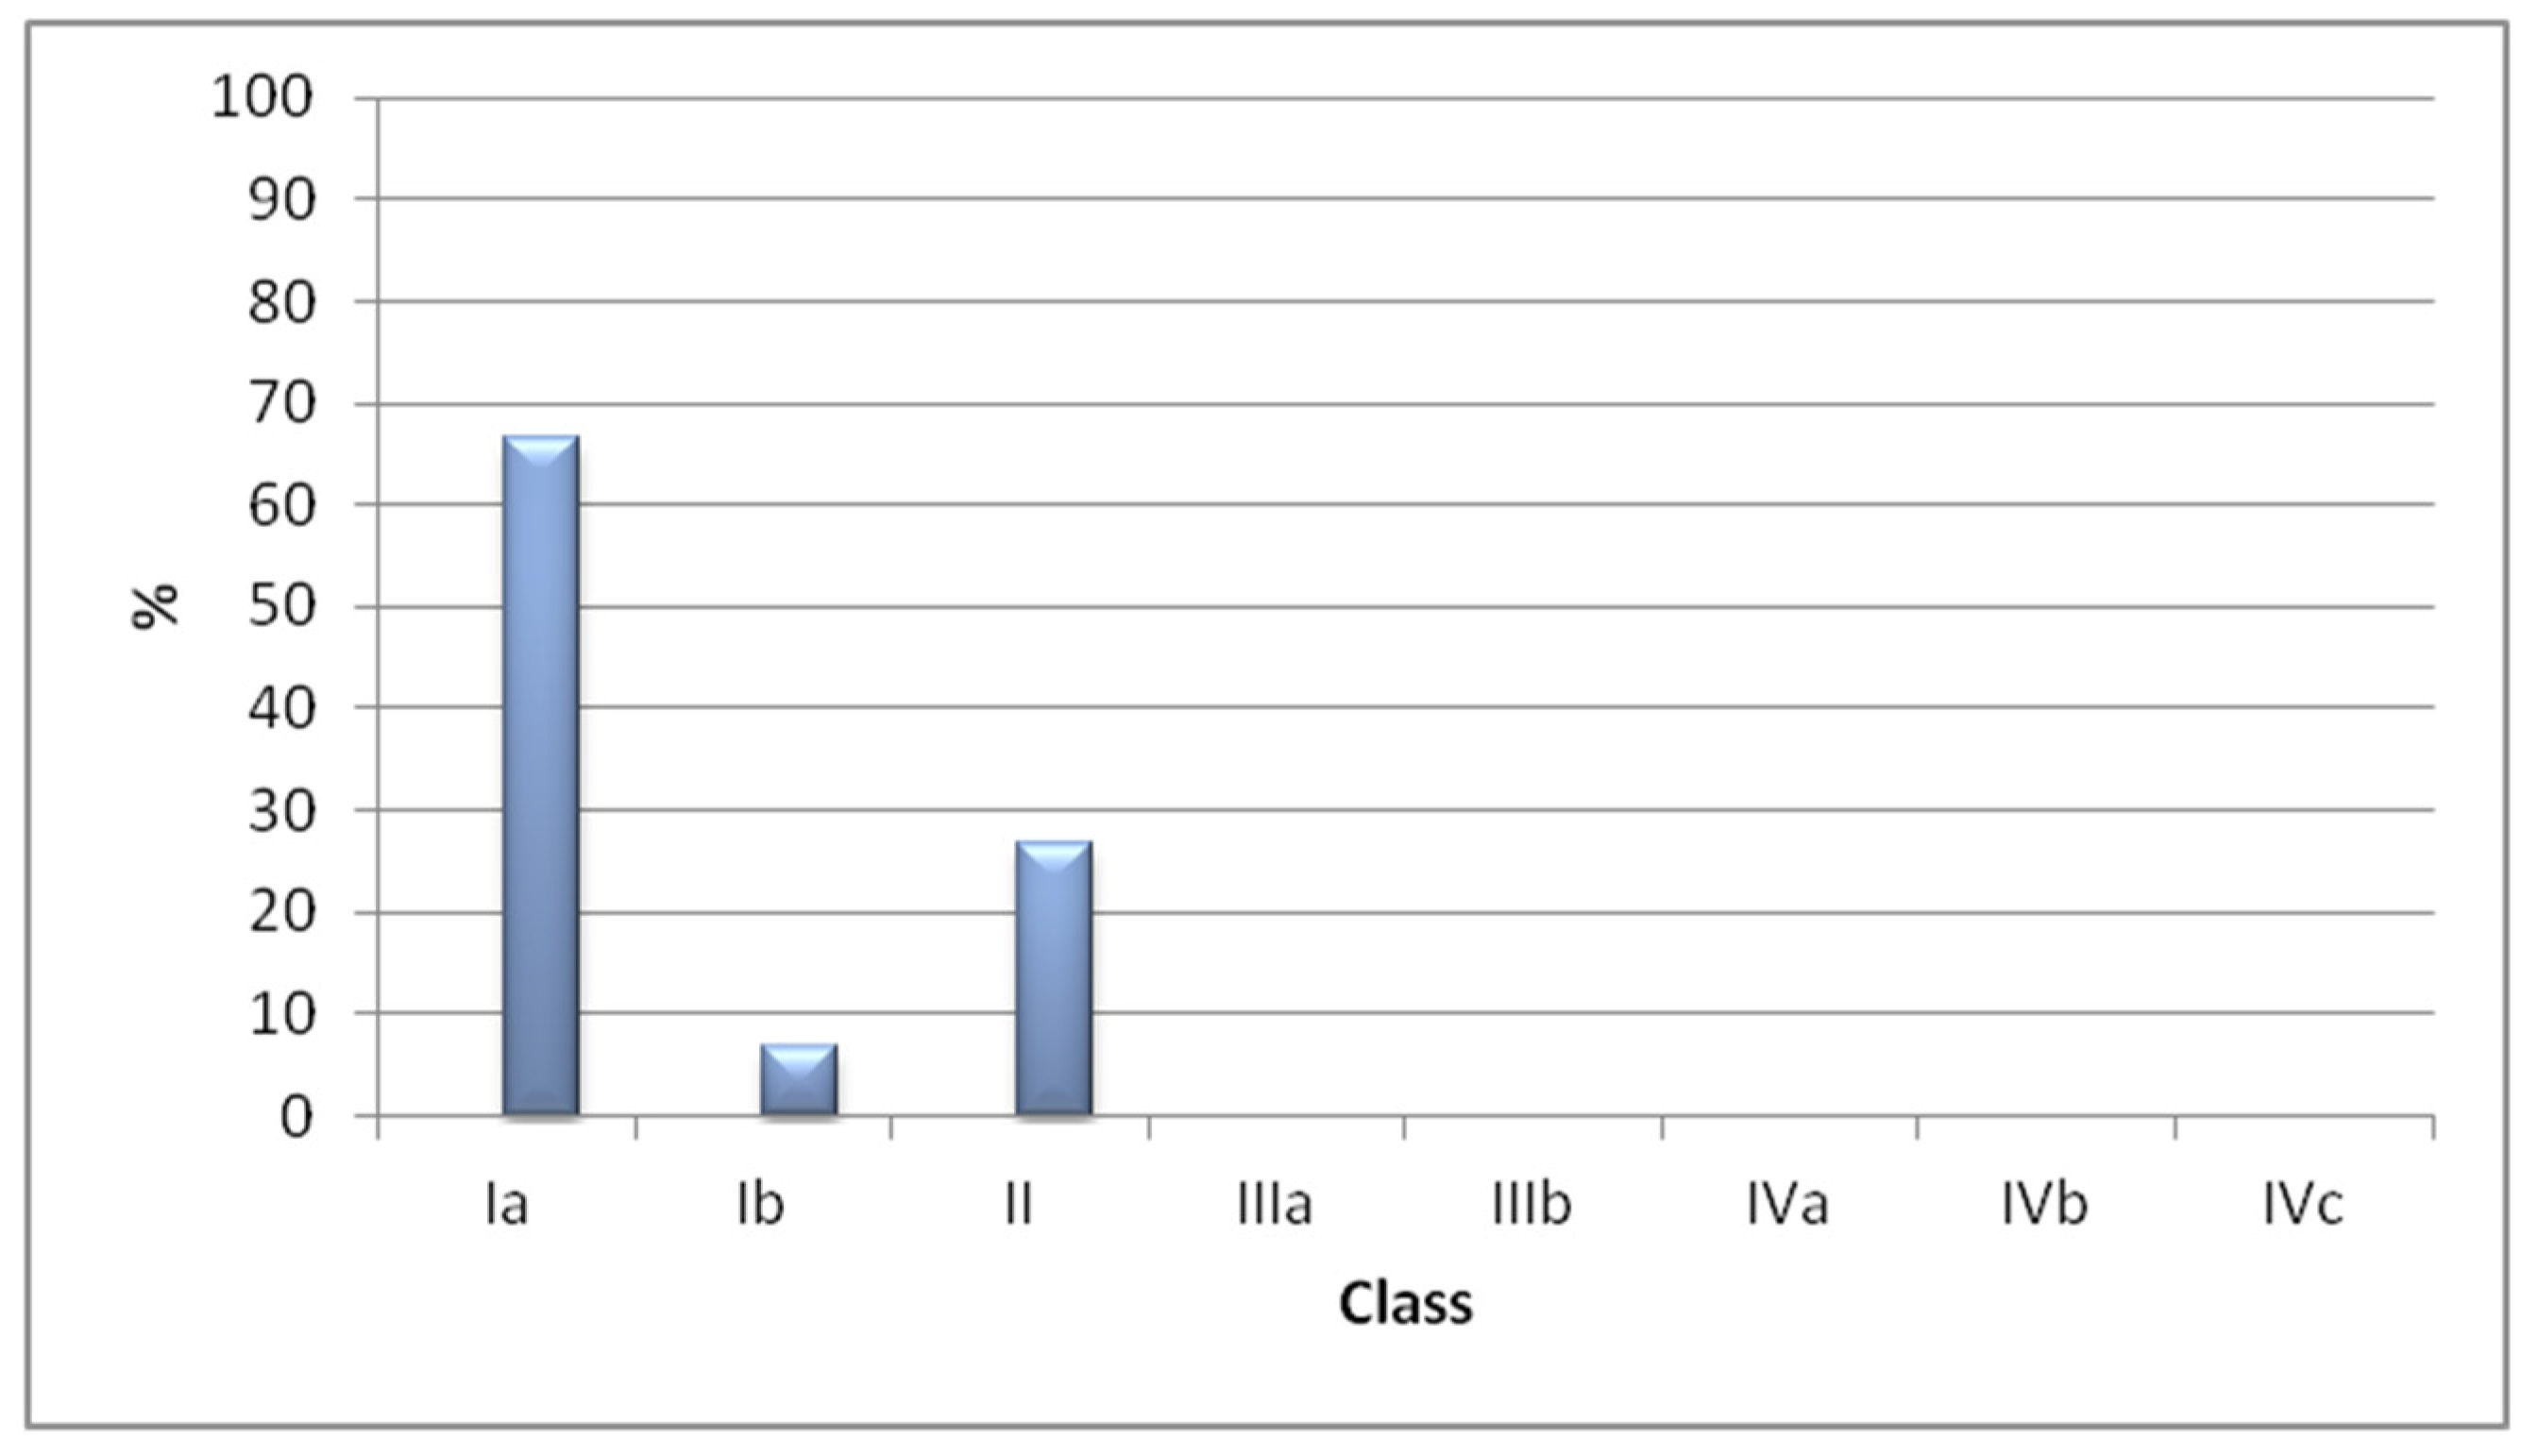
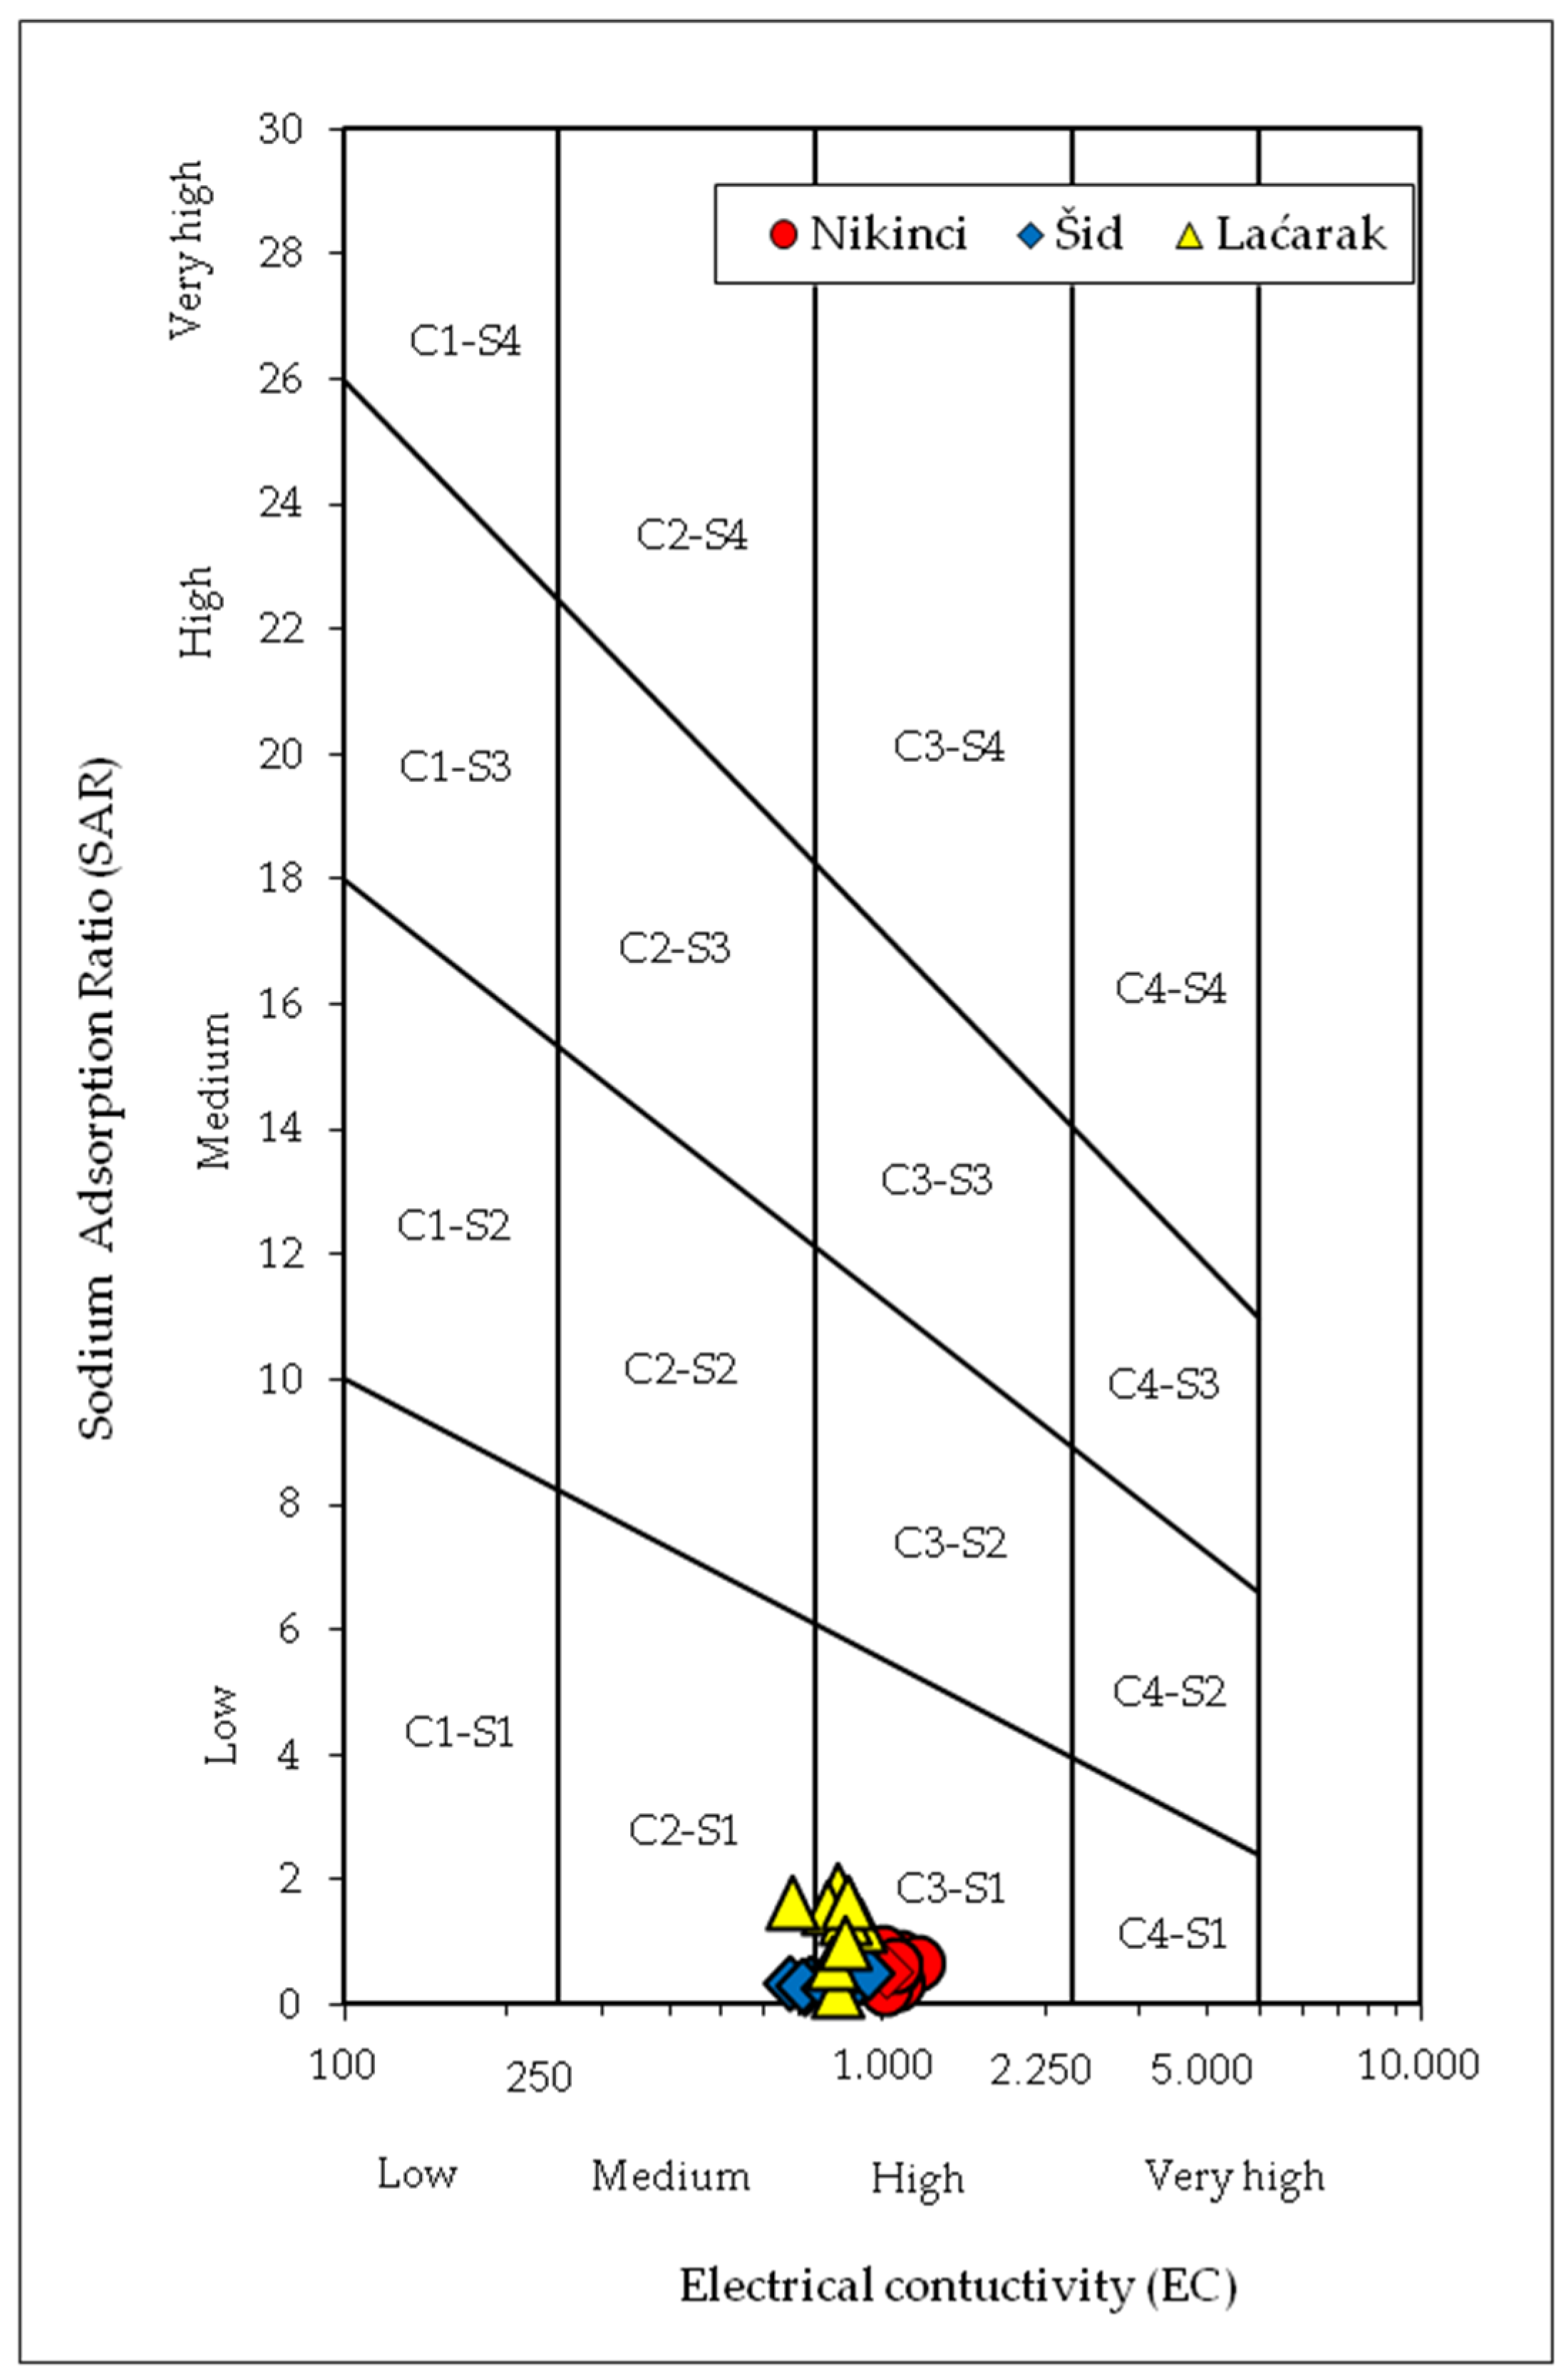
2.4. Classifications for Irrigation Water Quality
3. Results and Discussion
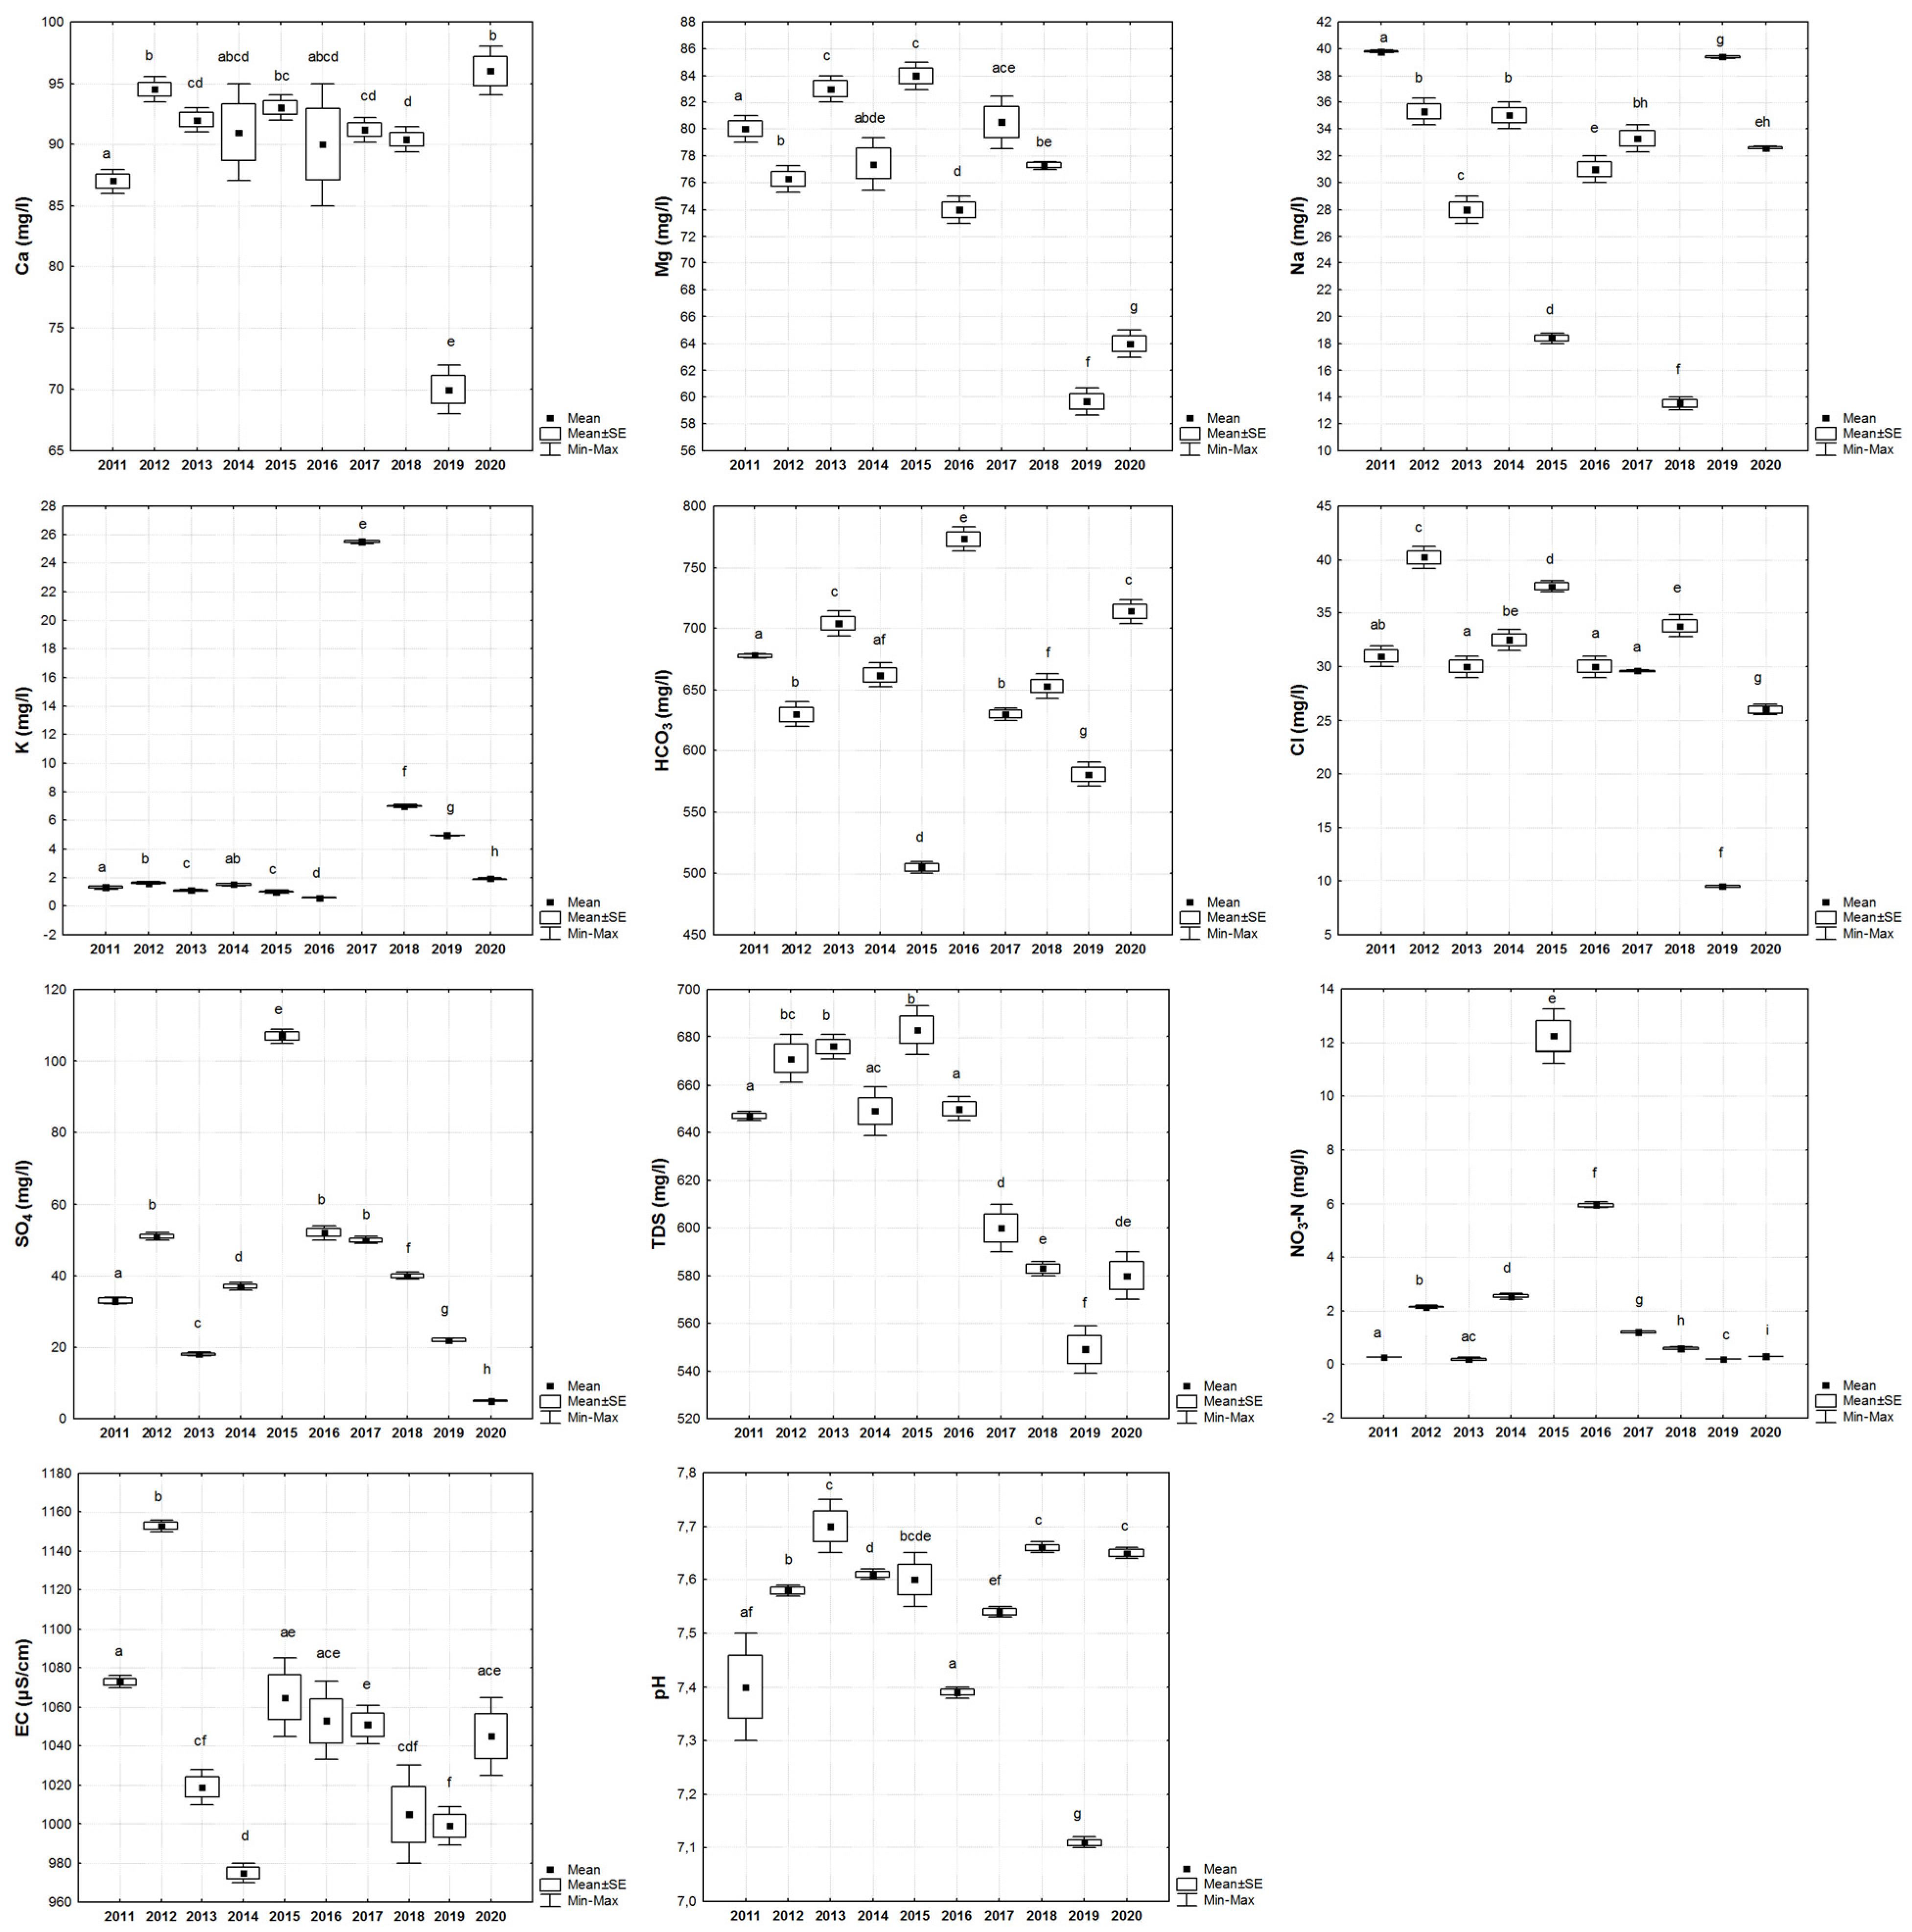
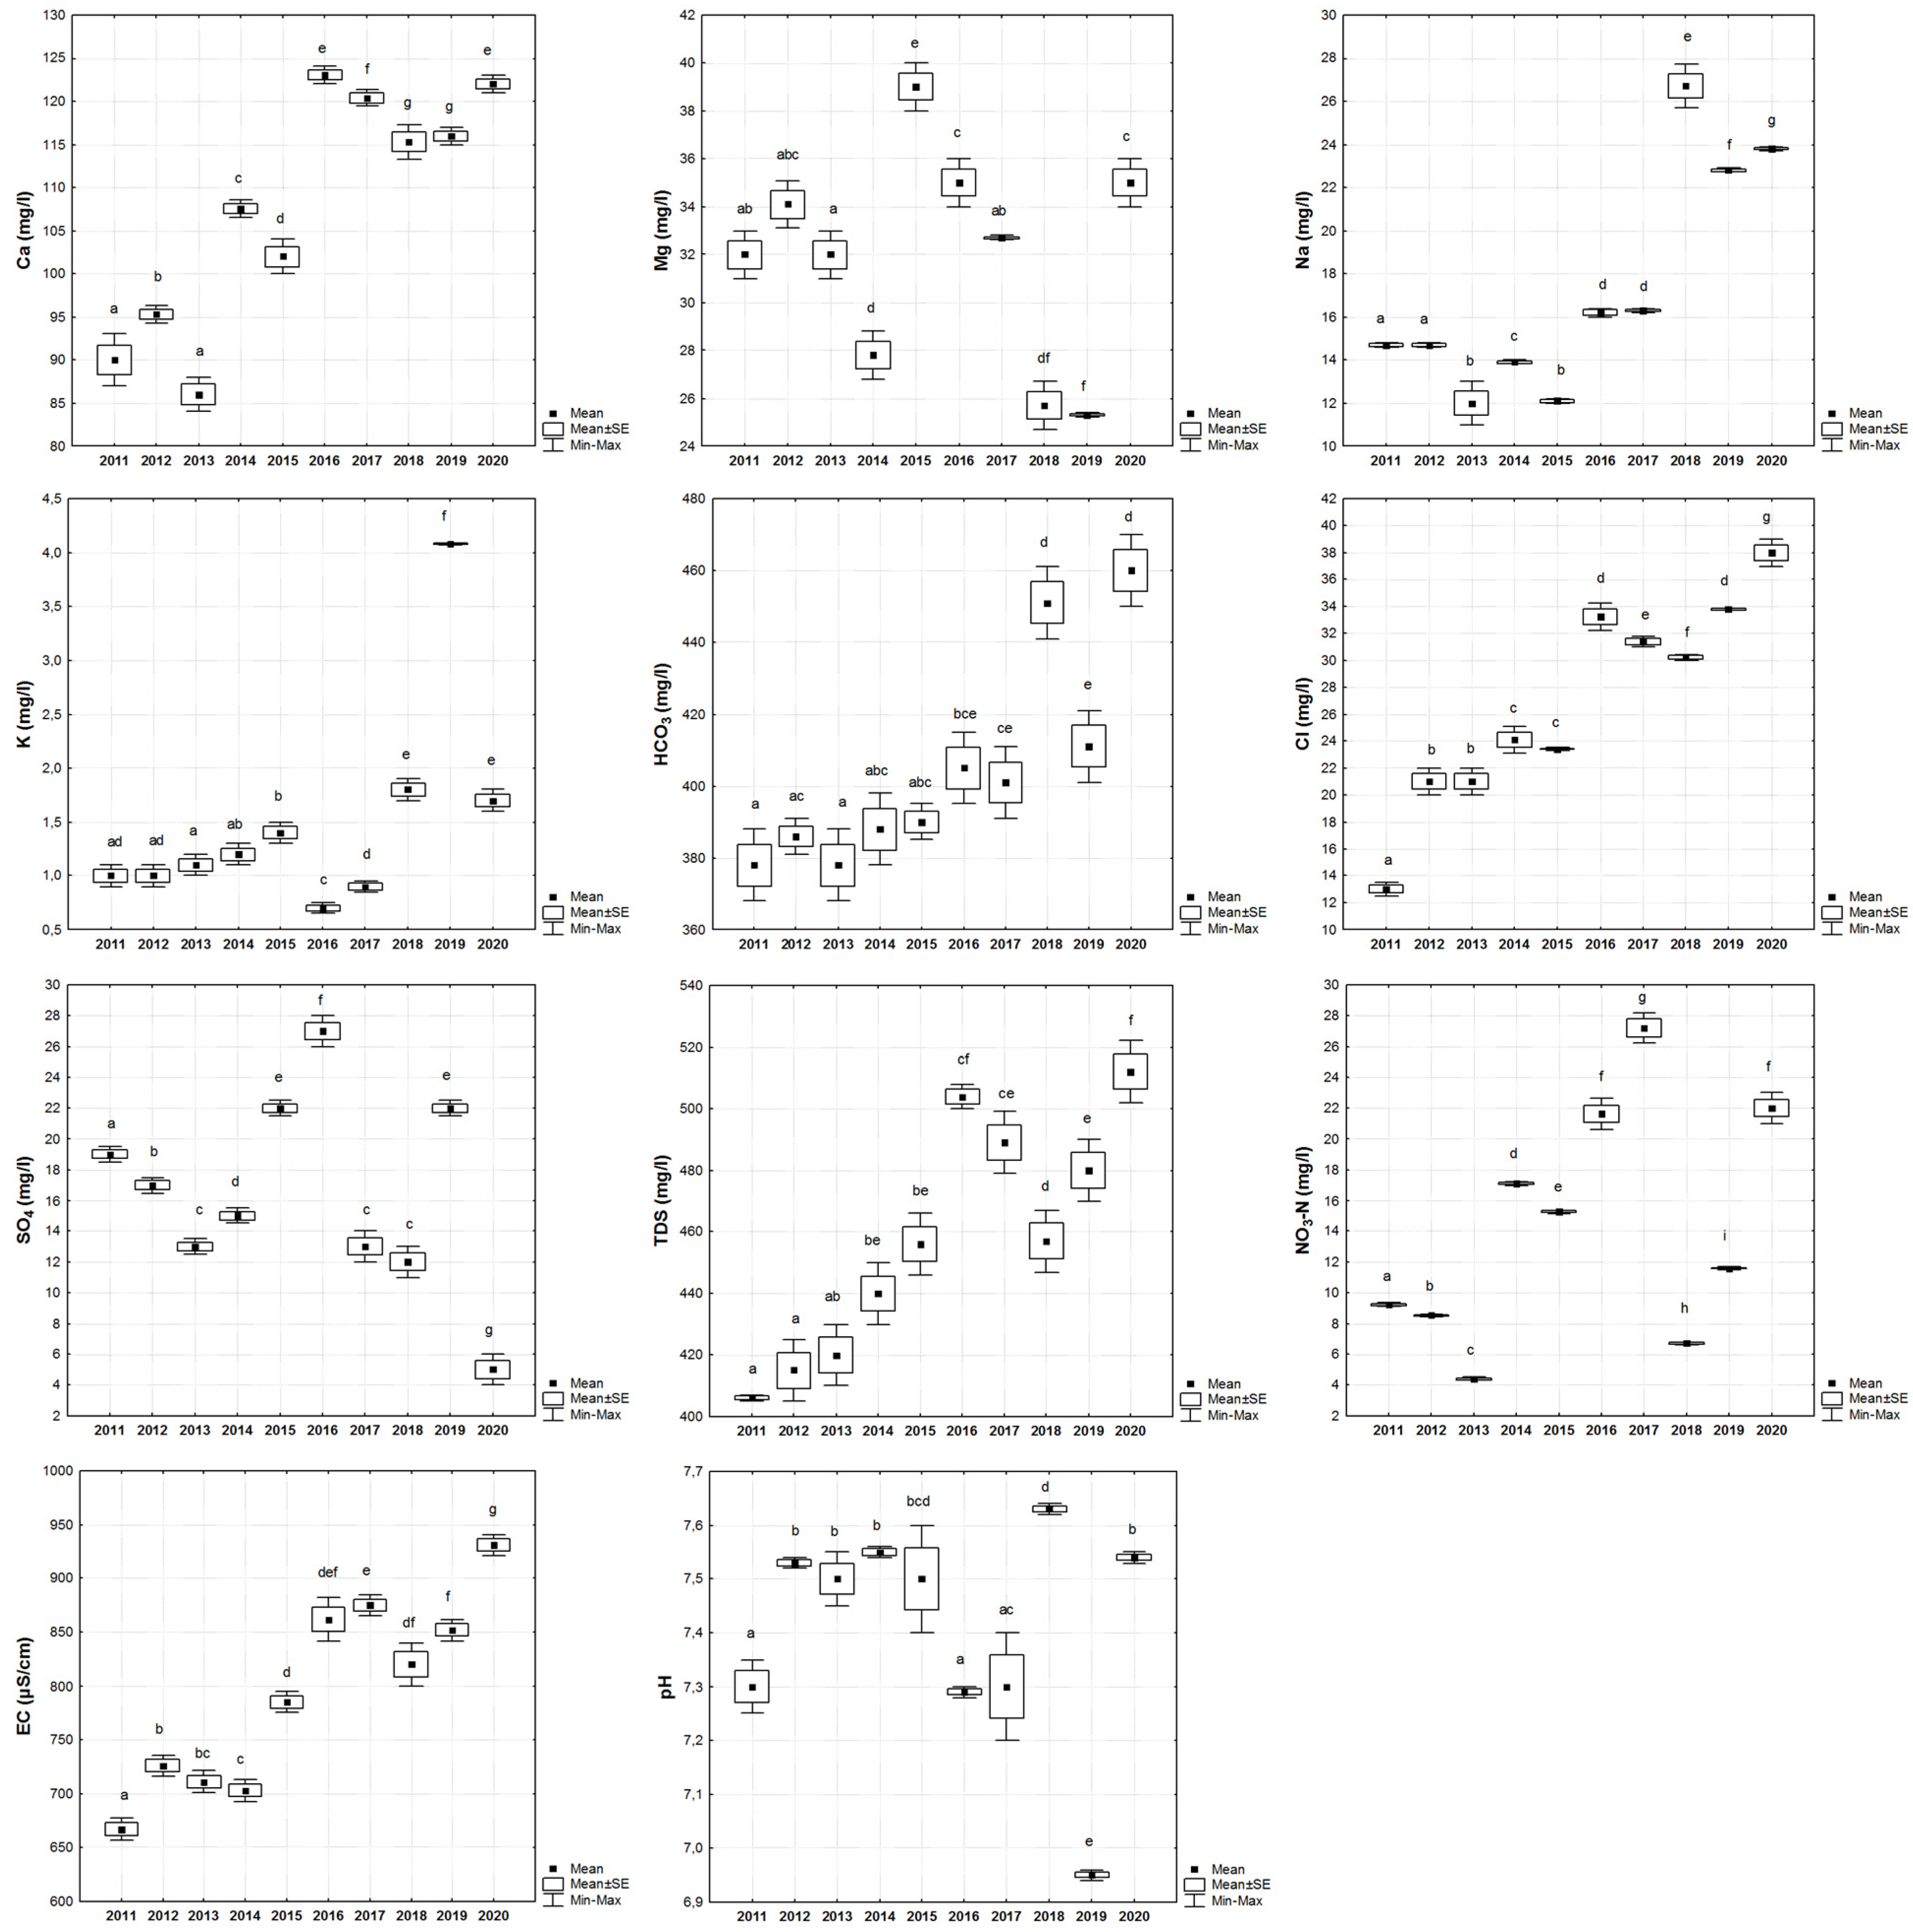
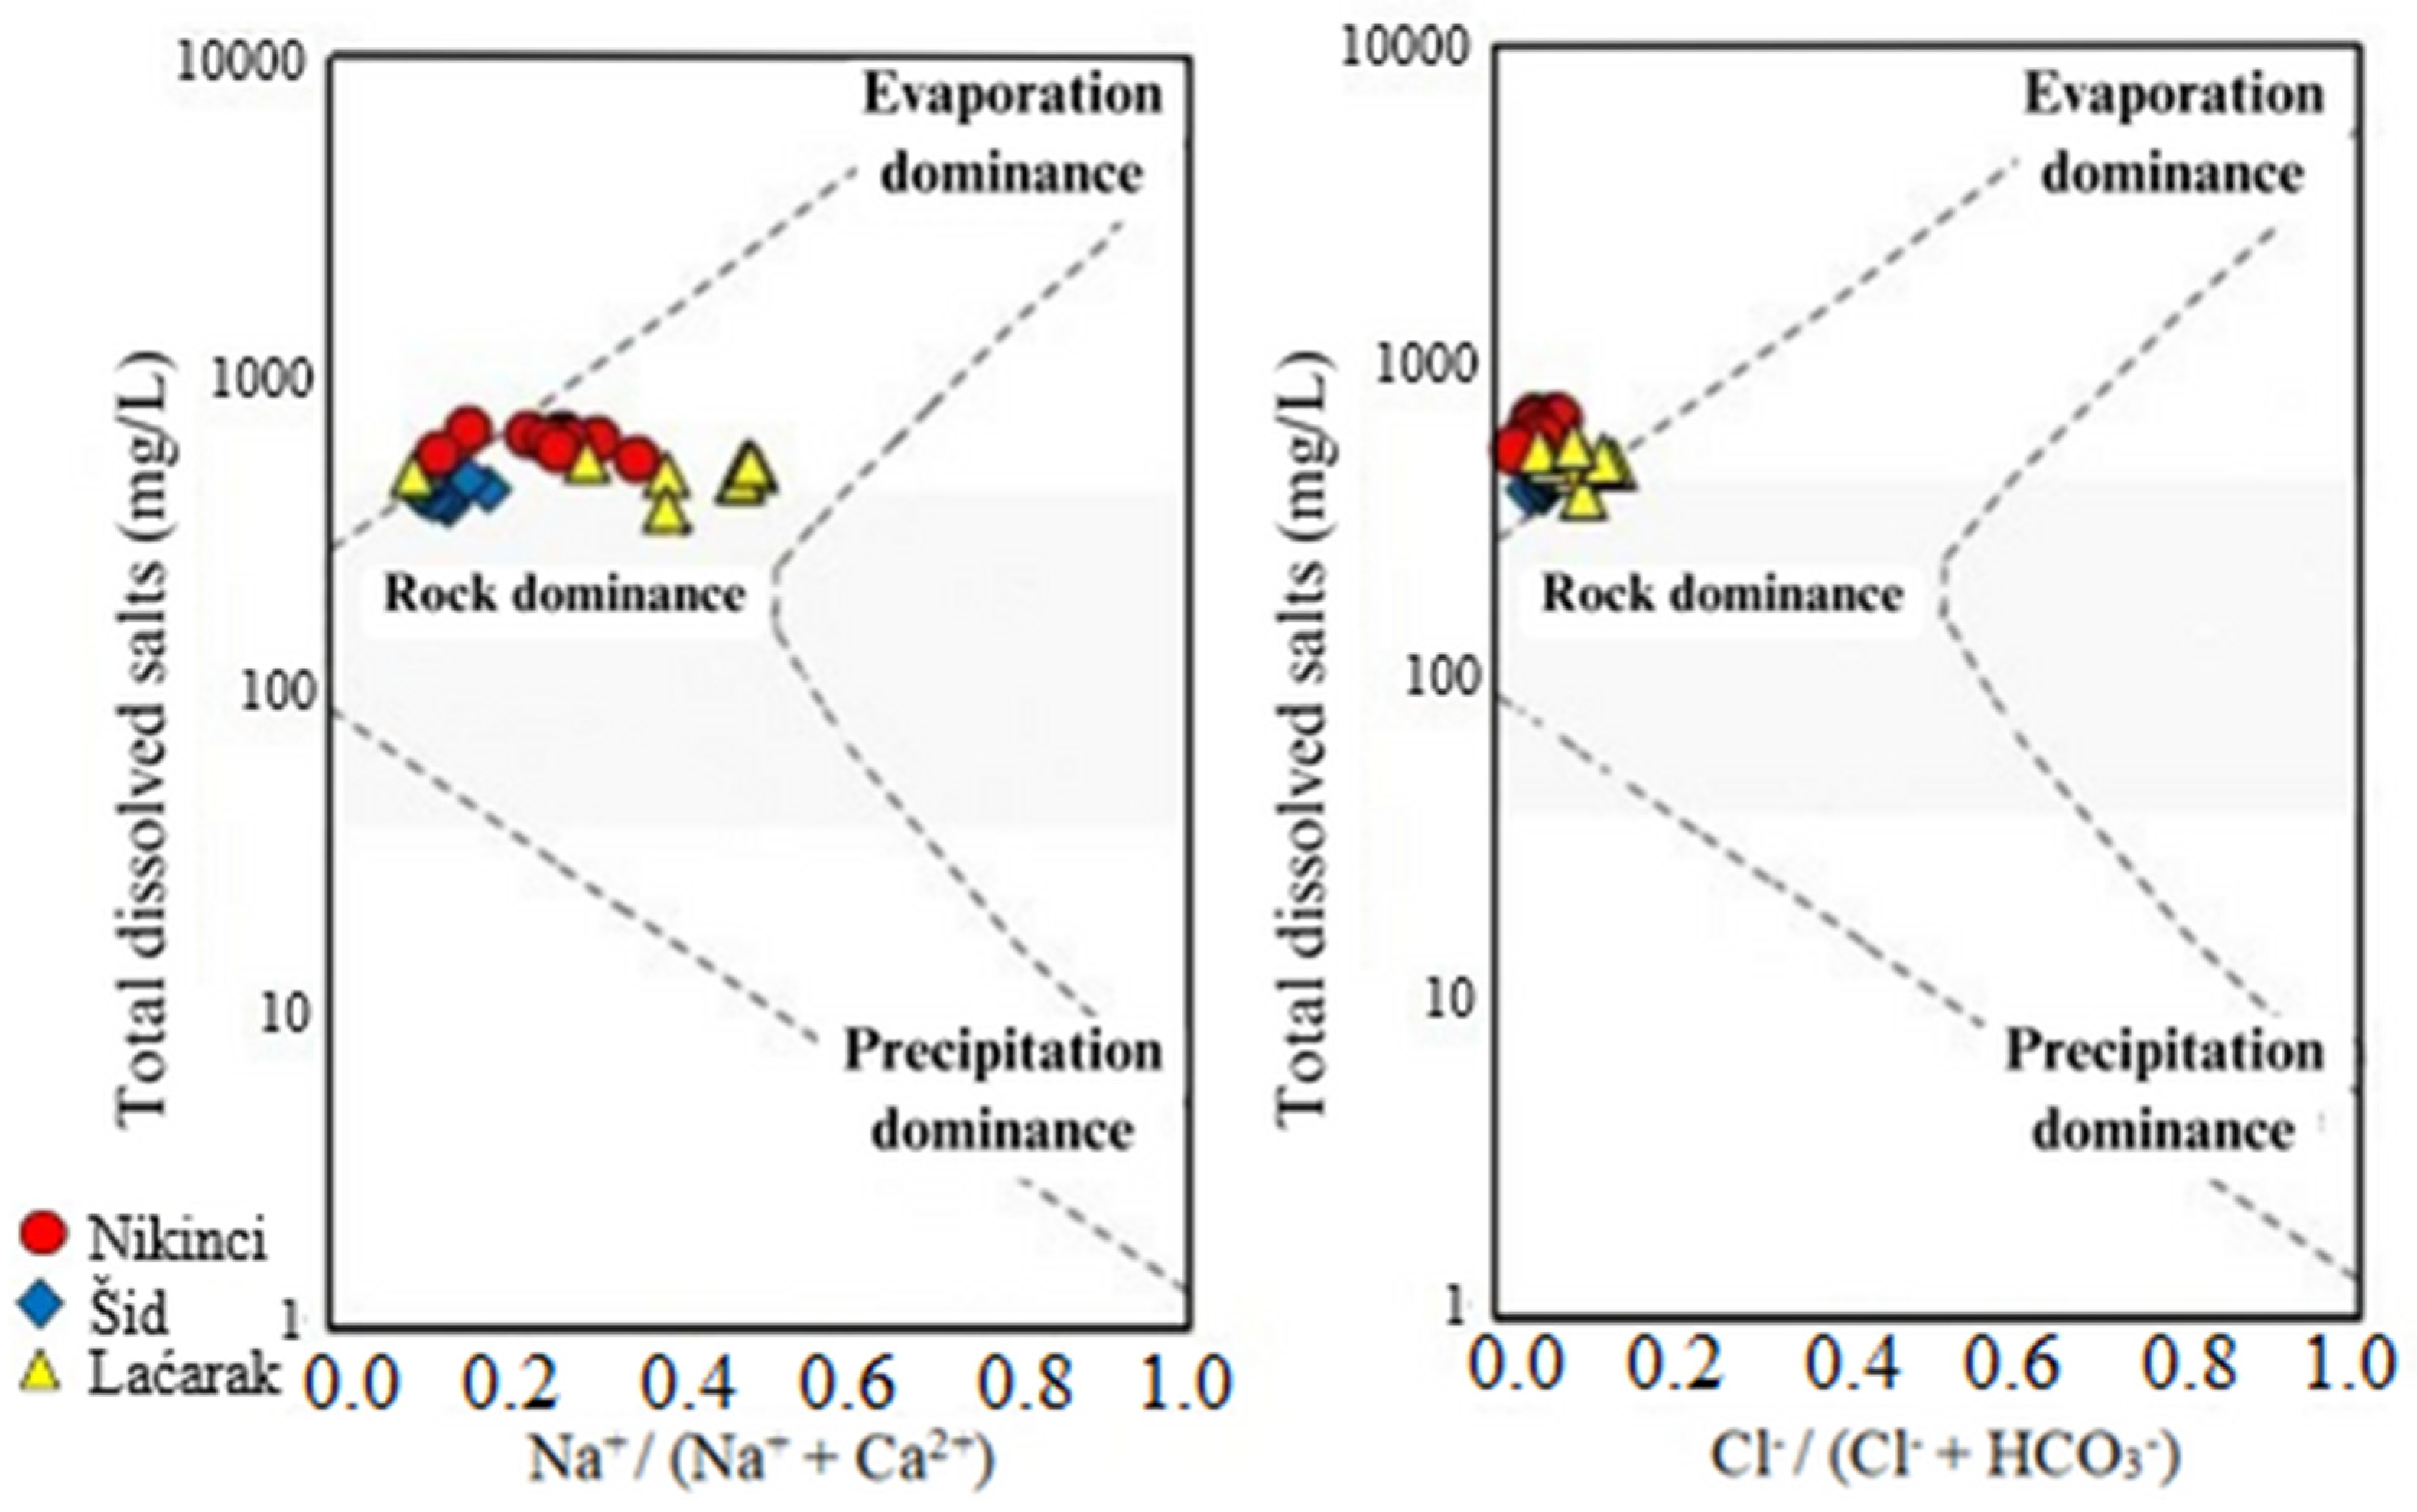
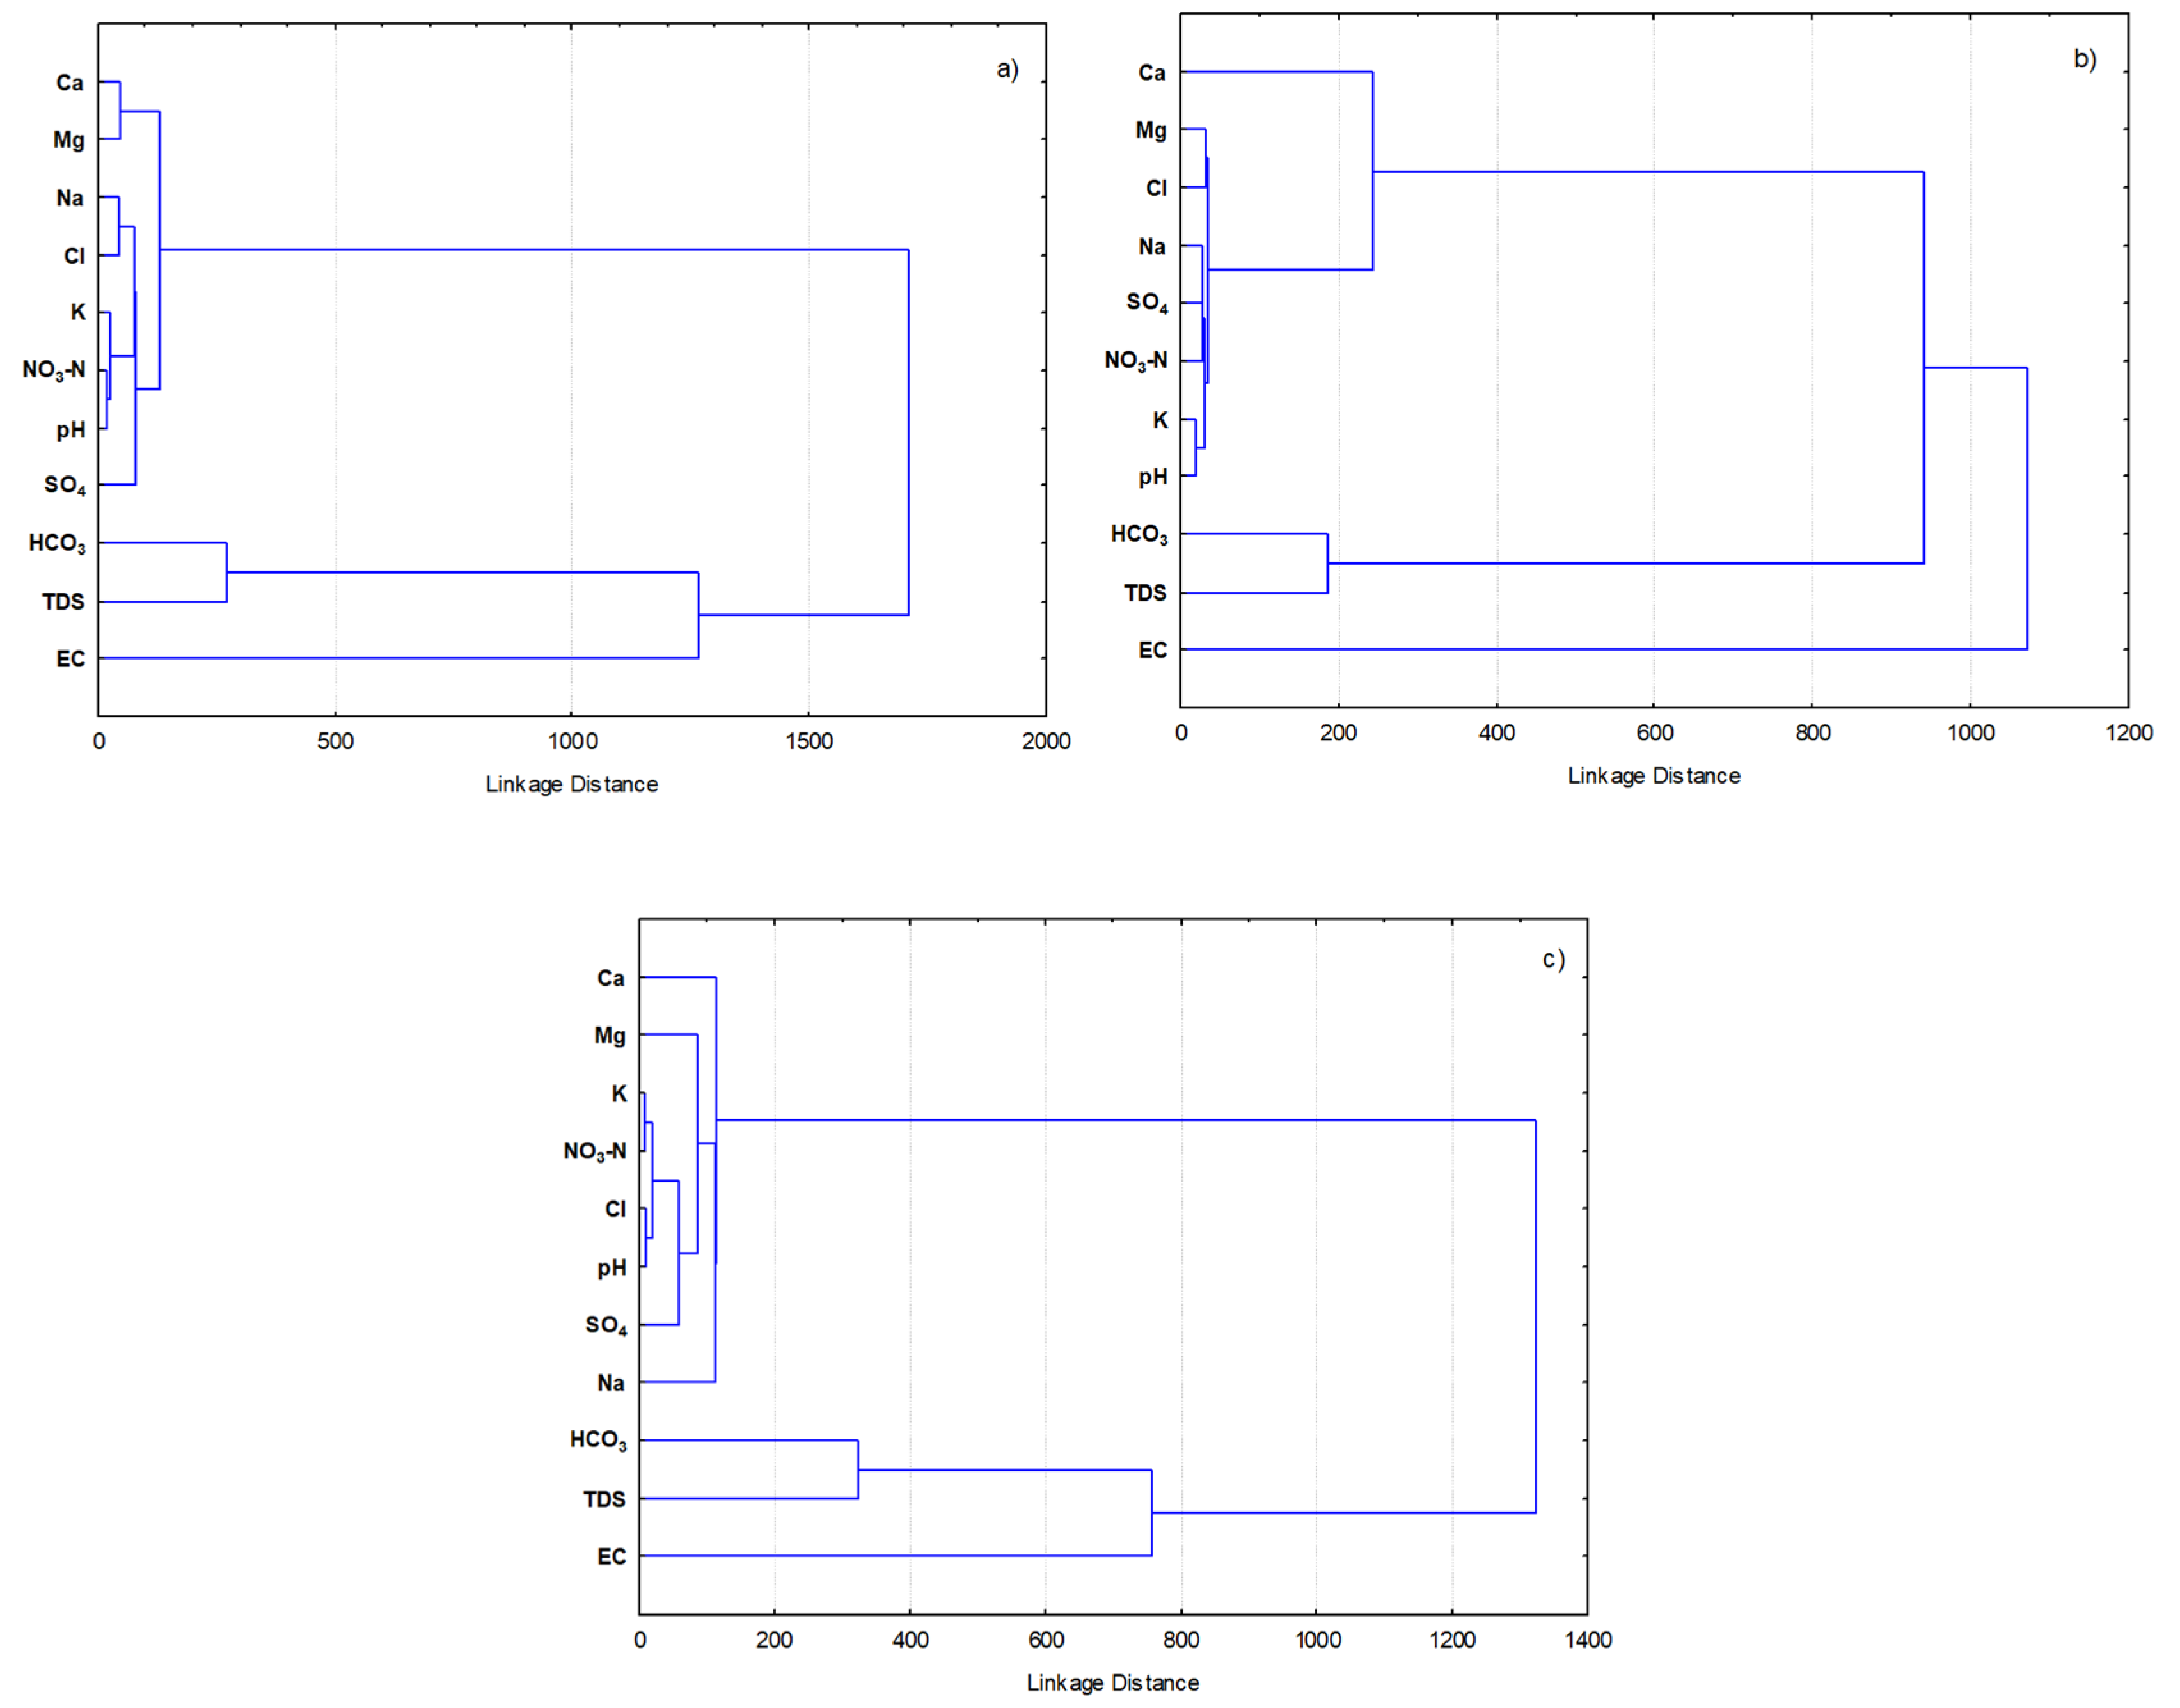
Hydrochemical Characteristics
4. Conclusions
Author Contributions
Funding
Data Availability Statement
Acknowledgments
Conflicts of Interest
Appendix A

References
- Food and Agriculture Organization of the United Nations—FAO. AQUASTAT Database. 2017. Available online: https://www.fao.org/aquastat/statistics/query/index.html (accessed on 15 May 2023).
- Eurostat. Agri-Environmental Indicators—Irrigation. 2016. Available online: https://ec.europa.eu/eurostat/web/agriculture/agri-environmental-indicators (accessed on 15 May 2023).
- Payen, S.; Basset-Mens, C.; Núñez, M.; Follain, S.; Grünberger, O.; Marlet, S.; Perret, S.; Roux, P. Salinisation impacts in life cycle assessment: A review of challenges and options towards their consistent integration. Int. J. Life Cycle Assess. 2016, 21, 577–594. [Google Scholar] [CrossRef]
- Perret, S.R.; Payen, S. Irrigation and the environmental tragedy: Pathways towards sustainability in agricultural water use. Irrig. Drain. 2020, 69, 263–271. [Google Scholar] [CrossRef]
- Grujić, G.; Vasin, J.; Belić, M. Soil salinisation in Vojvodina—The Republic of Serbia. Curr. Opin. Environ. Sustain. 2021, 50, 149–158. [Google Scholar] [CrossRef]
- Abdel-Fattah, M.K.; Abd-Elmabod, S.K.; Aldosari, A.A.; Elrys, A.S.; Mohamed, E.S. Multivariate Analysis for Assessing Irrigation Water Quality: A Case Study of the Bahr Mouise Canal, Eastern Nile Delta. Water 2020, 12, 2537. [Google Scholar] [CrossRef]
- Gu, X.; Xiao, Y.; Yin, S.; Pan, X.; Niu, Y.; Shao, J.; Cui, Y.; Zhang, Q.; Hao, Q. Natural and anthropogenic factors affecting the shallow groundwater quality in a typical irrigation area with reclaimed water, North China Plain. Environ. Monit. Assess. 2017, 189, 514. [Google Scholar] [CrossRef]
- Rawat, K.; Pradhan, S.; Tripathi, V.; Jeyakumar, L.; Singh, S.K. Statistical approach to evaluate groundwater contamination for drinking and irrigation suitability. Groundw. Sustain. Dev. 2019, 9, 100251. [Google Scholar] [CrossRef]
- Mrazovac Kurilic, S.; Cibulic, V.; Presburger Ulnikovic, V.; Staletovic, N.; Stamenkovic, L. Suitability of shallow aquifer groundwater in Vojvodina for irrigation. Water Resour. Manag. 2019, 9, 17–21. [Google Scholar]
- Nemcic-Jurec, J.; Singh, S.K.; Jazbec, A.; Gautam, S.K.; Kovac, I. Hydrochemical investigations of groundwater quality for drinking and irrigational purposes: Two case studies of Koprivnica-Križevci County (Croatia) and district Allahabad (India). Sustain. Water Resour. Manag. 2019, 5, 467–490. [Google Scholar] [CrossRef]
- Zemunac, R.; Savic, R.; Blagojevic, B.; Benka, P.; Bezdan, A.; Salvai, A. Assessment of surface and groundwater quality for irrigation purposes in the Danube-Tisa-Danube hydrosystem area (Serbia). Environ. Monit. Assess. 2021, 193, 519. [Google Scholar] [CrossRef]
- Singh, S.; Ghosh, N.C.; Gurjar, S.; Krishan, G.; Kumar, S.; Berwal, P. Index based assessment of suitability of water quality for irrigation purpose under Indian conditions. Environ. Monit. Assess. 2018, 190, 29. [Google Scholar] [CrossRef]
- Gharbi, A.; Ali, Z.I.; Zairi, M. Groundwater suitability for drinking and agriculture purposes using irrigation water quality index and multivariate analysis: Case of Sidi Bouzid aquifer, central Tunisia. Environ. Earth Sci. 2019, 78, 692. [Google Scholar] [CrossRef]
- Pivić, R.; Maksimović, J.; Dinić, Z.; Jaramaz, D.; Majstorović, H.; Vidojević, D.; Stanojković-Sebić, A. Hydrochemical Assessment of Water Used for Agricultural Soil Irrigation in the Water Area of the Three Morava Rivers in the Republic of Serbia. Agronomy 2022, 12, 1177. [Google Scholar] [CrossRef]
- Sun, Y.; Chen, X.; Luo, Y.; Cao, D.; Feng, H.; Zhang, X.; Yao, R. Agricultural Water Quality Assessment and Application in the Yellow River Delta. Agronomy 2023, 13, 1495. [Google Scholar] [CrossRef]
- Mihailović, B.; Cvijanović, D.; Milojević, I.; Filipović, M. The role of irrigation in development of agriculture in Srem district. Econ. Agric. 2014, 61, 989–1004. [Google Scholar] [CrossRef]
- Devic, G.; Djordjevic, D.; Sakan, S. Natural and anthropogenic factors affecting the groundwater quality in Serbia. Sci. Total Environ. 2014, 468–469, 933–942. [Google Scholar] [CrossRef]
- Serbian Environmental Protection Agency (SEPA). Annual Report—Results of Surface and Groundwater Quality Testing; Ministry of Environmental Protection: Belgrade, Serbia, 2011–2020. Available online: http://www.sepa.gov.rs (accessed on 15 May 2023). (In Serbian)
- Kouser, B.; Bala, A.; Verma, O.; Prashanth, M.; Khosla, A.; Pir, R.A. Hydrochemistry for the assessment of groundwater quality in the Kathua region, Jammu and Kashmir, India. Appl. Water Sci. 2022, 12, 143. [Google Scholar] [CrossRef]
- Belić, S.; Belić, A.; Maksimović, I.; Savić, R.; Vranešević, M. Usability of Irrigation Water; Belić, S., Ed.; University of Novi Sad: Novi Sad, Serbia, 2011; p. 177. (In Serbian) [Google Scholar]
- Richards, L.A. Diagnosis and improvement of saline and alkali soils. Soil Sci. 1954, 78, 154. [Google Scholar] [CrossRef]
- Ayers, R.S.; Westcot, D.W. Water Quality for Agriculture; FAO Irrigation and Drainage Paper 29; FAO: Rome, Italy, 1976. [Google Scholar]
- Piper, A.M. A geographic procedure in the geo-chemical interpretation of water analysis. Trans. Am. Geophys. Union 1944, 25, 914–928. [Google Scholar]
- Gu, X.; Xiao, Y.; Yin, S.; Hao, Q.; Liu, H.; Hao, Z.; Meng, G.; Pei, Q.; Yan, H. Hydrogeochemical Characterization and Quality Assessment of Groundwater in a Long-Term Reclaimed Water Irrigation Area, North China Plain. Water 2018, 10, 1209. [Google Scholar] [CrossRef]
- Wang, F.; Yang, H.; Zhang, Y.; Wang, S.; Liu, K.; Qi, Z.; Chai, X.; Wang, L.; Wang, W.; Banadkooki, F.B.; et al. Solute Geochemistry and Water Quality Assessment of Groundwater in an Arid Endorheic Watershed on Tibetan Plateau. Sustainability 2022, 14, 15593. [Google Scholar] [CrossRef]
- Zhang, W.; Ma, L.; Abuduwaili, J.; Ge, Y.; Issanova, G.; Saparov, G. Hydrochemical characteristics and irrigation suitability of surface water in the Syr Darya River, Kazakhstan. Environ. Monit. Assess. 2019, 191, 572. [Google Scholar] [CrossRef]
- Xu, P.; Feng, W.; Qian, H.; Zhang, Q. Hydrogeochemical characterization and irrigation quality assessment of shallow groundwater in the Central-Western Guanzhong Basin, China. Int. J. Environ. Res. Public Health 2019, 16, 1492. [Google Scholar] [CrossRef]
- Zhang, X.; Ma, Z.; Lu, H. Analysis of the hydro-chemical characteristics and origin of the karst groundwater, East Jinan city. IOP Conf. Ser. Earth Environ. Sci. 2018, 189, 032061. [Google Scholar] [CrossRef]
- Gibbs, R.J. Mechanisms controlling world water chemistry. Science 1970, 170, 1088–1090. [Google Scholar] [CrossRef]
- Vranešević, M.; Bezdan, A.; Blagojević, B.; Šekularac, G.; Savić, R.; Aksic, M. Hydrochemical assessment of irrigation water quality in Banat, Serbia. In Proceedings of the 27th Symposium on Biotechnology with International Participation, Čačak, Serbia, 25–26 March 2022. [Google Scholar]
- Ayers, R.S.; Westcot, D.W. Water Quality for Agriculture; Food and Agriculture Organization of the United Nations: Rome, Italy, 1985; p. 174. [Google Scholar]
- Gupta, S.K.; Chaudhari, S.K.; Sharma, P.C. Handbook of Saline and Alkali Soils Diagnosis Reclamation and Management; Scientific Publishers: Jodhpur, India, 2019; p. 238. [Google Scholar]
- Eaton, F.M. Significance of carbonates in irrigation waters. Soil Sci. 1950, 69, 123–134. [Google Scholar] [CrossRef]
- Bhat, M.A.; Wani, S.A.; Singh, V.P.; Sahoo, J.; Tomar, D.; Sanswal, R. An Overview of the Assessment of Groundwater Quality for Irrigation. J. Agric. Food Res. 2018, 9, 209. [Google Scholar]
- Doneen, L.D. Water Quality for Agriculture; Department of Irrigation, University of California: Los Angeles, CA, USA, 1964; p. 48. [Google Scholar]
- Kelly, W.P. Use of Saline Irrigation Water. Soil Sci. 1963, 95, 385–391. [Google Scholar] [CrossRef]
- Szabolcs, I.; Darab, C. The influence of irrigation water of high sodium carbonate content of soils. In Proceedings of 8th International Congress Soil Science Sodics Soils, Research Institute for Soil Science and Agricultural Chemistry of the Hungarian Academy of Sciences; ISSS Trans II: Tsukuba, Japan, 1964; Volume 2, pp. 802–812. [Google Scholar]
- Ragunath, H.M. Groundwater; Wiley: New Delhi, India, 1987; p. 563. [Google Scholar]
- Joshi, D.M.; Kumar, A.; Agrawal, N. Assessment of the Irrigation Water Quality of River Ganga in Haridwar District India. J. Chem. 2009, 2, 285–292. [Google Scholar]
- Rawat, K.S.; Singh, S.K.; Gautam, S.K. Assessment of groundwater quality for irrigation use: A peninsular case study. Appl. Water Sci. 2018, 8, 233. [Google Scholar] [CrossRef]
- Mateo-Sagasta, J.; Burke, J. Solaw Background Thematic Report—TR08 Agriculture and Water Quality Interactions: A Global Overview; FAO: Rome, Italy, 2010; 12p. [Google Scholar]


| Parameter | Determination Method | Level of Quantification |
|---|---|---|
| TDS (mg/L) | US EPA 160.1 | 5 |
| EC (μS/cm) | US EPA 120.1 | 5 |
| pH | SRPS H.Z1.111: 1987 | - |
| Ca2+ (mg/L) | ISO 6058 | 4 |
| Mg2+ (mg/L) | ISO 6059 | 4 |
| Na+ (mg/L) | APHA AWWA WEF 3111 B | 0.2 |
| K+ (mg/L) | APHA AWWA WEF 3111 B | 0.1 |
| HCO3− (mg/L) | SRPS EN ISO 9963-1 | 6 |
| Cl− (mg/L) | SRPS ISO 9297 | 5 |
| SO42− (mg/L) | ASTM D516-90 | 4 |
| NO3− | UP 1.98/PC 12 | 0.2 |
| Criteria | Formulas | |
|---|---|---|
| Sodium hazards | ||
| (1) | Sodium percentage (SSP) | |
| (2) | Sodium absorption ratio (SAR) | |
| (3) | Residual sodium carbonate (RSC) | |
| (4) | Permeability index (PI) | |
| (5) | Kelly’s ratio (KR) | |
| Magnesium hazards | ||
| (6) | Magnesium adsorption ratio (MAR) | |
| (7) | Total hardness |
| Class | Subclass | Conditions | Suitability of Water for Irrigation |
|---|---|---|---|
| I | Ia | TDS < 700 mg/L, (Ca+Mg):(Na+K) > 3 | Suitable water |
| Ib | TDS < 700 mg/L, (Ca+Mg):Na > 3 | ||
| II | TDS < 700 mg/L, (Ca+Mg):Na > 1 | Good water | |
| III | IIIa | TDS = 700–3000 mg/L, (Ca+Mg):Na > 3 | Waters that need to be tested |
| IIIb | TDS = 700–3000 mg/L, (Ca+Mg):Na > 1 | ||
| IV | IVa | TDS < 700 mg/L, (Ca+Mg):Na < 1 | Unsuitable water |
| IVb | TDS = 700–3000 mg/L, (Ca+Mg):Na < 1 | ||
| IVc | TDS > 3000 mg/L, (Ca+Mg):Na > 3 | ||
| IVd | TDS > 3000 mg/L |
| CS Class | S1 | S2 | S3 | S4 |
|---|---|---|---|---|
| C1 | Suitable/good water | Moderate to good | Moderate | Moderate to poor |
| C2 | Moderate to good | Moderate | Moderate to poor | Poor |
| C3 | Moderate | Moderate to poor | Poor | Very poor |
| C4 | Moderate to poor | Poor | Very poor | Unsuitable water |
| Nikinci | Šid | Laćarak | ||||||||||
|---|---|---|---|---|---|---|---|---|---|---|---|---|
| Parameter | Min | Max | Mean | SD | Min | Max | Mean | SD | Min | Max | Mean | SD |
| Ca2+ (mg/L) | 70 | 96 | 89.51 | 7.29 | 86 | 123 | 107.75 | 13.73 | 68 | 111.2 | 82.84 | 13.96 |
| Mg2+ (mg/L) | 59.7 | 84 | 75.62 | 7.92 | 25.3 | 39 | 31.86 | 4.40 | 18.4 | 80.2 | 47.61 | 16.74 |
| Na+ (mg/L) | 13.5 | 39.8 | 30.63 | 8.58 | 12 | 26.7 | 17.32 | 5.20 | 10.9 | 82 | 57.7 | 21.33 |
| K+ (mg/L) | 0.6 | 25.5 | 4.64 | 7.61 | 0.7 | 4.08 | 1.48 | 0.97 | 0.5 | 6.24 | 1.56 | 1.69 |
| HCO3− (mg/L) | 505 | 773 | 653 | 74.22 | 378 | 460 | 404.8 | 28.92 | 564 | 700 | 591.7 | 38.68 |
| Cl− (mg/L) | 9.5 | 40.2 | 30.01 | 8.29 | 13 | 38 | 26.91 | 7.63 | 6.3 | 13.3 | 9.27 | 2.29 |
| SO42− (mg/L) | 5 | 107 | 41.5 | 27.73 | 5 | 27 | 16.5 | 6.29 | 2 | 48 | 24.8 | 12.80 |
| NO3-N (mg/L) | 0.2 | 12.24 | 2.56 | 3.84 | 4.4 | 27.2 | 14.36 | 7.53 | 0.03 | 5.8 | 0.747 | 1.79 |
| EC (µS/cm) | 975 | 1153 | 1043.8 | 49.69 | 667 | 931 | 793.2 | 88.19 | 676 | 902 | 820.9 | 60.02 |
| TDS (mg/L) | 549 | 683 | 628.8 | 46.92 | 406 | 512 | 457.9 | 37.72 | 394 | 559 | 498 | 45.95 |
| pH value | 7.11 | 7.7 | 7.52 | 0.18 | 6.95 | 7.63 | 7.41 | 0.20 | 7.01 | 7.68 | 7.421 | 0.23 |
| Nikinci | Šid | Laćarak | ||||||||||
|---|---|---|---|---|---|---|---|---|---|---|---|---|
| Irrigation Water Quality Indices | Min | Max | Average | SD | Min | Max | Average | SD | Min | Max | Average | SD |
| SSP | 6.54 | 17.83 | 11.91 | 3.59 | 6.31 | 13.24 | 8.90 | 2.31 | 4.77 | 31.87 | 24.17 | 8.89 |
| SAR | 0.25 | 0.83 | 0.58 | 0.18 | 0.26 | 0.58 | 0.37 | 0.11 | 0.21 | 1.82 | 1.28 | 0.51 |
| RSC | −3.37 | 2.01 | −0.07 | 1.51 | −2.43 | −0.51 | −1.41 | 0.62 | −0.73 | 2.52 | 1.59 | 0.99 |
| PI | 29.54 | 47.11 | 38.15 | 4.79 | 33.58 | 42.79 | 37.96 | 3.01 | 33.06 | 61.00 | 53.27 | 9.56 |
| KR | 0.05 | 0.20 | 0.13 | 0.04 | 0.06 | 0.15 | 0.09 | 0.03 | 0.05 | 0.47 | 0.33 | 0.14 |
| MAR | 52.63 | 60.51 | 58.41 | 2.27 | 26.66 | 38.92 | 33.13 | 4.56 | 21.62 | 61.98 | 48.03 | 11.08 |
| TH | 252 | 355 | 320 | 33 | 111 | 168 | 138 | 18 | 82 | 338 | 203 | 70 |
| Nikinci | Šid | Laćarak | ||||
|---|---|---|---|---|---|---|
| Potential Problems | Class (%) | Class (%) | Class (%) | |||
| Salinization | II | 100 | I | 40 | I | 10 |
| II | 60 | II | 90 | |||
| Infiltration | I | 100 | I | 90 | I | 90 |
| II | 10 | II | 10 | |||
| Toxicity of Na+ | I | 100 | I | 100 | I | 100 |
| Toxicity of Cl− | I | 100 | I | 100 | I | 100 |
Disclaimer/Publisher’s Note: The statements, opinions and data contained in all publications are solely those of the individual author(s) and contributor(s) and not of MDPI and/or the editor(s). MDPI and/or the editor(s) disclaim responsibility for any injury to people or property resulting from any ideas, methods, instructions or products referred to in the content. |
© 2024 by the authors. Licensee MDPI, Basel, Switzerland. This article is an open access article distributed under the terms and conditions of the Creative Commons Attribution (CC BY) license (https://creativecommons.org/licenses/by/4.0/).
Share and Cite
Vranešević, M.; Zemunac, R.; Grabić, J.; Salvai, A. Hydrochemical Characteristics and Suitability Assessment of Groundwater Quality for Irrigation. Appl. Sci. 2024, 14, 615. https://doi.org/10.3390/app14020615
Vranešević M, Zemunac R, Grabić J, Salvai A. Hydrochemical Characteristics and Suitability Assessment of Groundwater Quality for Irrigation. Applied Sciences. 2024; 14(2):615. https://doi.org/10.3390/app14020615
Chicago/Turabian StyleVranešević, Milica, Radoš Zemunac, Jasna Grabić, and Andrea Salvai. 2024. "Hydrochemical Characteristics and Suitability Assessment of Groundwater Quality for Irrigation" Applied Sciences 14, no. 2: 615. https://doi.org/10.3390/app14020615