Article

Fire Tests of Load-Bearing, Light-Steel-Framed Wall Systems Insulated with Polyurethane Foam

by
Marija Jelčić Rukavina
1,*,
Davor Skejić
2,
Bojan Milovanović
1 and
Tomislav Ščapec
3
1
Department of Materials, Faculty of Civil Engineering, University of Zagreb, Fra Andrije Kačića Miošića 26, 10 000 Zagreb, Croatia
2
Department for Structures, Faculty of Civil Engineering, University of Zagreb, Fra Andrije Kačića Miošića 26, 10 000 Zagreb, Croatia
3
Laboratory for Thermal Measurements, Stubička Slatina 26, 49 243 Oroslavje, Croatia
*
Author to whom correspondence should be addressed.
Appl. Sci. 2024, 14(2), 637; https://doi.org/10.3390/app14020637
Submission received: 26 November 2023 / Revised: 4 January 2024 / Accepted: 9 January 2024 / Published: 11 January 2024
(This article belongs to the Section Civil Engineering)

Abstract

:
This paper presents the details of three fire tests conducted on light-steel-framed (LSF), load-bearing wall systems, which consist of polyurethane insulation injected into the cavities of the steel frame between two or three layers of gypsum fibreboard. To investigate the thermal and structural performance limits under standard fire conditions, observations were made during the tests, and temperatures and vertical displacements were recorded. Although combustible insulation was used, the results obtained are promising for the application of studied LSF wall systems in buildings, where fire resistance of more than 60 min is required.

1. Introduction

Light-steel framing (LSF) is a drywall system that offers high architectural flexibility, lower construction and transportation costs, reduced weights, the possibility of recycling and reuse, and at the same time high mechanical strength and stability [1,2]. LSF systems are manufactured as both load-bearing and non-load-bearing construction elements and are available in a wide range of compositions. The disadvantages of these systems are the lack of adaptability in situations where on-site adaptation is required, the low thermal mass, the higher maintenance costs, the limited number of storeys, the risk of corrosion of the metal elements due to condensation and possible air and water infiltration, the high thermal conductivity of the steel parts and fire behaviour [3]. The system consists of three main components: cold-formed steel structure (studs and tracks), sheathing boards (wallboards) and thermal insulation, each of which has its own function as an integral part of the system [1]. Other materials are necessary, such as screws, membranes for waterproofing and air tightness, and finishing layers. The cold-formed steel structure forms the skeleton of the system and provides stability and rigidity, which is protected by the sheathing. The thermal insulation serves to prevent heat loss and provide the necessary thermal comfort. The fire resistance of LSF wall systems is an important factor in preventing the spread of fire and eventually the collapse of the building in case of fire occurrence. Although it can be determined by fire testing or modelling, in most cases, it is determined by fire tests in which a specimen is subjected to a standardized fire load, usually represented by the ISO standard curve [4]. According to the test results, the specimen is assigned a fire resistance rating (FRR) based on the failure time evaluated according to the three criteria of structural stability, insulation and integrity [5,6]. Structural failure of load-bearing LSF systems under fire conditions is primarily due to the reduction in the mechanical properties of the steel frame, where at a temperature of 550 °C, only about 60% of the original yield strength of the steel is maintained [7]. The FRR of LSF wall systems is affected by many factors, such as configuration (number and type of applied wallboards, type and position of insulation material), geometry (stud spacing) and load ratio [8,9]. Of the factors mentioned, the type of wallboards and the type and position of insulation play a decisive role [10]. The wallboards protect the steel frame from direct fire exposure and delay temperature development [5]. Elevated thermal properties of various wallboards that can be used in LSF structures have been studied as an indication of their behaviour under fire exposure. As an example, Steau and Mahendran [11] studied gypsum boards (GBs), calcium silicate boards (CaSiBs), magnesium oxide boards (MgOBs), perlite boards (PBs), and structural plywood (PW), while Gnanachelvam et al. [12] investigated GBs, PCM-gypsum boards (PCMBs), magnesium sulphate boards (MgSO4Bs) and fibre cement boards (FBs). The results revealed that GBs exhibited the least mass loss when exposed to elevated fire temperatures, which has the potential to maintain a higher FRR of LSF structures than those with other type of wallboards. Furthermore, the addition of fibres in GBs could potentially lead to better FRR by preventing cracking during fire exposure [13]. Other benefits of GBs are ease of fabrication and the widespread availability of the primary material for its production [14]. Kodur and Sultan [9] determined that a layer of 15.9 mm thick GB on an uninsulated load-bearing wall gives an FRR of 35 min, while two layers of 12.5 mm thick GB give an FRR of 100 min. This means that the FRR of LSF constructions can be significantly increased by adding multiple layers of wallboards rather than just increasing the thickness of the wallboard, due to the staggered positions of the wallboard joints of the two applied layers which are often the weak point on wallboards. When the first joint on the exposed layer opens, underneath is usually a continuous layer which offers protection for a certain period of time. Due to the current trend in the construction industry to improve the energy efficiency of new and existing buildings, the use of thermal insulation in LSF structures is mandatory. Depending on the location of the insulation, LSF structures are defined as: (a) cold-framed structures, where the insulation is located in the cavity, (b) warm-framed structures, where the insulation is located entirely on the exterior and (c) hybrid structures, which are a combination of cold- and warm-framed structures [1,15]. Thermal insulation positioned in the cavity of load-bearing LSF structures tends to lower FRR, as shown in the studies of Kodur and Sultan [9], Ariyanayagam and Mahendran [16,17] and Alfawakhiri and Sultan [18]. Due to the low thermal conductivity of the insulation, a thermal barrier is formed, which leads to non-uniform heating of the LSF members [19]. This creates a high temperature gradient between the exposed and unexposed sides of the LSF structure. Since one side of the steel structure is heated much more than the other, structural failure of the load-bearing structure occurs. Studies on this topic have shown that externally insulated load-bearing LSF assemblies have better fire performance [8,20], but the disadvantage of such structures is the more complicated assembly process and the greater thickness of the element which makes the net floor area of such buildings smaller. A literature review revealed that most studies focused on the FRR of LSF constructions insulated with non-combustible (glasswool, rockwool and cellulose fibres in most cases [1,15]) thermal insulation, because organic polymeric insulation materials tend to increase fire intensity. However, the use of these materials is problematic where there is a risk of condensation and increased exposure to moisture. If water penetrates the system, these materials absorb the moisture, which increases the thermal conductivity of the material, reduces its insulating properties and potentially increases the risk of corrosion of metal elements in LSF systems. With respect to organic combustible thermal insulation, Gnanachelvam et al. [21] investigated LSF walls with PCM-mat in the cavity and concluded that such materials lined with fire-rated wallboards do not contribute to the fire load. LSF system with other combustible insulation materials, especially polymers, are scarcely studied for their FRR although because the low thermal resistance value they could provide good thermal properties at ambient temperatures. In recent decades, rigid polyurethane foam (PUR) in particular has been used together with other materials to obtain composites with low weight, good heat resistance, high toughness and ductility, high impact resistance, efficient sound insulation and excellent mechanical properties [22]. On the other hand, when used in high temperature environments, PUR foams are very combustible polymers with rapidly spreading flames, high thermal emissions and smoke generation [23,24,25]. When PUR foam is exposed to elevated heat, the chemical bonds generally break down, producing volatile gases that ignite when combined with oxygen. During this process, the PUR first softens and then decomposes, which manifests itself as charring. Due to the increased heat during combustion, the chemical links are further broken down and ignite until only char remains. The ignition and decomposition of PUR foam has been intensively studied and well described in the relevant literature [23,24,25,26]. Depending on the test method used, the heating rate of the sample, the air flow and the weight loss, the ignition and decomposition temperatures for polyurethane foams are between 260 °C and 500 °C and between 400 and 650 °C, respectively [24]. The combustion of PUR produces large quantities of smoke that obstruct visibility, with carbon monoxide and hydrogen cyanide being the most important toxic combustion products. The addition of flame retardants causes PUR to form a small protective layer of charcoal on the material [27,28], which can have a positive effect on fire behaviour for a certain period of time. Flame retardants have an influence on the smoke and toxicity development of PUR. There are some contradictions in the literature regarding the effect of flame retardants on the overall toxicity of PUR foams [25]. A literature search revealed only one study that addressed the fire performance of assemblies with PUR foam and gypsum fibreboards in the form of structurally insulated panels (SIPs) [29], which showed that that such assemblies can only withstand 30 min of fire exposure. In the scientific project “Composite Light Steel Framed Panel with an Integrated Load-bearing Structure”, led by the University of Zagreb, Faculty of Civil Engineering, and industry partners, an innovative load-bearing LSF system has been developed to improve construction speed and energy efficiency. In addition to lightweight steel members, the LSF system consists of gypsum fibreboards (GFBs) as sheathing and PUR foam as thermal cavity insulation. Furthermore, spacers are added to physically separate the wallboards from the steel members and, consequently, reduce the thermal bridging effect. The idea behind the development of such an LSF system with the chosen components is described in our previous paper [30]. In the current paper, the details of the experimental study on the fire resistance of the aforementioned LSF wall systems exposed to the standard ISO 834 are presented. For this purpose, three test specimens were made from the same components differing only in the number (double and triple) and type of gypsum fibreboards (regular—A2 board, and with improved fire properties—A1 board).

2. Experimental Study

2.1. Test Specimen Components and Construction

The experimental study was conducted on three load-bearing LSF wall panel specimens consisting of a steel frame, PUR foam as cavity thermal insulation and GFBs as sheathing wallboards. The dimensions of the specimens were 1.5 m wide and 3.0 m high. The members of the steel frame steel (studs, tracks and noggings), consisted of 0.95 mm thick C-sections with dimensions of 89 × 42 × 10 mm. The C-sections were made of S550 GD steel sheets. A total of four studs (labelled S1, S2, S3 and S4) with a length of 2995 mm, two tracks (labelled T1 and T2), and two noggings (labelled N1 and N2) with a length of 1500 mm were used to construct the steel frame, as shown in Figure 1b.
The studs were located at 486 mm from the centre axis off-centre, while the noggings were located 984 mm off-centre from the top and bottom tracks. A total of 16 nodes (numbered 1–16 in Figure 1a) were formed. The members of the steel frame were fixed with self-tapping flat-head screws with dimensions 6 × 19 mm and a diameter of 3.5 mm. To ensure the physical distance between the inner sheathing wallboards and the steel frame, 6 steel Z shaped spacers (Figure 1b) were placed on both sides of the specimen at certain positions along the length of studs S2 and S3 and noggings N1 and N2. The spacers were made of the same type of steel as all other steel members.
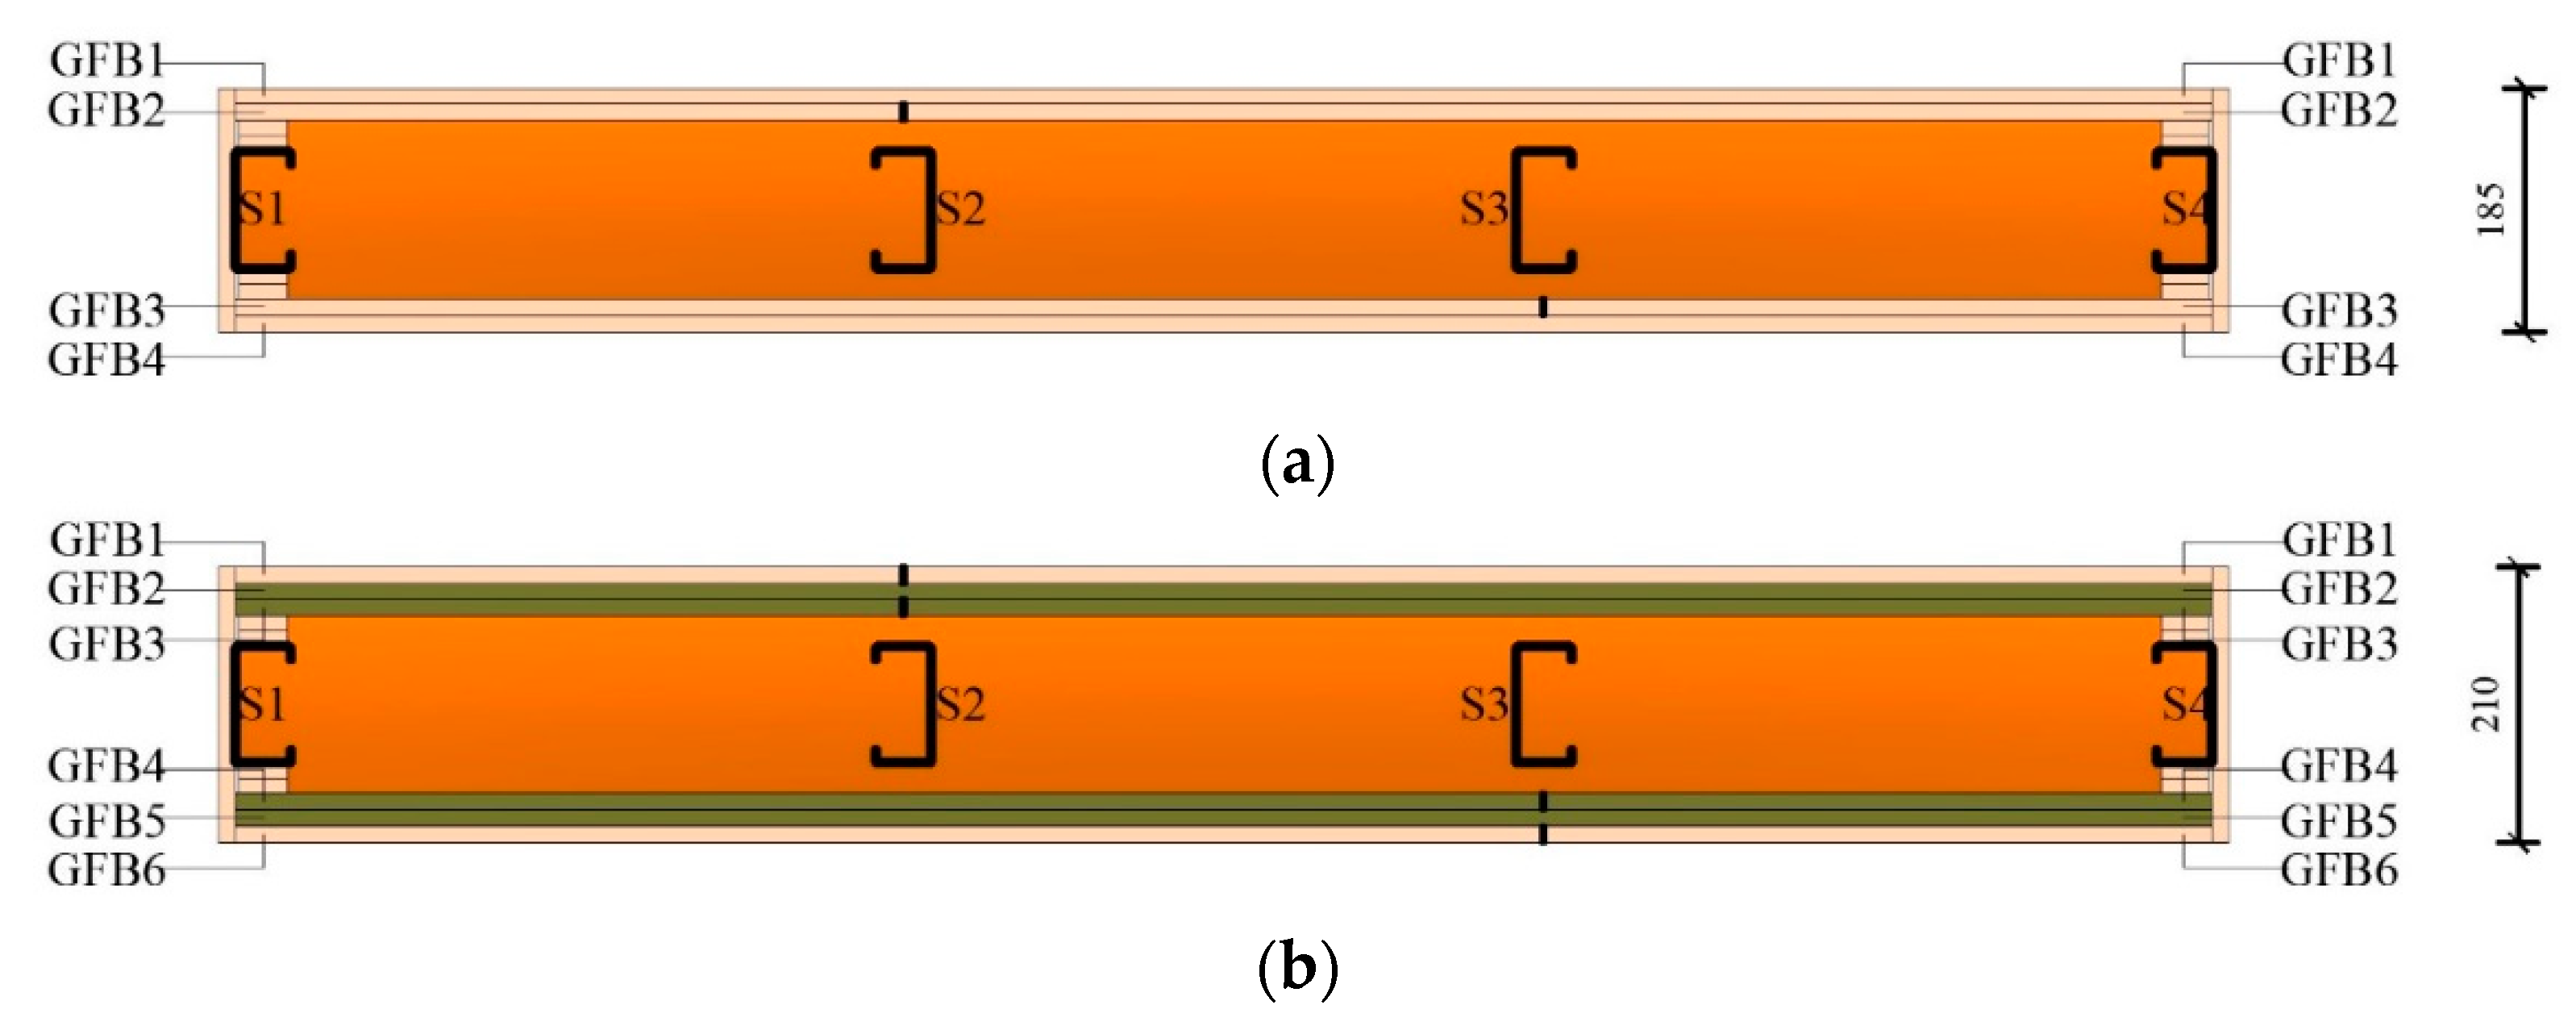
The steel frame was lined on both sides with two or three layers of GFBs, respectively. Two types of 12.5 mm GFBs were used from the same manufacturer (James Hardie Europe GmbH, Düsseldorf, Germany), GFB with density 1150 ± 50 kg/m3 and reaction to fire A2, s1-d0 [31], A2 GFB onwards, and GFB with improved fire properties (density 1250 ± 50 and reaction to fire A1 [32]), A1 GFB onwards. Two of the specimens (designated as Specimen P1 and Specimen P2, Figure 2a) were of the same composition, double-lined on both sides with A1 GFB, while one specimen (designated as Specimen 3, Figure 2b) was triple-lined with an outer layer of A1 GFB and two inner layers of A2 GFB. A2 GFBs are shown in green, while the A1 GFBs are shown in light orange.
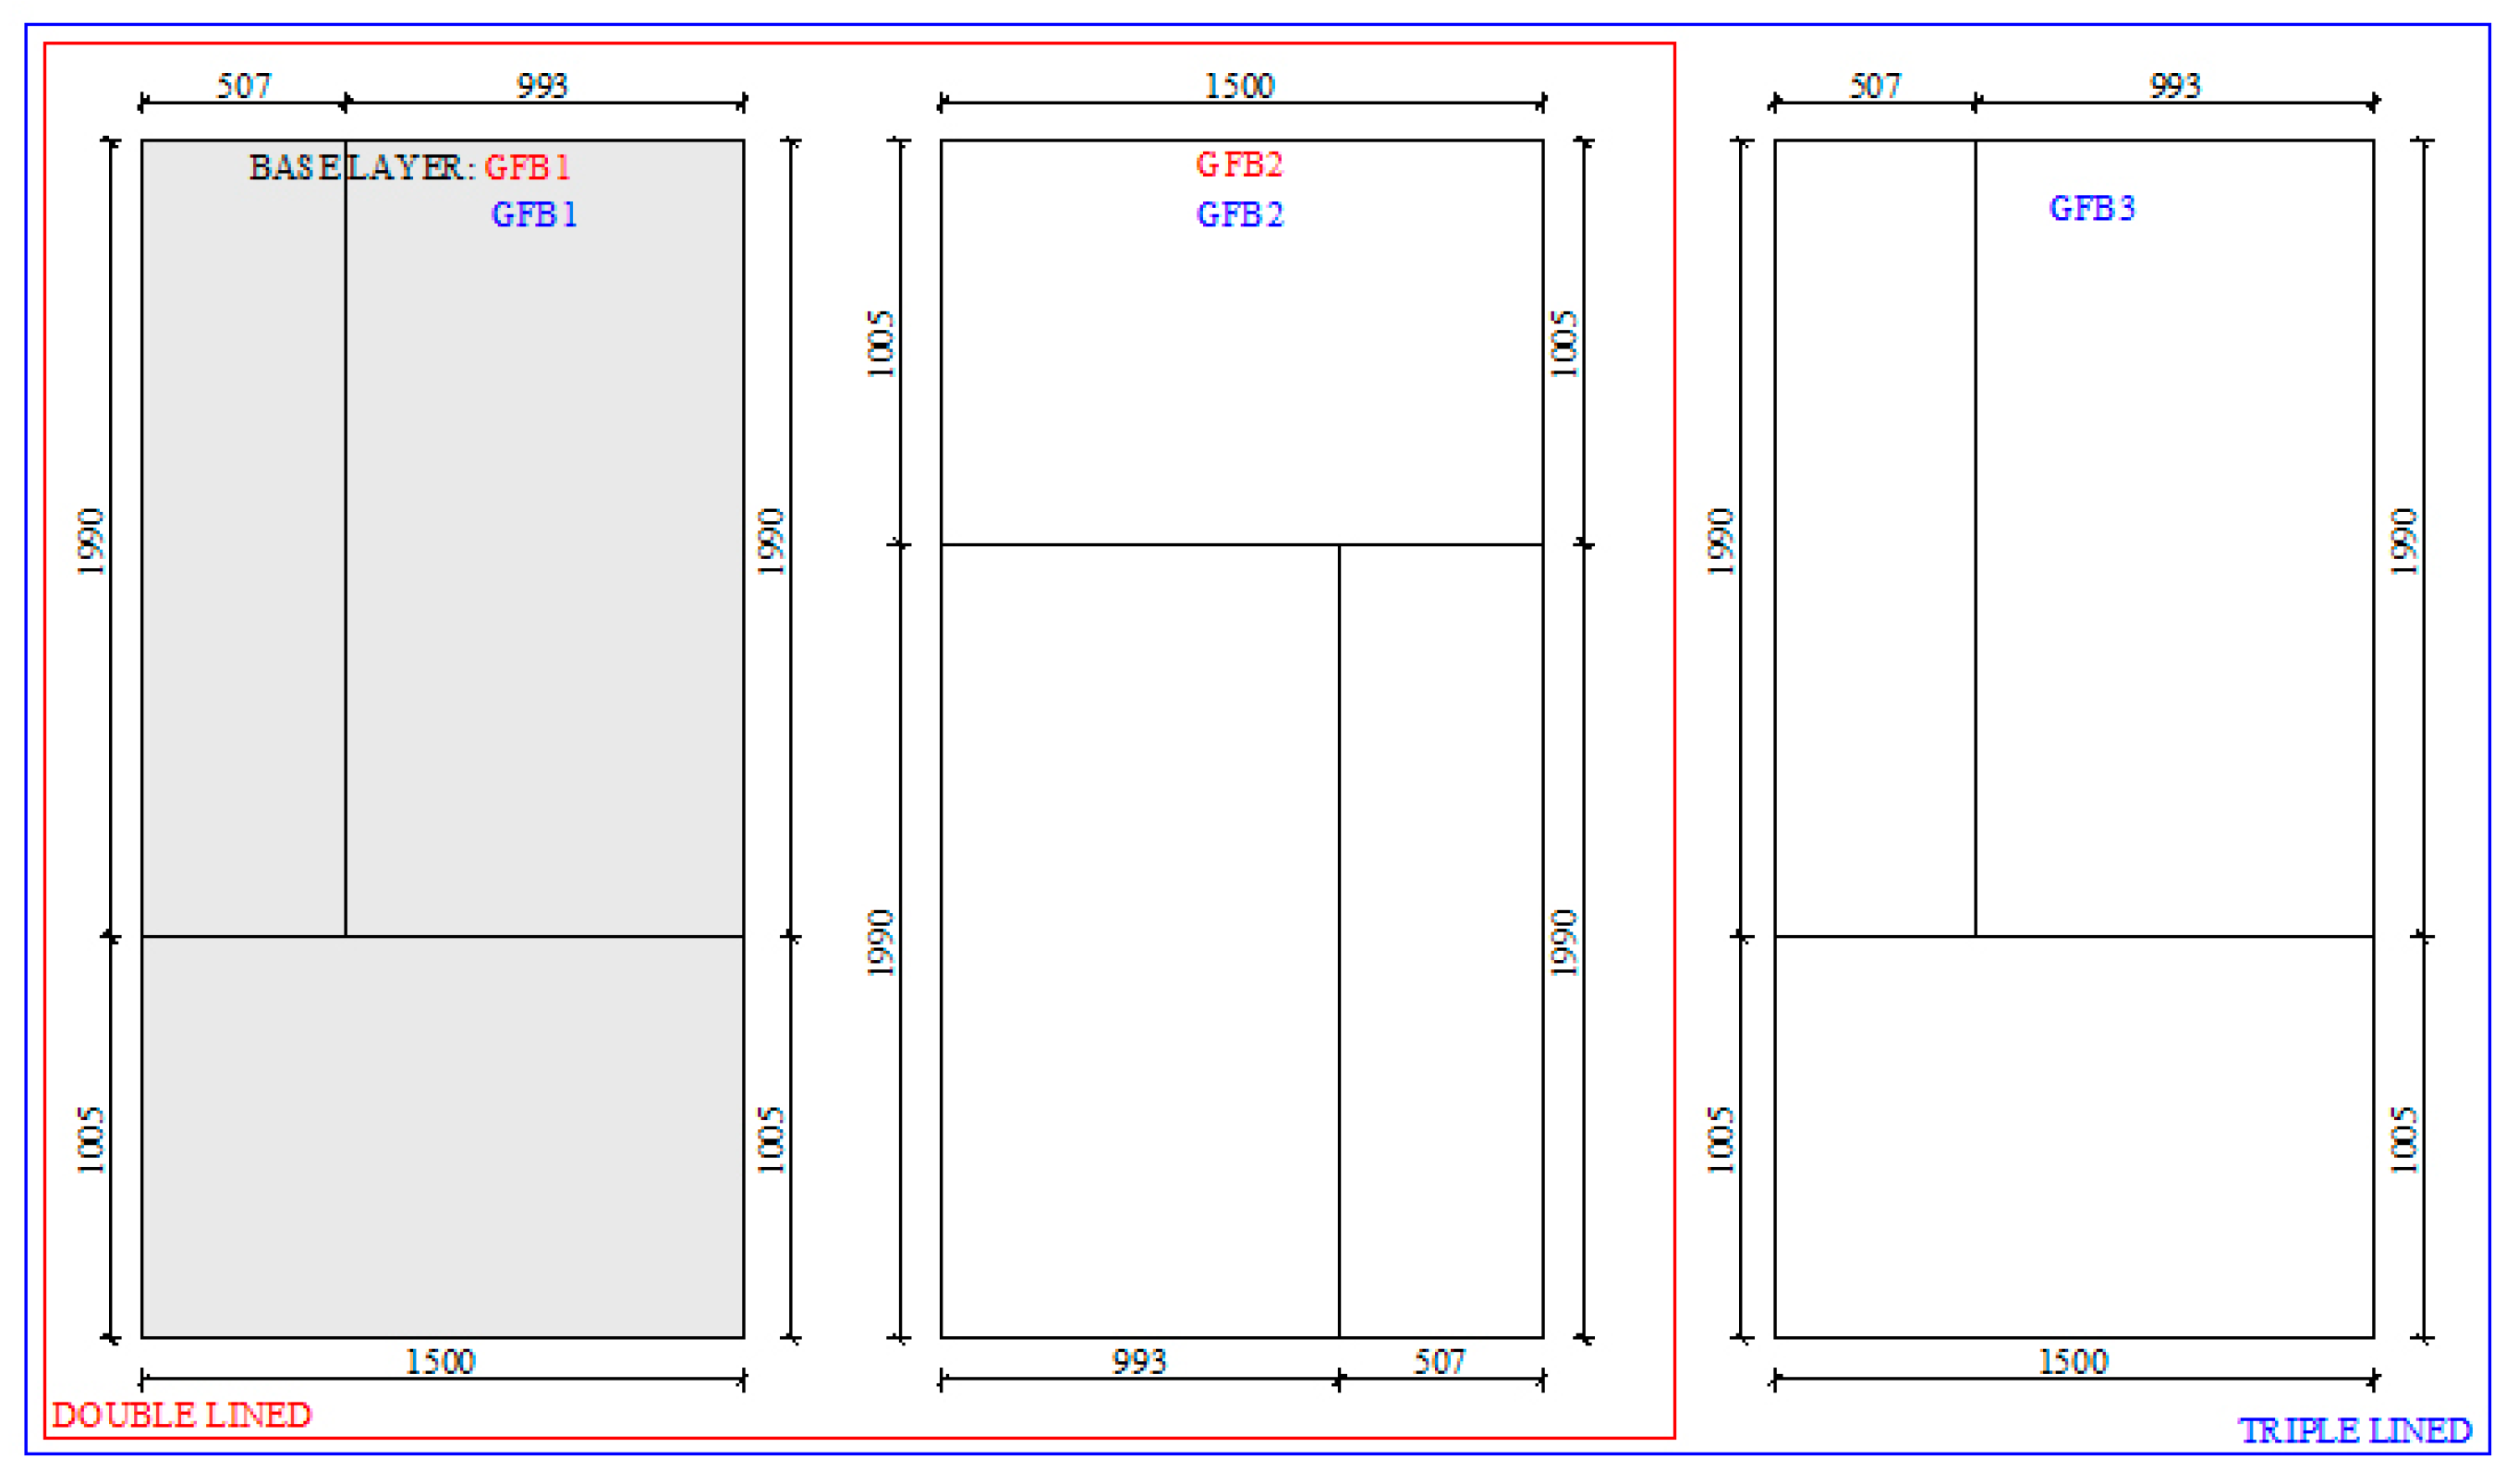
Three differently cut pieces with approximate dimensions of 500 × 1990 mm, 1000 × 1990 mm and 1005 × 1500 mm were used for each layer of the sheathing, as shown in Figure 3.
The layout of the ambient side wallboard is a mirror image of the fire-side wallboards. The joints of the base layer boards (GFB2, GFB3 for double-lined specimens and GFB3 and GFB4 for triple-lined specimens) were secured with mesh and paper tape and filled with the fireproof joint filler. In addition, joints, screw holes and the wallboard strips on S1, S4, N1 and N2 were coated with a thin layer of fireproof joint filler. After lining the steel structure, the cavity of the panel was filled with a two-component PUR foam with the following properties: density 45 kg/m3 with a tolerance of ±5%, thermal conductivity in the range of 0.020–0.023 W/mK and reaction to fire class E according to the manufacturer’s specifications. Injection of PUR into the test specimens was performed with a low-pressure injector at a pressure of 5–10 bar and was completed within an hour for each specimen.

2.2. Thermocouple Arrangement

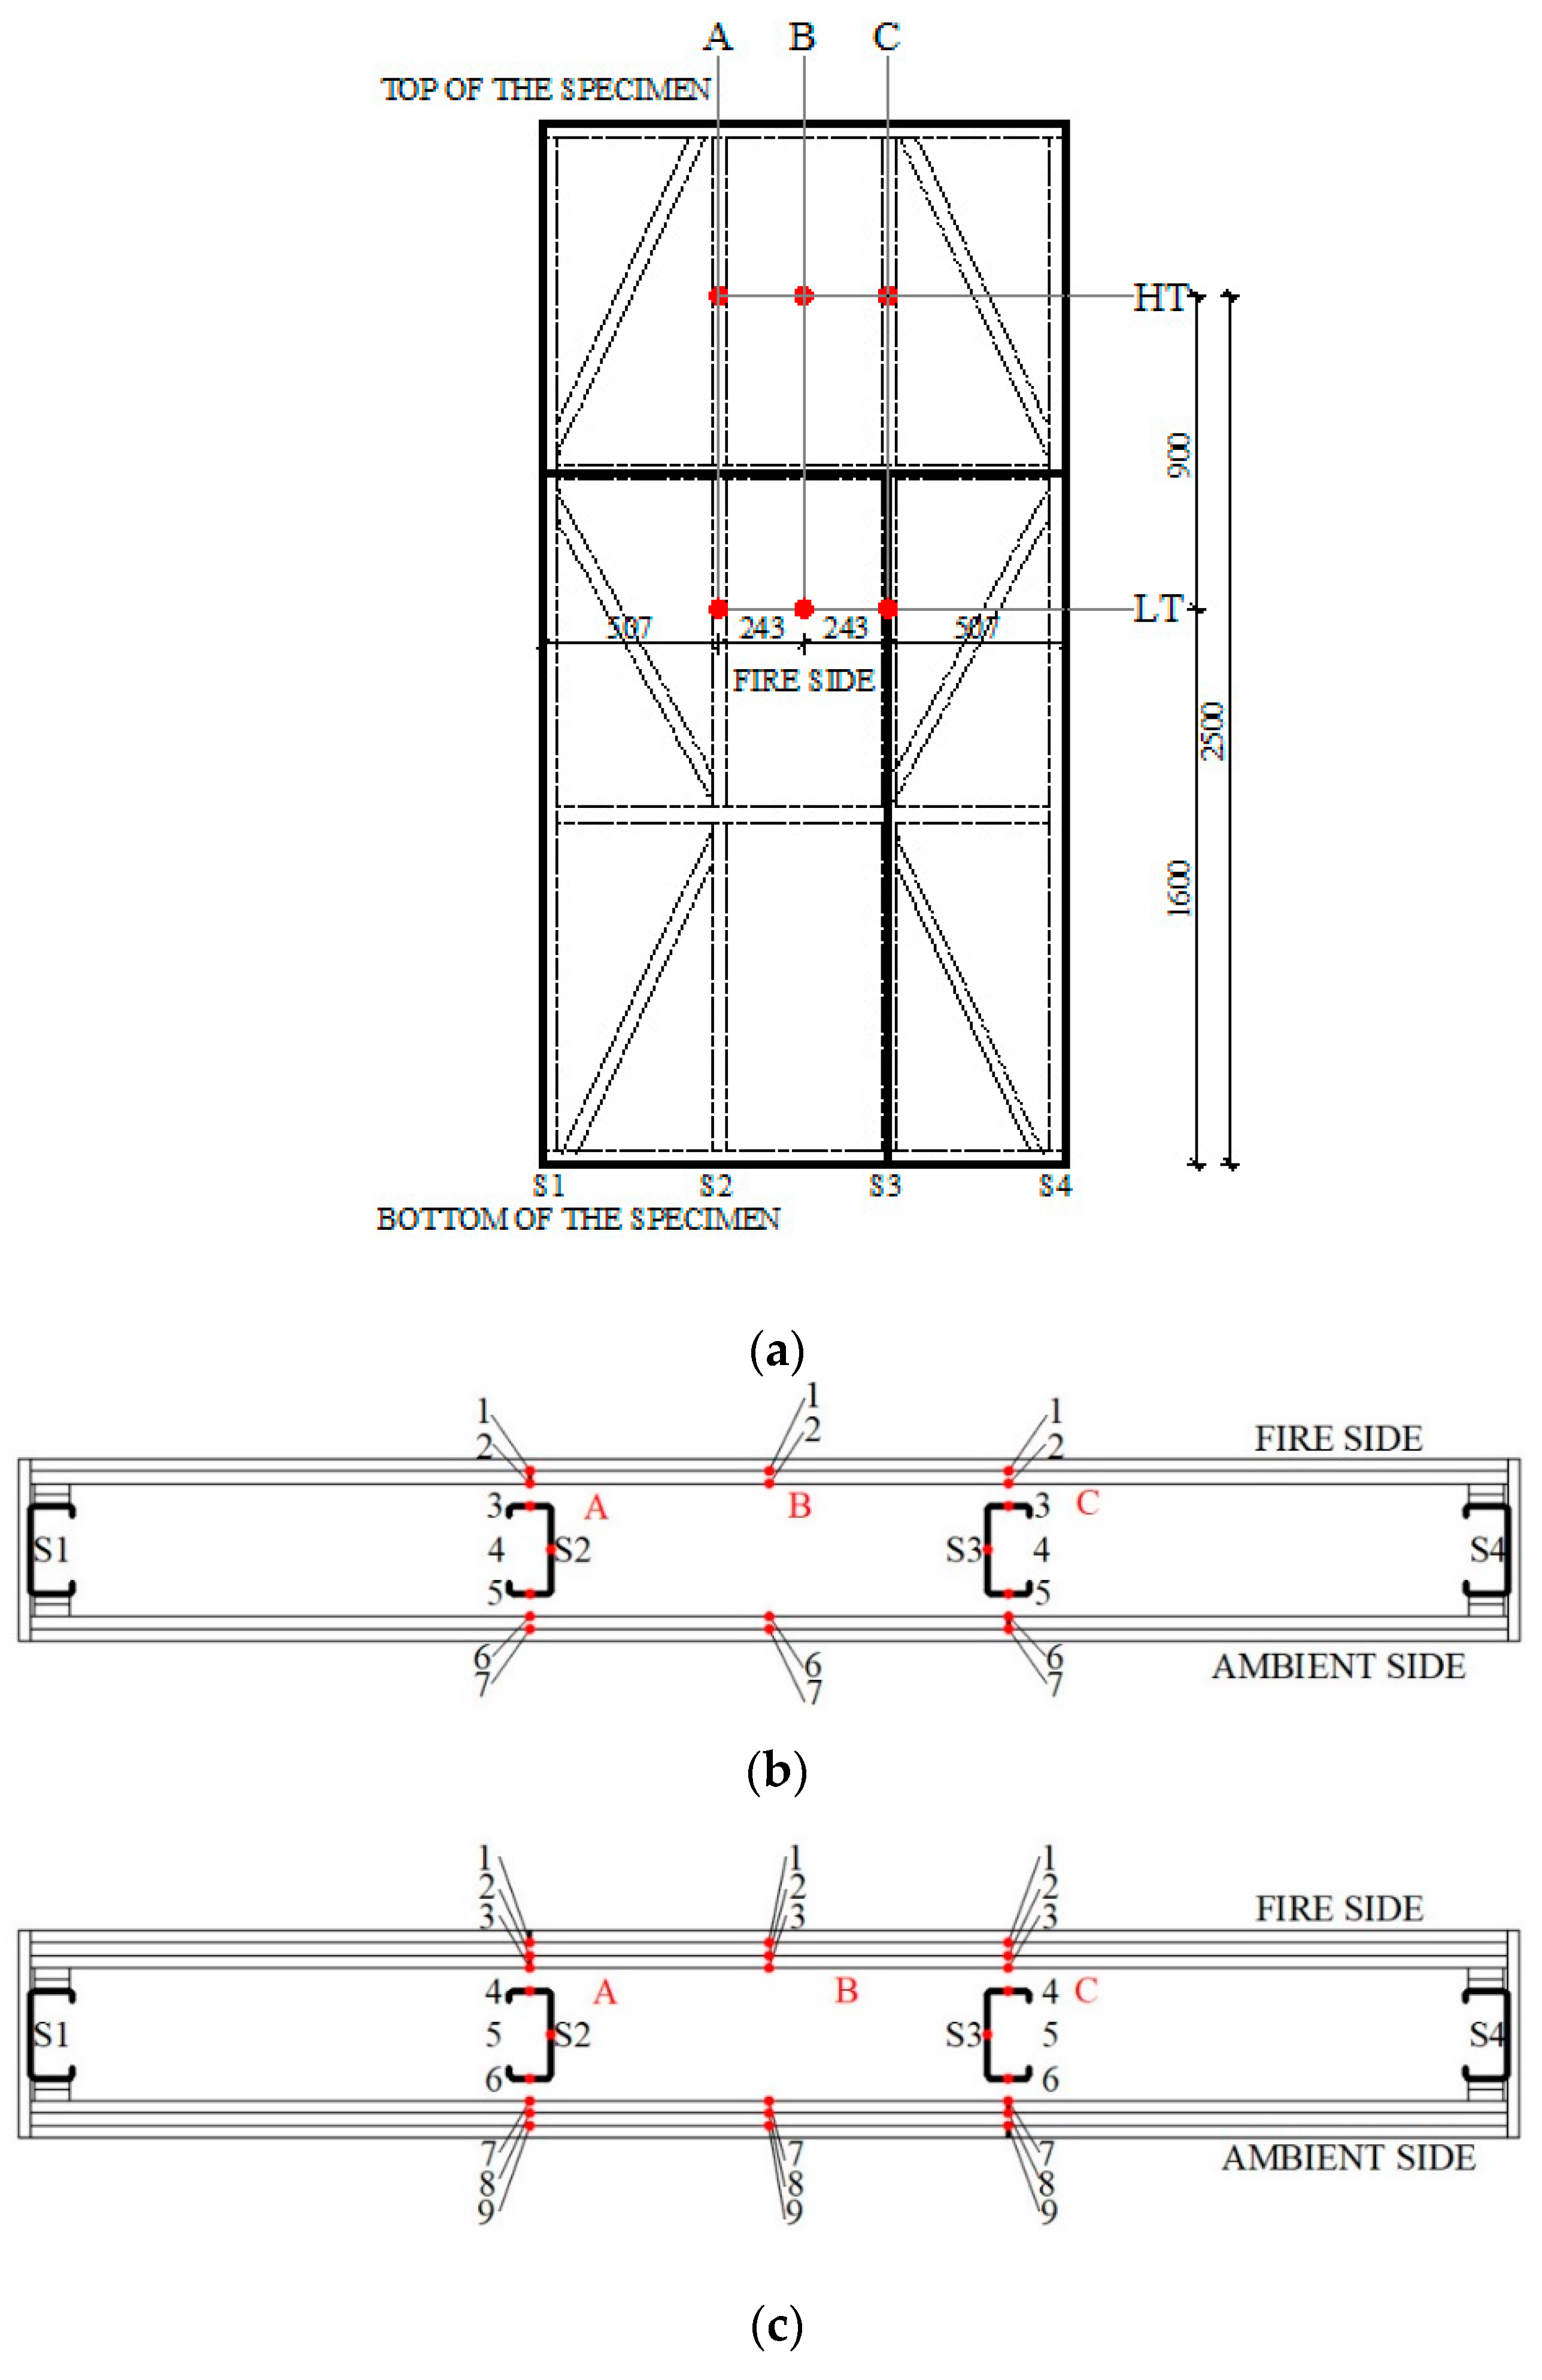
K-type thermocouples (NiCr-Ni) were installed on the ambient side of the wall panels in accordance with EN 1365-1 [33]. Additional thermocouples of the same type were installed, before filling the cavity with PUR foam, for monitoring the temperature development throughout the test panel—horizontally at three positions (A, B and C) at two heights, 1600–1650 mm (low, LT) and 2500–2550 mm (high, HT) from the bottom track, as shown in Figure 4a. Through the cross sections of the tested panels, the thermocouples were placed as follows (Figure 4b,c):
  • Between wallboard layers on both sides (ambient and fire side)—labelled 1, 2, 6 and 7 for double-lined specimens and 1, 2, 3, 7, 8 and 9 for triple-lined specimens.
  • On the hot and cold flanges and on the web of the lipped channel, C-shaped steel studs—marked 3, 4 and 5 for double-lined specimens and 4, 5 and 6 for triple-lined specimens.
A total of 42 thermocouples were installed in double-lined specimens and 54 in the triple-lined specimen. The thermocouples were welded to copper disks with a diameter of 12.0 mm and a thickness of 0.2 mm. The furnace temperature was measured using six K-type plate thermocouples symmetrically placed inside the furnace chamber at about 100 mm from the exposed surface of the specimen in accordance with EN 1363-1 [34].

2.3. Test Set-Up and Fire Test Methodology

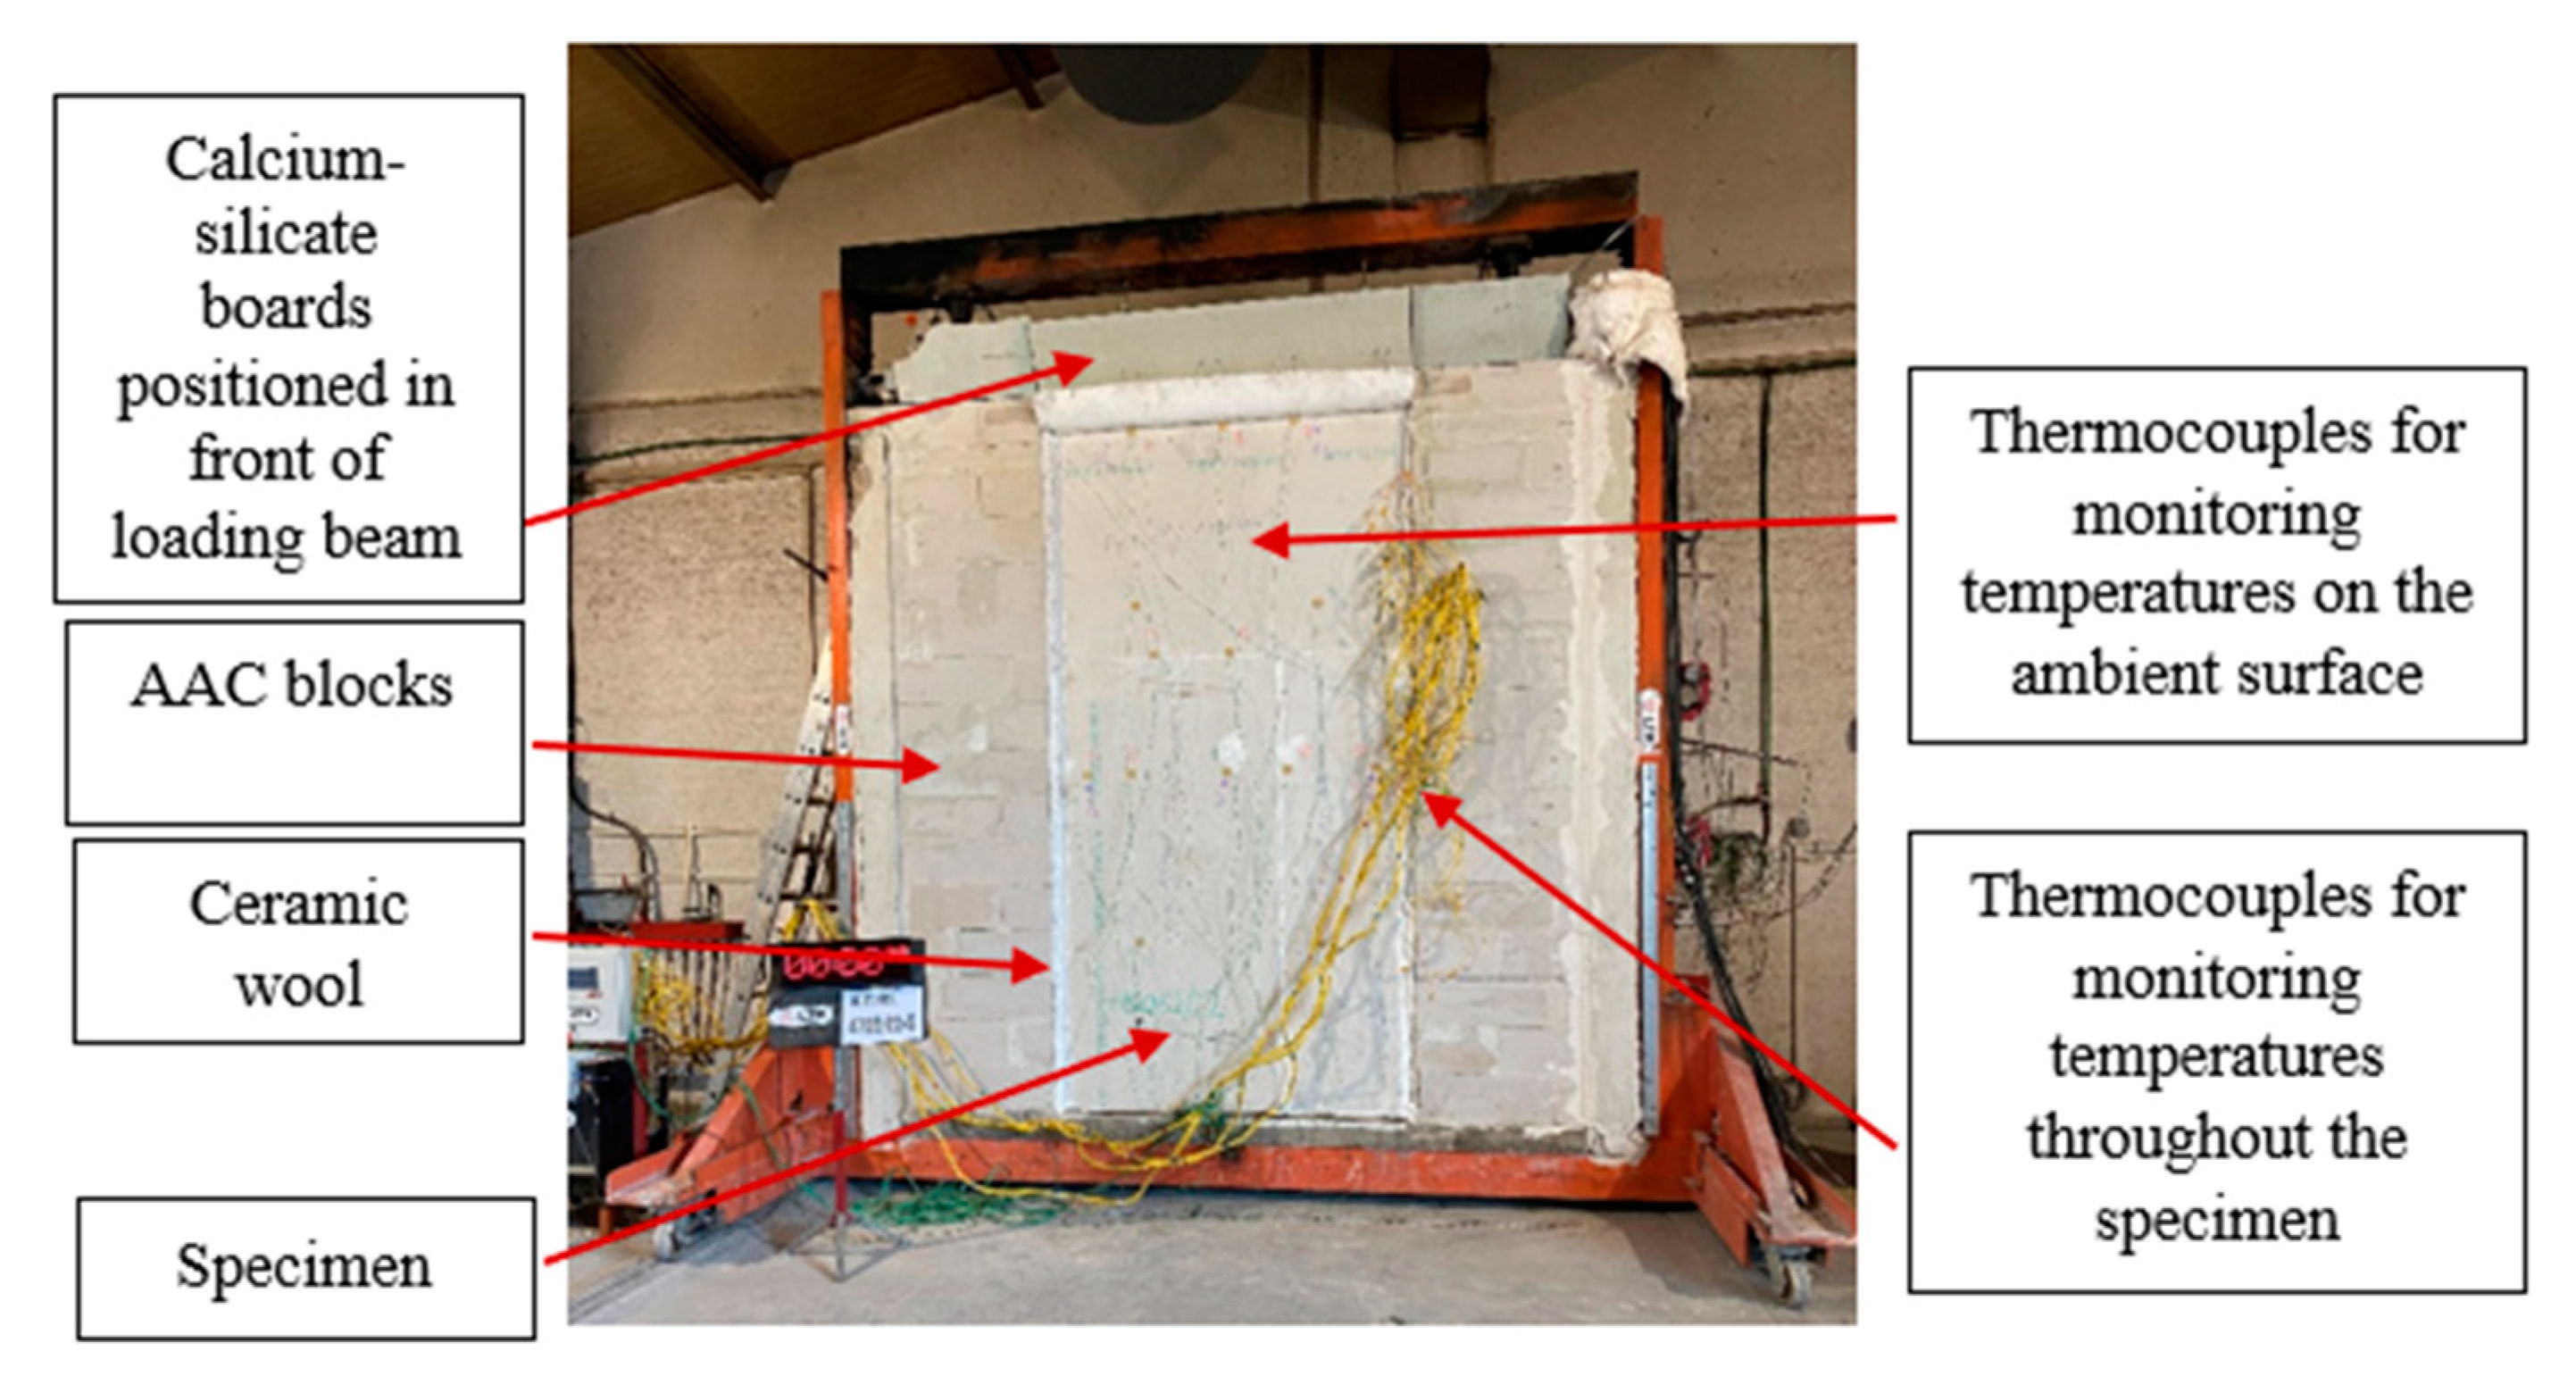
The opening of the furnace was 3.0 m wide and 3.0 m high and the additional width of the furnace opening was filled with non-combustible autoclaved aerated concrete (AAC) blocks and ceramic wool (with a density of 130 kg/m3 and a thickness of 25.4 mm) on both sides of the test specimen. Figure 5 shows the specimen test set-up.
The specimen was loaded with a specially designed beam providing a total load of 22.5 kN, i.e., a uniform load of 15 kN/m on the top of the specimen. The load was applied to the beam 20 min before the start of the test using hydraulic jacks and maintained throughout the test. The bottom of the specimen was secured with bolts that connected the specimen to a reinforced concrete slab. The specimen was unloaded when a steep increase in displacement was observed, and the structure tended to collapse. As combustible thermal insulation was used in specimens, the complete collapse of the specimen could damage the test equipment and endanger the safety of the laboratory personnel. The burners of the furnace were turned off with the delay after unloading when the rapid increase in temperatures of steel members was observed. The vertical deformations of the specimens were measured using displacement transducers placed at the top of the specimen, between the load beam and the fixed frame, recoding the distances between the load beam and the fixed frame. The changes in this distance correspond to the measured vertical displacements of the specimen. In addition, thermographic measurements were taken with an imaging camera during the fire test of specimen P1 to record the heat evolution on the whole unexposed side, which allowed a better understanding of the failure mode. The target fire curve was set in accordance with EN 1363-1 [34] using 6 radiant burners. The air temperature in the test area was maintained at 20 (±5) °C for 24 h prior to the fire test. The temperature readings of the thermocouples and the vertical displacements of the specimens were taken at 1 min intervals.

3. Test Observations and Results

The obtained results, which are composed of the observations during the tests as well as of the time–temperature and vertical displacement profiles, are presented separately for each tested specimen in the next Section 3.1, Section 3.2 and Section 3.3. Since all tested specimens showed a similar appearance at the end of the test, the observations for all three specimens are presented in Section 3.4.

3.1. Specimen P1

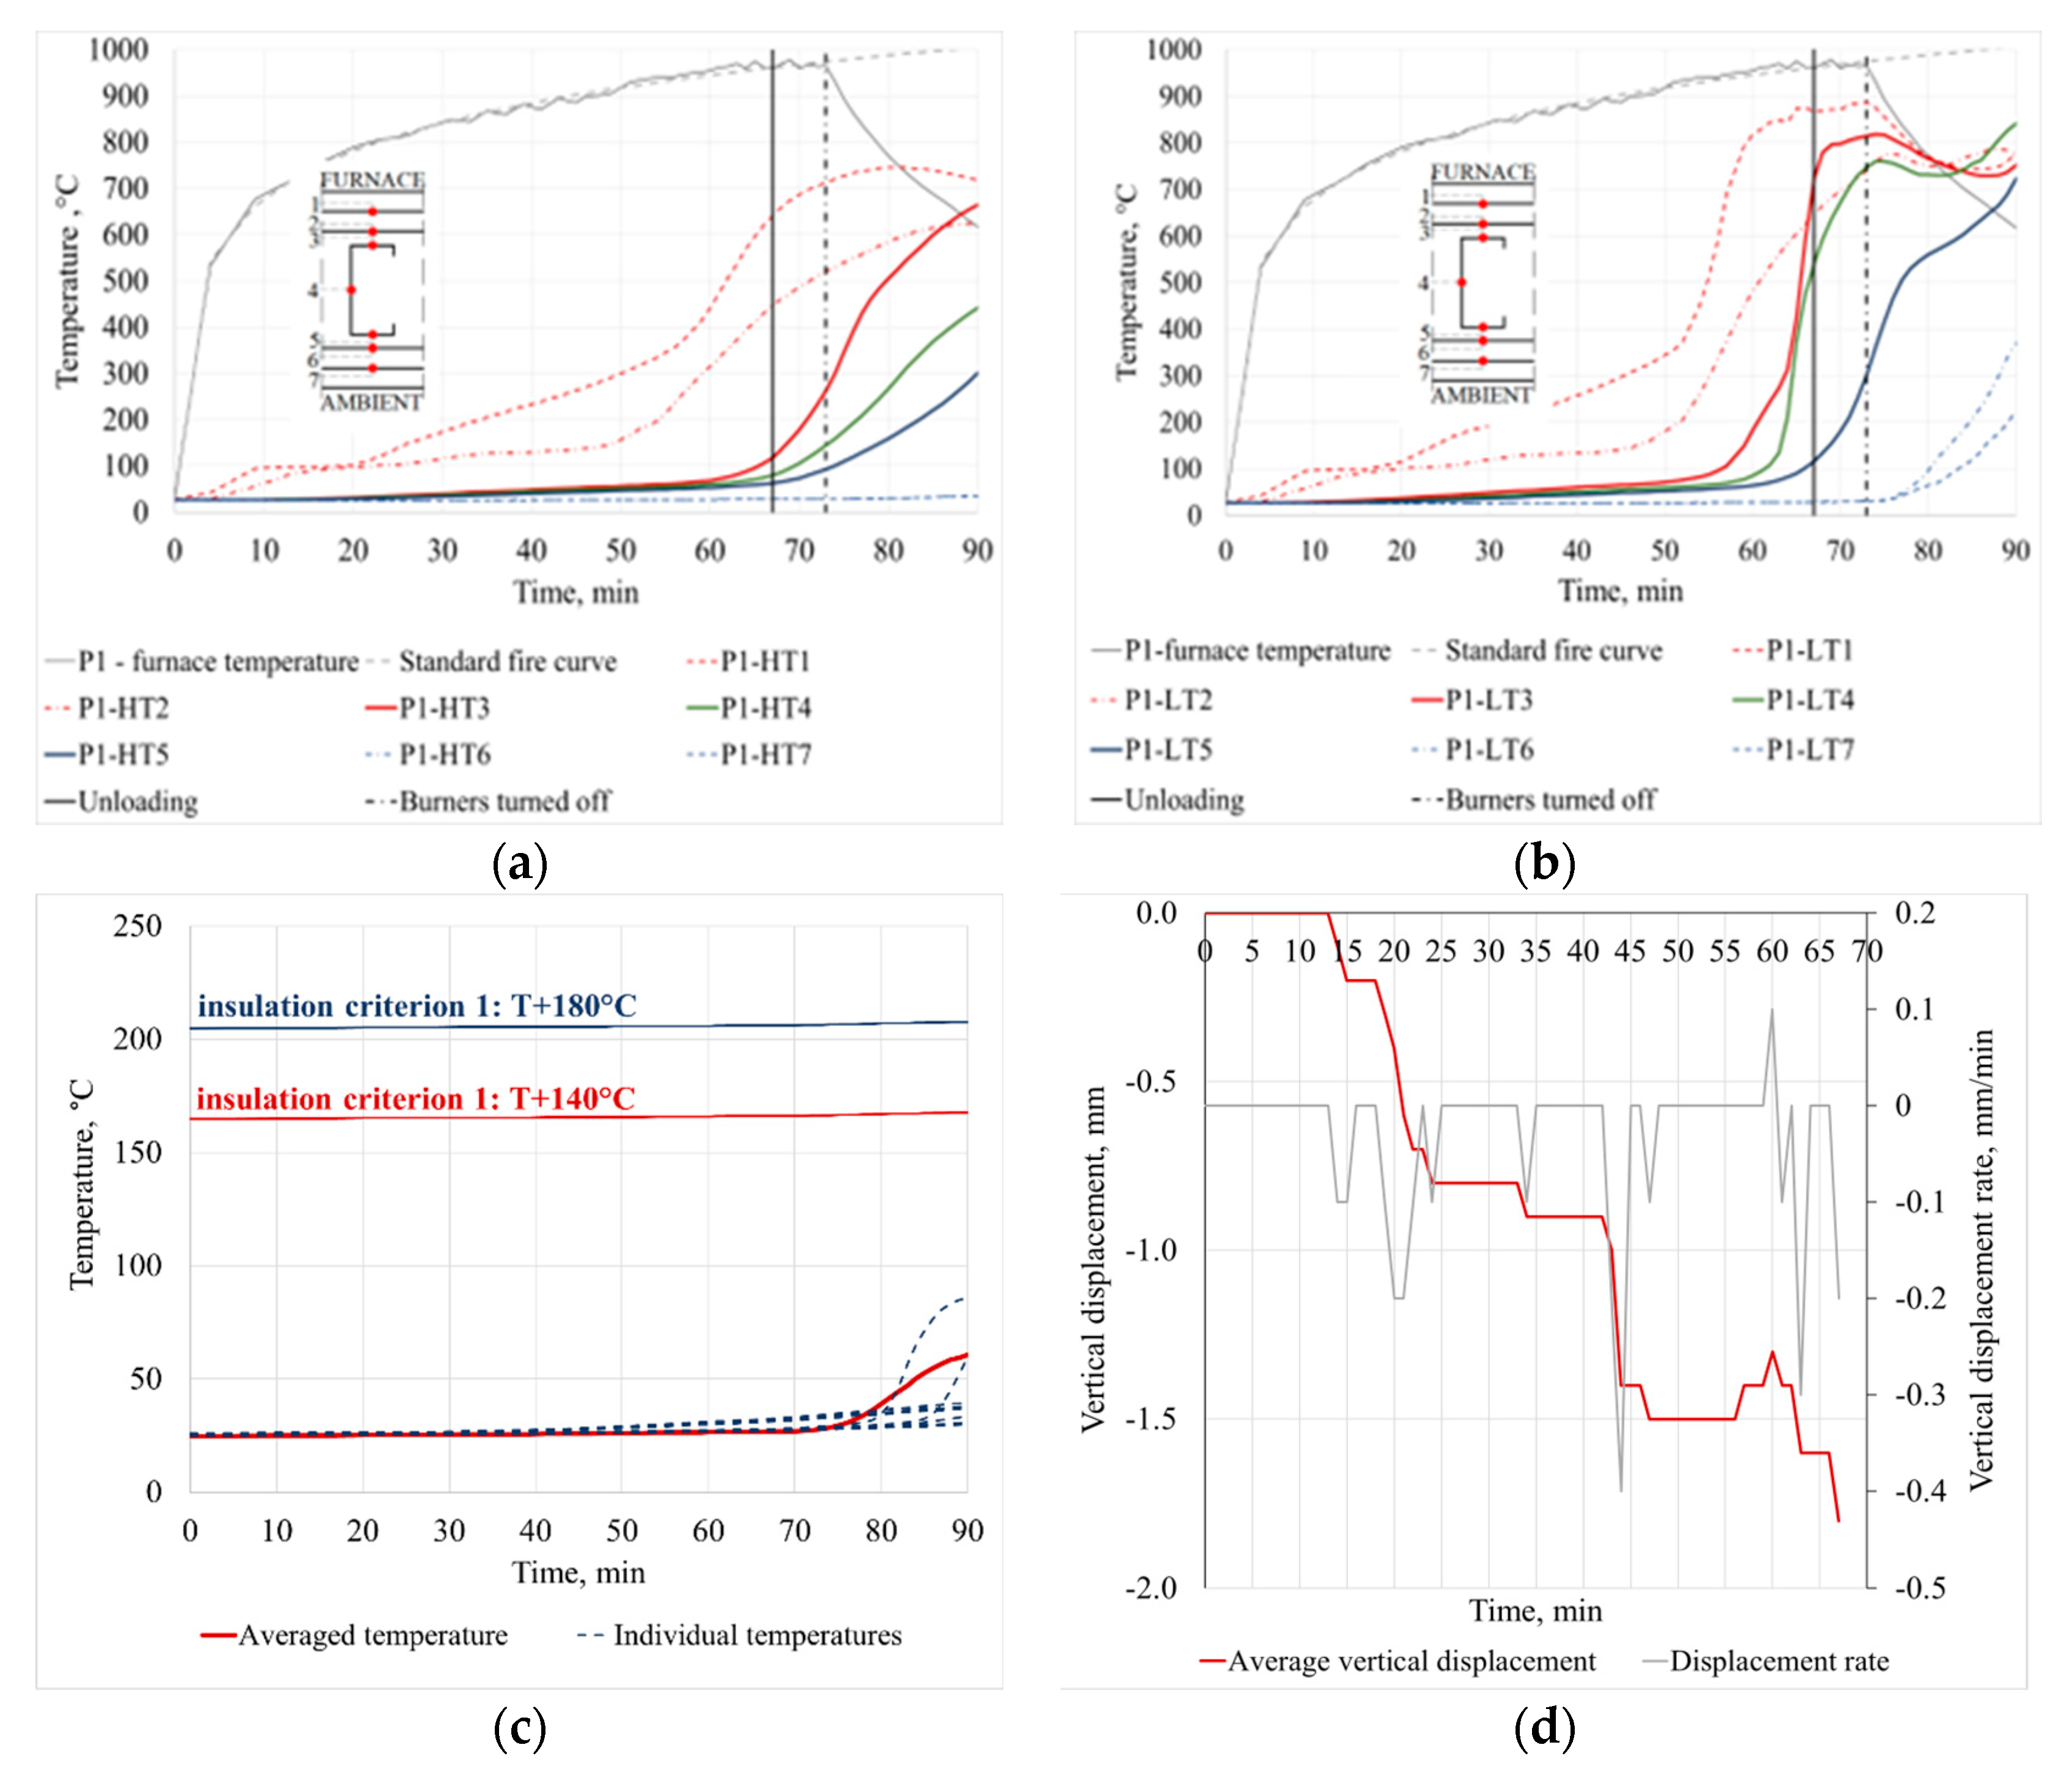
Specimen P1 consisted of double A1 gypsum fibre-boards on both sides. It was unloaded at the 67th minute because, as will be shown later, there was a threat of possible structural collapse. No smoke, flames, discolouration or cracks were observed on the ambient side of the specimen by the end of the test, indicating that the integrity failure criterion in accordance with EN 13501-2 [6] for FRR was not achieved. The temperature–time profile obtained in the furnace can be seen in Figure 6a,b and agrees well with the standard fire curve within the limits prescribed by EN 1363-1 [34]. Temperatures through the cross-section are presented as average values measured on thermocouples placed at the same height: upper (2500–2550 mm, HT) in Figure 6a and lower (1600–1650 mm, LT) in Figure 6b. As shown in Figure 6a, the temperature between the two wallboards (thermocouple P1-HT1) remained below 100 °C (temperature plateau) for a period of about 20 min after the start of the test when the temperature in the furnace had already reached about 800 °C. This delay in the temperature rise was due to the dehydration process of free and bound water in the GFBs [35,36]. After 20 min of fire exposure, the temperature recorded at thermocouple P1-HT1 increased significantly and reached maximum value of 746 °C in the 80th minute (the burners had already been turned off). At the position between the second wallboard and the PUR foam (thermocouple P1-HT2), the delay in the temperature rise extended to around 48 min of fire exposure, when the temperature started to continuously increase up to the end of the test. Temperatures at the steel sections (thermocouples P1-HT3, P1-HT4 and P1-HT5) began to rise steeply about 60 min after the start of the test, reaching 117 °C, 80 °C and 63 °C at the time of specimen unloading, and 665 °C, 442 °C and 302 °C in the 90th minute at the hot flange, web and cold flange, respectively. Compared to the temperature profiles obtained at the upper position, the average temperatures recorded at the lower positions (LTs—see Figure 6b) are similar up to the 50th minute of fire exposure when the steeper temperature rise at all thermocouple positions was observed. When the specimen was unloaded (67th min), temperatures of 722 °C, 539 °C and 115 °C were recorded at the hot flange, web and cold flange, respectively, while the maximum temperatures were recorded after the burners were turned off and were 818 °C, 842 °C and 724 °C respectively. These temperatures indicate that the recrystallization point of the steel was reached, which would result in significant deformation and loss of (local) structural stability of the steel members.
Figure 6c presents the individual and the average temperatures on the unexposed side of the tested wall indicating that the insulation failure criterion (average temperature rise of 140 °C and 180 °C on individual thermocouples, respectively) according to EN 13501-2 [6] was not reached. The highest average temperature was 61 °C and the highest individual temperature was 86 °C observed after the burners were turned off. As Figure 6d shows, the specimen deformed continuously from the 15th minute until the unloading. From the 15th to the 25th minute, there was a sudden increase in deformations, followed by a stable phase. During this period, the temperatures at the exposed specimen side (P1-HT1 and P1-LT1) were increasing from a stable stage (100 °C), as shown in Figure 6a,b. A sudden increase in the vertical displacement can also be seen at the 45th minute (vertical displacement rate of 0.4 mm/min), which can be attributed to the recorded board falling off, followed by a further increase in the 60th minute. This increase could be attributed to the rising temperatures at the steel frame members (P1-LT3, Figure 6b).

3.2. Specimen P2

Specimen P2 was of the same composition as specimen P1 and was tested to check uniformity of the test results. However, the specimen had to be unloaded earlier, at the 50th minute of the fire exposure while the furnace burners were shut down at the 67th minute. As with specimen P1, no smoke, water vapour or cracking was observed on the ambient side during the entire test period, indicating that the integrity failure criterion was not reached. The temperature–time profile obtained in the furnace (Figure 7a,b) agrees well with the standard fire curve within the limits prescribed. Monitored average temperatures for the upper positions are shown in Figure 7a up to 90 min. As shown in the figure, the temperature between the two wallboards (thermocouple P2-HT1) remained below 100 °C (temperature plateau), for a period of about 20 min of fire exposure and then began to rise until the end of the test. The delay in the temperature rise between the second wallboard and the PUR foam (thermocouple P2-HT2) extended to 46 min after the start of the test, when the temperature rise followed that of thermocouple between the two wallboards (P2-HT1). At the time of unloading, the temperatures at the hot flange (P2-HT3), web (P2-HT4) and cold flange (P2-HT5) were 64 °C, 55 °C and 50 °C, respectively, and reached maximum values of 577 °C, 573 °C and 336 °C, respectively, when the burners were turned off during the 90 min temperature-monitoring period. Compared to the temperature profiles shown for the upper position (Figure 7a), the average thermocouple temperatures recorded at the lower position (Figure 7b) are similar up to the 40th minute of fire exposure. However, it can be seen that after the dehydration period, the temperatures between the two wallboards (P2-LT1) increase rapidly. The same trend in temperature rise was observed at the position between base wallboard and PUR foam (P2-LT2) with later start of temperature rise. At the 50th min of exposure time (unloading), temperatures of 76 °C, 62 °C and 53 °C were recorded at the hot flange (P2-LT3), web (P2-LT4) and cold flange (P2-LT5), respectively, and reached maximum values of 783 °C, 734 °C and 681 °C, respectively, after turning off the radiant burners.
As for specimen P1, the individual and average temperature recorded on the unexposed wallboards shown in Figure 7c indicate that the insulation failure criteria were not reached. Figure 7d presents the vertical deformations that occurred during the 50 min fire test. Until the 15th minute, the specimen expanded due to the increasing heat, then there was a sudden increase in the opposite direction, i.e., the direction of the applied load. From the 20th minute, the temperatures at the exposed specimen side (P1-HT1 and P1-LT1—see Figure 7a,b) started to increase from stable stage (100 °C). Until the 35th minute, the specimen remained stable with no significant deformation observed. From this point on, the specimen deformed continuously with high displacement rate (from 0.4 mm/min to almost 0.8 mm/min), indicating a possible collapse of the structure. Consequently, the specimen was unloaded at the 50th minute.

3.3. Specimen P3

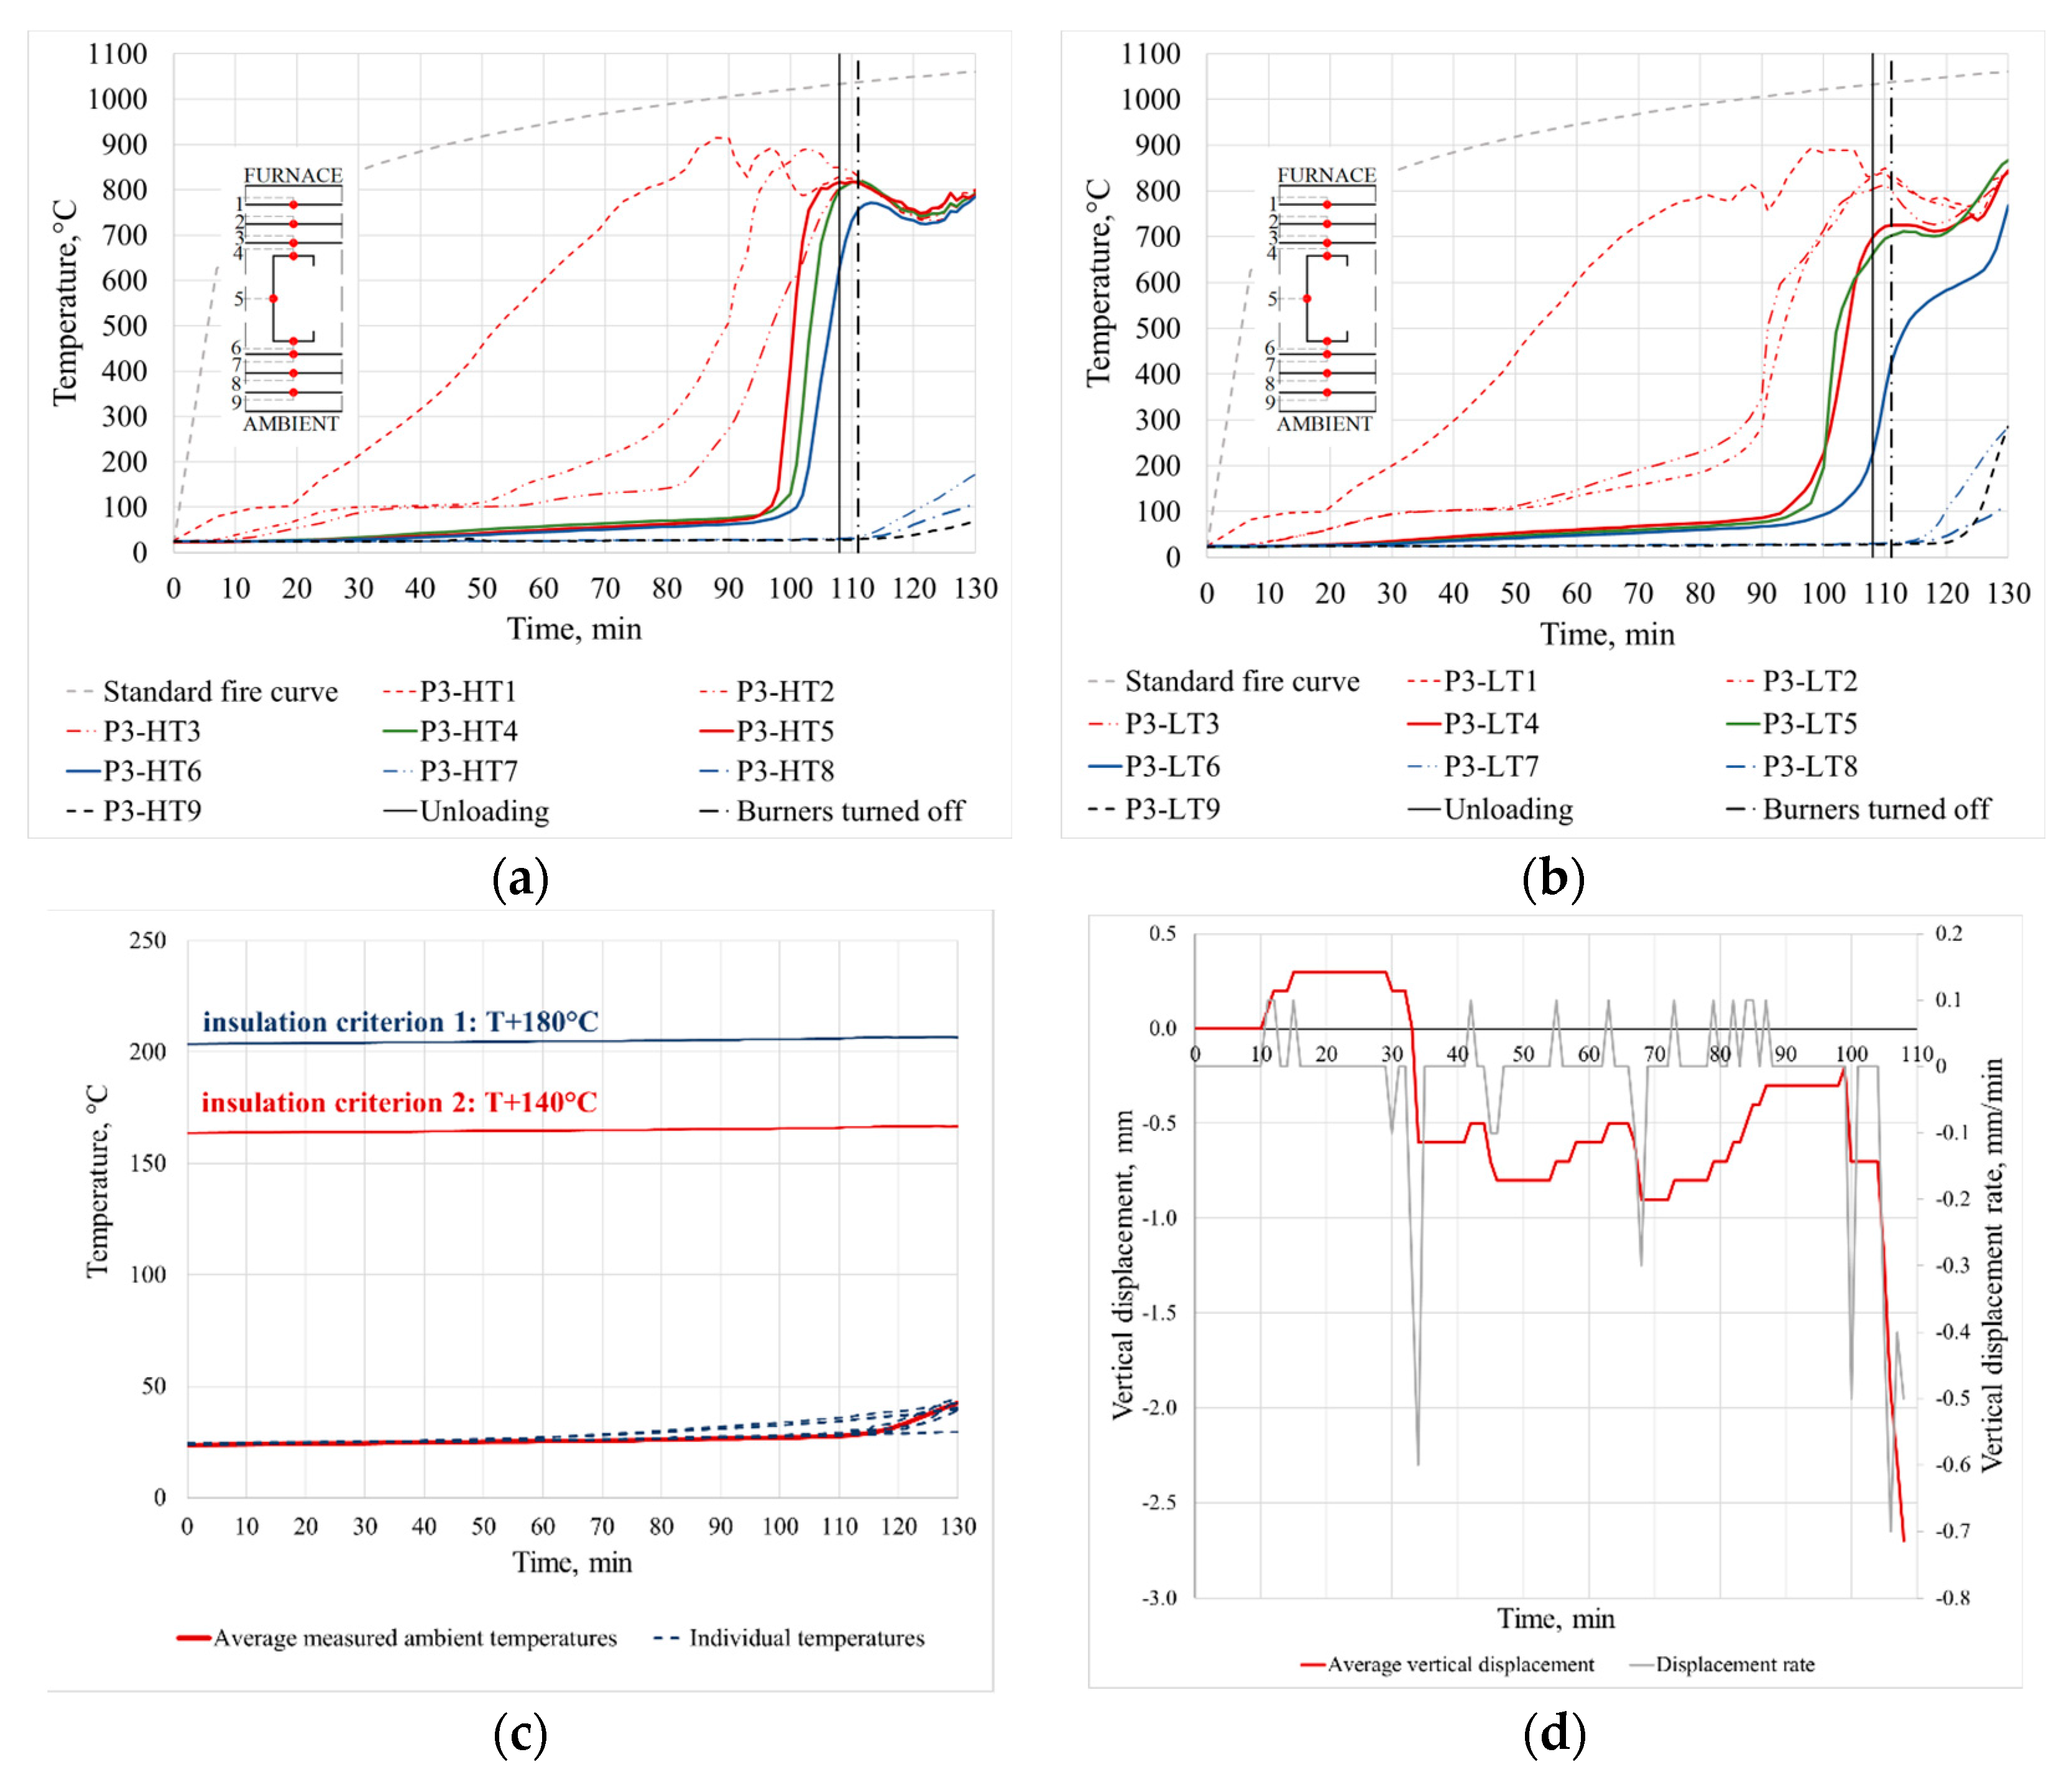
Specimen 3 was tested to observe the benefit of an additional layer of wallboard on the FRR The specimen consisted of triple gypsum fibreboards on both sides (two A2 GFBs and one A1 GFB). Specimen 3 was unloaded at the 108th minute and the burners were turned off in the 111th minute. No smoke, water vapour, flames or cracks were observed on the ambient side of the specimen throughout the test, indicating that the integrity failure criterion was not reached. Monitored average temperatures for the upper positions up to 130 min after the start of the test are shown in Figure 8a.
From the figure, it can be seen that the temperature between the two wallboards (thermocouple P3-HT1) remained below 100 °C for a period of about 20 min after the start of the test (temperature plateau) and then began to rise steeply. The temperature at the boundary between the base layer (GFB3) and the insulation (P3-HT3) remained below 100 °C until 60 min of fire exposure. After the initial delay, the temperature increased very slowly until the 90th minute and then increased rapidly to 814 °C at the 110th minute. Temperatures at the steel sections (thermocouples P3-HT4, P3-HT5 and P3-HT6) began to rise rapidly about 95 min after the test had started reaching maximum values of 819 °C at the hot flange and web of steel profile, and 785 °C at the cold flange. The average temperatures recorded on the lower positions of P3 (see Figure 8b) are similar to those recorded at upper positions up to the 50th minute of fire exposure, with some differences thereafter. Very similar temperature profiles were obtained at the position between the exposed and middle (i.e., PL3-LT2) and between the middle and base layers (i.e., PL3-LT3) of the gypsum fibreboards. The temperatures recorded on the steel studs (P3-LT4, P3-LT5 and P3-LT6) started to increase almost at the same time (95th minute) as those recorded at high position (P3-HT4, P3-HT5 and P3-HT6) and maximum values of 845 °C, 867 °C and 768 °C, respectively, were reached. From the aforementioned figures, temperature–time curves for positions 1–6 follow the same pattern after the specimens were unloaded and burners were shut down. The stagnation in temperature rise was then observed, which was followed by a temperature increase in the last 10 min, although there was no heat output from the furnace. Fast temperature rises at each position throughout the cross-section of the specimen were obviously a consequence of PUR burning. At the ambient side (Figure 8c), the obtained maximum individual and average temperatures were around 45 °C, which was below the insulation criteria for FRR.
As Figure 8d shows, the specimen vertically expanded due to the increased heat from the 12th to the 33rd minute. After the initial expansion, the measured vertical displacements show a steady increase in the direction of the applied load (vertical displacement rate of 0.6 mm/min). At the 33rd minute, the temperatures between GFB1 and GFB2 were 220–240 °C. After the initial propagation, the vertical displacements remained stable with only small fluctuations until the 99th minute. At the 99th minute, a sharp increase in the measured vertical displacements (vertical displacement rate from 0.5 mm/min to 0.7 mm/min) occurred, possibly leading to collapse of the structure.

3.4. Post-Test Observations

Post-test observations of all tested specimens indicate that all wallboards on the exposed side collapsed completely, and the PUR foam was almost completely charred. The steel members exhibited localised buckling around relatively rigid nodes 6 and 7. Global buckling of top diagonal members (under the load application position) was also recorded. For an example, Figure 9 presents the exposed side of test specimen P2.

4. Discussion

4.1. Overall Behaviour of Tested Specimens

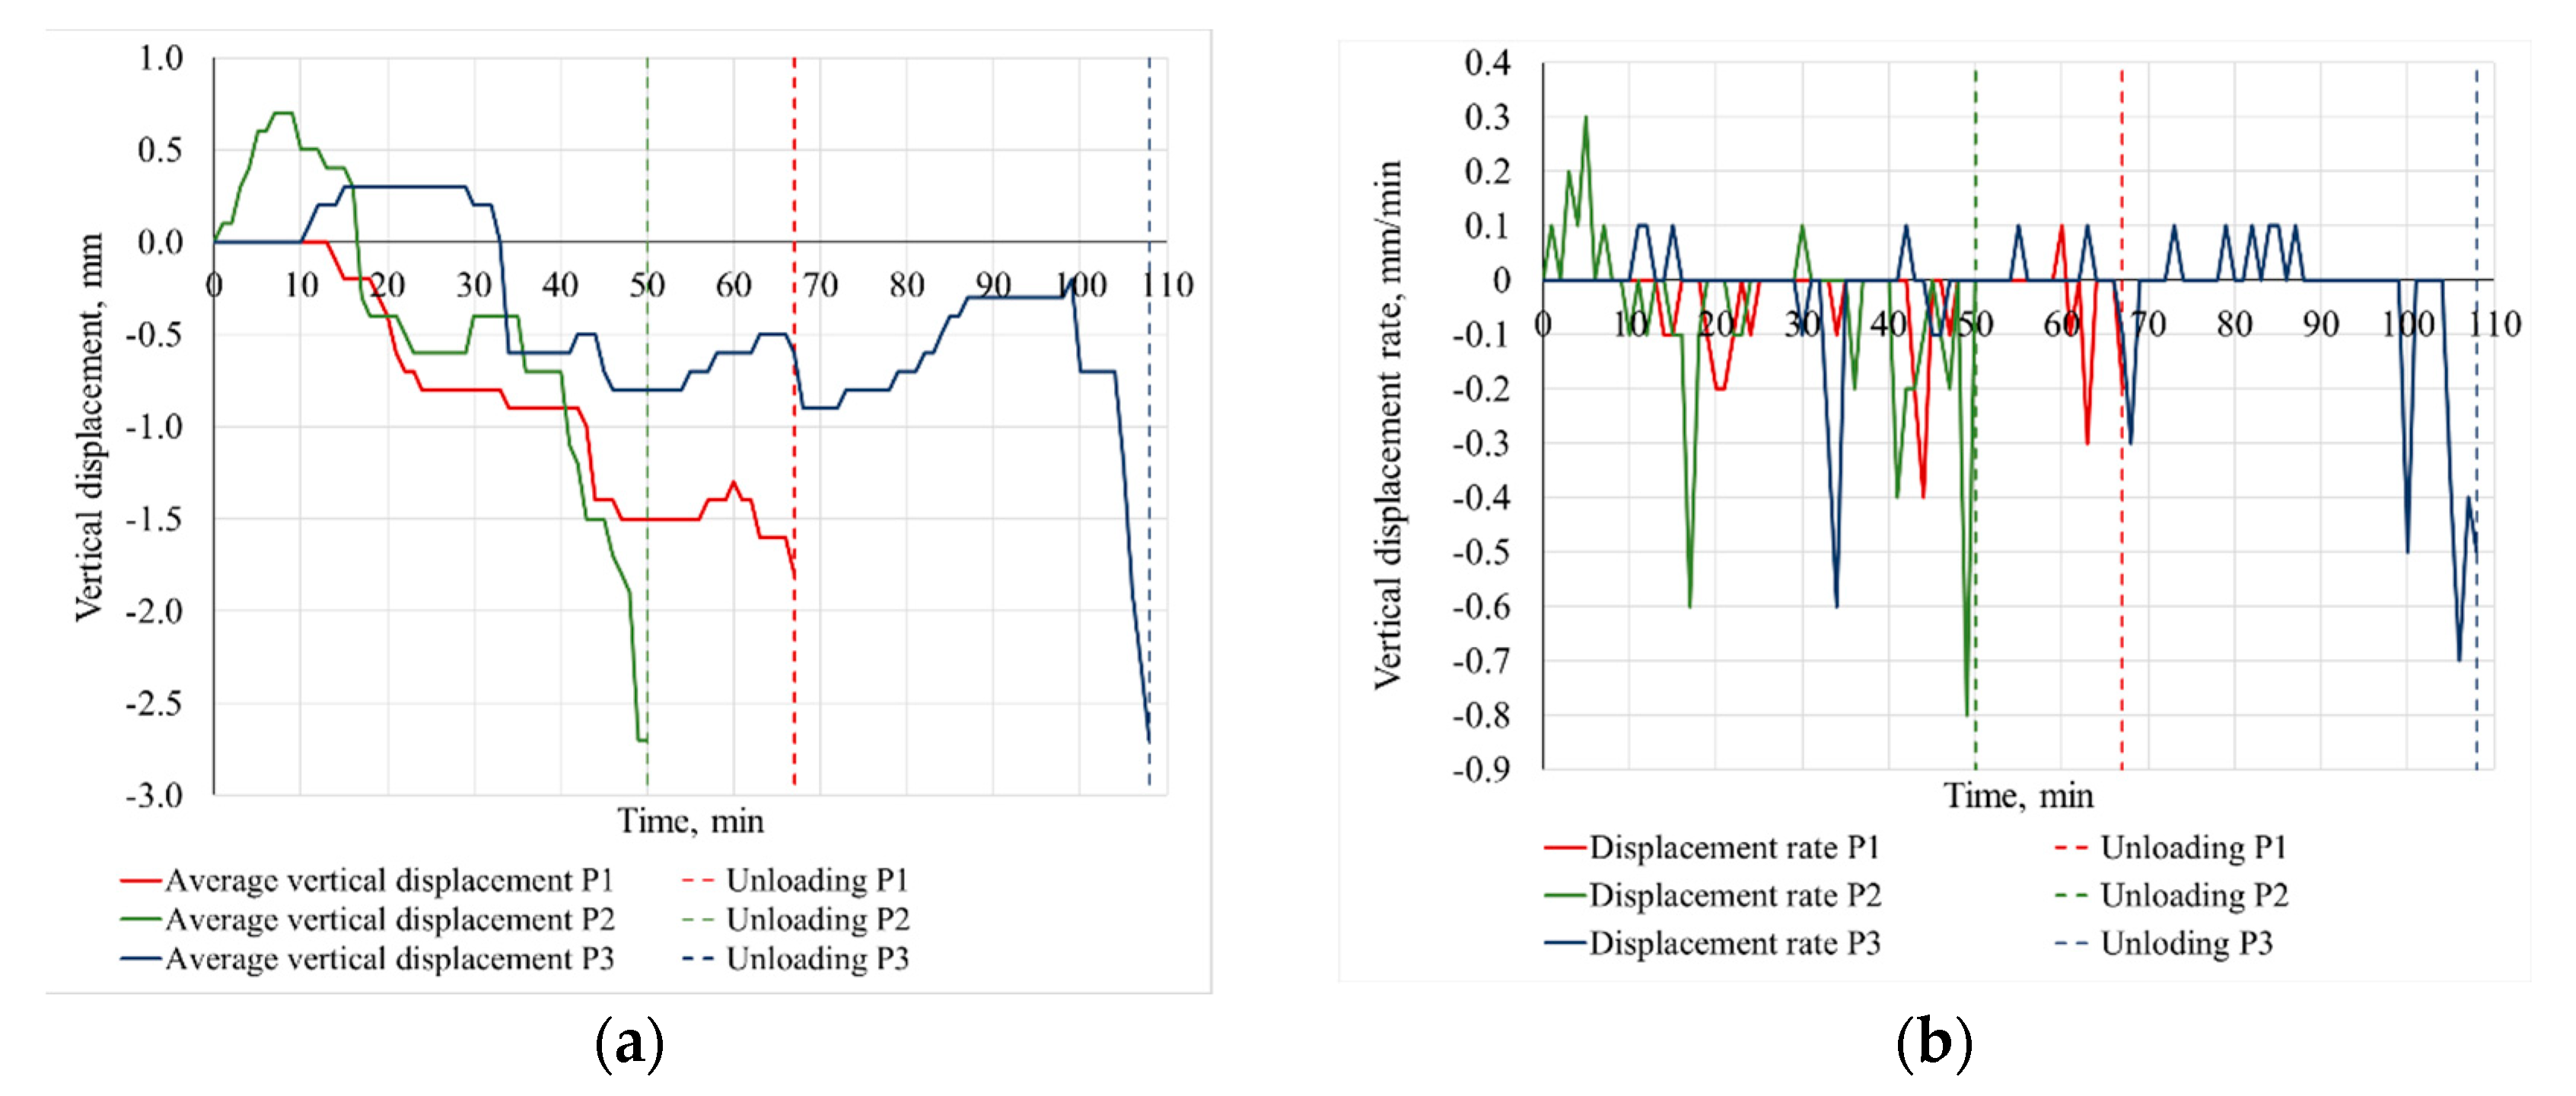
The results presented separately for each LSF specimen show similar behaviour and mode of failure during standard fire exposure. At the beginning of the test, the gypsum fibreboards protected the steel frame from a temperature rise for some time. In addition, the low thermal conductivity of the PUR foam contributed to low heat transfer through the specimen before it began to decompose. Once the free and physically bound water evaporated from the GFBs, they became susceptible to cracking, and parts of boards fell off, allowing heat to penetrate the combustible cavity insulation and steel members. For the specimens with double GFBs (specimens P1 and P2), the sudden temperature rise on the steel members started after about 50–60 min (Figure 6a,b and Figure 7a,b), while the additional board on the specimen with triple GFBs prolonged the steep temperature rise for an additional 30 min (Figure 8a,b). When the ignition temperature for the PUR insulation was reached (between 200 °C and 300 °C), the additional heat generated by combustion contributed to the temperature rise on the steel sections and maintained the high temperatures even after the burners in the furnace were turned off. Nevertheless, the heat generated by the PUR combustion was not sufficient to raise the furnace temperature (Figure 6a,b, Figure 7a,b and Figure 8a,b). Throughout the test period, all tested specimens showed no signs of integrity and insulation failure. As mentioned earlier, according to previous studies on the load-bearing cavity insulated LSF wall exposed to fire test [16,17,18], structural failure is usually the predominant failure mode due to the non-uniform heating of the steel members. In accordance with EN 1365-1 [33], structural failure occurs when the displacement reaches the value h/100 mm (height/100) or when the displacement rate reaches a value of 3 h/1000 mm/min. This means that a displacement of 30 mm or a displacement rate of 6 mm/min must be achieved. Figure 10a shows the comparison between the average measured displacements for all tested specimens, while Figure 10b shows the comparison of the average displacement rates. During the time of unloading, the two structural failure criteria were not reached but a trend of steep increase can be observed. Since the specimens were manufactured with non-standard dimensions and unloaded earlier than the above criteria were reached, it is not possible to give an official FRR. However, the results shown in Figure 10a,b suggest that specimens P1 and P2 could achieve a minimum FRR of 60 min and specimen P3 of minimum 90 min, which is sufficient for use in residential and commercial buildings.
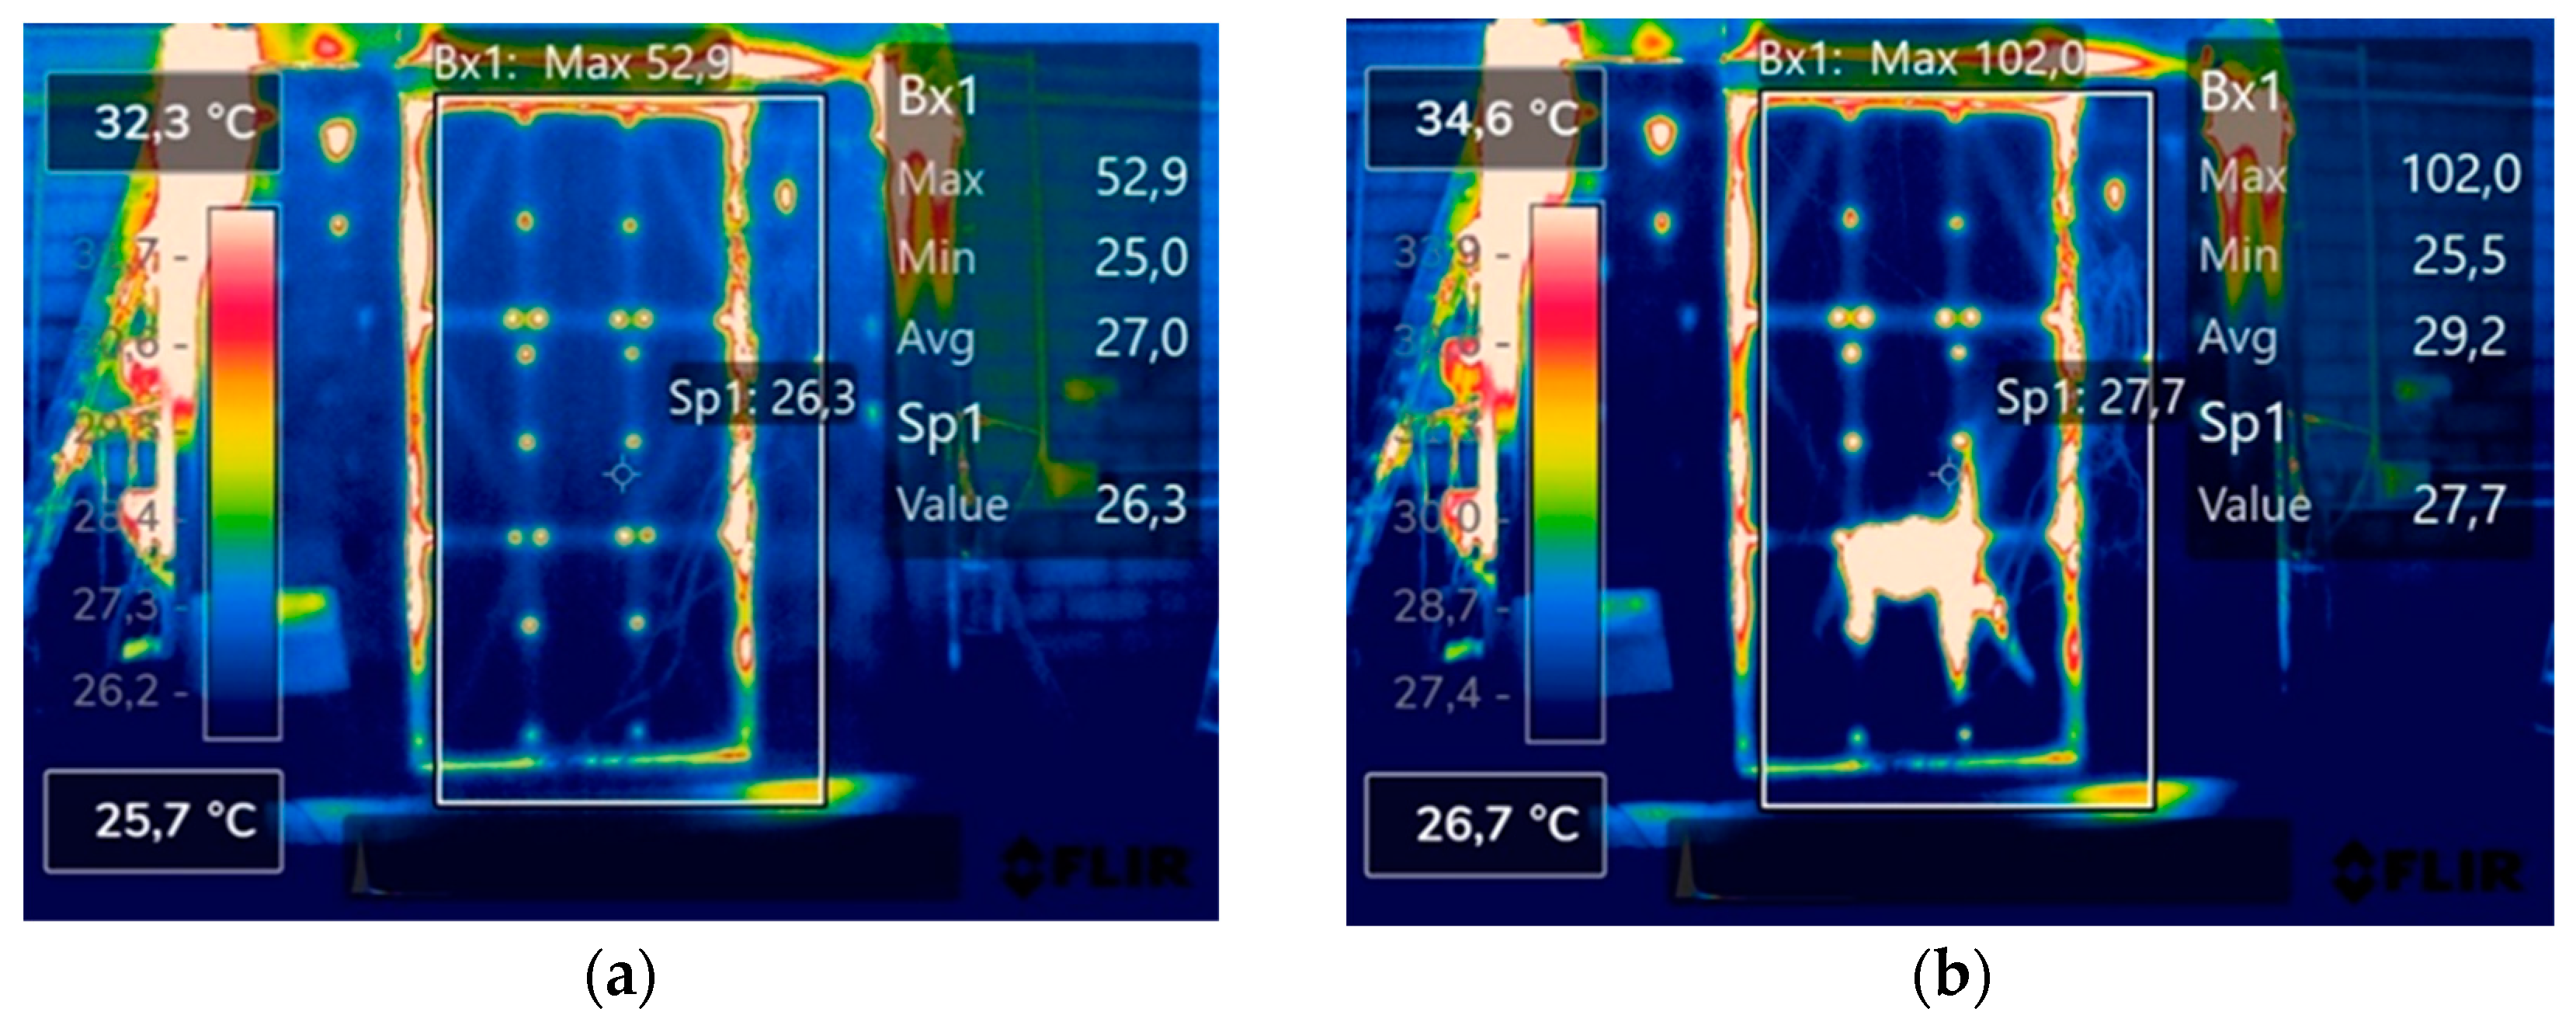
Post-test inspection of the tested specimens revealed that the cavity insulation was completely burned, leaving only layers of charcoal (Figure 9), while the steel members around nodes in central studs (N6 and N7 according to Figure 1) were deformed in all three specimens (Figure 9c,d). It was also noted that the GBFs were still attached to the steel structure at the top and near the bottom of the specimen. This led to the conclusion that the failure of the exposed GBF was localized and probably occurred about 1 m from the bottom of the specimen. At this location, the fire from the furnace entered the cavity, resulting in decomposition of insulation. This is confirmed by the results of the infrared thermography monitoring and thermograms taken on specimen P1 at the 67th and 76th minutes of testing, Figure 11.
Thermographic measurements showed that the predominant heat transfer occurred in the lower third of the specimen, which is consistent with the temperature–time curves shown in Figure 6a,b. As can be seen from the figures, a significant temperature increase (maximum temperature above 100 °C was achieved) was observed at the nodes positioned at the lower part of the specimens (around nodes N6 and N7). This higher temperature is directly correlated with the position of joints (as shown in Figure 3) implying that the joints failed first and the PUR insulation degraded around this location first. This resulted with heat being transmitted through the boards and consequently to the non-exposed surface of the specimen. Additionally, higher temperatures than the surroundings are observed in the areas where spacers and screws are positioned.

4.2. Comparison between Nominally Identical Specimens (P1 and P2)

Since fire tests are expensive and time-consuming, the results are usually analysed, and conclusions are drawn from individual measurements. On the other hand, studies dealing with repeated fire tests with the same specimens have shown that fire tests are difficult to reproduce in terms of their physical quantities even though they were designed to be repeated under the same conditions [37]. Therefore, two nominally identical LSF panels (P1 and P2) are tested for comparison. Figure 12a,b show the comparison of the time–temperature curves recorded between the two GBFs (positions HT1 and LT1) and between the GFB base layer and the PUR insulation (positions HT2 and LT2) for specimens P1 and P2, while Figure 12c,d show the comparison of the time–temperature curves obtained at the steel studs at both thermocouple positions.
Although specimens P1 and P2 were made from the same components, tested under the same conditions and exhibited similar failure modes, the degradation of specimen P2 began earlier. In general, the time–temperature curves recorded at GBFs at the lower positions for both specimens (Figure 12b) show greater differences compared to the analogous results recorded at the upper positions (Figure 12a). The location where the cracks are believed to have formed comes from the observations made from the thermograms (Figure 11) and it is located directly above nodes N6 and N7, where local buckling was observed during the post-test inspection. About 40 min after the start of the test, severe horizontal cracking and opening of the joints were observed on both specimens. The differences between the time–temperature curves in the steel members of specimens P1 and P2 are also high (Figure 12c,d), especially at lower position from the 50th minute onwards (Figure 12d). Consequently, the observed vertical deflection was more pronounced for specimen P2 (Figure 10). These discrepancies in the obtained results indicate the need to repeat the fire tests to draw strong conclusions and provide a broader basis for the results if modelling is used. Thus, the results obtained do not allow clear conclusions to be drawn regarding the uniformity of the results obtained and the subsequent FRR. If FRR is concerned, since the load was removed before the structural failure criteria were reached, it is hard to predict the behaviour of panels from test end onward. However, the results obtained on both specimens suggest that an FRR of at least 60 min can be achieved for LSF with combustible cavity insulation protected with two layers of GBF with reaction to fire A1.

4.3. Comparison between Specimens with Different Wallboard Layers (P1 and P3)

The comparison between specimens P1 and P3 was made with the aim of determining the effect of different arrangement, type and number of wallboard layers on the fire behaviour of studied LSF panels. Although specimen P3 did not fail up to the 108th minute, the purpose of this comparison is to evaluate the fire behaviour in the first 90 min. Since specimen P2 failed earlier than P1, specimen P1 was taken as more appropriate to determine the behavioural differences in a longer time frame. Comparing the time-temperature curves shown in Figure 13a,b, it can be seen that the addition of one layer of GBF in specimen P3, even if inner ones are of A2 GFB, significantly affected the temperature development at the interface between the base layer and the insulation (P1-(H/L)T2 vs. P3-(H/L)T3). The temperatures for both specimens between the two exposed wallboards at positions HT1 and LT1 were similar until the 20th minute. After the 20th minute, the temperatures between the exposed wallboards in specimen P3 began to be significantly higher than the analogous temperatures in specimen P1. This difference is much more pronounced at the higher positions, P3-HT1 vs. P1-HT1, see Figure 13a. This significant temperature increase could be attributed to the formation of cracks in specimen P3.
At the time of unloading specimen P1 (67th minute), the temperatures at the interface between the inner wallboards and the insulation were significantly lower. The temperature difference between the interface of the wallboards and insulation at the higher thermocouple position (P1-HT2 and P3-HT3, Figure 13a) was 321 °C. The temperature difference at the lower thermocouple positions (P1-LT2 and P3-LT3, Figure 13b) was even higher—467 °C. Comparing the temperatures recorded at the steel studs for the whole test period, it can be seen that the temperatures in specimen P3 remained below 100 °C at both the lower and higher positions (see Figure 13c,d). Comparing the hot flange temperatures at lower positions, the difference is 656 °C (Figure 13d) at the 67th minute of the test.

5. Conclusions

This paper presents the details of three fire tests conducted on a newly proposed composition for LSF wall systems using PUR foam in the cavities, with spacers separating the GFBs from the steel structure. Two specimens were identically sheathed with two A1 GFBs, while the third specimen were sheathed with two A2 GBFs and one outer A1 GFB. Based on the experimental results and discussion, the following conclusions can be drawn:
  • During testing, the integrity and insulating properties of the tested LSF panels were undisputed, and all test specimens showed indications of structural collapse. Nevertheless, a reliable mode of failure (governing the FRR criteria) cannot be specified because the insulation used is combustible and the tests were terminated before the failure criteria were reached.
  • Two 12.5 mm thick layers of A1 GBFs delayed the temperature rise in the steel bars by about 50 min (observed at lower positions of thermocouples) to 60 min (observed at higher position of thermocouples), while the configuration with two A2 GBFs and an outer A1 GFB caused an additional delay of 30 min.
  • Post-fire test observations showed that all three test specimens exhibited similar local buckling of the steel members in the lower segment near the rigid nodes.
  • The results obtained on two identical specimens under the same conditions demonstrate the need to perform a larger number of nominally identical tests, especially to broaden the basis for verification when fire behaviour modelling is used.
Since there are no data in the existing literature on the behaviour of LSF walls with combustible cavity insulation materials, the results presented in this study are valuable for future studies. Although combustible PUR insulation was used, the study showed promising results for the application of developed LSF panels in prefabricated and modular structures in both residential and commercial buildings where an FRR of more than 60 min is required. To comprehend the behaviour of LSF panels with PUR insulation in a fire situation, particularly with regard to their potential application in specific building types, it is crucial to investigate the potential release of toxic gases from the used PUR foam on the side exposed to the fire. Cost-optimal configuration of the wallboards should be established by further research, which could lead to testing of different types of wallboards with their different position in the cross section of the system, even introducing the possibility of an installation layer, which could enable reduction in penetrations through the system, easier airtightness barrier installation and easier detailing (regarding the fire resistance) of multiple panel connections—especially if the installation layer is filled with mineral wool or similar non-combustible insulation material.

Author Contributions

Conceptualization, M.J.R., D.S. and T.Š.; methodology, M.J.R., D.S. and T.Š.; formal analysis, M.J.R., D.S., B.M. and T.Š.; investigation, M.J.R., D.S., B.M. and T.Š.; writing—original draft preparation, D.S. and T.Š.; writing—review and editing, M.J.R., D.S. and B.M.; visualization, M.J.R., D.S. and B.M.; project administration, M.J.R.; funding acquisition, M.J.R. All authors have read and agreed to the published version of the manuscript.

Funding

This research was funded by the European Union through the European Regional Development Fund’s Competitiveness and Cohesion Operational Program, grant number KK.01.1.1.07.0060, project “Composite lightweight panel with integrated load-bearing structure (KLIK-PANEL)”.

Institutional Review Board Statement

Not applicable.

Informed Consent Statement

Not applicable.

Data Availability Statement

The data presented in this study are available on request from the corresponding author. The data are not publicly available due to privacy.

Conflicts of Interest

The authors declare no conflict of interest.

References

  1. Soares, N.; Santos, P.; Gervásio, H.; Costa, J.J.; da Silva, L.S. Energy efficiency and thermal performance of lightweight steel-framed (LSF) construction: A review. Renew. Sustain. Energy Rev. 2017, 78, 194–209. [Google Scholar] [CrossRef]
  2. Rodrigues, E.; Soares, N.; Fernandes, M.S.; Gaspar, A.R.; Gomes, Á.; Costa, J.J. An integrated energy performance-driven generative design methodology to foster modular lightweight steel framed dwellings in hot climates. Energy Sustain. Dev. 2018, 44, 21–36. [Google Scholar] [CrossRef]
  3. Jerónimo, R.; Gonçalves, M.; Furtado, C.; Rodrigues, K.; Ferreira, C.; Simões, N. Experimental Assessment and Validation of the Hygrothermal Behaviour of an Innovative Light Steel Frame (LSF) Wall Incorporating a Monitoring System. Buildings 2023, 13, 2509. [Google Scholar] [CrossRef]
  4. Ariyanayagam, A.D.; Mahendran, M. Experimental study of load-bearing cold-formed steel walls exposed to realistic design fires. J. Struct. Fire Eng. 2014, 5, 291–329. [Google Scholar] [CrossRef]
  5. Ariyanayagam, A.D.; Mahendran, M. Fire tests of non-load bearing light gauge steel frame walls lined with calcium silicate boards and gypsum plasterboards. Thin-Walled Struct. 2017, 115, 86–99. [Google Scholar] [CrossRef]
  6. EN 13501-2; Fire Classification of Construction Products and Building Elements—Part 2: Classification Using Data from Fire Resistance Tests, Excluding Ventilation Services. CEN The European Committee for Standardization: Brussels, Belgium, 2016.
  7. Wang, Y.; Burgess, I.; Wald, F.; Gillie, M. Performance-Based Fire Engineering of Structures; CRC Press: Boca Raton, FL, USA, 2012. [Google Scholar]
  8. Gunalan, S.; Kolarkar, P.; Mahendran, M. Experimental study of load bearing cold-formed steel wall systems under fire conditions. Thin-Walled Struct. 2013, 65, 72–92. [Google Scholar] [CrossRef]
  9. Kodur, V.K.R.; Sultan, M.A. Factors influencing fire resistance of load-bearing steel stud walls. Fire Technol. 2006, 42, 5–26. [Google Scholar] [CrossRef]
  10. Alves, M.H.; Constantini, G.; Ianni, A.; Kimura, E.F.A.; Meda, A.; Piloto, P.A.G. Fire performance of non-load-bearing double-stud light steel frame walls: Experimental tests, numerical simulation, and simplified method. Fire Mater. 2022, 46, 227–250. [Google Scholar] [CrossRef]
  11. Steau, E.; Mahendran, M. Elevated temperature thermal properties of fire protective boards and insulation materials for light steel frame systems. J. Build. Eng. 2021, 43, 102571. [Google Scholar] [CrossRef]
  12. Gnanachelvam, S.; Mahendran, M.; Ariyanayagam, A. Elevated temperature thermal properties of advanced materials used in LSF systems. Fire Mater. 2022, 46, 12–28. [Google Scholar] [CrossRef]
  13. Just, A.; Schmid, J.; König, J. Gypsum Plasterboards Used as Fire Protection—Analysis of a Database; SP Technical Research Institute of Sweden: Stockholm, Sweden, 2010; p. 30. [Google Scholar]
  14. Keerthan, P.; Mahendran, M. Thermal Performance of Composite Panels Under Fire Conditions Using Numerical Studies: Plasterboards, Rockwool, Glass Fibre and Cellulose Insulations. Fire Technol. 2013, 49, 329–356. [Google Scholar] [CrossRef]
  15. Santos, P.; Martins, C.; Simões da Silva, L. Thermal performance of lightweight steel- framed construction systems. Metall. Res. Technol. 2014, 111, 329–338. [Google Scholar] [CrossRef]
  16. Ariyanayagam, A.D.; Mahendran, M. Influence of cavity insulation on the fire resistance of light gauge steel framed walls. Constr. Build. Mater. 2019, 203, 687–710. [Google Scholar] [CrossRef]
  17. Ariyanayagam, A.D.; Mahendran, M. Fire performance of load bearing LSF wall systems made of low strength steel studs. Thin-Walled Struct. 2018, 130, 487–504. [Google Scholar] [CrossRef]
  18. Alfawakhiri, F.; Sultan, M.A. Fire Resistance of Loadbearing LSF Assemblies. In Proceedings of the International Specialty Conference on Cold-Formed Steel Structures: Recent Research and Developments in Cold-Formed Steel Design and Construction, St. Louis, MO, USA, 19–20 October 2000; University of Missouri—Rolla: Rolla, MO, USA, 2000; pp. 545–561. [Google Scholar]
  19. Tao, Y.; Mahendran, M. Fire tests and thermal analyses of LSF walls insulated with silica aerogel fibreglass blanket. Fire Saf. J. 2021, 122, 103352. [Google Scholar] [CrossRef]
  20. Perera, D.; Poologanathan, K.; Gillie, M.; Gatheeshgar, P.; Sherlock, P.; Nanayakkara SM, A.; Konthesingha, K.M. C Fire performance of cold, warm and hybrid LSF wall panels using numerical studies. Thin-Walled Struct. 2020, 157, 107109. [Google Scholar] [CrossRef]
  21. Gnanachelvam, S.; Ariyanayagam, A.; Mahendran, M. Fire resistance of LSF wall systems lined with different wallboards including bio-PCM mat. J. Build. Eng. 2020, 32, 101628. [Google Scholar] [CrossRef]
  22. Somarathna, H.M.C.C.; Raman, S.N.; Mohotti, D.; Mutalib, A.A.; Badri, K.H. The use of polyurethane for structural and infrastructural engineering applications: A state-of-the-art review. Constr. Build. Mater. 2018, 190, 995–1014. [Google Scholar] [CrossRef]
  23. Liu, X.; Hao, J.; Gaan, S. Recent studies on the decomposition and strategies of smoke and toxicity suppression for polyurethane based materials. RSC Adv. 2016, 6, 74742–74756. [Google Scholar] [CrossRef]
  24. Singh, H.; Jain, A.K. Ignition; combustion; toxicity, and fire retardancy of polyurethane foams: A comprehensive review. J. Appl. Polym. Sci. 2009, 111, 1115–1143. [Google Scholar] [CrossRef]
  25. Thomas McKenna, S.; Hull, T.R. The fire toxicity of polyurethane foams. Fire Sci. Rev. 2016, 5, 3. [Google Scholar] [CrossRef]
  26. Paabo, M.; Levin, B.C. A review of the literature on the gaseous products and toxicity generated from the pyrolysis and combustion of rigid polyurethane foams. Fire Mater. 1987, 11, 1–29. [Google Scholar] [CrossRef]
  27. Amado, J.C.Q. Thermal Resistance Properties of Polyurethanes and its Composites: A Short Review. J. Res. Updat. Polym. Sci. 2019, 66–84. [Google Scholar] [CrossRef]
  28. Günther, M.; Lorenzetti, A.; Schartel, B. From Cells to Residues: Flame-Retarded Rigid Polyurethane Foams. Combust. Sci. Technol. 2020, 192, 2209–2237. [Google Scholar] [CrossRef]
  29. Le Dréau, J.; Jensen, R.L.; Kolding, K. Thermal behaviour of a gypsum fibre board associated with rigid polyurethane foam under standard fire conditions. Energy Procedia 2015, 78, 2736–2741. [Google Scholar] [CrossRef]
  30. Rukavina, M.J.; Skejić, D.; Kralj, A.; Ščapec, T.; Milovanović, B. Development of Lightweight Steel Framed Construction Systems for Nearly-Zero Energy Buildings. Buildings 2022, 12, 929. [Google Scholar] [CrossRef]
  31. Fermacell ®. “Fermacell ® Gypsum Fibreboards Product Data Sheet, no. 5–6 October 2019. Available online: https://www.fermacell.co.uk/fermacellapi/downloads/file/en-GB/0690J000004BxHIQA0 (accessed on 20 September 2023).
  32. Fermacell ®. “Fermmacell Firepanel A1 Product Data Sheet. October 2019. Available online: https://www.fermacell.co.uk/fermacellapi/downloads/file/en-GB/0690J000004BxFgQAK (accessed on 20 September 2023).
  33. EN 1365-1; Fire Resistance Tests for Loadbearing Elements—Part 1: Walls. CEN The European Committee for Standardization: Brussels, Belgium, 2012; p. 25.
  34. EN 1363-1; Fire Resistance Tests—Part 1: General Requirements. CEN The European Committee for Standardization: Brussels, Belgium, 2020.
  35. Thomas, G. Thermal properties of gypsum plasterboard at high temperatures. Fire Mater. 2002, 26, 37–45. [Google Scholar] [CrossRef]
  36. Ang, C.N.; Wang, Y.C. Effect of moisture transfer on specific heat of gypsum plasterboard at high temperatures. Constr. Build. Mater. 2009, 23, 675–686. [Google Scholar] [CrossRef]
  37. Melcher, T.; Zinke, R.; Trott, M.; Krause, U. Experimental investigations on the repeatability of real scale fire tests. Fire Saf. J. 2016, 82, 101–114. [Google Scholar] [CrossRef]
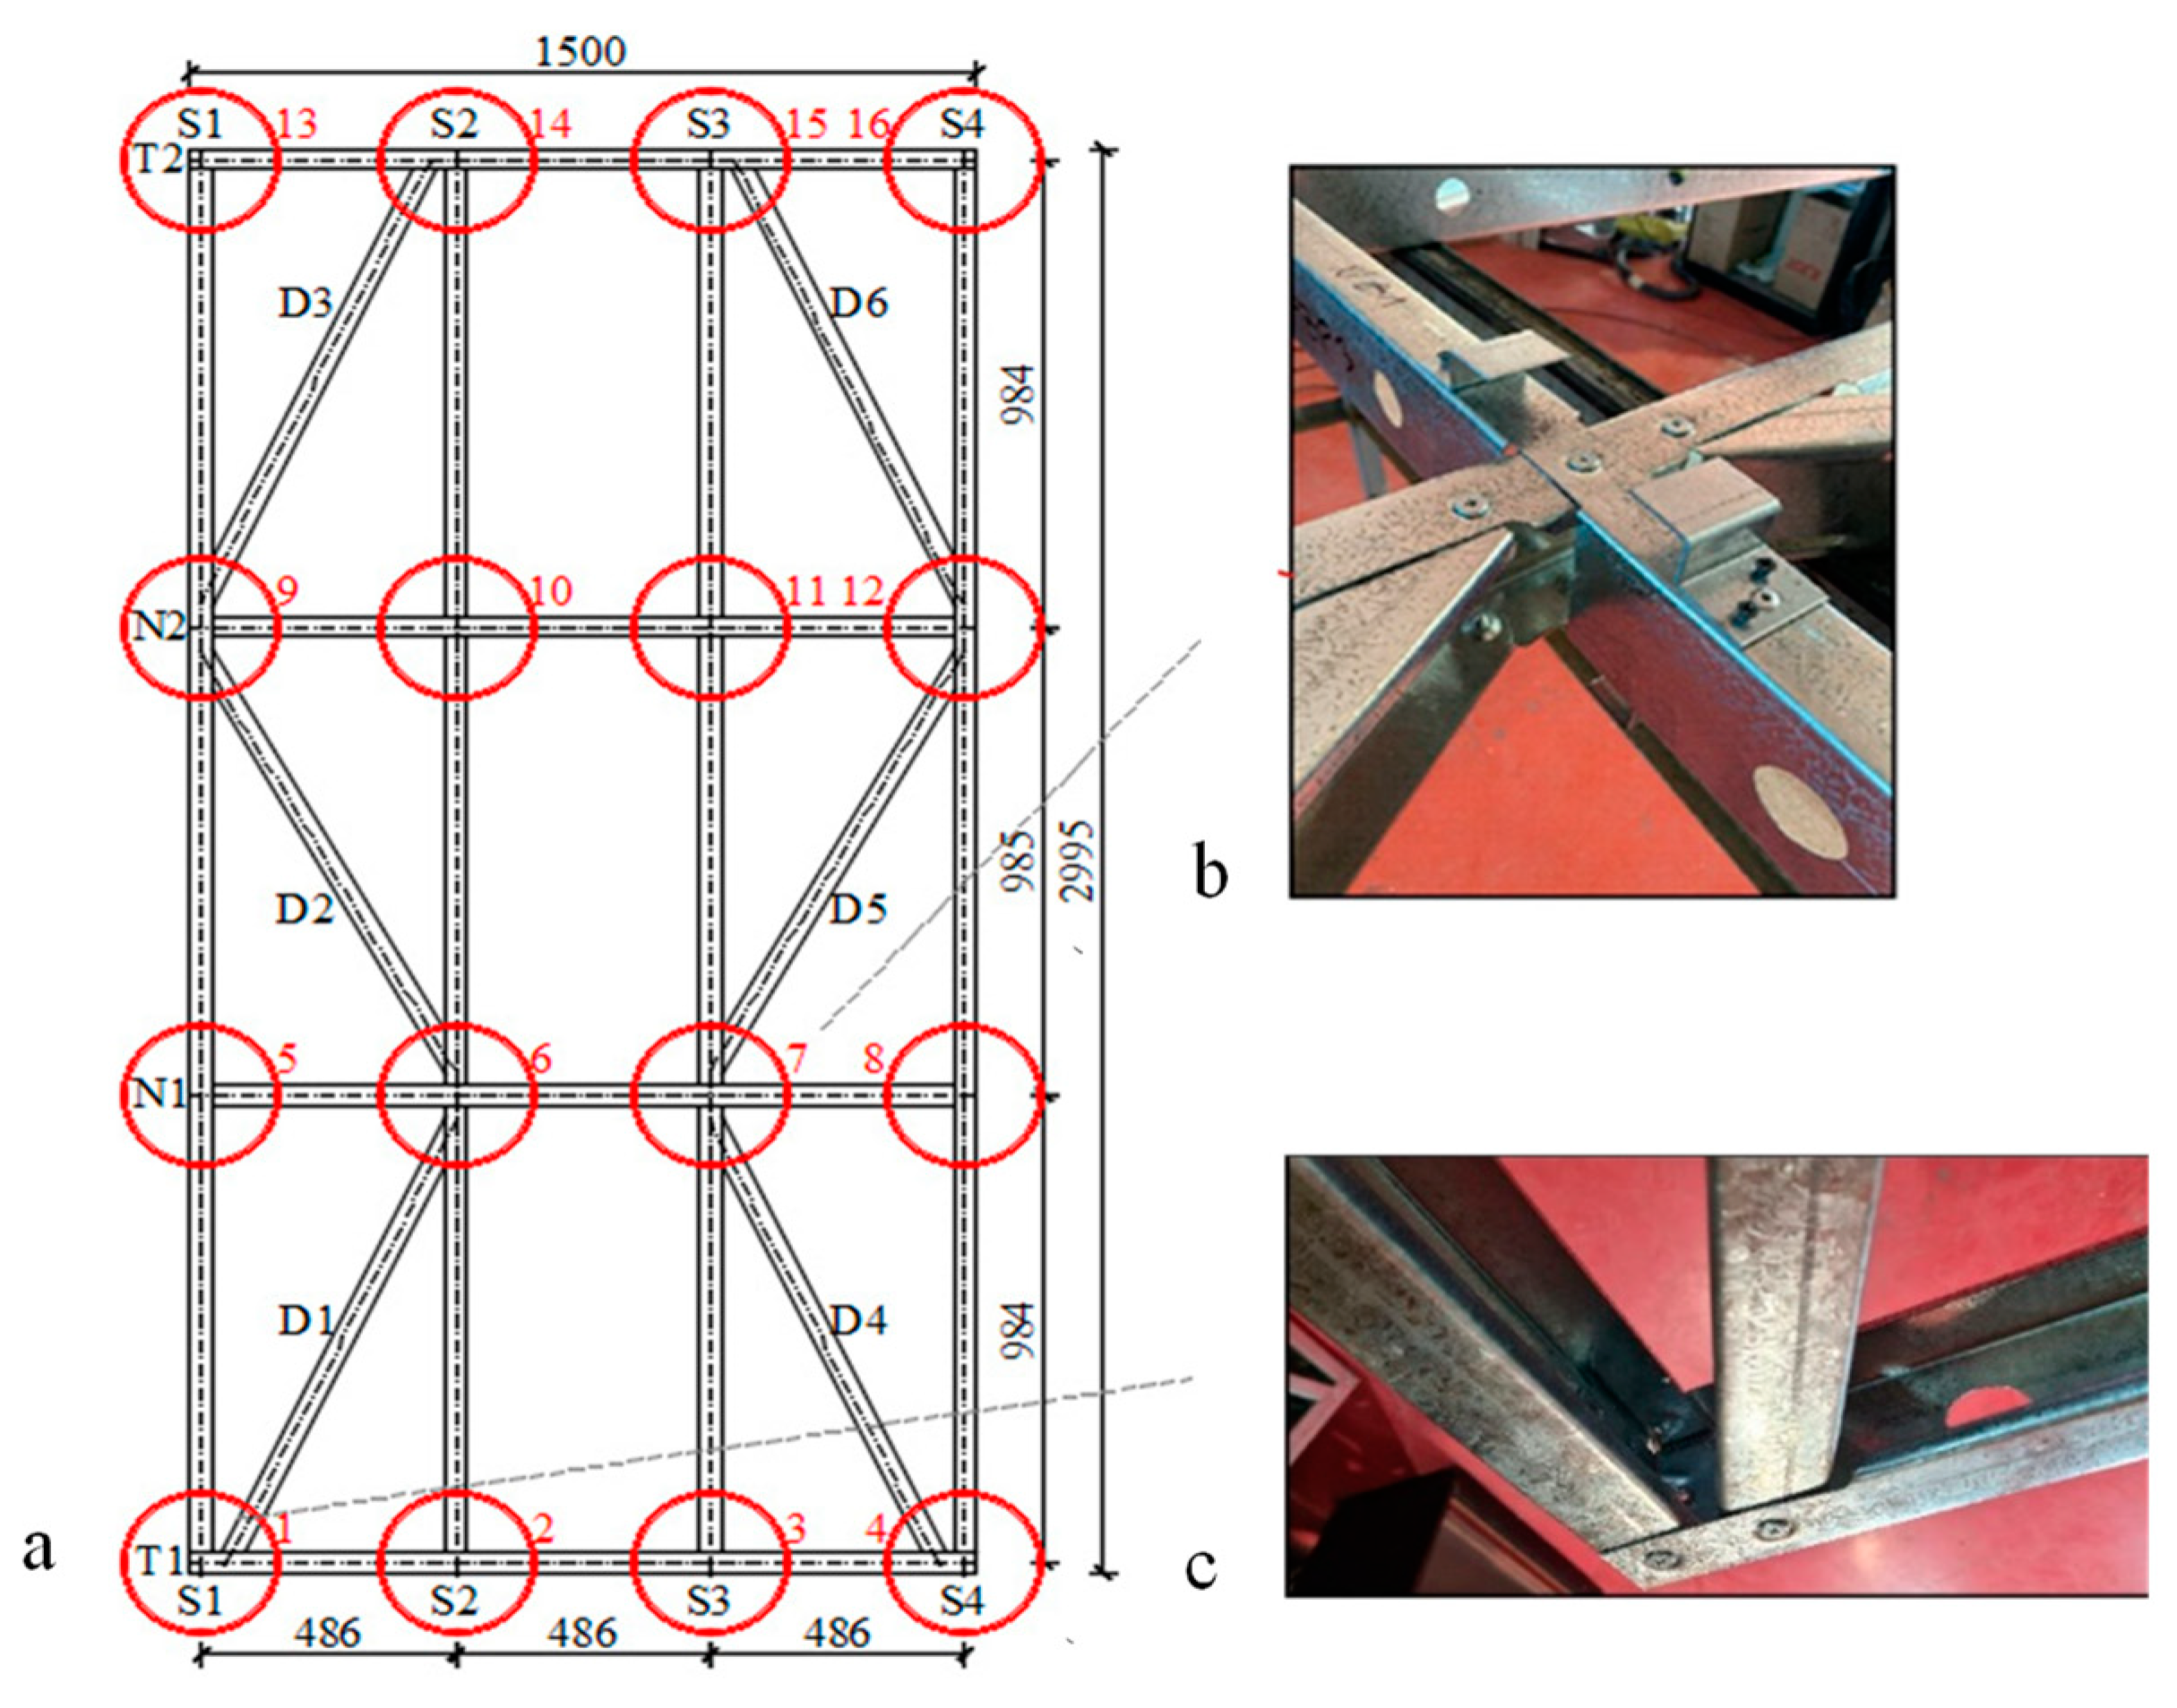
Figure 1. Layout of the LSF wall frame and characteristic connection details: (a) steel frame; (b) Z-shaped spacers near the node, (c) cut-out of the steel frame. Red circles numbered 1–16 indicate the 16 nodes formed in the steel frame.
Applsci 14 00637 g001
Figure 2. Wall configurations used in the fire tests: (a) Cross section of the double lined specimens (P1 and P2); (b) cross section of triple lined specimen (P3).
Applsci 14 00637 g002
Figure 3. GFB wallboard lining configuration. The red box indicates the wallboard configuration for double-lined, while blue box for triple-lied LSF walls.
Applsci 14 00637 g003
Figure 4. Thermocouple positions through the cross-sections of the specimens: (a) Front side of the test specimens; (b) cross-sections of specimens P1 and P2; (c) cross-section of specimen P3.
Applsci 14 00637 g004
Figure 5. Specimen set-up in the testing furnace.
Applsci 14 00637 g005
Figure 6. Fire test results for specimen P1: (a) average temperatures at high position (HTs); (b) average temperatures at low position (LTs); (c) temperature profiles at the unexposed side of the specimen; (d) average vertical displacement and displacement rate.
Applsci 14 00637 g006
Figure 7. Fire test results for specimen P2: (a) average temperatures at high positions (HTs); (b) average temperatures at low positions (LTs); (c) temperatures recorded at the unexposed side of the specimen; (d) average vertical displacement and displacement rate.
Applsci 14 00637 g007
Figure 8. Fire test results for specimen P3: (a) average temperatures at high positions (HTs), (b) average temperatures at low positions (LTs); (c) temperatures recorded at the unexposed side of the specimen; (d) average vertical displacement and displacement rate.
Applsci 14 00637 g008
Figure 9. Post test observations for specimen P2: (a) exposed side of upper part of test specimen; (b) exposed side of lower part of test specimen; (c) node 6; (d) node 7.
Applsci 14 00637 g009
Figure 10. Comparison between the measured (a) displacements and (b) displacement rates.
Applsci 14 00637 g010
Figure 11. Thermograms for specimen P1: (a) in the 67th minute; (b) in the 76th minute.
Applsci 14 00637 g011
Figure 12. Comparisons of time–temperature curves for specimens P1 and P2: (a) average time–temperature curves recorded at GBFs (higher positions—HTs); (b) average time–temperature curves recorded at GBFs (lower positions—LTs); (c) average time–temperature curves recorded on steel studs at higher positions (HTs); (d) average–time-temperature curves recorded on steel studs at lower positions (LTs).
Applsci 14 00637 g012
Figure 13. Time–temperature curves comparisons for specimen P1 and P3: (a) average time–temperature curves for higher positions (HTs); (b) average time–temperature curves for lower positions (LTs); (c) average time–temperature curves measured on the steel studs (HTs); (d) average time–temperature curves measured on steel studs (LTs).
Applsci 14 00637 g013
Disclaimer/Publisher’s Note: The statements, opinions and data contained in all publications are solely those of the individual author(s) and contributor(s) and not of MDPI and/or the editor(s). MDPI and/or the editor(s) disclaim responsibility for any injury to people or property resulting from any ideas, methods, instructions or products referred to in the content.