Article

Analysis of the Existing Air Emissions Detection Methods for Stationary Pollution Sources Monitoring

by
Alexandr Neftissov
1,
Andrii Biloshchytskyi
2,3,
Ilyas Kazambayev
1,*,
Lalita Kirichenko
1,*,
Ultuar Zhalmagambetova
4 and
Svitlana Biloshchytska
3,5
1
Research and Innovation Center “Industry 4.0”, Astana IT University, Astana 010000, Kazakhstan
2
Rectorate, Astana IT University, Astana 010000, Kazakhstan
3
Department of Information Technology, Kyiv National University of Construction and Architecture, 03680 Kyiv, Ukraine
4
Department of Electrical Engineering and Automation, Toraighyrov University, Pavlodar 140000, Kazakhstan
5
Department of Computational and Data Science, Astana IT University, Astana 010000, Kazakhstan
*
Authors to whom correspondence should be addressed.
Appl. Sci. 2024, 14(23), 10934; https://doi.org/10.3390/app142310934
Submission received: 30 August 2024 / Revised: 18 November 2024 / Accepted: 19 November 2024 / Published: 25 November 2024
(This article belongs to the Section Ecology Science and Engineering)

Abstract

:
The application of coal technologies for energy generation leads to high pollutant emissions. Thus, governmental and international organizations have created new programs and laws for monitoring emissions. Recently, the government of Kazakhstan has introduced regulations for the measurement of emissions produced by factories and power plants. However, the requirements and Corecommendations for the monitoring methods have not been defined. Therefore, this article addresses the problem and focuses on determining the measurement errors made by optical SGK510 and electrochemical POLAR devices used for coal power plants. The hypothesis is based on the fact that there are currently no systems for monitoring probe drying, and its implementation is expensive. The main methods are analyzed, namely their operation, taking into account the presence of water particles in samples, and the possibility of using adjustment coefficients is considered. The main pollutants chosen for analysis are CO, NO, NO2, NOx, SO2, and O2. Using the Broich–Pagan test, homoscedasticity was determined, and the Fisher test showed the possibility of using tuning coefficients. The data for the optical method were compared to measurements taken using Inspector 500. The error for SO2 determination was 7.19% for NO, 44.0985% for NO2, 733.26% for NOx, 7.39% for O2, 2.75% for CO, 60.81%. The comparison between SGK510 and POLAR demonstrated the following errors: for CO—1.5%, for NOx—82.4405%, for SO2—41.17%, for O2—11.61%. According to the Fisher criteria analysis of the optical method, only SO2 and CO values measured by SGK510 in comparison to Inspector 500 had close similarity, while others demonstrated high deviations. The significance tests were carried out by Fisher’s, t-test, and ANOVA methods. For the electrochemical measurement, only CO values had close similarity. In the future, methods will be proposed to improve the accuracy of the system while reducing maintenance costs, as well as cleaning sampling systems. The multicomponent analysis application for accuracy improvement with the exhaust gas humidity, temperature, and flow consideration was recommended as a possible solution.

1. Introduction

Environmental pollution is an urgent problem of the present time, which has an increasingly negative impact on public health [1], climate change [2], and changes in entire ecosystems [3]. The international community is actively involved in the development of programs and initiatives aimed at mitigating the consequences of this negative impact. Such initiatives include the Paris Agreement (2015) [4], the UN Program for Sustainable Development until 2030 [5], and the European Green Deal [6]. Currently, two of the main approaches to regulating air quality is legislation and international standards. For example, the Clean Air Act [7] from the United States Environmental Protection Agency specified pollutants such as sulfur dioxide (SO2), carbon monoxide (CO), lead (Pb), particulate matter (PM2.5, PM10), as well as ozone concentration (O3). In the case of the European EUR-Lex agreement [8], the main indicators that need to be monitored are PM10, PM2.5, NO2, and O3, as well as the Gtenbursky ones [9]. Components such as SO2 and nitrogen oxides (NOx) are distinguished, as are the volatility of an organic compound from the methane content (NMLOC), PM10, and ammiak (NH3), for example, in international standards, in accordance with ISO 14001:2015 [10], ISO 12039:2001 [11], ISO 10473 [12] general requirements and rules for the use of defenders. However, these standards and legislation are not able to take into account all the features of air quality change conditions in various countries, in our case in the Republic of Kazakhstan. As noted in the document, as part of the Strategy to Achieve Carbon Neutrality of the Republic of Kazakhstan until 2060 (approved by Decree of the President of the Republic of Kazakhstan dated 2 February 2023 No. 121 [13]), large factories, boiler houses, and industrial enterprises monitor emissions into the environment by installing automatic monitoring systems. Even taking into account the peculiarities of the geography, industry, and economy of a given state, the effectiveness of laws and standards is achieved only with the accurate and reliable operation of the monitoring system. Moreover, there are many standards that define the most appropriate measurement methods [14,15]. However, there is a problem of uncertainty regarding a specific measurement method with sufficient accuracy within the framework of regulations on measuring the concentration of components at industrial facilities in Kazakhstan [16]. That is why the key task is to choose an accurate measurement method, which is also regulated by law.
Currently, considering the information noted in the standards, there are common methods such as electrochemical [17,18], gas chromatography [19,20,21], mass spectrometry [22,23,24], as well as optical, which is also divided by the frequency on infrared [25,26,27] and ultraviolet spectroscopy [28,29]. One of the most common methods is electrochemical due to its ease of use. The study in [30] proposes a new type of electrolyte for an electrochemical sensor for hydrogen sulfide (H2S) detection. Monoethanolamine (MEA) was added to the ionic liquid electrolyte [C3OHmim]BF4, which increased the absorption capacity of H2S. It should be noted that the developed sensor is suitable for detecting only the mentioned component and does not react to CO2 and SO2. On the other hand, the article [31] proposes electrochemical sensor optimization for the detection of SO2 by creating electrode structures with triple and quadruple phase boundaries. An electrochemical gas sensor in [32], based on epitaxial graphene, was developed to detect nitrogen dioxide (NO2). The authors note that the optimal operation of the sensor is achieved at a temperature of 150 °C, which is not suitable for use under normal conditions. The study in [33] uses polyaniline (PANI) as an electrochemical sensing material for measuring SO2. The suggested material can be produced for microconducting matrices. In addition, it is proposed to combine the method of dehydration of the interface and the method of creating capillary bridges from a liquid film. However, it should be noted that the accuracy and sensitivity of the sensor based on the PANI material depends on the structure of the matrix, as well as on humidity and ambient temperature. The effect of a solvent in the manufacture of gas sensors for the detection of HS is demonstrated in [34]. The authors of the article suggest using dimethyl sulfoxide as a safer option instead of dimethylformamide. At the same time, sensors made with dimethyl sulfoxide may have problems with long-term stability. In general, electro-chemical sensors have gained great popularity due to their rather high sensitivity and low cost. However, this type of electrochemical sensor can be affected by other gases, humidity, and temperature.
Another popular method that is used to measure emissions into the environment is gas chromatography [35], which implies the application of SO2 diffusion coefficients, which are determined using Reversed-Flow Inverse Gas Chromatography. This method of setting can be used not only for the mentioned component but also for others, for example to determine nitrous oxide (H2S) [36]. On the other hand, in the study in [37] within the framework of gas chromatography, a concept was developed that uses the technology of chemical ionization of a barrier discharge detector. The main disadvantage of the gas chromatography method is the high cost of equipment necessary for conducting research. There are studies suggesting combining the methods of gas chromatography and mass spectrometry in determining the concentration of gases [38]. In [39], the low-pressure gas chromatography (GC) method was proposed in combination with chemical ionization mass spectrometry (CIMS). The mass spectrometry method itself is based on the ionization of sample molecules and the separation of these ions by their masses and charges in an electric or magnetic field [40]. The application of the method of mass spectrometry with chemical ionization in a stream of selected ions (SIFT-MS) was proposed in [41]. The SIFT-MS method is based on the reaction of ions in a special tube filled with an inert gas (helium or nitrogen), and H3O+, NO+, and O2+ ions are used to reduce the fragmentation of target molecules. The authors noted the influence of the tube temperature on the data results. In total, it should also be noted that the application of the mass spectrometry method requires complex and expensive equipment.
On the other hand, another type of optical measurement also became very common [42]. For example, a remote method was developed that uses UV in the study [43] and cameras that track the intensity of UV radiation absorption by SO2 gas in ship exhausts. The results of the experiment showed an accuracy level of 95.918%. Another study [44] suggests a NO2 detection sensor that uses the technology of functionalization of submicron gallium nitride wire with titanium dioxide nanoclusters to improve the properties of the wire by applying titanium dioxide nanoclusters to it. However, this sensor shows the best results only at a temperature of 20°C. In comparison, infrared devices for monitoring nitrous oxide (N2O) concentration was developed in [45]. The principle is based on the use of infrared spectroscopy with hollow waveguides (iHWG) and the preliminary concentration of samples. However, spectral interference from CO2 may be a limitation of the method’s application. The study in [46] suggests a sensor for detecting NO2. The device consists of a pyroelectric detector with a carbon black layer, an MEMC emitter of infrared radiation, and an optical camera. Much attention in the research is paid to signal filtering and error compensation algorithms. In addition, the Bera–Lambert equation was used as part of the calibration. The effects on measurement results from temperature and humidity should be considered during the optical analyzers’ use.
According to the literature analysis, these methods have demonstrated high measurement accuracy. However, measurements were carried out for a maximum of three components, which is not sufficient within the framework of the requirements in the Republic of Kazakhstan regulatory acts. And the use of combined emission monitoring systems, which use several of the above methods, turn out to be too expensive to use and maintain. Optical and electrochemical methods are the simplest in execution and do not require complex and expensive equipment. Considering this fact, as well as the fact that stationary methods are less time-consuming, electrochemical and optical methods are currently the most popular. They also show good accuracy results. However, such accuracy in practice is not always achievable due to the presence of various external factors that are absent in laboratory studies, therefore, they must be carefully monitored and eliminated, or their impact on indicators must be taken into account in some way.
Taking into account the practical experience of enterprises, as well as the presence of comments from the environmental inspectorate on the accuracy of emission readings, one of the factors that introduces significant errors may be the presence of moisture in the exhaust gas filters. For this reason, dehumidification units are often used. However, the operation of these modules is not controlled and is too primitive. Consequently, the accuracy of such sensors may be reduced due to the lack of control over the drying process of the sample. Moreover, in this case, the implementation of such systems or the replacement of existing measuring systems can be expensive. For this reason, an analysis of existing solutions is necessary. The purpose of this study is to determine not only the accuracy of measurement by optical and electrochemical methods, but also the possibility of introducing correction factors in the presence of humidity in the exhaust gas sample. This study is a continuation of the studies in [47,48].

2. Materials and Methods

The hypothesis of this work is based on the introduction of errors in determining the components’ concentration in the exhaust gas due to the water particles’ presence. The hypothesis verification is primarily carried out by determining the nature of the phenomenon. First of all, the humidity of the exhaust gases is determined by the filtration process using irrigation. Currently, the most common device for this purpose is the second-generation emulsifier battery (Figure 1) [49]. The installation is used for ash cleaning and the absorption of particulate matters on the heat power plants and state district power stations.
The technological process can be described as follows. Exhaust gas is supplied to the inlet pipe (IP). Then, along the bottom of the installation with the body (B) it enters the swirler (S), where the gas is mixed with water coming from the irrigation collector unit (CIU) through water distribution pipes (WDP) and the cups (WDC). As a result, heavy particles and components settle in the water and drain back into the body. Then, the remaining heavy components are filtered using the jackhammer ring (JR) and the exhaust gas exits through the outlet pipe (OP). Thus, the water particle appears during the filtration process.
The emulsifier allows exhaust gases to be cleaned with an efficiency of 99%. The technological process, on the one hand, is very simple. On the other hand, the filtering process is not monitored or controlled. In addition, the application of water as the absorber increases humidity. Considering the above, the evaluation of the measured values of the traditional stationary automated monitoring system (AMS (Automated Monitoring System)) was carried out using a reference device for measuring dried exhaust gas samples. In addition, all measurements were done in the ppm units. The data presented by the company Promanalyt were transformed to mg/m3 according to the [11], and devices used methods for calibration from [50] and the reference oxygen concentration was considered equal to 6% [49].

2.1. Optical Method for Exhaust Gases Content Determination

Currently, optical devices play an important role in measurement technology. Moreover, regardless of the purpose, all methods have fundamental principles on which measurement is based.
The technology of optical measurement sensors is to generate light radiation for measurement by passing through the gas environment. As a result, the optical output signal is sent to the photodetector. Then, the optical signal is converted into an electrical one, which, after amplification, enters the microprocessor (Figure 2).
Moreover, the principle itself for any type of optical measurement is determined by a general mathematical description. First of all, the light wave is described by the main parameters [51]:
× E = μ c d H d t
where E is the vector electrical field intensity; H is the vector magnetic field intensity; μ is the resulting magnetic permeability; c is light speed.
Therefore, the properties of the light wave can be considered based on electrical field intensity [51]:
E ( r , t ) = E 0 e i ( u · r ω t ) ,
where u is the distribution coefficient; E0 is the electrical field intensity in the initial coordinates; r is the coordinates vector; ω is cyclic frequency; t is time.
Moreover, the resulting signal on the photosensitive element is determined as the sum of the electrical field intensities of different frequencies, therefore, (2) is transformed [52]:
E ( r , t ) = κ = 1 n E κ 0 e i ( u r κ ω t ) ,
where κ is the harmonic number, and n is the amount of harmonics.
It is worth noting that, in this case, the measurement should be carried out in a vacuum, but in an inhomogeneous environment, which consists of small regions with a predominance of a certain component of the exhaust gas, and for each of them the electrical field intensity is represented as [52]:
E κ i 0 ( ω ) = E κ 0 ε i ( ω ) ,
where i is the number of the area with the predominance of a certain exhaust gas component, ε i ( ω ) is the dielectric constant of the region.
Considering (4), Equation (3) can be represented as a sum of intensities in various areas [52]:
E ( r , t ) = κ = 1 n E κ 10 ( ω ) e i ( u r κ ω t ) + + κ = 1 n E κ p 0 ( ω ) e i ( u r κ ω t ) + κ = 1 n E κ o 0 ( ω ) e i ( u r κ ω t ) ,
where p is the final number of the area with the predominance of a certain component of the processed gas, and E κ o 0 ( ω ) is the electrical intensity of the light wave incident on the photosensitive element.
Otherwise, (5) can be written as
E ( r , t ) = κ = 1 n i = 1 p E κ i 0 ( ω ) e i ( u r κ ω t ) + κ = 1 n E κ o 0 ( ω ) e i ( u r κ ω t ) .
As a result, the intensity of the light wave incident on the photographic matrix from (6) can be written as [53]:
κ = 1 n E κ o 0 ( ω ) e i ( u r κ ω t ) = E ( r , t ) κ = 1 n i = 1 p E κ i 0 ( ω ) e i ( u r κ ω t ) .
In this case, the photomatrix perceives information mainly in the form of a scalar intensity value, and therefore,
I κ o 0 = n ι ( ω ) ε 0 c 2 | E κ o 0 | 2 ,
where n ι ( ω ) is the refractive index of the area.
A comparison is then carried out in the measuring device, because of which the concentration of gases is determined and based on the proportional law [52]:
T = I κ o 0 I r e f ,
where I0 is reference intensity.
Therefore, the influence of exhaust gas humidity is possible using standard statistical methods of evaluation processing.
The measurement of pollution gas components by a direct measurement method is not possible. Therefore, the entire determination process can be divided into several stages: primary measurement, data filtering, pre-formation, and statistical analysis (Figure 3). Primary measurement consists of obtaining data in the form of an electrical signal. Moreover, for optical and electrochemical methods, the output is current or voltage.
Data filtering is necessary to eliminate values with interference and high deviations due to limitations of computing devices. Then, the data are processed using well-known mathematical models. In order to obtain accurate values and to build trends, standard statistical analysis methods are used.
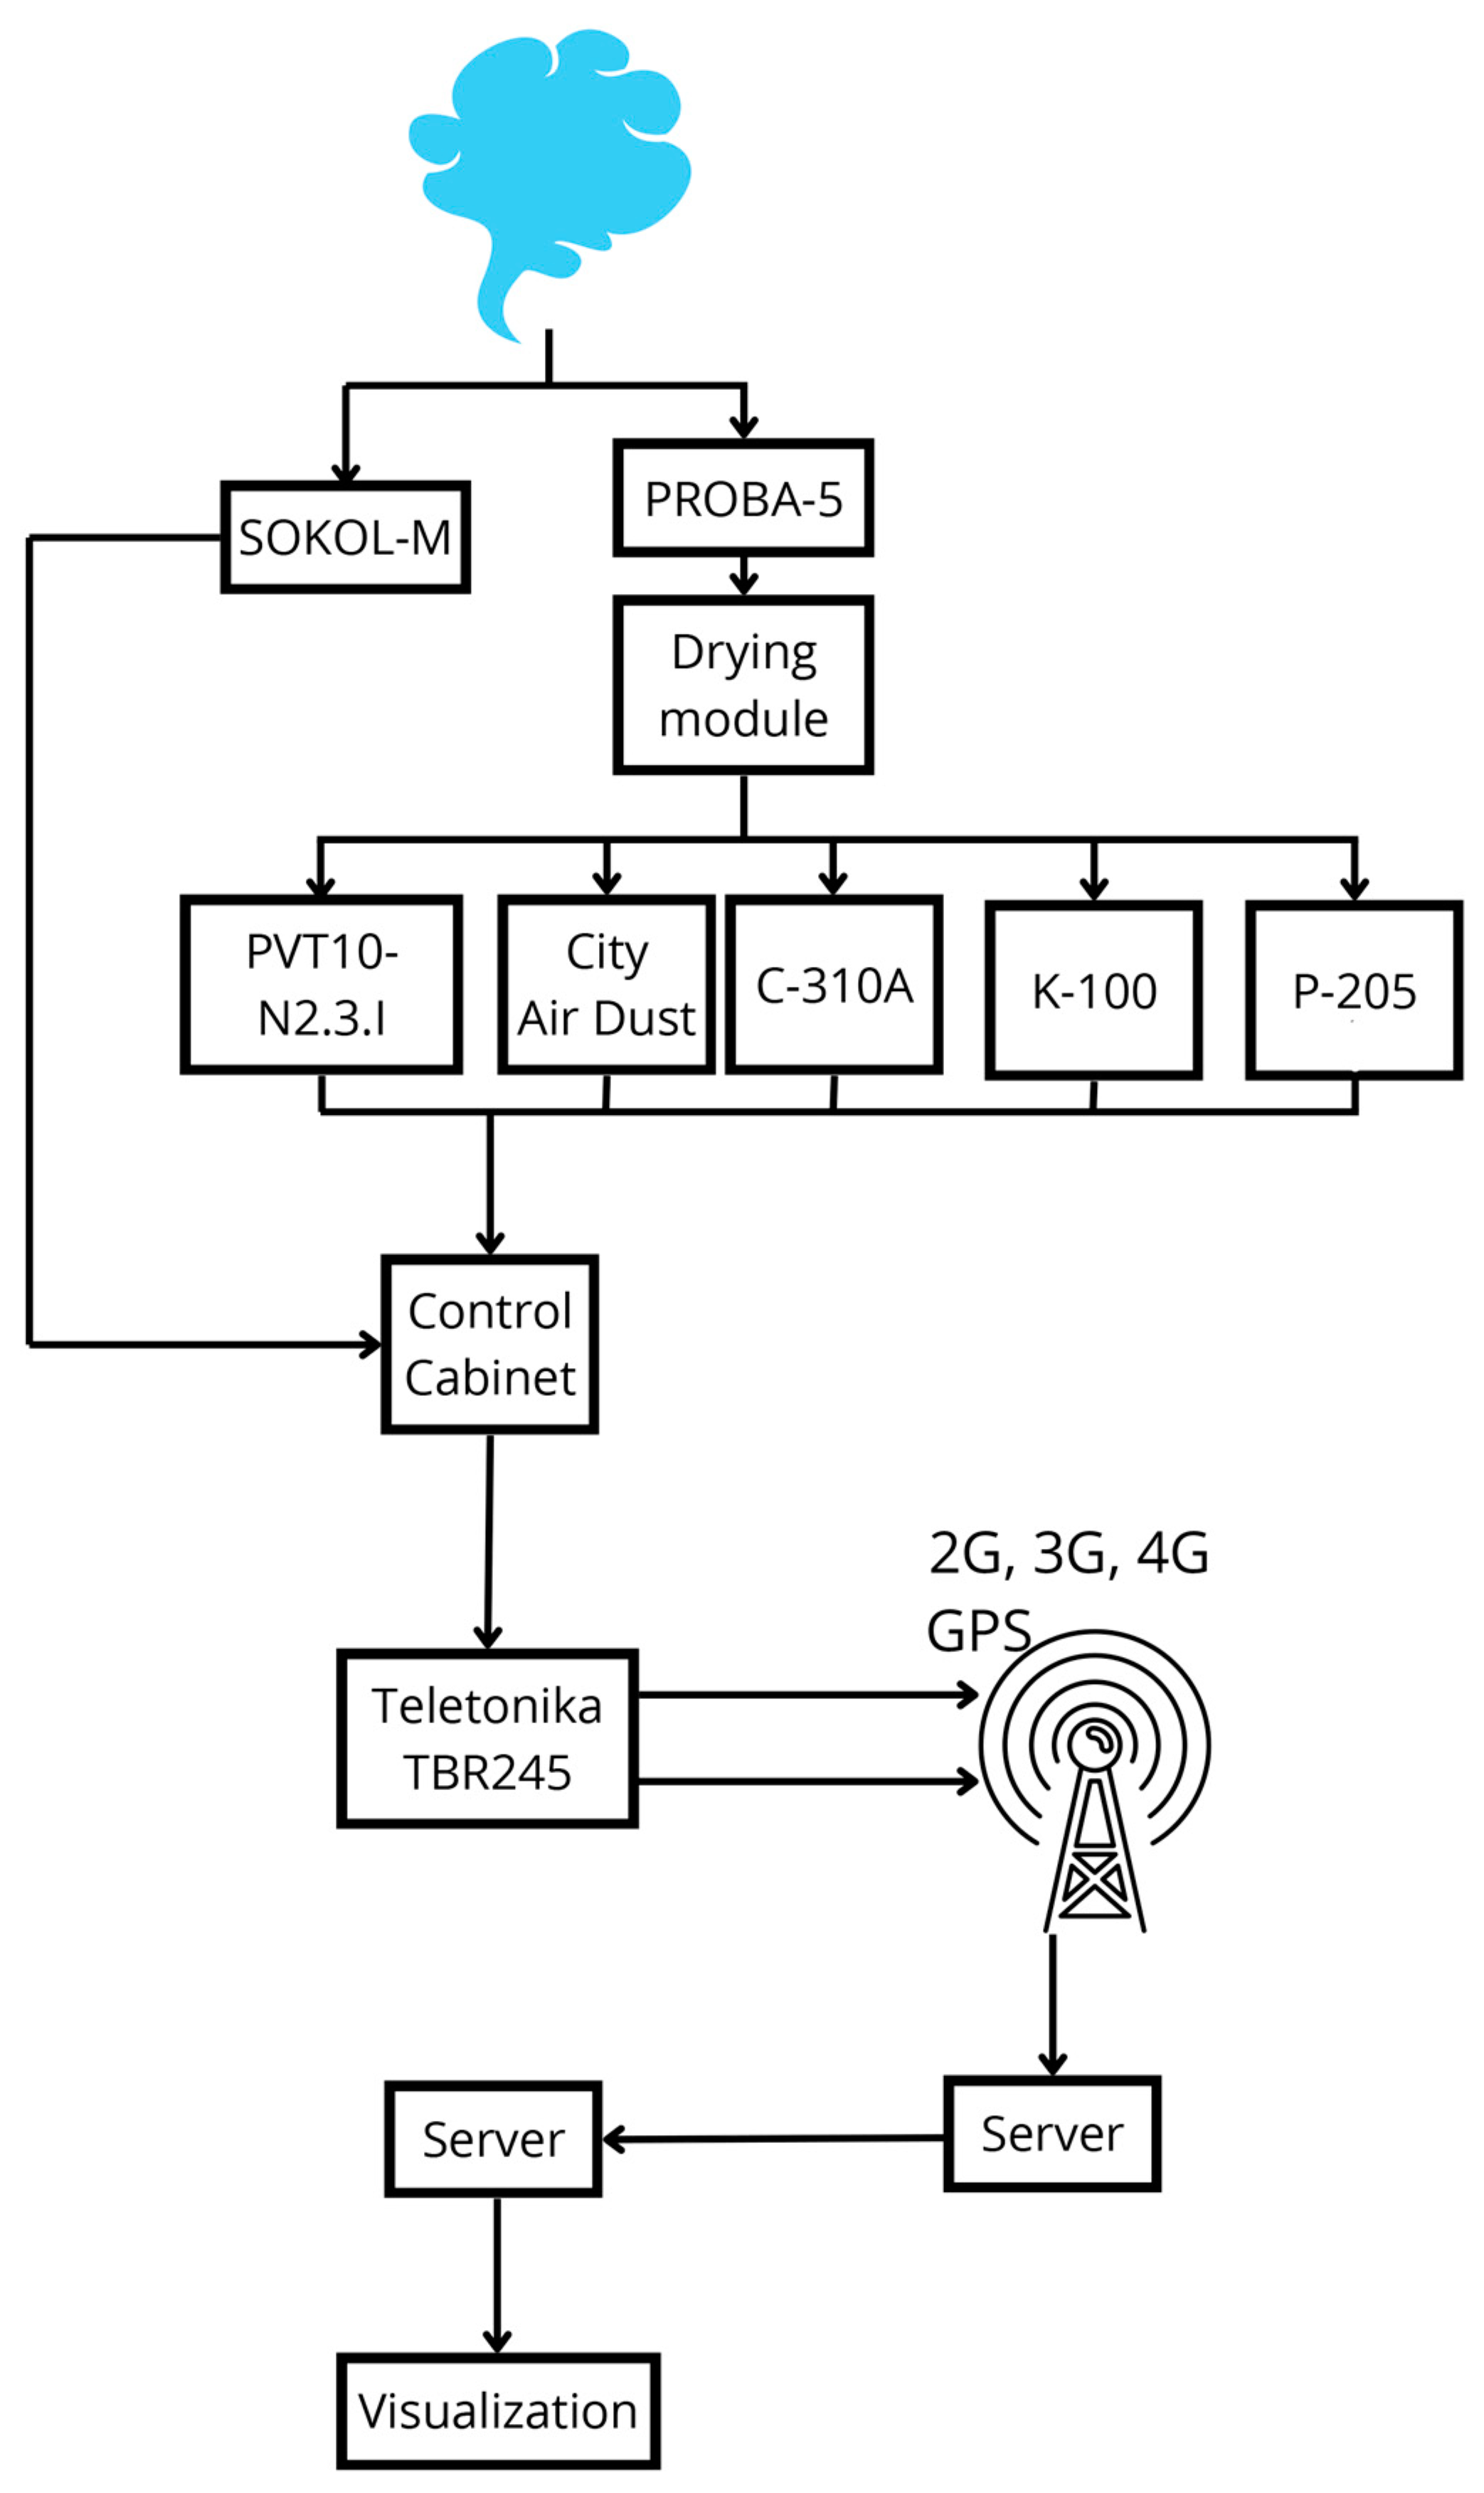
For the above-mentioned purposes, the AMS Solar SGK 510 is considered in this work (Figure 4) [54].
The system includes a SOKOL-M weather station device for obtaining data on measurement conditions. The sampling zone “PROBA-5” (NIKI MLT, St Petersburg, Russia) collects the exhaust gas. The concentration of gases is then determined using devices such as C-310A (Optek, St Petersburg, Russia) for SO2, K-100 (Optek, St Petersburg, Russia) for CO and O2, P-205 (Optek, St Petersburg, Russia) for NO2, NO, NOx, and PVT10-N2.3.I (OWEN, St Petersburg, Russia). The measurements are then sent to the control cabinet for data filtration and conversion. In turn, the output data from the control cabinet using Teltonika TRB245 (Teletonika Networks, Vilniaus, Lithuania) are transmitted wirelessly to the server for data processing, statistical analysis, and further visualization.
The use of the SOKOL-M weather station is necessary for measurement accuracy, since changes in parameters such as temperature, velocity, and pressure have a strong effect on the physical parameters of the gas, and therefore on the concentration measurement process. Moreover, the PROBA-5 has five channels, and therefore allows measurements to be taken with five different devices. In addition, from PROBA-5 the gas is dried inside the preparation module (Drying Module). Then, from the five channels of the module, the sample is distributed to gas analyzers, which measure the concentration of various components. The control cabinet is necessary not only for data collection and distribution, but also for device calibration. The server is used for storing and processing big data, since standard controllers do not have enough for this task.
It is worth noting that the main disadvantage of using stationary gas analysis systems is their vulnerability to the clogging of the tubes, as well as the device itself, unlike portable ones. Moreover, both types of device must be controlled using additional cylinders with calibration gases.
In order to accurately determine the disadvantages of these methods and how much the effect of humidity on the concentration of components is, it is worth noting that since the drying process of the sample is uncontrolled, it is difficult to assess the operation of the system. In the case of the convergence of two samples, it is possible to increase accuracy using a linear coefficient.
The analysis was carried out using a portable measuring device, Inspector 500, suggested by Promanalyt for several components, documents on which are supplied in the Supplementary Materials.
Furthermore, the measurement values will be recorded for both the AMS and the portable Inspector 500 equipment, which measures the drained sample. The device can measure the concentration of six components, which are SO2, NO, NO2, NOx, CO, and O2.

2.2. Electrochemical Method for Exhaust Gases’ Content Determination

Unlike the optical measurement method, the electrochemical method mainly uses the electric potential of the arc created in the chamber (Figure 5).
Technologically, the gas is injected into the gas analyzer chamber, where the negative and positive electrodes create a discharge. As a result, the concentration of the gas component is determined by the obtained discharge parameters. Moreover, both current and voltage can be considered, since, in general, the mathematical model is reduced to calculating potentials.
First of all, it is necessary to consider the dependence of the potential for a small area with a predominance of a certain component on the electrical field intensity [52]:
φ = j 1 ε j r j + 1 r j E κ ( r , t ) d r ,
where r is the unit distance vector, j is the area number, r j is the coordinates of the j-th charge.
Given that the regions are significantly small and the integral for them is approximately equal, (10) can be written as
φ = j 1 ε j φ .
Moreover, the measurement is mainly carried out based on voltage. Therefore, it can be carried out through the difference between the initial potential and the sum of all other potentials [52]:
u ( t ) = φ 0 j = 1 l φ j = φ 0 φ j = 1 l ε j ,
where l is the number of small areas.
Considering (3), (4), and (10), Equation (11) can be written as follows:
u ( t ) = r p r 1 ( E ( r , t ) κ = 1 n l = 1 l E κ l 0 ( ω ) e i ( u r κ ω t ) ) d r .
The current measurement is determined by the following expression
i ( t ) = u ( t ) R ( t , ρ , Τ ) ,
where ρ is the density of the gas, and T is the temperature of the gas.
As a result of the presence of water particles in the exhaust gas, measurements by this method are most affected, leading to an increase in errors.
The measurement was controlled by the instrument POLAR [55]. The device is suitable for working in the range of the temperatures from minus 40 to plus 45 degrees Celsius. The instrument can also measure the concentration of more than six gases at the same time.
POLAR also has a measurement recording function, which allows the gained values to be analyzed throughout the process. In addition, the instrument allows the O2, CO, CO2, NO, NO2, NOx, SO2, H2S, NH3, and CH concentrations to be measured.
In this case, statistical methods of processing readings will also be used.

3. The Results of the Statistical Analysis of the Work of the Optical and Electrochemical Methods

According to the existing requirements [13], AMSs should be able to simultaneously measure the main pollution markers. Moreover, the main markers are concentrations of SO2, NO, NO2, NOx, CO, and O2. The comparison is carried out in two different conditions for optical and electrochemical instruments.

3.1. Analysis of the Optical Method for Measuring the Concentration of Exhaust Gas

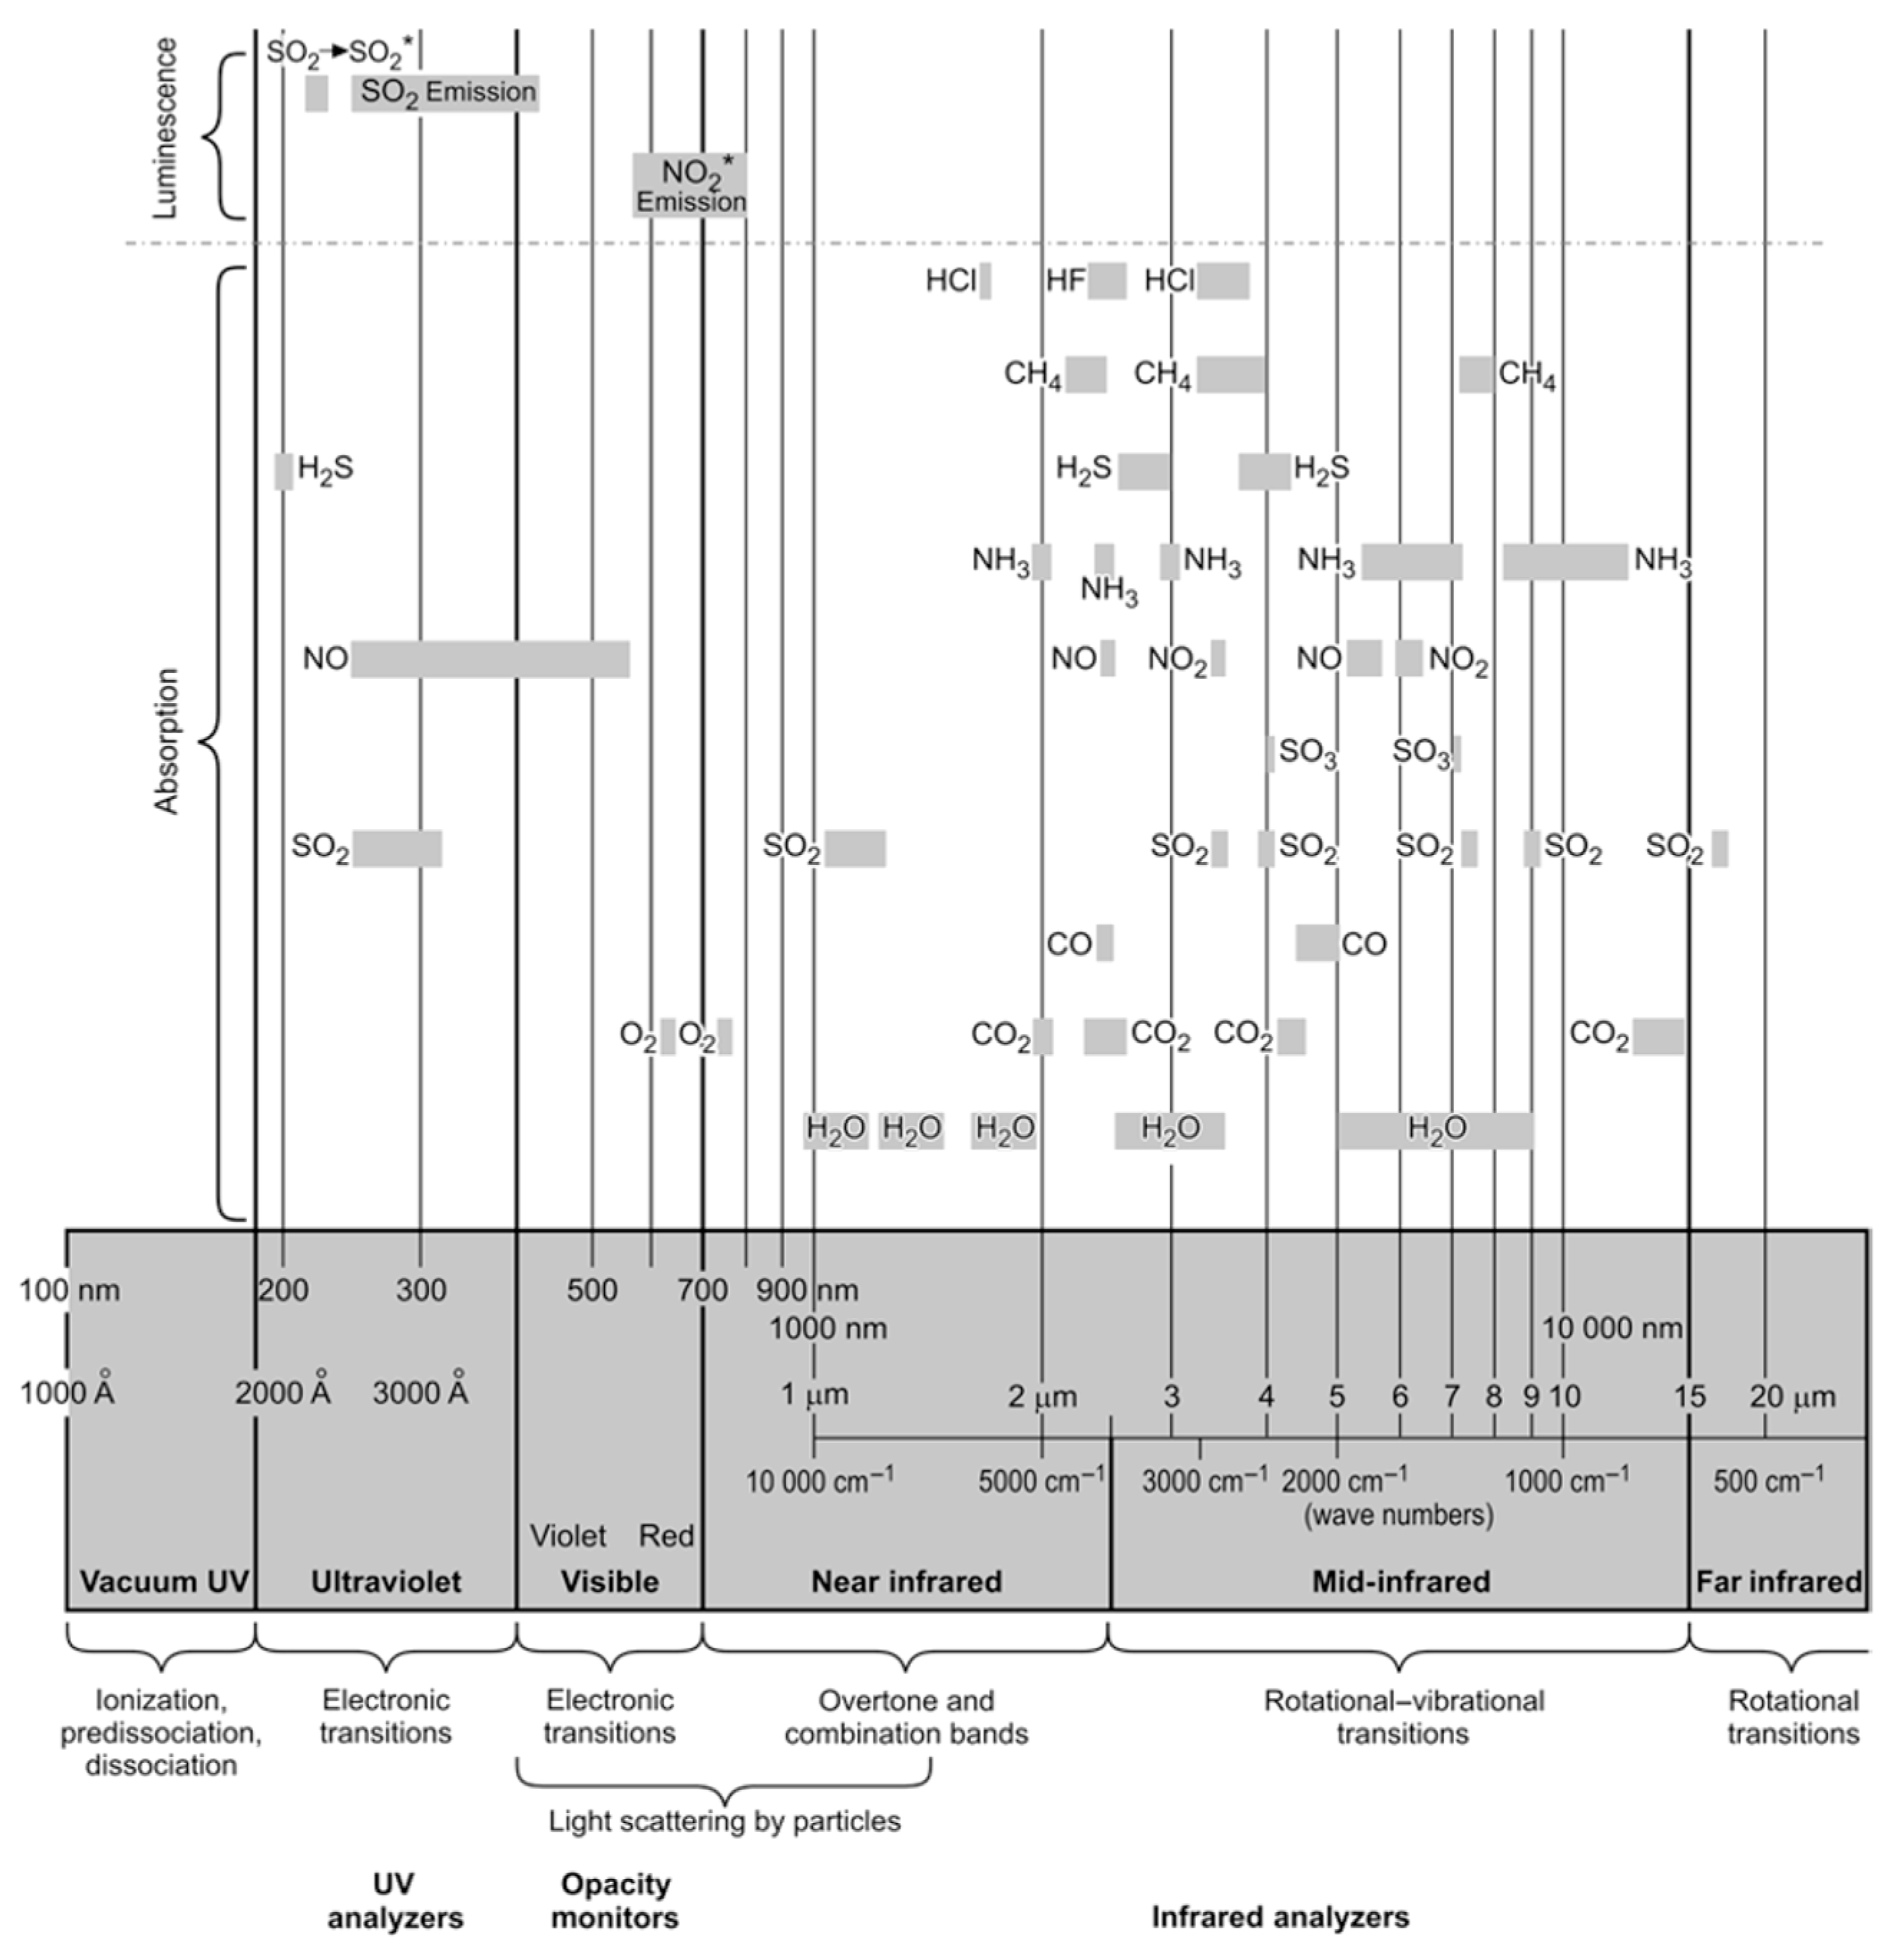
According to the existing knowledge of optical methods, different spectra of several wavelengths are used to measure gas components. In [53], it is indicated in which frequency ranges absorption and luminescence are carried out (Figure 6).
Therefore, from the known data, it can be noted that the main part of the absorbed energy of SO2 is superimposed with the absorption spectrum of NO in the ultraviolet range. Moreover, it is also superimposed on the absorption spectrum of water particles in the entire range. On the other hand, in the inter-infrared and far-infrared ranges, the change is influenced by the measurement of NO and NO2. On the other hand, during luminescence, the spectra of SO2 and NO2 do not overlap. However, if there is a high concentration of nitric oxide in the gas, the measurement may also have a large error.
In turn, to determine the influence exerted on the measurement, it is worth noting that an analysis of the spectral pattern of absorption frequencies by light radiation elements is necessary. The measured values from two different measurement systems were presented in Table 1 for SO2, NO, and NO2, and in Table 2 for NOx, O2, and CO. Moreover, the measurements transformation was conducted by considering the reference O2 content equal to 6% [49].
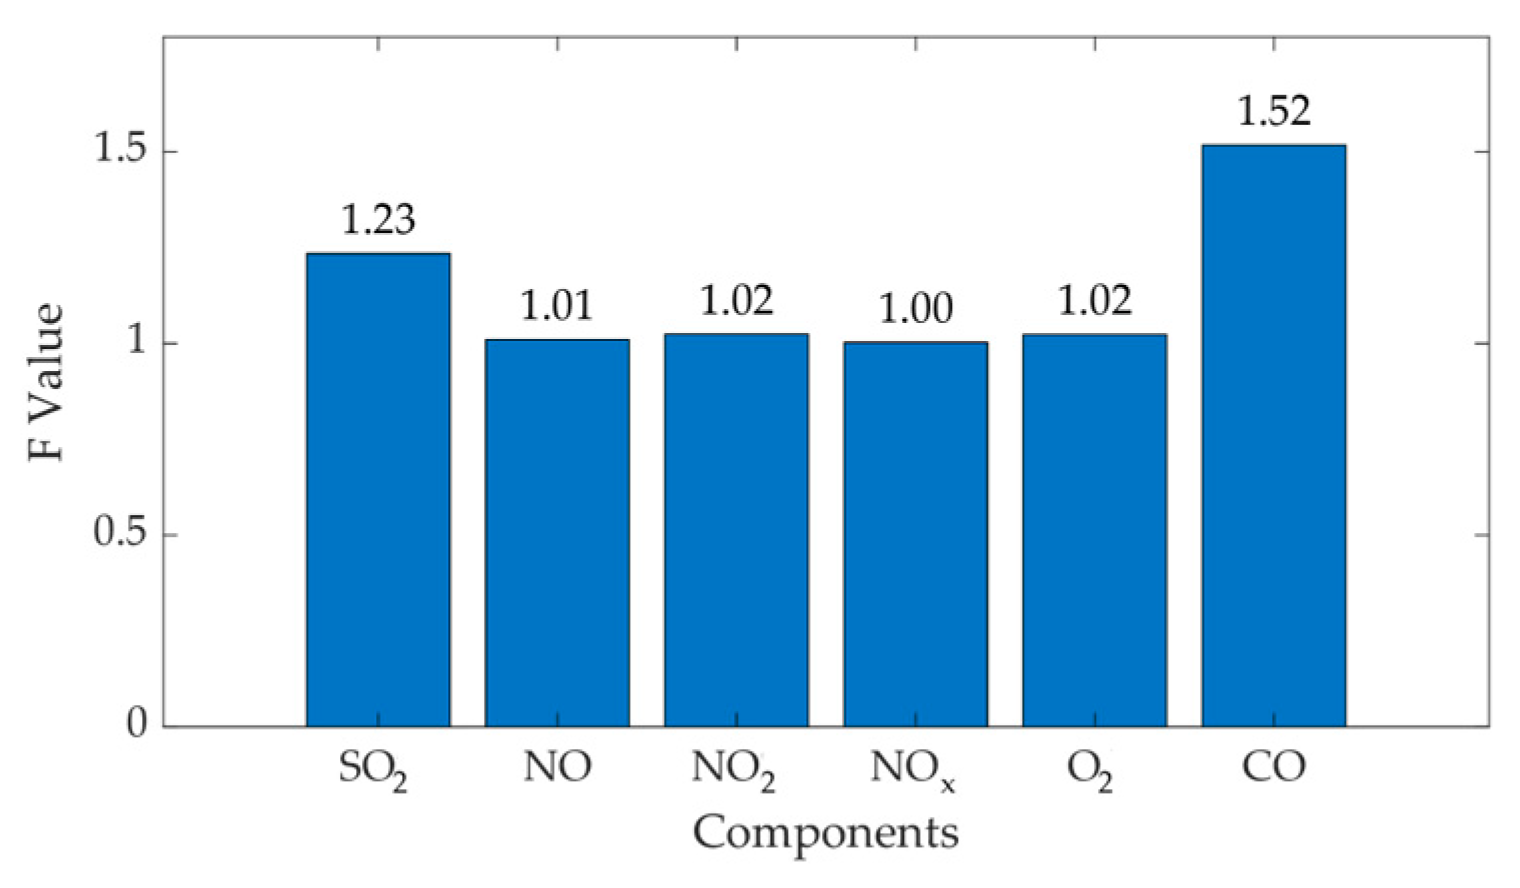
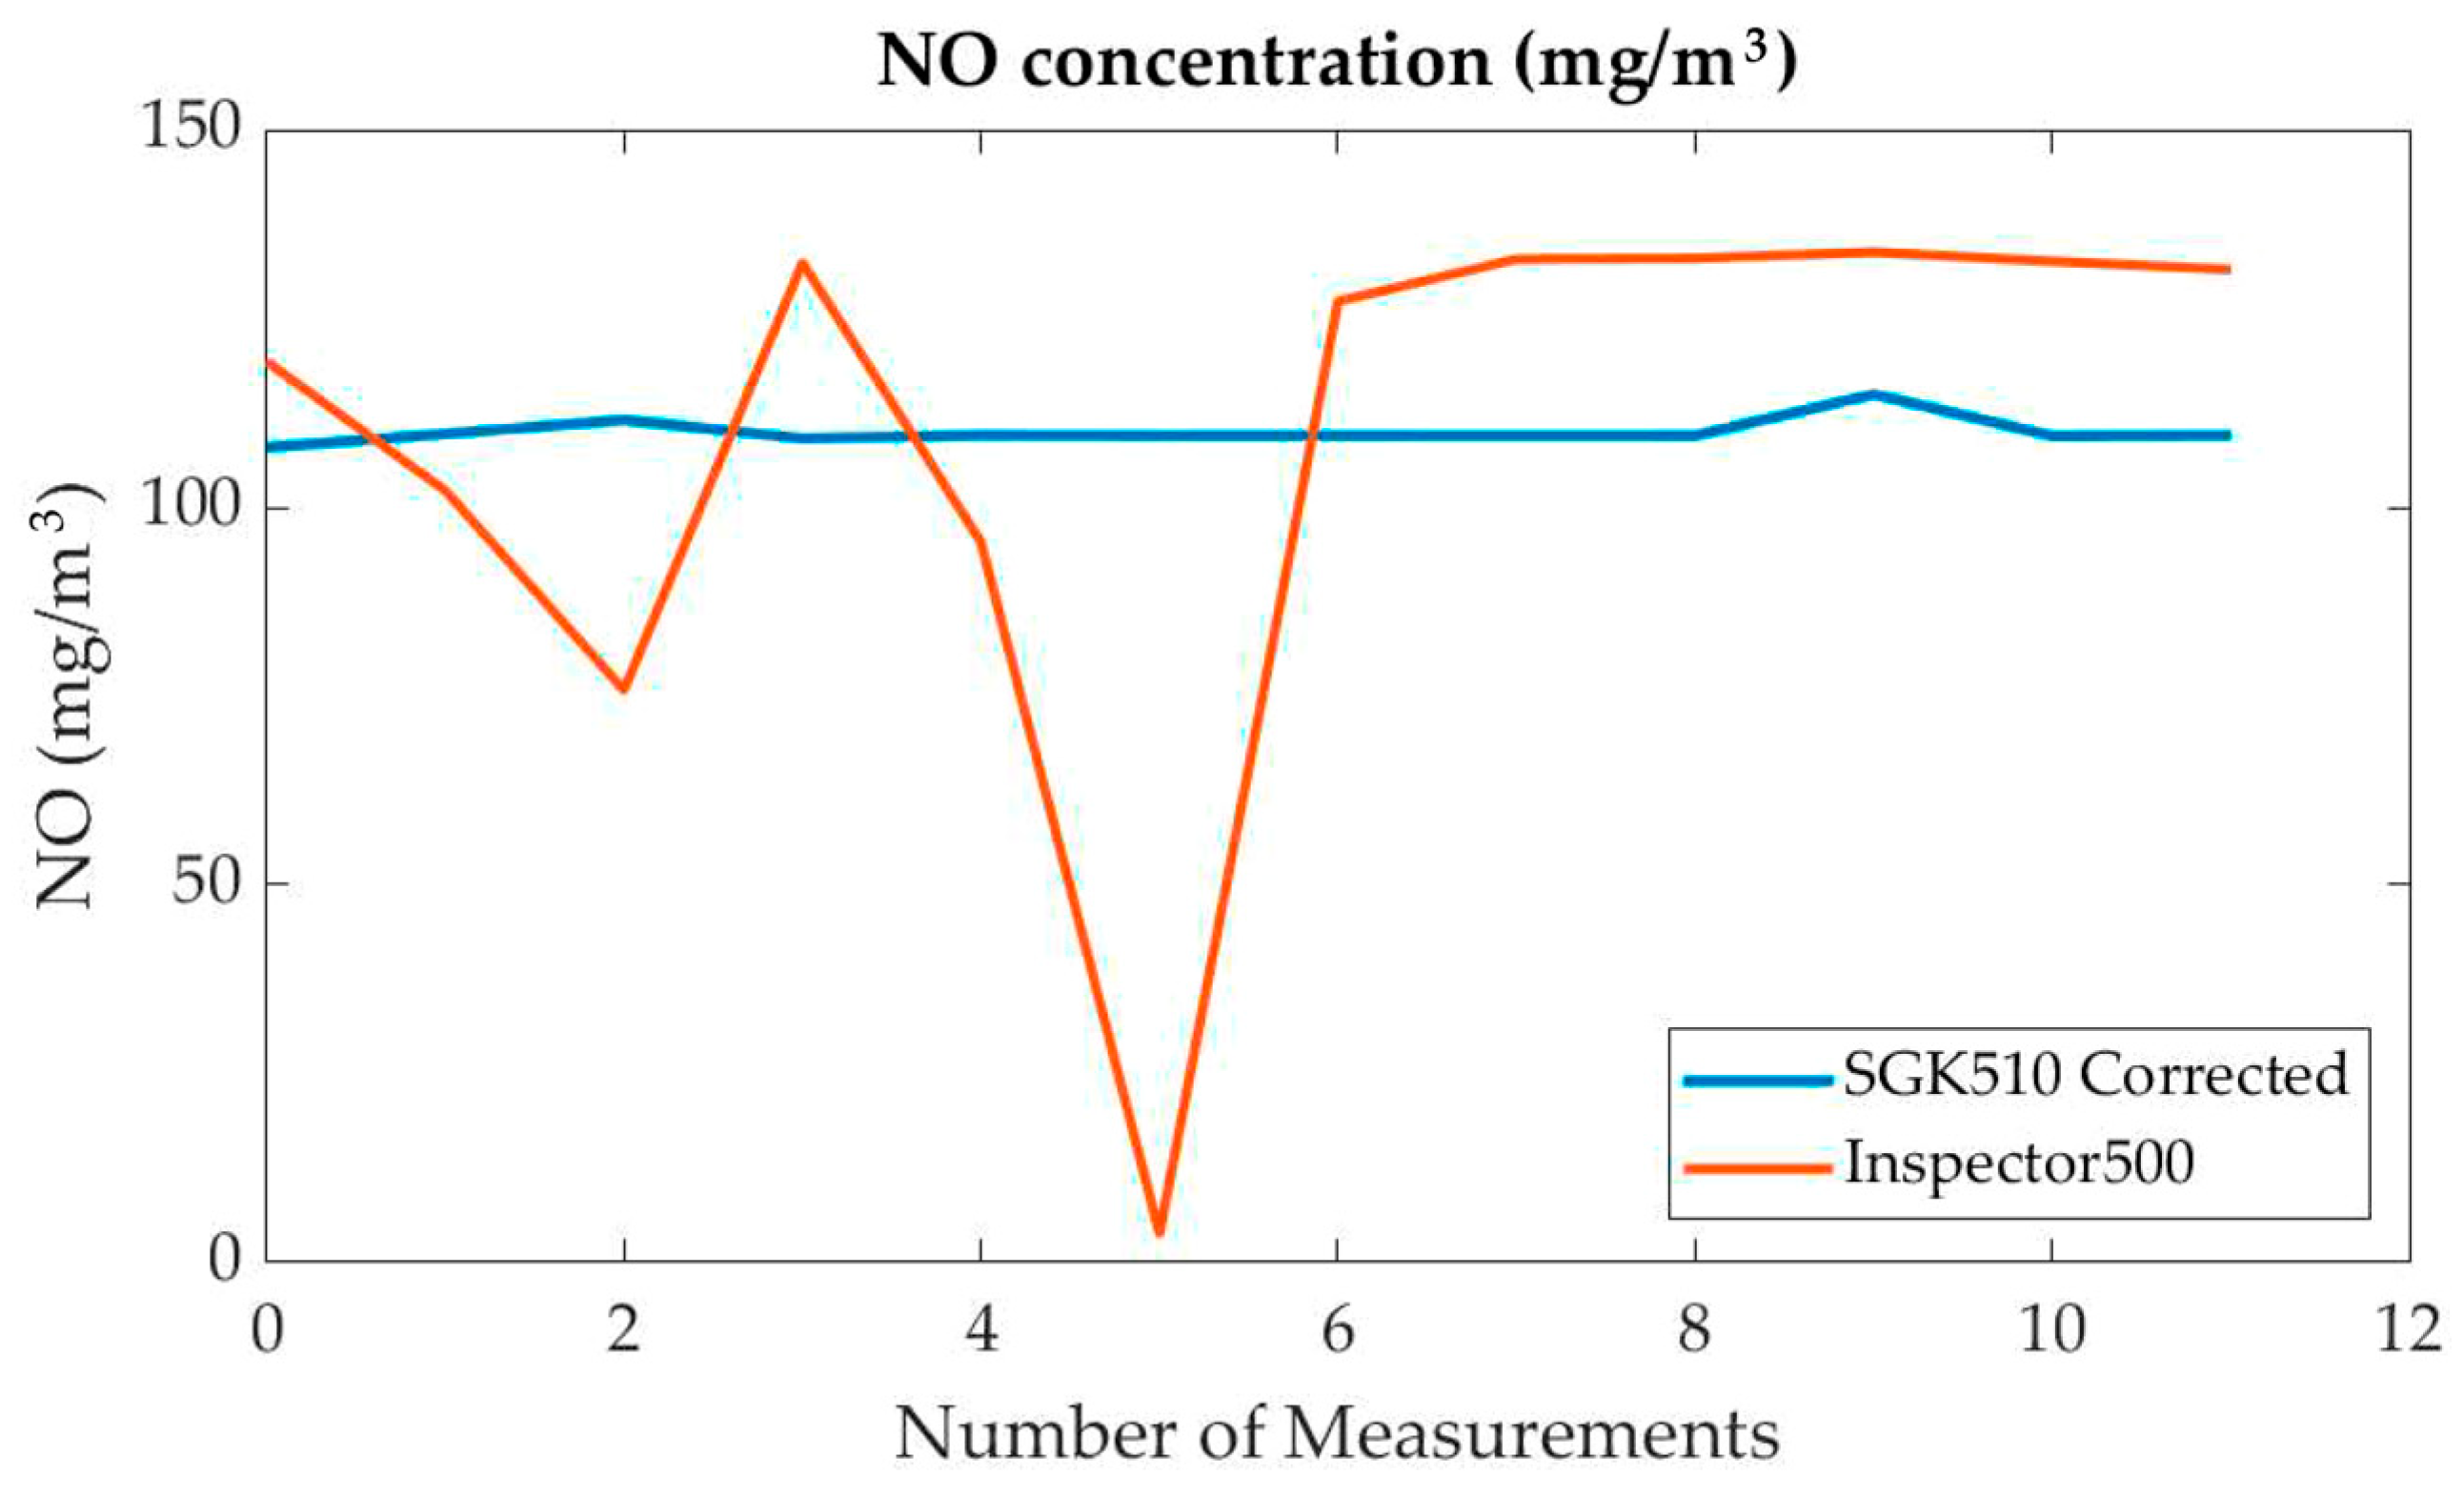
In order to verify the accuracy of the SOLER-500 system, the method specified in the ISO-13752 standard was used [56]. According to the requirements, using the Breusch–Pagan test, it was determined that the values of the residues are independent of the measurements in this sample [57]. Consequently, the Fisher method was used for the evaluation. The obtained values have high similarity, and the f-values took values in most cases from 1 to 1.05, except for measurements of CO for which the f-value was 1.52 (Figure 7).
Therefore, in order to determine the possibility of using tuning coefficients, as well as to evaluate the operation of the device, the Fisher coefficient was used for a complete sample of measurements. Therefore, parameters such as the expectation values for the y ¯ 1 and y ¯ 2 for the Inspector 500 are used for the calculation. The values of the standard deviation RΜD1 and RΜD2, the unbiased variance S1 and S2, and the Fisher criterion f are also used. All the values obtained were entered in Table 3.
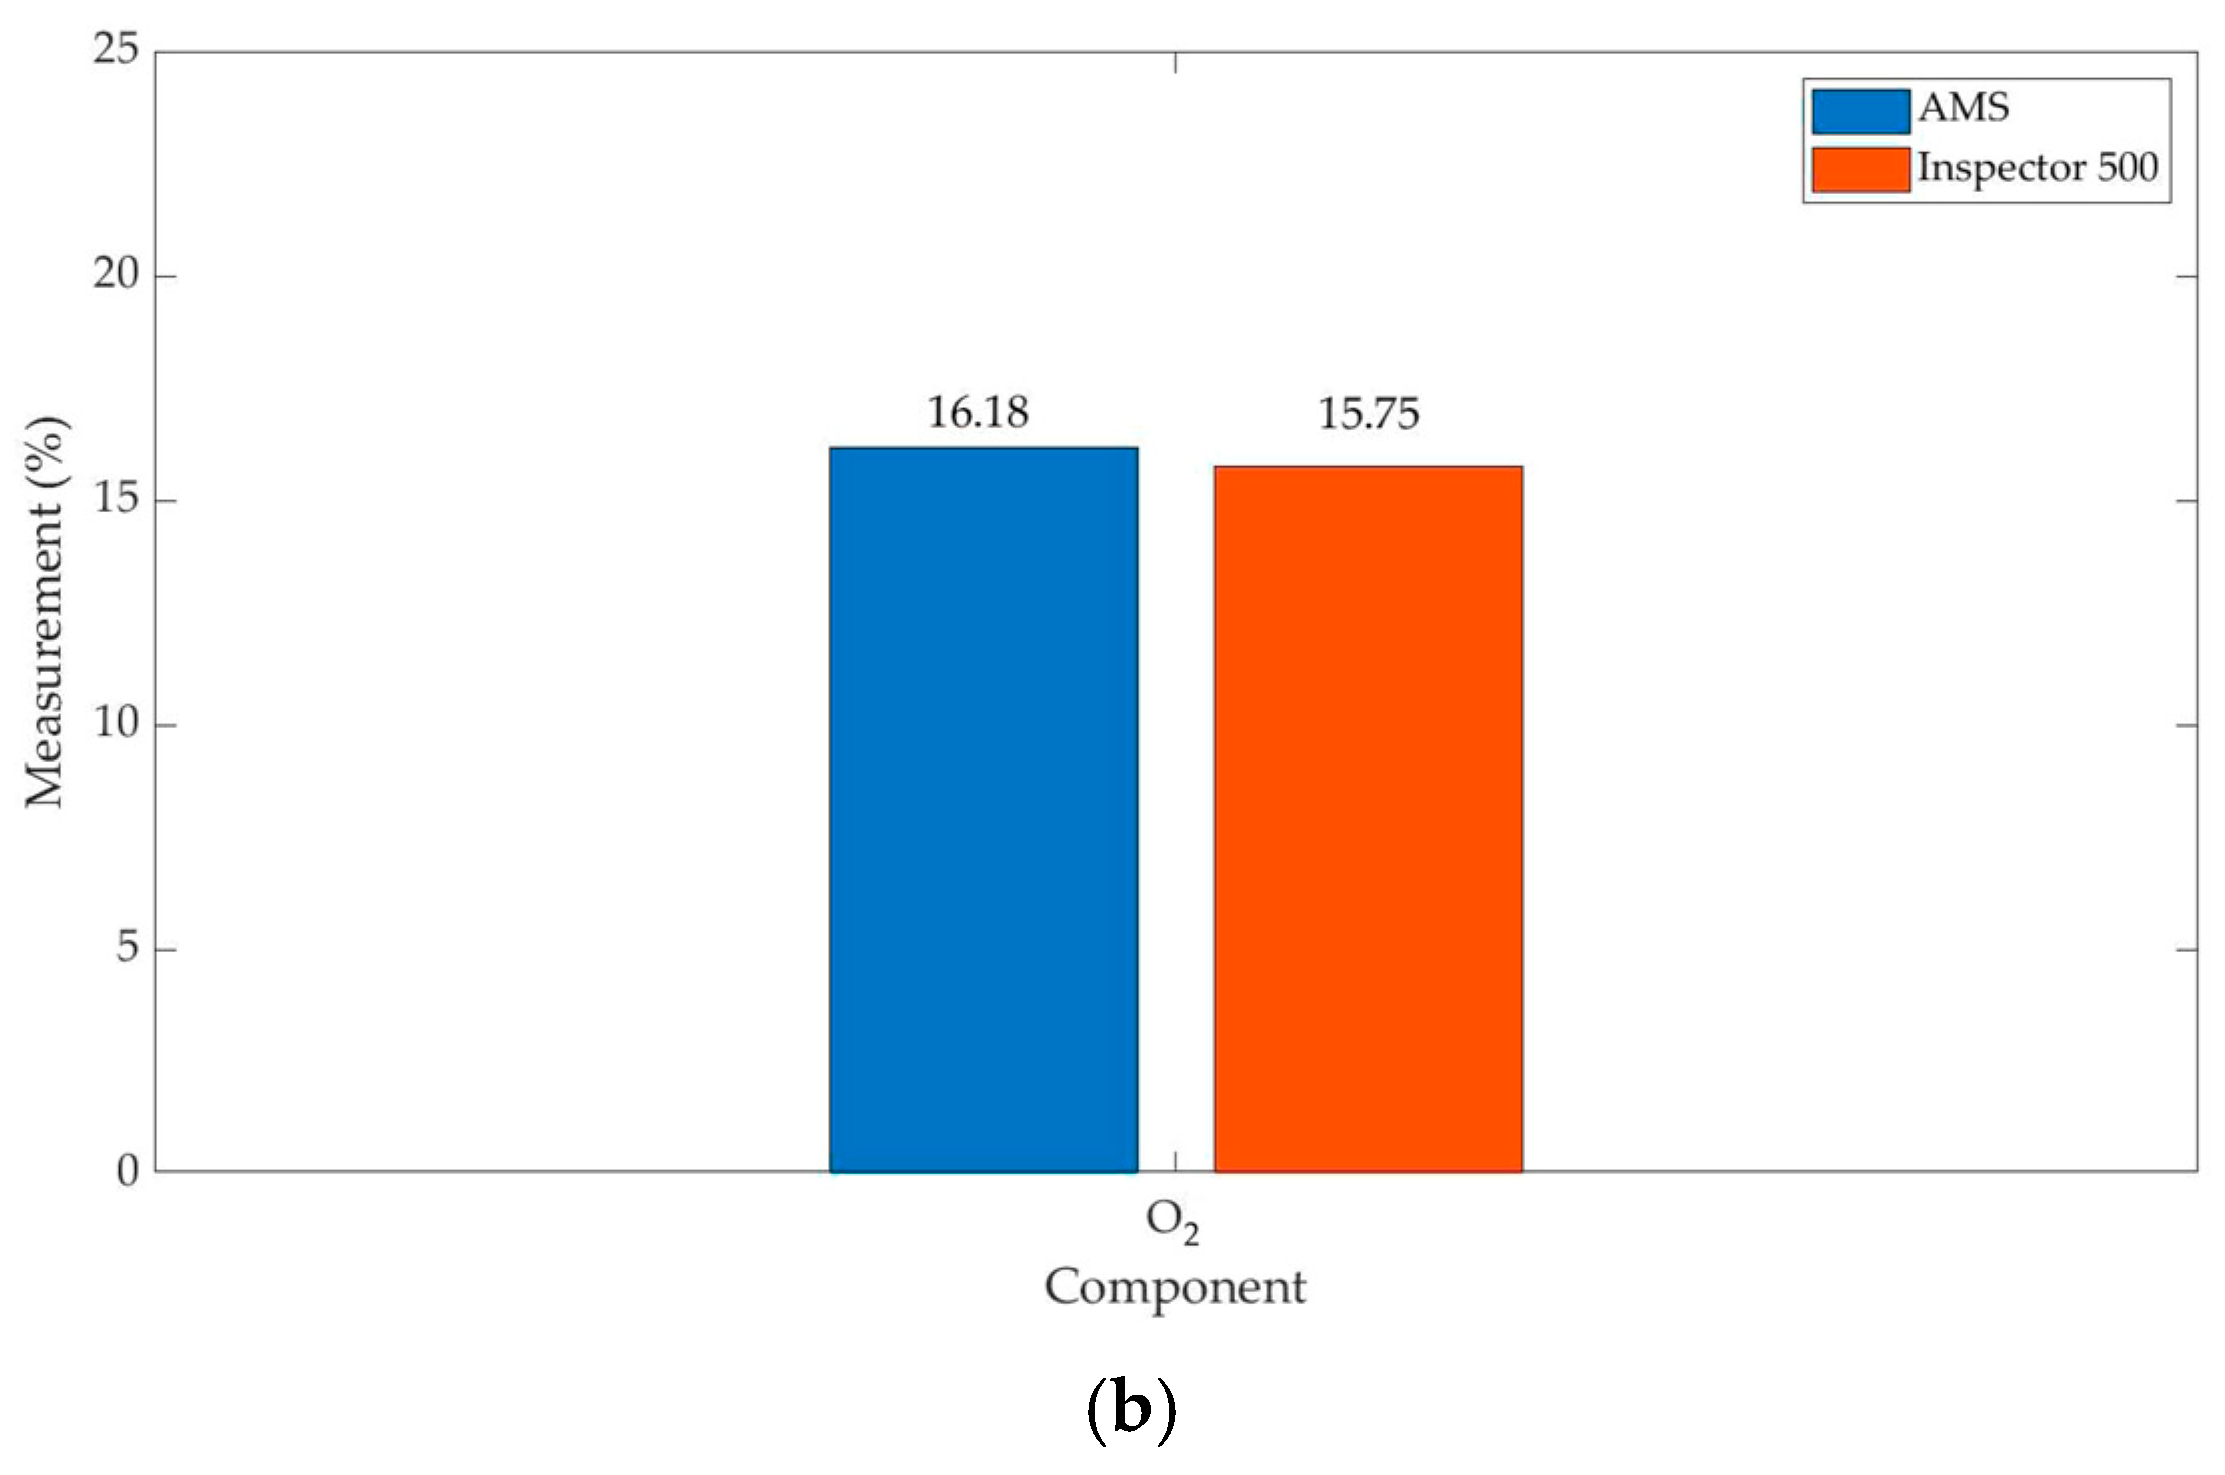
Firstly, according to Table 3, the distribution of the mean values can be presented as a bar graph (Figure 8).
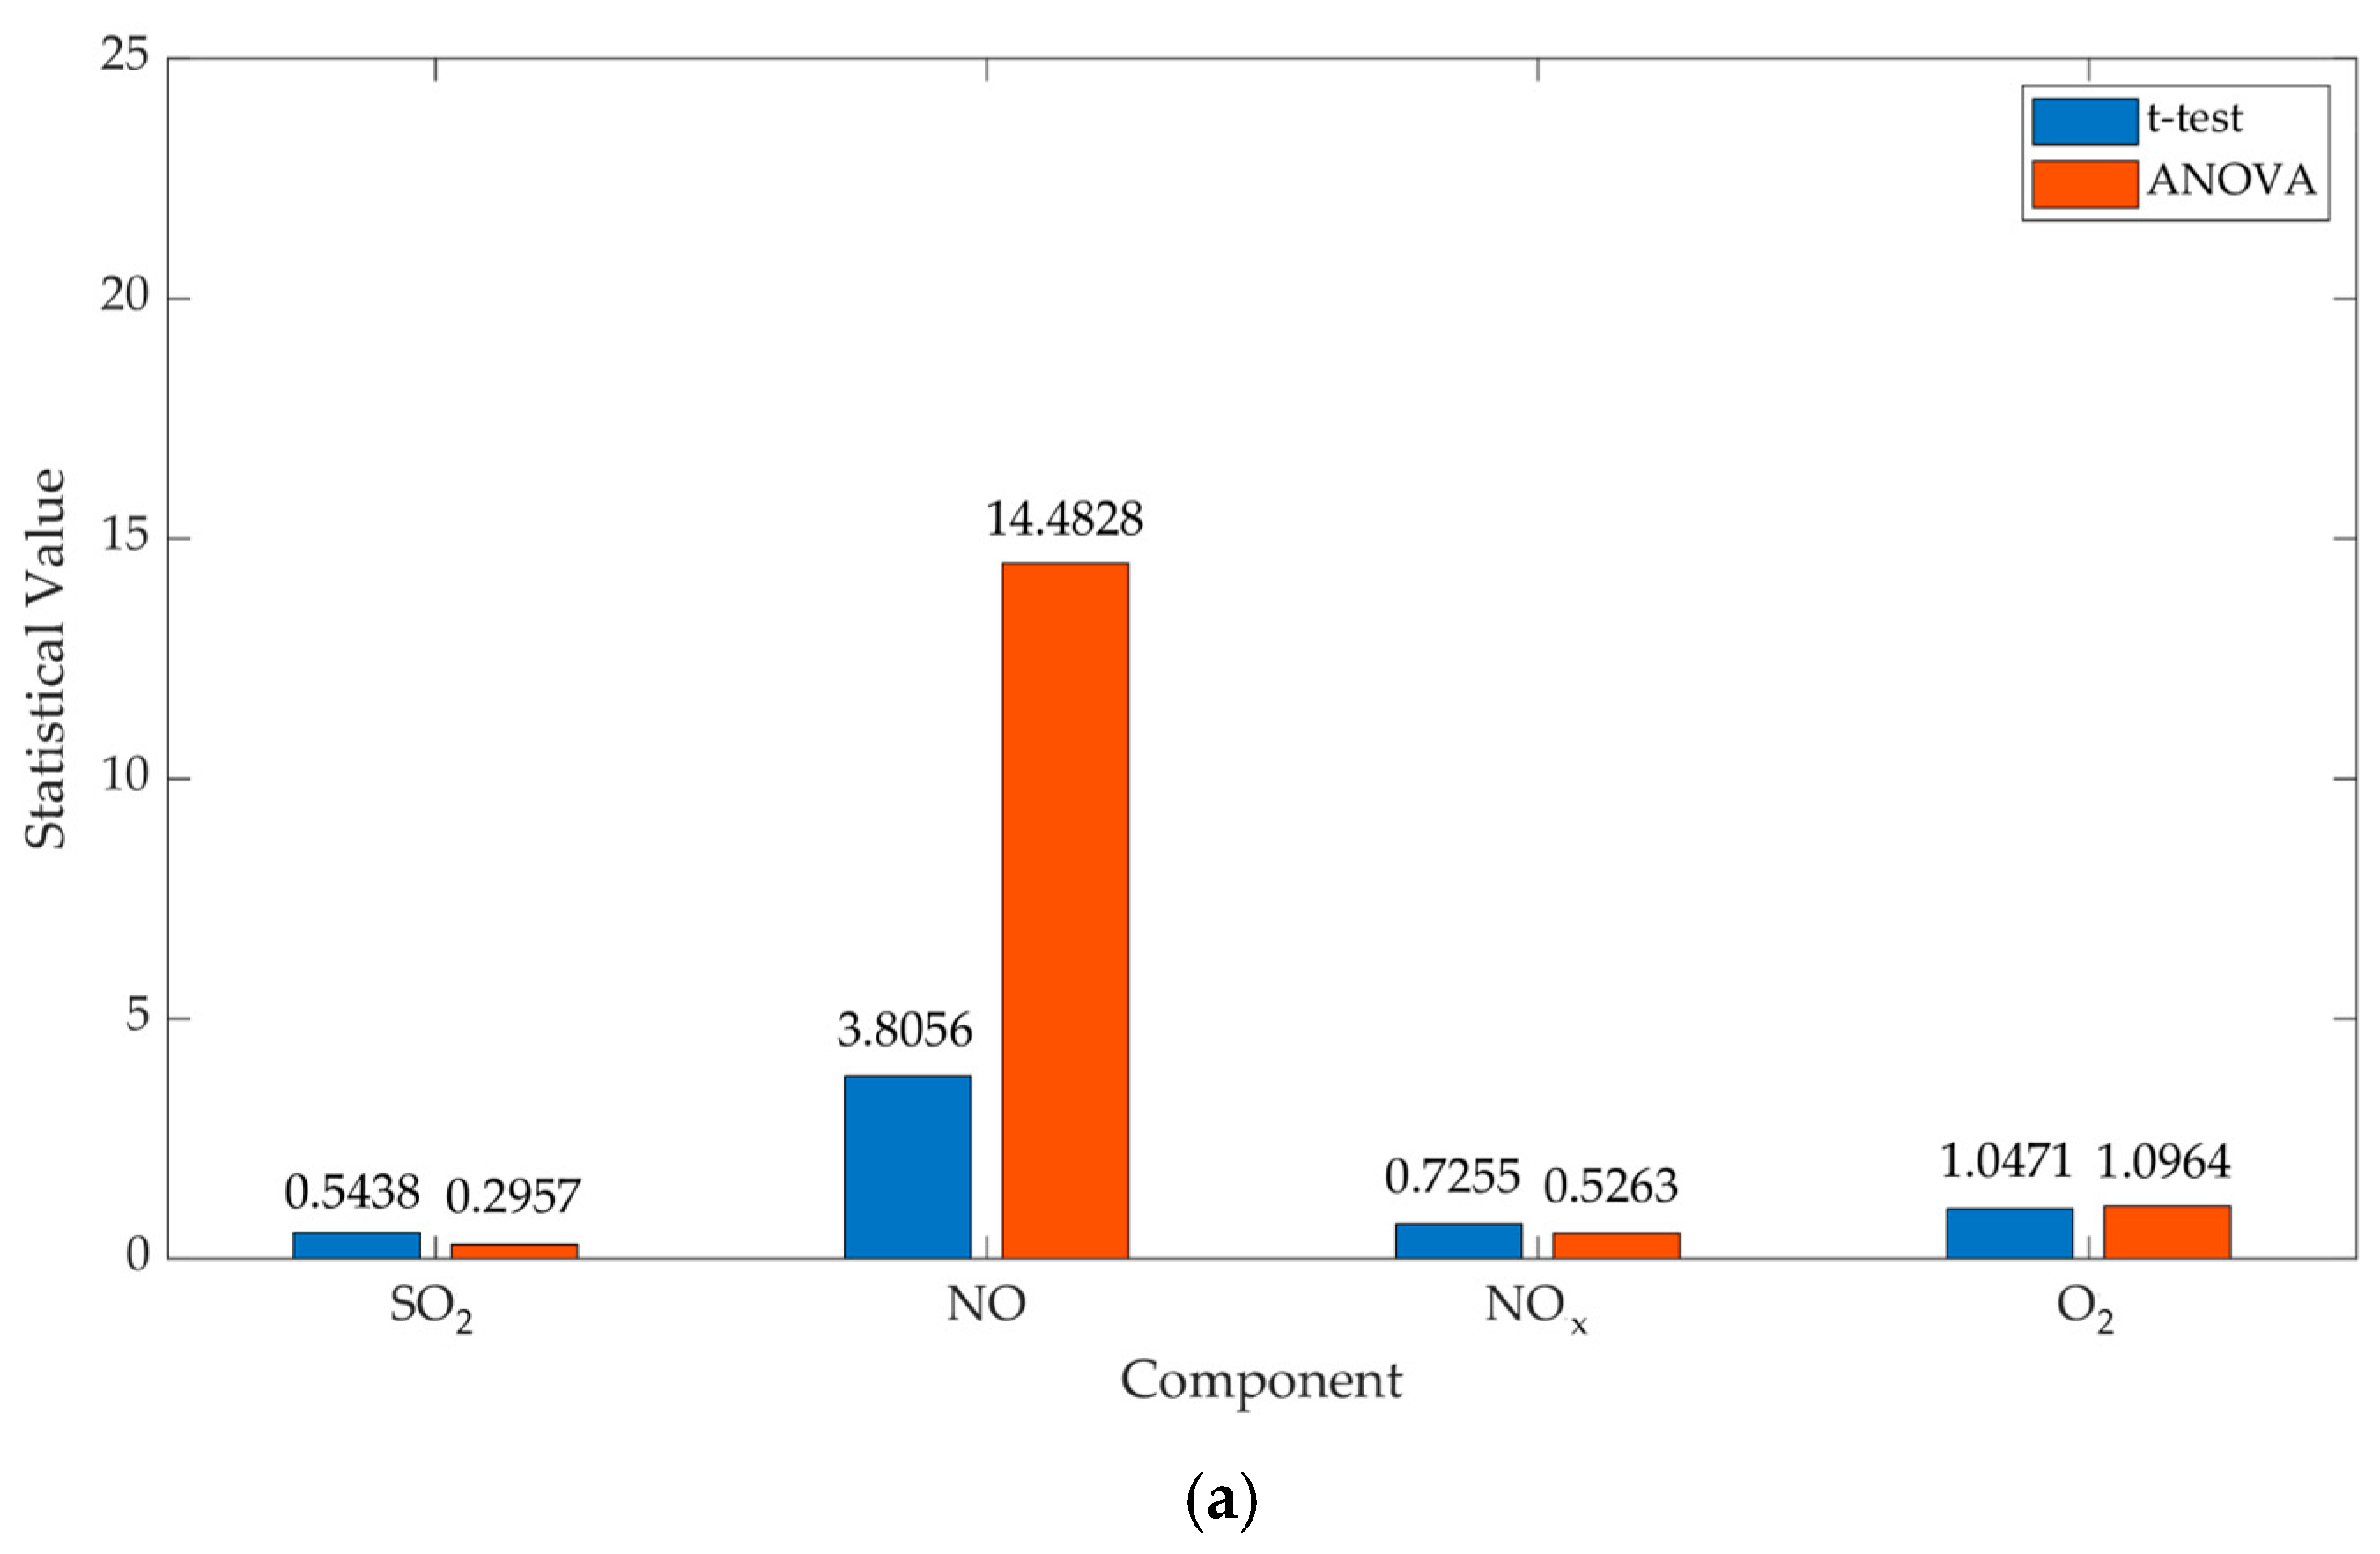
With the aim of statistical significance and zero-hypothesis testing, the additional mathematical operations Student’s test and ANOVA test (dispersion test) needed to be carried out (Table 4) for statistical significance that does not exceed 0.01. The results are presented in the bar graph.
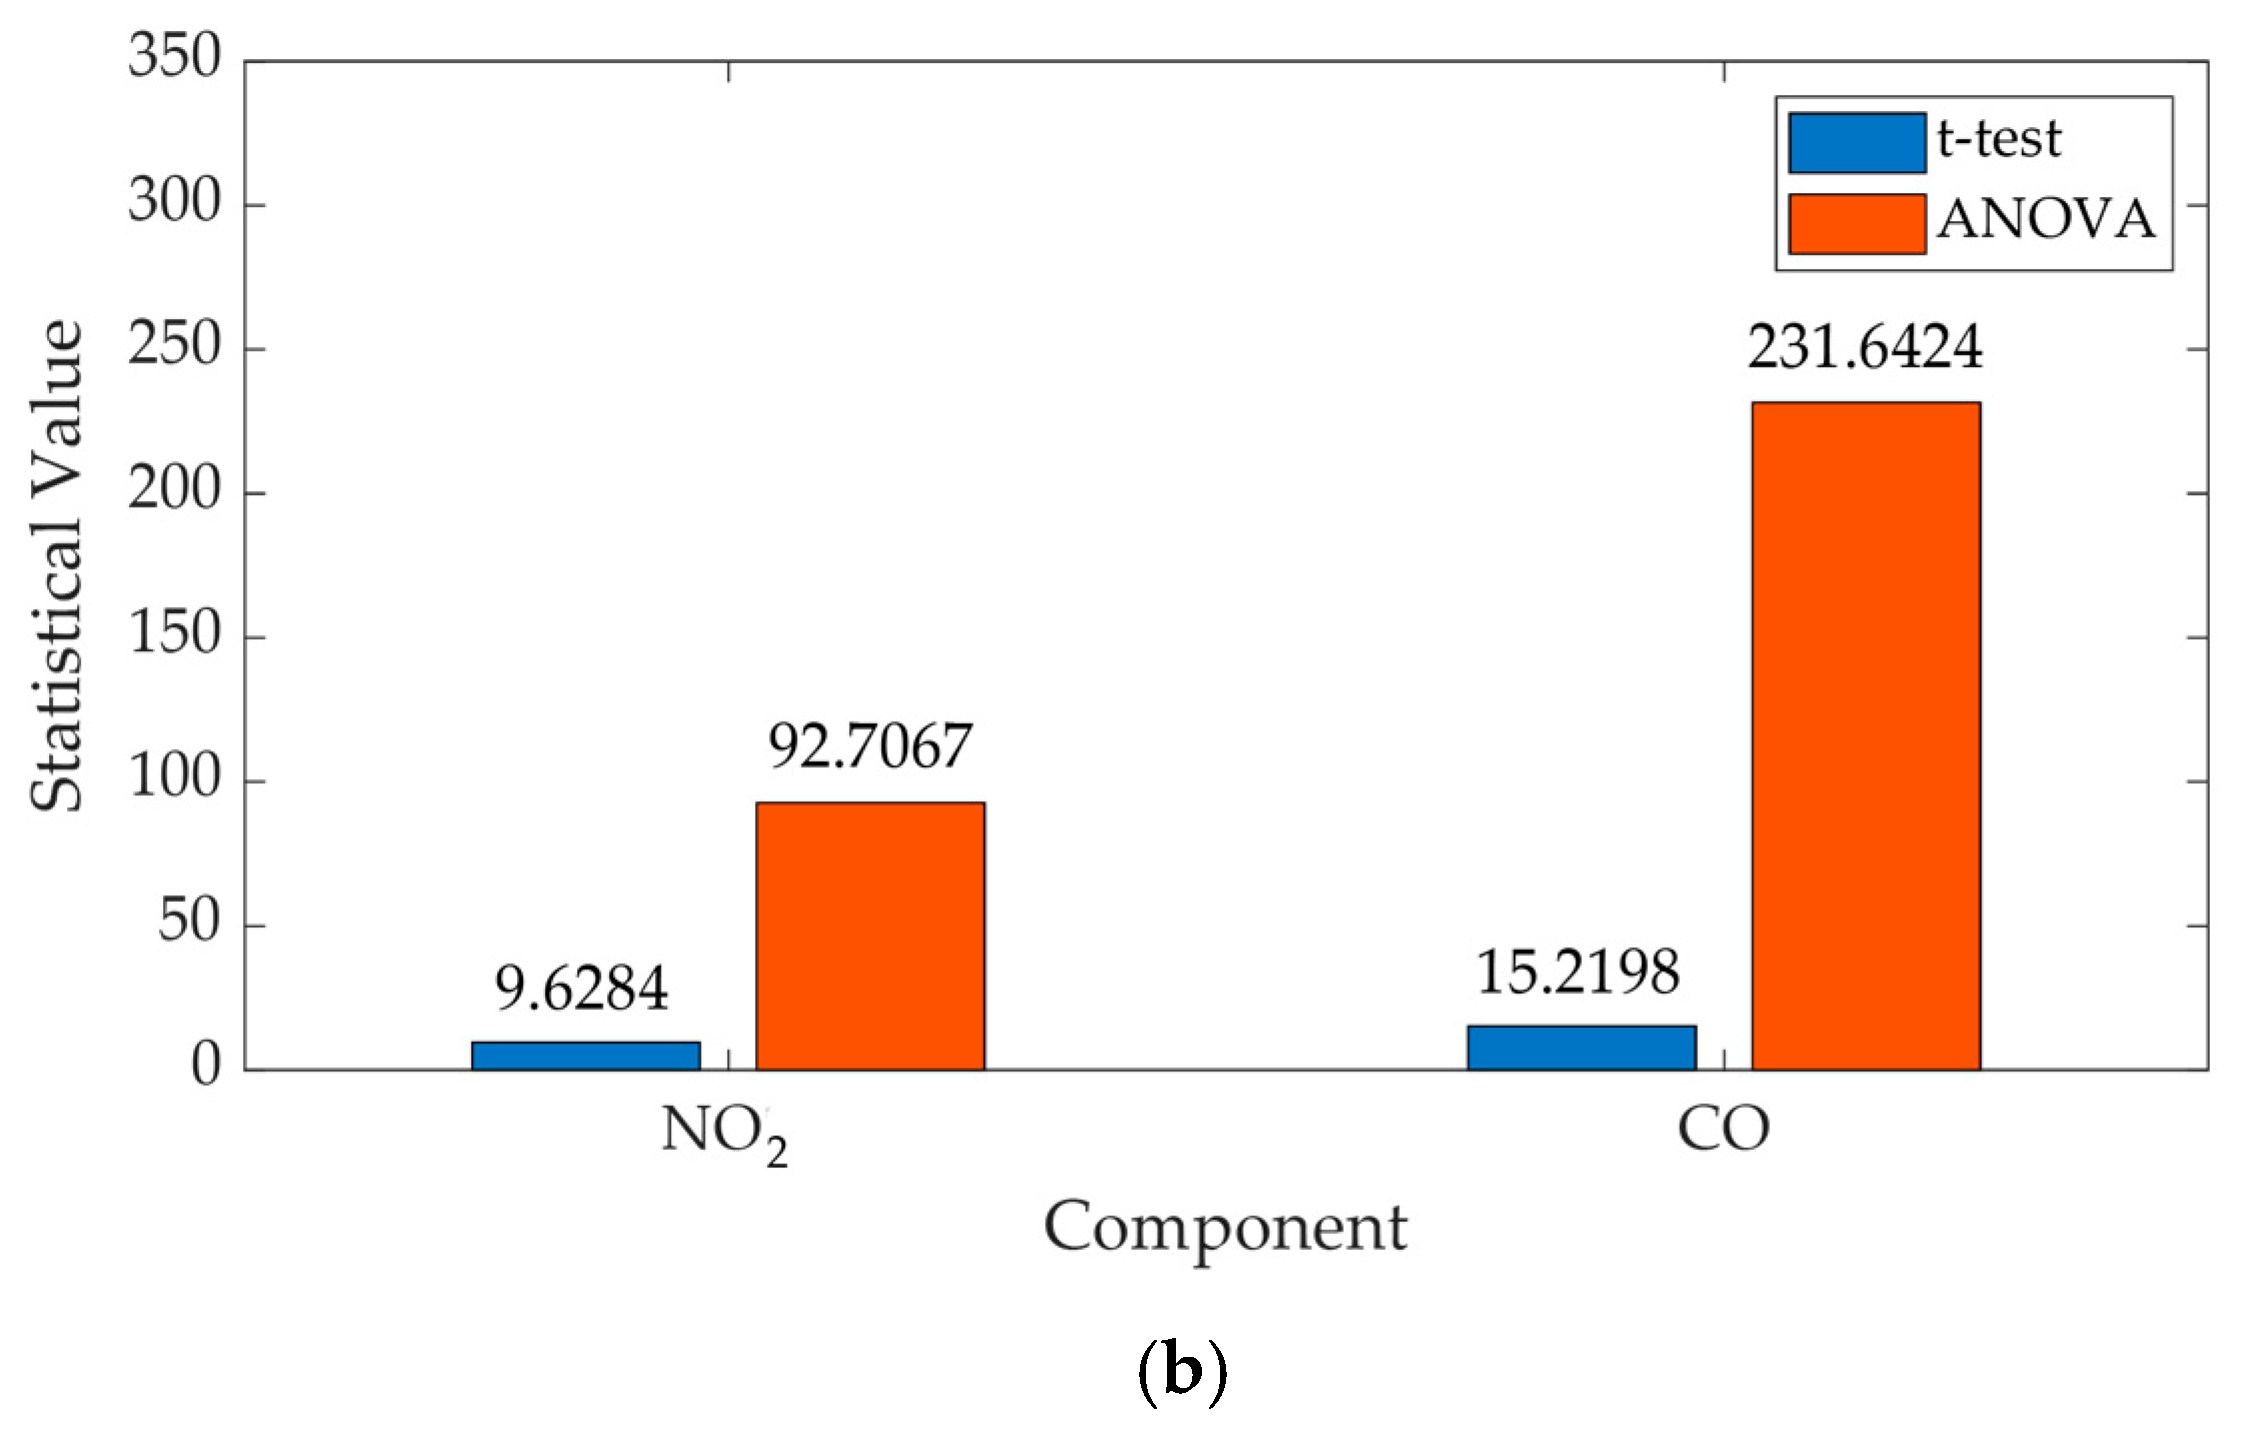
Analysis of the values gained through the Fisher’s, t-, and ANOVA tests. The bar graph demonstrates the difference between them in comparison (Figure 9).
Further analysis can be performed only in the case of the prepared graphs (Figure 10).
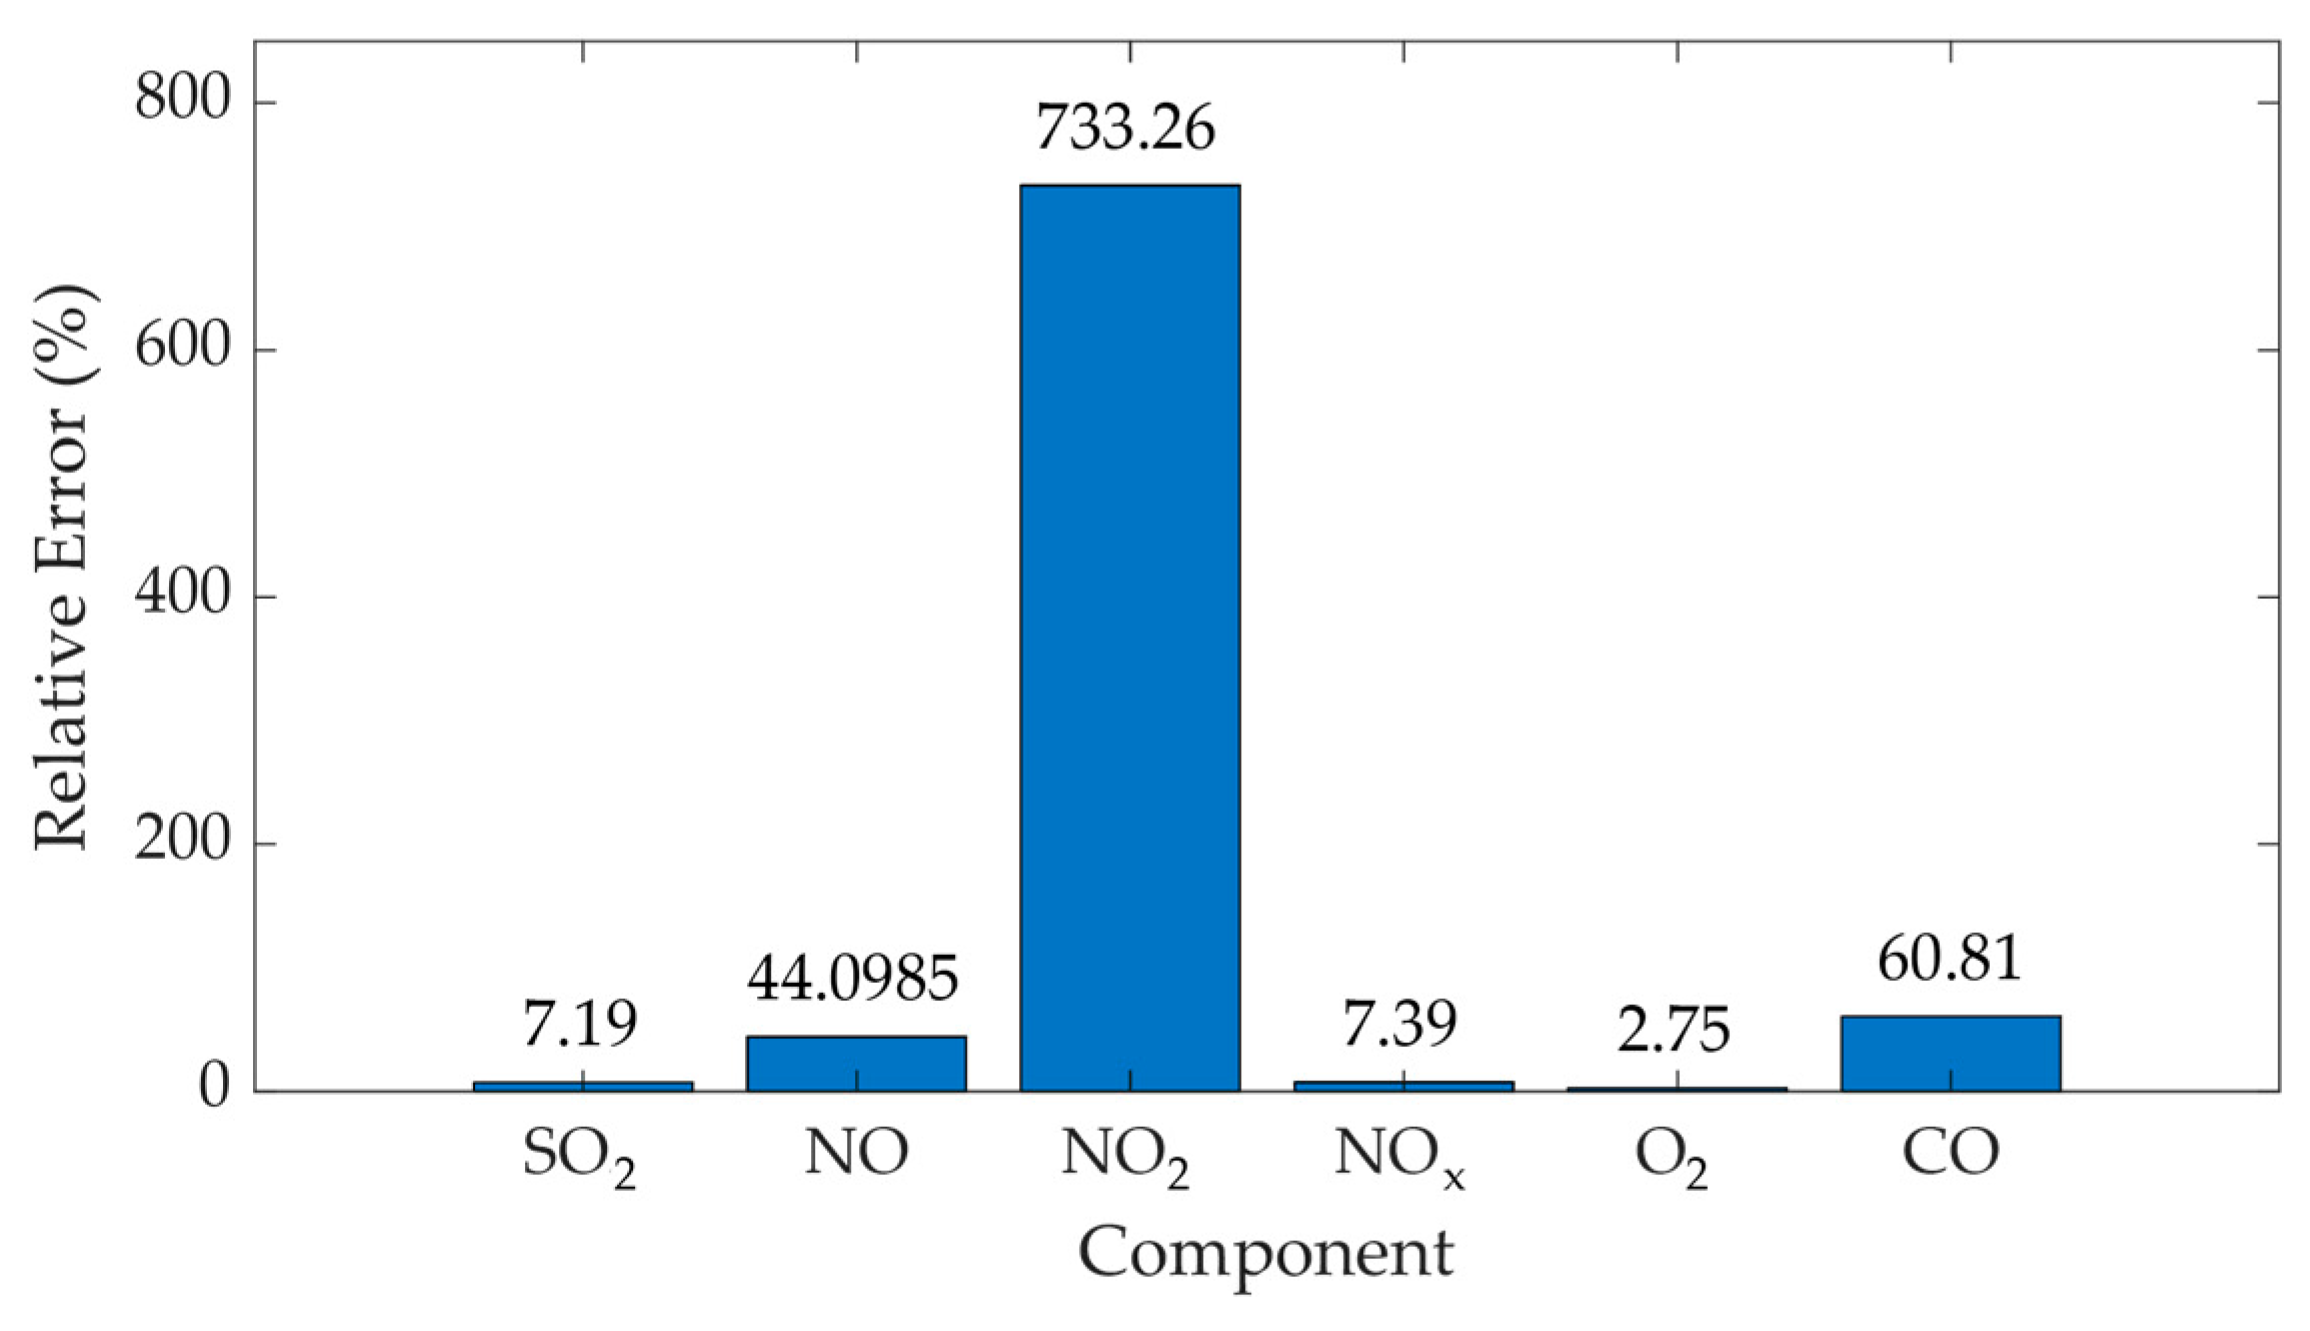
During the analysis, it was determined that the relative error for SO2 was 7.19%, for NO it was 44.0985%, for NO2 it was 733.26%, for NOx it was 7.39%, for O2 it was 2.75%, and for CO it was 60.81% (Figure 11).
Figure 11 demonstrates that most of the components had high errors of measurement.

3.2. Analysis of an Electrochemical Method for Measuring the Concentration of Exhaust Gas

In the case of the electrochemical method, the measurements are strongly influenced by the humidity of the exhaust gas. In order to confirm this assumption, a laboratory installation was built with the supply of a drained sample and then with the supply of humidity by a humidifier with a potentiometer regulator that works on the ultrasound principle. The water particles were introduced by tubes, which imitated the installation, and a reference gas was used for the measurement. The electrochemical device was recommended by the Promanalyt LLP for the content determination. The results of the test are shown in figures that are supplied in the Supplementary Materials.
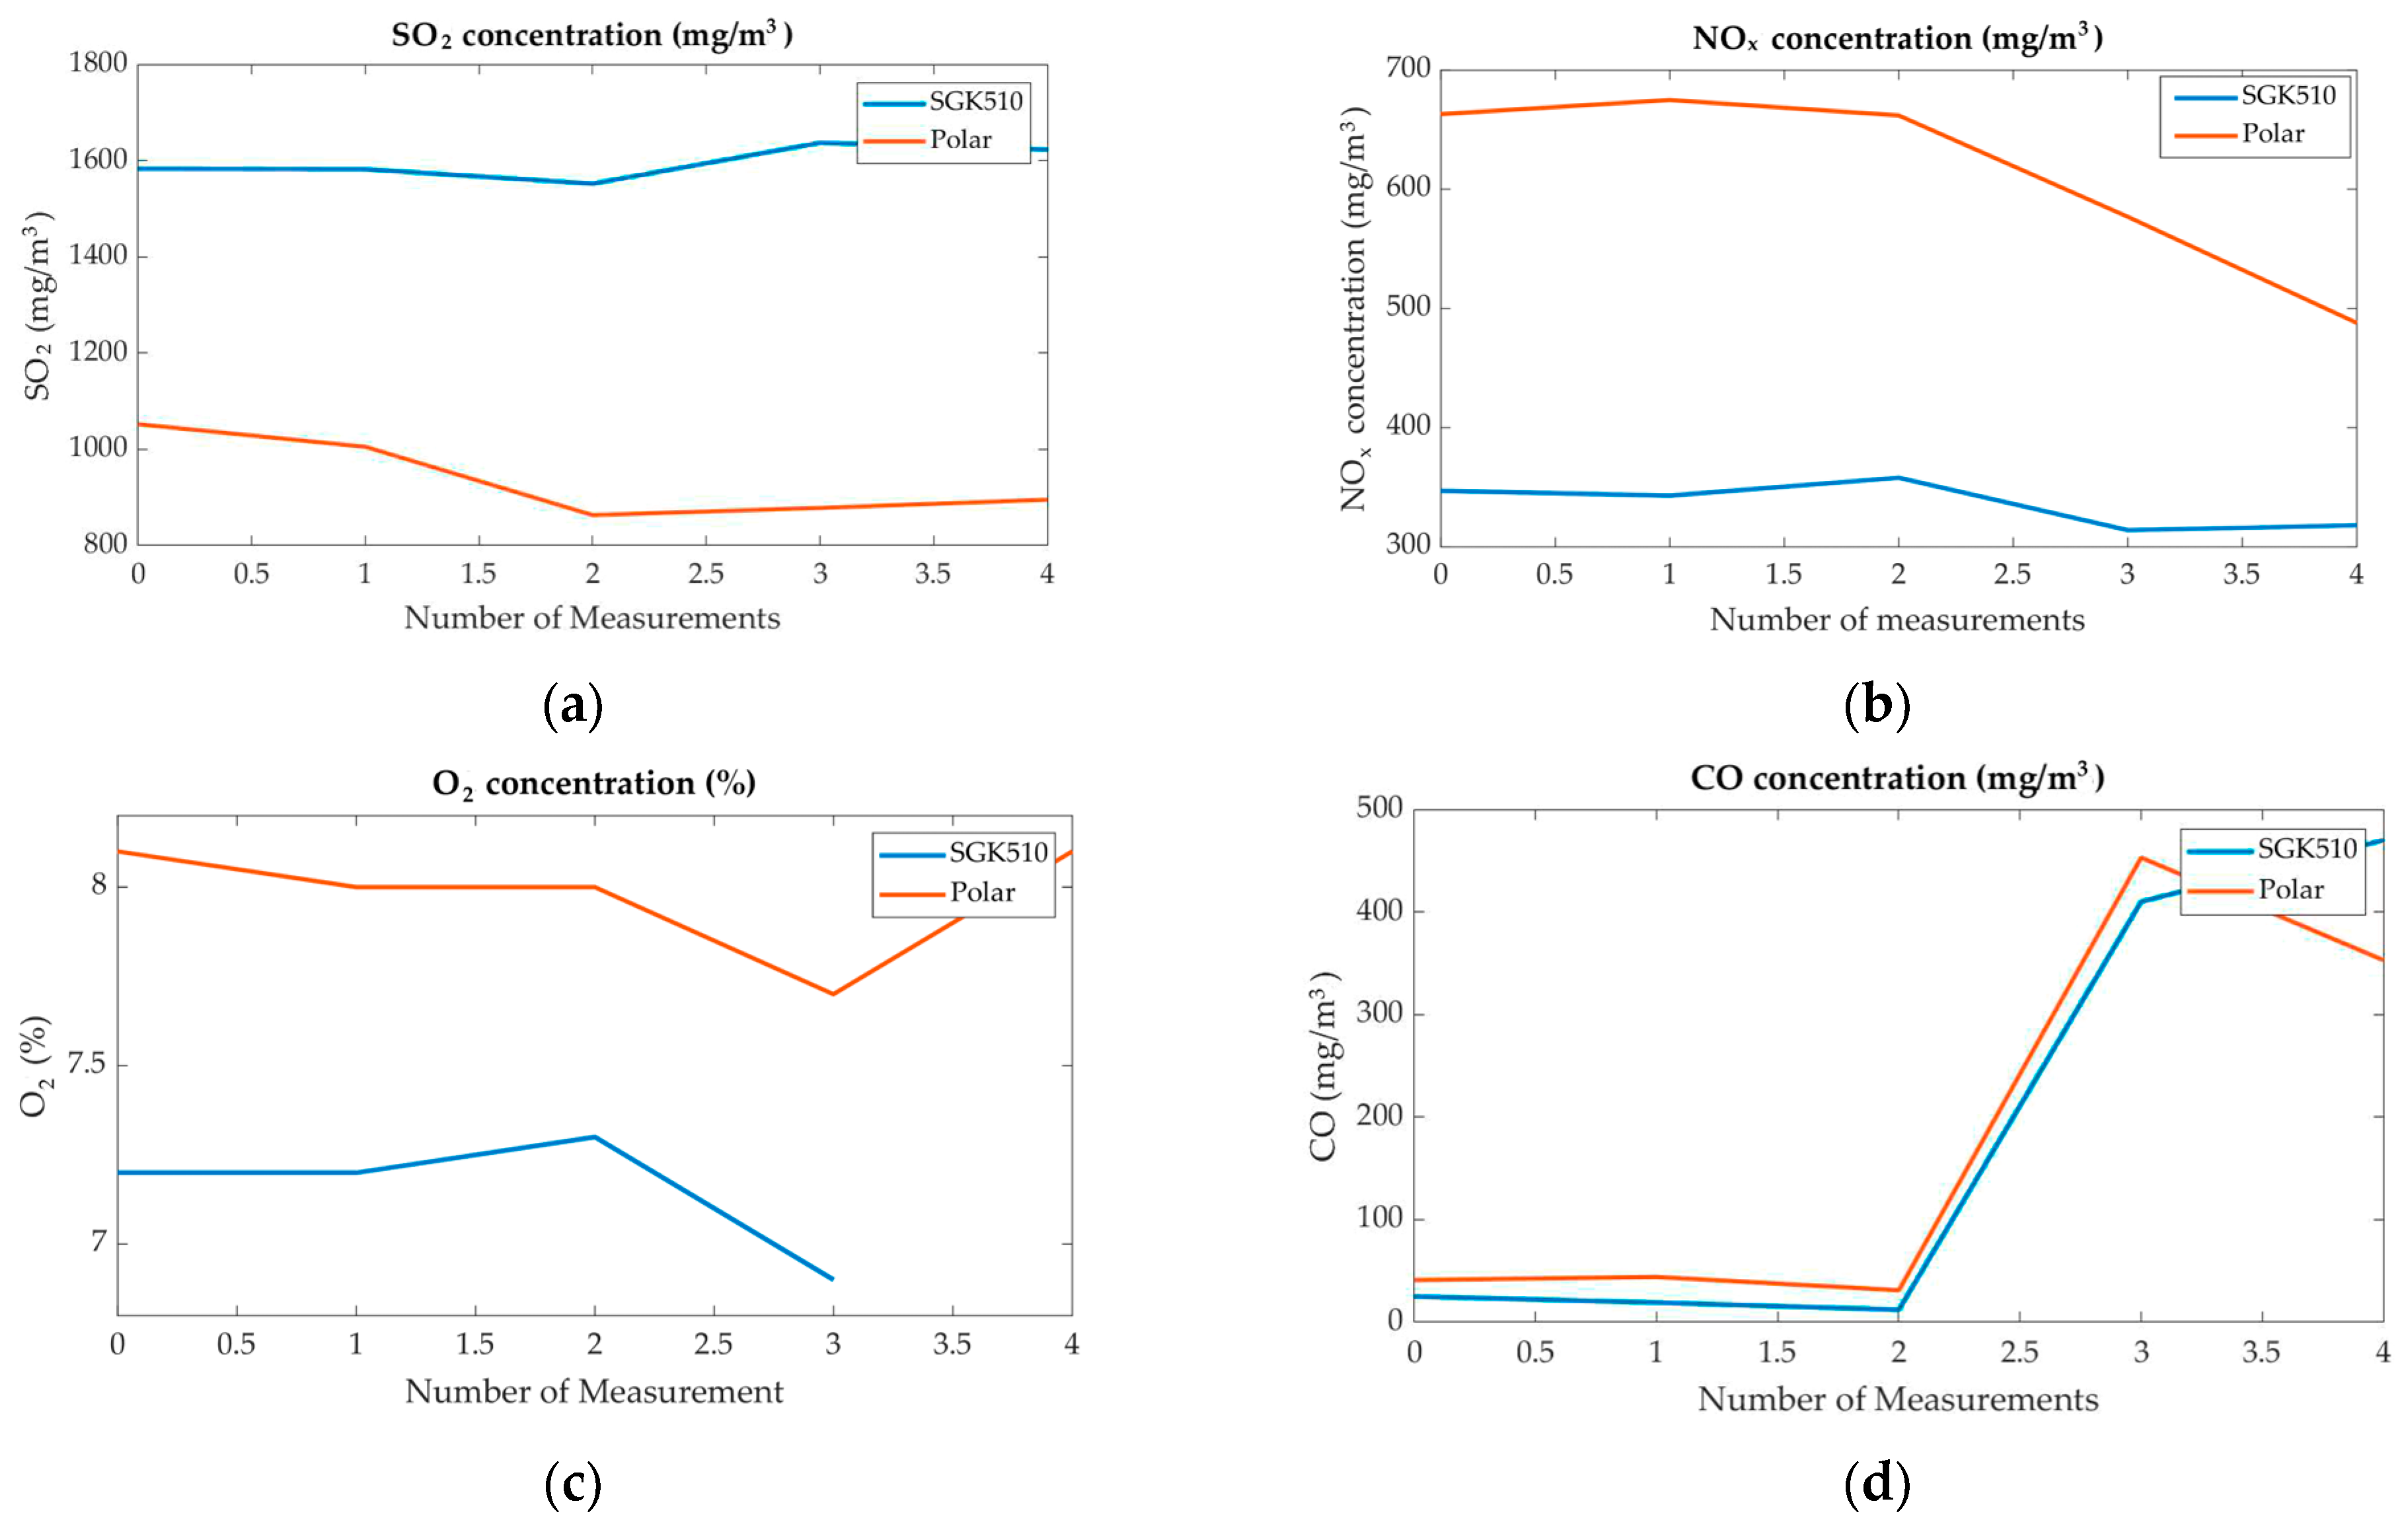
In this case, the measurements of the drained sample had stable readings of 537 ppm, then the humidity was increased by the addition of water particles into the installation. When humidity was added to the sample, the readings decreased to a value of 393 ppm. In this case, the POLAR ultrasonic gas analyzer was used. Data collection was also carried out in the operating conditions of a coal-fired power plant. In this case, the readings had a different pattern.
The values obtained during the data collection are shown in Table 5. Moreover, the measurements transformation was conducted considering a reference oxygen content equal to 6% [49].
Due to the small number of measurements, the application of the proposed technique in [55] to analyze the obtained values is difficult, but, according to the Breusch–Pagan test, it can be concluded that the remaining squares in this sample are independent of the measurement of the test sample.
By analyzing these values in a similar way, statistical parameters can be presented as in Table 3 (Table 6). However, in this case, index 1 indicates POLAR measurements.
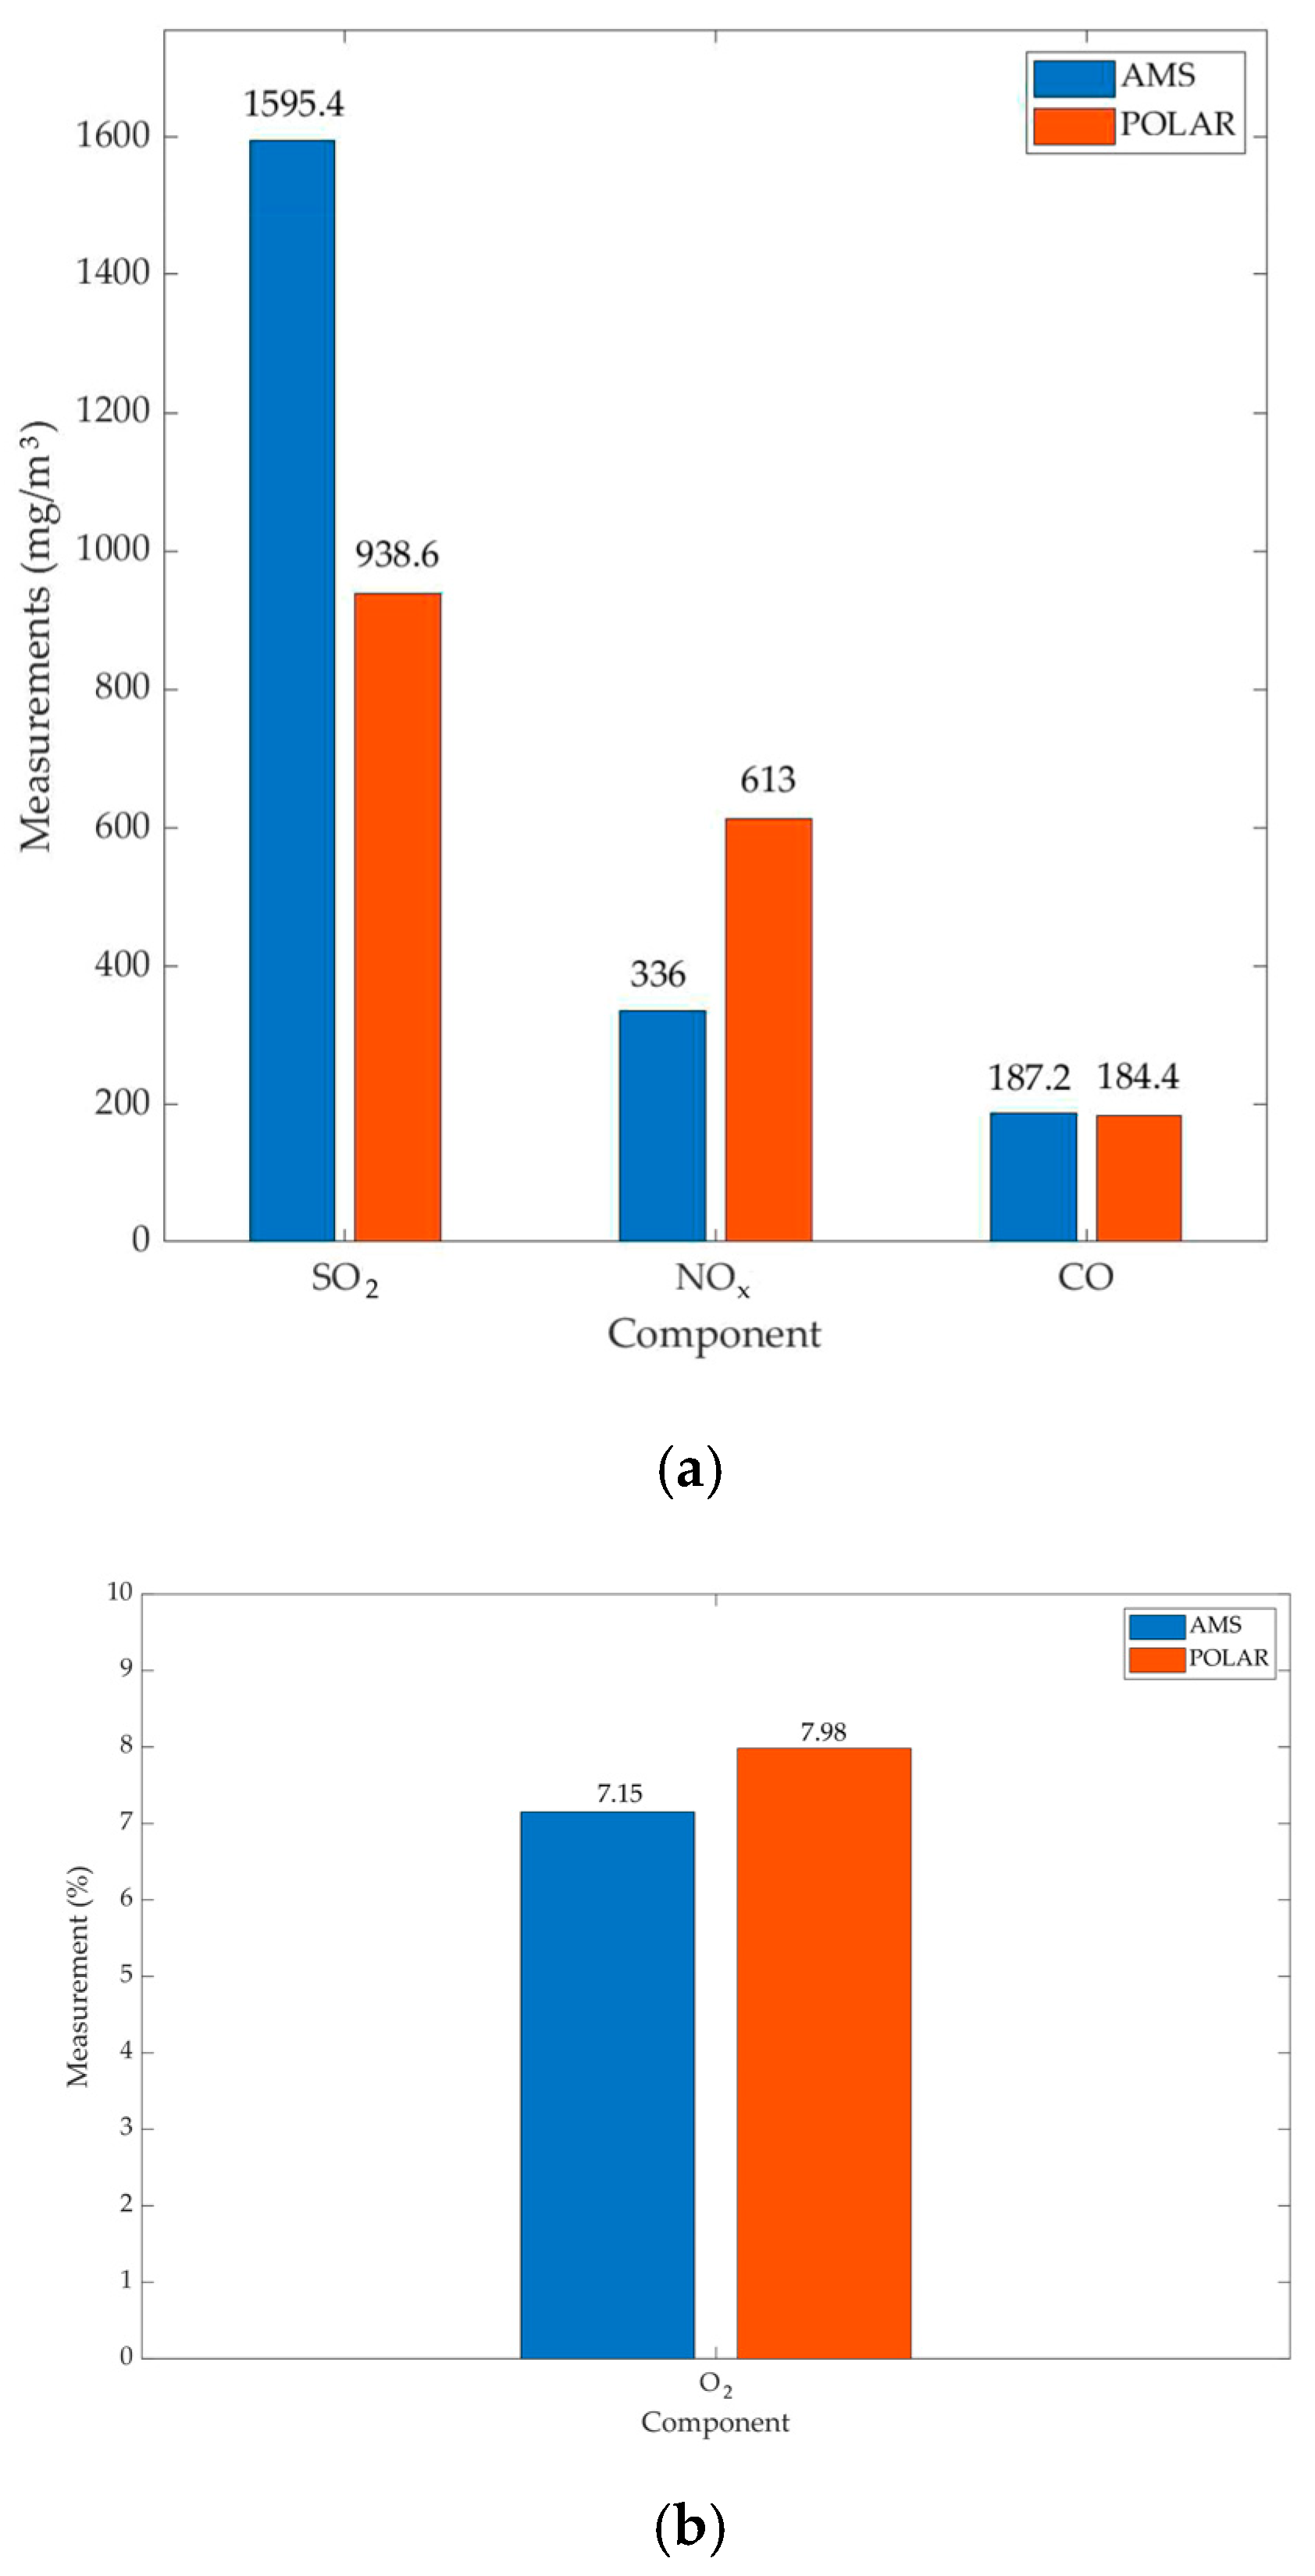
The comparison of measurements is presented via mean values in the bar graph (Figure 12).
For a more accurate analysis, graphs were plotted (Figure 13).
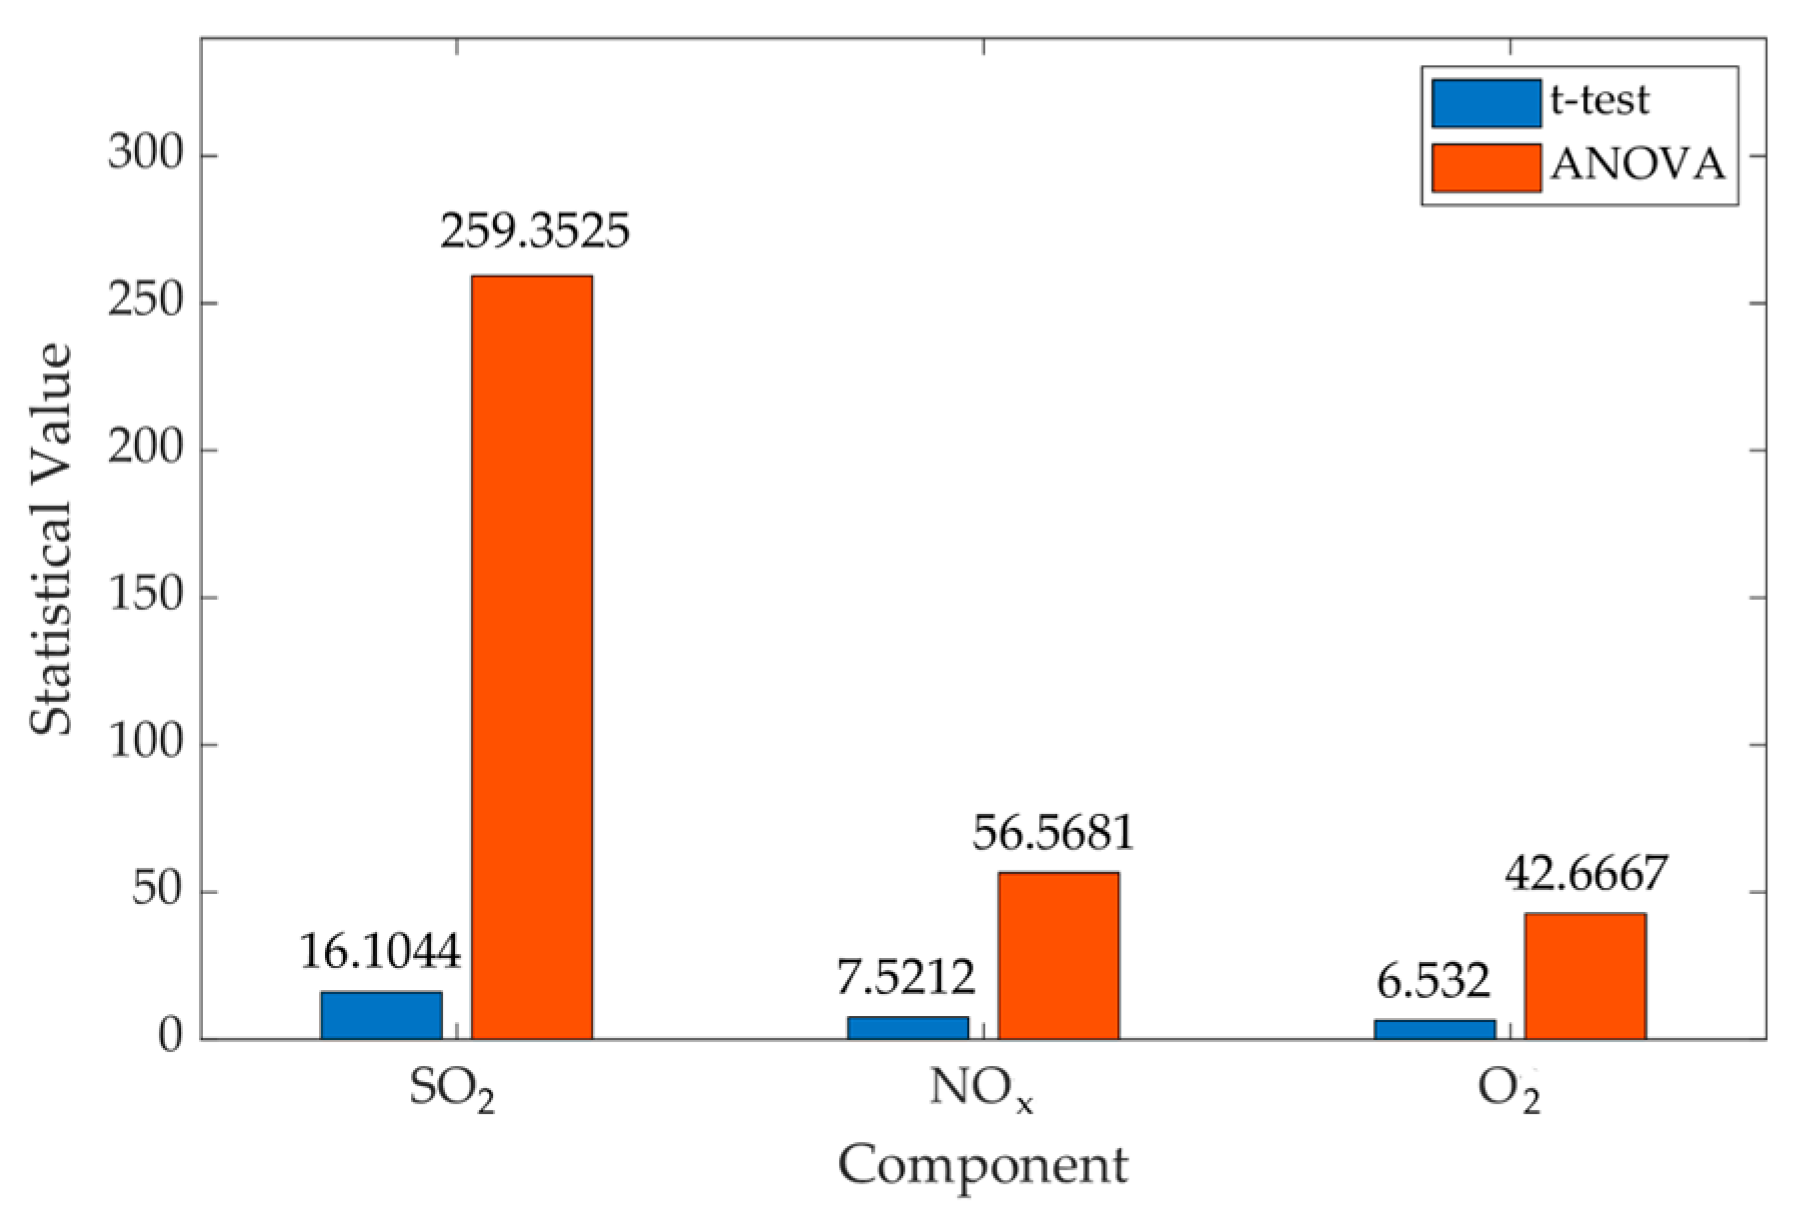
The analysis of statistical significance was carried out by the t-test and the ANOVA test, and the data were written in Table 7.
The representation of the statistical values from the t-test and the ANOVA test is demonstrated in Figure 14 (the values for CO were not considered as they were very low).
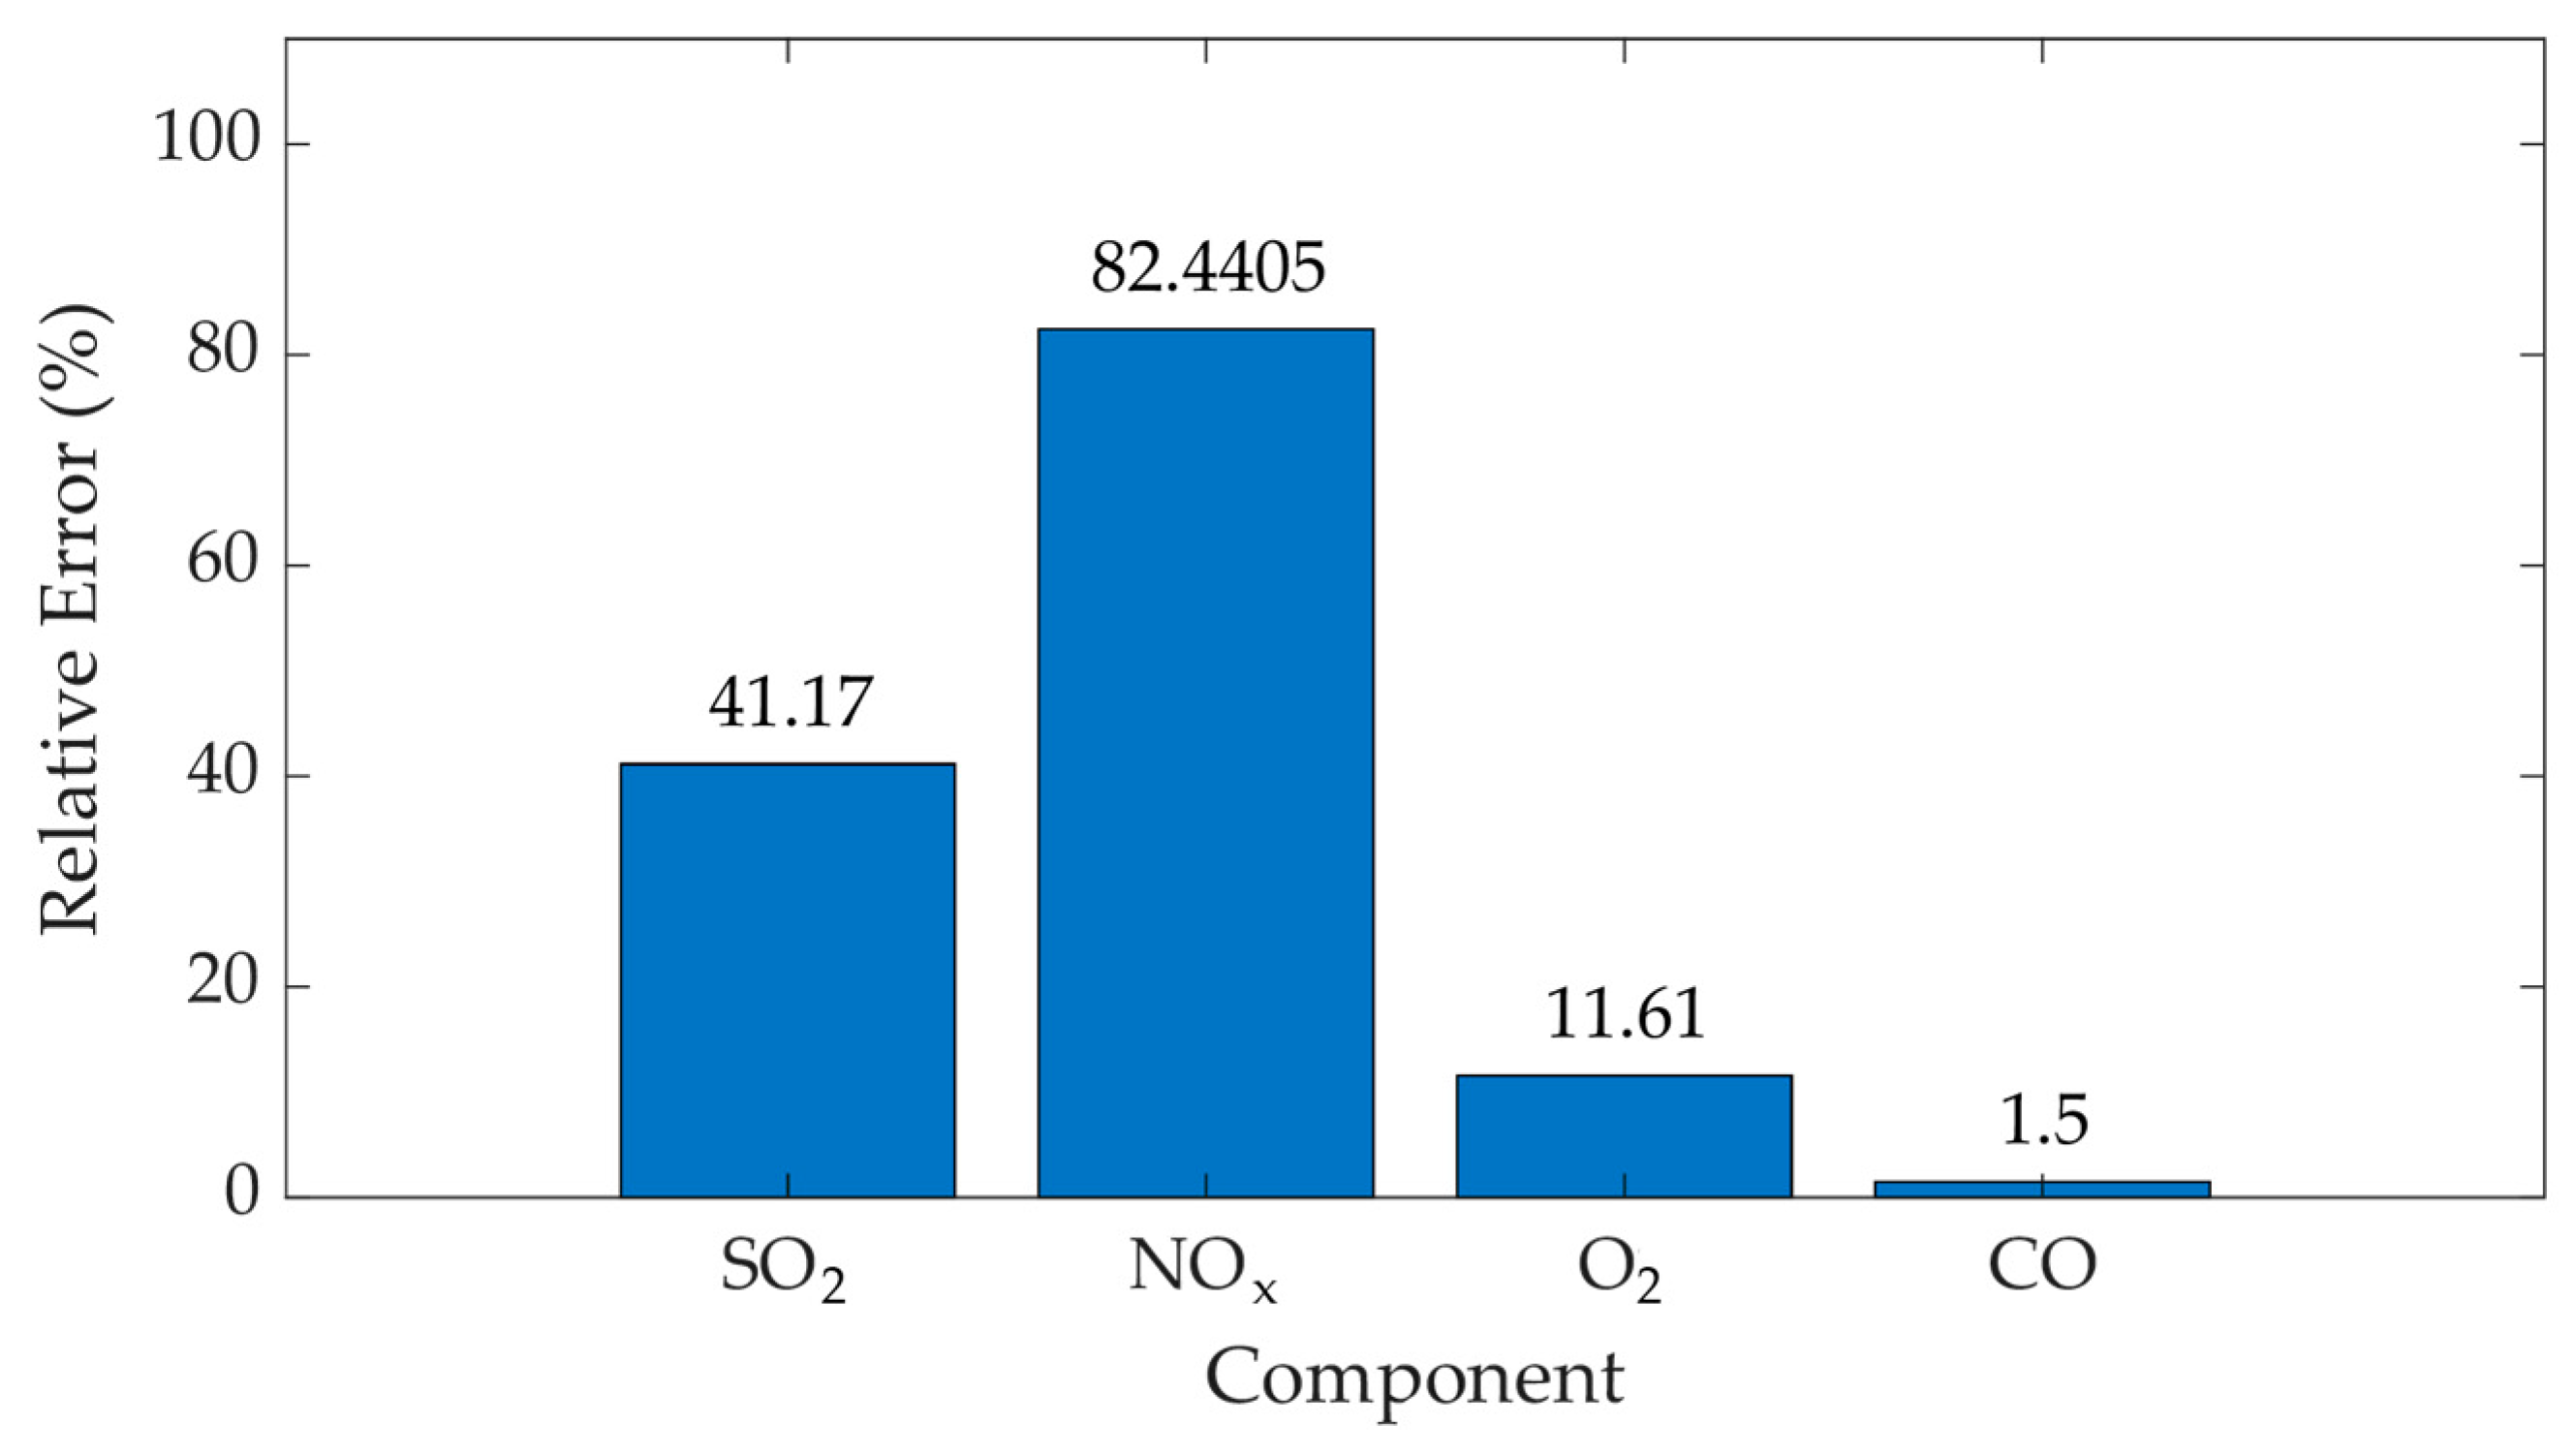
According to the statistical analysis, the relative measurement error for CO was 1.5%, for NOx it was 82.4405%, for SO2 it was 41.17%, and for O2 it was 11.61% (Figure 15).
The error distribution demonstrates that the deviation is very high for this device.

4. Discussion

The statistical analysis demonstrates high deviation of the measured values gained from different devices. According to the results obtained, humidity has an impact on the measurement accuracy. Moreover, the Fisher criterion demonstrated that the concentration of most components had a clear similarity with the reference measurements (Table 3). Considering each marker separately, namely for SO2, the f-value is 1.54, and for NO it was 3.09, confirming the null hypothesis with a significance of 0.01. Nevertheless, for NOx, the Fisher criterion was 6.46, for O2 it was 6.21, for CO it was 4.69, and for NO2 it was 65.9, thus rejecting the null hypothesis. It is worth noting that the concentration of NO2 cannot exceed the concentration of NOx. In addition, the statistical significance of 0.01 testing through the t- and ANOVA methods demonstrated that O2, SO2, and NOx values for Inspector 500 and AMS showed no significant deviation, but this was not so for NO, NO2, and CO (Table 4). The controversy of the results gained for O2 is demonstrated by the fact that the values could be corrected by mathematical tools, however, more measurements are needed to accomplish this goal. In the values for NO2, the reason for these significant deviations can be explained by the mistakes in the measurement and data computing processes. According to the comparison of the errors, the highest among all the components are for NO2, CO, and NO, which were caused by the water particles’ presence in the probe firstly, and secondly due to systematic error, which is explained by the gaps in the graphs (Figure 10). In addition, the automated monitoring system (AMS) has the auto-calibrating subsystem, which is automatic. Due to that, the AMS periodically cleans and sets itself by calibrating gas. However, the calibrating system is not monitored as well. Therefore, the error can be caused by the system. Moreover, a high error like for NO2, namely 733.26%, can lead to consequences which can worsen conditions of companies. An enterprise where stationary sources of emissions are registered pays an environmental fee annually, according to the maximum permissible emission standards. However, according to environmental monitoring, if these standards are exceeded, then fines are imposed on enterprises. Therefore, the consequences of such errors carry additional financial costs for the enterprise in the form of fines. As well as the consequence, an incorrect decision may be made within the framework of process control. On the other hand, the difference between the CO readings is caused by the fact that the measurement range of both devices differs. In addition, the RMD1 and RMD2 for both devices varied and reached 38% of the arithmetic mean at the factory error of 25% for devices built into the SOLER SGK-510. This fact indicates the presence of various factors that introduce a strong measurement error.
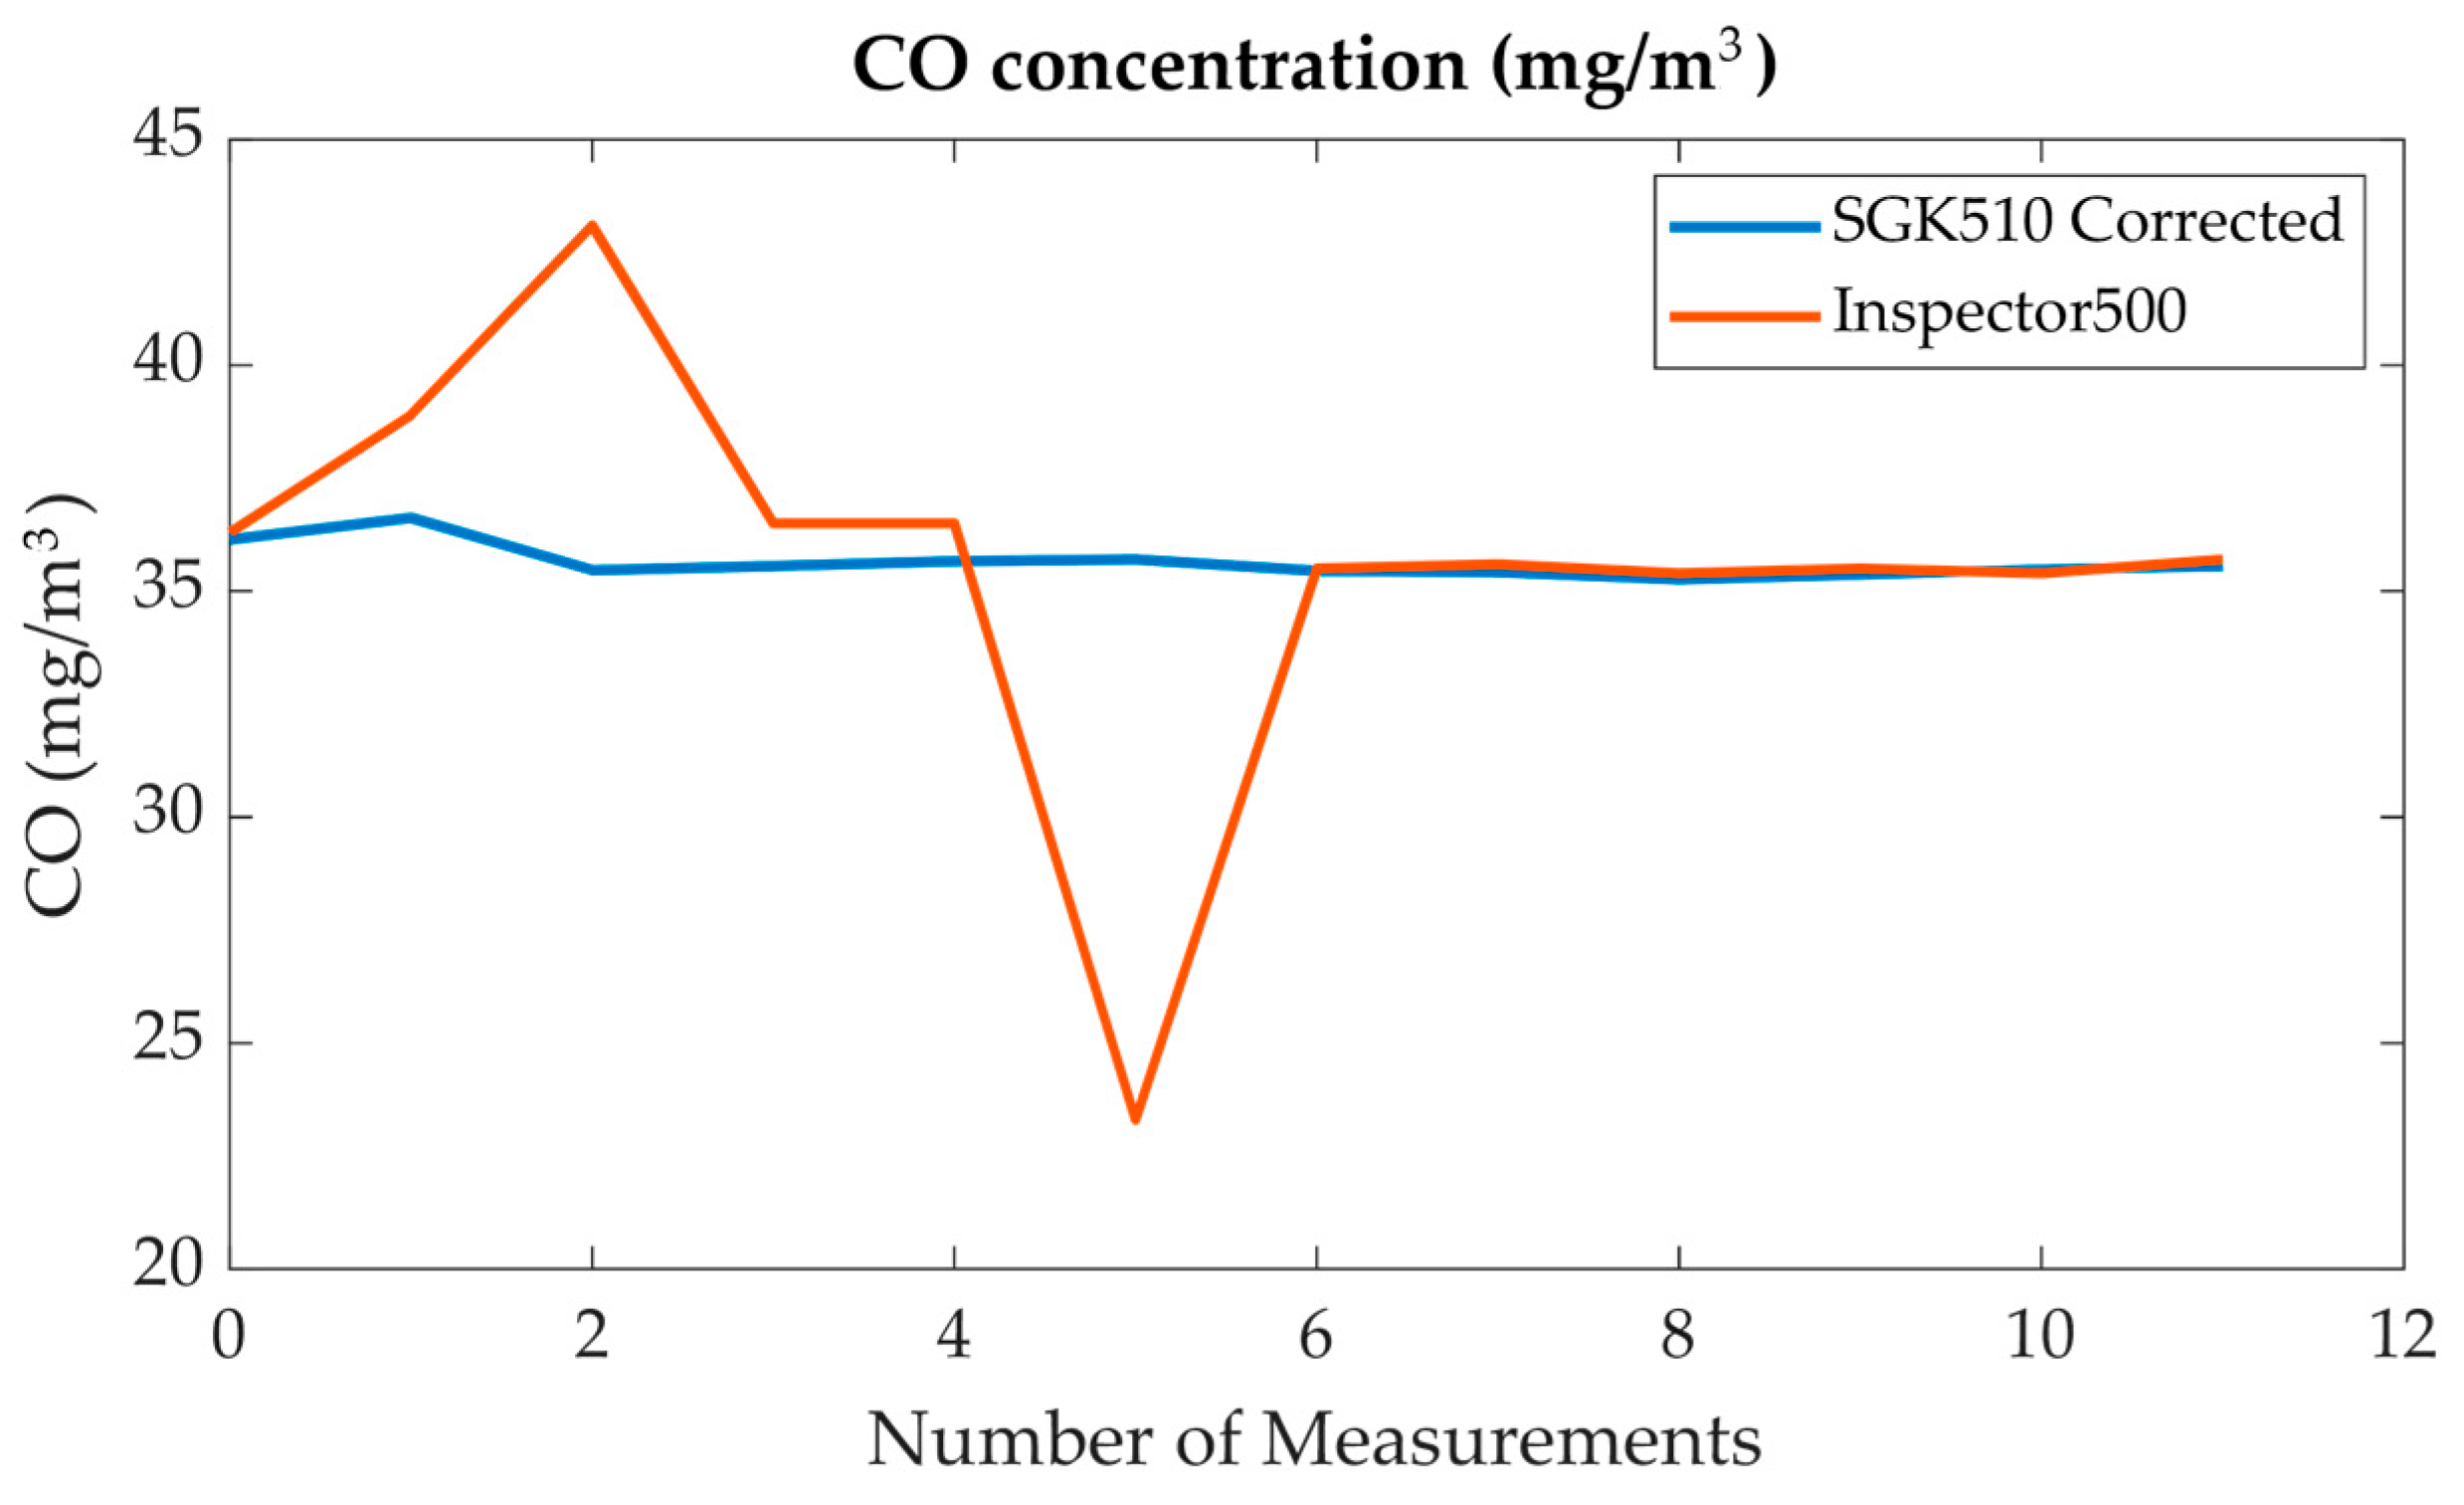
On the other hand, it is possible to increase the accuracy of measurements by using linear coefficients, and displacement using the least squares method (Figure 16).
Thus, the relative error in measuring the concentration of CO can be reduced to 0.0017%, but the Fisher criterion in this case is reduced to 13.86, which indicates that the dependence is approaching real measurements. In the case of NO, the error approaches 0%, and the Fisher criterion is 478.16, which also leads to the rejection of the null hypothesis (Figure 17).
Therefore, the use of a linear coefficient to correct the readings is impractical and requires further observation. Moreover, in order to increase the accuracy of this system, it is also necessary to use a multicomponent analysis of sample properties.
For the electrochemical method, the similarity analysis of two measurement samples using AMS and POLAR is difficult to assess. This limitation is caused by the complexity of obtaining exhaust gas samples. However, based on the measurements obtained and the values of the statistical assessment, it can be concluded that humidity has a strong effect on the accuracy of electrochemical measuring devices for NOx and SO2. Moreover, the water particle presence in the probe, even after the drying process, still has a significant effect on the error. In addition, different approaches and methods demonstrate that they have their special conditions in the measurement process. According to the results, the best method to recommend is optical. The statistical analysis by Fisher’s method resulted in f-values that for SO2 equals 6.06, for NOx 17.56, and for O2 11.11, thus rejecting the null hypothesis (Table 7). The ANOVA and t-test prove this suggestion. However, for CO with an f-value of 1.31, the null hypothesis is confirmed, which is also proved by the ANOVA test and the t-test (Table 7). In addition, the errors demonstrated in Figure 15, the measurement with electrochemical devices, has a disadvantage in comparison with the optical methods.
Nevertheless, the disadvantage can be eliminated by using a multicomponent concentration analysis of the main polluting markers according to the main parameters of the operation of power plants, namely, the technological process of boiler combustion, which will be carried out in the further research. In addition, the recommendations from the current work can be summed up by saying that the electrochemical method has a high error during the measurement of SO2 and NOx, thus for higher accuracy during the AMS integration in the technical process it is better to use optical instruments. On the other hand, the pollution concentration determination for both methods can be improved by a multicomponent analysis of the humidity, temperature, and flow of gas. Another disadvantage of this study is the lack of data such as humidity, temperature, and exhaust velocity of the exhaust gases, since the gas concentration readings change depending on them. The inclusion of this is possible by constructing a dependence on these parameters to find the adjustment coefficients. In this case, RMD1 and RMD2 had a smaller spread, which can be explained by the small number of measurements performed. However, in the case of CO measurement, it can be noted that there are a large number of random factors that determine such a strong deviation.

5. Conclusions

As a result of the work, an explanation of the increase in the measurement error of the optical method was theoretically presented. In order to prove this statement, test measurements were carried out. As the results showed, the humidity of the exhaust gas affects the measurement of the content of polluting components, among which a large error was observed in NO (78.89%) and CO (60.81%), which indicates the need to introduce additional mathematical adjustments to obtain reliable results. It is also worth noting that the obtained measurements for NOx also demonstrate an error caused by the operation of the system and malfunctions of the computer processing of measurements. In addition, the electrochemical method showed worse results in NOx and SO2 measurements with 82.4405% and 41.17% errors, accordingly, which indicates the need to introduce corrective methods to ensure the accuracy of the system, since this method is also common in measuring the concentration of exhaust gas components in power plants. Fisher’s method demonstrated that not only was the error a problem, but the measurement factors were as well. The ANOVA and t-test methods proved this suggestion. The recommendation of both methods can also be introduced into regulations. In general, the study showed that the use of mathematical tools for tuning measuring instruments is possible in the case of the optical method. However, other approaches are needed for the ultrasound method. Despite these arguments, it can be noted that, in this way, industrial organizations will be able to achieve greater accuracy in measuring pollutants at lower costs. In addition, the application of a multicomponent analysis considering exhaust gas humidity, temperature, and flow can possibly increase accuracy and improve the measurement process in total.

Supplementary Materials

The following supporting information can be downloaded at: https://github.com/KazambayevIlyas/OpticalAndElect.git (accessed on 18 November 2024).

Author Contributions

Conceptualization, A.N. and A.B.; methodology, I.K.; validation, A.N., A.B., and I.K.; formal analysis, L.K. and S.B.; investigation, I.K.; resources, A.N.; writing—original draft preparation, A.N. and I.K.; writing—review and editing, U.Z., I.K., A.N., and A.B.; supervision, A.N.; project administration, A.B. and S.B.; funding acquisition, A.B. All authors have read and agreed to the published version of the manuscript.

Funding

This research was funded by the Science Committee of the Ministry of Science and Higher Education of the Republic of Kazakhstan, grant number BR21882258 “Development of Intelligent Information and Communication Systems Complex for Environmental Emission Monitoring to Make Decisions on Carbon Neutrality”.

Institutional Review Board Statement

Not applicable.

Informed Consent Statement

Not applicable.

Data Availability Statement

The original contributions presented in the study are included in the article/Supplementary Material, further inquiries can be directed to the corresponding author.

Acknowledgments

The authors are grateful to Promanalyt LLP for providing the data.

Conflicts of Interest

The authors declare no conflicts of interest.

References

  1. Brauer, M.; Brook, J.R.; Christidis, T.; Chu, Y.; Crouse, D.L.; Erickson, A.; Hystad, P.; Li, C.; Martin, R.V.; Meng, J.; et al. Mortality-Air Pollution Associations in Low-Exposure Environments (MAPLE): Phase 1. Res. Rep. Health Eff. Inst. 2019, 2019, 203. [Google Scholar] [PubMed]
  2. Surianshah, S.; Hassan, S.; Liwan, A. The Effect of Green Technology Policy on Climate Change Awareness of Youth in Sabah, Malaysia. J. Adv. Res. Appl. Sci. Eng. Technol. 2024, 43, 42–51. [Google Scholar] [CrossRef]
  3. Cakaj, A.; Qorri, E.; Coulibaly, F.; De Marco, A.; Agathokleous, E.; Leca, Ș.; Sicard, P. Assessing Surface Ozone Risk to Human Health and Forests over Time in Poland. Atmos. Environ. 2023, 309, 119926. [Google Scholar] [CrossRef]
  4. The Paris Agreement. Available online: https://www.un.org/en/climatechange/paris-agreement (accessed on 20 August 2024).
  5. The European Green Deal. Available online: https://commission.europa.eu/strategy-and-policy/priorities-2019-2024/european-green-deal_en (accessed on 20 August 2024).
  6. The 2030 Agenda for Sustainable Development. Available online: https://sdgs.un.org/goals (accessed on 20 August 2024).
  7. U.S. Environmental Protection Agency (EPA). Available online: https://www.epa.gov/ (accessed on 29 September 2024).
  8. EUR-Lex—Access to European Union Law. Available online: https://eur-lex.europa.eu/homepage.html?locale=en (accessed on 29 September 2024).
  9. United Nations Economic Commission for Europe (UNECE). Gothenburg Protocol to the UNECE Convention on Long-Range Transboundary Air Pollution. 1999. Available online: https://unece.org/fileadmin/DAM/env/lrtap/full%20text/1999%20Protocol%20to%20Abate.pdf (accessed on 29 September 2024).
  10. ISO 14001:2015; Environmental Management Systems—Requirements with Guidance for Use. International Organization for Standardization: Geneva, Switzerland, 2015.
  11. ISO 12039; Stationary Source Emissions—Determination of Carbon Monoxide, Carbon Dioxide, and Oxygen—Performance Characteristics and Calibration of Automated Measuring Systems. International Organization for Standardization: Geneva, Switzerland, 2001.
  12. ISO 10473; Ambient Air—Measurement of Sulfur Dioxide—Ultraviolet Fluorescence Method. International Organization for Standardization: Geneva, Switzerland, 2000.
  13. Decree of the President of the Republic of Kazakhstan Dated 2 February 2023 No. 121 “On Approval of the Strategy for Achieving National Neutrality of the Republic of Kazakhstan Until 2060”. Available online: https://adilet.zan.kz/rus/docs/U2300000121 (accessed on 20 August 2024).
  14. Order of the Minister of Ecology, Geology and Natural Resources of the Republic of Kazakhstan dated 22 June 2021 No. 208. Registered with the Ministry of Justice of the Republic of Kazakhstan dated 22 July 2021 No. 23659. “On Approval of the Rules for Maintaining an Automated System for Monitoring Emissions into the Environment During Industrial Environmental Control”. Available online: https://adilet.zan.kz/eng/docs/V2100023659 (accessed on 20 August 2024).
  15. Khan, M.A.H.; Rao, M.V.; Li, Q. Recent Advances in Electrochemical Sensors for Detecting Toxic Gases: NO2, SO2 and H2S. Sensors 2019, 19, 905. [Google Scholar] [CrossRef]
  16. Pan, Y.; Zhang, J.; Guo, X.; Li, Y.; Li, L.; Pan, L. Recent Advances in Conductive Polymers-Based Electrochemical Sensors for Biomedical and Environmental Applications. Polymers 2024, 16, 1597. [Google Scholar] [CrossRef] [PubMed]
  17. He, Q.; Wang, B.; Liang, J.; Liu, J.; Liang, B.; Li, G.; Long, Y.; Zhang, G.; Liu, H. Research on the Construction of Portable Electrochemical Sensors for Environmental Compounds Quality Monitoring. Mater. Today Adv. 2023, 17, 100340. [Google Scholar] [CrossRef]
  18. Tang, C.; Tan, J. Quasi-Targeted Analysis of Halogenated Organic Pollutants in Fly Ash, Soil, Ambient Air and Flue Gas Using Gas Chromatography-High Resolution Mass Spectrometry with Isotopologue Distribution Comparison and Predicted Retention Time Alignment. J. Chromatogr. A 2018, 1555, 74–88. [Google Scholar] [CrossRef]
  19. Lopes, A.F.; Fernandes, T.S.M.; do Nascimento, R.F. Barrier Discharge Ionization Detector in Gas Chromatography: A Review on Applications. Crit. Rev. Anal. Chem. 2021, 53, 614–633. [Google Scholar] [CrossRef]
  20. Zhao, Y.; Kreisberg, N.M.; Worton, D.R.; Teng, A.P.; Hering, S.V.; Goldstein, A.H. Development of an In Situ Thermal Desorption Gas Chromatography Instrument for Quantifying Atmospheric Semi-Volatile Organic Compounds. Aerosol Sci. Technol. 2012, 47, 258–266. [Google Scholar] [CrossRef]
  21. Smith, D.; Španěl, P.; Demarais, N.; Langford, V.S.; McEwan, M.J. Recent Developments and Applications of Selected Ion Flow Tube Mass Spectrometry (SIFT-MS). Mass Spectrom. Rev. 2024, 43, 1002–1025. [Google Scholar] [CrossRef]
  22. Lay, J.O.; Liyanage, R.; Gidden, J.A. The Development of a High-Resolution Mass Spectrometry Method for Ultra-Trace Analysis of Chlorinated Dioxins in Environmental and Biological Samples Including Viet Nam Era Veterans. Mass Spectrom. Rev. 2021, 40, 236–254. [Google Scholar] [CrossRef] [PubMed]
  23. Zhao, Y.-F.; Gao, J.; Cai, Y.-J.; Wang, J.-J.; Pan, J. Real-Time Tracing VOCs, O3, and PM2.5 Emission Sources with Vehicle-Mounted Proton Transfer Reaction Mass Spectrometry Combined with Differential Absorption Lidar. Atmos. Pollut. Res. 2021, 12, 146–153. [Google Scholar] [CrossRef]
  24. Choi, W.; Yang, J.; Lee, H.; Van Roozendael, M.; Koo, J.-H.; Park, J.; Kim, D. Investigation of Aerosol Peak Height Effect on PBL and Volcanic Air Mass Factors for SO2 Column Retrieval from Space-Borne Hyperspectral UV Sensors. Remote Sens. 2020, 12, 1459. [Google Scholar] [CrossRef]
  25. Khan, S.; Newport, D.; Le Calvé, S. Gas Detection Using Portable Deep-UV Absorption Spectrophotometry: A Review. Sensors 2019, 19, 5210. [Google Scholar] [CrossRef] [PubMed]
  26. Barreto, D.; Rodrigues Silva, W.; Mizaikoff, B.; Petruci, J.F. Monitoring Ozone Using Portable Substrate-Integrated Hollow Waveguide-Based Absorbance Sensors in the Ultraviolet Range. ACS Meas. Sci. Au 2021, 2, 39–45. [Google Scholar] [CrossRef]
  27. Chen, Y.; Zhang, S.; Yao, Q.; Miao, Y.; Qiu, N. Quantitative Detection of SO2, H2S, and CS2 Based on Ultraviolet Absorption Spectrometry and Least Squares Algorithm. In Proceedings of the 2020 IEEE 4th Conference on Energy Internet and Energy System Integration (EI2), Wuhan, China, 30 October–1 November 2020; pp. 3905–3910. [Google Scholar] [CrossRef]
  28. Zhang, Y.; Jiang, J.; Wang, X.; Cui, Z.; Li, Y.; Bian, C.; Chen, X. SO2 and SOF2 Gas Mixture Detection by Mid-Infrared Laser Photoacoustic Spectroscopy Based on IWOA-BP. IEEE Trans. Dielectr. Electr. Insul. 2024. [Google Scholar] [CrossRef]
  29. Dinh, T.-V.; Choi, I.-Y.; Son, Y.-S.; Kim, J.-C. A Review on Non-Dispersive Infrared Gas Sensors: Improvement of Sensor Detection Limit and Interference Correction. Sens. Actuators B Chem. 2016, 231, 529–538. [Google Scholar] [CrossRef]
  30. Wang, Q.; Liu, Y.-P.; Li, W.-L. Development of a Multi-Component Infrared Gas Sensor Detection System. J. Phys. Conf. Ser. 2019, 1229, 012068. [Google Scholar] [CrossRef]
  31. Huang, Q.; Li, W.; Wu, T.; Ma, X.; Jiang, K.; Jin, X. Monoethanolamine-Enabled Electrochemical Detection of H2S in a Hydroxyl-Functionalized Ionic Liquid. Electrochem. Commun. 2018, 88, 93–96. [Google Scholar] [CrossRef]
  32. Balaish, M.; Rupp, J.L.M. Design of Triple and Quadruple Phase Boundaries and Chemistries for Environmental SO2 Electrochemical Sensing. J. Mater. Chem. A 2021, 9, 14691–14699. [Google Scholar] [CrossRef]
  33. Melios, C.; Panchal, V.; Edmonds, K.; Lartsev, A.; Yakimova, R.; Kazakova, O. Detection of Ultralow Concentration NO2 in Complex Environment Using Epitaxial Graphene Sensors. ACS Sens. 2018, 3, 1666–1674. [Google Scholar] [CrossRef]
  34. Zhao, Z.; Ma, C.; Xu, L.; Yu, Z.; Wang, D.; Jiang, L.; Jiang, X.; Gao, G. Conductive Polyaniline-Based Microwire Arrays for SO2 Gas Detection. ACS Appl. Mater. Interfaces 2023, 15, 38938–38945. [Google Scholar] [CrossRef]
  35. Braunger, M.L.; da Silva, E.A.; Fier, I.; Redon, N.; Duc, C. Optimizing Polyaniline-Based Gas Sensors for Hydrogen Sulfide Detection: The Crucial Role of Solvent Choice. Proceedings 2024, 97, 184. [Google Scholar] [CrossRef]
  36. Varlet, V.; Giuliani, N.; Palmiere, C.; Maujean, G.; Augsburger, M. Hydrogen Sulfide Measurement by Headspace-Gas Chromatography-Mass Spectrometry (HS-GC-MS): Application to Gaseous Samples and Gas Dissolved in Muscle. J. Anal. Toxicol. 2015, 39, 52–57. [Google Scholar] [CrossRef] [PubMed]
  37. Lushozi, S.; Tshilongo, J.; Chimuka, L. Verification of Nitrous Oxide Primary Standard Gas Mixtures by Gas Chromatography and Cavity Ring-Down Spectroscopy for Ambient Measurements in South Africa. Accred. Qual. Assur. 2019, 24, 203–214. [Google Scholar] [CrossRef]
  38. Kirk, A.; Last, T.; Zimmermann, S. A Sensitive Gas Chromatography Detector Based on Atmospheric Pressure Chemical Ionization by a Dielectric Barrier Discharge. J. Chromatogr. A 2016, 1483, 120–126. [Google Scholar] [CrossRef]
  39. Vasquez, K.T.; Allen, H.M.; Crounse, J.D.; Praske, E.; Xu, L.; Noelscher, A.C.; Wennberg, P.O. Low-Pressure Gas Chromatography with Chemical Ionization Mass Spectrometry for Quantification of Multifunctional Organic Compounds in the Atmosphere. Atmos. Meas. Tech. 2018, 11, 6815–6832. [Google Scholar] [CrossRef]
  40. Risoluti, R.; Materazzi, S. Mass Spectrometry for Evolved Gas Analysis: An Update. Appl. Spectrosc. Rev. 2018, 54, 87–116. [Google Scholar] [CrossRef]
  41. Roberts, I.J.; Carpenter, L.J.; Shaw, M.D.; Langford, V.S. Selected Ion Flow Tube—Mass Spectrometry (SIFT-MS) Study of the Reactions of H3O+, NO+, and O2+ with a Range of Oxygenated Volatile Organic Carbons (OVOCs). Int. J. Mass Spectrom. 2022, 479, 116892. [Google Scholar] [CrossRef]
  42. Balsubramaniam, B.G.; Bekal, A.; Rajeshirke, Y.; Mitra, C. Ultraviolet Absorption Spectral Data Analysis for Flue Gas Detection. In Applied Industrial Optics 2021; Miller, G., Smith, A., Capraro, I., Majors, J., Eds.; OSA Technical Digest (Optica Publishing Group, 2021): Washington, DC, USA, 2021; paper F2A.1. [Google Scholar]
  43. Lu, K. Development of a UV-Based Remote Sensing Technology for Sulphur Dioxide Monitoring from Ship Emissions. Ph.D. Thesis, The Hong Kong Polytechnic University, Hong Kong, China, 2023. Available online: https://theses.lib.polyu.edu.hk/handle/200/12306 (accessed on 18 November 2024).
  44. Khan, M.A.H.; Thomson, B.; Debnath, R.; Rani, A.; Motayed, A.; Rao, M.V. Reliable Anatase-Titania Nanoclusters Functionalized GaN Sensor Devices for UV-Assisted NO2 Gas-Sensing in ppb Level. Nanotechnology 2019, 31, 155504. [Google Scholar] [CrossRef]
  45. da Silveira Petruci, J.F.; Wilk, A.; Cardoso, A.A.; Mizaikoff, B. A Hyphenated Preconcentrator-Infrared-Hollow-Waveguide Sensor System for N2O Sensing. Sci. Rep. 2018, 8, 5909. [Google Scholar] [CrossRef]
  46. Zhao, Y.; Zhang, C.; Ci, G.; Zhao, X.; Lv, J.; Liang, J.; Ming, A.; Wei, F.; Mao, C. Development of High-Precision NO2 Gas Sensor Based on Non-Dispersive Infrared Technology. Sensors 2024, 24, 4146. [Google Scholar] [CrossRef]
  47. Zhalmagambetova, U.; Radelyuk, I.; Omerbayeva, D.; Neftissov, A.; Kazambayev, I. Environmental Monitoring in Kazakhstani Context—State-of-the-Art and Challenges for Industrial Region. Vestn. Toraygyrov Univ. Energy Ser. 2024, 1, 82–93. [Google Scholar] [CrossRef]
  48. Biloshchytskyi, A.; Kuchanskyi, O.; Andrashko, Y.; Yedilkhan, D.; Neftissov, A.; Biloshchytska, S.; Amirgaliyev, B.; Vatskel, V. Reducing Outdoor Air Pollutants through a Moss-Based Biotechnological Purification Filter in Kazakhstan. Urban Sci. 2023, 7, 104. [Google Scholar] [CrossRef]
  49. Government of the Republic of Kazakhstan. Approval of the Best Available Techniques Reference Document “Combustion of Fuel in Large Installations for Energy Production.” Resolution No. 23 dated 23 January 2024. Available online: https://adilet.zan.kz/rus/docs/P2400000023 (accessed on 26 October 2024).
  50. EN 14181; Stationary source emissions—Quality Assurance of Automated Measuring Systems (AMS). European Committee for Standardization: Brussels, Belgium, 2014.
  51. Scott, C. Introduction to Optics and Optical Imaging; IEEE: Piscataway, NJ, USA, 1998. [Google Scholar] [CrossRef]
  52. Idemen, M.M. Discontinuities in the Electromagnetic Field; IEEE Press Series on Electromagnetic Wave Theory; Wiley-IEEE Press: Hoboken, NJ, USA, 2011. [Google Scholar]
  53. Jahnke, J.A. Continuous Emission Monitoring, 3rd ed.; Wiley: Hoboken, NJ, USA, 2020. [Google Scholar]
  54. SGK-510 SOLER. Available online: https://promanalyt.kz/en/catalog/control-cabinets/portable-and-stationary-gas-analyzers/stationary-oxygen-analyzers/sgk-510-soler (accessed on 20 August 2024).
  55. Promanalyt. Polar Portable and Stationary Gas Analyzers for Controlling Industrial Emissions. Retrieved 18 November 2024. Available online: https://promanalyt.kz/en/catalog/control-cabinets/portable-and-stationary-gas-analyzers/to-control-industrial-emissions/polar (accessed on 20 August 2024).
  56. ISO 13752:1998; Environmental Management—Assessment of the Environmental Impact of Activities—Expert Judgement. International Organization for Standardization: Geneva, Switzerland, 1998. Available online: https://www.iso.org/standard/2821.html (accessed on 29 September 2024).
  57. Breusch, T.S.; Pagan, A.R. A Simple Test for Heteroscedasticity and Random Coefficient Variation. Econometrica 1979, 47, 1287–1294. [Google Scholar] [CrossRef]
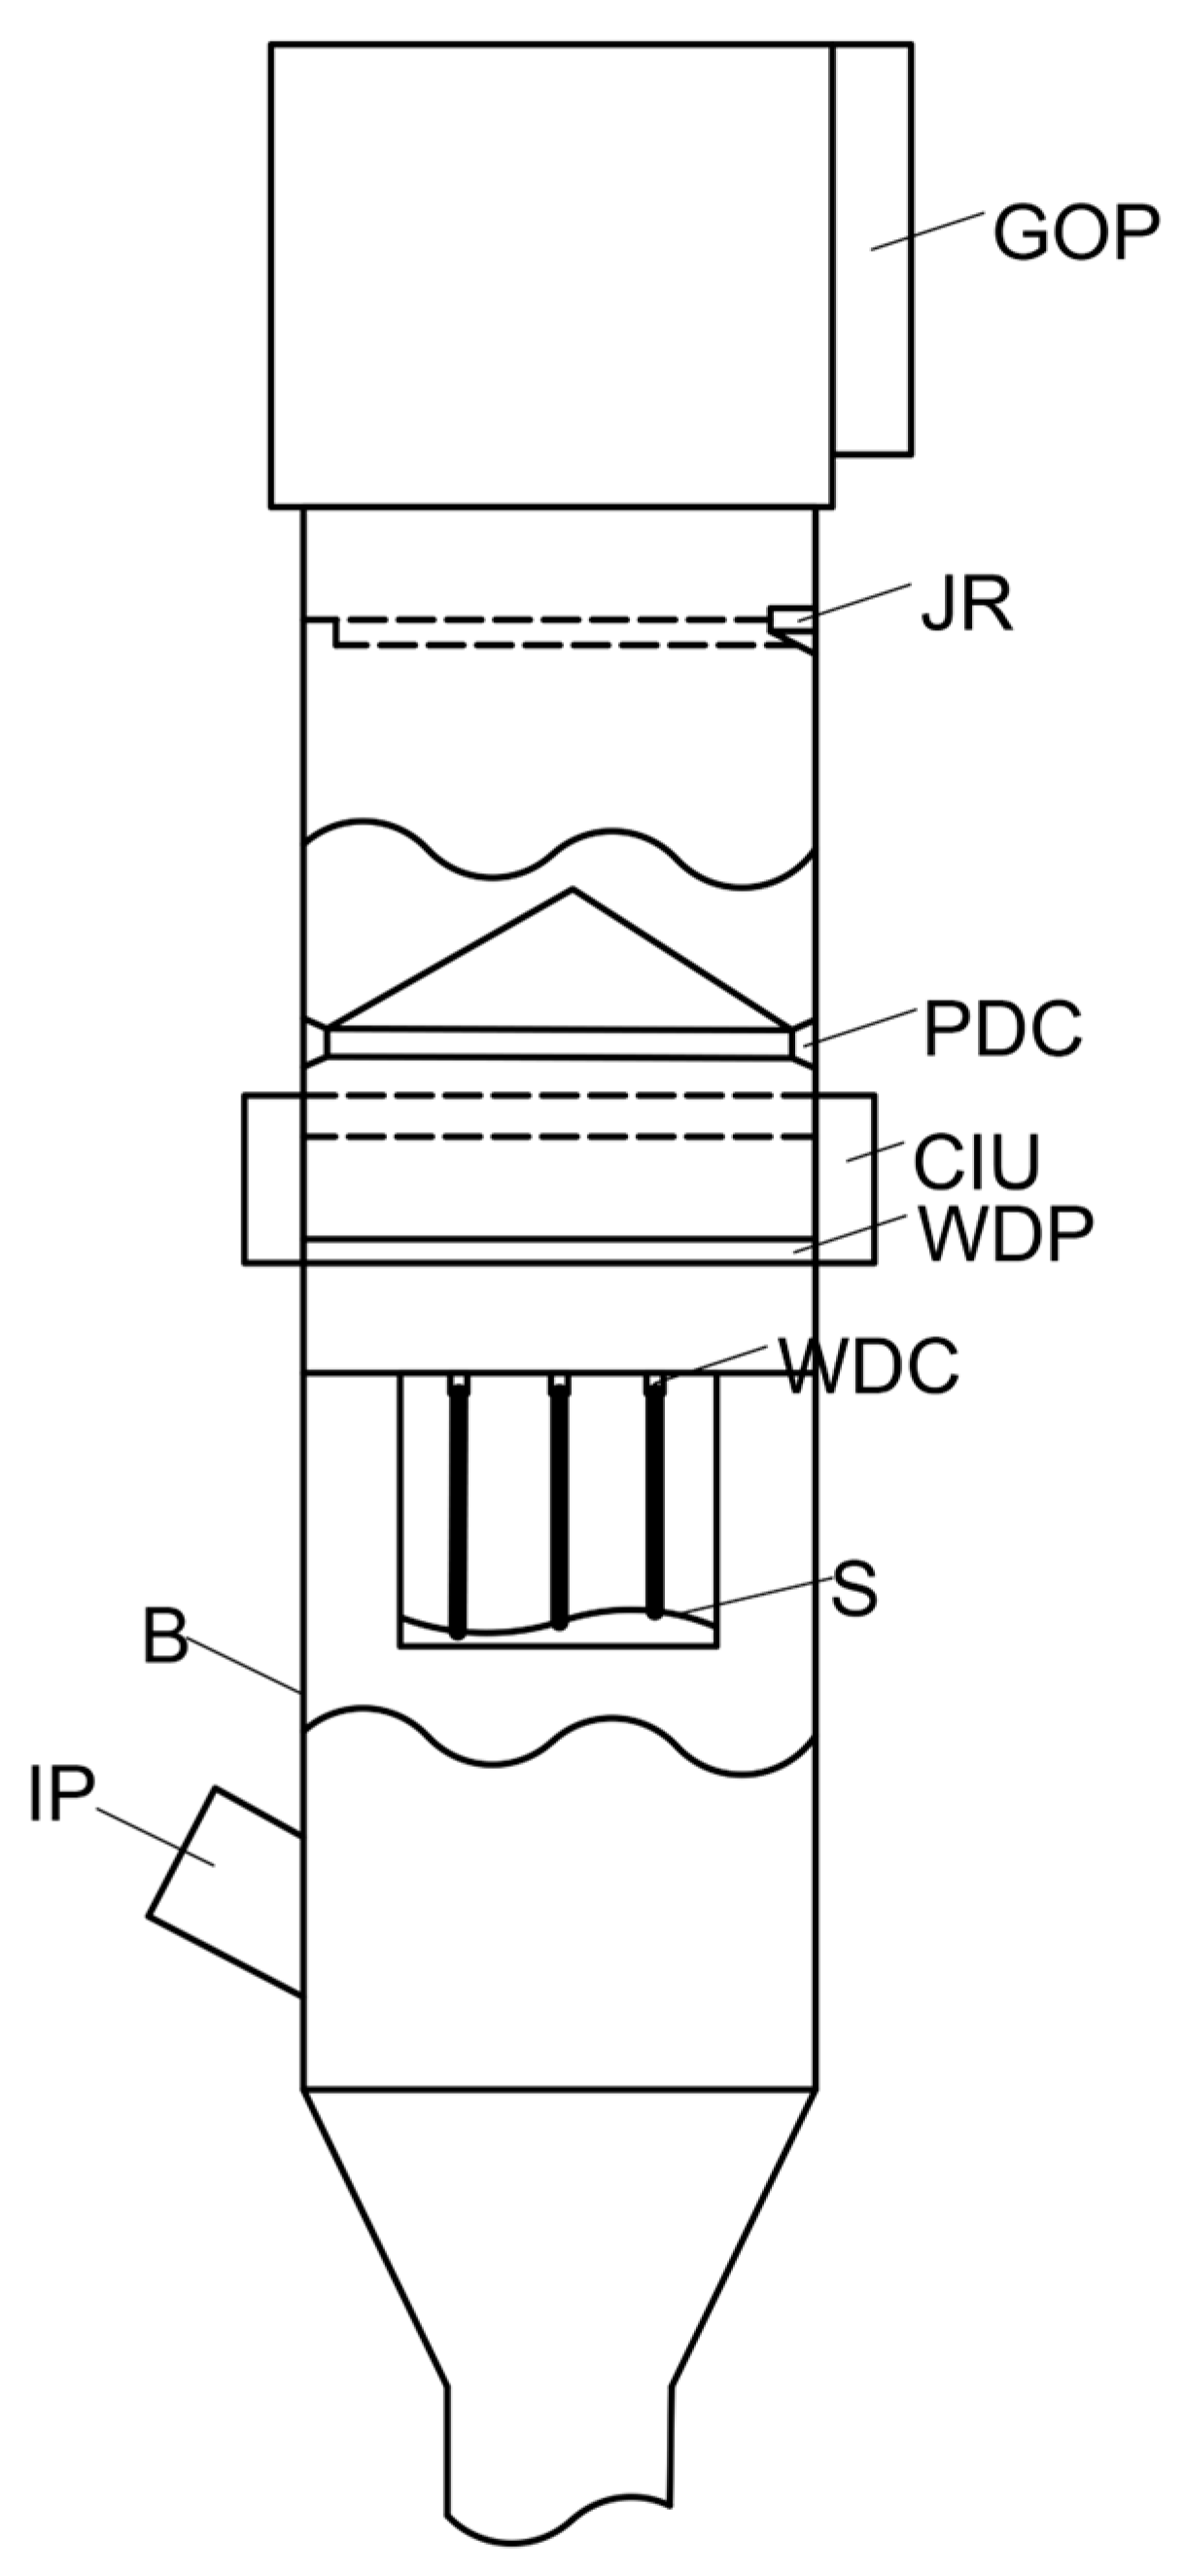
Figure 1. Second-generation emulsifier filter structural scheme.
Applsci 14 10934 g001
Figure 2. Structural scheme of optical method for exhaust gases’ content determination.
Applsci 14 10934 g002
Figure 3. A block diagram of the concentration determination process.
Applsci 14 10934 g003
Figure 4. SGK510 structural scheme.
Applsci 14 10934 g004
Figure 5. Block diagram of electrochemical gas content determination.
Applsci 14 10934 g005
Figure 6. Absorption spectrum of components [53] (* is used for the components that emit light).
Applsci 14 10934 g006
Figure 7. F-value distribution for components calculated by ISO-13752.
Applsci 14 10934 g007
Figure 8. Comparison of mean values for concentration: (a)—for SO2, NO. NO2, NOx, CO; (b)—for O2.
Applsci 14 10934 g008aApplsci 14 10934 g008b
Figure 9. Comparison of statistical values for components: (a)—for SO2, NO. NOx, O2; (b)—for NO2, CO.
Applsci 14 10934 g009aApplsci 14 10934 g009b
Figure 10. Measurement graphs for the main markers: (a)—SO2, (b)—NO, (c)—NO2, (d)—NOx, (e)—O2, (f)—CO.
Applsci 14 10934 g010
Figure 11. Errors in concentration.
Applsci 14 10934 g011
Figure 12. POLAR measurements: (a)—for SO2, NOx, CO; (b)—for O2.
Applsci 14 10934 g012
Figure 13. Measurement graphs for the main markers: (a)—SO2, (b)—NOx, (c)—O2, (d)—CO.
Applsci 14 10934 g013
Figure 14. Comparison of statistical values for SO2, NOx, O2.
Applsci 14 10934 g014
Figure 15. Errors for concentration with POLAR.
Applsci 14 10934 g015
Figure 16. Adjusted dependence of CO measurements of AMS.
Applsci 14 10934 g016
Figure 17. Adjusted dependence of AMS measurements.
Applsci 14 10934 g017
Table 1. Measurements performed using the Inspector 500 (I500) and the AMS for SO2, NO, and NO2 (reference O2 is 6%).
Time
(19 June 2024)
SO2 (mg/m3) (I500)SO2 (mg/m3) (AMS)NO (mg/m3) (I500)NO (mg/m3) (AMS)NO2 (mg/m3) (I500)NO2 (mg/m3) (AMS)
11:00228.2 218.3 119.3 87.0 4.3 535.3
11:20246.5 285.9 102.2 64.7 8.5 398.1
11:40118.6 171.5 75.8 41.9 10.2 258
12:00321.0 277.5 132.4 72.2 4.8 444.5
12:20316.2 336.8 95.4 66.9 6.0 411.9
12:40133.2 302.8 3.8 67.6 4.0 415.8
13:00375.1 387.1 127.3 67.4 3.2 415
13:20405.4 416.7 132.9 67.8 3.5 417
13:40416.2 419.4 133.0 67.5 4.2 415.6
14:00419.7 414.6 133.8 -0.4 4.0 −2.3
14:20430.8 442.2 132,6 68.2 4.2 419.7
14:40432 446.4 131.5 67.1 4.2 412.7
Table 2. Measurements performed using the Inspector 500 (I500) and the AMS for NOx, O2, and CO (reference O2 is 6%).
Time
(19 June 2024)
NOx (mg/m3) (I500)NOx (mg/m3) (AMS)O2 (%) (I500)O2 (%) (AMS)CO (mg/m3) (I500)CO (mg/m3) (AMS)
11:00165.5139.3 16.7 16.3 36.3 16.7
11:20148.2 166.6 15.1 16.0 38.9 19.3
11:40115.3 115.9 15.1 17.7 43.1 13.0
12:00183.9 151.2 15.3 16.7 36.5 13.5
12:20135.7 176.2 15.9 15.9 36.5 14.1
12:4010.4 176.1 19.7 15.9 23.3 14.3
13:00174.8 177.8 15.4 15.9 35.5 12.9
13:20182.5 178.1 15.1 15.9 35.6 12.8
13:40183.6 174.1 15.1 16 35.4 11.9
14:00184.5 174.8 15.2 16.1 35.5 12.5
14:20183,2 179 15.3 15.9 35.4 13.1
14:40181,6 176.8 15.1 15.9 35.7 13.5
Table 3. The results of statistical analysis of measurements of the traditional system in comparison with the standard.
Component y ¯ 1 y ¯ 2 RMD1RMD2S1S2f
SO2343.27320.2488.05109.418458.0813,058.621.54
NO61.4911020.936.75476.721472.953.09
NO2378.445.09128.591.964.1818,038.193958.2
NOx165.49154.119.0648.46396.332561.766.46
O216.1815.750.511.27380.28521.776.21
CO13.9735.641.984.294.282.014.69
Table 4. The results of statistical analysis in comparison with three methods: Fisher’s test, t-test, ANOVA test.
Componentf (Fisher’s Test)t-Value (t-Test)F-Value (ANOVA)p-Value (t-Test)p-Value (ANOVA)
SO21.540.54380.29570.59230.5921
NO3.093.805614.48280.00140.001
NO23958.29.628492.706700
NOx6.460.72550.52630.47990.4758
O26.211.04711.09640.31220.3064
CO4.6915.2198231.642400
Table 5. Measurements performed using the POLAR (P) and the AMS (reference oxygen concentration is 6%).
TimeSO2 (mg/m3) (P)SO2 (mg/m3) (AMS)NOx (mg/m3) (P)NOx (mg/m3) (AMS)O2 (%) (P)O2 (%) (AMS)CO (mg/m3) (I500)CO (mg/m3) (AMS)
9:251052 15836633478.1 7.2 41 25
9:301005 1582675 3438 7.244 19
10:23863 1552662 3588 7.3 31 12
11:21878 1637 577 3147.7 6.9 453 410
14:1089516234883188.1-353470
Table 6. Results of statistical analysis of measurements of the traditional system in comparison with the standard.
Component y ¯ 1 y ¯ 2 RMD1RMD2S1S2f
SO21595.4938.630.6975.571177.37139.36.06
NOx33661317.180.1365.56416.517.56
O27.157.980.150.1470.030.002711.11
CO187.2184.4207.32181.3253,727.741,094.81.31
Table 7. The results of statistical analysis in comparison with three methods: Fisher’s test, t-test, ANOVA test.
Componentf (Fisher’s Test)t-Value (t-Test)F-Value (ANOVA)p-Value (t-Test)p-Value (ANOVA)
SO26.0616.1044259.352500
NOx17.567.521256.56810.00110.0001
O211.116.532042.66670.00060.0006
CO1.310.02030.00040.98430.9843
Disclaimer/Publisher’s Note: The statements, opinions and data contained in all publications are solely those of the individual author(s) and contributor(s) and not of MDPI and/or the editor(s). MDPI and/or the editor(s) disclaim responsibility for any injury to people or property resulting from any ideas, methods, instructions or products referred to in the content.