Article

A New Approach to 3D Facilities Management in Buildings Using GIS and BIM Integration: A Case Study Application

by
César A. Carrasco
1,
Ignacio Lombillo
1,*,
Javier M. Sánchez-Espeso
2 and
Francisco Javier Balbás
3
1
Building Technology R&D Group, Structural Engineering & Mechanics Department, University of Cantabria, Av. de los Castros 44, 39005 Santander, Spain
2
Geographical Engineering & Graphical Expression Techniques Department, University of Cantabria, 39005 Santander, Spain
3
Electrical and Energy Engineering Department, University of Cantabria, 39005 Santander, Spain
*
Author to whom correspondence should be addressed.
Appl. Sci. 2024, 14(23), 11097; https://doi.org/10.3390/app142311097
Submission received: 8 October 2024 / Revised: 22 November 2024 / Accepted: 26 November 2024 / Published: 28 November 2024
(This article belongs to the Special Issue Building Information Modeling (BIM): Advance and Future Trends)

Abstract

:
This research seeks to advance the technological process of 3D digitization in built environments and streamline management processes in the construction sector through digital methodologies. To this end, an integration framework is proposed that combines geographic information systems (GISs) and building information modeling (BIM) digital models, specifically for simulating building facilities maintenance management. Although the proposed methodology is applicable across various geographical contexts and building typologies, to ensure clarity in its development, it was applied to a specific case study. For this purpose, a 3D GIS model was created for one of the campuses of the University of Cantabria in Santander, Spain, along with a BIM model for one of its university buildings. Using these integrated models, facility management was simulated within a 3D environment via a computerized maintenance management system (CMMS). The findings indicated that GIS and BIM digital models could indeed be integrated through straightforward linking mechanisms without compromising the efficiency of information synchronization and management. When comparing 2D facility management approaches with 3D formats, the advantages of 3D visualization became clear. This three-dimensional representation allowed for a more intuitive understanding of spatial dynamics and interactions, facilitating quicker identification of potential issues and more efficient maintenance operations. Consequently, integrating these advanced digital models not only optimizes operational efficiency but also fosters a collaborative environment, fundamentally transforming building facilities management.

1. Introduction

Building information modeling (BIM) involves creating a comprehensive virtual model of a physical asset, enabling various applications in both urban and building environments. BIM is technically linked to the concept of a “digital twin” [1,2]. A geographic information system (GIS) complements this by supporting large-scale navigation and managing quantitative and semantic data for urban structures like buildings and infrastructure. The applications of these digital models in public–private management have increased the demand for skills in both BIM and GIS, whether used independently or integrated, especially in developing smart cities [3]. The precision of these models depends on data quality and detail [4]. However, in practice, combining multiple software systems within a project is challenging due to format incompatibilities, impeding smooth integration. Consequently, a methodology is needed to ensure interoperability between BIM, GIS, and auxiliary tools, introducing a lightweight linking mechanism [5], without affecting the effectiveness in the synchronization and management of information.
Geographic information systems (GISs) enable problem-solving through spatial analysis by integrating spatial and attribute data, linked to geographic objects on digital maps to identify issues, track changes, and support decision-making [6]. A GIS stores spatial entities, such as geometry, with projections and coordinates, and organizes attributes in tables associated with spatial features [7]. A layered architecture allows the separation of information into thematic layers for independence [8]. Building information modeling (BIM) is a parametric, computer-aided approach that optimizes decision-making throughout the life cycle of buildings and smart cities [9]. Although it has been under development for over a decade, BIM remains a relatively recent advancement [7,10]. It supports three-dimensional modeling to integrate architectural, structural, and facilities data into a unified parametric model, enabling efficient project design, development, and management within a common data environment (CDE) [11,12,13]. This model serves stakeholders across planning, design, construction, and asset management, emphasizing life cycle project considerations [14,15,16] (Figure 1). BIM’s primary objective is to centralize stakeholder information within a federated model that serves as a reliable information source, ensuring project consistency. Beyond 3D visualization, BIM automates digital documentation for various applications—economic, structural, environmental, and energy management—optimizing project information management and lowering operational costs [6,17]. The integration of GIS with BIM enables efficient, multifunctional modeling, providing comprehensive information about the building and its relationship with the surrounding environment [18,19,20,21]. Effective integration requires selecting suitable formats to ensure interoperability, which depends on the software and project objectives. Therefore, the primary challenge is to establish a linking mechanism between GIS and BIM technologies that minimizes information overload and maintains effective data exchange [4,5,21,22].
Facility management (FM) is an integrated approach that coordinates processes to maintain and enhance the services necessary for an asset’s effectiveness. These processes consist of pre-planned activities aimed at specific maintenance objectives, utilizing coordinated human and material resources. The selection of FM processes depends on the required “input elements” [23], which may include equipment, workspaces, buildings, resources, labor, energy, and data storage. After identifying these inputs and ensuring they align with planning, the workflow commences, leading to “output elements” that reflect the outcomes of the processes. This workflow represents a logical sequence of planned activities designed to address failures, deficiencies, and interruptions, ultimately striving for effective and measurable results. In facility management (FM), key elements include spaces, assets, and systems. Spaces refer to bounded surfaces or volumes where a building’s assets are located [24]. Assets are the valuable objects or elements within the building, while systems encompass the structural components that provide services to users. These systems are typically composed of subsystems and can be categorized into seven main groups [25] (Figure 2). Maintaining an accurate inventory of assets is crucial for developing effective maintenance strategies.
Digital facility management necessitates handling complex and varied data, often utilizing computer-aided maintenance management systems (CMMSs). Traditionally, CMMSs operate in a two-dimensional (2D) format, relying on databases and asset photographs due to a scarcity of three-dimensional (3D) building models (BIM). However, emerging CMMSs, such as Revizto, YouBim, and EcoDomus, focus on 3D facility management, as detailed in Table 1. A key challenge is maintaining the BIM model throughout the asset’s life cycle to ensure real-time data accuracy and integrating it with various management platforms. Anticipated issues include incomplete as-built models and the difficulties of manual data management within BIM software.

2. Methodology

Figure 3 shows the proposed methodology for the 3D simulation of building facilities maintenance management. This process consists of creating digital GIS and BIM models (PHASE 1); integrating and enriching them with accurate information (PHASE 2); and, finally, applying the integrated model to simulate 3D maintenance management of the building’s facilities (PHASE 3).
PHASE 1, Modeling, is divided into two stages, one consisting of the creation of the GIS-3D environment of the site and the other of the creation of the BIM models of the buildings. For stage 1, Creation of the site GIS-3D environment, a three-step methodology is proposed. In step ①, Data management and initial configuration, the first action to be taken is to define the semantic level (level of detail and type of terrain) that the GIS-3D model will have. The initial data for building the model include the base map, which will serve as the GIS platform; the LiDAR (light detection and ranging) point cloud data of the geographic area; and the cadastral base of city plots, a two-dimensional GIS layer containing a table of municipal and cadastral attributes. In step ②, Definition of the Terrain and the Footprint of the Buildings, the focus is on using the cadastral base of city parcels to extract “building footprints” needed for the 3D model. These footprints are represented as 2D polygons linked to a database containing municipal and cadastral data, including building level specifications. If terrain relief is to be incorporated, the digital terrain model (DTM) and digital surface model (DSM) are created from LiDAR point cloud data to ensure modeling accuracy in later steps. In step ③, Generation of the GIS-3D Environment of Buildings, the 3D building model is developed within the GIS platform, with levels of detail (LoDs) ranging from LoD 1 to LoD 4, depending on the project specifications. For LoD 1, the model uses building footprints and associated attributes from step ②. For this purpose, algorithms can be employed to extrude the building footprints from the digital height model (DHM) or to assign a standard height for each building level. For more detailed models (LoD 2 to LoD 4), raster-based tools are recommended.
In PHASE 1, stage 2, Creation of the BIM models of the building, the proposed methodology includes two steps (Figure 3): step ①, Preliminary information and data capture, and step ②, Creation of the geometric model. In step ①, existing building data are collected to create and populate the BIM model in the following step, drawing on sources like sketches, measurements, plans, large-scale position capture (LiDAR point clouds), technical data sheets, or family libraries, among others. Step ② involves virtually constructing the building in BIM software, requiring both 3D modeling skills and technical building knowledge. The goal is not merely to create a geometric representation but to form a BIM model with parametric intelligence, providing both quantitative and qualitative data. The focus should be on using BIM as a knowledge tool rather than on achieving precise 3D detail [25,26].
The procedure to integrate GIS and BIM model files into the same platform (PHASE 2) involves a simple file import through the GIS software’s import menus, requiring five key steps (Figure 3). The speed and effectiveness of this integration depend on the GIS software used, which may require specific plugins or programming to handle the BIM files and their attributes. Folders are created on the server to store model-related files (documentary source of the virtual library), and links to access documentation are extracted for inclusion in the GIS browser. Additionally, databases such as BIM attribute tables and Excel sheets must be created, linked to BIM elements, and populated with the collected information that has not been previously integrated in the BIM model. Pop-up windows should be configured within the GIS platform to display model element information.
Finally, once the models are integrated into the GIS and BIM platform, they can be applied to multiple applications. This article focuses on their application for building facilities maintenance management (PHASE 3), through a procedure structured in four steps (Figure 4).
For step ①, Define spaces, assets and systems/subsystems, Figure 5 shows the hierarchical structure of digital elements in a BIM model. These elements are called “types”, which are different components belonging to a digital family. Variations in parameters within the same type are referred to as “exemplars”. Systems are collections of types working together to provide a service (e.g., an electrical system or a facade wall system). Some systems consist of subsystems that interact to provide a service (e.g., the pumping subsystem in a boiler system). Model spaces are areas where interrelated types and/or systems are organized (e.g., classrooms or boiler rooms).
In step ②, Link and Configure a Computerized Maintenance Management System (CMMS-3D) and list the stakeholders, the GIS-3D platform containing the BIM model must be configured to manage its attributes, enabling direct access to the CMMS through GIS pop-ups. This involves adding links to the BIM model’s parameters for easy access. To manage building maintenance in 3D, software that allows the BIM model to be integrated into it is necessary, allowing the configuration of maintenance activities without modifying the model’s initial geometric parameters. Stakeholders will be listed and registered in the CMMS-3D for efficient task assignment.
In step ③, Develop pre-maintenance activities, incidents that disrupt or reduce building service quality are detected and recorded in the CMMS-3D model. In addition, prior to executing maintenance, a comprehensive maintenance plan is developed by reviewing all available asset information, including equipment, history, plans, measurements, materials, tests, location, physical barriers, and permits. Relevant stakeholders and resources are identified, and for external maintenance, estimates are obtained and contracts signed. Once the incident is administratively processed, it is configured in the CMMS control panel, allowing personnel assignment and work order setup to begin maintenance and supervision. Finally, in step ④, Execute and digitally supervise maintenance tasks, the 3D digital supervision of maintenance can be developed through a CMMS. The selected CMMS should facilitate linking the assets, spaces, and systems/subsystems of the buildings with all existing documentation, to ensure its accessibility by the stakeholders, at any time during the life cycle of the building, allowing the exchange of information, in real time, of the entire maintenance process to be documented during its supervision.

3. Results

The methodology presented was developed at “Las Llamas” Campus of the University of Cantabria (Figure 6a). This campus covers an area of more than 1 km² and is located in Santander, Spain. The building developed in BIM was the Civil Engineering School (Figure 6b). The following sections present the results obtained from the applied methodology.

3.1. PHASE 1—Modeling

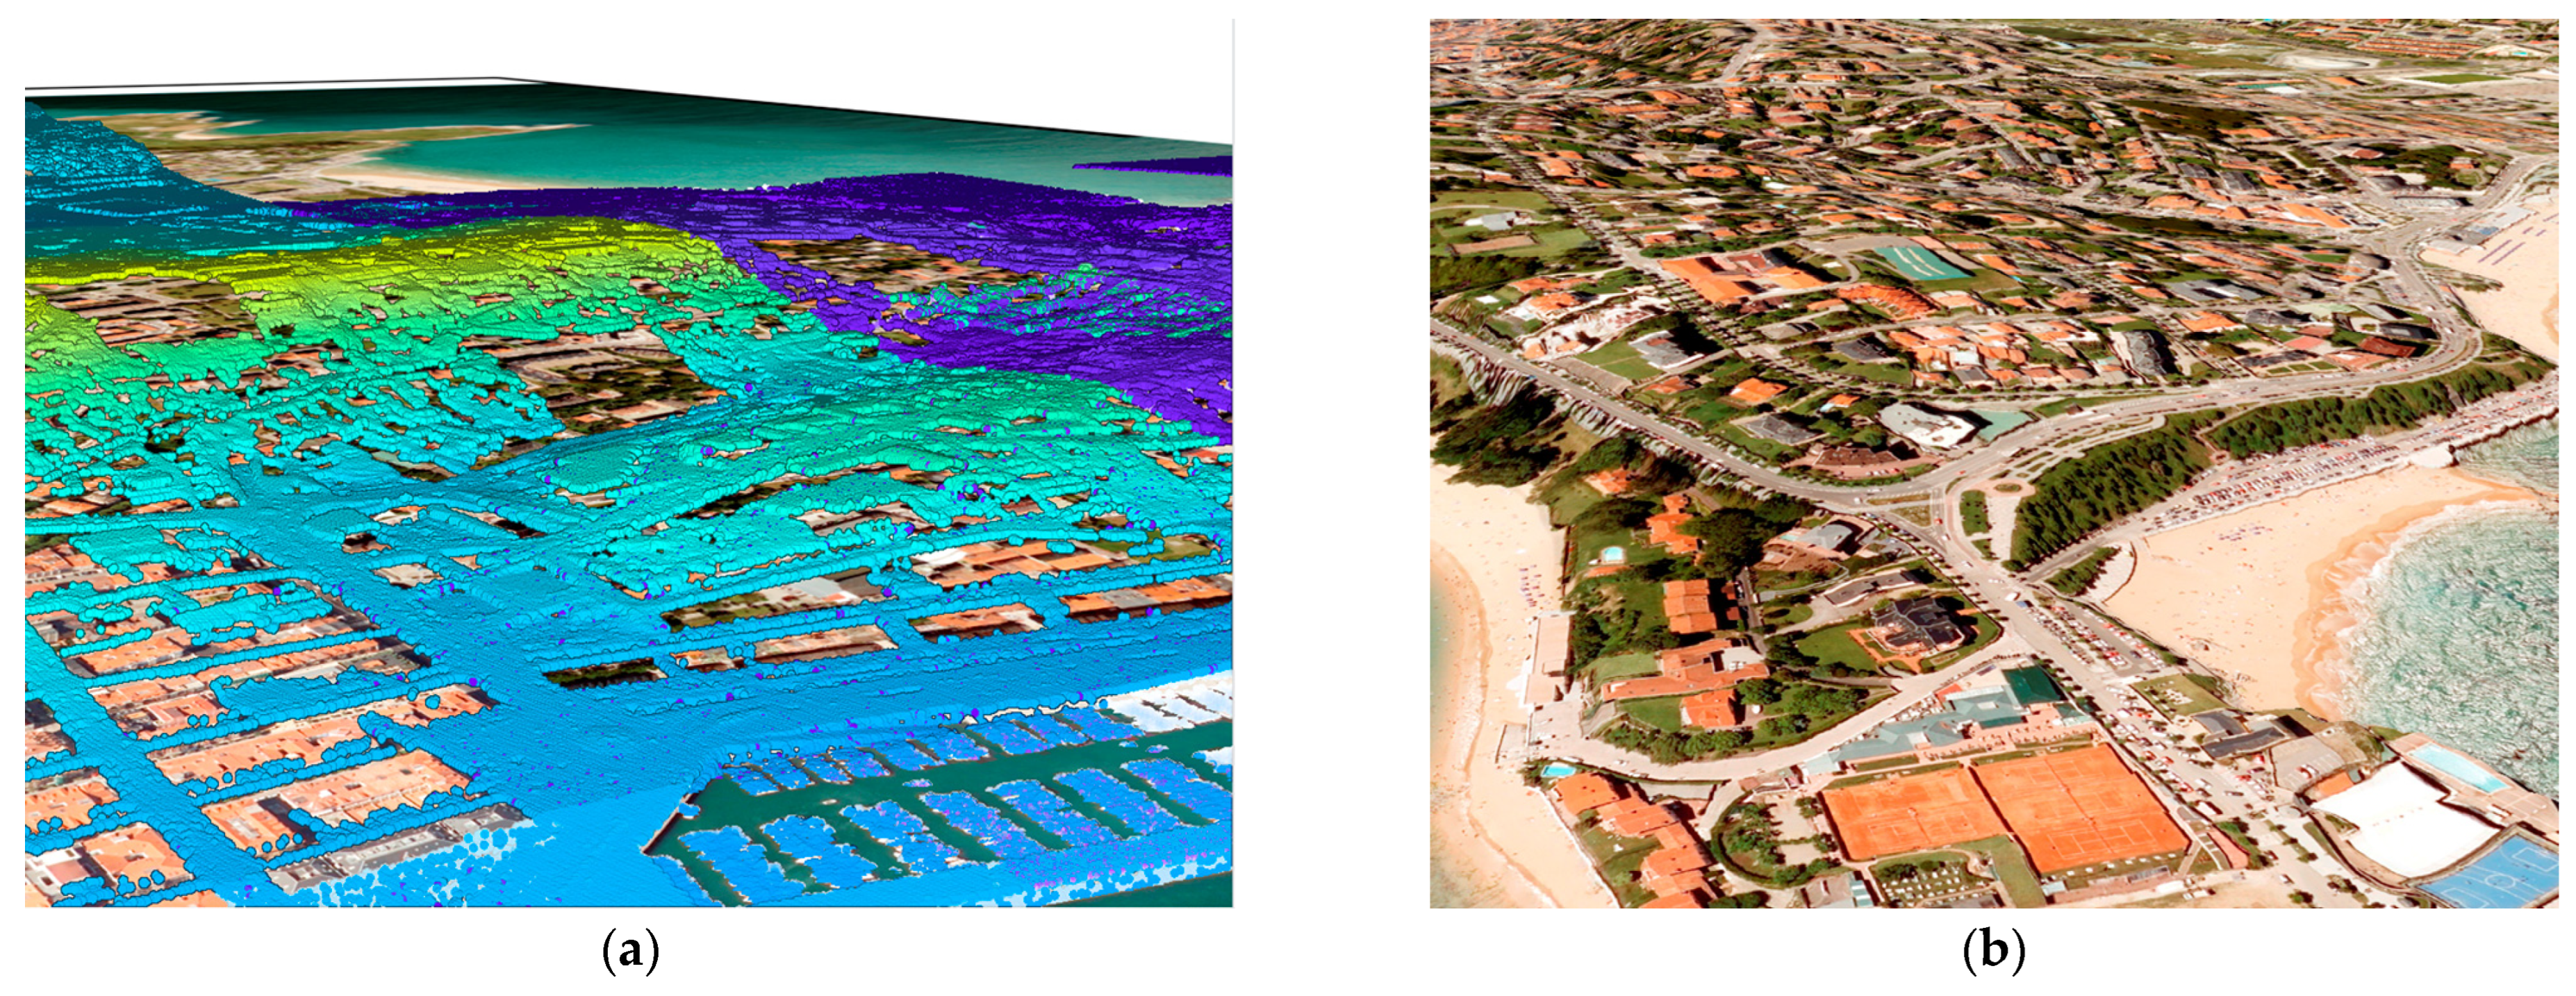
3.1.1. Stage 1—Generation of the GIS-3D Site Environment

In step ①, Data Management and Initial Configuration, orthophotos were utilized as the base map alongside a digital terrain model that included relief. To represent the latter, we employed point clouds from the LiDAR flights conducted as part of the 2012 National Aerial Orthophotography Plan of Spain (PNOA), which were used to generate the aforementioned digital terrain model (DTM). Both the orthophotos and the corresponding point clouds were obtained from the Mapas Cantabria-España download center [27] and the headquarters of the Catastro-España [28]. To develop step ②, Definition of Terrain and Building Footprint, the process began with the cadastral base of the parcels for each site. This base, referred to in Spain as “Constru”, was obtained directly from the Spanish Cadastre headquarters [28]. The 2D layer “Constru” included an attribute table containing information about the parcels, sub-parcels, and the polygonal shapes of the building footprints. Given that the site was expected to have terrain with relief, it was necessary to create both the digital terrain model (DTM) and the digital surface model (DSM). To achieve this, the points corresponding to the terrain in the LiDAR point cloud were filtered out, as shown in Figure 7a. These points were then combined with the previously assigned orthophoto using algorithms implemented in GIS software (ArcGIS Pro v2.7), resulting in a terrain that featured realistic relief and texture, as illustrated in Figure 7b. In step ③, Generation of the GIS-3D Environment of Buildings, the “Constru” layer created in step ② included an attribute table with a field that specified the height of each building. For this project, an average height of 3 m per floor was adopted, enabling the generation of the environment at level of detail 1 (LoD 1), as illustrated in Figure 8a. To achieve LoD 2, a Python function was automated to identify building heights and elevation differences at the highest points (roofs) within the digital height model (DHM). This process defined the slopes of the roofs accurately. For LoD 3, it was essential to enhance the realism of the building envelopes by incorporating textures (multipaths). Figure 8b illustrates the GIS-3D model that integrated buildings at LoD 2 alongside those at LoD 3. Finally, LoD 4 was achieved through the integration of BIM models in subsequent stages of the methodology.

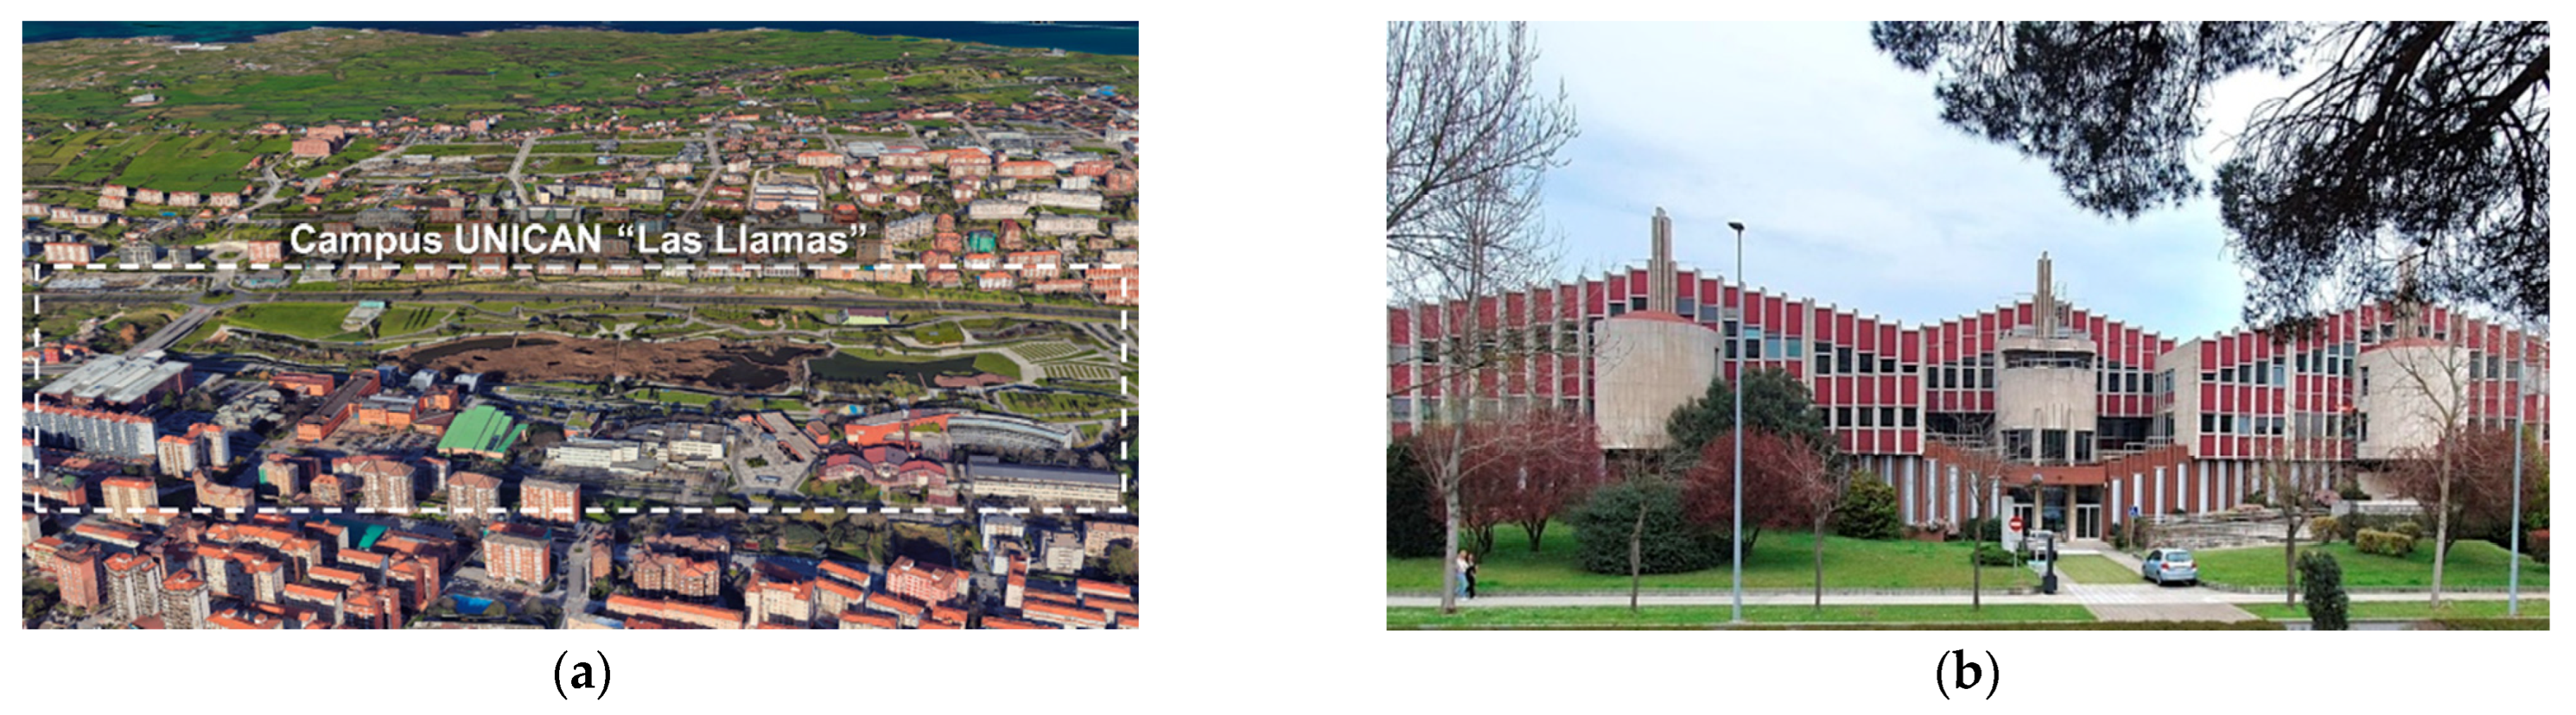
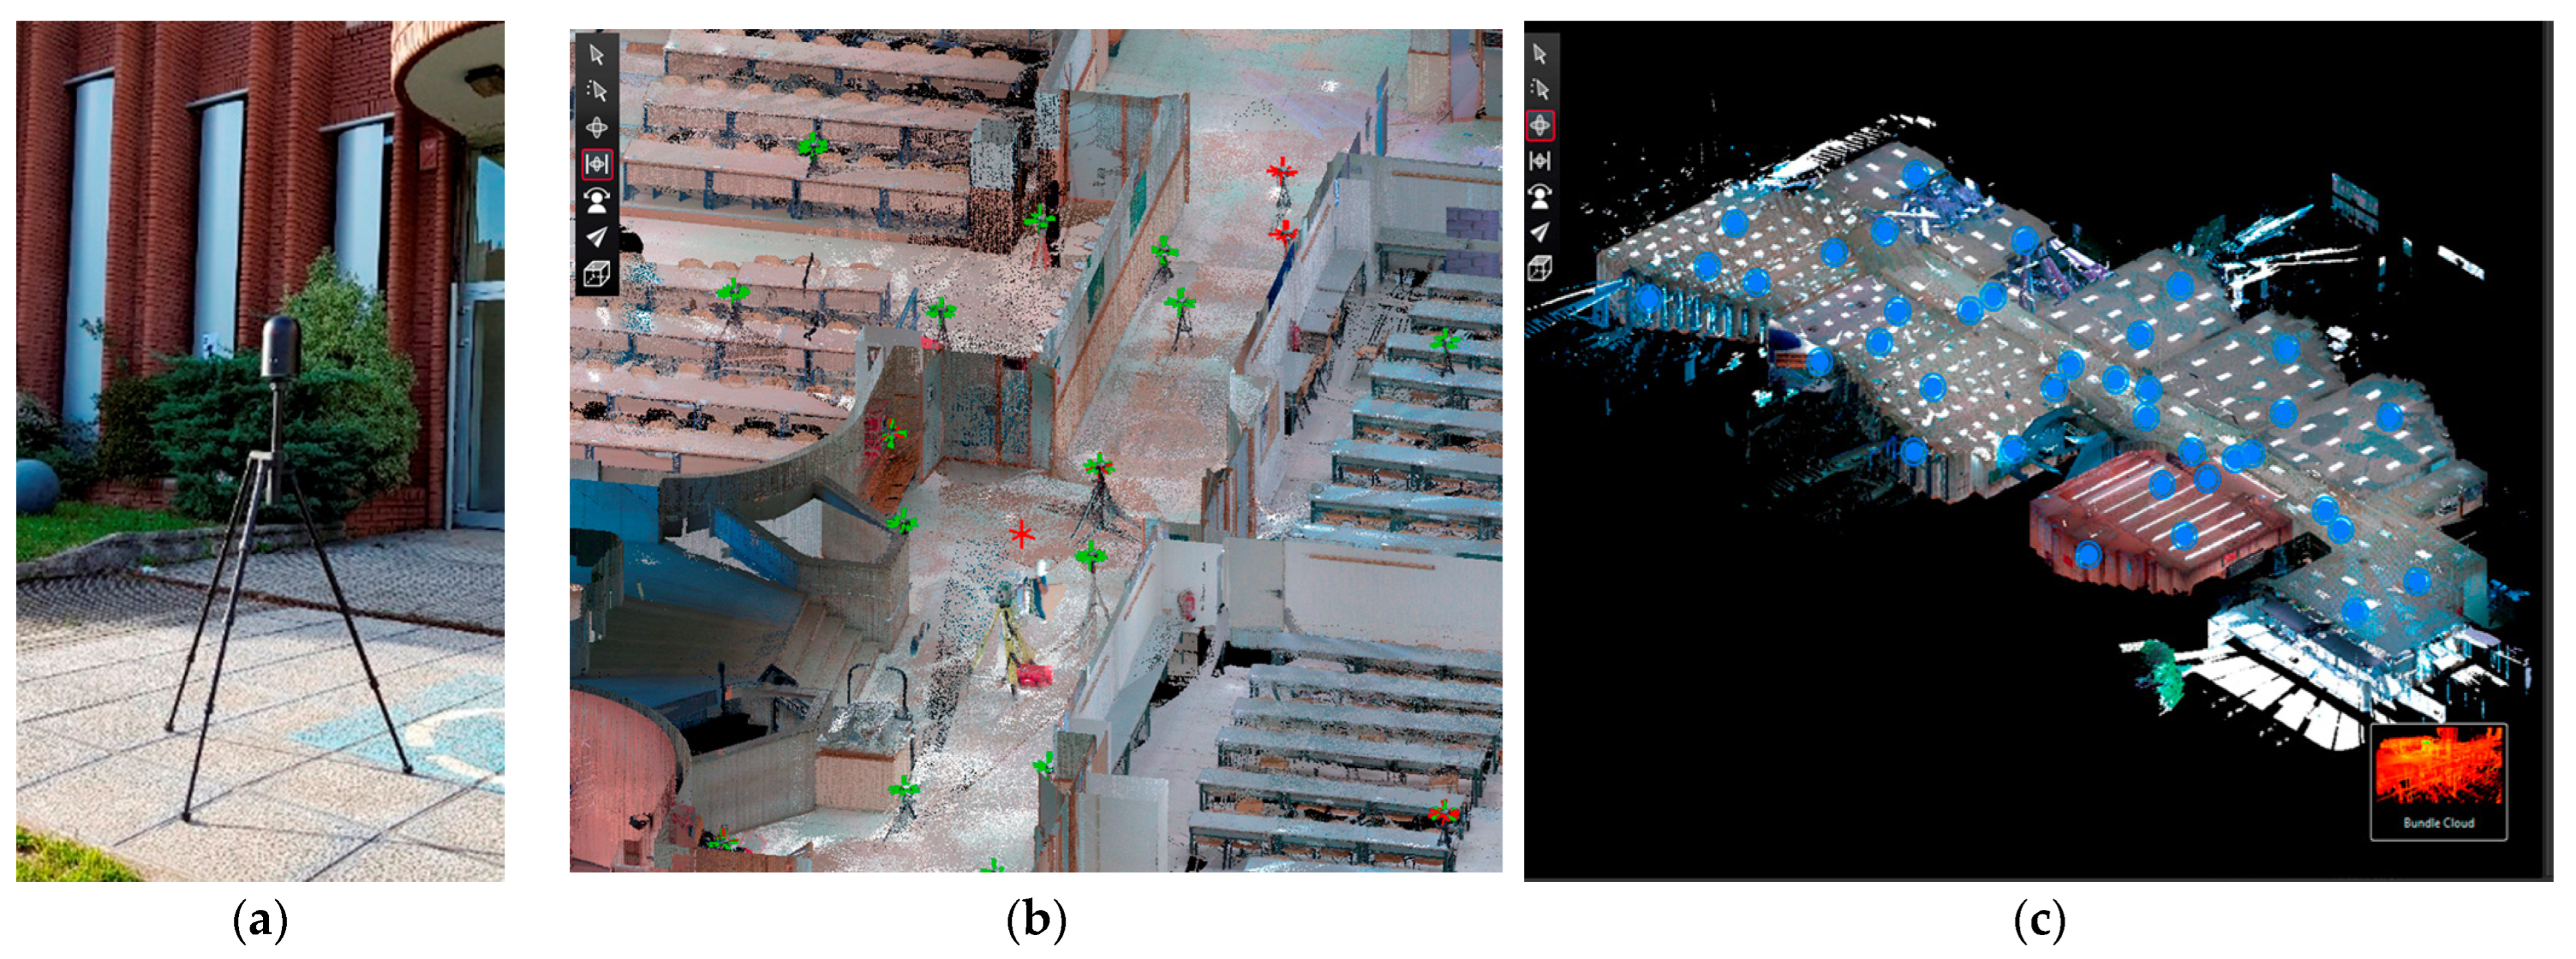
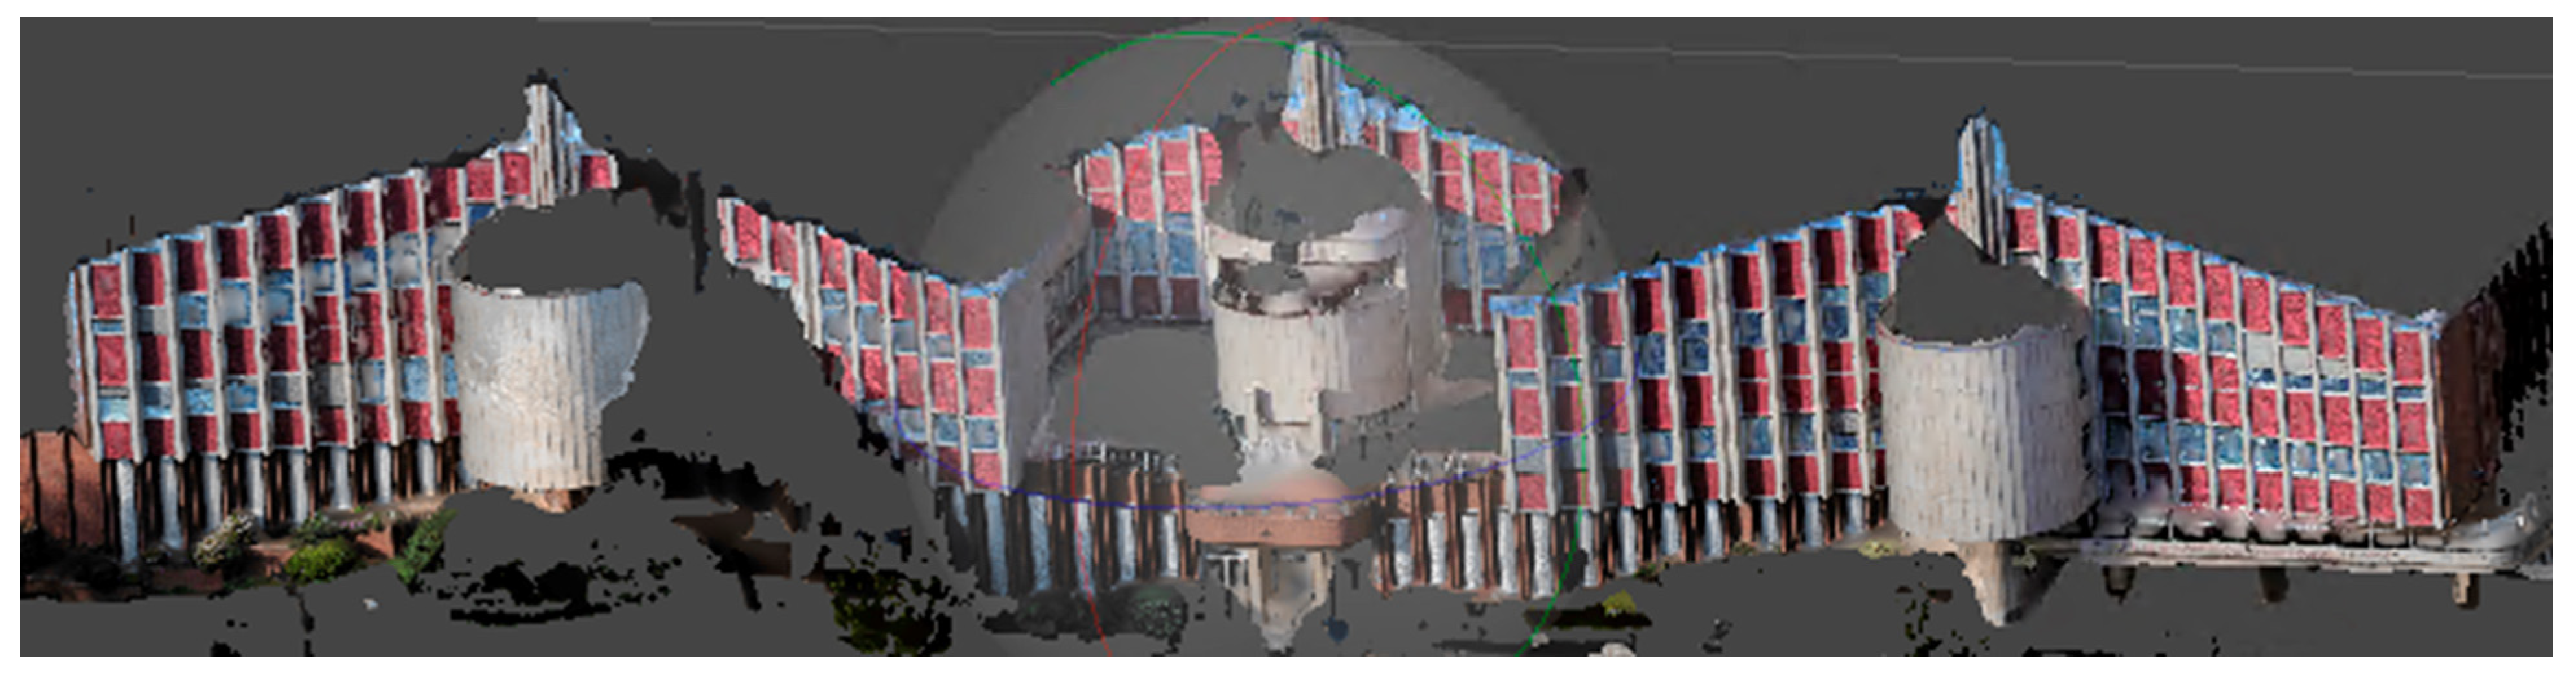
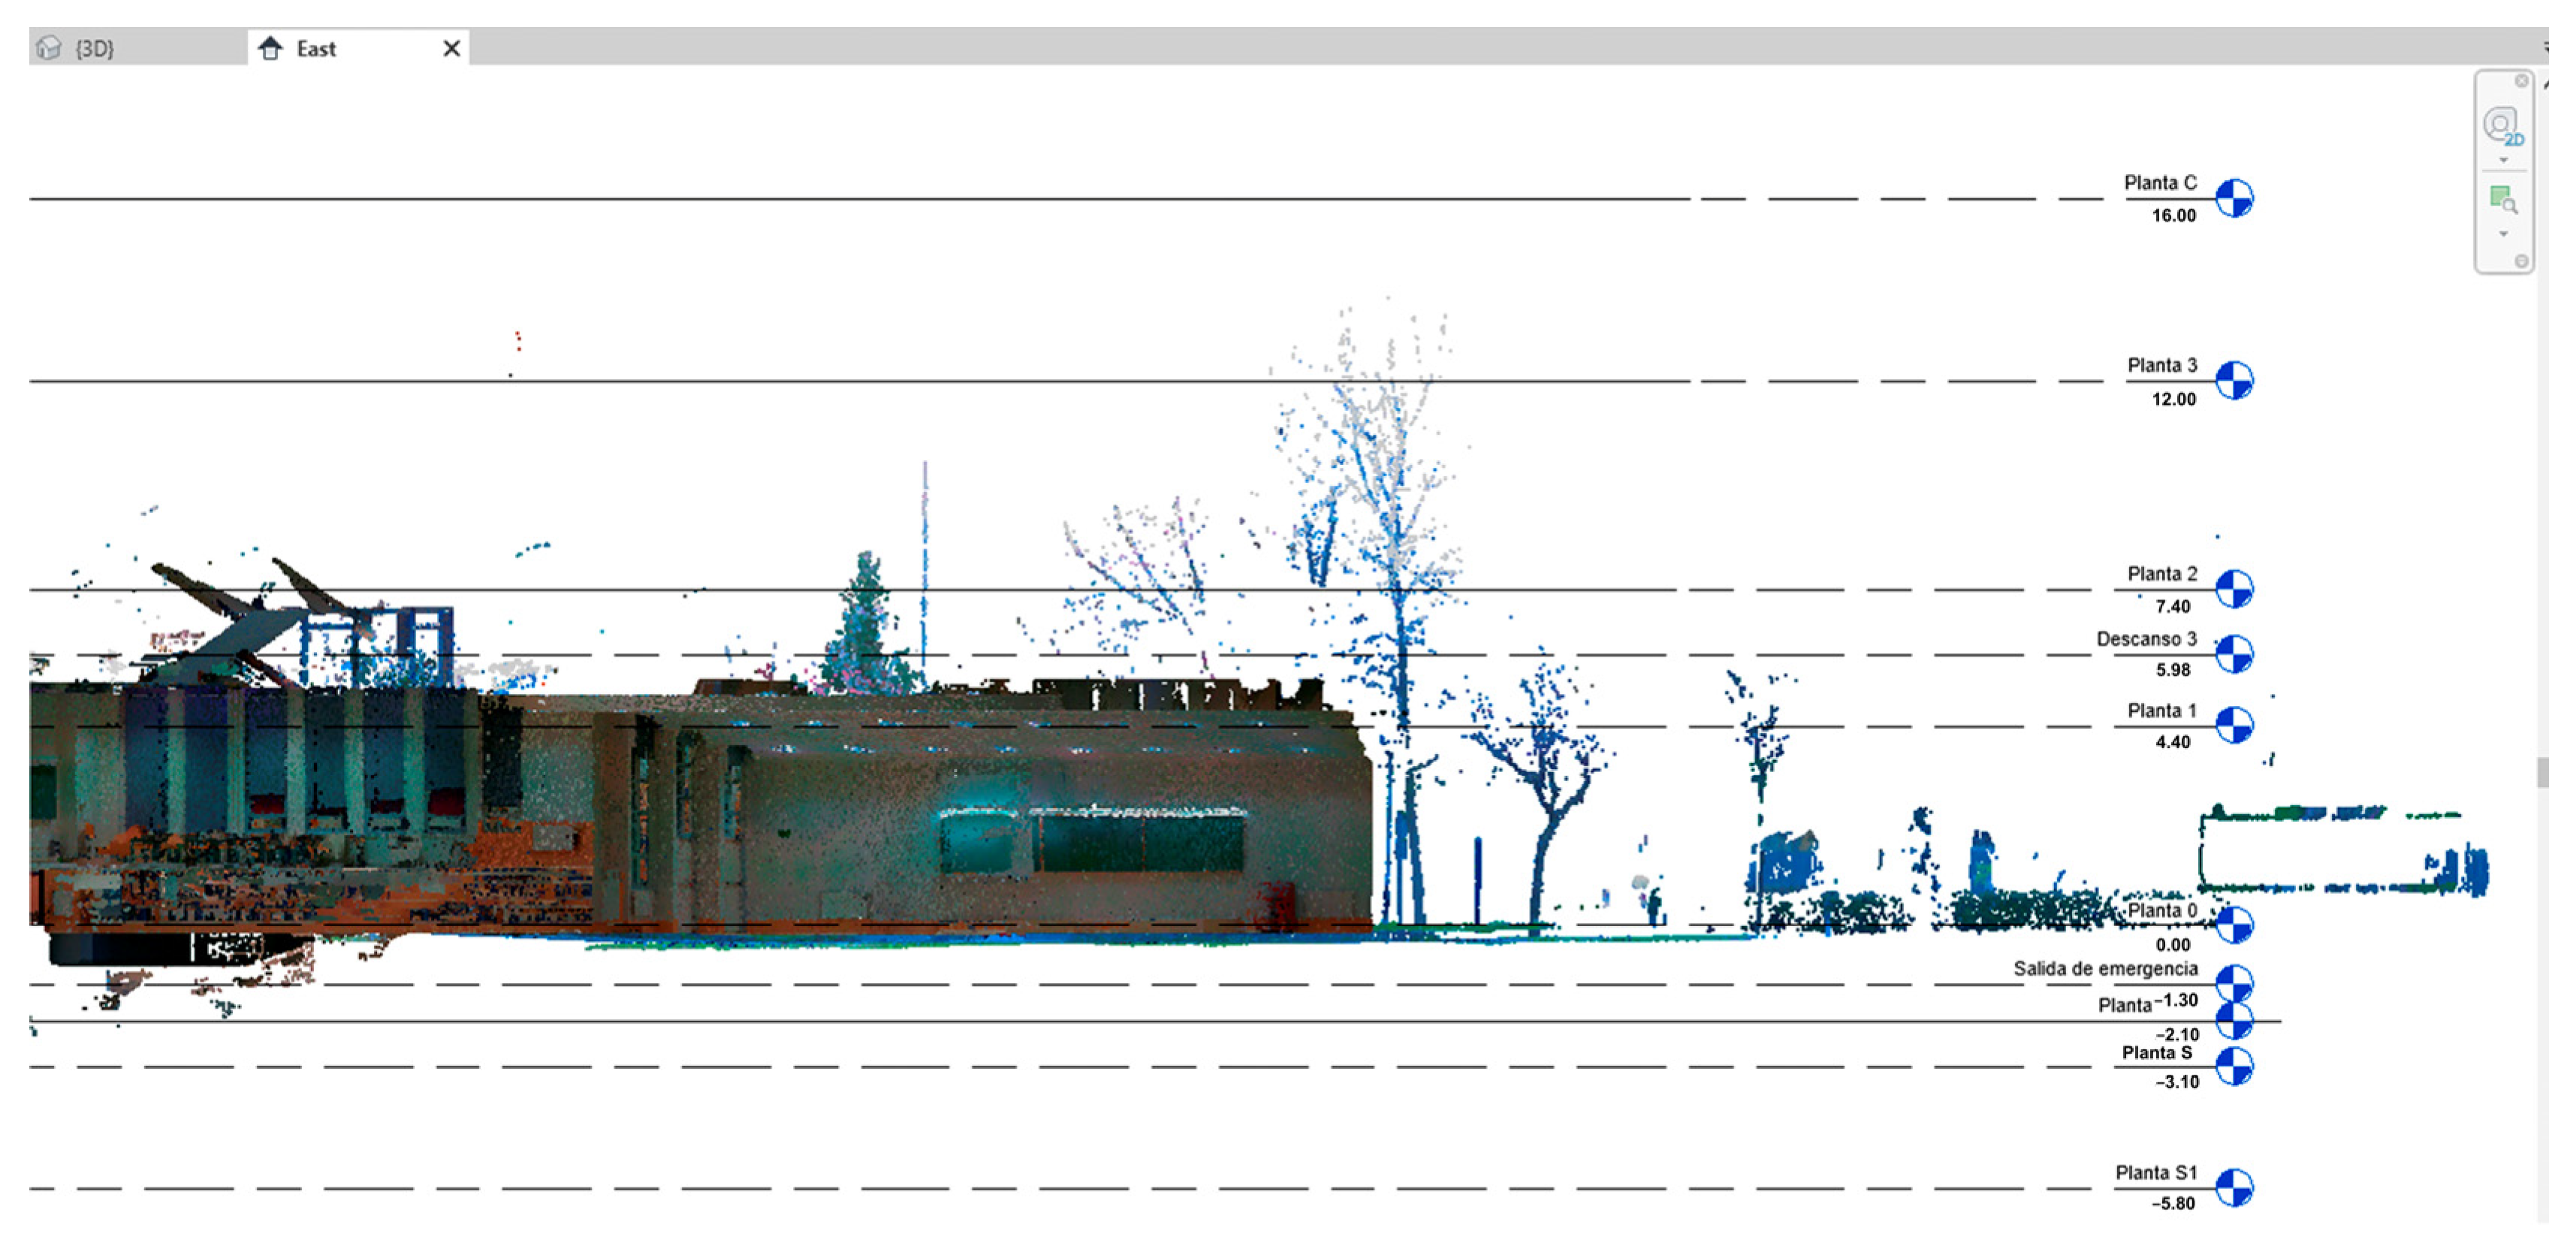
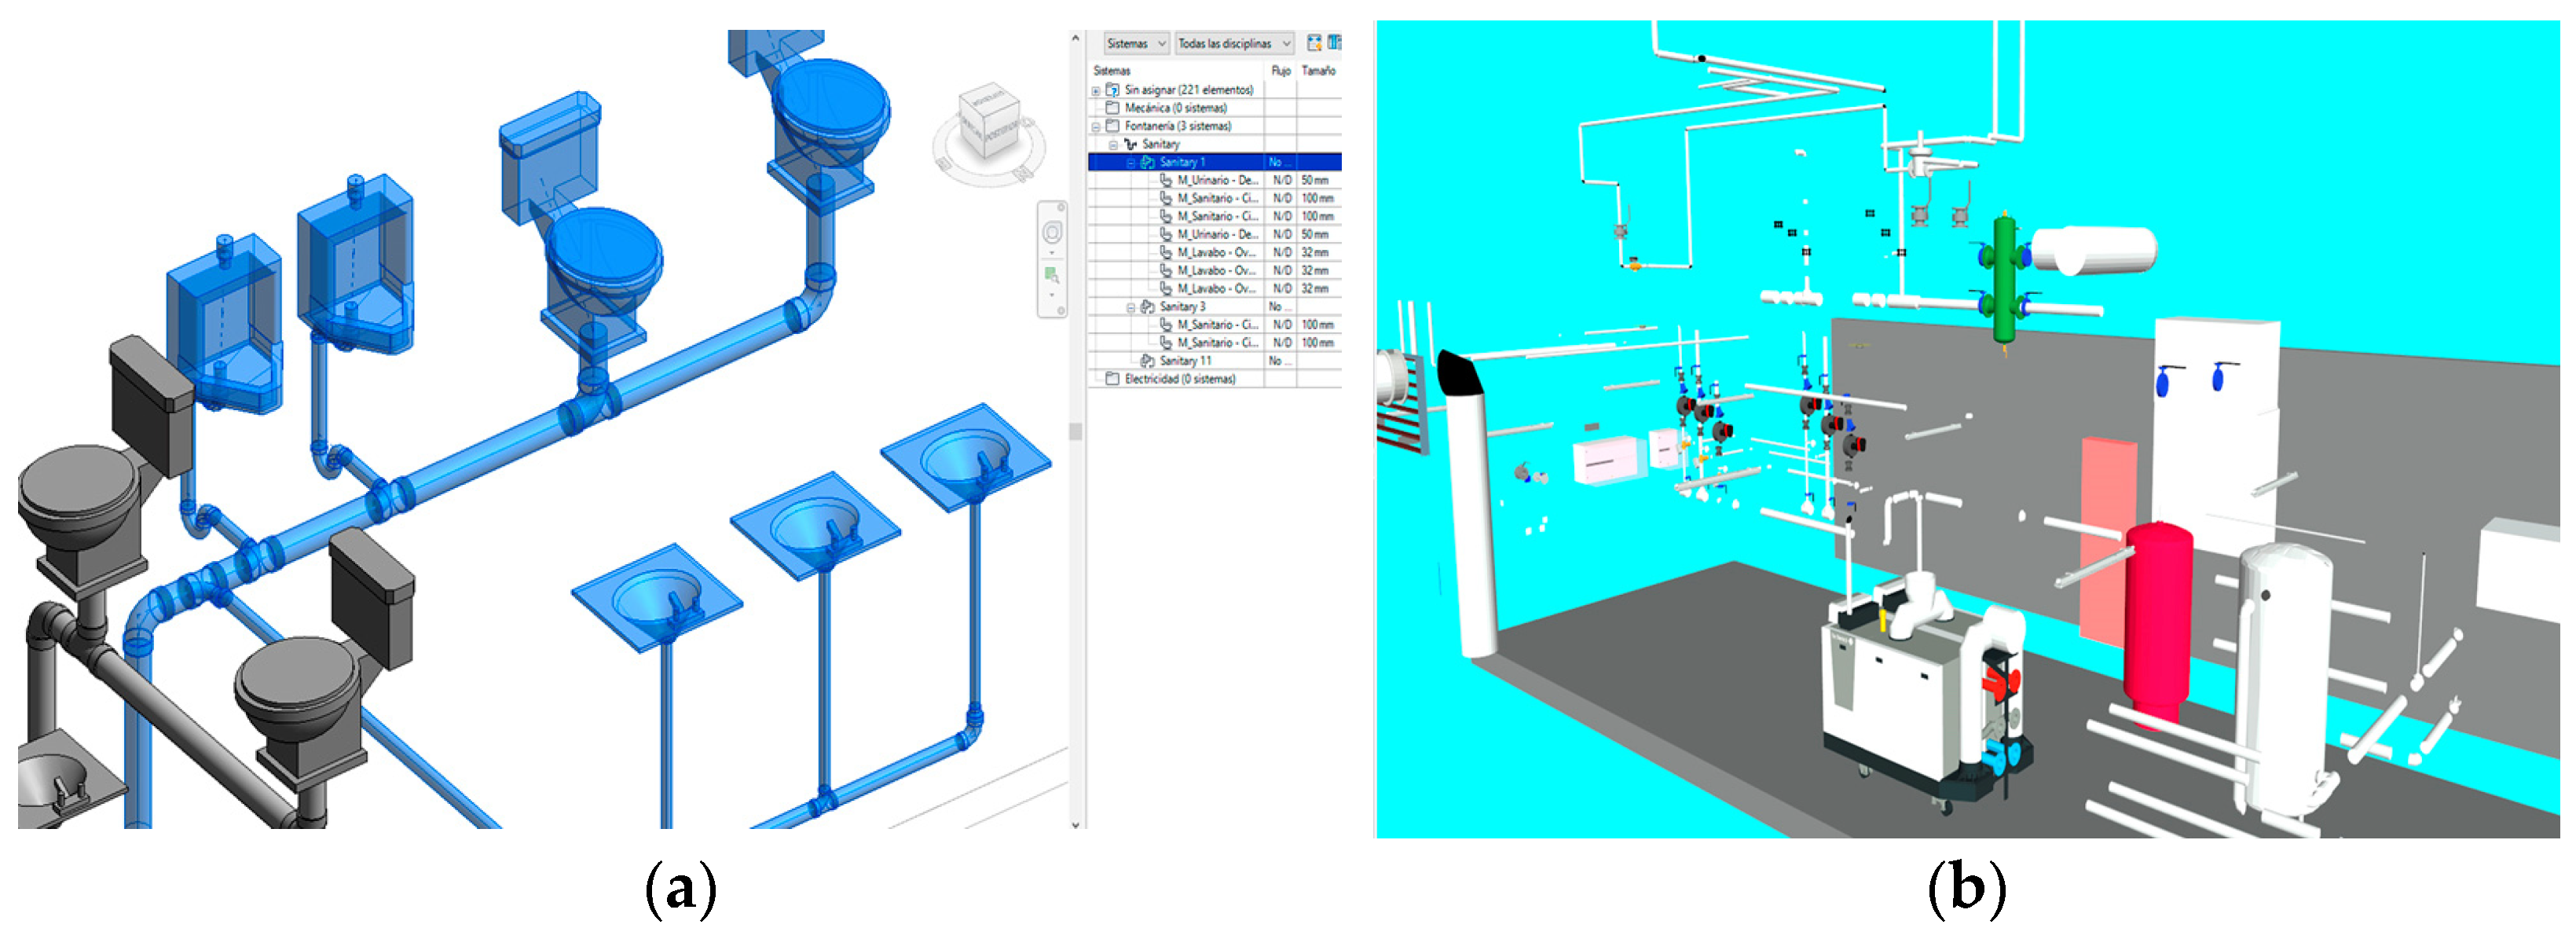
3.1.2. Stage 2—Creation of the BIM Model (Civil Engineering School)

In step ①, Previous Information and Data Collection, all information was collected, including available plans in both paper and digital formats (*.dwg and *.pdf), along with data obtained from 3D laser scanning and architectural photogrammetry. Thus, the positioning work was carried out with a Leica TS13, 5’ robotic total topographic station, performing a total of 10 parking positions on the exterior of the building. For laser scanning inside the building, a Leica-geosystem BLK360 model was used (Figure 9a). For the georeferencing of the scans, 6″ circular targets were used (Figure 9b). Given the characteristics of the scanner and the building, 48 scans were considered adequate. For the processing of the data obtained by laser scanner, Leica’s Reality capture software was used, specifically the register360 and cyclone3DR tools, generating a total of 79 links (Figure 9c). The 48 scans were linked “cloud to cloud”, obtaining a joint cloud. The joint cloud was also registered in the Project reference system.
To generate the photogrammetric model of the building (Figure 10), a Canon EOS 5DS R digital camera with 50.6 megapixels and fixed focal length lenses (28 mm, 35 mm, and 50 mm) was used. A total of 948 images were captured. The software used for this task was Agisoft Metashape Pro, version 1.8. Consequently, the 948 images of the project were oriented, achieving a ground sample distance (GSD) of 3.6 mm. This work generated several point cloud models and multiple mesh models.
The creation of the geometric model (step ②) has been developed in two ways, one using existing plans as a template and the other using point clouds obtained by 3D laser scanner or photogrammetry. In the case of the model from existing plans, it was generated in Autodesk Revit 2019 software from 2D digital plans (dwg and pdf) and on-site measurements (Figure 11). For the most part, the libraries of existing elements in the software were used, both for its architecture and installations, except for the construction of the facades that had to be modeled with the “mass” tool due to the non-existence of standard families of this unique building (Figure 12).
On the other hand, the modeling from the point clouds obtained by laser scanning and photogrammetry was developed for the lower levels of the building. For this purpose, the elements of the model created from plans were readjusted in Revit 2019, importing and using the referenced point clouds as a reference. The reason for doing so was to avoid recreating all the building elements from scratch, thus optimizing the modeling process. Although the point cloud was properly referenced, it was necessary to set certain parameters in Revit 2019, such as the location of the project, the elevation, and the actual north of the project with respect to the north of the BIM software drawing space. Next, the different levels (heights of the building) were created and located, as shown in Figure 13. These levels served as the working planes that allowed for the adjustment of the elements of the model that constituted the building. Once the process of referencing and locating the levels was completed, the elements (families and types) were readjusted.

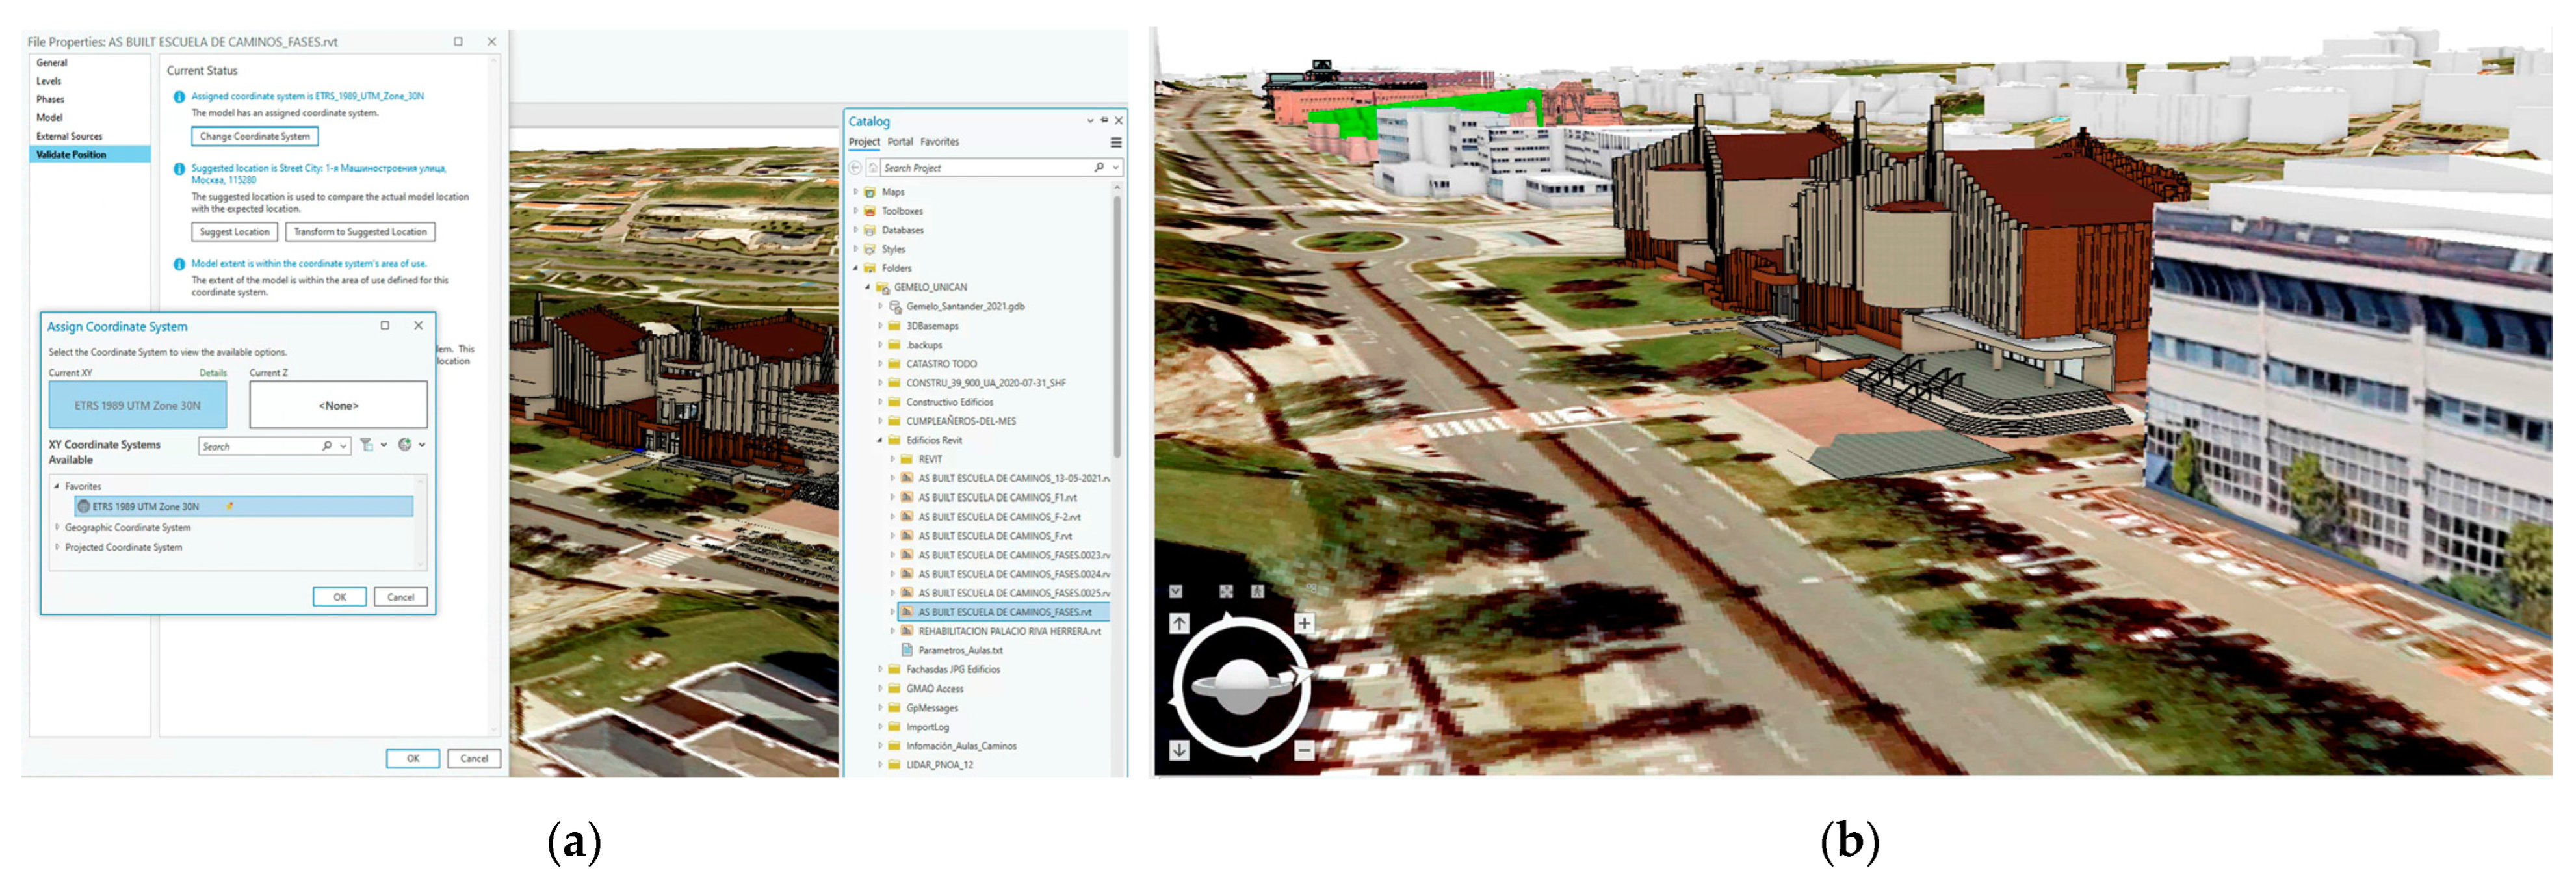
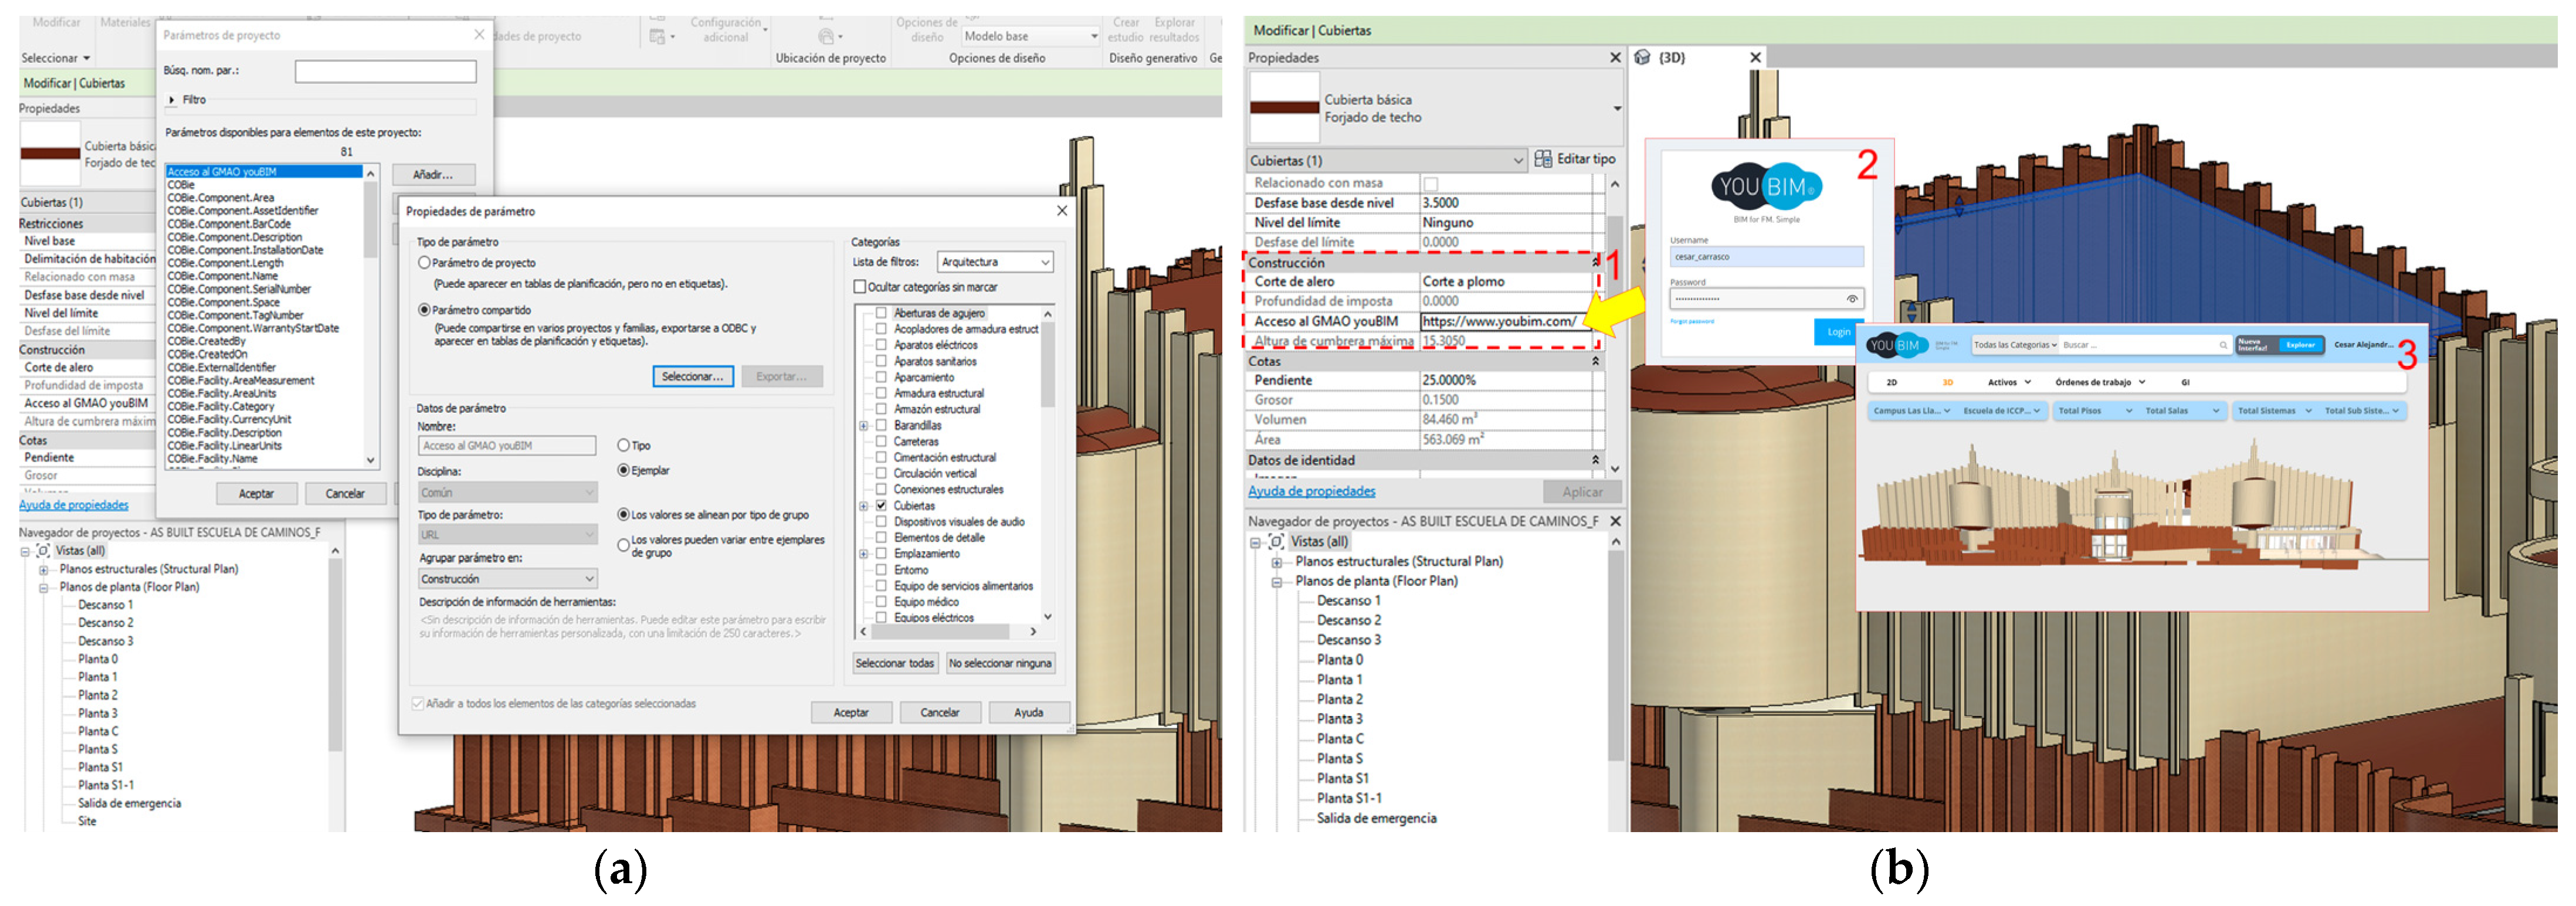
3.2. PHASE 2—Integration and Feeding of the GIS and BIM Model

In this case, the integration was performed directly with the Revit file (*.rvt), because the GIS software used, ArcGIS Pro v2.7, was configured to be compatible with *.rvt files without the need for additional algorithms; for this reason, this process was quite simplified. Thus, once the file was imported into the “Catalog” of ArcGIS Pro, we proceeded to link it as a “3D Layer”, to georeference it, and to verify that both the georeferencing and the elevation of the building with respect to the terrain were correct (Figure 14a). Figure 14b shows the integrated GIS and BIM model. Before feeding the integrated GIS and BIM model, families of furniture; sanitary ware; computers; lighting fixtures; electrical room equipment; and various appliances, such as fire extinguishers, radiators, and other building equipment, were created. For this purpose, in addition to creating the families, it was necessary to modify the types (Figure 15).
Next, we proceeded to the configuration of shared parameters in Autodesk Revit, which allowed us to feed the properties of the elements. The configuration of the shared parameters was performed from the Revitmanage” tool (Figure 16a). The final step was to feed the parameter, for example, by writing a URL to the CMMS of the model, through which the CMMS could be accessed after entering the user credentials (Figure 16b). Folders were created on the server to contain the files (documentary source of the virtual library) linked to the model. Likewise, the paths or access links to all the documentation were extracted to be included in the GIS browser and to be able to directly access the information stored on the server. Excel sheets were also created in which Revit planning tables and ArcGIS attribute tables were linked. Similarly, the information feeding the Excel sheet was synchronized using the Revit plugin “Export-Import Excel”. Finally, pop-up windows were configured in ArcGIS to display the information to be accessed in the integrated GIS and BIM model.

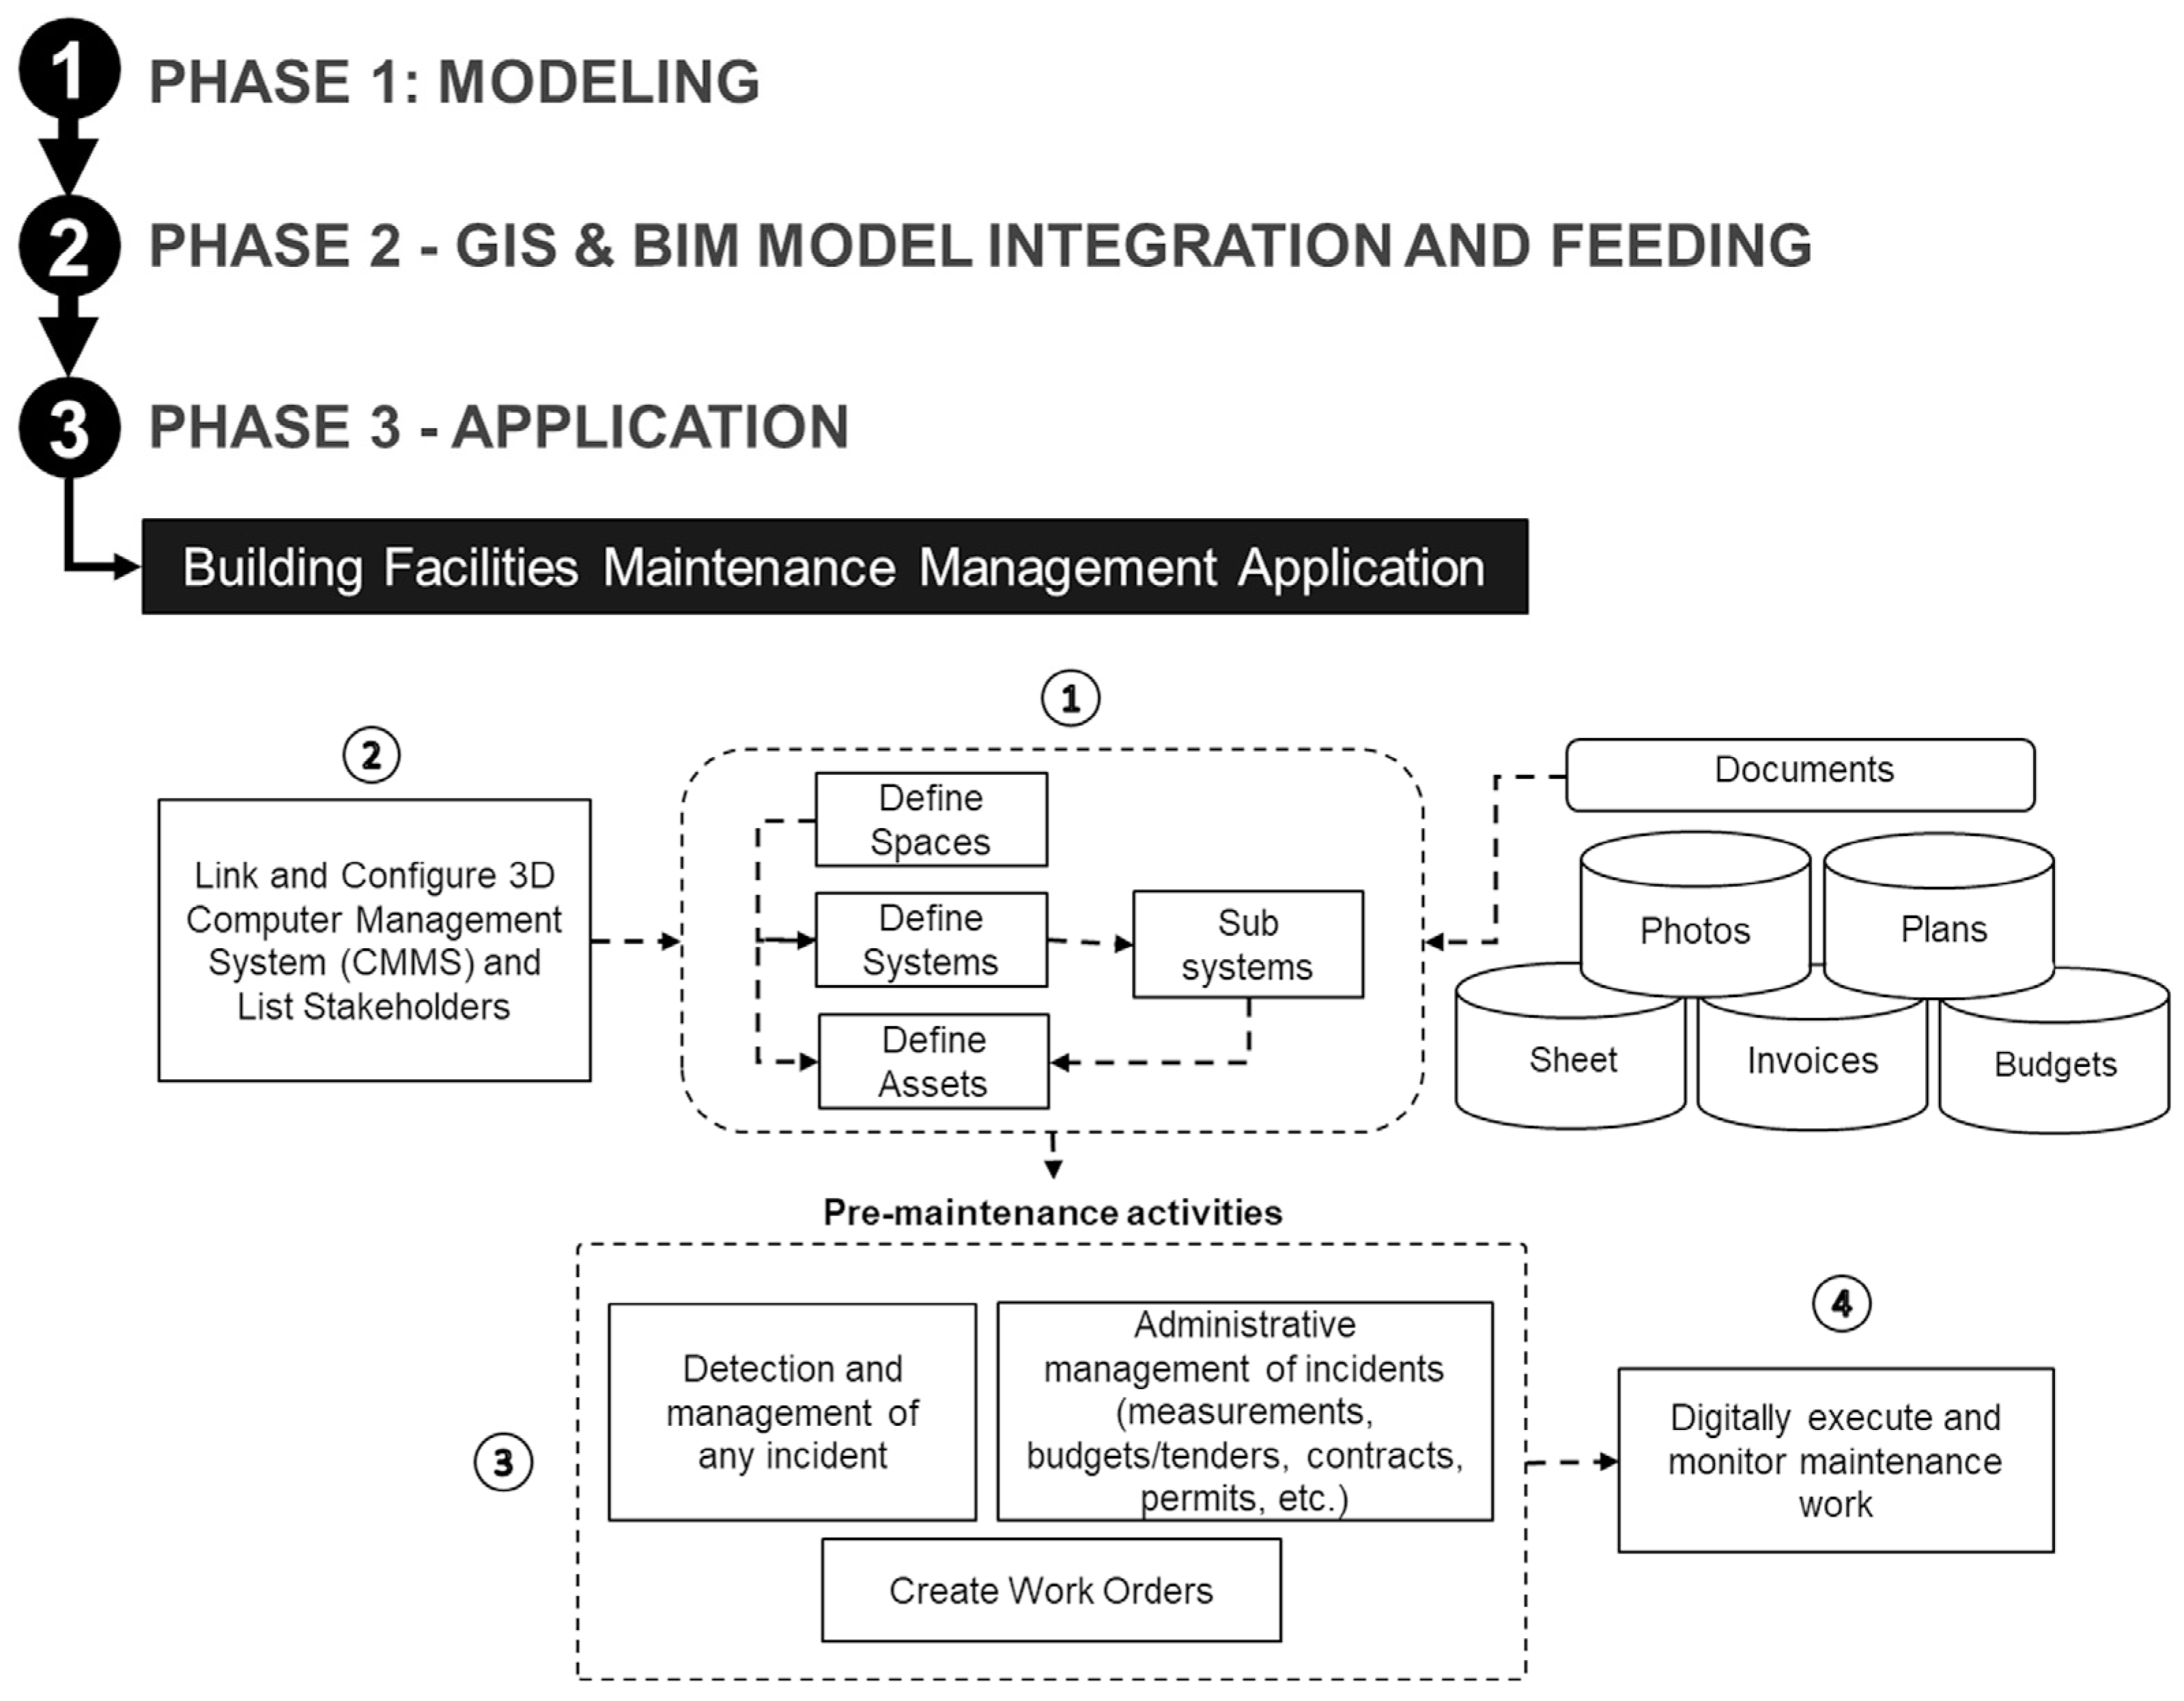
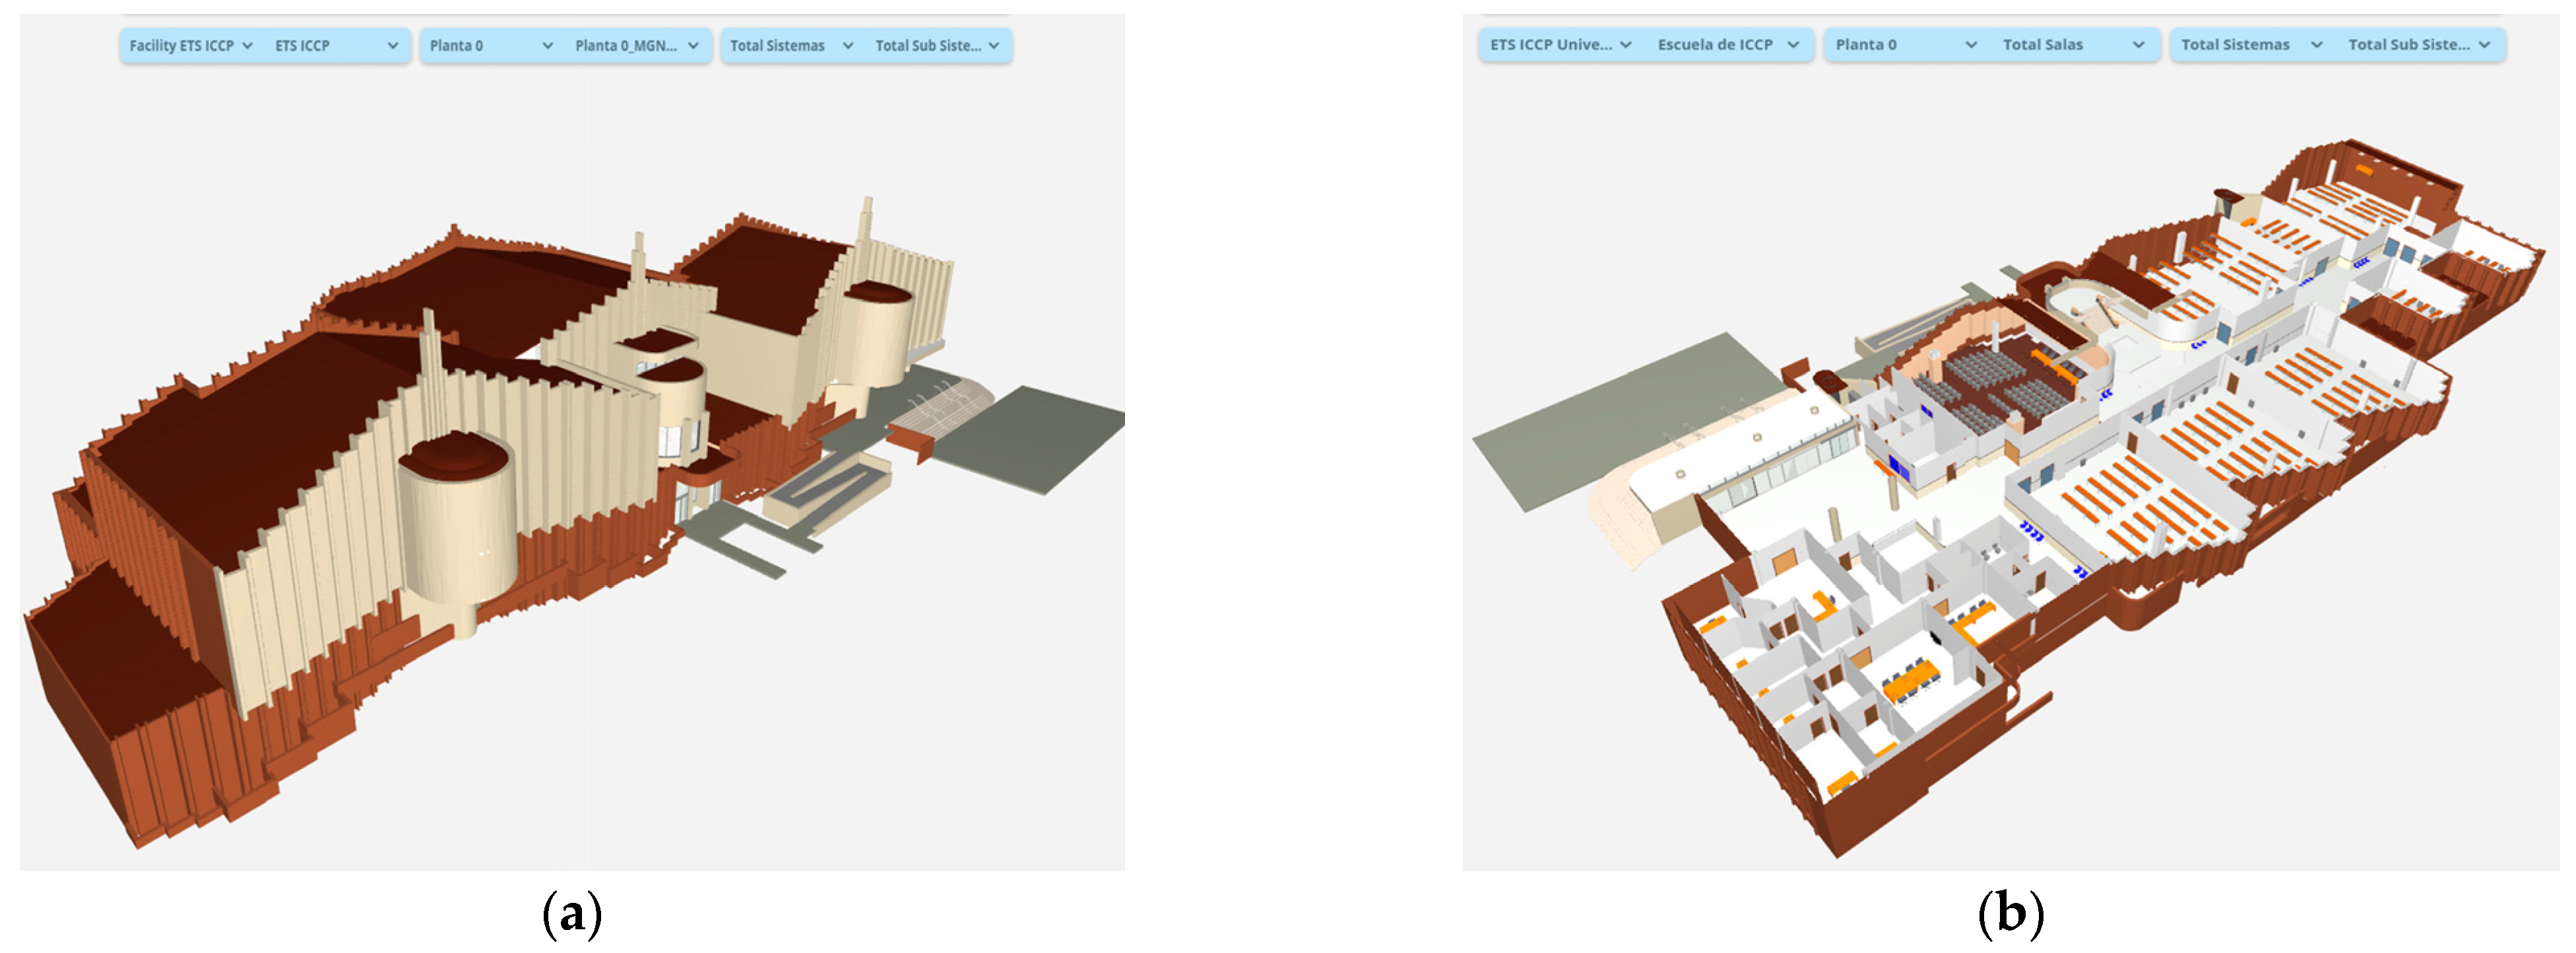
3.3. PHASE 3—Application for the 3D Simulation of the Maintenance Management of the Building Facilities

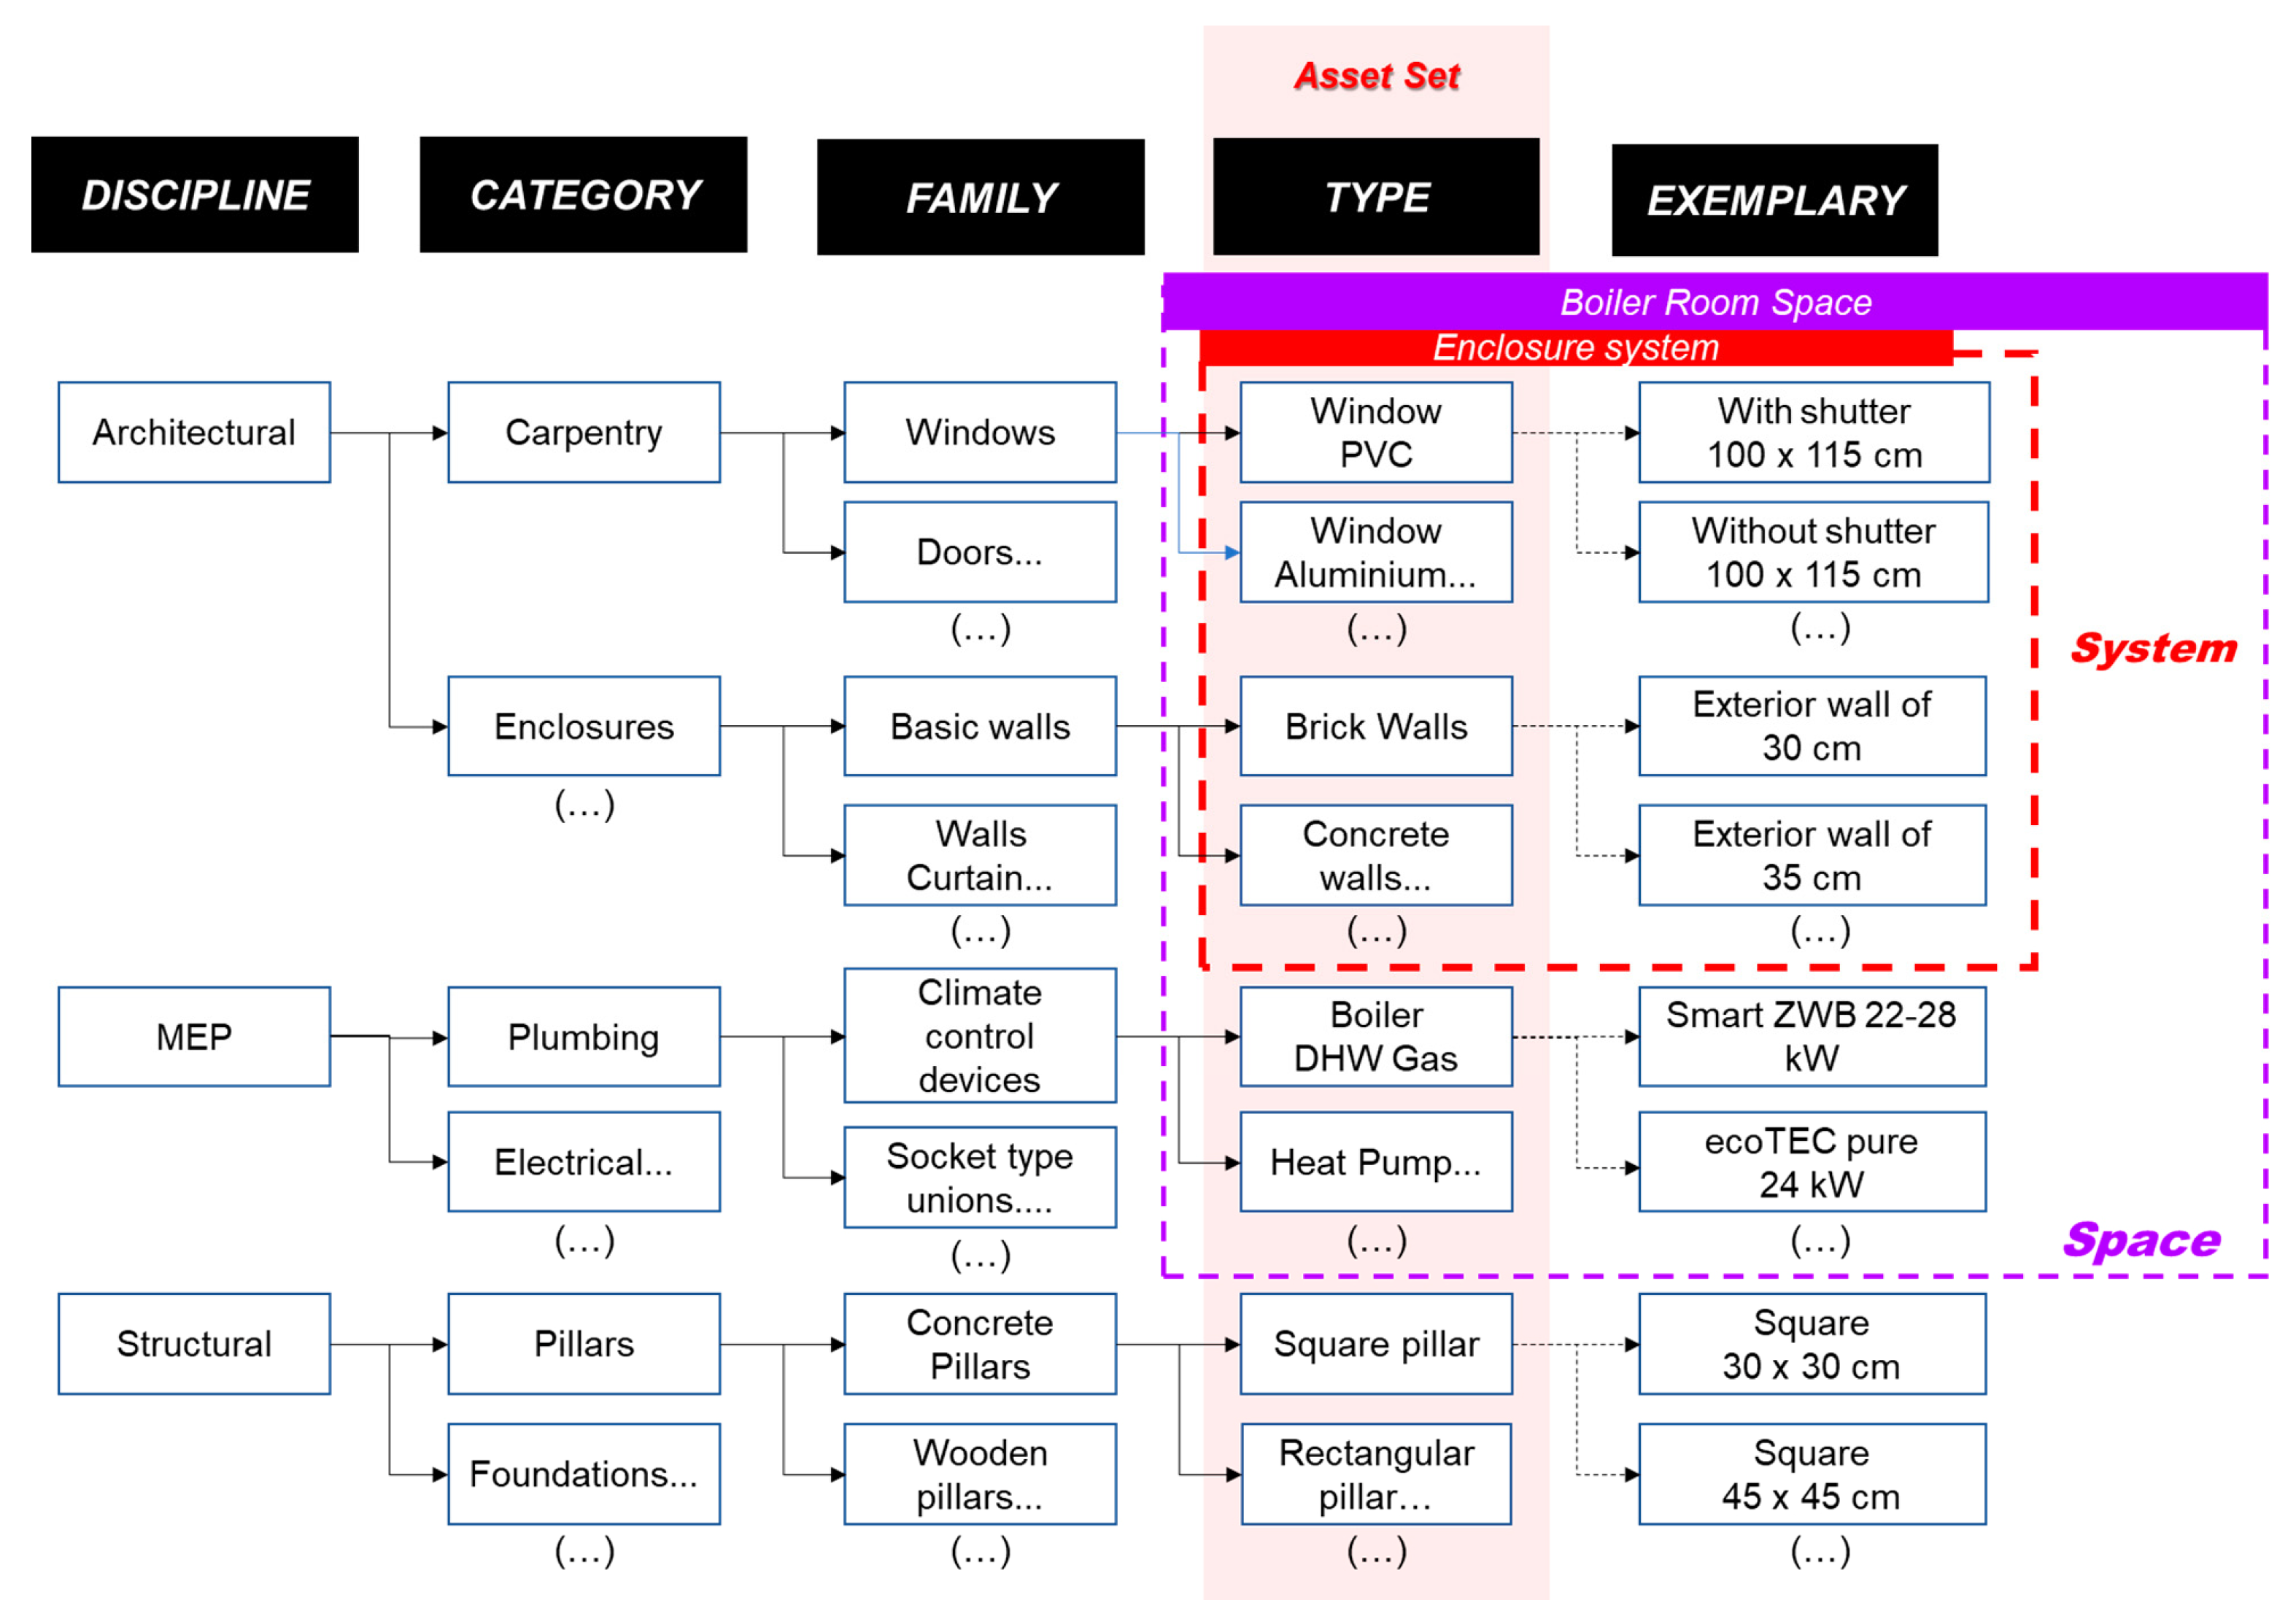
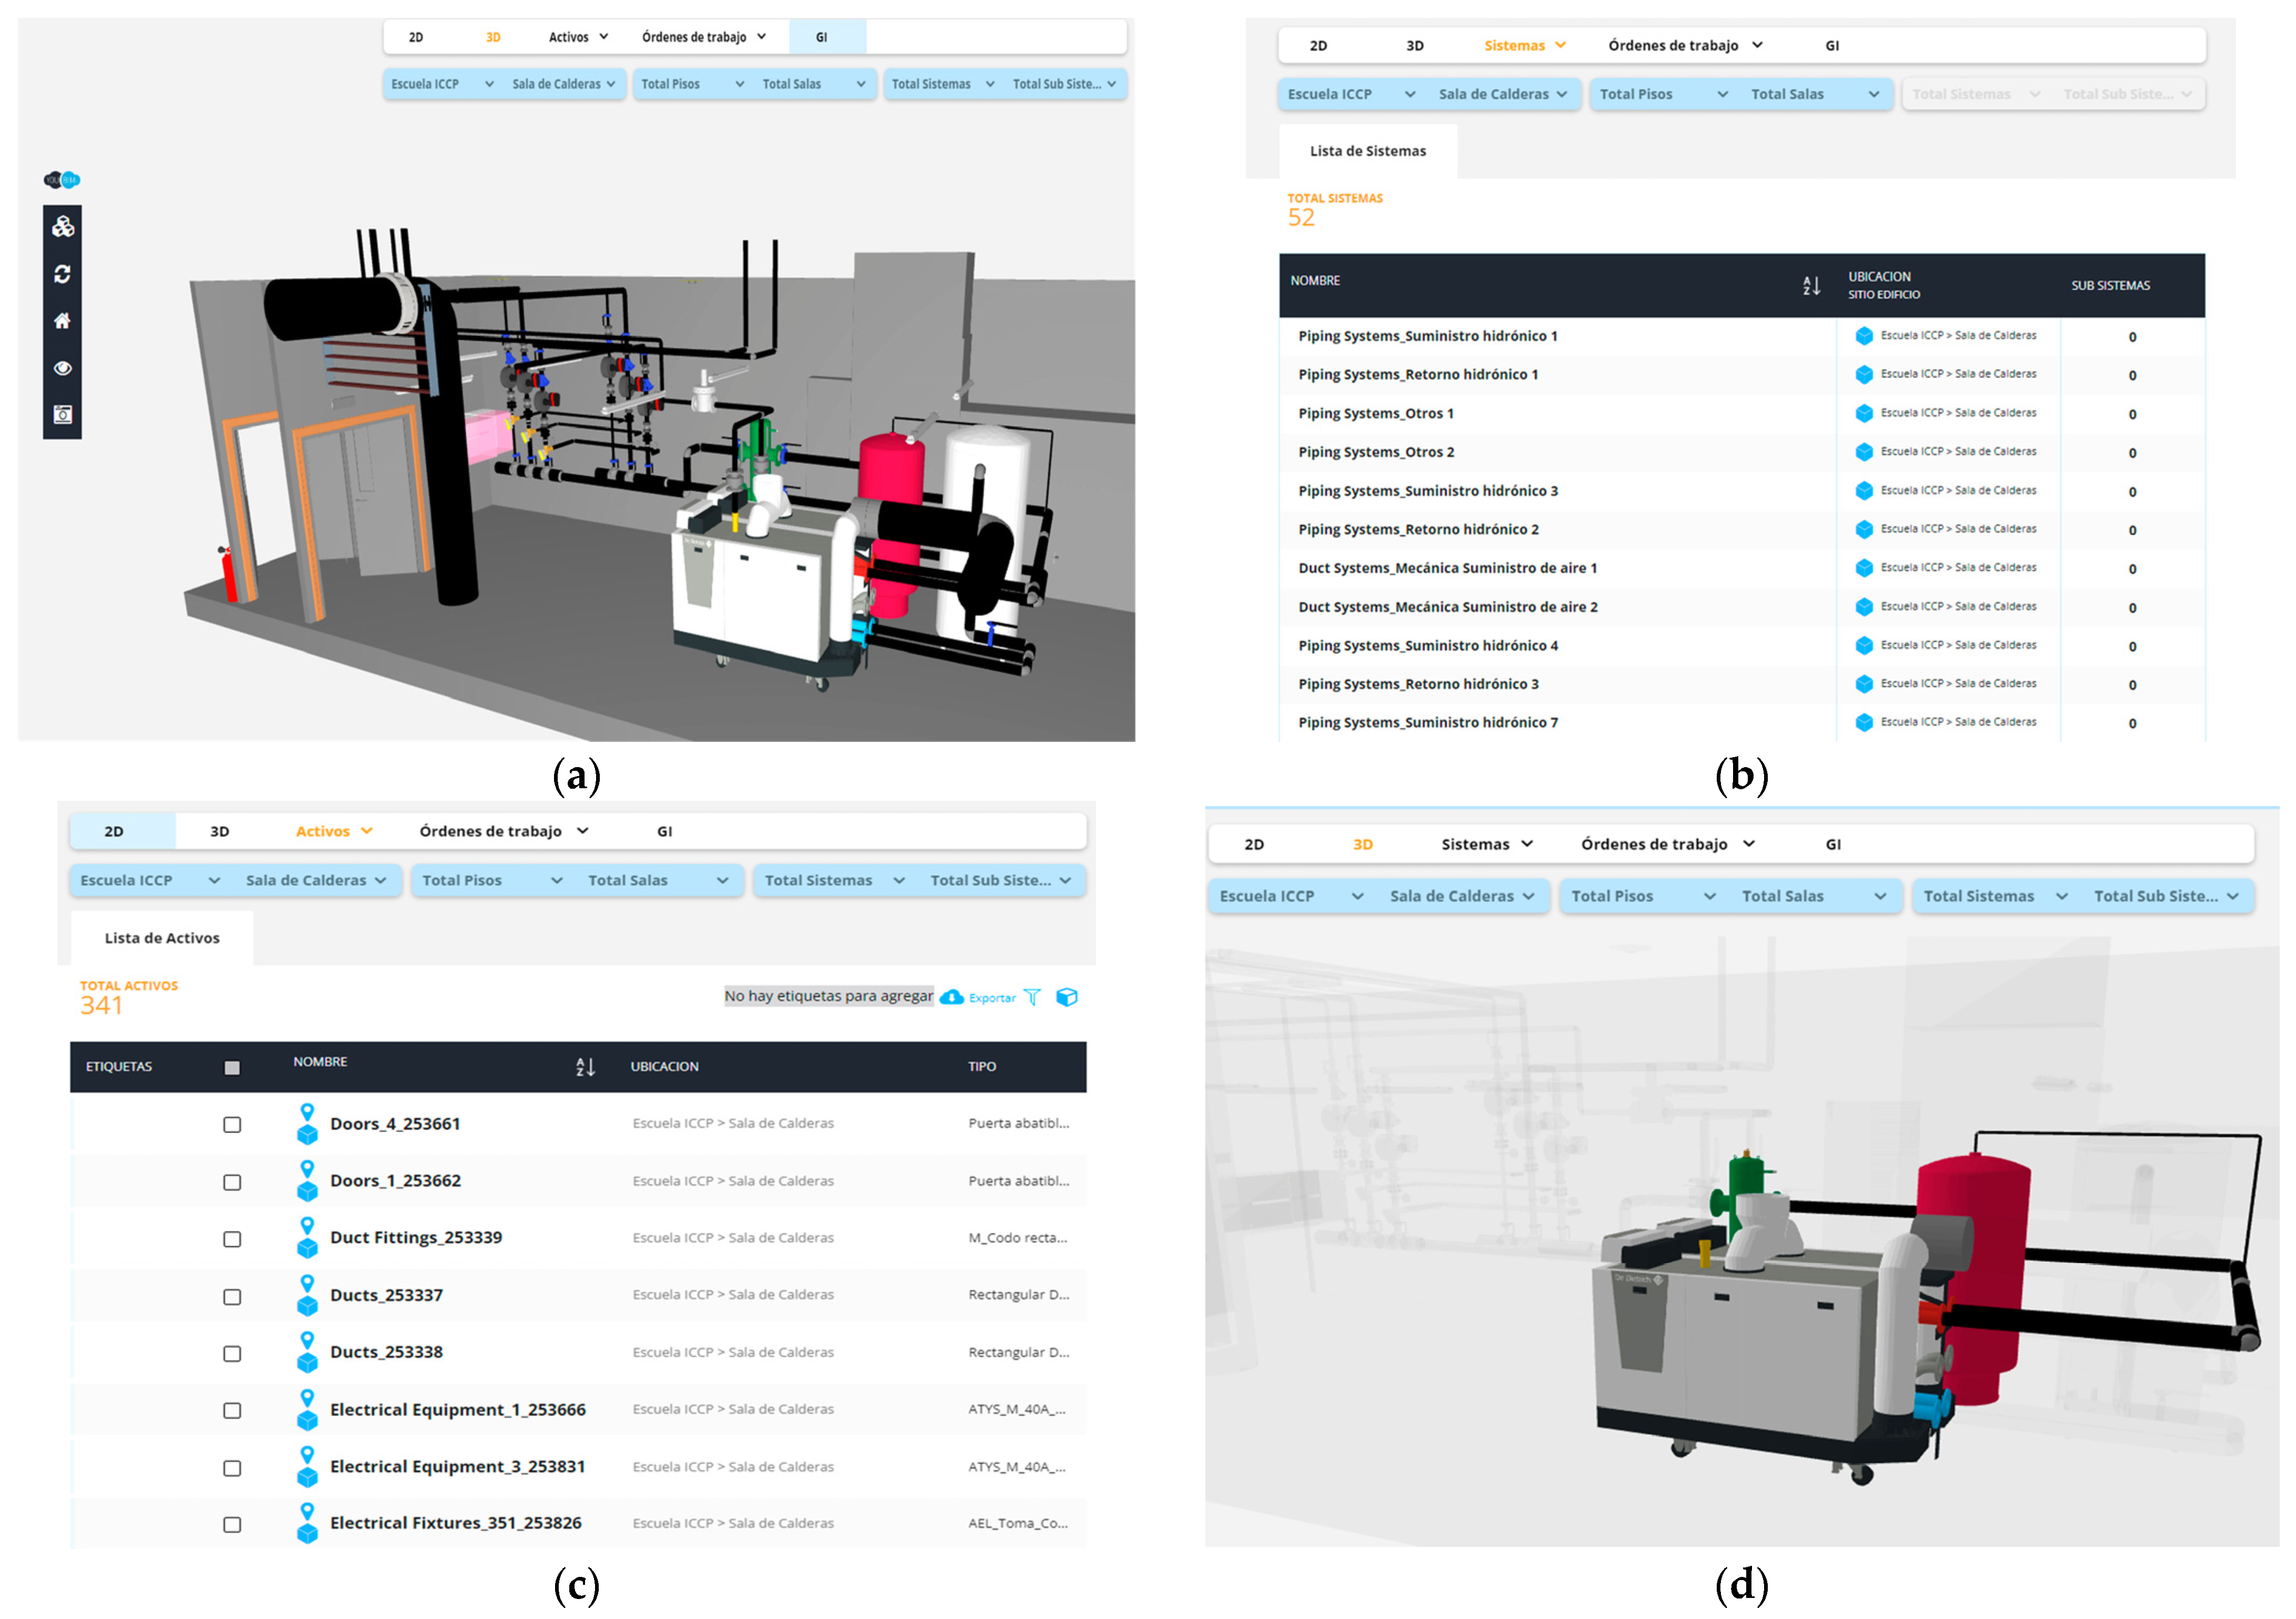
3.3.1. Step ①—Define Assets, Spaces, and Systems/Subsystems

The BIM model previously modeled in Revit 2019 is reused through the captured field data. The assets, spaces, and systems/subsystems that were worked with in this application case correspond to those of the first floor of the building, namely, plumbing fixtures (sinks, toilets, urinals, etc.), boiler room, furniture (desks, chairs, etc.), and some electrical devices (control panels, light fixtures, etc.).

3.3.2. Step ②—Link and Configure a Three-Dimensional Computer-Aided Maintenance Management System (CMMS-3D) and List the Stakeholders

A direct link with the text “click for CMMS” was added to the pop-up windows ArcGIS Pro in order to access the building asset information (Figure 17a). In this simulation the CMMS YouBIM software [30] is used. The integration of the BIM model to the CMMS is developed in three stages conditioned by YouBIM (Figure 17b).
In the first one, Classification of systems/subsystems in the Revit BIM model, this classification is applied directly to the set of assets (appliances) during their modeling in the BIM software. Several assets are selected and grouped, to which a “name and classification” are assigned, thereby forming the system. Figure 18a illustrates part of the classification process of the sanitary system in the bathrooms located on the first floor of the Civil Engineering School in Revit (labeled sanitary 1, sanitary 2, and sanitary 3), while Figure 18b shows the exploded view of the boiler system and subsystem of the building, as viewed with eveBIM software [29].
In the second stage, COBie file generation from Revit to Excel, the standard format for linking a BIM file to a CMMS application is COBie (Construction Operations Building Information Exchange). To generate COBie data, automation was implemented through the interoperability plugins of the BIM application used for the federated model (in this case, Revit). Finally, in the third stage, Linking 3D BIM Model (Revit) + COBie File (Excel) + CMMS (YouBIM), before linking the BIM file (Revit) and the COBie file (Excel) to the CMMS (YouBIM), the latter is configured in the cloud to host the data to be imported. Once this configuration is complete, the Revit BIM model and the COBie (Excel) file can be uploaded to the CMMS YouBIM application via the Revit YouBIM plugin. After the plugin process is completed, the final CMMS 3D model can be viewed and navigated, and the information content of the assets previously selected to populate the COBie can be accessed, as shown in Figure 19.

3.3.3. Step ③—Develop Pre-Maintenance Activities

Among the previous activities to be carried out are corrective maintenance and the corresponding work orders. The following section explains how to manage them using the YouBIM CMMS.

Asset Management (Types)

Assets are all the elements that make up the structure where maintenance is to be performed, from a screw that requires a predictive operation to an industrial electrical panel. With the “filters” tool in the CMMS, the assets can be browsed through, either by listing them (Figure 20a) or by viewing them in a 3D format (Figure 20b). When an asset is selected in the model for consultation, its properties can be accessed. In addition to being highlighted, a pop-up appears displaying preliminary information associated with the asset. Furthermore, the pop-up allows the information to be expanded in the “details” section, enabling the generation of Work Orders (in the “WO” section—OT in Spanish) or providing access to the asset’s location in the 2D drawings (Figure 21).

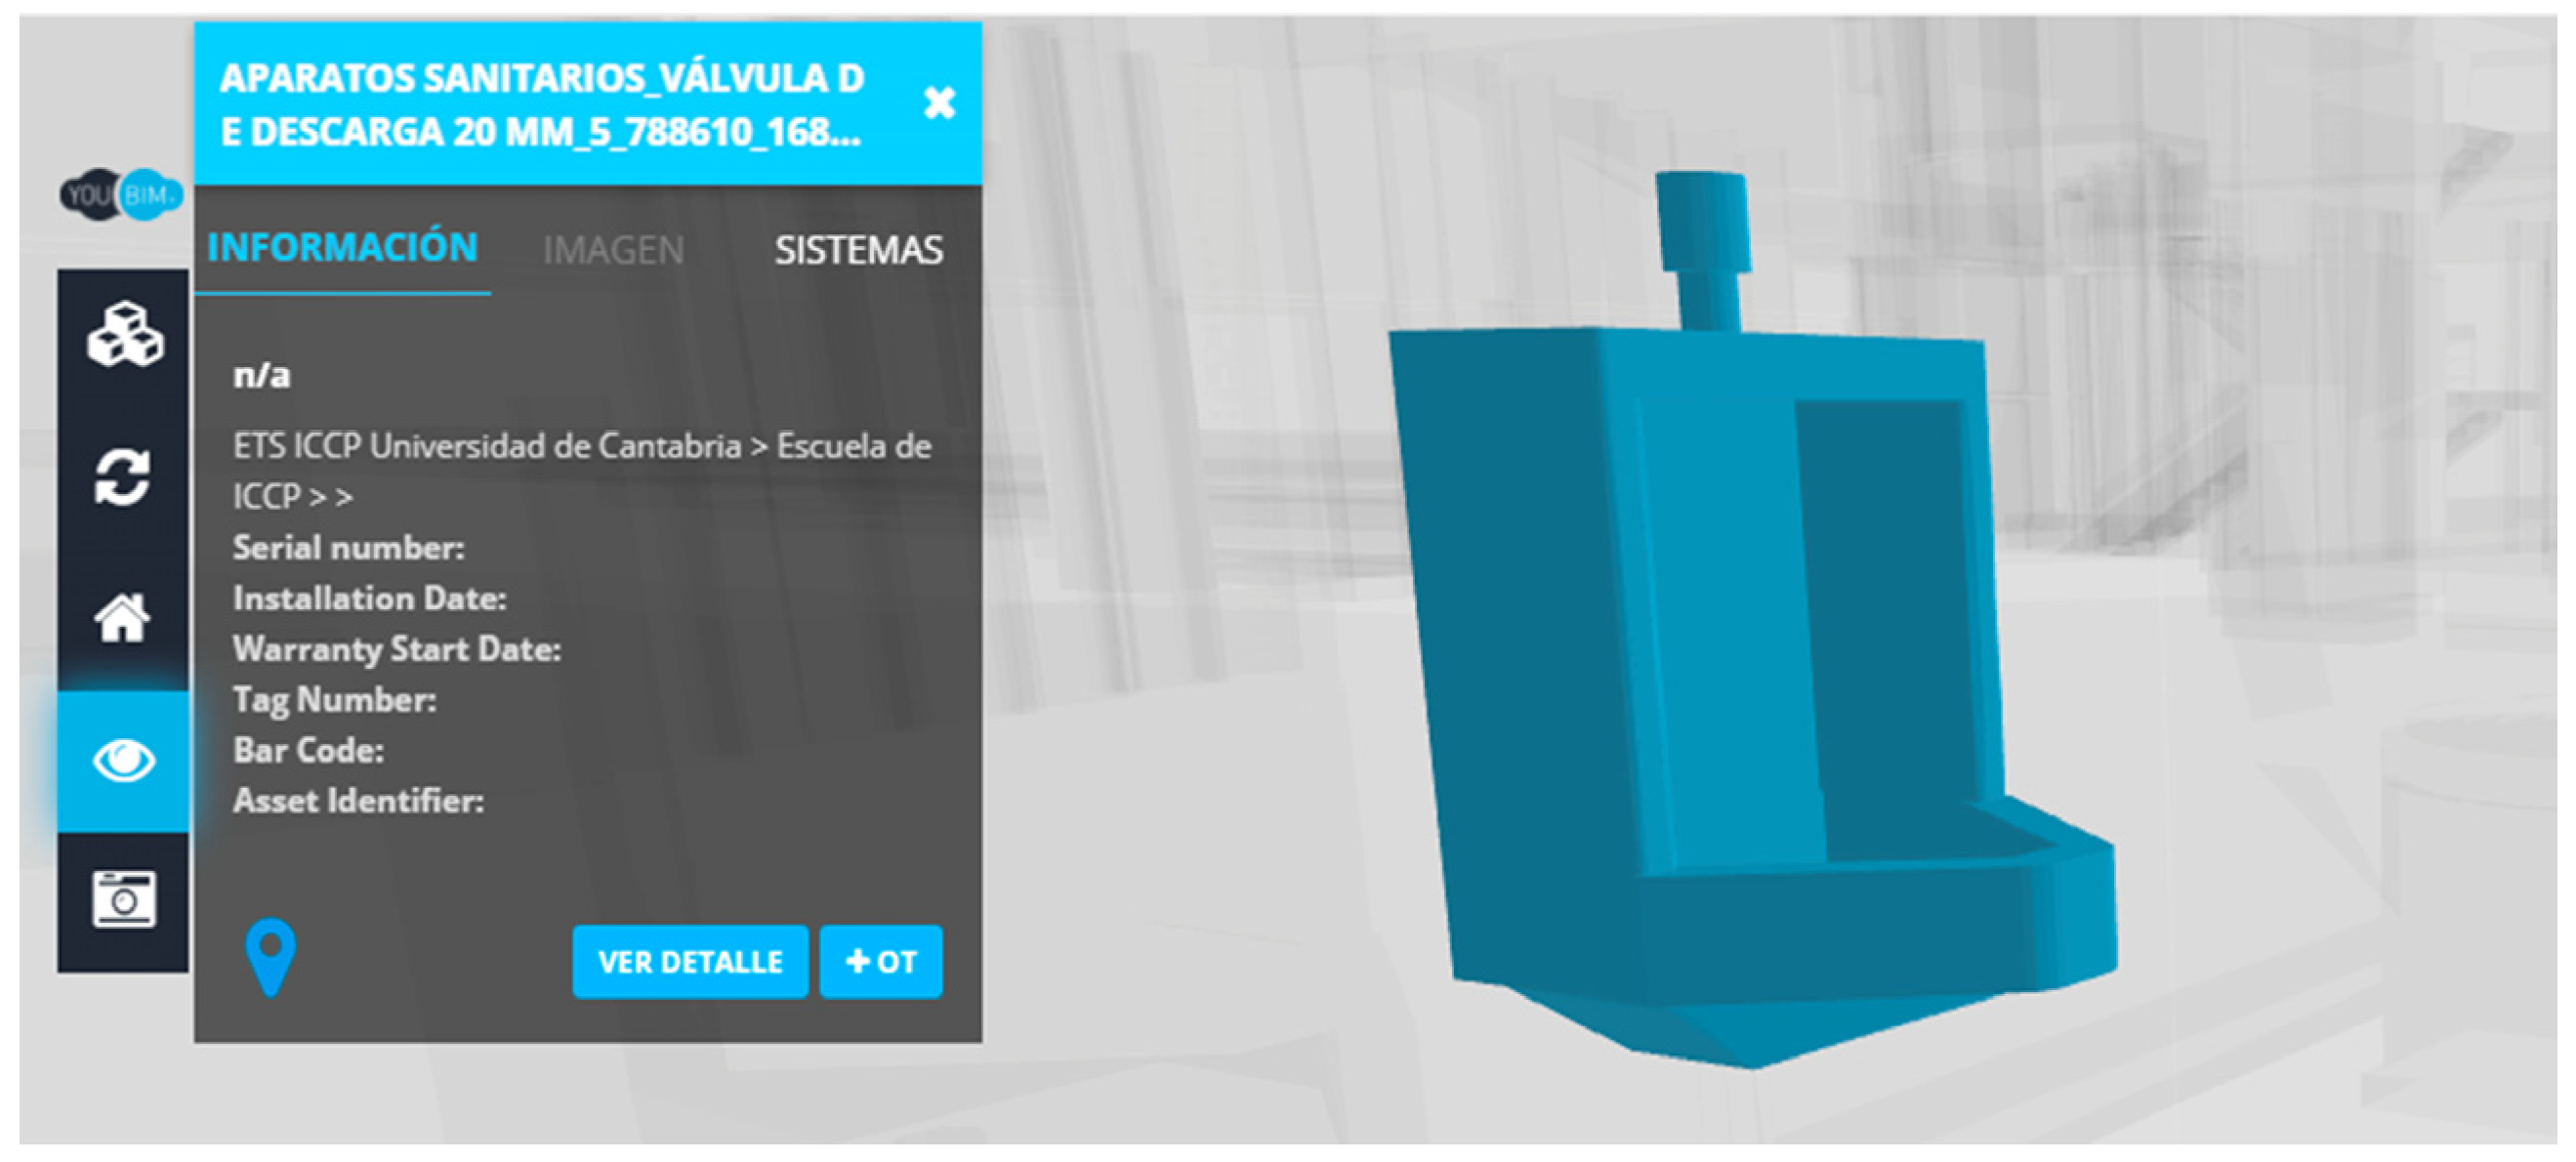
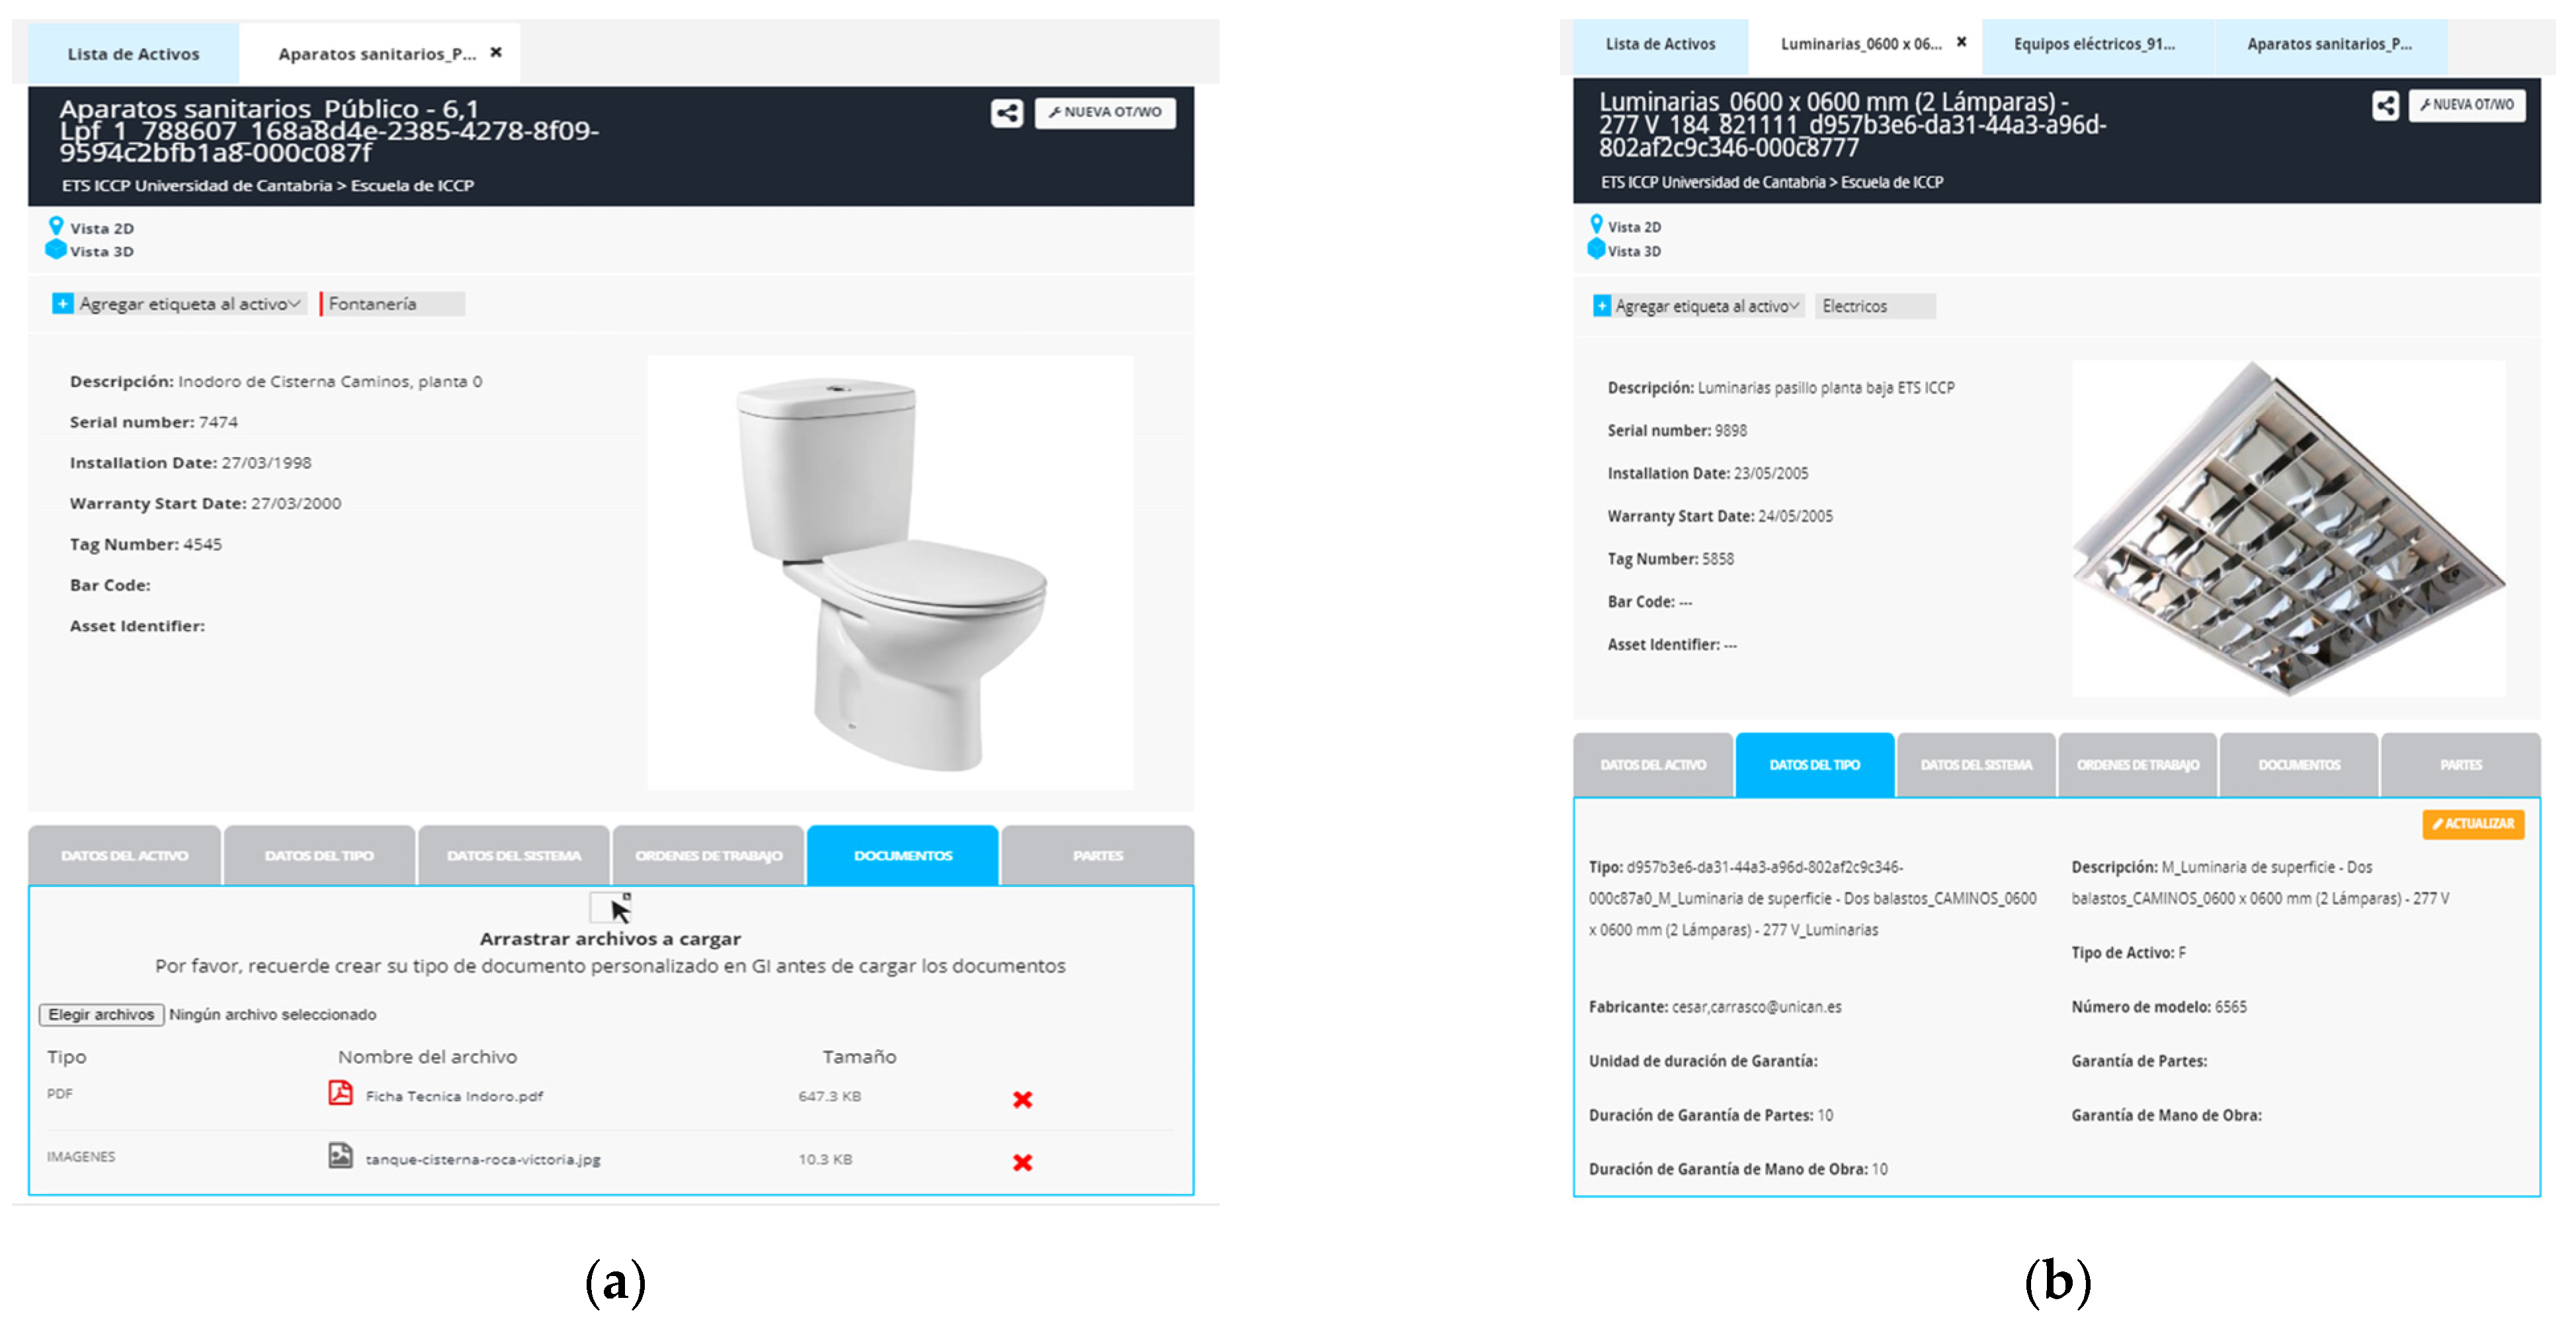
Manage Asset Details
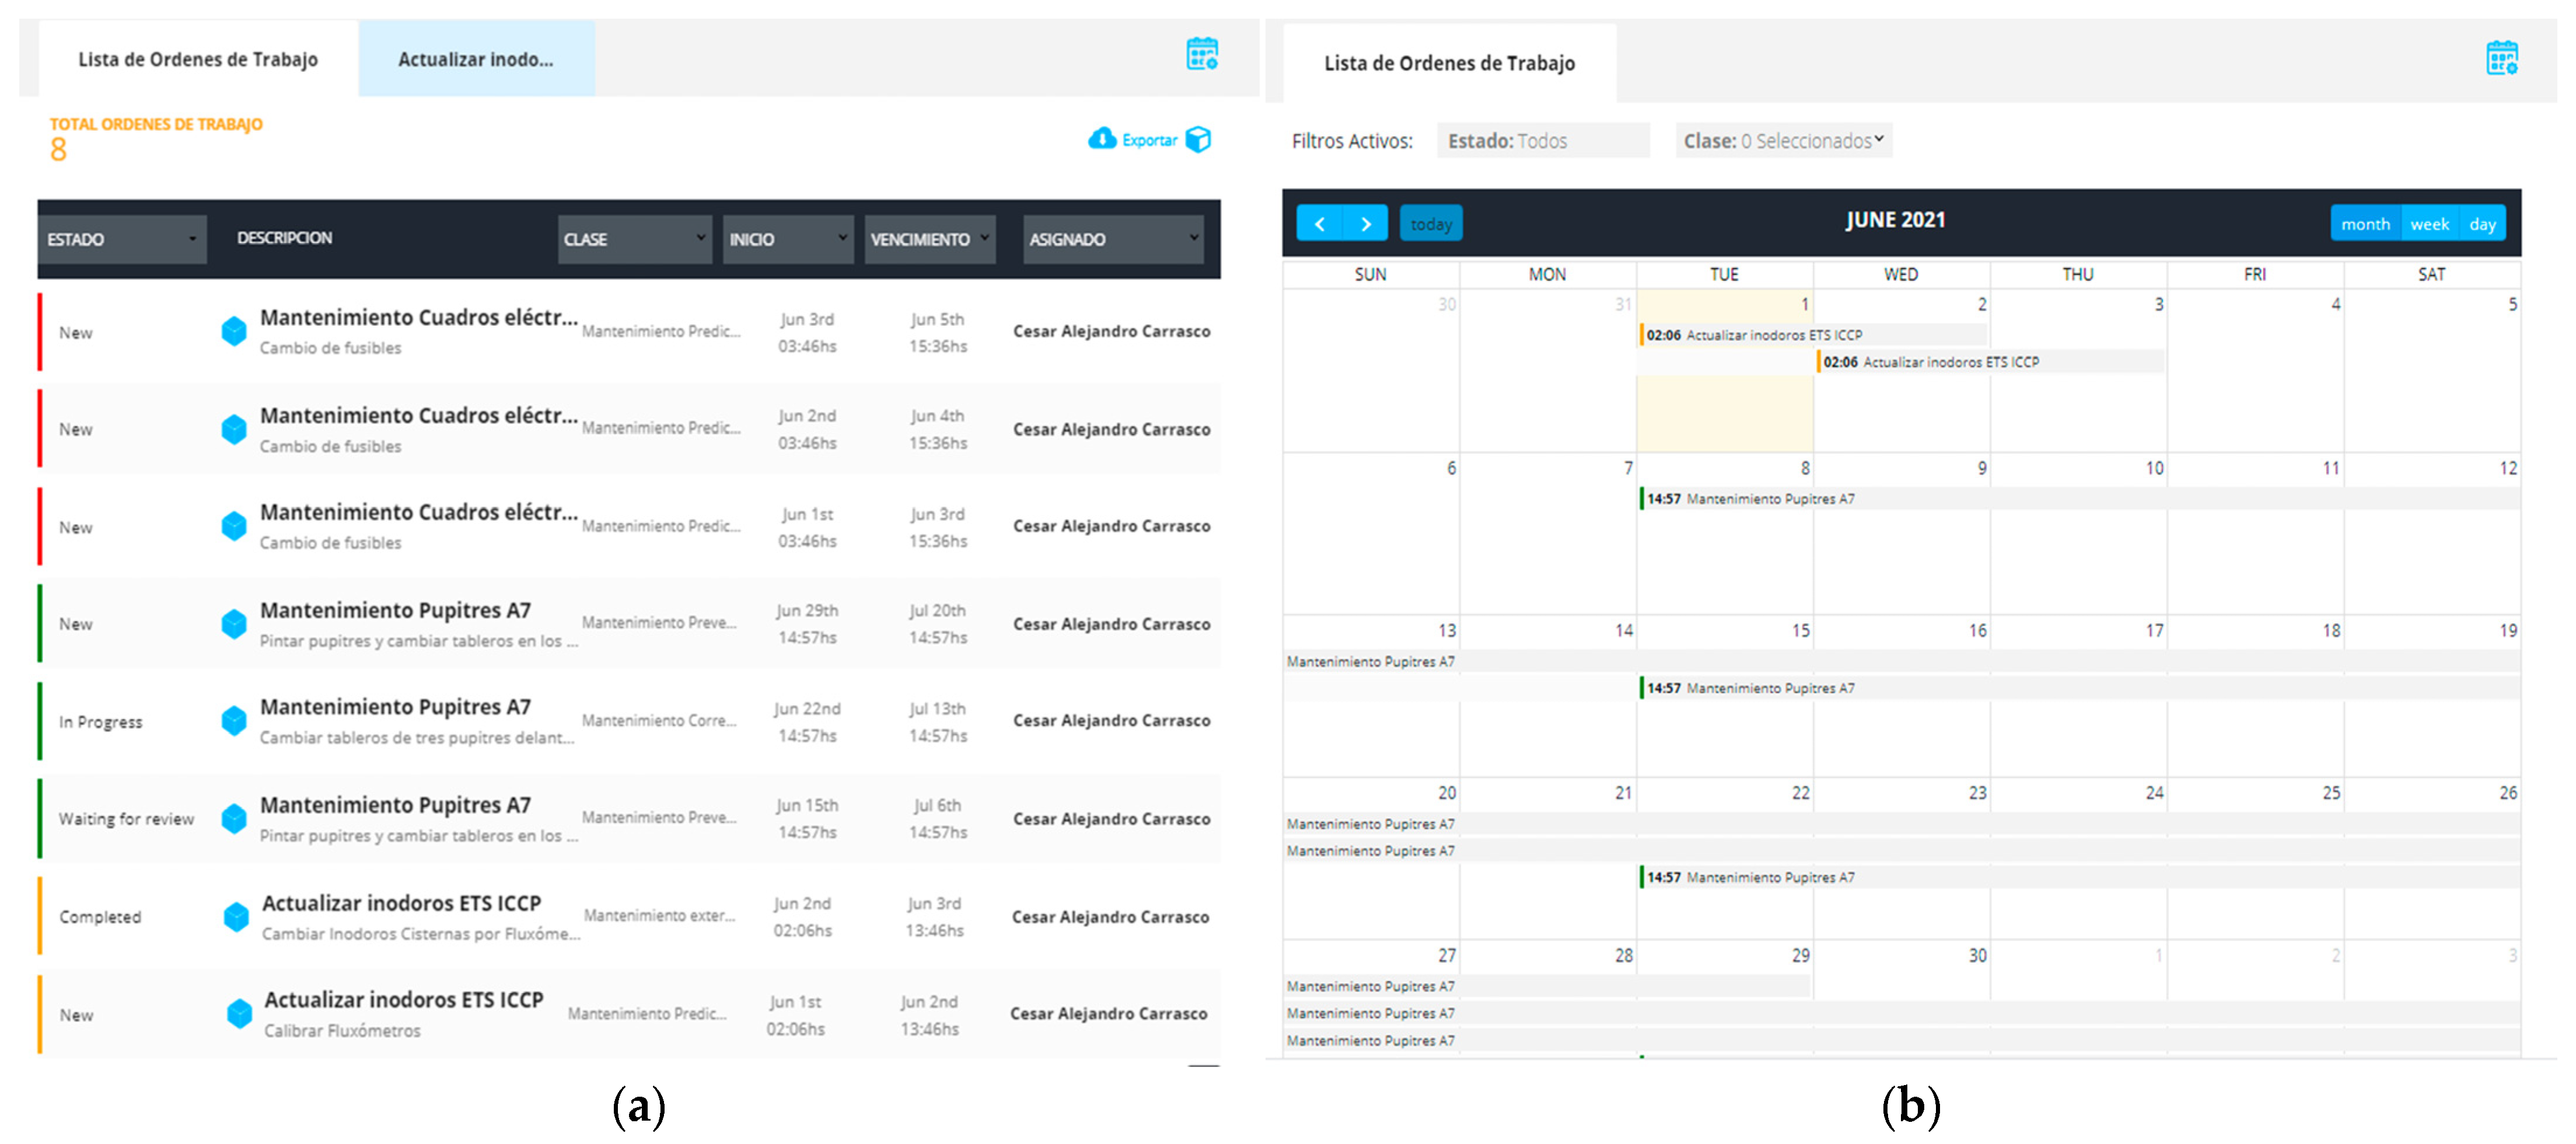
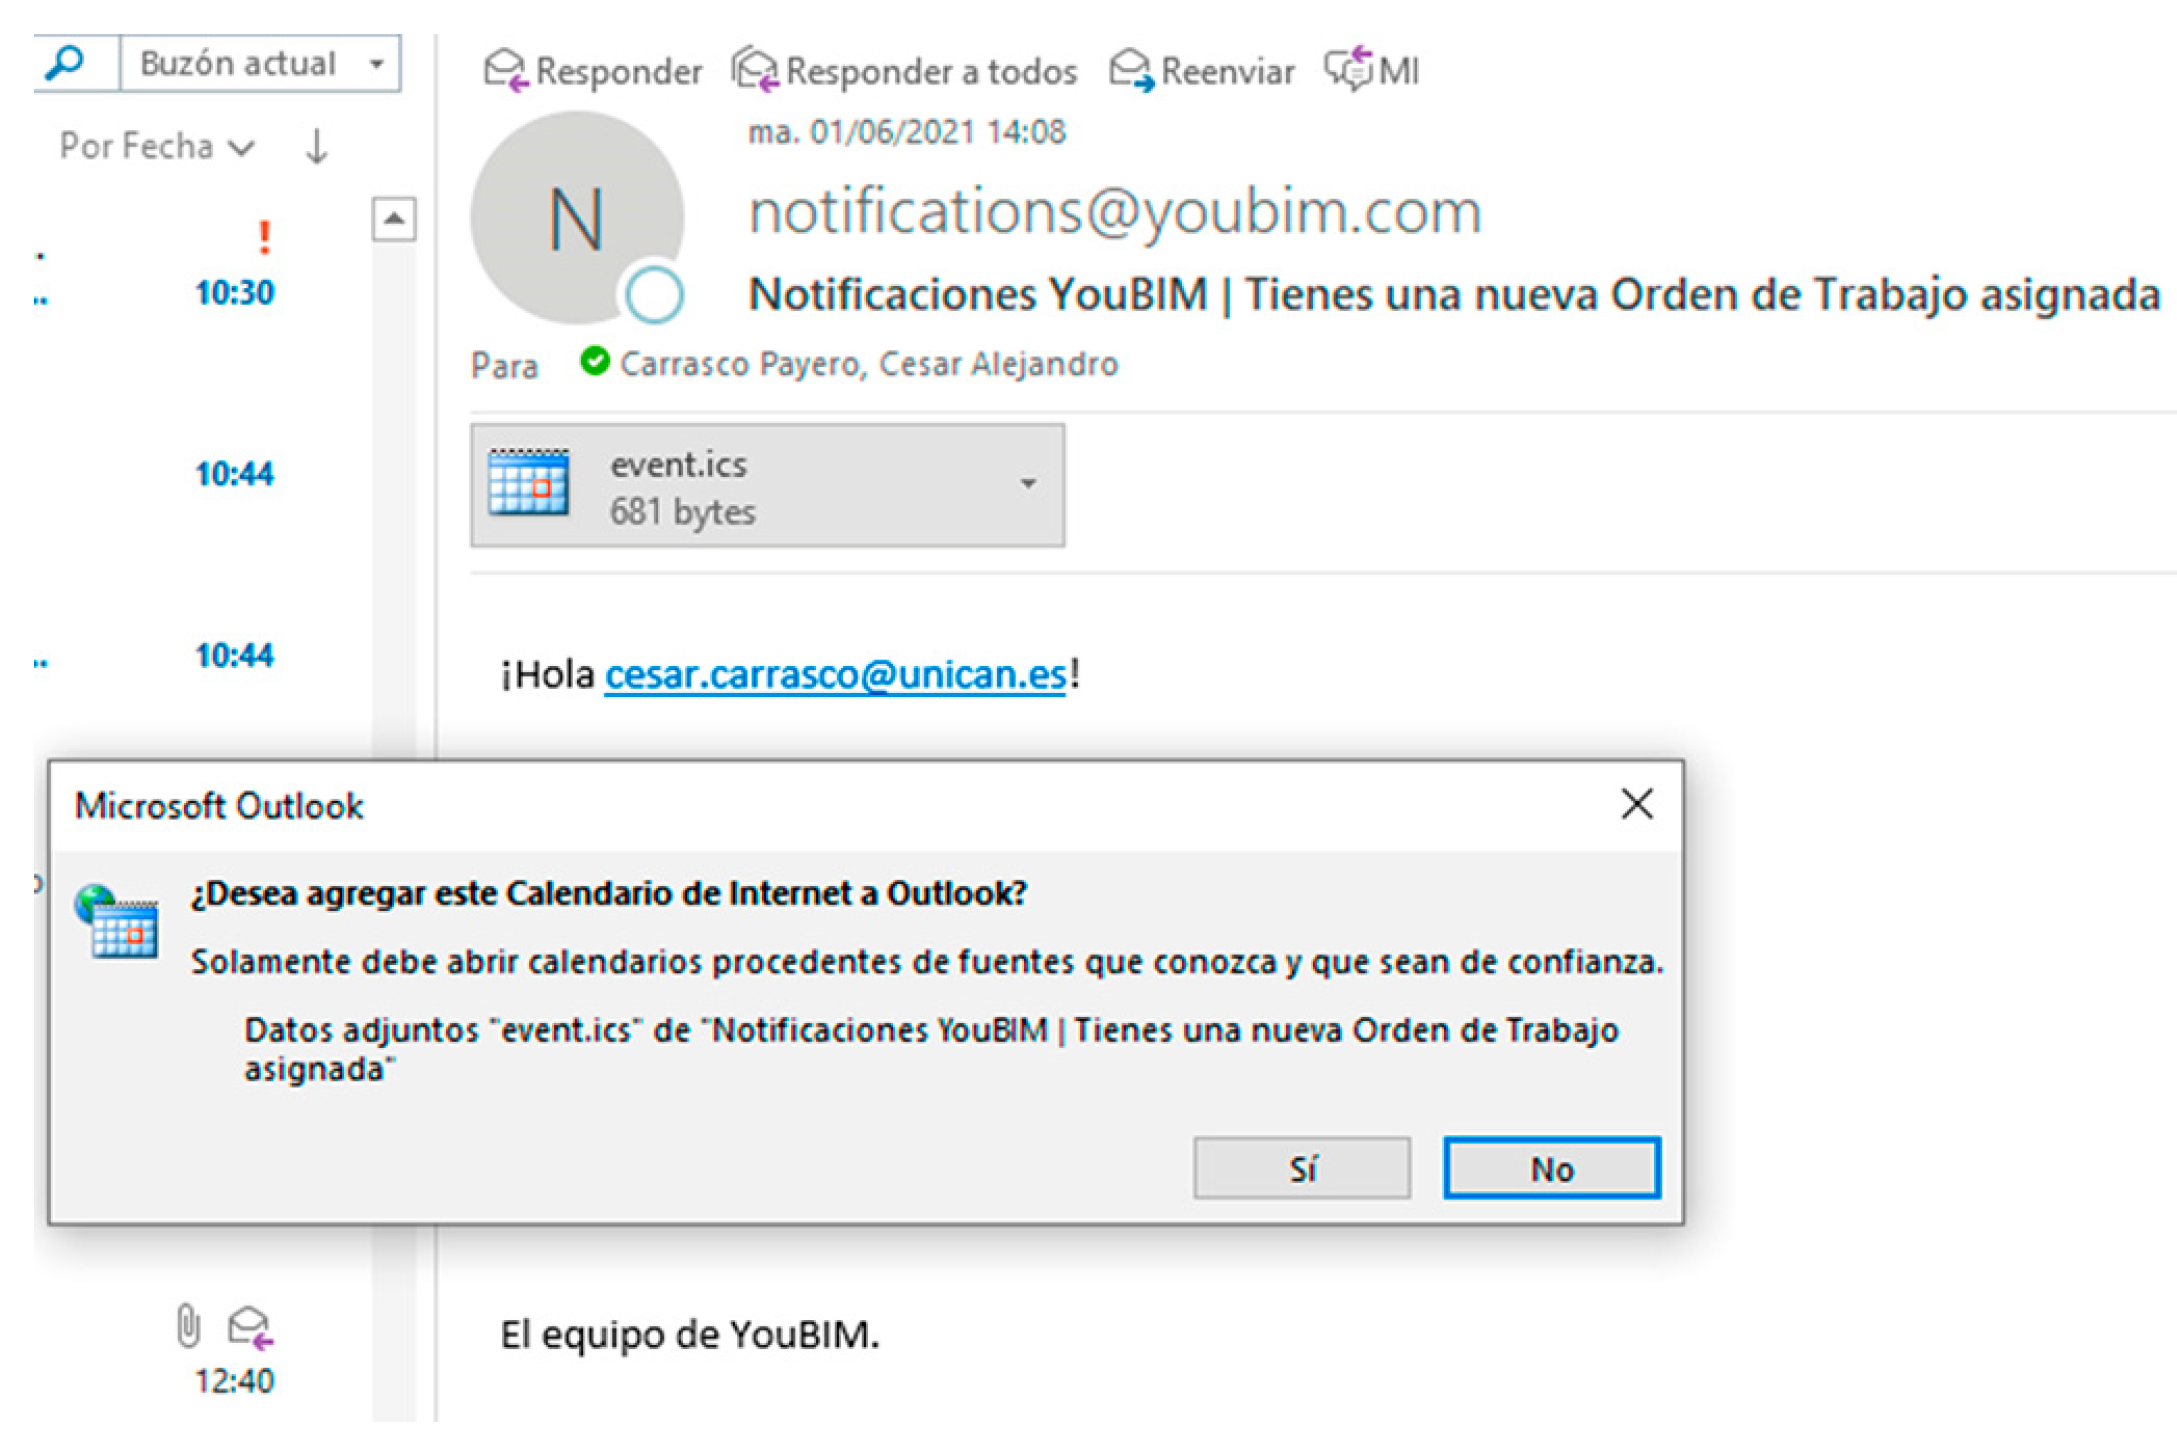
The asset details are managed through the “view details” option, which displays a pop-up containing all the information associated with the asset. In addition, it allows linking or filling in information that has not yet been updated or included, such as “asset data”, “type” data that provide further information on the asset, data on the system to which it belongs, work orders generated, associated documents or inclusion of new documents, etc. (Figure 22).

Work Orders (WO)

The software was configured to classify the work orders that are created according to the case, in the group of preventive, corrective, and predictive maintenance (Figure 23). In this way, when working with the work orders, the manager will be able to classify them quickly. The labels were also previously configured. Labels are a secondary way of sorting by assigning a color marking directly on the asset.
Work orders can be managed through listings (Figure 24a), scheduling (automatically generated in a calendar view with a monthly layout) (Figure 24b), and email notifications (Figure 25). This scheduling and notifications can be followed both from the CMMS itself and from the personal or institutional calendar associated with the account of the stakeholder in charge of the WO. Thus, every modification that is made to the WO will be notified via email, from its creation to its closure, including the documentation that is attached to the asset while the WO is open.

Room Management (Spaces)

The spaces are those areas that contain the systems and/or assets to be managed in the CMMS. These function as a filter or list (Figure 26). Once the systems and assets to be treated are identified, the management becomes direct on the asset.

Systems Management

Systems are sets of assets that are grouped together to provide a service to the building. An example of such a system is the boiler room of Civil Engineering School (Figure 27a). In the YouBIM system tab, users can access the set of subsystems that compose the boiler room (Figure 27b), considering the assets that make up each of them (Figure 27c) as if they were common to each other. Consequently, most of the maintenance scheduled for an asset within a subsystem (Figure 27d) will affect all the assets that compose that subsystem.

3.3.4. Step ④—Execute and Monitor Digitally of Maintenance Work

Digital maintenance monitoring relies on documenting and keeping the associated work orders up to date. This process utilizes the status parameter within the work orders section (Figure 28a). It can also be developed by feeding the affected assets with the documentation generated during maintenance, through the “Documentation” tab of the YouBIM software (Figure 28b).

4. Discussion of Results

4.1. Regarding the Model Generation (Phase 1)

To generate a GIS-3D model of the city, three key aspects must be considered: First, there is the challenge of obtaining an optimal 3D volumetric representation of the city as volumes are extruded using algorithms that rely on building footprints and LiDAR flight point clouds as input data. This process often results in graphic errors, largely due to the insufficient quality of the latter. Second, the challenge of configuring the realistic appearance of building facades (LoD 3) involves defining textures (multipaths) and external elements, such as windows and doors, on the established building volumes. Multipaths are polygonal elements that define the 3D contours of buildings, allowing for textures or photographs to be applied either manually or automatically. LoD 4 models, which are highly valued for their detailed interior partition definitions, require substantial labor and are not commonly produced in GIS, as most software lacks the necessary tools to effectively manage the complexities associated with this level of detail. Third, the hardware required for creating the GIS-3D models should include a minimum of 1 TB of disk space and 36 GB of RAM. For effective BIM model generation, expertise in 3D modeling specifically tailored to building construction is essential. This requires not only software proficiency but also a thorough understanding of the various facets of 3D modeling. A critical skill is the ability to differentiate between the disciplines associated with various components, whether they pertain to architectural design, structural engineering, or MEP systems (mechanical, electrical, and plumbing). Each discipline requires distinct parameter settings to ensure accurate representation and functionality within the model. Table 2 summarizes the challenges encountered in the model generation process.
The acquisition of geometric data for buildings, including measurements, irregularities, and deformations, is significantly enhanced by photogrammetric techniques and laser scanning (LiDAR). Both methods are essential for generating precise 3D point clouds and meshes that document architectural and structural features. These point clouds serve as templates for creating BIM models, enabling accurate representations for design and construction. Photogrammetry captures images from various angles to derive spatial data through triangulation, but it can be time-consuming and affected by environmental factors. In contrast, LiDAR offers a faster, more robust solution, using laser beams to measure distances and generate high-density point clouds. Its speed and accuracy make LiDAR an invaluable tool in architecture, engineering, and construction, improving data collection efficiency compared with photogrammetry. The BIM model generated from blueprints plays a crucial role in creating virtual libraries to organize and visualize building data in a 3D environment [31]. This capability enhances communication among stakeholders, such as architects, engineers, and facility managers. However, a limitation of BIM models created from blueprints is the potential lack of accuracy in measurements, especially for applications requiring precision, such as construction coordination, structural analysis, or system integration. Discrepancies in drafting, construction changes, or material variations can lead to inaccuracies. In contrast, the model generated with laser scanning clearly proved to be more accurate than the one generated from blueprints as it exhibited precise geometric similarity with the actual constructed building.
When comparing the resulting model with others identified in the reviewed literature, the most notable 3D digital city environments include Helsinki, Finland [32,33]; Cambridge, USA [34]; Digital Urban European Twin (Pizen, Czech Republic; Flanders, Belgium; Athens, Greece) [35]; Docklands, Dublin, Ireland [36]; and Singapore [37]. At the time of the literature review, all of these digital twins were characterized as 100% GIS platforms, lacking integration with BIM models. In this regard, while GIS entity attributes can be queried, access to building “type parameters” is not available. As a result, full access to the corresponding physical counterpart information is not achieved. This implies that the integrated GIS and BIM model offers improvements over existing models in several aspects, including the following: (1) The resulting model more accurately represents its real-world physical counterpart. (2) Obtaining a model with level of detail (LoD) 4 becomes a more streamlined process. (3) In GIS, by replacing mesh-type elements with BIM models, the model is lighter. (4) Access to all multiparametric information of the elements is provided. (5) Access to other platforms (and users) is facilitated via preconfigured links. (6) External users can update the model through external databases, such as Excel spreadsheets, without requiring knowledge in GIS or BIM, making the model a more accessible and universal tool. (7) Life cycle management is enhanced through the document management of the 3D virtual library. As a result, dissemination of the built environment and its internal characteristics is improved.

4.2. Concerning the Integrated GIS and BIM Platform (Phase 2)

Before integrating the GIS and BIM model, it is imperative to verify that all essential elements have been incorporated into the BIM model [38]. In developing the integrated GIS and BIM simulation environment, challenges arise due to the need to use multiple software programs simultaneously, with format incompatibilities preventing seamless integration. For this reason, electronic links are sometimes used to incorporate functionalities from external tools into the GIS and BIM model. An analysis of the GIS-3D and BIM integration process reveals several key technical aspects, highlighting both the strengths and challenges associated with their interoperability:
  • Enhanced integration capabilities: GIS-3D and BIM together provide a robust framework for integrating valuable information that supports quantitative analysis of buildings and their built environment. This integration results in semantically rich models that can be applied across various domains, enhancing the decision-making process.
  • Advanced database functionality: The integrated platform serves as an advanced database, facilitating the management and analysis of the 3D semantics of buildings. This capability allows for models that convey effect-response information, elucidating how buildings interact with their surrounding built environment.
  • Technical inefficiencies: Despite the advantages, there are notable technical inefficiencies in integrating GIS-3D and BIM. The existing literature indicates a lack of comprehensive theoretical studies that address how to effectively combine the strengths of both models. Much of the focus has been on navigation and visualization aspects of GIS-3D data, particularly in relation to CityGML, rather than on BIM-specific models.
  • Representation and interoperability: The integration of GIS and BIM models hinges on effective 3D representation and interoperability. Different formats exist for storing and exchanging 3D geometry in both environments, with CityGML and IFC being among the most widely used and standardized.
  • Semantic definition of geometry: Within the context of GIS and BIM integration, the geometry of models is intrinsically linked to their semantics. This relationship is articulated through levels of detail (LoDs) in GIS and levels of development (LODs) in BIM. It is important to clarify that these terms are often conflated; LODs should be understood as levels of development rather than mere levels of detail.
  • Challenges with higher detail levels: Higher detail levels, such as LoD 3 and LoD 4, which encompass architectural details, are infrequently achieved. The modeling of these levels requires a variety of datasets that must be collected using diverse technologies and often entails significant manual effort. As a result, most urban-scale buildings are typically represented at most in LoD 2, limiting the granularity of information available for analysis.

4.3. Concerning the Platform Application (Phase 3): 3D Building Facilities Maintenance Management

The application of integrated models for the simulation of building facilities maintenance management has proven to be an exceptionally effective tool. These models function as true virtual libraries, in which all information encapsulated within their parameters and attributes—both external and internal—can be easily accessed through advanced 3D navigation capabilities. The empirical results derived from this application indicate that the management of assets utilizing integrated 3D models, in contrast to traditional 2D tools, yields significant improvements across several critical areas:
  • Enhanced identification and assignment of asset needs: The 3D environment facilitates a more rapid identification and assignment of needs and operational tasks related to the assets. This enhanced capability allows for a more efficient allocation of resources and a quicker response to maintenance requirements.
  • Objective and immediate asset location: Integrated models enable the precise and immediate localization of assets impacted by incidents or work orders. Furthermore, these models facilitate the instant identification of associated stakeholders, streamlining communication and coordination efforts.
  • Centralized and accessible asset information: The transition to a 3D framework allows for the centralization, digitization, and accessibility of asset information from virtually any location, whether in the field or within the office environment. This level of accessibility enhances decision-making processes and operational efficiency.
  • Maintenance prediction through simulation: The capability to simulate various maintenance scenarios allows for the proactive prediction of maintenance needs, thus reducing potential downtimes and improving overall asset longevity.
  • Optimized management of historic buildings: The integration of building information modeling (BIM) techniques facilitates the optimization of management and maintenance strategies specifically for historic buildings, ensuring that preservation efforts are both effective and sustainable.
  • Organized 3D information management: The 3D environment allows for the structured organization of information generated throughout the design and construction processes. This organization is crucial for maintaining comprehensive project documentation and facilitating future reference.
  • Effective management of public spaces and infrastructure: The application of these integrated models extends to the management of public spaces and infrastructure, providing a holistic approach to urban planning and asset management.
  • Access to comprehensive parametric information: Users can access all parametric information associated with the model, allowing for a deeper understanding of the assets and their respective operational parameters.
  • Potential for sensor integration: The models present opportunities for the development and integration of applicable sensor technologies, enhancing the real-time monitoring and management of building facilities.
  • Robust statistical management: These integrated frameworks serve as excellent sources for statistical management of BIM parameters and GIS attributes, facilitating data-driven decision-making.
COBie (Construction Operations Building Information Exchange) is a data exchange standard that enables the transfer of information from a BIM model to the operations and maintenance management model. It identifies, lists, and classifies the parameters of the graphic units in an Excel data file. To identify assets and systems within a CMMS application, it is crucial for elements to be assigned a common code between both software platforms (Revit and YouBIM), referred to as the “Category”. The COBie file is generated by appropriately classifying these categories. When no specific classification is provided, the “OmniClass” classification is used by default. OmniClass is a comprehensive BIM classification system for the construction industry, primarily designed to offer a classification structure for electronic databases and software, thereby enriching the information within these resources [39].
In reference to the results regarding resource consumption (time, costs, personnel, tools, etc.) of the proposed 3D management model in this research (excluding the cost of the GIS and BIM modeling process) and in comparison with the existing 2D management model for the case study, Table 3 presents, based on the authors’ experience, the relative savings (in percentage) for different topics. These values were obtained by considering the actual time and resources consumed for each management task using both systems (2D and 3D).
However, if 3D models are not already available, creating these models in the short term may result in 3D facility management being even more costly than 2D management; nevertheless, neither the quality of information handled nor the efficiency of this management is comparable. Furthermore, in the medium to long term, the initial cost of model creation would be justified as the associated operational resources are reduced.
On the other hand, it is important to note that these results are not entirely transferable to all contexts, as aspects such as, among others, the institution’s interest in digitalizing its infrastructure in line with current and future needs, as well as the potential existence of administrative regulations, such as in Europe [3,40], that may mandate building digitalization, could impact the resulting returns.
For example, in the case of Spain, in compliance with European regulations, there is an obligation to present public projects in BIM [41], and public administrations are even encouraged to adopt GIS tools [42]. Some strategies of the Spanish government emphasize the need to promote and implement the use of BIM methodology in the life cycle analysis of buildings. This approach aims to efficiently calculate their sustainability, including aspects such as refurbishment, thereby contributing to improvements in climate change mitigation and the sustainability of constructions, including infrastructure [43]. For this reason, 3D digitalization and management are more advantageous for public buildings in Spain, such as the case study presented.

5. Conclusions

Digital twins enable the simulation of various scenarios that may arise in their physical counterparts, facilitating the exploration and analysis of management tasks. This capability enhances decision-making processes by enabling the anticipation of potential outcomes. However, many existing 3D digital city models lack a complete virtual library, largely due to the absence of the parameters or attributes provided by BIM models. To advance technological development in digitization, this research proposes a comprehensive methodological process for integrating GIS-3D and BIM digital models. The goal of this integration is to achieve effective interoperability between the two platforms, using tools compatible with computerized maintenance management systems (CMMSs). This integration leverages advanced 3D navigation within the built environment, allowing stakeholders to interact with and analyze data more intuitively. By fostering this interoperability, the research aims to enhance management practices and improve operational outcomes in built environment applications.
Successful BIM implementation relies on a comprehensive skill set that includes both technical proficiency and a deep understanding of the various disciplines involved in the construction process. Additionally, generating a GIS-3D city model presents several key challenges, including accurately extruding 3D volumes from building footprints and low-quality LiDAR point clouds, as well as creating realistic facade representations (LoD 3) using retouched on-site photographs. The LiDAR point cloud plays a critical role in the integrated GIS and BIM model by providing a template for defining the contours of the terrain, buildings, and other elements within the GIS environment. LiDAR captures high-resolution 3D data, offering precise coordinates that enable GIS software to delineate the geometric boundaries of various features. These contours form the foundation for generating 3D models, facilitating the development of accurate digital representations of the built environment. Integrating LiDAR data with BIM significantly enhances visualization and spatial analysis, thereby improving decision-making in urban planning, construction, and facility management.
The primary advantage of integrated GIS and BIM models lies in their ability to encapsulate geometric or semantic information in a 3D format as a virtual library, accessible to stakeholders for evaluating and making decisions regarding process development. This capability helps reduce resource consumption, including time, costs, personnel, training, and tools. While integrating GIS-3D and BIM offers significant opportunities for enhancing building management and analysis, addressing the identified technical challenges is essential to fully realize the potential of these platforms. Continued research and development in this field is critical to achieving seamless interoperability between the two systems. Developing an integrated GIS and BIM simulation is challenging due to software incompatibilities, often requiring electronic links to incorporate external tools effectively. This suggests that integration between GIS and BIM may not require a complete conversion between the platforms but rather mechanisms that enable the management of elements from both systems through lightweight external models.
Integrated models for simulating building maintenance have proven highly effective, providing three-dimensional virtual libraries with accessible information and advanced 3D navigation capabilities. These models significantly enhance asset management and resource optimization, achieving resource savings of 80 to 90% in some cases (excluding resources associated with the GIS and BIM modeling process) compared with traditional two-dimensional tools. However, a key limitation identified in the findings is compatibility issues with various formats and the integration of digital information across multiple types of 3D CMMS software. Notably, certain software does not support commonly used document formats, such as PDF, nor does it accommodate point cloud data. This compatibility challenge highlights the need for ongoing advancements in software interoperability to fully unlock the potential of integrated GIS and BIM systems. Finally, the results demonstrate the feasibility of documenting and optimizing 3D digital maintenance planning, as well as the entire execution process. The simulated application represents a successful shift from using CMMS technologies in 2D format to a computer-aided maintenance tool in a 3D environment, which is inherently more visual and intuitive.

Author Contributions

The contributions to this document by each author are listed below. C.A.C.: data curation, formal analysis, investigation, and writing—original draft. I.L.: conceptualization, formal analysis, methodology, resources, supervision, validation, and writing—review and editing. J.M.S.-E.: methodology, validation, investigation, and supervision. F.J.B.: methodology, validation, investigation, and supervision. All authors have read and agreed to the published version of the manuscript.

Funding

This research received no external funding.

Institutional Review Board Statement

Not applicable.

Informed Consent Statement

Not applicable.

Data Availability Statement

The data presented in this study are available in the article.

Conflicts of Interest

The authors declare no conflicts of interest.

References

  1. White, G.; Zink, A.; Codecá, L.; Clarke, S. A digital twin smart city for citizen feedback. Cities 2021, 110, 103064. [Google Scholar] [CrossRef]
  2. Lee, A.; Kim, J.; Jang, I. Movable Dynamic Data Detection and Visualization for Digital Twin City. In Proceedings of the 2020 IEEE International Conference on Consumer Electronics—Asia (ICCE-Asia), Seoul, Republic of Korea, 1–3 November 2020; pp. 1–2. [Google Scholar] [CrossRef]
  3. Comisión Europea. Oleada de Renovación Para Europa: Ecologizar Nuestros Edificios, Crear Empleo y Mejorar Vidas. 2020. Available online: https://eur-lex.europa.eu/resource.html?uri=cellar:0638aa1d-0f02-11eb-bc07-01aa75ed71a1.0022.02/DOC_1&format=PDF (accessed on 15 January 2022).
  4. Arcuri, N.; De Ruggiero, M.; Salvo, F.; Zinno, R. Automated Valuation Methods through the Cost Approach in a BIM and GIS Integration Framework for Smart City Appraisals. Sustainability 2020, 12, 7546. [Google Scholar] [CrossRef]
  5. Hijazi, I.H.; Krauth, T.; Donaubauer, A.; Kolbe, T. 3DCITYDB4BIM: A system architecture for linking bim server and 3d citydb for bim-gis-integration. ISPRS Ann. Photogramm. Remote Sens. Spat. Inf. Sci. 2020, 5, 195–202. [Google Scholar] [CrossRef]
  6. Andrianesi, D.E.; Dimopoulou, E. An Integrated Bim-Gis Platform for Representing and Visualizing 3d Cadastral Data. ISPRS Ann. Photogramm. Remote Sens. Spat. Inf. Sci. 2020, 6, 3–11. [Google Scholar] [CrossRef]
  7. Dore, C.; Murphy, M. Integration of Historic Building Information Modeling (HBIM) and 3D GIS for recording and managing cultural heritage sites. In Proceedings of the 2012 18th International Conference on Virtual Systems and Multimedia, VSMM 2012: Virtual Systems in the Information Society, Milan, Italy, 2–5 September 2012; pp. 369–376. [Google Scholar] [CrossRef]
  8. Baik, A.; Yaagoubi, R.; Boehm, J. Integration of Jeddah Historical BIM and 3D GIS for Documentation and Restoration of Historical Monument. ISPRS Int. Arch. Photogramm. Remote. Sens. Spat. Inf. Sci. 2015, 40, 29–34. [Google Scholar] [CrossRef]
  9. Goyal, L.K.; Chauhan, R.; Kumar, R.; Rai, H.S. Use of BIM in Development of Smart Cities: A Review. IOP Conf. Series Mater. Sci. Eng. 2020, 955, 012010. [Google Scholar] [CrossRef]
  10. Quattrini, R.; Pierdicca, R.; Morbidoni, C. Knowledge-based data enrichment for HBIM: Exploring high-quality models using the semantic-web. J. Cult. Herit. 2017, 28, 129–139. [Google Scholar] [CrossRef]
  11. Bruno, S.; De Fino, M.; Fatiguso, F. Historic Building Information Modelling: Performance assessment for diagnosis-aided information modelling and management. Autom. Constr. 2018, 86, 256–276. [Google Scholar] [CrossRef]
  12. Mol, A.; Cabaleiro, M.; Sousa, H.S.; Branco, J.M. HBIM for storing life-cycle data regarding decay and damage in existing timber structures. Autom. Constr. 2020, 117, 103262. [Google Scholar] [CrossRef]
  13. Hidalgo Sánchez, F.M.; Interoperabilidad Entre SIG y BIM Aplicada Al Patrimonio Arquitectónico. Exploración de Posibilidades Mediante la Realización de un Modelo Digitalizado de la Antigua Iglesia de Santa Lucía y Posterior Análisis. 2018. Available online: https://idus.us.es/handle/11441/79394 (accessed on 20 May 2023).
  14. Yin, X.; Liu, H.; Chen, Y.; Al-Hussein, M. Building information modelling for off-site construction: Review and future directions. Autom. Constr. 2019, 101, 72–91. [Google Scholar] [CrossRef]
  15. Kassem, M.; Kelly, G.; Dawood, N.; Serginson, M.; Lockley, S. BIM in facilities management applications: A case study of a large university complex. Built Environ. Proj. Asset Manag. 2015, 5, 261–277. [Google Scholar] [CrossRef]
  16. Tejaswini, V.; Rao, P.K.; Shankar, G.J.; Nagaraja, R.; Sinha, S.K. A Comparative Study on Various Stages of Level of Details in Advanced 3D Building Construction Using BIM Tools. IOP Conf. Ser. Mater. Sci. Eng. 2020, 1006, 012012. [Google Scholar] [CrossRef]
  17. Antwi-Afari, M.; Li, H.; Pärn, E.; Edwards, D. Critical success factors for implementing building information modelling (BIM): A longitudinal review. Autom. Constr. 2018, 91, 100–110. [Google Scholar] [CrossRef]
  18. Escribano, J.M. Facility Management con BIM: Aplicaciones de Software Existentes en el Mercado. J. BIM Constr. Manag. 2022, 4, 1. Available online: https://journalbim.org/index.php/jb/issue/view/4/7 (accessed on 25 March 2023).
  19. Abd, A.M.; Hameed, A.H.; Nsaif, B.M. Documentation of construction project using integration of BIM and GIS technique. Asian J. Civ. Eng. 2020, 21, 1249–1257. [Google Scholar] [CrossRef]
  20. Popovic, D.; Govedarica, M.; Jovanovic, D.; Radulovic, A.; Simeunovic, V. 3D Visualization of Urban Area Using Lidar Technology and CityGML. IOP Conf. Ser. Earth Environ. Sci. 2017, 95, 042006. [Google Scholar] [CrossRef]
  21. El-Mekawy, M.; Östman, A.; Hijazi, I. A Unified Building Model for 3D Urban GIS. ISPRS Int. J. Geo-Inf. 2012, 1, 120–145. [Google Scholar] [CrossRef]
  22. Przybyla, J. The Next Frontier for BIM: Interoperability With GIS. J. Build. Inf. Model. Off. Publ. Natl. Inst. Build. Sci. Build. Alliance 2010, 2010, 14–18. [Google Scholar]
  23. UN E-EN 15221-6; Gestión de Inmuebles y Servicios de Soporte. AENOR: Madrid, Spain, 2012; pp. 1–52.
  24. UNE-EN-15551-5; Gestión de Inmuebles y Servcios de Soporte Parte 5. AENOR: Madrid, Spain, 2012; pp. 1–46.
  25. Yang, X.; Grussenmeyer, P.; Koehl, M.; Macher, H.; Murtiyoso, A.; Landes, T. Review of built heritage modelling: Integration of HBIM and other information techniques. J. Cult. Heritage 2020, 46, 350–360. [Google Scholar] [CrossRef]
  26. Castellano-Román, M.; Pinto-Puerto, F. Dimensions and Levels of Knowledge in Heritage Building Information Modelling, HBIM: The model of the Charterhouse of Jerez (Cádiz, Spain). Digit. Appl. Archaeol. Cult. Herit. 2019, 14, e00110. [Google Scholar] [CrossRef]
  27. de Cantabria, G. Mapas Cantabria. 2022. Available online: https://mapas.cantabria.es/ (accessed on 6 July 2022).
  28. Gobierno, d.E. Sede Electrónica de Catastro España. 2021. Available online: https://www.sedecatastro.gob.es/ (accessed on 12 May 2021).
  29. CSTB.Fr. eveBIM-CSTB. eveBIM-Centro Científico y Técnico de la Edificación. 2020. Available online: https://www.cstb.fr/communiques-de-presse/numerique-gestion-technique-patrimoniale (accessed on 4 May 2023).
  30. Youbim. YouBIM—Bim for Facility Management Software. 2021. Available online: https://www.youbim.com/ (accessed on 2 June 2021).
  31. Carrasco, C.A.; Lombillo, I.; Sánchez-Espeso, J. Methodology for the generation of 3D city models and integration of HBIM models in GIS: Case studies. Vitr. Int. J. Arch. Technol. Sustain. 2022, 7, 74–87. [Google Scholar] [CrossRef]
  32. City of Helsinki. Helsingin 3D-Mallit. Helsinki’s Digital Twin and City Models Helsingin 3D-Mallit. 2022. Available online: https://kartta.hel.fi/3d/mesh/ (accessed on 5 May 2023).
  33. City of Helsinki. Helsingin 3D-Kaupunkimallit. 2022. Available online: https://kartta.hel.fi/3d/#/ (accessed on 5 May 2023).
  34. Cambridge GIS. Model GIS City of Cambridge/Citywide 3D Model. 1999. Available online: https://www.cambridgema.gov/GIS/3D/citywide3dmodel (accessed on 7 December 2020).
  35. DUET City Twins. Casa Clásica—Dúo. Urban Digital Twins. 2021. Available online: https://citytwin.eu/ (accessed on 5 May 2023).
  36. Smart Dublin. 3D Data Model Resources for Dublin Docklands SDZ—Dataset—data.smartdublin.ie. 2019. Available online: https://data.smartdublin.ie/dataset/mapview/2194d38a-46a9-4e5c-8184-3e87ed1bff68 (accessed on 5 May 2023).
  37. Geospatial. Singapore Government Virtual Singapur. 2022. Available online: https://geospatial.sla.gov.sg/ (accessed on 5 May 2023).
  38. Carrasco, C.A.; Lombillo, I.; Blanco, H.; Boffill, Y.; Sánchez-Haro, J. Integración de HBIM & GIS para la visualización 3D de Bibliotecas Virtuales en Edificios Existentes: Caso de Estudio. In Proceedings of the REHABEND 2022, Granada, Spain, 13–16 September 2022; p. 11. [Google Scholar]
  39. C. S. Institute. OmniClass—Instituto de Especificaciones de Construcción. 2019. Available online: https://www.csiresources.org/standards/omniclass (accessed on 28 May 2021).
  40. European Union. Directiva 2014/24/UE. Diario Oficial de la Unión Europea. 2014, 2014, pp. 65–242. Available online: https://eur-lex.europa.eu/legal-content/ES/TXT/PDF/?uri=CELEX:32014L0024&from=ES (accessed on 22 April 2022).
  41. Jefatura del Estado Boletín Oficial del Estado. Ley de Contratos del Sector Público—BOE-A-2017-12902-Consolidado. 2017. Available online: https://www.boe.es/buscar/pdf/2017/BOE-A-2017-12902-consolidado.pdf (accessed on 22 April 2022).
  42. Gobierno de España. Plan para la Conectividad y las Infraestructuras Digitales de la Sociedad, la Economía y los Territorios. Minist. Asuntos Económicos y Transform. Digit. 2020. Available online: https://portal.mineco.gob.es/es-es/digitalizacionIA/paginas/plan-conectividad.aspx (accessed on 23 April 2022).
  43. Gobierno de España. España Circular 2030. Estrateg. Española Econ. Circ. 2030. Available online: https://www.miteco.gob.es/content/dam/miteco/es/calidad-y-evaluacion-ambiental/temas/economia-circular/espanacircular2030_def1_tcm30-509532_mod_tcm30-509532.pdf (accessed on 23 April 2022).
Figure 1. Life cycle of a BIM project.
Applsci 14 11097 g001
Figure 2. Systems (in text) and subsystems (symbols) of the building.
Applsci 14 11097 g002
Figure 3. Schematic representation of the three phases of the proposed methodology for simulating 3D building facilities maintenance management.
Applsci 14 11097 g003
Figure 4. Procedure for managing the maintenance of the building’s facilities.
Applsci 14 11097 g004
Figure 5. Hierarchical structure of the digital elements of the model.
Applsci 14 11097 g005
Figure 6. Location: (a) Santander campus of “Las Llamas” of the University of Cantabria. (b) Civil Engineering School.
Applsci 14 11097 g006
Figure 7. Terrain definition. (a) The point cloud from the 2012 LiDAR flight of the PNOA is displayed over an orthophoto of Santander. This combination allowed for a detailed visualization of the terrain and building features, enhancing the understanding of the geographical landscape and facilitating further analysis in GIS applications. (b) Textured digital terrain model (DTM) of Santander.
Applsci 14 11097 g007
Figure 8. A 3D environment model. (a) A 3D environment in LoD 1 with ArcGIS Pro 2.7. (b) A 3D built environment of “Las Llamas” Campus LoD 2 with university buildings in LoD 3.
Applsci 14 11097 g008
Figure 9. (a) Laser scanner Leica-geosystem BLK360. (b) Circular targets used in the laser scans visualized in linked point clouds. (c) General approach to the processing of the point cloud obtained from the first floor of the Civil Engineering School.
Applsci 14 11097 g009
Figure 10. Screenshot in Metashape Pro software, version 1.8. Textured photogrammetric mesh.
Applsci 14 11097 g010
Figure 11. BIM modeling process of the Civil Engineering School (in Spanish: E.T.S. de Ingenieros de Caminos, Canales y Puertos), using 2D CAD drawings as a template.
Applsci 14 11097 g011
Figure 12. Modeling of the facade of the Civil Engineering School with the tool “mass”.
Applsci 14 11097 g012
Figure 13. Process of readjustment of the model developed from existing plans, using as the template the point cloud resulting from laser scanning.
Applsci 14 11097 g013
Figure 14. Model integration. (a) Georeferencing. (b) Integrated GIS and BIM model.
Applsci 14 11097 g014
Figure 15. Preliminary BIM model input. (a) Preliminary feeding of the BIM model: examples of creation and edition of furniture and equipment families. (b) Equipment of the first floor of the building (authors’ elaboration with eveBIM software, version 4.2.4.585 [29]).
Applsci 14 11097 g015
Figure 16. Shared parameters of BIM model envelopes. (a) Creation process. (b) Feeding and querying.
Applsci 14 11097 g016
Figure 17. (a) Configuring the roof pop-up to add access to the CMMS. (b) Integration process of the BIM model with its data (COBie-Excel) to the YouBIM CMMS.
Applsci 14 11097 g017
Figure 18. MEP (mechanical, electrical, and plumbing) modeling and system design for the Civil Engineering School. (a) Layout of sanitary fixtures in the men’s restroom located in the building’s hall, illustrating the arrangement and integration of various components. (b) Exploded view of the boiler system and its subsystems within the same building, offering a detailed perspective of the components and configurations to enhance understanding of the system’s functionality and design.
Applsci 14 11097 g018
Figure 19. (a) The 3D navigation capabilities for the exterior of the Civil Engineering School model within the CMMS YouBIM environment. This feature enables users to interactively explore the building’s exterior, examining architectural features and surrounding elements. (b) A 3D visualization of assets within the CMMS YouBIM model. This feature offers an interactive representation of various assets, enabling users to examine their locations and interrelationships within the building.
Applsci 14 11097 g019
Figure 20. (a) Asset filtering process configured in the Civil Engineering School model using the assets option within the computerized maintenance management system (CMMS). This filtering feature enables users to efficiently organize and manage various assets, facilitating quick and effective access to relevant data for maintenance and operational needs. (b) A 3D visualization of assets using the 3D navigation tool within the CMMS. This view specifically highlights devices located in the bathroom complex on the first floor of the Civil Engineering School, enabling an interactive and detailed exploration of assets within this space.
Applsci 14 11097 g020
Figure 21. Selection and visualization of an individual asset in the men’s restroom on the first floor of the Civil Engineering School within the 3D model. This feature allows users to view asset details, including their placement and condition within the facility.
Applsci 14 11097 g021
Figure 22. Detailed asset management within the CMMS for the Civil Engineering School. This view highlights the “view details” option, which provides users with comprehensive information on specific assets. Displays the technical data sheet of a cistern toilet (a) and Ceiling light fixture (b), located on floor 0. It includes information such as the serial number, installation date, warranty, supplier, and associated documents (technical data sheet and diagram). The interface allows for the management of information and files related to the asset.
Applsci 14 11097 g022
Figure 23. Classification of work orders by maintenance type within the 3D CMMS for the Civil Engineering School. This categorization enables users to efficiently manage and prioritize maintenance tasks, ensuring that appropriate resources and actions are allocated for each work order type.
Applsci 14 11097 g023
Figure 24. (a) Work order (WO) listing for the “Las Llamas” Campus. This listing provides an overview of all active and pending work orders associated with the site, facilitating effective tracking and management of maintenance tasks and projects within the campus. (b) Calendarization of work orders (WOs) within the CMMS for the “Las Llamas” Campus. This feature enables users to visualize and schedule maintenance tasks over time, ensuring efficient planning and timely execution of work orders to support campus operations.
Applsci 14 11097 g024
Figure 25. Work order (WO) assignment notifications include a prompt to link the WO to the user’s Outlook calendar, improving time management and task tracking.
Applsci 14 11097 g025
Figure 26. List of rooms (classrooms) in the Civil Engineering School. This list provides an organized overview of the available classrooms, facilitating effective scheduling and management of educational activities within the institution.
Applsci 14 11097 g026
Figure 27. Boiler room system of the Civil Engineering School. (a) A 3D model of the boiler room within the CMMS YouBIM, providing a detailed view of the facility. (b) List of subsystems that constitute the boiler room system, highlighting the various components involved. (c) List of assets composing these subsystems, offering insights into individual items and their roles within the system. (d) Specifically, the subsystem labeled “Piping Systems_Hydronic Supply 1” is included, illustrating its significance within the overall boiler room infrastructure.
Applsci 14 11097 g027
Figure 28. (a) Dashboard designed for the supervision of maintenance work. It provides a comprehensive overview of active and pending work orders, facilitating efficient monitoring and management of maintenance activities. (b) Dashboard for the supervision of maintenance work, specifically focused on updating work order (WO) documentation. This dashboard enables users to efficiently manage and revise documentation related to the WO, ensuring that all relevant information is current and accessible. This functionality enhances the overall management of maintenance tasks.
Applsci 14 11097 g028
Table 1. Interoperability of CMMS software with other 3D BIM software. Author’s elaboration based on [18].
Software
BIM
Software
CMMS
REVITAUTOCADARCHICADTEKLANAVISWORKSSKETCHUPRHINOCEROSBENTLEY
YouBIM *
Revizto **
EcoDomus ***
* Allows the integration of pdf documents. ** Allows the integration of point clouds and pdf documents. *** Allows the integration of point clouds.
Table 2. Challenges encountered during the modeling process and the input of models for the built environment (GIS-3D) and buildings (BIM).
DifficultyGIS and BIM ModelBIM Model
Geometry Error of the Extruded BuildingsLoD 3 of the BuildingsModel Properties and Links to InformationModeling of the ArchitectureModeling of SystemsAssigning Asset PropertiesAssigning Historical Documentation to the Assets
Requires programming languageXX-----
Remove false volumesX------
Manual editing of volumesXX-X---
Taking photographs of facades in situ-X-XXXX
Photo retouching-X-X---
Paste photos-X-X-X-
Creating families---XX--
Creating types (items)---XXX-
Requires specific technical knowledge and pre-configurationXX--XX-
Poor performance during modeling XX--XXX
Acquisition of other information on site -X-XXXX
Digitization of information on paper--XXXXX
Creation of non-existent informationXXXXXXX
Inconsistency of the model with existing information--XXXXX
Exceeds allotted handling time-X--XX-
Table 3. Results of resource consumption from applying 3D management in the case study compared with the existing 2D system (excluding resources associated with the GIS and BIM modeling process).
TopicSavings (%)
TimeOther Resources *
Cost of CMMS software license-≈50
Management of documentation generated throughout the life cycle90–9580–90
Planning for preventive maintenance 75–8070–80
Management of corrective maintenance80–9050–60
Incident handling90–9580–90
* Costs, personnel, training, tools, etc.
Disclaimer/Publisher’s Note: The statements, opinions and data contained in all publications are solely those of the individual author(s) and contributor(s) and not of MDPI and/or the editor(s). MDPI and/or the editor(s) disclaim responsibility for any injury to people or property resulting from any ideas, methods, instructions or products referred to in the content.

