
Construction of Nicotinamide Mononucleotide-Loaded Liposomes and Their In Vitro Transport Across the Blood–Brain Barrier


Abstract
:1. Introduction
2. Materials and Methods
2.1. Materials
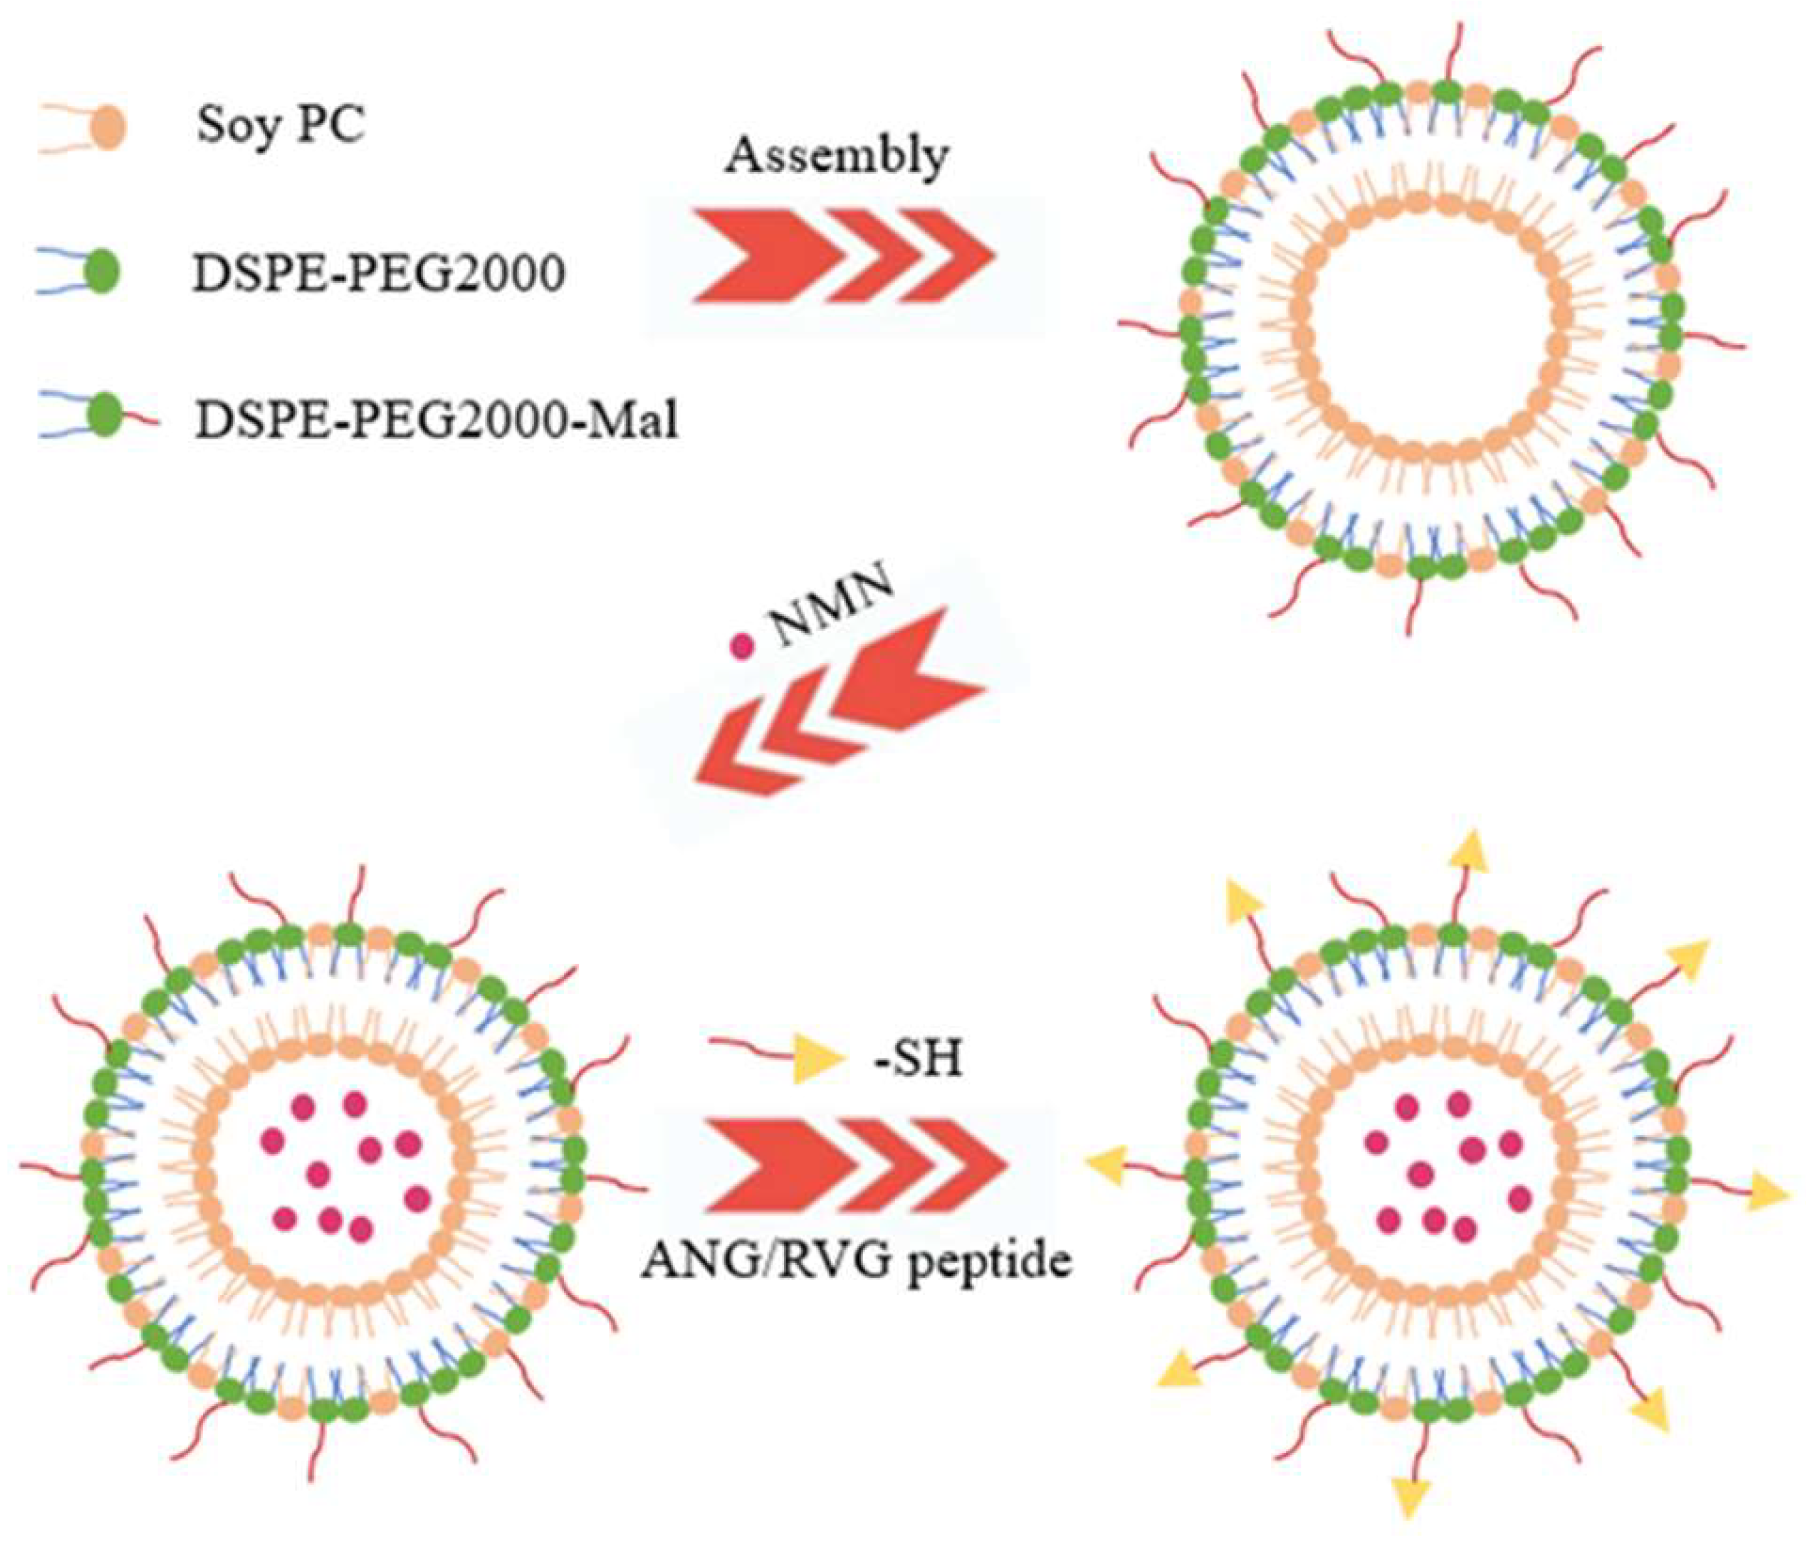
2.2. Liposome Preparation
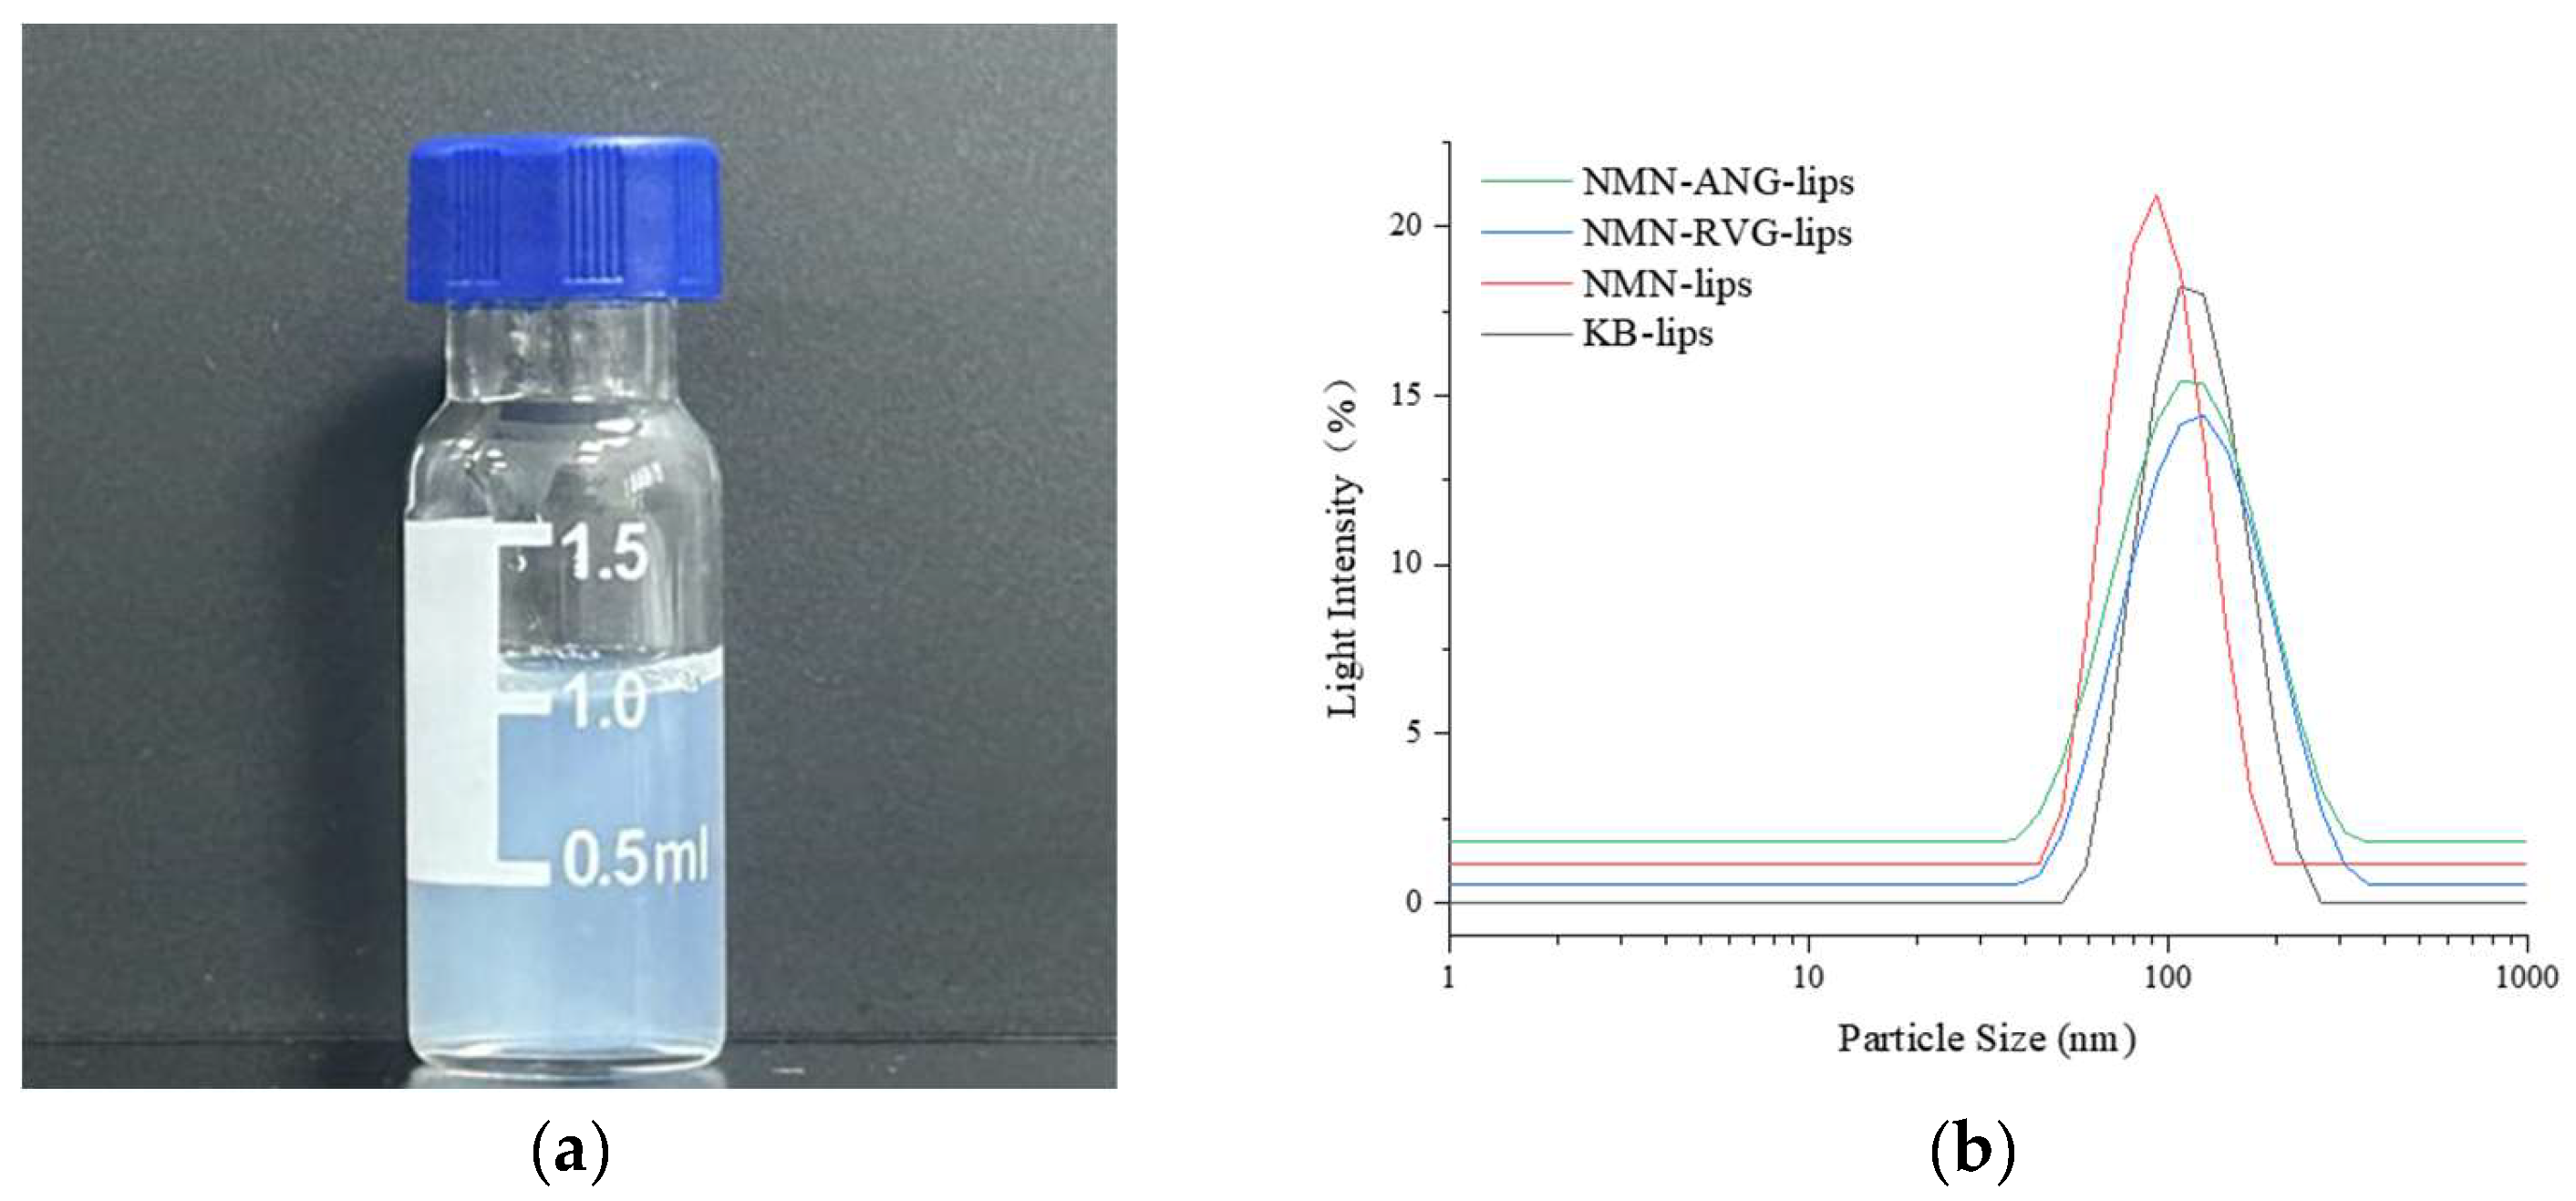
2.3. Measurement of Liposome Particle Size
2.4. Measurement of Encapsulation Rate and Drug Loading
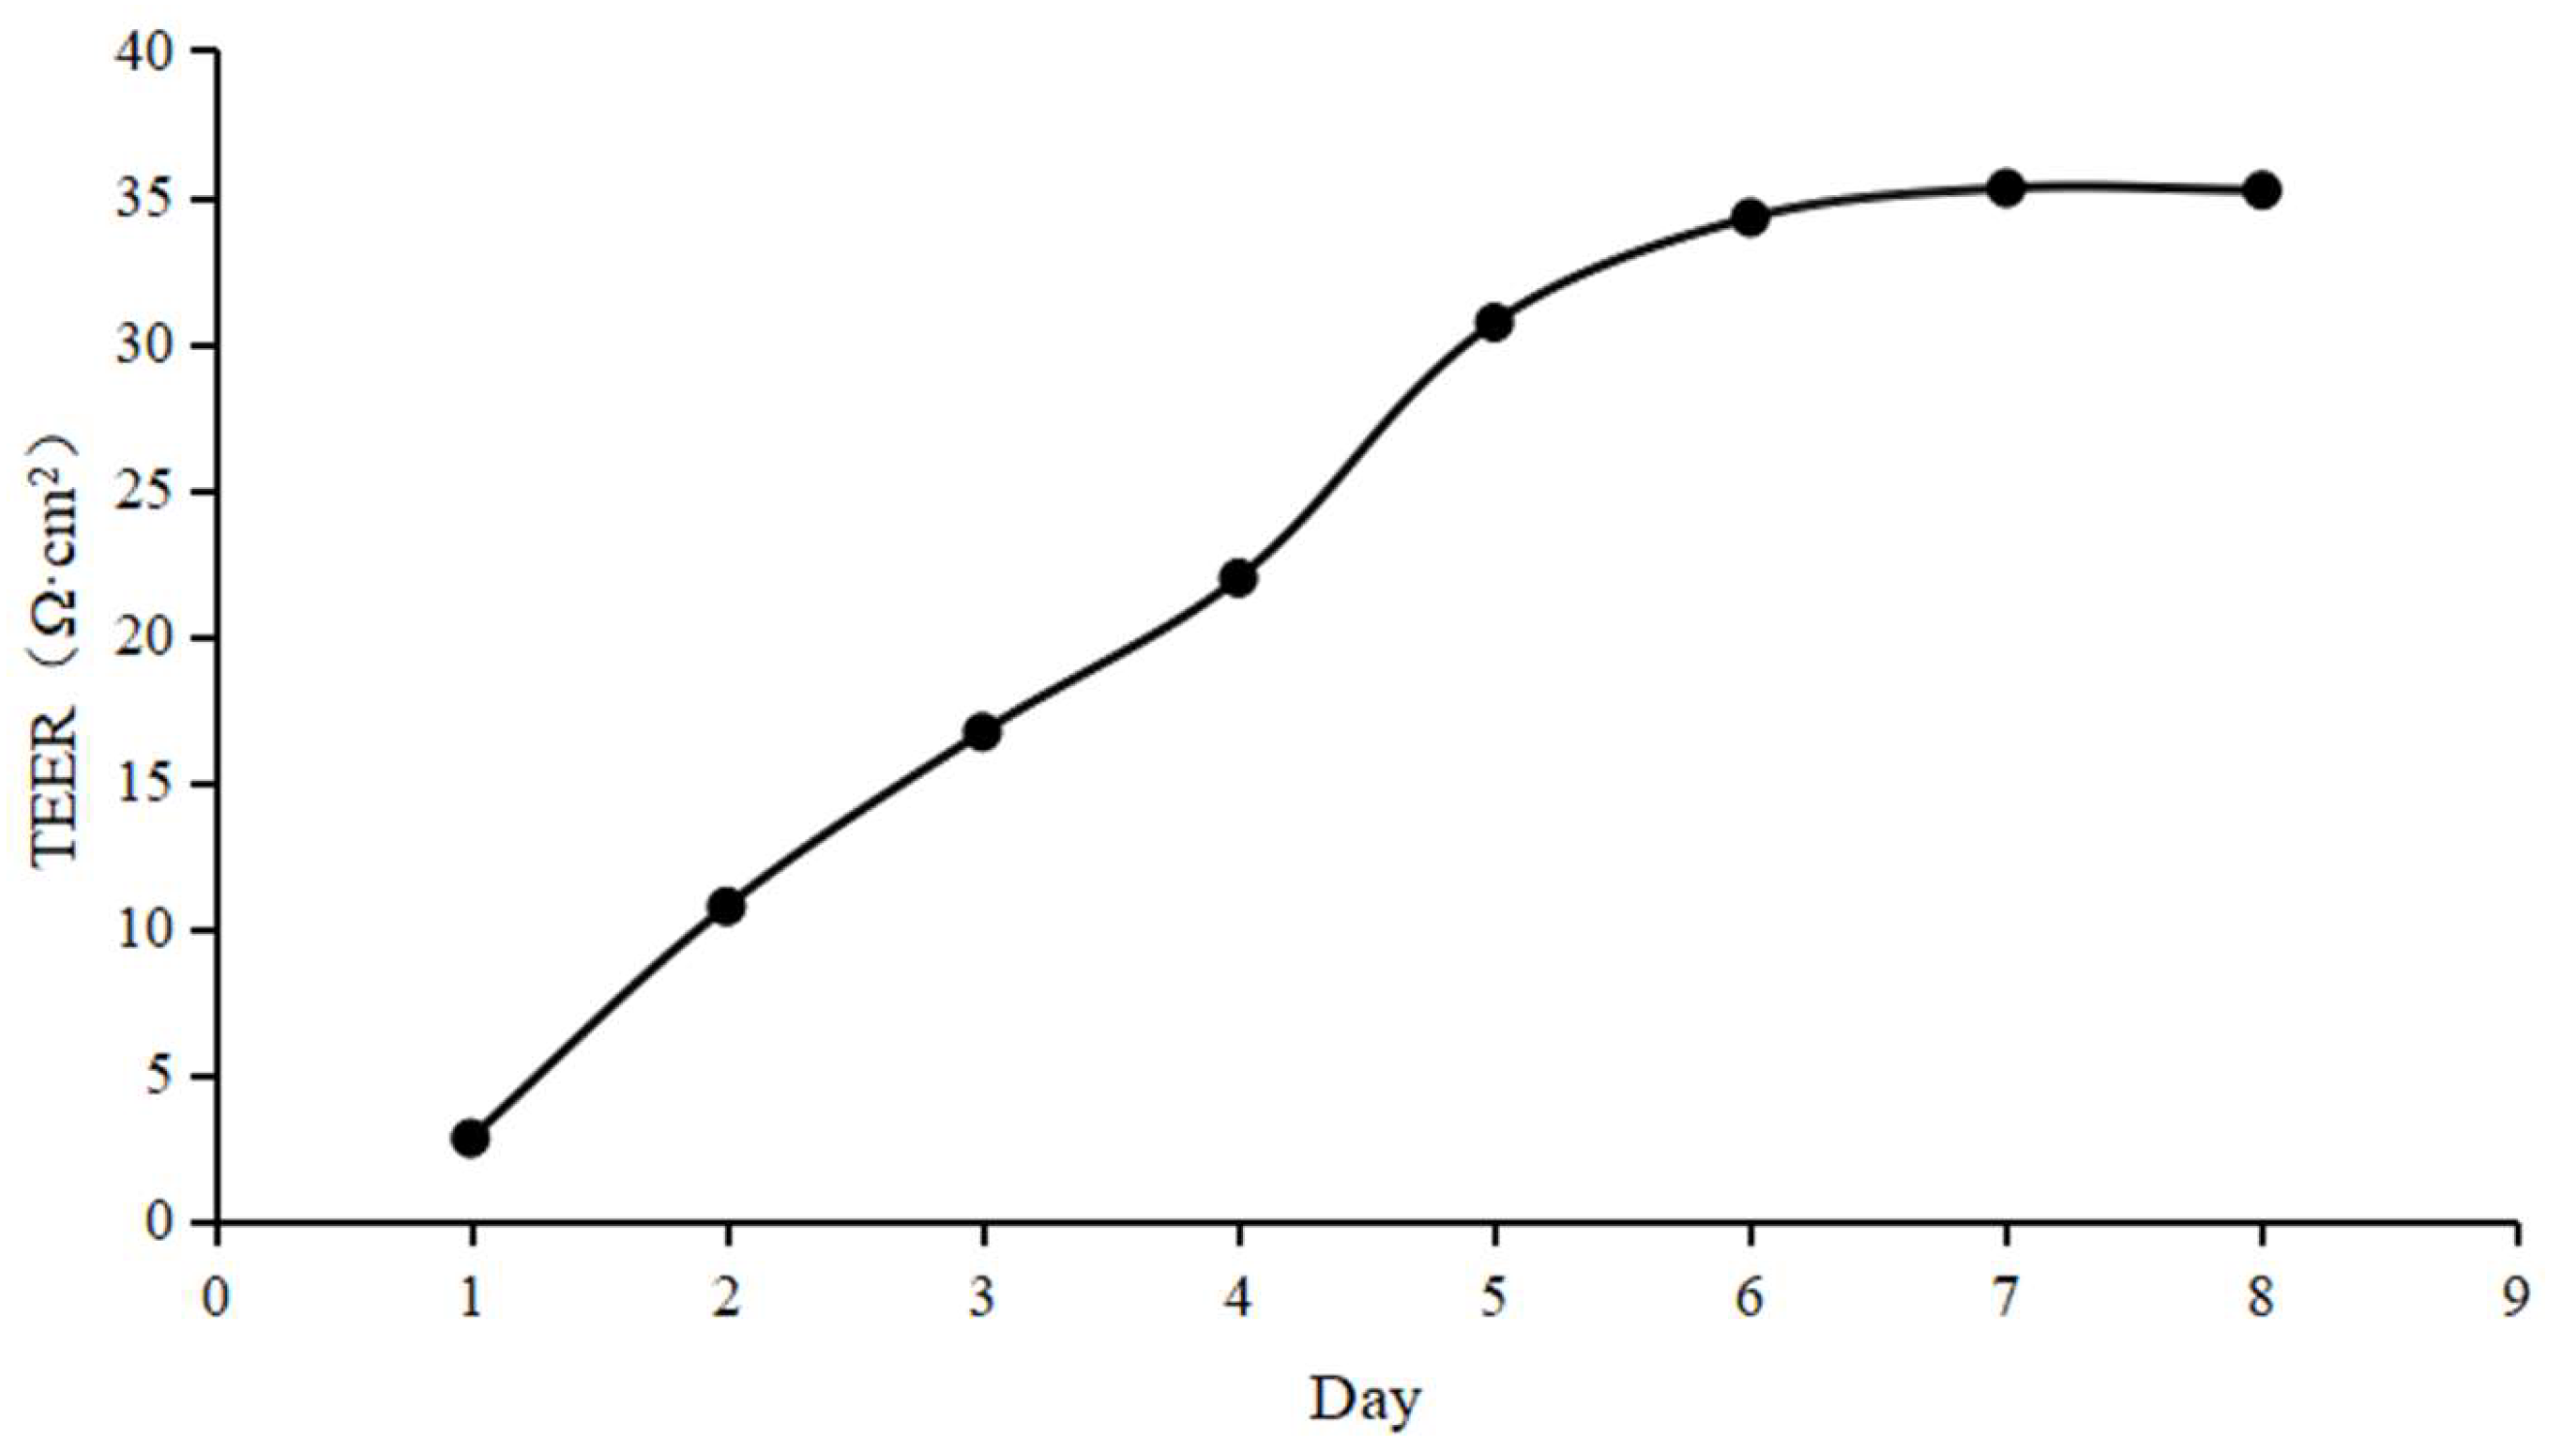
2.5. Preparation of hCMEC/D3 Monolayer
2.6. Transport Experiments
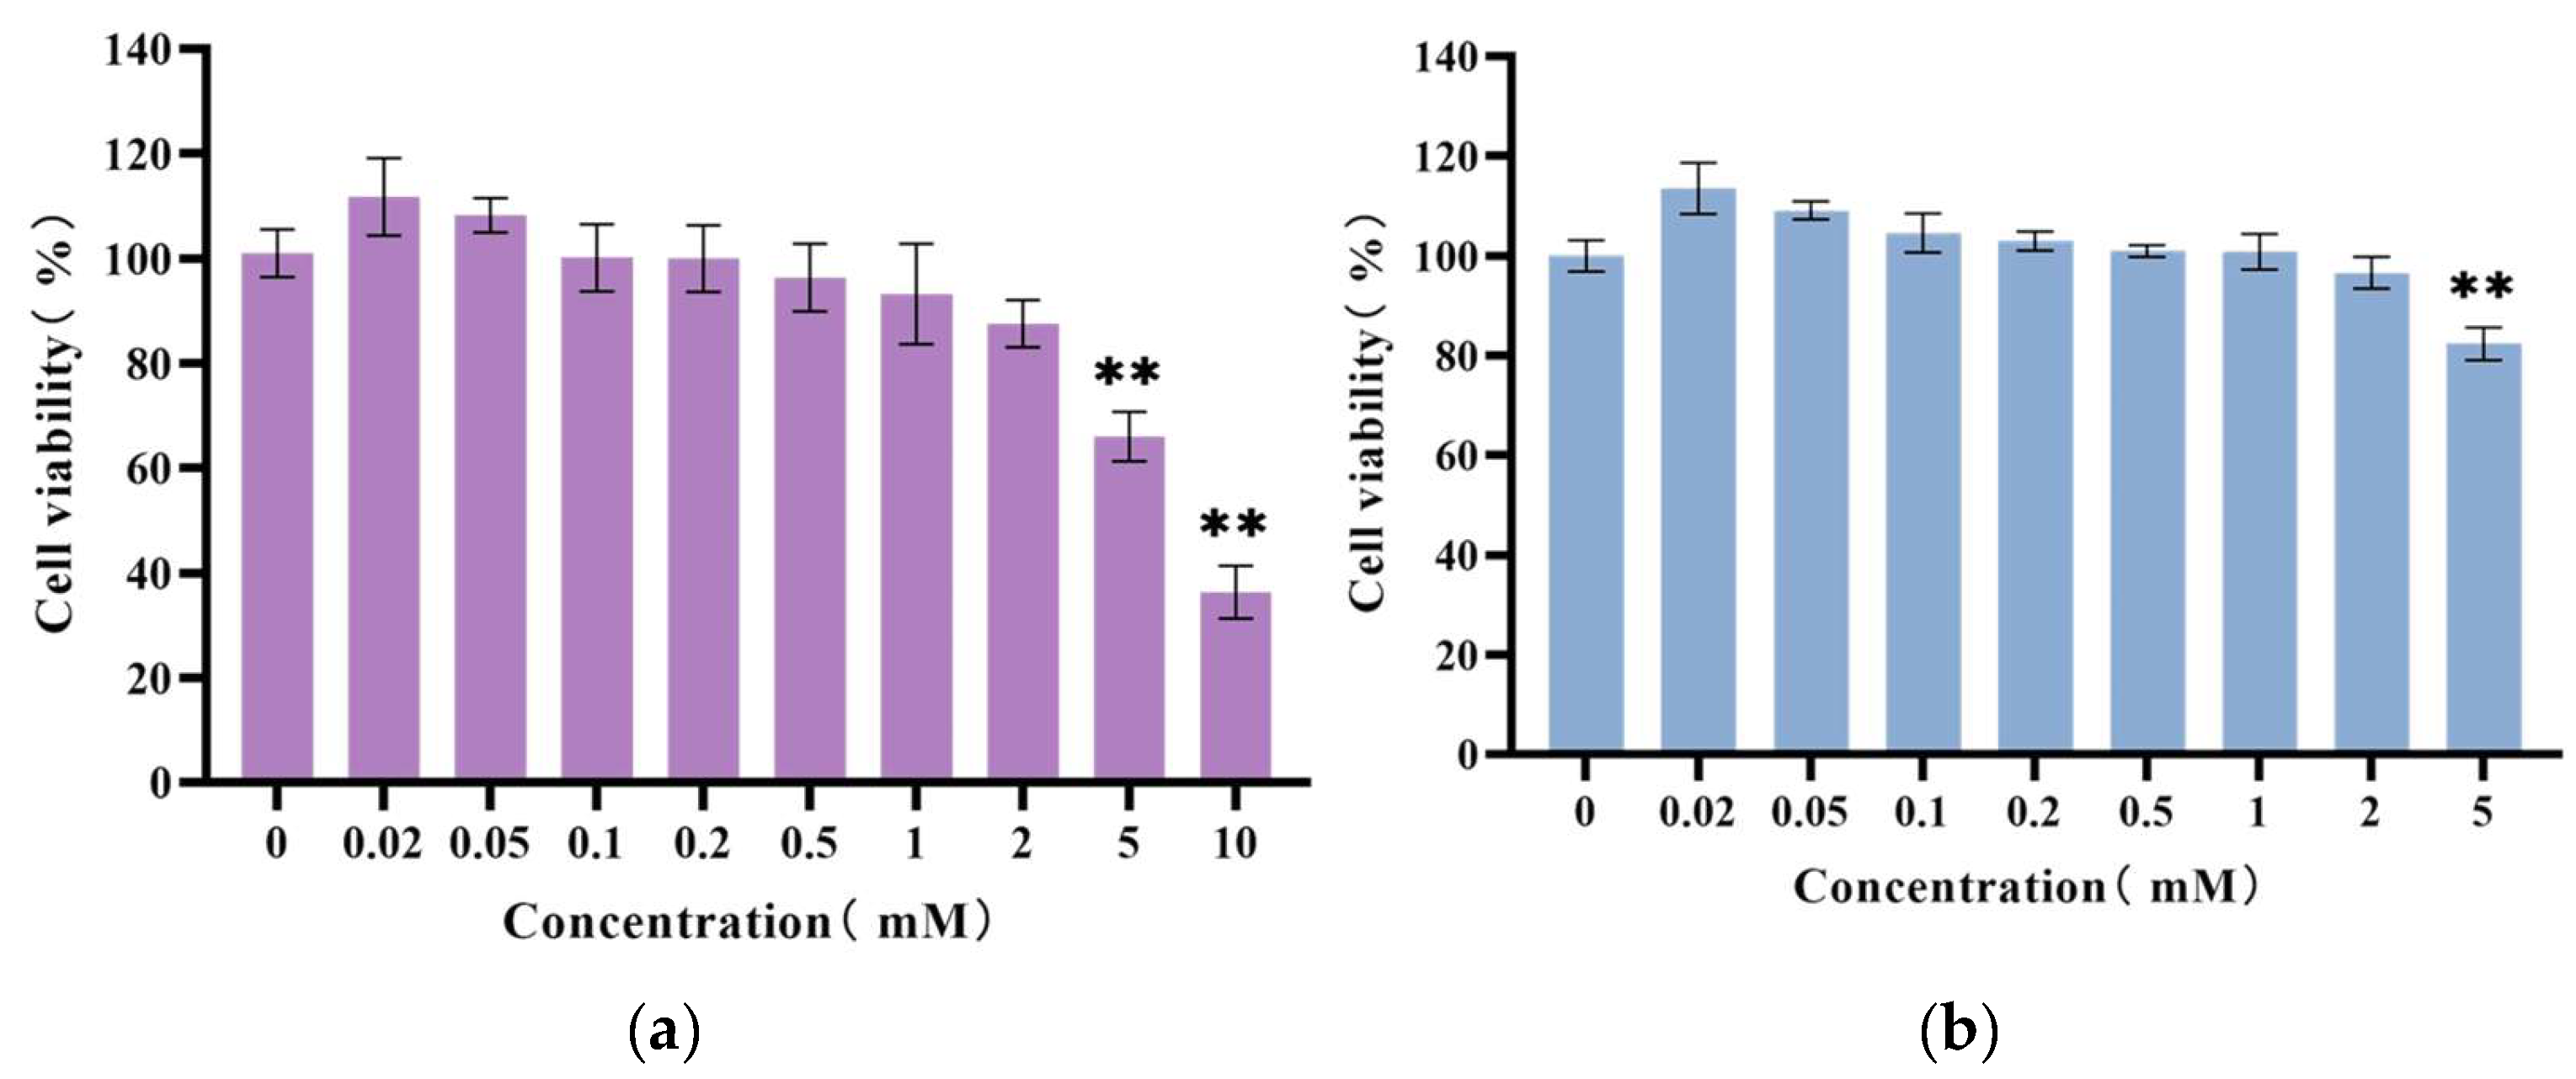
2.6.1. Cytotoxicity Assay
2.6.2. Transport and Efflux Experiments
2.7. Intracellular Accumulation and Recovery
2.8. Analytical Method
2.8.1. Sample Pre-Treatment
2.8.2. Establishment of HPLC Conditions
2.9. Data Processing
3. Results
3.1. Preparation and Characterization of NMN-Lips
3.2. Optimization of HPLC Method for Detecting NMN
3.3. Evaluation of In Vitro Monolayer BBB Model
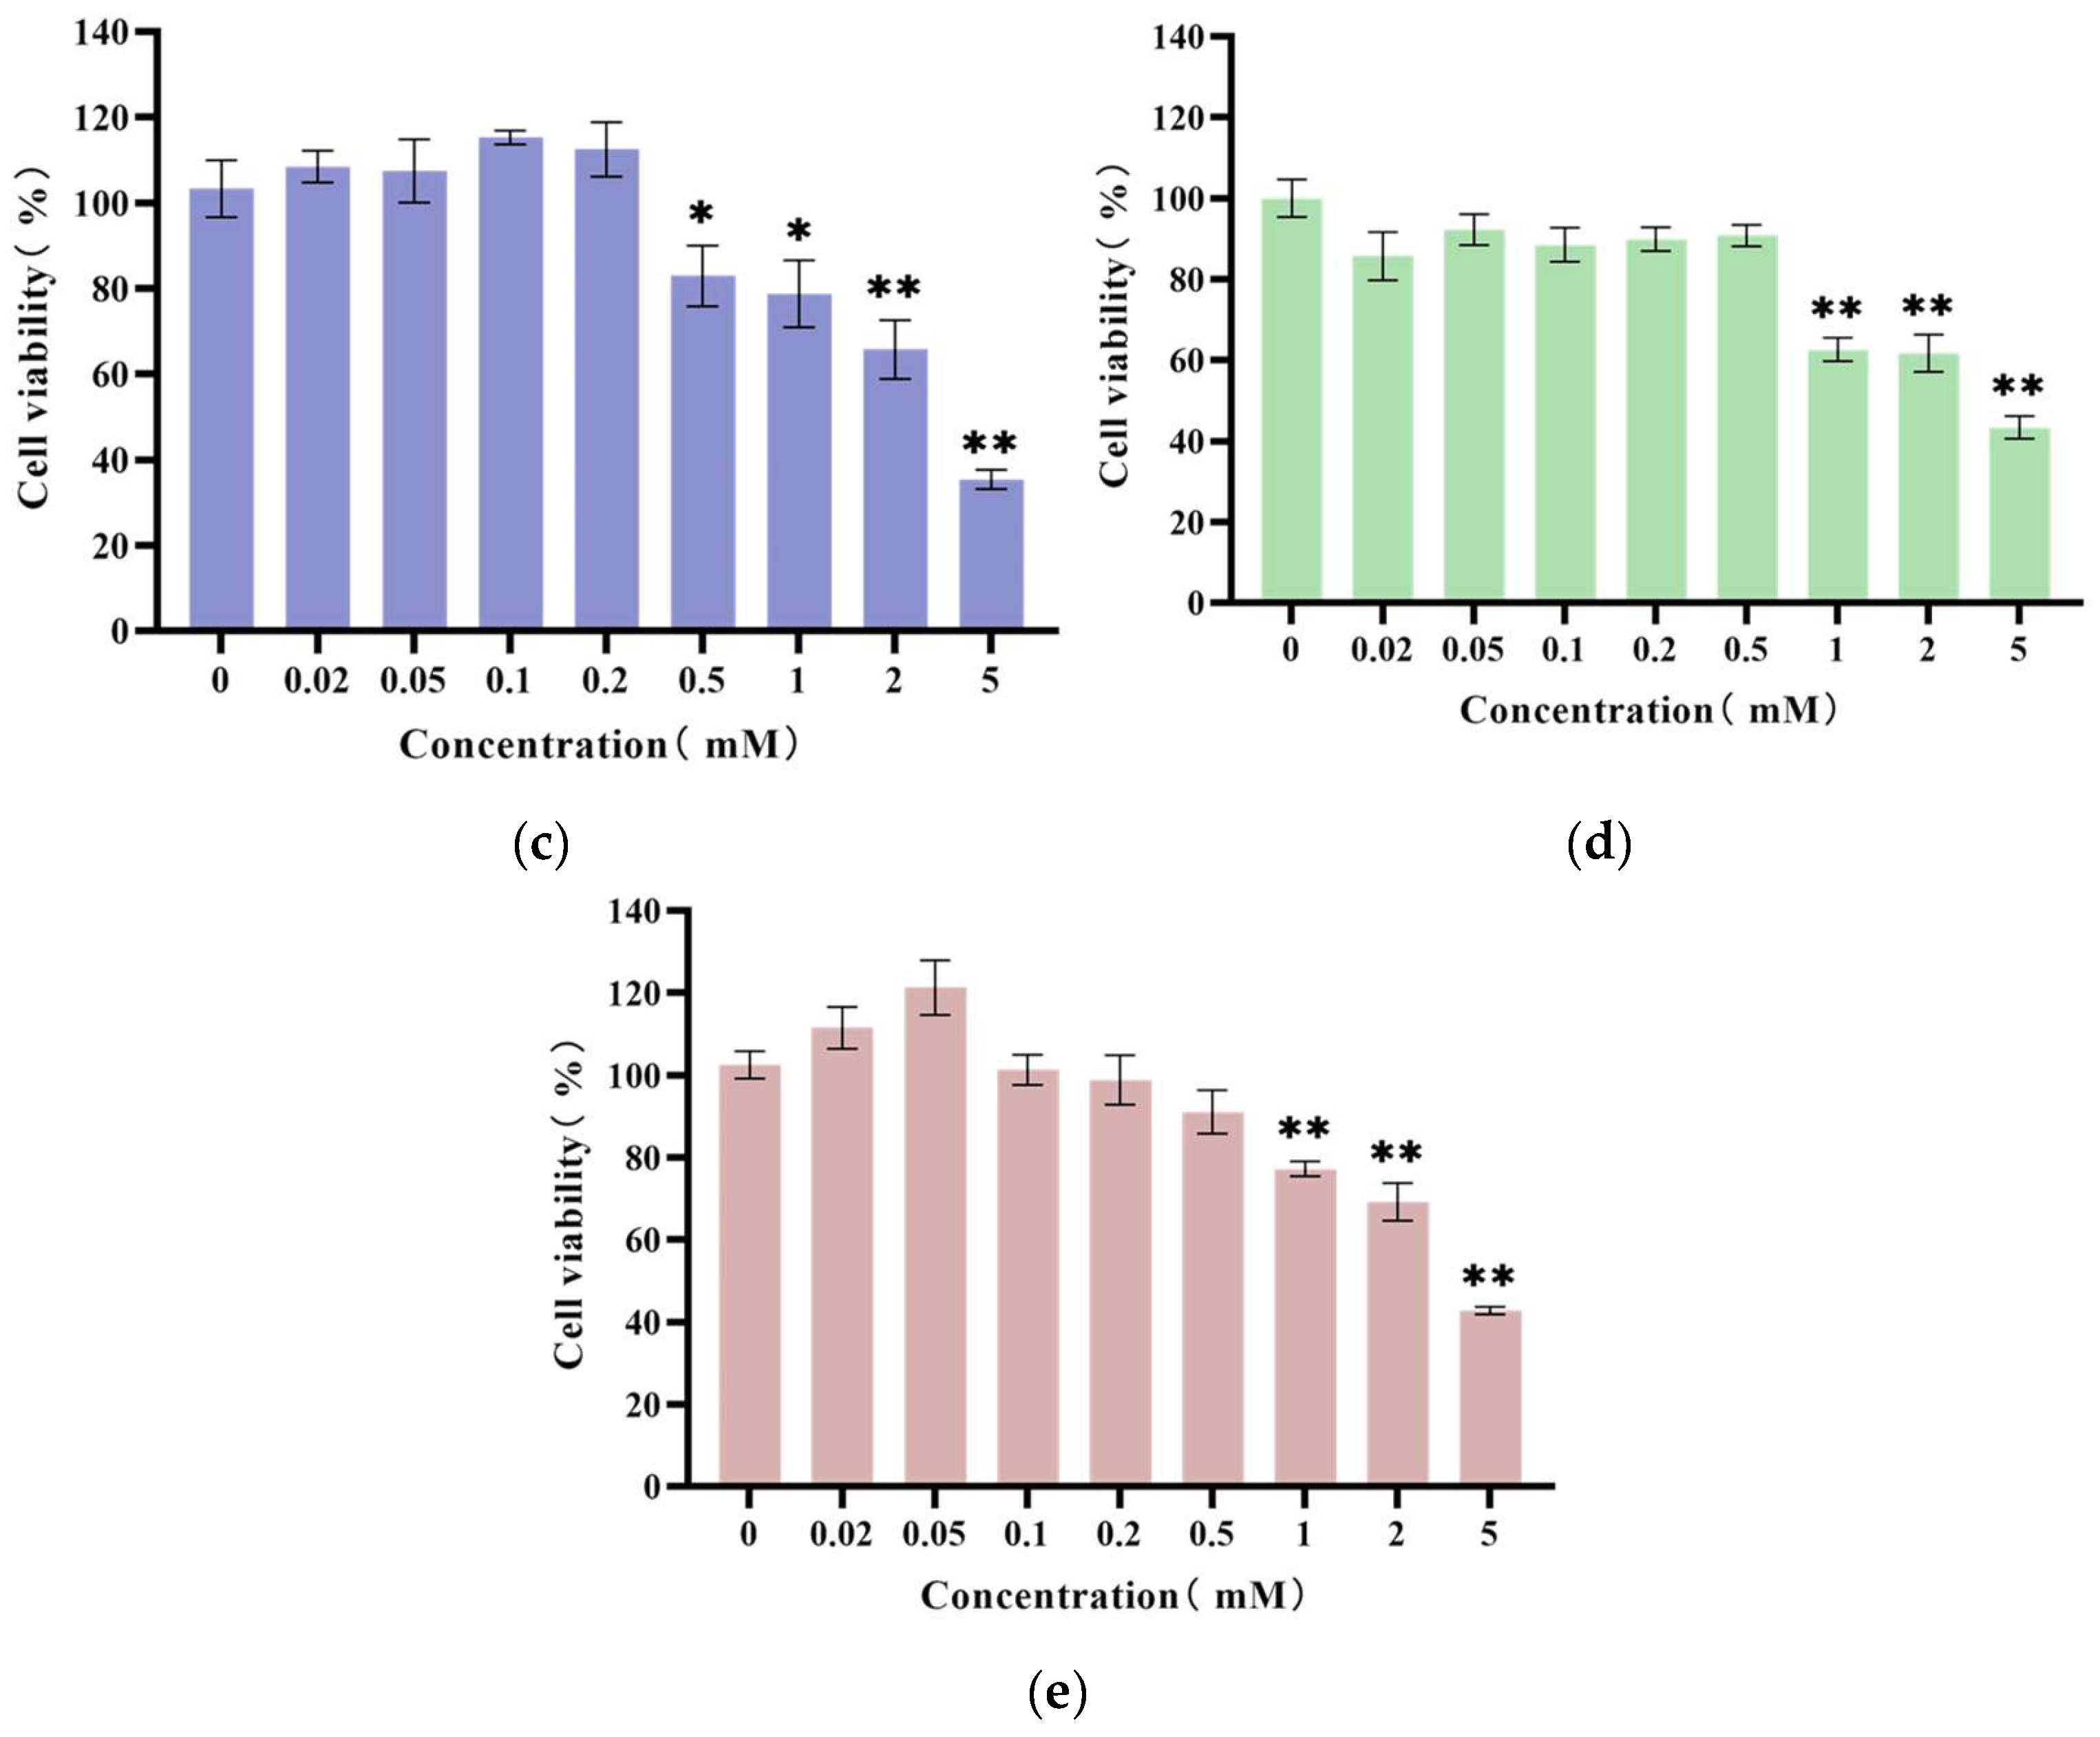
3.4. Results of Cytotoxicity Assay
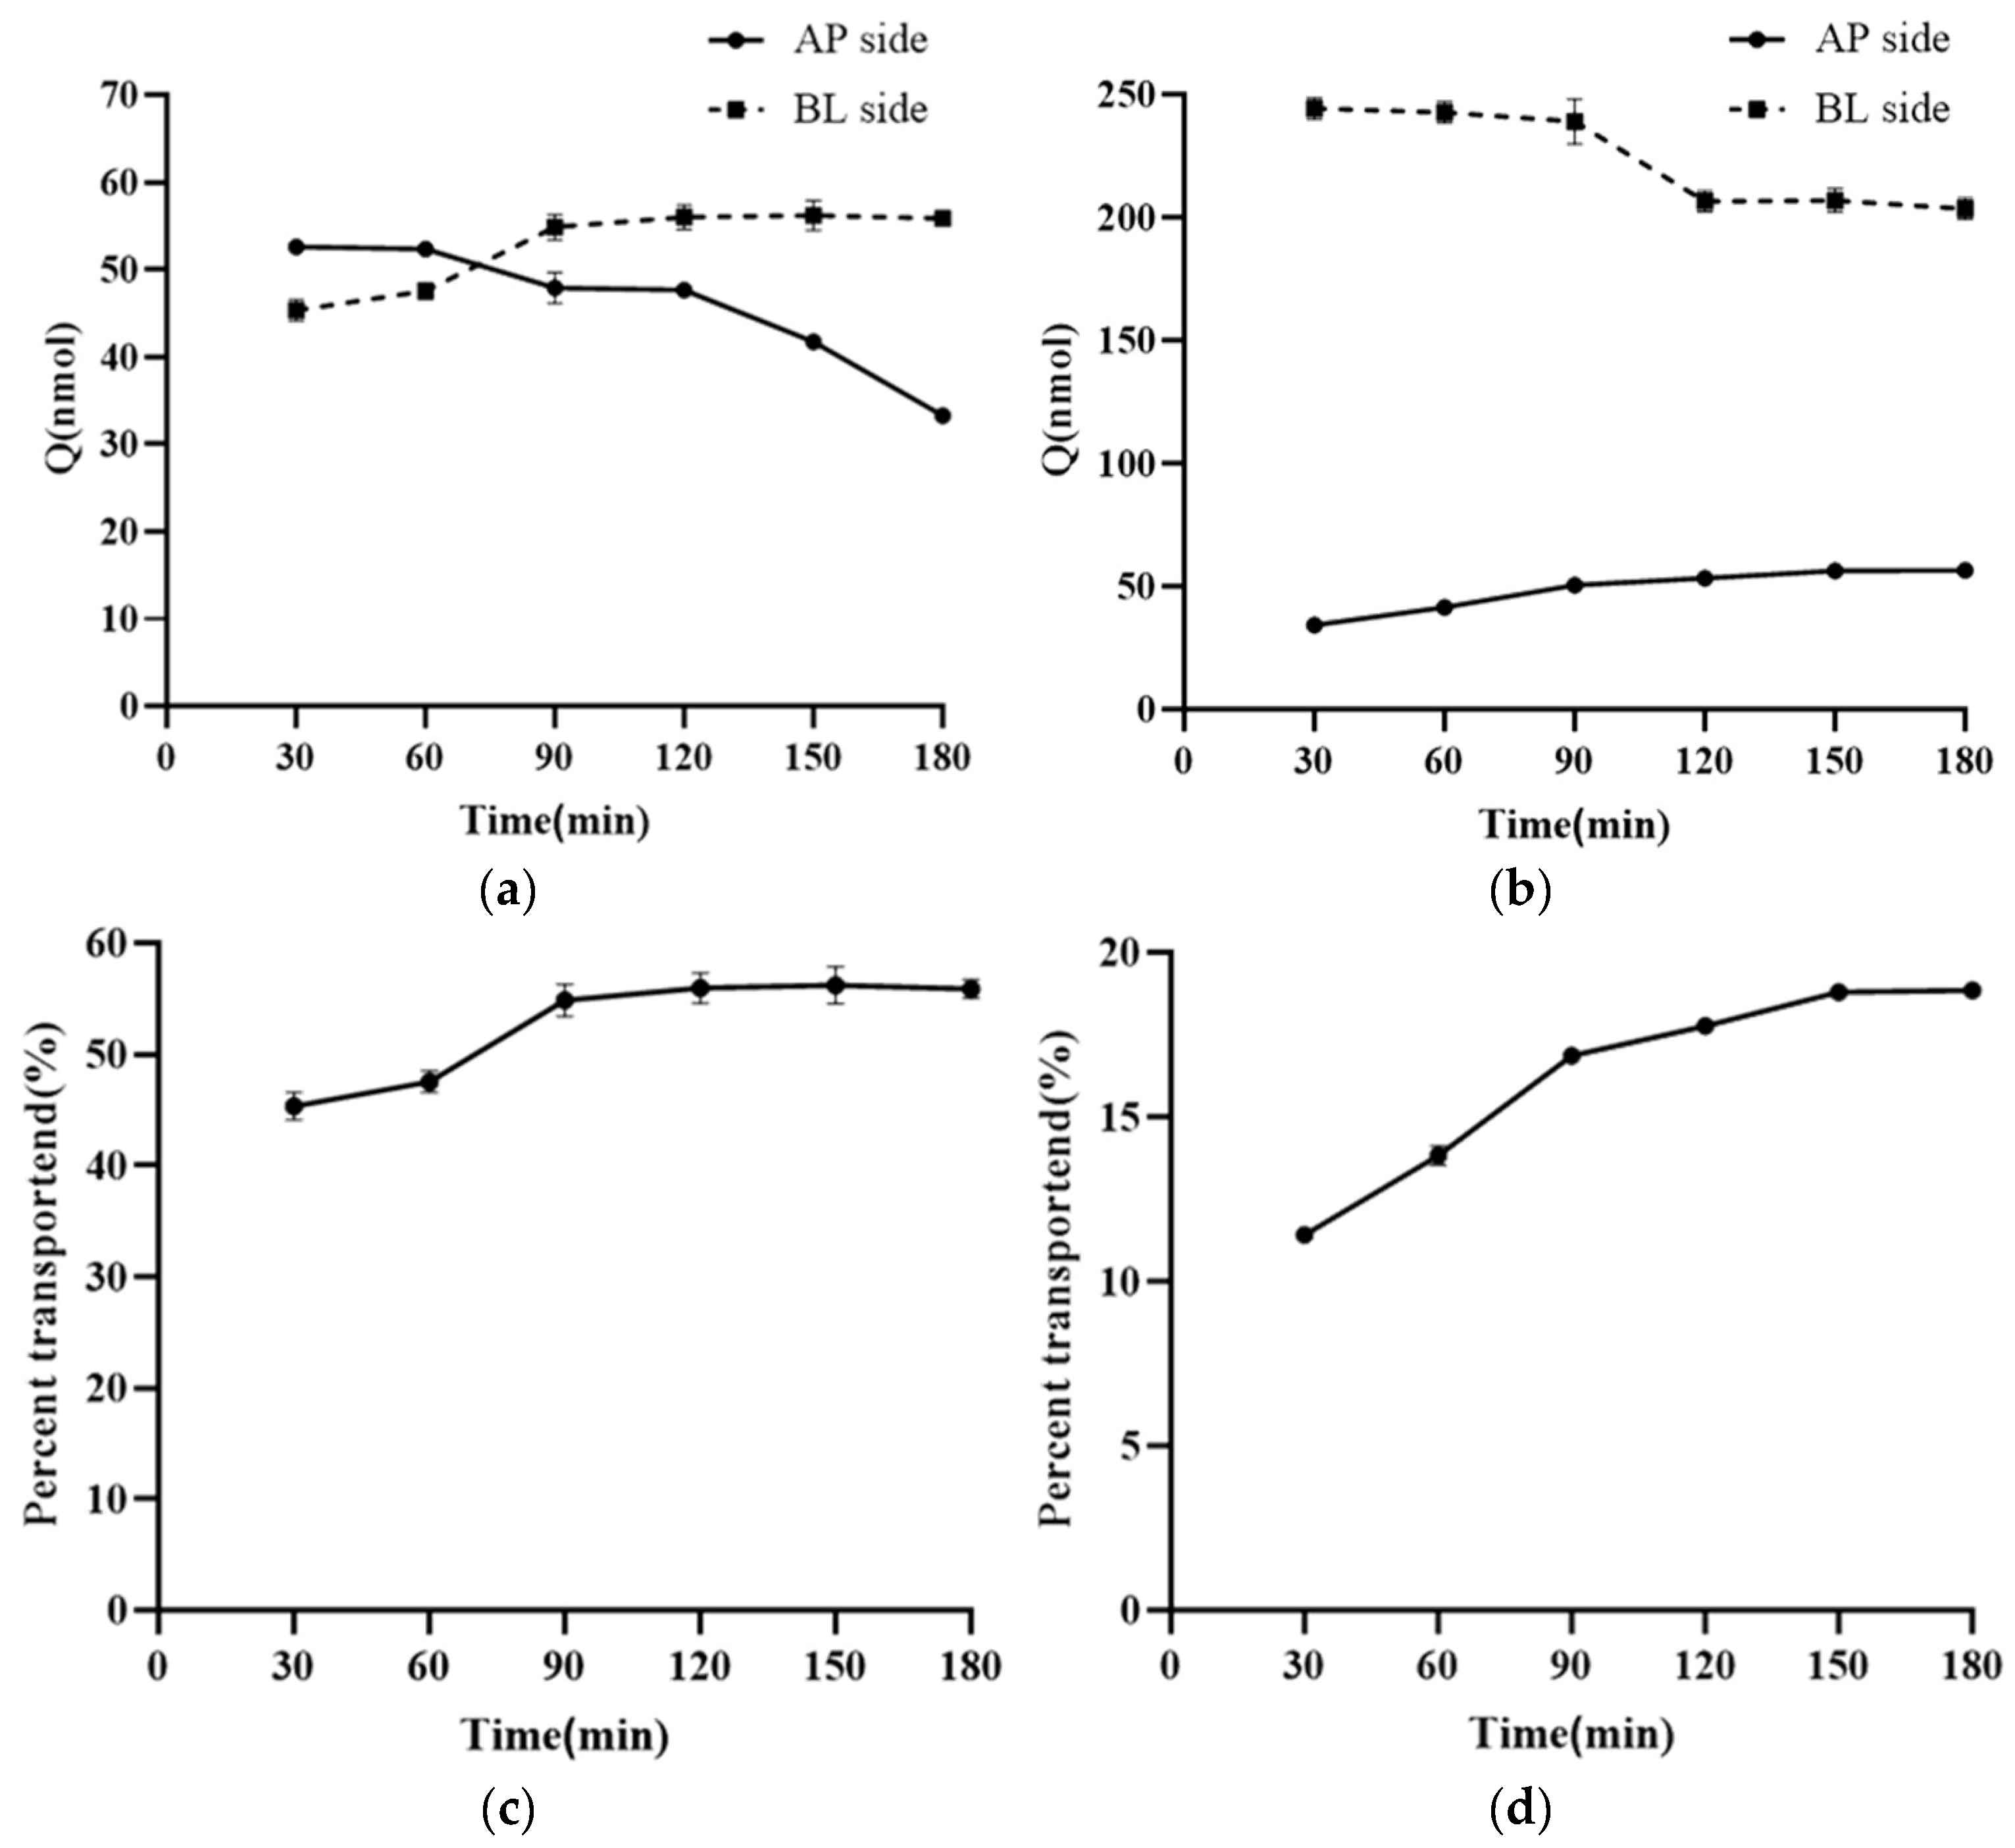
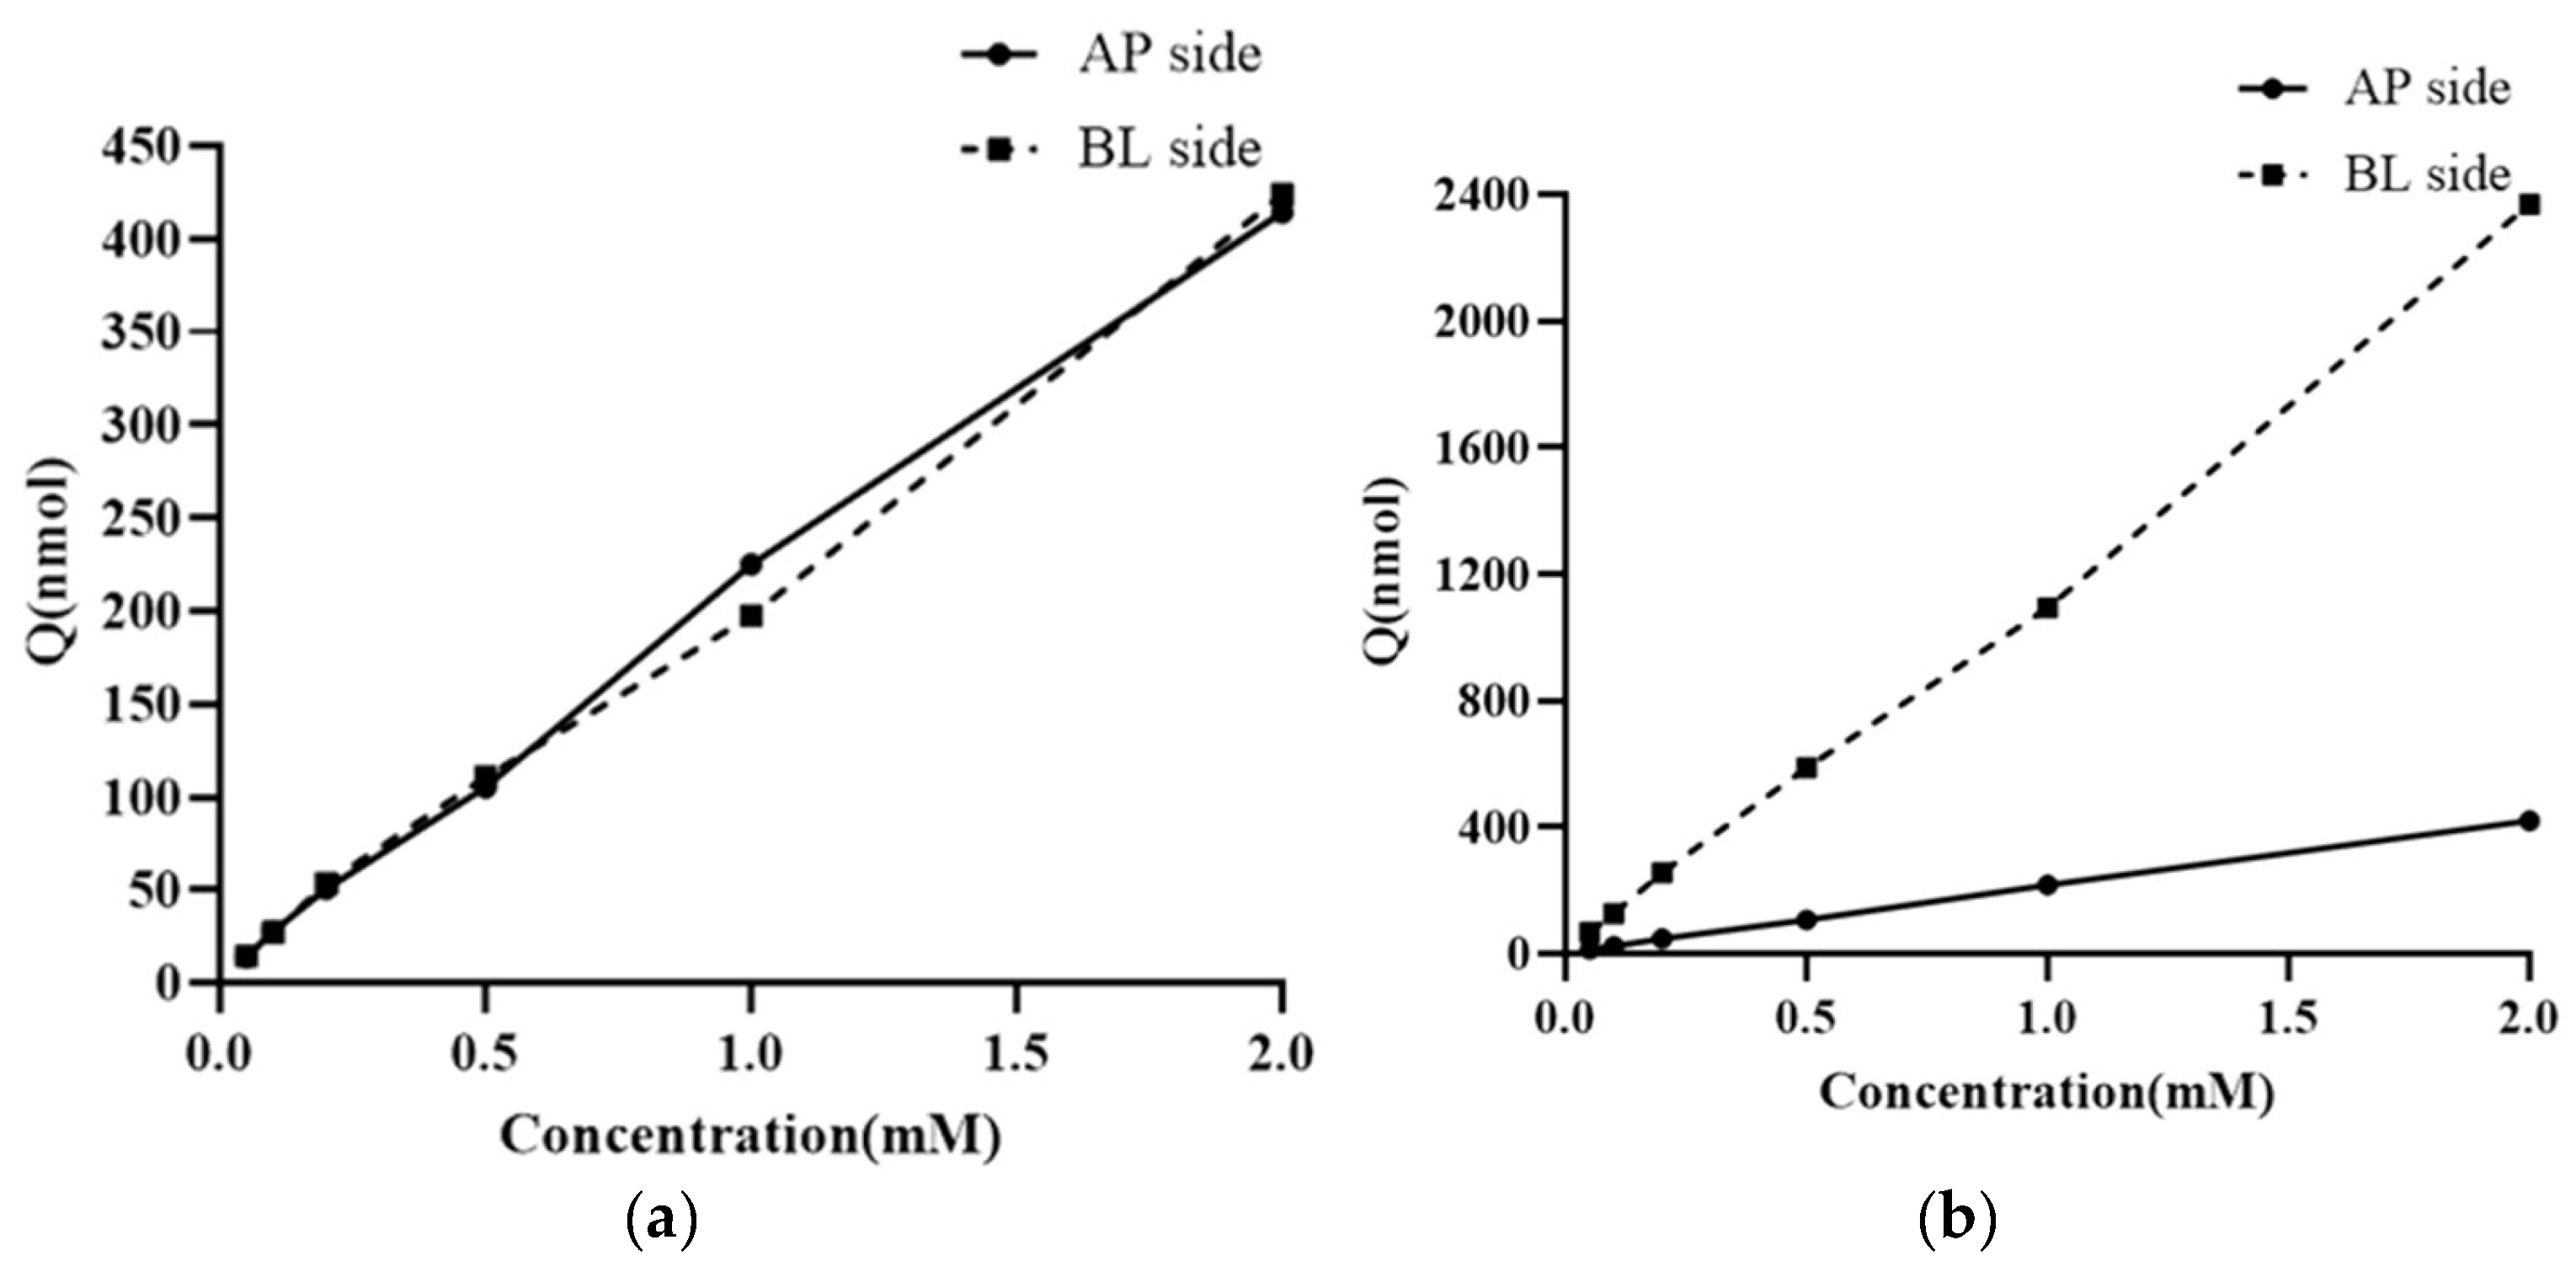
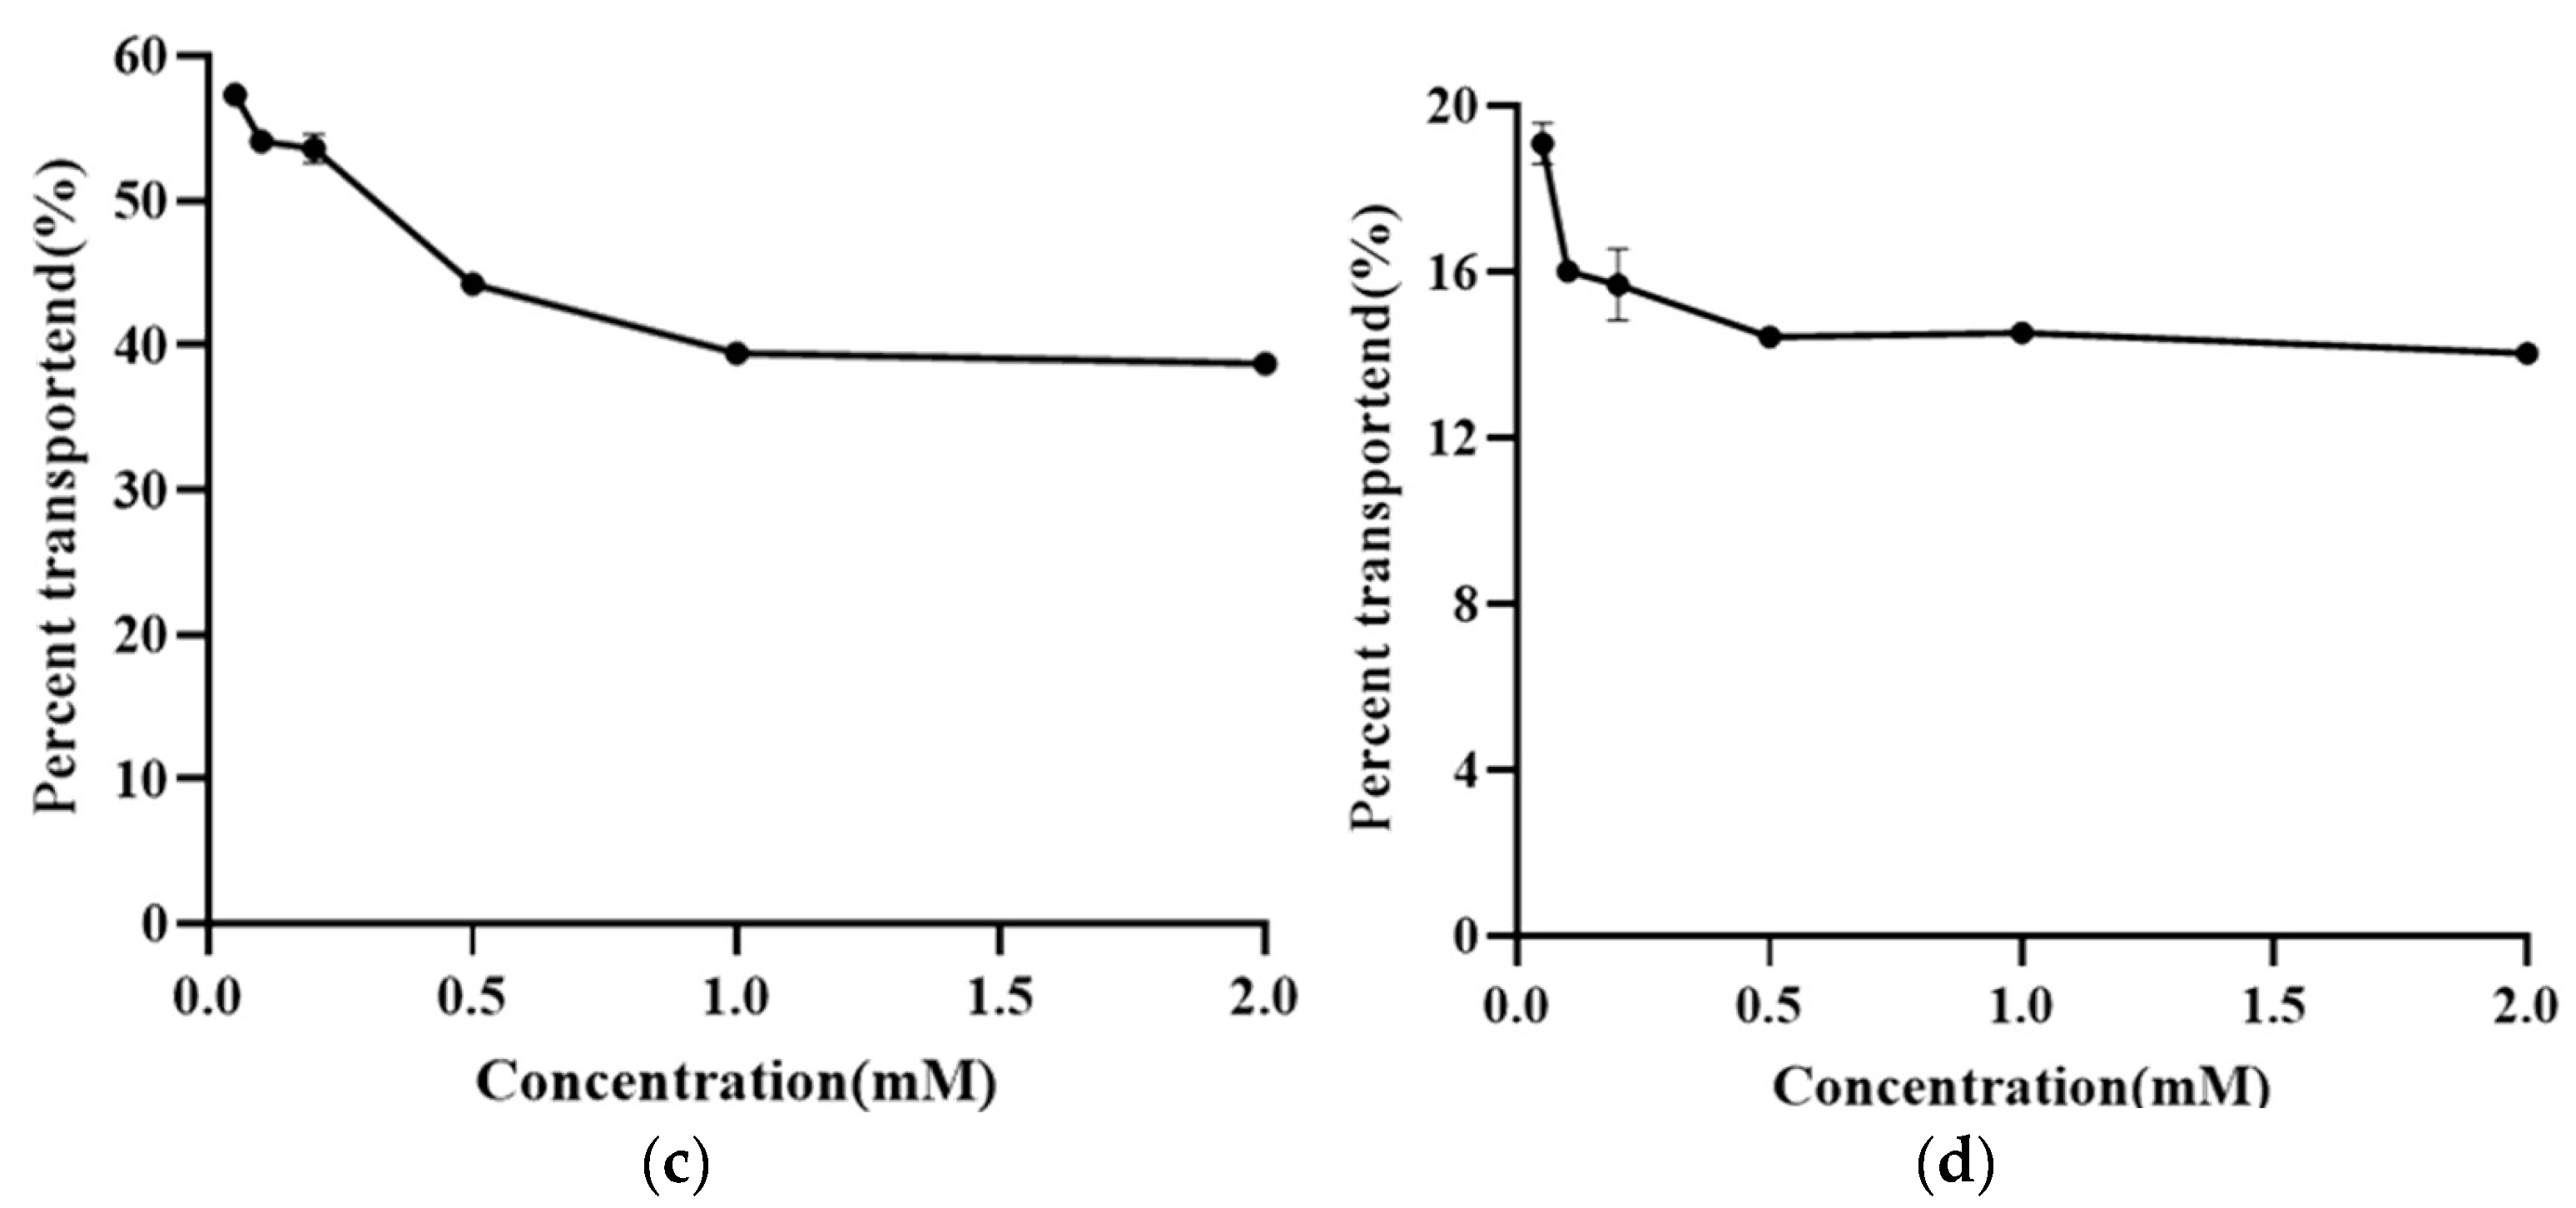
3.5. Research on the Transmembrane Transport Mechanism of NMN
3.6. Liposome Bidirectional Transmembrane Transport Experiment
3.7. Result of Intracellular Accumulation and Recovery
4. Discussion
5. Conclusions
Author Contributions
Funding
Institutional Review Board Statement
Informed Consent Statement
Data Availability Statement
Conflicts of Interest
References
- Zhou, C.L.; Feng, J.; Wang, J.; Hao, N.; Wang, X.; Chen, K.Q. Design of an in vitro multienzyme cascade system for the biosynthesis of nicotinamide mononucleotide. Catal. Sci. Technol. 2022, 12, 1080–1091. [Google Scholar] [CrossRef]
- Mateuszuk, Ł.; Campagna, R.; Kutryb-Zając, B.; Kuś, K.; Słominska, E.M.; Smolenski, R.T.; Chlopicki, S. Reversal of endothelial dysfunction by nicotinamide mononucleotide via extracellular conversion to nicotinamide riboside. Biochem. Pharmacol. 2020, 178, 114019. [Google Scholar] [CrossRef] [PubMed]
- Ren, L.M.; Wang, X.R.; Qi, Y.H.; Han, G.X.; Han, T.M.; Gui, Y.; Zhang, M.; Li, X.B. Research progress on the function and synthesis of β-nicotinamide mononucleotide. Biotic Resour. 2021, 43, 127–132. [Google Scholar]
- Nadeeshani, H.; Li, J.; Ying, T.; Zhang, B.; Lu, J. Nicotinamide mononucleotide (NMN) as an anti-aging health product—Promises and safety concerns. J. Adv. Res. 2021, 8, 267–278. [Google Scholar] [CrossRef] [PubMed]
- Long, A.N.; Owens, K.; Schlappal, A.E.; Kristian, T.; Fishman, P.S.; Schuh, R.A. Effect of nicotinamide mononucleotide on brain mitochondrial respiratory deficits in an Alzheimer’s disease-relevant murine model. BMC Neurol. 2015, 15, 1–14. [Google Scholar] [CrossRef]
- Lu, L.; Tang, L.; Wei, W.S.; Hong, Y.Y.; Chen, H.Y.; Ying, W.H.; Chen, S.D. Nicotinamide mononucleotide improves energy activity and survival rate in an in vitro model of Parkinson’s disease. Exp. Ther. Med. 2014, 8, 943–950. [Google Scholar] [CrossRef]
- Shade, C. The Science Behind NMN-A Stable, Reliable NAD+Activator and Anti-Aging Molecule. Integr. Med. 2020, 19, 12–14. [Google Scholar]
- Qu, Y. Construction and Application Research of a New Generation of Blood-Brain Barrier 3D In Vitro Model; Jilin University: Changchun, China, 2019. [Google Scholar]
- Oliveira, A.I.; Pinho, C.; Sarmento, B.; Dias, A.C.P. Quercetin-biapigenin nanoparticles are effective to penetrate the blood-brain barrier. Drug Deliv. Transl. Res. 2022, 12, 267–281. [Google Scholar] [CrossRef]
- Xie, J.B.; Shen, Z.Y.; Anraku, Y.; Kataoka, K.; Chen, X.Y. Nanomaterial-based blood-brain-barrier (BBB) crossing strategies. Biomaterials 2019, 224, 119491. [Google Scholar] [CrossRef]
- Alexander, A.; Agrawal, M.; Uddin, A.; Siddique, S.; Shehata, A.M.; Shaker, M.A.; Ata Ur Rahman, S.; Abdul, M.I.M.; Shaker, M.A. Recent expansions of novel strategies towards the drug targeting into the brain. Int. J. Nanomed. 2019, 14, 5895–5909. [Google Scholar] [CrossRef]
- Weksler, B.B.; Subileau, E.A.; Perrière, N.; Charneau, P.; Holloway, K.; Leveque, M.; Tricoire-Leignel, H.; Nicotra, A.; Bourdoulous, S.; Turowski, P.; et al. Blood-brain barrier-specific properties of a human adult brain endothelial cell line. FASEB J. 2005, 19, 1872–1874. [Google Scholar] [CrossRef] [PubMed]
- Ma, S.W.; Liu, X.Y.; Xu, Q.R.; Zhang, X.T. Transport of ginkgolides with different lipophilicities based on an hCMEC/D3 cell monolayer as a blood-brain barrier cell model. Life Sci. 2014, 114, 93–101. [Google Scholar] [CrossRef] [PubMed]
- Weksler, B.; Romero, I.A.; Couraud, P.O. The hCMEC/D3 cell line as a model of the human blood brain barrier. Fluids Barriers CNS 2013, 5, 16. [Google Scholar] [CrossRef] [PubMed]
- Sajja, R.K.; Cucullo, L. Altered glycaemia differentially modulates efflux transporter expression and activity in hCMEC/D3 cell line. Neurosci. Lett. 2015, 598, 59–65. [Google Scholar] [CrossRef]
- Abbott, N.J.; Rönnbäck, L.; Hansson, E. Astrocyte-endothelial interactions at the blood-brain barrier. Nat. Rev. Neurosci. 2006, 7, 41–53. [Google Scholar] [CrossRef]
- Terstappen, G.C.; Meyer, A.H.; Bell, R.D.; Zhang, W. Strategies for delivering therapeutics across the blood-brain barrier. Nat. Rev. Drug Discov. 2021, 20, 362–383. [Google Scholar] [CrossRef]
- Nance, E.; Pun, S.H.; Saigal, R.; Sellers, D.L. Drug delivery to the central nervous system. Nat. Rev. Mater. 2022, 7, 314–331. [Google Scholar] [CrossRef]
- Luo, Z.; Wu, S.; Zhou, J.; Xu, W.; Xu, Q.; Lu, L.; Xie, C.; Liu, Y.; Lu, W. All-stage targeted therapy for the brain metastasis from triple-negative breast cancer. Acta Pharm. Sin. B 2023, 13, 359–371. [Google Scholar] [CrossRef]
- Wu, F.; Wang, P.; Wei, X.; Yang, Y.; Al Mamun, A.; Zhang, X.; Zhu, Y.; Mo, T.; Zhang, H.; Jiang, C.; et al. Barrier-penetrating liposome targeted delivery of basic fibroblast growth factor for spinal cord injury repair. Mater. Today Bio 2023, 18, 100546. [Google Scholar] [CrossRef]
- Xin, X.; Liu, W.; Zhang, Z.A.; Han, Y.; Qi, L.L.; Zhang, Y.Y.; Zhang, X.T.; Duan, H.X.; Chen, L.Q.; Jin, M.J.; et al. Efficient Anti-Glioma Therapy Through the Brain-Targeted RVG15-Modified Liposomes Loading Paclitaxel-Cholesterol Complex. Int. J. Nanomed. 2021, 16, 5755–5776. [Google Scholar] [CrossRef]
- Huang, R.Q.; Ma, H.J.; Guo, Y.B.; Liu, S.H.; Kuang, Y.Y.; Shao, K.; Li, J.F.; Liu, Y.; Han, L.; Huang, S.X.; et al. Angiopep-conjugated nanoparticles for targeted long-term gene therapy of Parkinson’s disease. Pharm. Res. 2013, 30, 2549–2559. [Google Scholar] [CrossRef] [PubMed]
- Li, S.; Xu, Q.; Zhao, L.; Ye, C.K.; Hua, L.; Liang, J.; Yu, R.T.; Liu, H.M. Angiopep-2 modified cationic lipid-polylactic-co-glycolic acid selivery temozolomide and DNA repair inhibitor dbait to achieve synergetic chemo-radiotherapy against glioma. J. Nanosci. Nanotechnol. 2019, 19, 7539–7545. [Google Scholar] [CrossRef] [PubMed]
- Zou, L.; Tao, Y.H.; Payne, G.; Do, L.; Thomas, T.; Rodriguez, J.; Dou, H.Y. Targeted delivery of nano-PTX to the brain tumor-associated macrophages. Oncotarget 2017, 8, 6564–6578. [Google Scholar] [CrossRef] [PubMed]
- Wei, H.M.; Liu, T.; Jiang, N.; Zhou, K.; Yang, K.Q.; Ning, W.M.; Yu, Y. A Novel Delivery System of Cyclovirobuxine D for Brain Targeting: Angiopep-Conjugated Polysorbate 80-Coated Liposomes via Intranasal Administration. J. Biomed. Nanotechnol. 2018, 14, 1252–1262. [Google Scholar] [CrossRef]
- An, L.L.; Sun, H.J.; Kong, Y.H.; Wang, X.M.; Zhao, C.L. Preparation of TPP-PEG-PE Liposomes with Mitochondrial Targeting Function and Mechanism Study of Its Effect on Gastric Cancer Model Mice. Chin. Tradit. Herb. Drugs 2021, 52, 1945–1956. [Google Scholar]
- Wang, M. Study on the Transport Characteristics and Mechanism of Fluoxetine Across the Blood-Brain Barrier; Zhejiang Academy of Medical Sciences: Hangzhou, China, 2021. [Google Scholar]
- Franke, R.M.; Scherkenbach, L.A.; Sparreboom, A. Pharmacogenetics of the organic anion transporting polypeptide 1A2. Pharmacogenomics 2009, 10, 339–344. [Google Scholar] [CrossRef]
- Gomes, M.J.; Mendes, B.; Martins, S.; Sarmento, B. Cell-based in vitro models for studying blood-brain barrier (BBB) permeability. In Concepts and Models for Drug Permeability Studies: Cell and Tissue Based in Vitro Culture Models; Woodhead Publishing: Cambridge, UK, 2016; pp. 169–188. [Google Scholar]
- Peng, H.; Yu, Y.; Zhu, Y.Z. Research progress on in vitro blood-brain barrier model. Chem. Life 2019, 39, 1218–1224. [Google Scholar]
- Li, H.; Jin, H.E.; Kim, W.; Han, Y.H.; Kim, D.D.; Chung, S.J.; Shim, C.K. Involvement of P-glycoprotein, multidrug resistance protein 2 and breast cancer resistance protein in the transport of belotecan and topotecan in Caco-2 and MDCKII cells. Pharm. Res. 2008, 25, 2601–2612. [Google Scholar] [CrossRef]
- Garg, T.; Bhandari, S.; Rath, G.; Goyal, A.K. Current strategies for targeted delivery of bio-active drug molecules in the treatment of brain tumor. J. Drug Target. 2015, 12, 865–887. [Google Scholar] [CrossRef]
- Lajoie, J.M.; Shusta, E.V. Targeting receptor-mediated transport for delivery of biologics across the blood-brain barrier. Annu. Rev. Pharmacol. Toxicol. 2015, 55, 613–631. [Google Scholar] [CrossRef]
- Chen, Z.Z.; Lu, Y.; Du, S.Y.; Shang, K.X.; Cai, C.B. Influence of borneol and muscone on geniposide transport through MDCK and MDCK-MDR1 cells as blood-brain barrier in vitro model. Int. J. Pharm. 2013, 456, 73–79. [Google Scholar] [CrossRef] [PubMed]
- Tang, H. Construction of Paclitaxel Carboplatin Co-Loaded Liposomes Targeting Estrogen Receptors and Study on Their Anti-Ovarian Cancer Properties; Jilin University: Changchun, China, 2023. [Google Scholar]
- Cai, X.; Huang, Y.; Wang, T.; Wang, Z.; Jiao, L.; Liao, J.; Zhou, L.; Zhu, C.; Rong, S. A biocompatible polydopamine platform for targeted delivery of nicotinamide mononucleotide and boosting NAD+ levels in the brain. Nanoscale 2024, 16, 19335–19343. [Google Scholar] [CrossRef] [PubMed]
- Grozio, A.; Mills, K.F.; Yoshino, J.; Bruzzone, S.; Sociali, G.; Tokizane, K.; Lei, H.C.; Cunningham, R.; Sasaki, Y.; Migaud, M.E.; et al. Slc12a8 is a nicotinamide mononucleotide transporter. Nat. Metab. 2019, 1, 47–57. [Google Scholar] [CrossRef] [PubMed]

| Chromatographic Conditions | Result |
|---|---|
| Pump | Binary pump |
| Detector | Ultraviolet detector |
| Chromatographic Column | Venusil HILIC (4.6 × 250 mm, 5 μm) |
| Mobile Phase A | 0.1% formic acid aqueous solution |
| Mobile Phase B | 0.1% formic acid methanol solution |
| A:B | 5:95 (v/v), isocratic elution |
| Detection Wavelength | 235 nm |
| Current Speed | 1 mL/min |
| Column Temperature | 35 °C |
| Injection Volume | 10 μL |
| Group | Papp Value (cm/s) ( ± SD) |
|---|---|
| Actual measurement value | 29.2 × 10⁻⁶ ± 0.65 |
| Literature report value [28] | 25.8 × 10⁻⁶ ± 1.66 |
| Sample | Papp (10−6, cm/s) ( ± SD) |
AP-BL/ BL-AP |
BL-AP/ AP-BL | Recovery (%) | ||
|---|---|---|---|---|---|---|
| AP-BL | BL-AP | AP-BL | BL-AP | |||
| NMN | 7.31 ± 0.31 | 7.40 ± 0.13 | 0.988 | 1.012 | 84.34 ± 2.33 | 93.41 ± 1.62 |
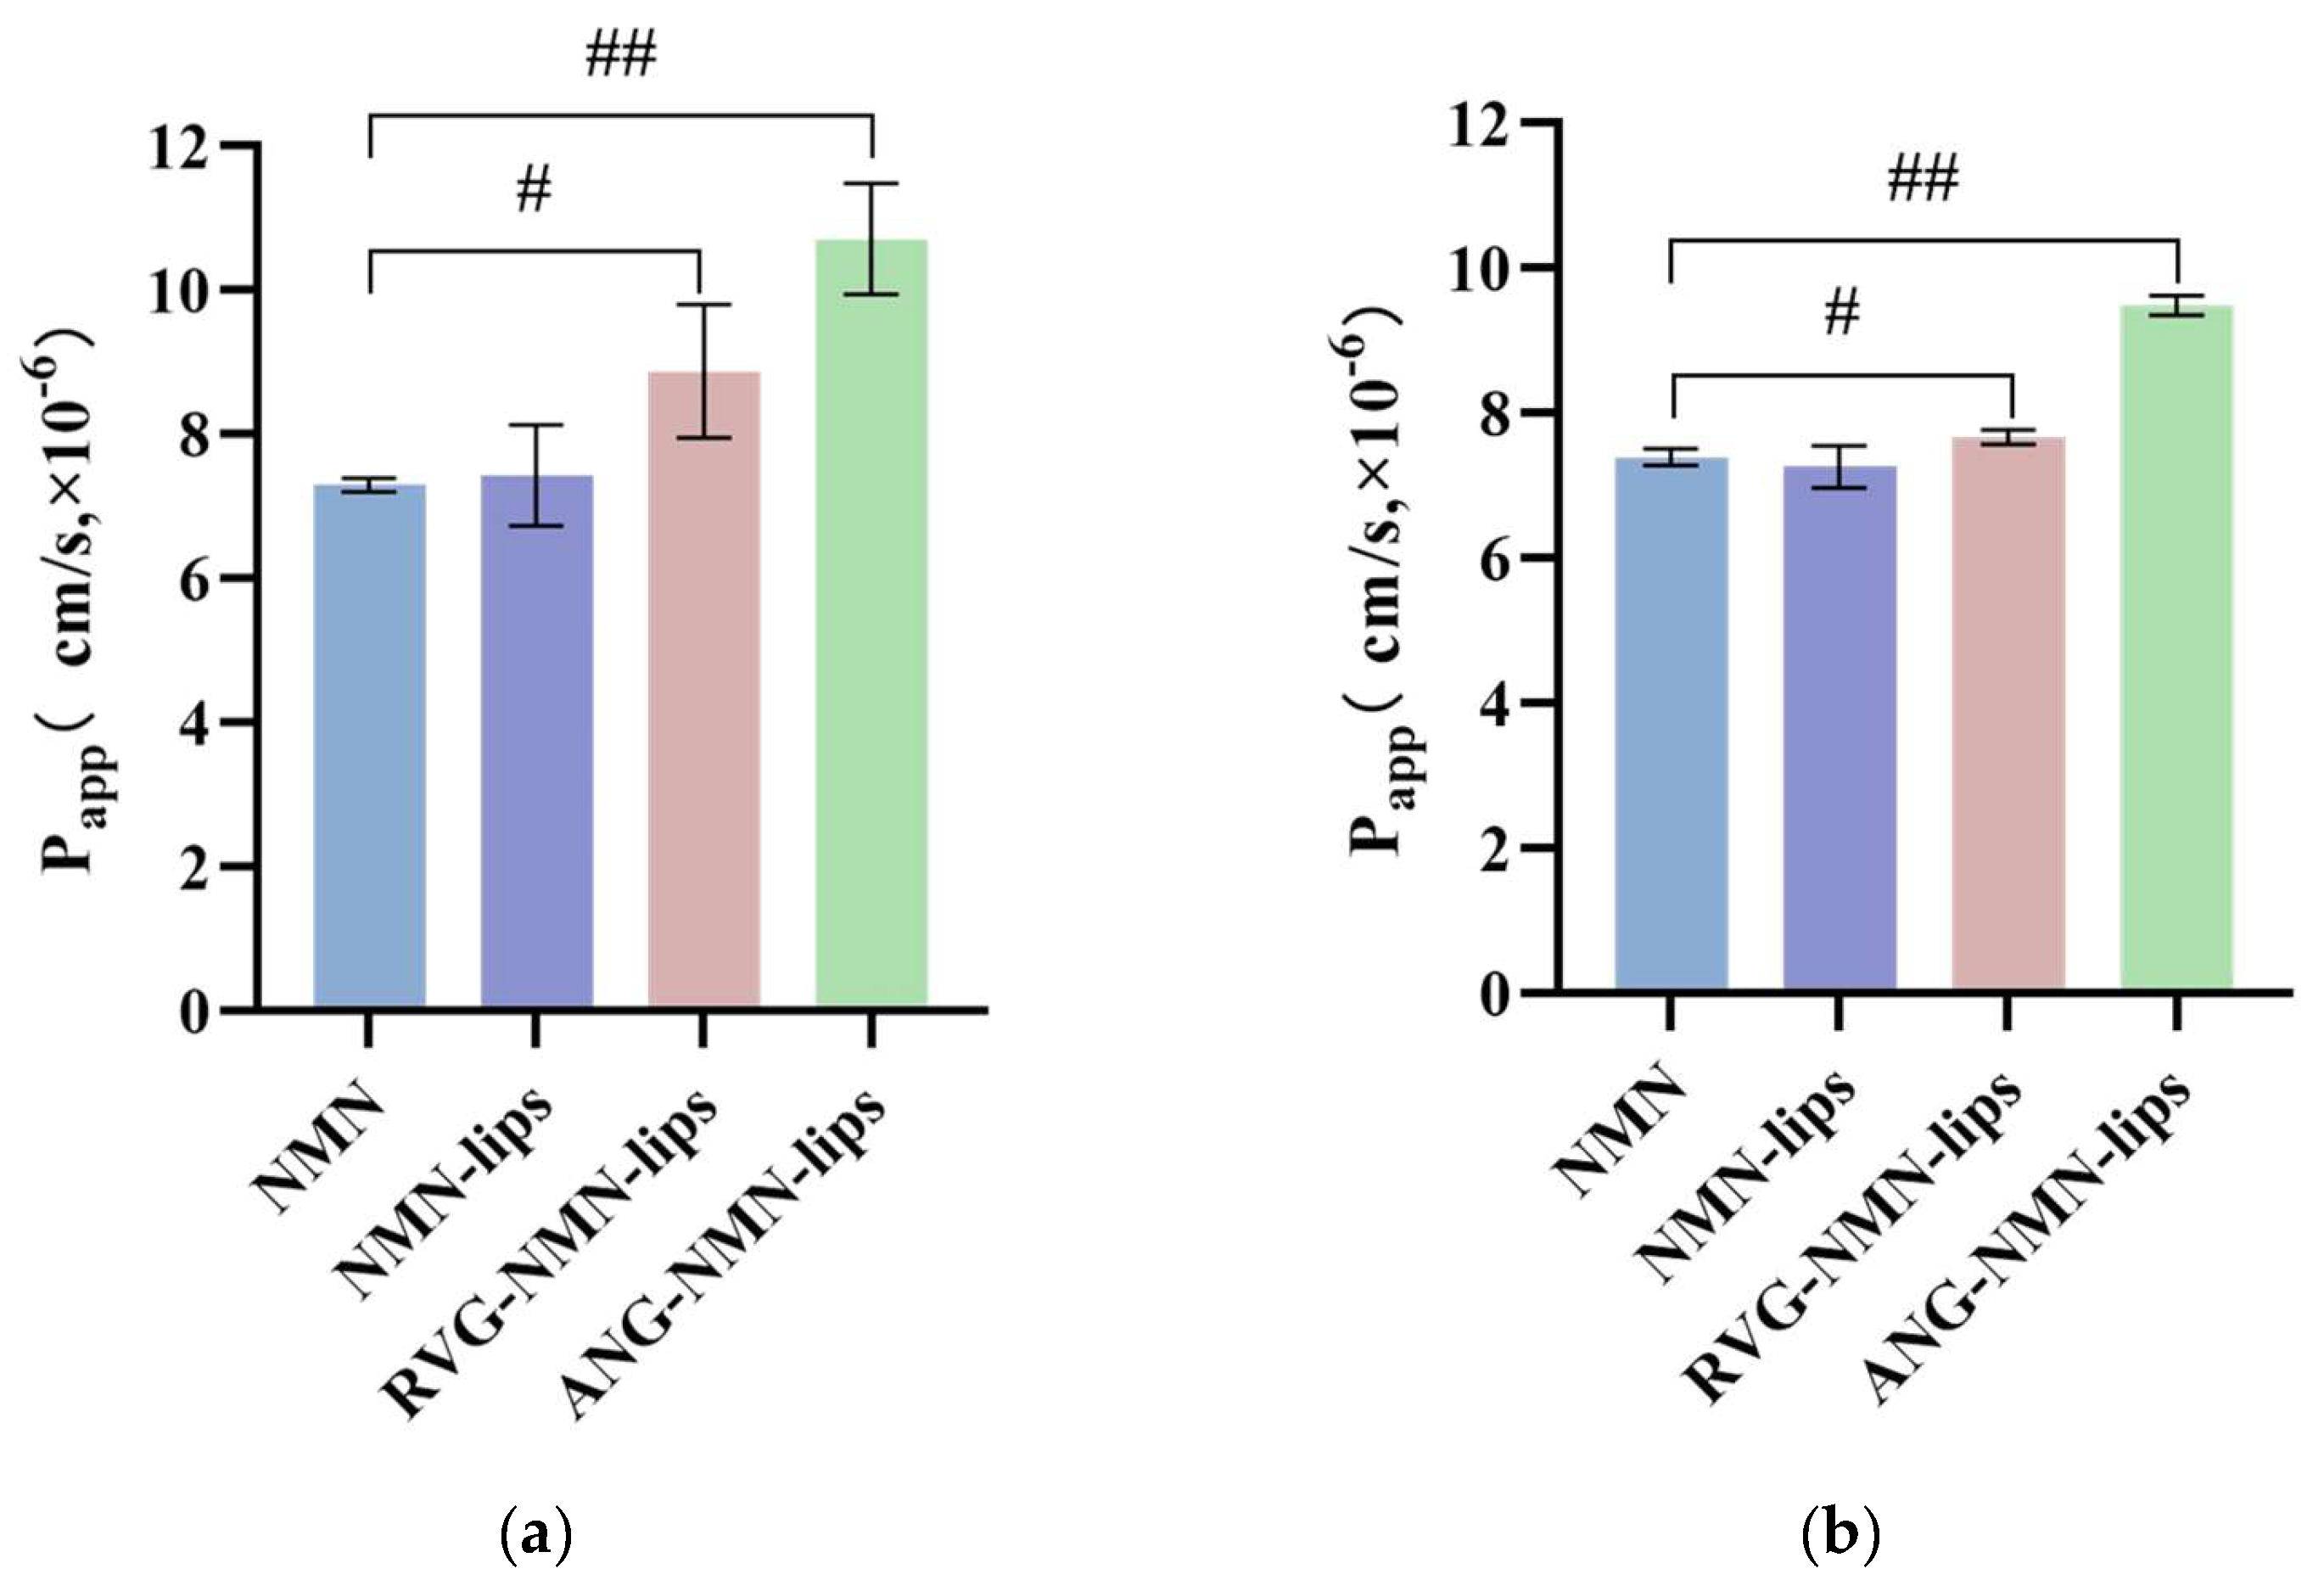
| Sample | Papp Value (10−6, cm·s−1) ( ± SD) | Ratio of AP-BL/BL-AP | Ratio of BL-AP/AP-BL | |
|---|---|---|---|---|
| AP-BL | BL-AP | |||
| NMN | 7.31 ± 0.31 | 7.40 ± 0.13 | 0.988 | 1.012 |
| NMN-lips | 7.44 ± 0.70 | 7.26 ± 0.29 | 1.024 | 0.977 |
| RVG-NMN-lips | 8.88 ± 0.92 | 7.67 ± 0.10 | 1.129 | 0.886 |
| ANG-NMN-lips | 10.71 ± 0.77 | 9.49 ± 0.13 | 1.157 | 0.864 |
| Sample | Time | Recovery (%) ( ± SD) | |
|---|---|---|---|
| AP-BL | BL-AP | ||
| NMN | 30 min | 97.94 ± 1.38 | 92.81 ± 1.27 |
| 60 min | 99.86 ± 1.73 | 94.74 ± 1.46 | |
| 90 min | 102.7 ± 2.45 | 96.52 ± 3.07 | |
| 120 min | 103.6 ± 1.84 | 86.63 ± 1.47 | |
| 150 min | 97.91 ± 2.20 | 87.76 ± 1.76 | |
| 180 min | 89.12 ± 0.51 | 86.71 ± 1.40 | |
| Sample | Concentration (mmol/L) | Recovery (%) ( ± SD) | |
|---|---|---|---|
| AP-BL | BL-AP | ||
| NMN | 0.05 | 114.4 ± 1.10 | 109.8 ± 0.86 |
| 0.1 | 110.0 ± 0.93 | 101.0 ± 0.29 | |
| 0.2 | 104.3 ± 1.70 | 101.8 ± 3.42 | |
| 0.5 | 86.34 ± 0.66 | 93.01 ± 1.06 | |
| 1 | 84.43 ± 0.96 | 87.45 ± 0.48 | |
| 2 | 83.80 ± 0.50 | 93.01 ± 0.63 | |
Disclaimer/Publisher’s Note: The statements, opinions and data contained in all publications are solely those of the individual author(s) and contributor(s) and not of MDPI and/or the editor(s). MDPI and/or the editor(s) disclaim responsibility for any injury to people or property resulting from any ideas, methods, instructions or products referred to in the content. |
© 2024 by the authors. Licensee MDPI, Basel, Switzerland. This article is an open access article distributed under the terms and conditions of the Creative Commons Attribution (CC BY) license (https://creativecommons.org/licenses/by/4.0/).
Share and Cite
Wang, T.; Wu, Q.; Wang, L.; Lan, T.; Yun, Z.; Zhao, L.; Wu, X. Construction of Nicotinamide Mononucleotide-Loaded Liposomes and Their In Vitro Transport Across the Blood–Brain Barrier. Appl. Sci. 2024, 14, 11732. https://doi.org/10.3390/app142411732
Wang T, Wu Q, Wang L, Lan T, Yun Z, Zhao L, Wu X. Construction of Nicotinamide Mononucleotide-Loaded Liposomes and Their In Vitro Transport Across the Blood–Brain Barrier. Applied Sciences. 2024; 14(24):11732. https://doi.org/10.3390/app142411732
Chicago/Turabian StyleWang, Tiantian, Qi Wu, Lihong Wang, Tao Lan, Zhenyu Yun, Lin Zhao, and Xi Wu. 2024. "Construction of Nicotinamide Mononucleotide-Loaded Liposomes and Their In Vitro Transport Across the Blood–Brain Barrier" Applied Sciences 14, no. 24: 11732. https://doi.org/10.3390/app142411732
APA StyleWang, T., Wu, Q., Wang, L., Lan, T., Yun, Z., Zhao, L., & Wu, X. (2024). Construction of Nicotinamide Mononucleotide-Loaded Liposomes and Their In Vitro Transport Across the Blood–Brain Barrier. Applied Sciences, 14(24), 11732. https://doi.org/10.3390/app142411732