Article

Analysis of the Relationship between Step Angle and Step Rate during Running: Implication for Rehabilitation

1
Department of Orthopaedic and Trauma Surgery, Ninewells Hospital and Medical School, University of Dundee, Dundee DD1 9SY, UK
2
Fitness Department, Sallynoggin College of Further Education, Pearse Street, Thomastown, Sallynoggin Co., A96 KV84 Dublin, Ireland
*
Author to whom correspondence should be addressed.
Appl. Sci. 2024, 14(3), 1059; https://doi.org/10.3390/app14031059
Submission received: 25 December 2023 / Revised: 22 January 2024 / Accepted: 24 January 2024 / Published: 26 January 2024
(This article belongs to the Section Biomedical Engineering)

Abstract

:

Featured Application

The relationship between step rate and step angle in running was investigated. The results could be useful and referable for clinicians and coaches in rehabilitation and sports science.

Abstract

In running, step rate and step angle are important, but the relationship between the two parameters is not clear in the literature. This study aimed to investigate the effect of step rate manipulation on step angle in running. A group of twenty healthy recreational runners aged between 30 and 59 years who regularly run 15–90 km per week were recruited. Kinematic data were recorded using a motion capture system while running on a treadmill. Participants maintained a self-selected speed and then altered their step rate using a metronome and completed three thirty-second trials at the preferred step rate, 10% above the preferred step rate and 10% below the preferred step rate. The results showed that the step angle is not significantly correlated with the step rate and kept at roughly 37 degrees at the preferred step rate and 10% lower than the preferred step rate but increased to 42 deg when the step rate increased to 10% of the preferred step rate. The step angles were not significantly different between the male and female or between sides. This finding provides an understanding of the association of step rate re-training on swing phase parameters.

1. Introduction

Sport Ireland’s annual report 2017 [1] stated that running is the third most popular form of sports participation in Ireland. Additionally, worldwide participation levels in organized running races peaked in 2016 with a total of 9.1 million participants. According to Andersen [2] worldwide participation levels over the last 10 years has increased by 57.8%.
Furthermore, running research has dramatically accelerated with a recent emphasis on developing wearable running technology to analyse running techniques. Time and distance gait parameters or spatiotemporal step characteristics are commonly measured with portable and laboratory devices, which include step rate (SR), contact time (CT), flight time (FT), stride length (SDL), step length (SL), step height (SH) and step angle (SA).
SR is a temporal parameter that has been extensively examined in running biomechanics [3]. SR is defined as the number of ground contact events per amount of time. Typically, SR is retrained using a metronome to change the runner’s preferred SR. Schubert et al. [3] suggested that increasing running SR affects impact peak, kinematics, and kinetics, thus reducing injury rate risks.
Biomechanical analysis of running has largely concentrated on stance phase variables [4] and less so on swing phase biomechanics. A swing phase spatial parameter that has been examined and associated with running economy (RE) is SA [5,6,7,8]. SA is defined as “the angle of the parabola tangent derived from the theoretical arc traced by a foot during a step and the ground” (See Figure 1). SA is an indirect indicator of swing phase biomechanics related to the vertical component of ground contact forces. A higher SA has been related to reduced ground CT and improved RE [5,6,7,8]. Moreover, Morin et al. [9] identified SR as an indirect factor affecting leg stiffness because of its effect on minimising CT. Therefore, it seems significant to investigate the relationship between SR manipulation and SA due to their intimate association with CT.
Note: the curve is the trace of the foot, L is the step length, H is the max height reached by the foot, and α the step angle.
While considerable research exists regarding spatiotemporal parameters during running, there is a lack of research on the relationship between step rate and step angle, nor the report between sex differences when SR is manipulated. In comparison to men, women are nearly twice as likely to have a running injury [10]. It has been suggested that there are lower extremity differences between sex in running kinematics [11]. Only two studies have investigated the influence of sex differences on spatiotemporal step characteristics [12,13]. However, these studies examined spatiotemporal step characteristics at a constant speed and SR or incremental running test. Hence, the importance of comparing sex differences was considered in this novel study of SR manipulation on spatial step characteristics.
Prior research evaluating asymmetry between lower limbs in gait has identified significant differences in kinetic and kinematic measures [14,15]. Zifchock et al. demonstrated that never-injured runners had normal levels of asymmetry ranging from 3.1% up to 49.8% for kinetic forces [16]. In this current original investigation into SA utilising motion capture, we sought to identify any spatial asymmetries.
The purpose of the present study was three-fold: (1) to investigate if SA has a predicable interaction with SR, (2) to establish if SA differs between genders with SR changes, and (3) to determine any spatial asymmetrical between the left and right sides. It was hypothesised that there would be a significant correlation between SA and SR, and significant SA differences were found between (a) sex and (b) lower limb symmetry.
The reason for investigating step angle with varying step rates was to determine if this parameter is comparable at all step rate changes, not just increased step rates as seen with increased running speed, previously found in other studies. It is also important to measure and compare spatial parameters such as SL and SH, as these are components of SA and could provide a further understanding of the relationships between these parameters. Gender differences were investigated to clarify if there are any changes since current research into spatiotemporal characteristics is inconclusive [12,13]. Since this study allowed participants to self-select their running speed, it was worthwhile to measure gait symmetry, as some studies have found that running speed and running experience affect the level of symmetry. Asymmetry could be seen as important due to the metabolic cost of changing gait retraining and fatigue, which can increase asymmetry in participants. Lastly, if step rate and step angle are related, then it could be used as a further parameter to monitor when injured participants are being guided through gait retraining programs in clinics and rehabilitation.

2. Materials and Methods

2.1. Participants

Twenty healthy (9 females, 11 males) recreational runners, without any current injuries, who ran a minimum of 15 km a week (mean: 33.0 ± standard deviation 20.3 km, ages 43.0 ± 10.2 years, heights 1.73 m ± 10.2 and body mass 71.8 ± 12.1 kg) volunteered to participate in the study. The study was approved by the School of Medicine and School of Life Sciences Research Ethics Committee at the University of Dundee (SMED REC 19/38), and the participants provided written informed consent in accordance with institutional policies.

2.2. Protocol

Before data collection, each participant’s preferred running speed and preferred step rate were determined while running on a treadmill (Body Power, Motorised treadmill, model no: Sprint T700, Sport-Tiedje GmbH, Schleswig, Germany) after a 5-min warm-up. Participants were instructed to adjust the speed as needed over this period until they identified a speed that was representative of their typical moderate-intensity run. This speed was then employed for all three SR trials. SR was visually calculated over a 30-s period by counting the number of right foot strikes and multiplying by four. When calculating steps, we used a round number of steps, ignoring the half/part of the step. The process was repeated to guarantee accuracy with the average value used.
Vicon® motion capture system (Oxford, UK), including 6 MX T20 cameras and 10 Vantage 5 cameras, was used to collect movement data. The lower limb body model (Plug-in-Gait) with 24 reflective markers was placed on each subject, and the kinematic data was recorded at 400 Hz during all running conditions, as shown in Figure 2.
According to the requirement of the Vicon system and model, a “T-pose” calibration trial was performed to establish joint centres, body segment coordinate systems, segment lengths and the local positions of tracking markers with Vicon Nexus 2.8.1 capture software.
Participants were then asked to run at their preferred running speed under the three SR trials: preferred step rate (PSR) = 152–176 SPM (step per min or cadence), 10% below preferred step rate (10% below PSR) = 137–159 SPM, 10% above-preferred step rate (10% above PSR) = 167–194 SPM. The order of the SR trials was randomised for each participant, with 30 s of data collection for each condition and 30 s of rest between SR trials. Subjects ran in time with a digital audio metronome to facilitate the correct SR. Data collection did not begin until the participants could maintain the prescribed SR for a minimum of 1 min determined by visual inspection. There was 2 min of rest between different step rates.
The iPad application “Pro Metronome” by EUM Lab for IOS (Figure 3a) was utilised in conjunction with a Voombox Portable Bluetooth speaker (model: Voombox-Travel, Divoom®, Shenzhen, China) (Figure 3b) to help participants maintain their step rate throughout the study. Once the step rate was determined by the participant and researcher, the metronome would produce the sound with the step rate, and then the participant maintained the step rate according to the sounds. The 10% increase and decrease to pre-SR were adjusted according to this way.

2.3. Data Processing

After recording trial data, Vicon Nexus software (v 2.8.1) was used to format the data, including marker labelling, marker gap filling, marker smoothing and lower limb pipelines. Gait events were manually identified for foot contact and terminal stance and then auto-correlated. Kinematic data were formatted with Woltring filtering and processed through a dynamic Plug-in-Gait model. During each of the three SR trials, spatiotemporal characteristics (described below) were measured for every step and averaged for each individual trial.
-
Step length: (SL, in meters [m]): based on the length the treadmill belt moved from toe-off to initial contact in successive steps.
-
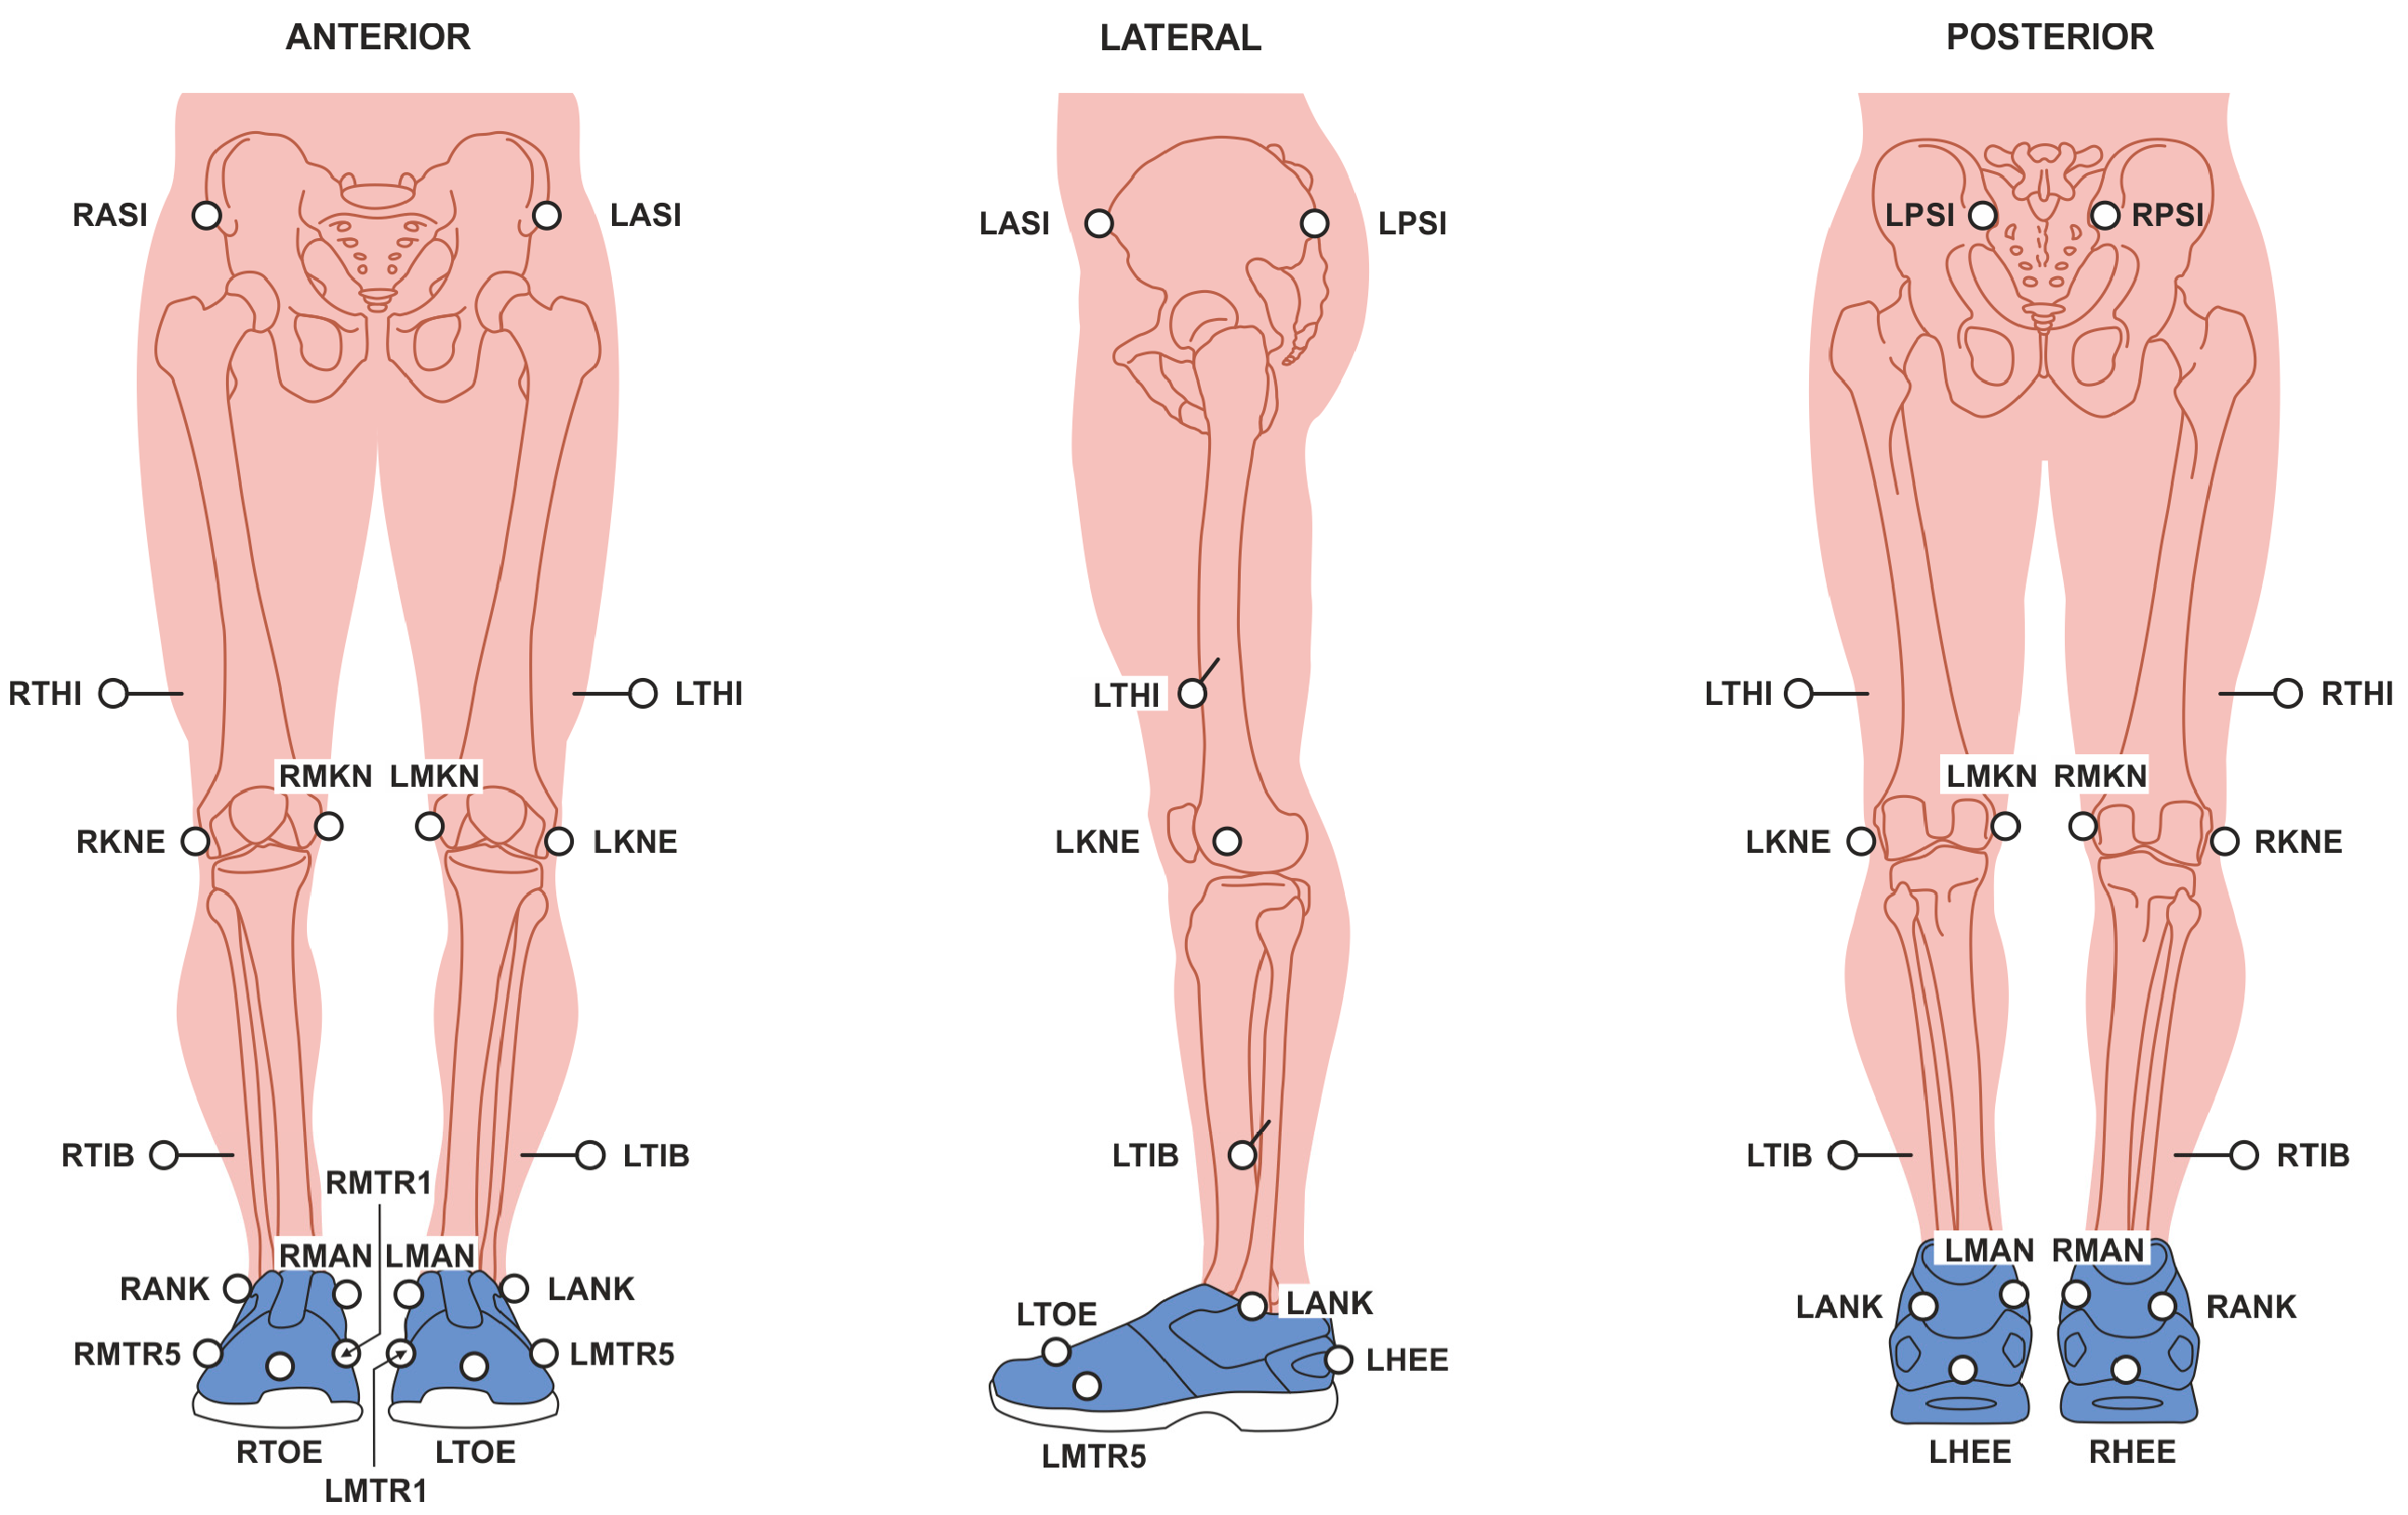
Step height (SH, in meters [m]): the maximum height the lateral malleolus marker (L/RANK) reaches during a step.
-
Step rate: (SR in steps per minute [SPM]) the number of ground contact events per minute.
-
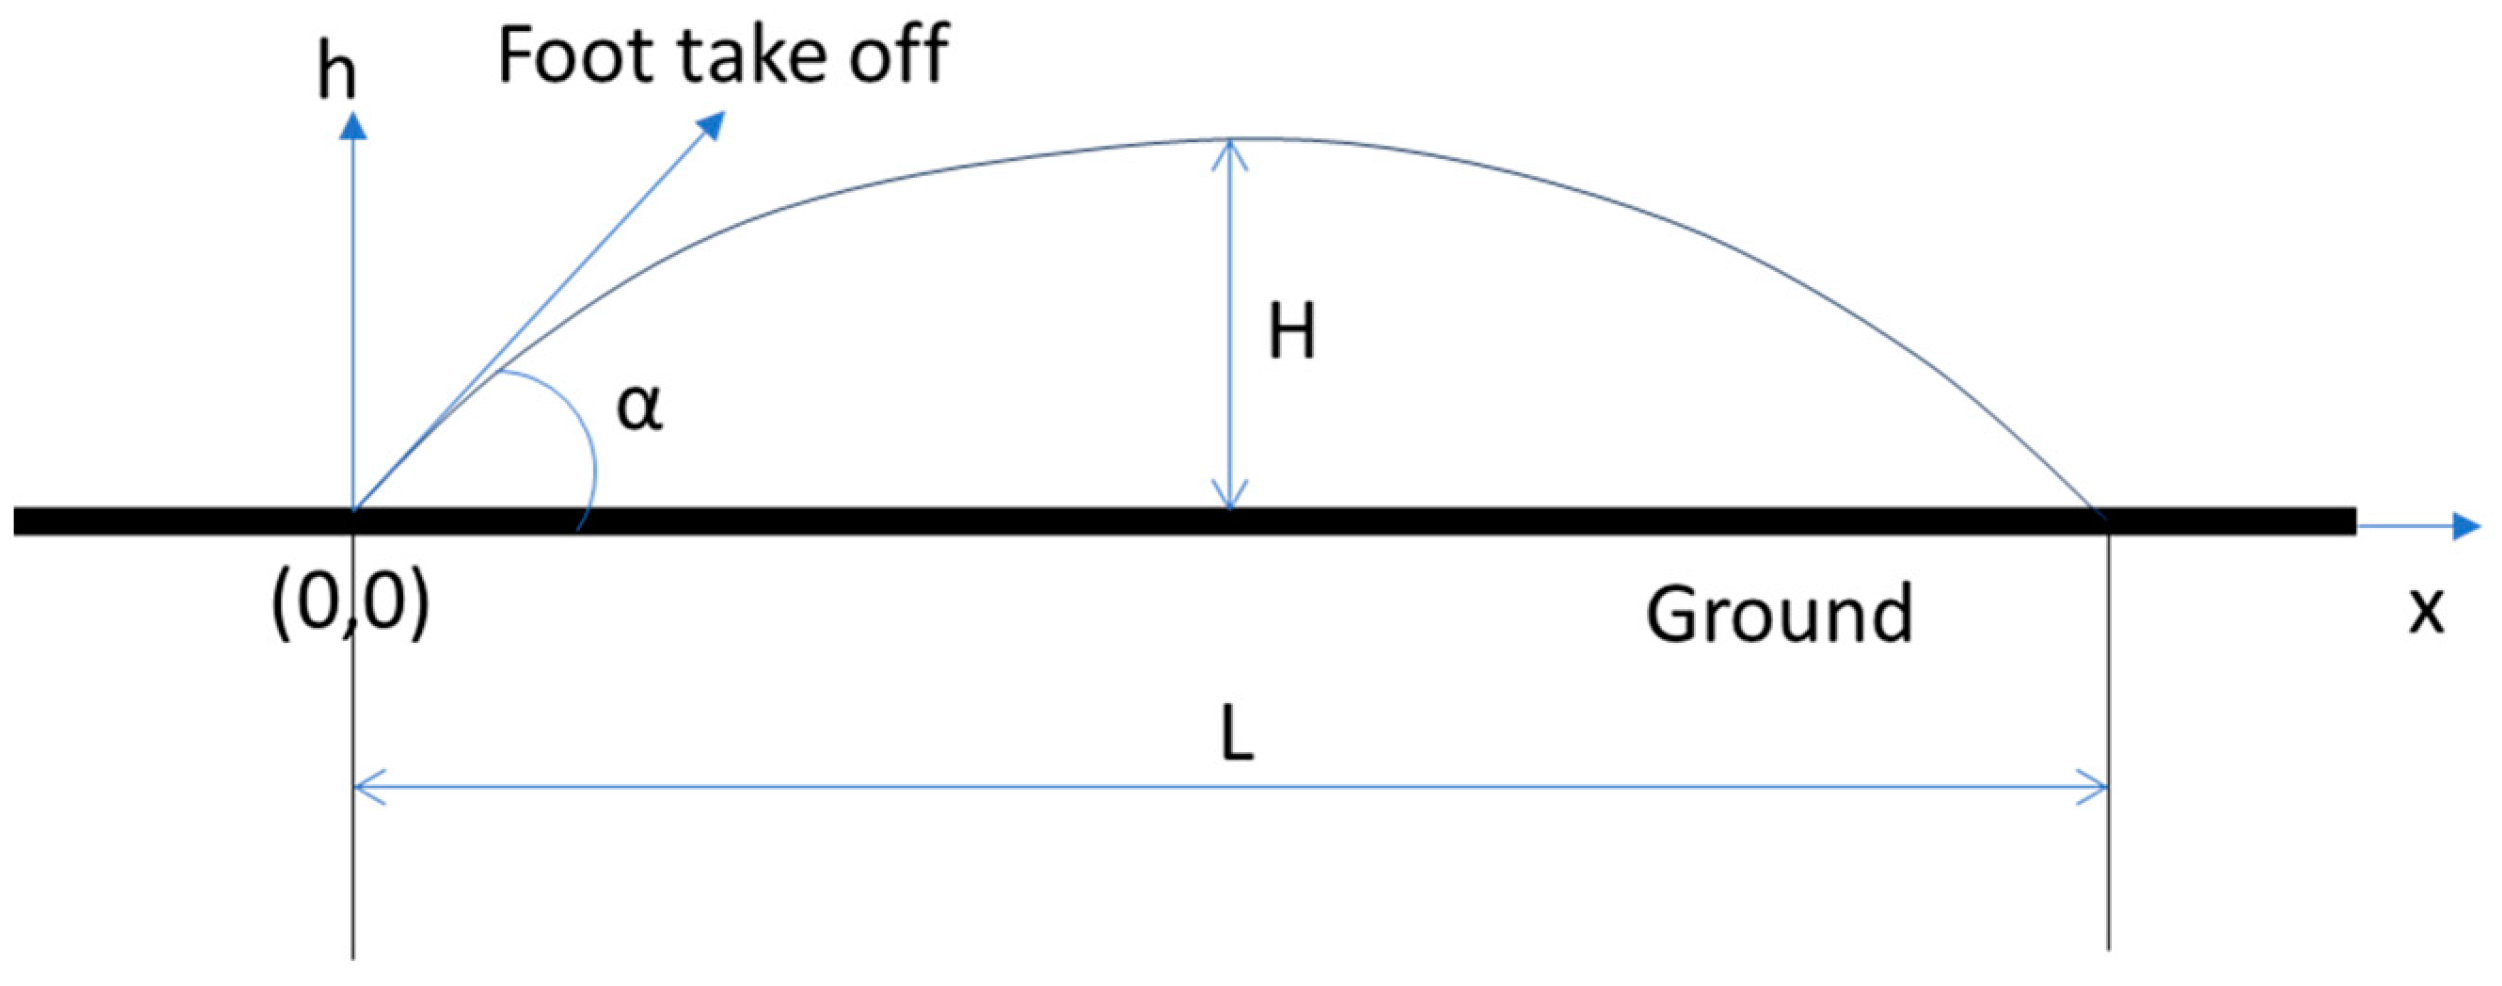
Step angle: (SA in degrees [°]) the angle of a parabola tangent deriving from the SL and the SH during a step and calculated by the formulas below. Referring to Figure 1, given that the origin is the point of foot taking off, height h and distance x, there is a function as below, and k is a coefficient to be determined:
f ( x ) = k x ( L x )
Its derivative is below,
d f d x = k L x k x = k ( L 2 x )
When the derivative (2) is zero, the f(x) reaches the maximum where x = L/2. Thus, when put x = L/2 into (1), the maximum height H is
H = k ( L 2 ) ( L L 2 )
That is to say,
k = 4 L 2 H
At the taking off position (x = 0), the derivative of function is equal to the tangent angle of the curve, thus:
d f d x ( x = 0 ) = k L = 4 L H
That is to say,
t a n ( α ) = 4 L H
The Equation (6) was used to estimate step angle in this study. In the Vicon marker set, there were a few makers on the foot; the L/RANK was used to approximate the foot position in calculating the step angle. According to Equations (1)–(6), the calculation of step parameters was implemented using an in-house program made in Matlab® (v 2019a).

2.4. Sample Size and Power Analysis

As this was a brand-new study, there was no way to get previous standard deviation from the literature. Therefore, a posteriori test was conducted to check the sample size. From the SA results, standard deviations from 5 to 8° from three groups were found, and the average SD was 6.7°. Given that the clinical difference was assumed as 5°, power 80% and α = 0.05, the sample size required was fourteen. As this study included 20, it provided good statistical quality.

2.5. Statistics

Statistical Package for the Social Science (SPSS) V.28 (IBM Corp., New York, NY, USA) was used. Bilateral means and standard deviation for each subject’s SA, SL, and SH were calculated in each of the three SR trials. In statistical analysis, SR trials were used as the independent variable to analyse a within-subject factor of spatial gait parameter and to compare gender as a between-subject factor. A general linear model for repeated measures with pairwise comparisons was performed to compare three types of SR. A general linear model for multivariate with pairwise comparisons was performed to compare the gender in three types of SR. A general linear model for repeat measure or multivariate in SPSS is similar to ANOVA, but this way allows users to input other factors in a run. For example, step rate was used as a within-subject factor, gender as a between-subject factor, and BMI as an interactive covariate factor in one run. Thus, this way considers not only a multi-way ANOVA but also multi-interactive factors. Bilateral measurements of SL, SH, and SA were compared to identify any lower limb asymmetry by performing a paired sample t-test. A significance level of p < 0.05 was set.
Furthermore, correlation testing (Pearson’s correlation coefficient) was conducted to identify the relationship between parameters with significance at the 0.05 level (2-tailed). The following interpretation of the coefficient was applied: 0.0–0.3 was negligible, 0.3–0.5 was low correlation, 0.5–0.7 was moderate correlation, 0.7–0.9 was high correlation, and 0.9–1.0 was very high correlation [17].

3. Results

3.1. Participant Demographics with Gender

The basic information on the participants is reported in Table 1. The age and the body mass index (BMI) for the two groups are not significantly different. Usually, if the age and BMI are increased, the step rate and length would be decreased. This study collected data from the male and female groups with similar age and BMI, and thus, these factors were ignored.

3.2. Basic Results on the Three Different Step Rates

The three different step rates produced different results for various parameters, which are displayed in Table 2.
Step angle
A significant increase in step angle (SA) was observed bilaterally when comparing the PSR trial to 10% > PSR. Additionally, a significant increase was also observed bilaterally when comparing 10%> PSR to 10% < PSR on the right side. Conversely, no significant difference was noted between SA when comparing the PSR trial and 10% below PSR.
Step length
A pairwise comparison of SL showed an inverse relationship to SR, i.e., step length was increased when the step rate decreased.
Step height
It is surprising that no significant differences were observed among SH on either side for any of the SR trials (Table 1), except the case between left SA PSR and >10% PSR.

3.3. Results on Gender Comparison

The results on step rates and angles for gender comparison are shown in Table 3. There are no significant differences between males and females in terms of step rates and angles.
The results on step heights and step lengths are shown in Table 4. It was found that the male group had a larger step length than the female group when step rates were PSR and <10% PSR situations, but no changes in >10% PSR cases. It was also found that the max heights of the feet during running were not significantly different between genders in three types of step rates.

3.4. Results on Correlation

Further correlation analysis produced the results in Table 5 and Table 6. It is found that step rate is not significantly correlated with step length, step height and step angles. The running speed is mainly correlated with the step length and then with step height, but not correlated with the step angle. The step angles are mainly correlated with the step height.

3.5. Results on Left vs. Right

The results in comparing both sides are shown in Table 7. The only significant difference occurred in the PSR case for step length. Other parameters are not significant differences between the two sides.

4. Discussion

4.1. Main Findings and Comparison with Previous Studies

This is the first study to investigate the relationship between SR and SA while controlling the running speed. A limited amount of research has investigated swing-phase kinematics [5,6,7,8]. This research, therefore, intended to improve the current understanding of SA in relation to SR, which has not previously been explored.
This study found that there is not a significant correlation between SA and SR, and SR are correlated with SH. Implementing gait re-training strategies with recreational runners may require a period of time to adapt to the changes in metabolic costs when manipulating biomechanics variables [18].
Santos-Concejero et al. discovered that elite runners tend to display a higher SR, SA and shorter CT time than recreational runners [5,7]. Moreover, Garcia-Pinillos et al. observed greater flight time, SA and SL in elite runners, while recreational runners displayed similar contact times and a higher SR [19]. Increasing SR in recreational runners could be a superior method to improve running technique that increases swing time, vertical stiffness and SA without the need to increase SL.
No significant difference existed between SAs that were 10% below the participants’ PSR. This could be explained by lower SR producing longer ground CT, thus reducing leg stiffness [20]. More compliant limbs are associated with greater lower limb joint flexion during the stance phase and increased energy expenditure [21]. More mechanical work from the muscles at a lower SR could produce a more varied SA among participants due to their inability to utilise kinetic energy effectively. Therefore, incorporating SA as a quantitative measure in running technology could assist in the improvement of running performance.
Previous research reported that SL had an inverse relationship to SR [22]. Increasing SR is a technique employed with runners to prevent overstriding and to reduce SL [3,23]. This helps to reduce vertical COM displacement [24], thus reducing peak vertical ground reaction forces [9] and breaking impulses during the stance phase, although elite runners displayed a longer SL and lower SR due to their higher athletic abilities [19]. Coaching drills that increase SA or SR could be useful in preventing overstriding in gait re-education programs for recreational runners. In contrast, this current study does not find that SL and SR have a significant correlation, maybe because this experiment has different conditions from the previous ones.
Interestingly, SL was the only spatial parameter that had asymmetry when running at the participants’ PSR (Table 6). This asymmetry could be explained by participants having lower limb dominance [23] or a previous injury [16]. Conversely, it would seem that increasing or decreasing SR may reduce this asymmetry.
Unsurprisingly, there is a moderate positive relationship between SH and SA (Table 5 and Table 6), given that SH is a component of SA, although it could indicate that SH has a more significant relationship to altering SA. Furthermore, runners who have a lower SR can tend to overstride and increase SL rather than utilising SH [25]. Therefore, gait re-education techniques that alter SH should be considered to alter swing phase biomechanics, for instance, the butt flick. Additionally, a moderately positive relationship was found between SL and SH. Runners may choose to increase SH to allow them to increase swing time and maximise their ability to achieve a higher foot position. A longer swing phase has been associated with better RE [6]. Future studies may want to evaluate the link between temporal parameters and SA and SR manipulation.
This is the first study to analyse the sex differences between SAs when SR is manipulated. Regarding SA, no significant difference was found between sex in this study (Table 3). García-Pinillos et al. found no significant difference between sexes and SA when running velocity was inclemently increased [13]. Likewise, Roche-Seruendoa et al. found no difference between sexes and SA when running at a constant speed of 12 km. With SA comprising of the SH and SL, it is possible that a natural ratio exists between these two measurements that permits sex comparison. From this investigation, we can conclude that SA is comparable between sex when SR and running speeds are altered.
Males ran with a significantly longer SL but not higher SH in comparison to females (Table 4). Studies have established that females run with a smaller gait cycle length/height than males [13,21]. Furthermore, dissimilarities in physique between genders could explain the significant difference in both SL and SH, with males having a mean height of 179.3 cm compared to 164.5 cm in females. It should be noted that the body height was considered as an interactive and covariate factor in our statistical analysis.
It is noted in Table 3 that males and females have similar step angles during running. Also, in Table 5 and Table 6, it is found that step angle was not linearly correlated with speed and step rate. This indicated that human beings might have specific step angles during running in terms of biomechanically optimum principles, e.g., saving energy, coordinating limbs, smoothing the centre of mass during running, etc. The reason why such a specific range of step angles was used while running is worth exploring in the future.
In terms of rehabilitation, the specific range of step angles in this study could be used as a reference for those who have been disabled and would recover while running. Also, this information provides useful information to clinicians in rehabilitation and sport coaches in exercise.

4.2. Limitation

While this study adds a unique understanding to current research, it is acknowledged that there are some limitations to the work. It is pertinent to note that all previous investigations into SA by Santos-Concejero et al. [5,6,7,8], Roche-Seruendoa [12] and García-Pinillos [13] used an optical measurement system (Optojump-next system) to quantify SA. However, the present research project was the first to calculate SA from kinematic data and apply the SA formula. This will make it difficult to directly compare data from other research papers, but comparing tendencies should be possible.
One limitation that needs to be considered is the weekly running distance mean, which was 33.0 km with a large standard deviation of 20.3 km within the group. Furthermore, there was a significant difference in the mean training volume between male and female runners, namely 40 km and 24 km per week, respectively. Boyer et al. [26] found a significant difference in lower extremity segment kinematics between higher and lower-mileage runners. This needs to be considered when interpreting results from a heterogeneous group.
The accuracy of identifying gait events through known kinematic correlations could cause minor errors without the use of force plate data. Additionally, some debate exists regarding the accuracy of certain algorithms for predicting gait events. Several kinematic events have been employed to identify the different phases of stance running gait [27]. To improve the accuracy of the study, the use of a treadmill with an internal force plate or overground running onto force plates may improve the experiment design.
Treadmills have been found to alter kinematics in comparison to over-ground running. Moreover, it should be noted that SR increases when running on a treadmill in comparison to over-ground running [28]. Fellin et al. [28] found no significant difference between both over-ground and treadmill running. However, verbal cueing to alter running gait has been seen to transfer from treadmill running to over-ground running [29]. Future studies should consider over-ground running for training and assessing participants to allow more accurate measurements of SR manipulation on SA.
A disadvantage of this study was that a single bout of gait re-training was implemented to alter participants’ SR. During the study, some participants reported awkwardness while attempting to coordinate their desired SR. It was noted that motor skill acquisition varied between participants, with some needing more coaching and time to adapt to a running pattern. The use of real-time, gradually faded feedback 6-week protocol for running gait re-training would be a more effective intervention [30]. The use of over-ground running gait re-training and mobile monitoring to alter SR would be valuable in the experiment to improve participant learning.
As participants used their own running tops, shorts and footwear, this study did not investigate the effect of shoes on the step angle and rate. Also, it was fully recognised that this study had a small sample size, especially when comparing two groups between genders. In addition, we did not record limb lengths and dominance sides, as these were considered a factor. Hopefully, a future study will consider these limitations.

4.3. Future Study

Previously, a study investigated the relationship between foot inclination angle and vertical ground reaction force (GRF) and reported that the vertical loading rate was the lowest at specific angles [31]. Another research studied the relationship between step length and step rate but not step angle [32]. As our study has not collected GRFs and the step angle used in our study is different from the foot inclination angle, it is difficult to compare this study with the previous ones. However, these previous studies indicated that we should consider further research on step angle with other factors.
Future research should consider conducting a larger trial to include injured and uninjured runners for comparison. A gradually faded feedback training protocol over a 6–8-week period. This could include three trial groups: preferred step rate (control), 10% above PSR and 10% below PSR. The analysis of running kinetics using over-ground running on force plates would provide a complete understanding of the relationship between swing phase kinematics on kinetics and temporal characteristics.

5. Conclusions

To our knowledge, this is the first study to successfully analyse SA utilising motion capture technology while comparing step rate, sex differences and symmetry. It was established that SA differed between trials but had a low correlation to SR. SA is a parameter that is comparable between sex and sides when SR is modified. These findings provide a greater understanding of the SR in running. This study should inspire further investigations into the interaction of swing phase parameters to enhance running performance and rehabilitation.

Author Contributions

Conceptualization, B.K.; methodology, B.K. and W.W.; software, W.W.; validation, B.K. and W.W.; formal analysis, B.K. and W.W.; investigation, B.K.; resources, G.A.; data curation, B.K. and S.N.; writing—original draft preparation, B.K.; writing—review and editing, W.W.; visualisation, W.W.; supervision, W.W.; project administration, G.A.; funding acquisition, W.W. All authors have read and agreed to the published version of the manuscript.

Funding

The University of Dundee the Library’s Institutional Open Access Fund.

Institutional Review Board Statement

The study was conducted in accordance with the Declaration of Helsinki and approved by the University of Dundee Medical School Ethics Committee (SMED 19/38) on 4 April 2019.

Informed Consent Statement

Informed consent was obtained from all subjects involved in the study. Written informed consent has been obtained from the patient(s) to publish this paper.

Data Availability Statement

The data will be provided if a request is sent to the corresponding author.

Acknowledgments

The authors are grateful to all volunteers who participated in this study. The acknowledgements are extended to the University of Dundee, represented in the School of Medicine, particularly the Department of Orthopaedic and Trauma Surgery, for giving B.K. a chance to do the study with their help.

Conflicts of Interest

The authors declare no conflicts of interest.

References

  1. Sport Ireland. Irish Sports Monitor Annual Report 2017; Sport Ireland: Dublin, Ireland, 2017; p. 14. Available online: https://assets.gov.ie/16014/3abf58a4a5af41b9ab66065de65e15a3.pdf (accessed on 1 January 2019).
  2. Andersen, J. Run Repeat Website [Internet]. Fort Collins (CO): The State of Running 2019. Available online: https://runrepeat.com/state-of-running (accessed on 1 January 2019).
  3. Schubert, A.; Kempf, J.; Heiferscheit, B. Influence of stride frequency and length on running mechanics: A systematic review. Sports Health 2014, 6, 210–217. [Google Scholar] [CrossRef]
  4. Tartaruga, M.; Brisswalter, J.; Peyré-Tartaruga, L.A.; Avila, A.O.V.; Alberton, C.L.; Coertjens, M.; Cadore, E.L.; Tiggemann, C.L.; Silva, E.M.; Kruel, L.F.M. The relationship between running economy and biomechanical variables in distance runners. Res. Q. Exerc. Sport Am. Alliance Health Phys. Educ. Recreat. Danc. 2012, 83, 367–375. [Google Scholar] [CrossRef]
  5. Santos-Concejero, J.; Granados, C.; Irazusta, J.; Bidaurrazaga-Letona, I.; Zabala-Lili, J.; Tam, N.; Gil, S.M. Influence of the biomechanical variables of the gait cycle in running economy. Rev. Int. Cienc. Deporte 2014, 36, 95–108. [Google Scholar] [CrossRef]
  6. Santos-Concejero, J.; Tam, N.; Granados, C.; Irazusta, J.; Bidaurrazaga-Letona, I.; Zabala-Lili, J.; Gil, S.M. Stride angle as a novel indicator of running economy in well-trained runners. J. Strength Cond. Res. 2014, 28, 1889–1895. [Google Scholar] [CrossRef]
  7. Santos-Concejero, J.; Granados, C.; Irazusta, J.; Bidaurrazaga-Letona, I.; Zabala-Lili, J.; Tam, N.; Gil, S.M. Differences in ground contact time explain the less efficient running economy in North African runners. Biol. Sport 2013, 30, 181–187. [Google Scholar] [CrossRef]
  8. Santos-Concejero, J.; Tam, N.; Granados, C.; Irazusta, J.; Bidaurrazaga-Letona, I.; Zabala-Lili, J.; Gil, S.M. Interaction effects of stride angle and strike pattern on running economy. Int. J. Sports Med. 2014, 35, 1118–1123. [Google Scholar] [CrossRef]
  9. Morin, J.; Samozino, P.; Zameziati, K.; Belli, A. Effects of altered stride frequency and contact time on leg-spring behaviour in human running. J. Biomech. 2007, 40, 3341–3348. [Google Scholar] [CrossRef]
  10. Taunton, J.E.; Ryan, M.B.; Clement, D.B.; McKenzie, D.C.; Lloyd-Smith, D.R.; Zumbo, B.D. A retrospective case-control analysis of 2002 running injuries. Br. J. Sports Med. 2002, 36, 95–101. [Google Scholar] [CrossRef] [PubMed]
  11. Sakaguchi, M.; Ogawa, H.; Shimizu, N.; Kanehisa, H.; Yanai, T.; Kawakami, Y. Gender differences in hip and ankle joint kinematics on knee abduction during running. Eur. J. Sport Sci. 2014, 14 (Suppl. S1), S302–S309. [Google Scholar] [CrossRef] [PubMed]
  12. Roche-Seruendoa, L.E.; Latorre-Románb, P.Á.; Soto-Hermosoc, V.M.; García-Pinillosd, F. Do sex and body structure influence spatiotemporal step characteristics in endurance runners? Sci. Sports 2019, 34, 412.e1–412.e9. [Google Scholar] [CrossRef]
  13. García-Pinillos, F.; Jerez-Mayorga, D.; Latorre-Román, P.Á.; Ramirez-Campillo, R.; Sanz-López, F.; Roche-Seruendo, L.E. How do Amateur Endurance Runners Alter Spatiotemporal Parameters and Step Variability as Running Velocity Increases? A Sex Comparison. J. Hum. Kinet. 2020, 72, 39–49. [Google Scholar] [CrossRef]
  14. Radzak, K.N.; Putnam, A.M.; Tamura, K.; Hetzler, R.K.; Stickley, C.D. Asymmetry between lower limbs during rested and fatigued state running gait in healthy individuals. Gait Posture 2017, 51, 268–274. [Google Scholar] [CrossRef]
  15. Exell, T.A.; Gittoes, M.J.R.; Irwin, G.; Kerwin, D.G. Gait asymmetry: Composite scores for mechanical analyses of sprint running. J. Biomech. 2012, 45, 1108–1111. [Google Scholar] [CrossRef]
  16. Zifchock, R.A.; Davis, I.; Hamill, J. Kinetic asymmetry in female runners with and without retrospective tibial stress fractures. J. Biomech. 2006, 39, 2792–2797. [Google Scholar] [CrossRef]
  17. Mukaka, M. A guide to appropriate use of correlation coefficient in medical research. Malawi. Med. J. 2012, 24, 69–71. [Google Scholar]
  18. Cavanagh, P.; Williams, K. The effect of stride length variation on oxygen uptake during distance running. Med. Sci. Sport Exerc. 1982, 14, 30–35. [Google Scholar] [CrossRef] [PubMed]
  19. García-Pinillos, F.; García-Ramos, A.; Ramírez-Campillo, R.; Latorre-Román, P.A.; Roche-Seruendo, L.E. How Do Spatiotemporal Parameters and Lower-Body Stiffness Change with Increased Running Velocity? A Comparison Between Novice and Elite Level Runners. J. Hum. Kinet. 2019, 30, 25–38. [Google Scholar] [CrossRef] [PubMed]
  20. Farley, C.T.; González, O. Leg stiffness and stride frequency in human running. J. Biomech. 1996, 29, 181–186. [Google Scholar] [CrossRef] [PubMed]
  21. Folland, J.; Allen, S.; Black, M.; Handsaker, J. Running technique is an important component of running economy and performance. Med. Sci. Sports Exerc. 2017, 49, 1412–1423. [Google Scholar] [CrossRef]
  22. Hunter, J.P.; Marshall, R.N.; Mcnair, P.J. Interaction of step length and step rate during sprint running. Med. Sci. Sports Exerc. 2004, 36, 261–271. [Google Scholar] [CrossRef]
  23. Gómez-Molina, J.; Ogueta-Alday, A.; Stickley, C.; Cámara, J.; Cabrejas-Ugartondo, J.; García-López, J. Differences in Spatiotemporal Parameters Between Trained Runners and Untrained Participants. J. Strength Cond. Res. 2017, 31, 2169–2175. [Google Scholar] [CrossRef] [PubMed]
  24. Derrick, T.J.; Hamill, J.; Caldwell, G.E. Energy absorption of impacts during running at various stride lengths. Med. Sci. Sport Exerc. 1998, 30, 128–135. [Google Scholar] [CrossRef] [PubMed]
  25. Harrast, M. Clinical Care of the Runner, 1st ed.; Elsevier: Berkeley, CA, USA, 2020; Volume 8, p. 75. [Google Scholar]
  26. Boyer, K.A.; Silvernail, J.F.; Hamill, J. The role of running mileage on coordination patterns in running. J. Appl. Biomech. 2014, 30, 649–654. [Google Scholar] [CrossRef] [PubMed]
  27. Fellin, R.; Rose, W.; Royer, T.; Davis, I. Comparison of methods for kinematic identification of footstrike and toe-off during overground and treadmill running. J. Sci. Med. Sport 2010, 13, 646–650. [Google Scholar] [CrossRef] [PubMed]
  28. Fellin, R.; Davis, I. Transfer of gait retraining effects from treadmill to overground running. Med. Sci. Sports Exerc. 2011, 43, 427–428. [Google Scholar] [CrossRef]
  29. Riley, P.; Dicharry, J.; Franz, J.; Croce, U.D.; Wilder, R.P.; Kerrigan, D.C. A kinematics and kinetic comparison of overground and treadmill running. Med. Sci. Sports Exerc. 2008, 40, 1093–1100. [Google Scholar] [CrossRef]
  30. Fellin, R.; Manal, K.; Davis, I. Comparison of lower extremity kinematic curves during overground and treadmill running. J. Appl. Biomech. 2010, 26, 407–414. [Google Scholar] [CrossRef]
  31. Noehren, B.; Scholz, J.; Davis, I. The effect of real-time gait retraining on hip kinematics, pain and function in subjects with patellofemoral pain syndrome. Br. J. Sports Med. 2011, 45, 691–696. [Google Scholar] [CrossRef]
  32. Stiffler-Joachim, M.R.; Wille, C.M.; Kliethermes, S.A.; Johnston, W.; Heiderscheit, B.C. Foot Angle and Loading Rate during Running Demonstrate a Nonlinear Relationship. Med. Sci. Sports Exerc. 2019, 51, 2067–2072. [Google Scholar] [CrossRef]
Figure 1. The definitions of step angle in running.
Applsci 14 01059 g001
Figure 2. Marker placement in lower limb model.
Applsci 14 01059 g002
Figure 3. The metronome application—Pro Metronome (a) and Voombox portable Bluetooth speaker (b).
Applsci 14 01059 g003
Table 1. Detailed demographic data for participants and experimental conditions.
NMeanStd.
Deviation
MinMaxp
Age (years)male1141.098.8730580.359
female945.4411.812659
Height (m)male111.790.051.7251.907<0.001 *
female91.650.091.5331.815
Weight (kg)male1178.659.6062.095.00.002 *
female963.409.3746.678.2
BMI (kg/m2)male1124.402.1220.4827.460.215
female923.291.6219.8325.62
Weekly distance (km)male1140.0922.2215960.035 *
female924.2214.321548
Running speed (m/s)male113.010.452.503.880.02 *
female92.250.461.642.77
Note: A t-test was used if the data had a normal distribution; otherwise, a non-parametric test was applied. * p < 0.05. BMI: body mass index.
Table 2. Comparison of various parameters between three step rates on left and right sides, respectively.
ParameterMeanStd. Error95% Confidence Interval
SR (Step/Min) Lower BoundUpper BoundNotep
PSR164.2831.529161.07167.496PSR vs. >10%<0.001 *
10% > PSR180.7221.689177.175184.27PSR vs. <10%<0.001 *
10% < PSR147.8991.389144.98150.818<10% vs. >10% <0.001 *
SL Left (m)
PSR1.1690.0501.0641.274PSR vs. >10%<0.001 *
10% > PSR1.0400.0480.9391.141PSR vs. <10%0.011 *
10% < PSR1.2550.0511.1481.362<10% vs. >10% <0.001 *
SH Left (m)
PSR0.2240.0160.1910.258PSR vs. >10%1
10% > PSR0.2430.0190.2030.283PSR vs. <10%0.413
10% < PSR0.2380.0170.2030.272<10% vs. >10% 1
SA Left (deg)
PSR37.11.20134.57639.623PSR vs. >10%0.026 *
10% > PSR42.2421.89438.26446.22>10% vs. <10%0.15
10% < PSR36.7841.60333.41740.151<10% vs. PSR 1
SL Right (m)
PSR1.1420.0511.0361.248PSR vs. >10%0.07 *
10% > PSR1.0660.0510.9581.174PSR vs. <10%<0.001 *
10% < PSR1.2810.0441.1881.374<10% vs. >10% <0.001 *
SH Right (m)
PSR0.2240.0170.1880.260PSR vs. >10%0.840
10% > PSR0.2460.0190.2060.286PSR vs. <10%0.187
10% < PSR0.2400.0170.2040.276<10% vs. >10% 1.000
SA Right (deg)
PSR37.5761.17335.11140.042PSR vs. >10%0.087
10% > PSR41.9681.85638.06945.867>10% vs. <10%0.050
10% < PSR36.3271.42933.32439.33<10% vs. PSR 0.593
Note: A general linear model for repeated measures was used in comparison, with SR serving as the main within-subject factor and gender as the interactive between-subject factor. Adjustment for multiple comparisons: Bonferroni. PSR: preferred step rate, SL: step length, SA: step angle, SH: max height of foot during step. * p < 0.05. These notes are also applied to the following tables.
Table 3. Comparison of step rates and angles between gender.
Step Rate (Step/Min)MeanStd.
Error
95% Confidence
Interval
Lower BoundUpper Boundp
PSRmale165.942.07161.57170.310.293
female162.522.30157.66167.37
>10% PSRmale182.572.28177.77187.370.287
female178.752.53173.42184.08
<10% PSRmale149.351.88145.37153.320.313
female146.362.09141.94150.77
Step Angle Left (degree)
PSRmale36.601.6833.0540.150.711
female37.571.8733.6341.50
>10% PSRmale41.212.6635.5946.830.616
female43.292.9637.0549.54
<10% PSRmale35.892.2231.2040.570.618
female37.612.4732.4042.82
Step Angle Right (degree)
PSRmale37.271.6233.8540.700.827
female37.821.8034.0241.63
>10% PSRmale41.482.6135.9746.980.802
female42.492.9036.3848.60
<10% PSRmale35.852.0031.6340.080.777
female36.762.2232.0741.45
Note. A general linear model for multivariate was used. Gender was the main factor, and the covariates appearing in the model are evaluated at the following values: BMI = 23.9020. PSR: preferred step rate.
Table 4. Comparison of step lengths and heights between gender in three step rates.
SL Left (m)MeanStd.
Error
95% Confidence
Interval
Lower BoundUpper Boundp
PSRmale1.360.091.181.540.023 *
female0.980.100.771.19
>10% PSRmale1.200.081.021.370.054
female0.890.100.681.09
<10% PSRmale1.460.091.271.650.018 *
female1.040.100.831.26
SH Left (m)
PSRmale0.250.030.200.310.255
female0.200.030.130.26
>10% PSRmale0.230.030.170.290.531
female0.260.030.190.33
<10% PSRmale0.260.030.200.320.471
female0.220.030.150.29
SL Right (m)
PSRmale1.330.091.151.510.028 *
female0.960.100.751.17
>10% PSRmale1.180.090.991.360.200
female0.960.100.751.18
<10% PSRmale1.490.071.331.650.006 *
female1.070.090.881.25
SH Right (m)
PSRmale0.260.030.200.320.175
female0.190.030.120.26
>10% PSRmale0.240.030.180.300.599
female0.260.030.190.33
<10% PSRmale0.270.030.210.330.271
female0.210.030.140.28
Note. A general linear model for multivariate was used with gender as the main factor, and the covariates appearing in the model are evaluated at the following values: body height (m) = 1.72670, body mass (kg) = 71.785. PSR: preferred step rate, SL: step length, SH: max height of foot during step. * p < 0.05.
Table 5. Correlation coefficients between the parameters on the left side.
Step RateSpeedLeft Step Length Left Step HeightLeft Step Angle
Step rate (step/min)Pearson Correlation10.257 *−0.0790.0470.141
Sig. (2-tailed) 0.0430.5430.7170.275
Speed (m/s)Pearson
Correlation
0.257 *10.901 **0.541 **−0.179
Sig. (2-tailed)0.043 0.0000.0000.164
Left step length (m)Pearson
Correlation
−0.0790.901 **10.622 **−0.180
Sig. (2-tailed)0.5430.000 0.0000.162
Left step height (m)Pearson
Correlation
0.0470.541 **0.622 **10.645 **
Sig. (2-tailed)0.7170.0000.000 0.000
Left step angle (deg)Pearson
Correlation
0.141−0.179−0.1800.645 **1
Sig. (2-tailed)0.2750.1640.1620.000
Note. *. Correlation is significant at the 0.05 level (2-tailed). **. Correlation is significant at the 0.01 level (2-tailed). The number of trials n = 62.
Table 6. Correlation coefficients between the parameters on the right side.
Step RateSpeedRight Step LengthRight Step HeightRight Step Angle
Step rate (step/min)Pearson
Correlation
10.257 *−0.1020.0400.160
Sig. (2-tailed) 0.0430.4300.7560.213
Speed (m)Pearson
Correlation
0.257 *10.883 **0.565 **−0.103
Sig. (2-tailed)0.043 0.0000.0000.425
Right step length (m)Pearson
Correlation
−0.1020.883 **10.660 **−0.105
Sig. (2-tailed)0.4300.000 0.0000.416
Right step height (m)Pearson
Correlation
0.0400.565 **0.660 **10.662 **
Sig. (2-tailed)0.7560.0000.000 0.000
Right step angle (deg)Pearson
Correlation
0.160−0.103−0.1050.662 **1
Sig. (2-tailed)0.2130.4250.4160.000
*. Correlation is significant at the 0.05 level (2-tailed). **. Correlation is significant at the 0.01 level (2-tailed). The number of trials: n = 62.
Table 7. Comparison of SL, SA, and SH between left and right sides.
PSRMenStd. Error95% Confidence Interval
Lower BoundUpper Boundp
SL (m)Left1.190.071.041.330.019 *
Right1.160.071.021.30
SA (deg)Left37.031.1934.5339.54
Right37.521.1535.1139.93
SH (m)Left0.230.020.190.27
Right0.230.020.190.27
>10%PSR
SLLeft1.060.060.931.18
Right1.080.060.951.21
SALeft42.151.9038.1746.13
Right41.931.8538.0645.81
SHLeft0.250.020.200.29
Right0.250.020.210.29
<10%PSR
SLLeft1.280.071.131.42
Right1.300.061.171.43
SALeft36.661.5833.3439.98
Right36.261.4233.2839.24
SHLeft0.240.020.200.28
Right0.240.020.200.28
Note. All pairs are p > 0.05 except for a pair of variables. Covariates appearing in the model are evaluated at the following values: BMI = 23.9020. * p < 0.05. PSR: preferred step rate, SL: step length, SA: step angle, SH: max height of foot during step.
Disclaimer/Publisher’s Note: The statements, opinions and data contained in all publications are solely those of the individual author(s) and contributor(s) and not of MDPI and/or the editor(s). MDPI and/or the editor(s) disclaim responsibility for any injury to people or property resulting from any ideas, methods, instructions or products referred to in the content.

