


Old Landslide Detection Using Optical Remote Sensing Images Based on Improved YOLOv8


 , ,
, ,
Abstract
1. Introduction
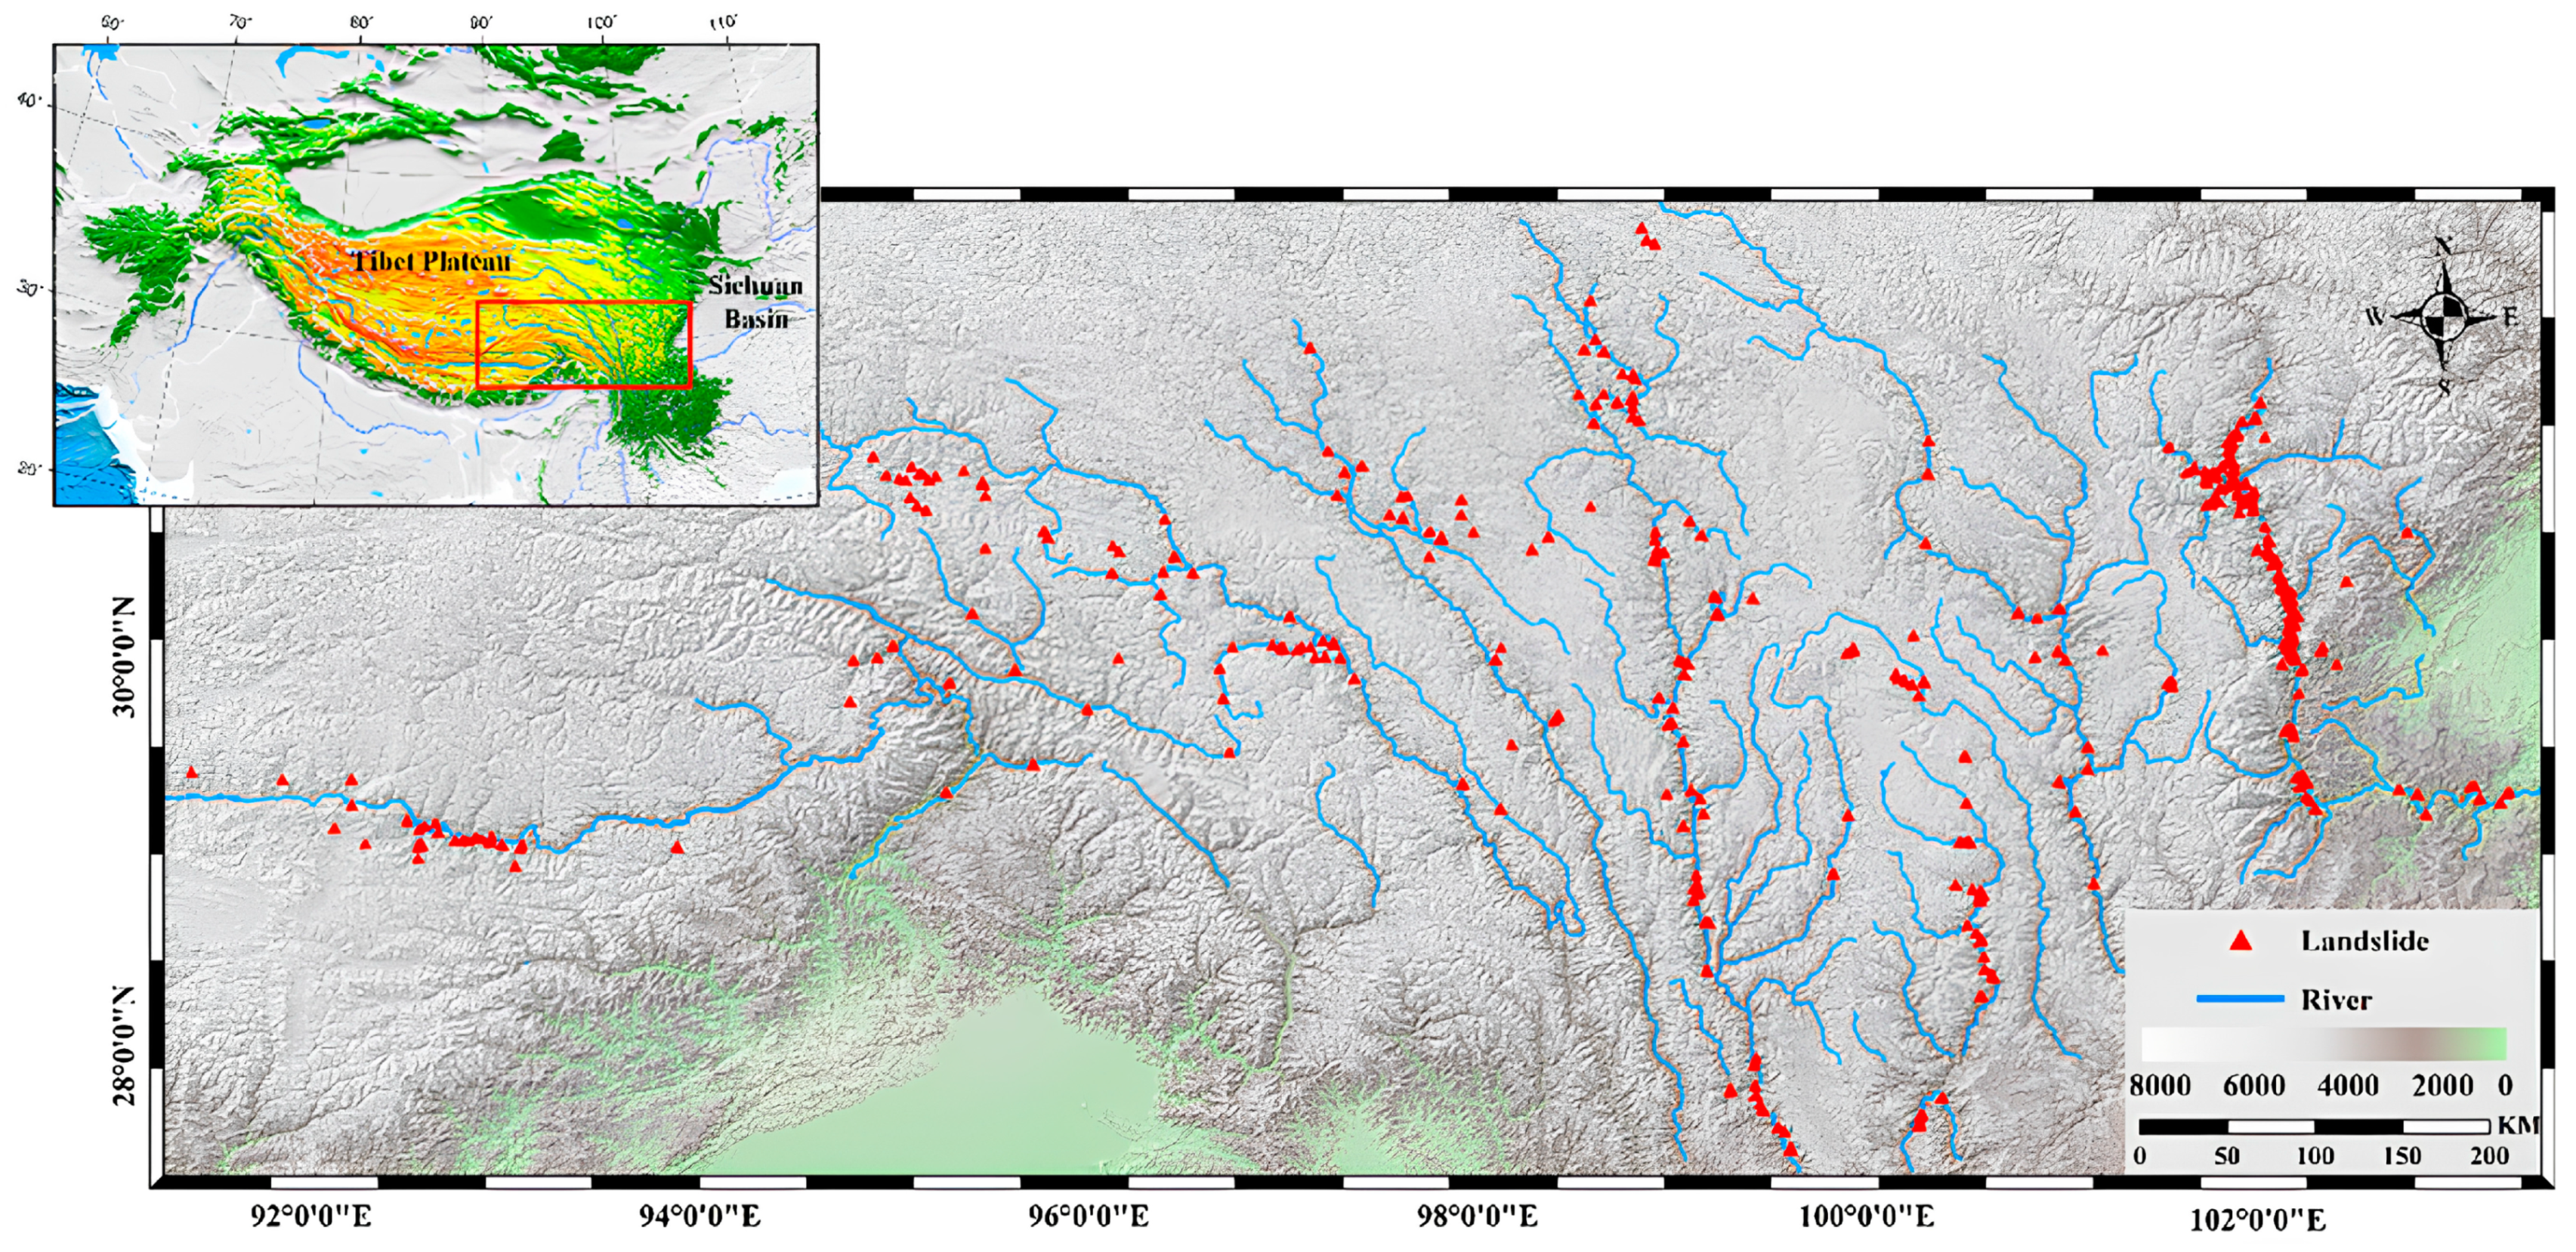
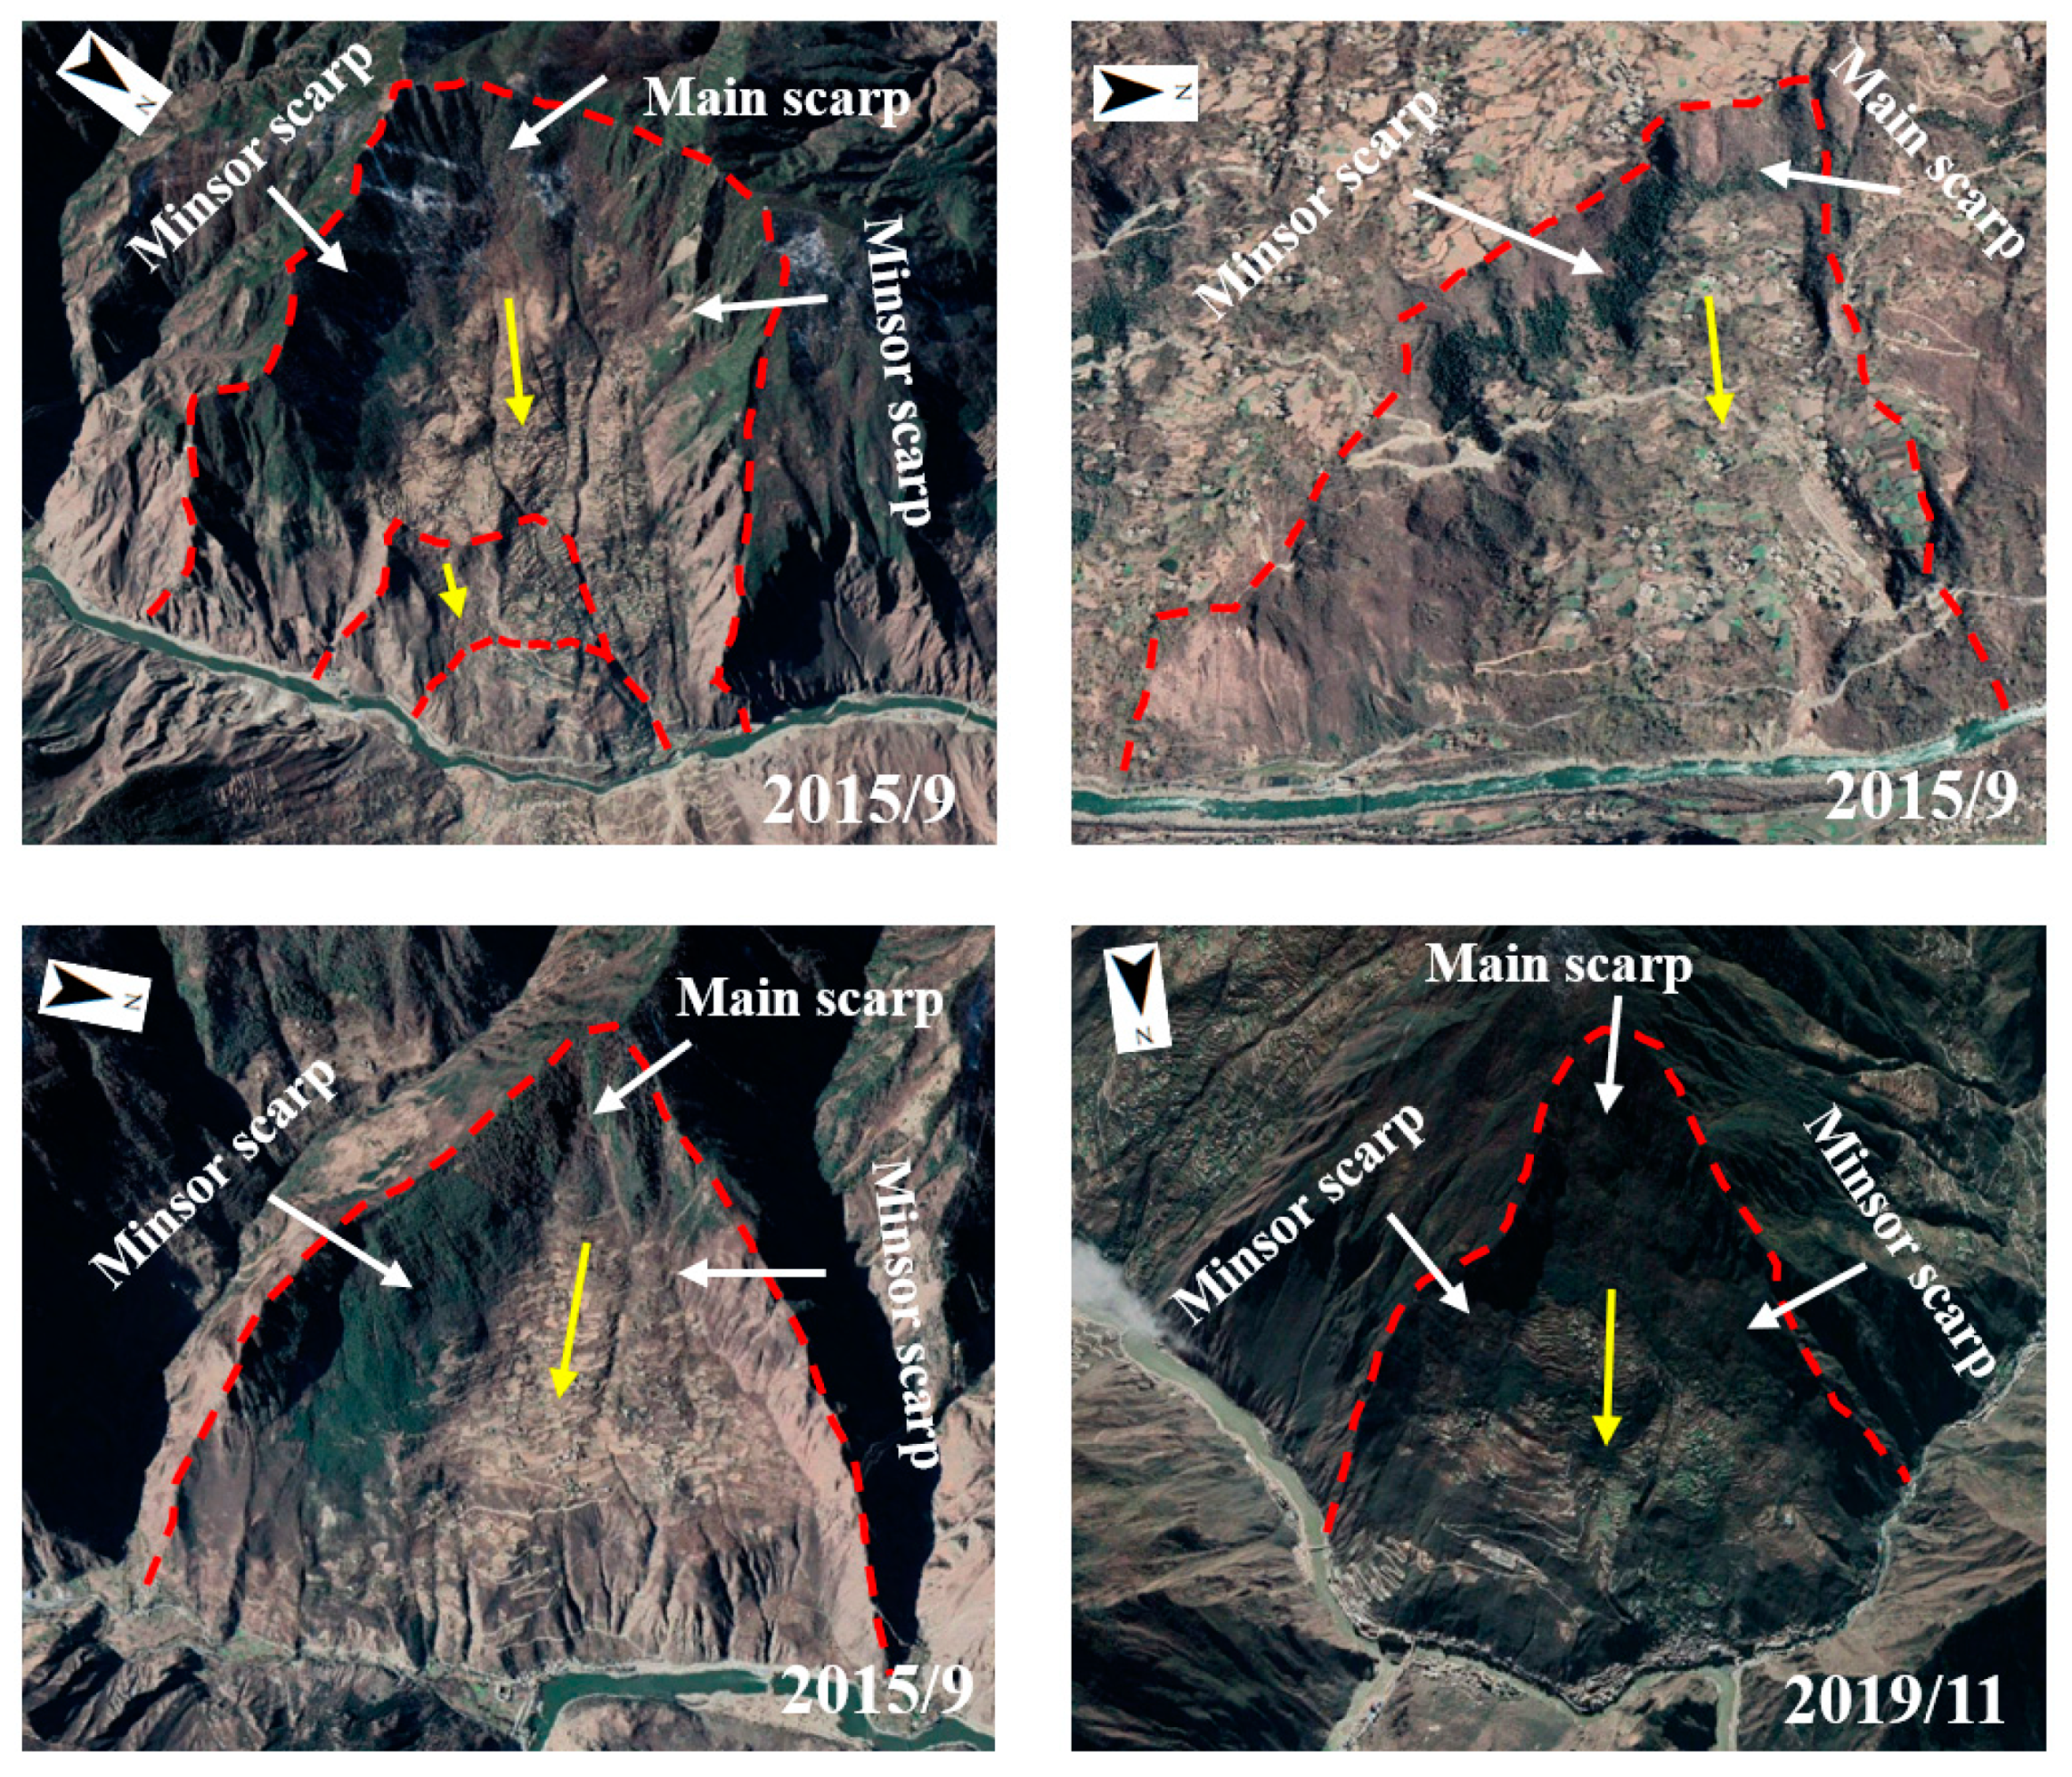
2. Study Area and Dataset
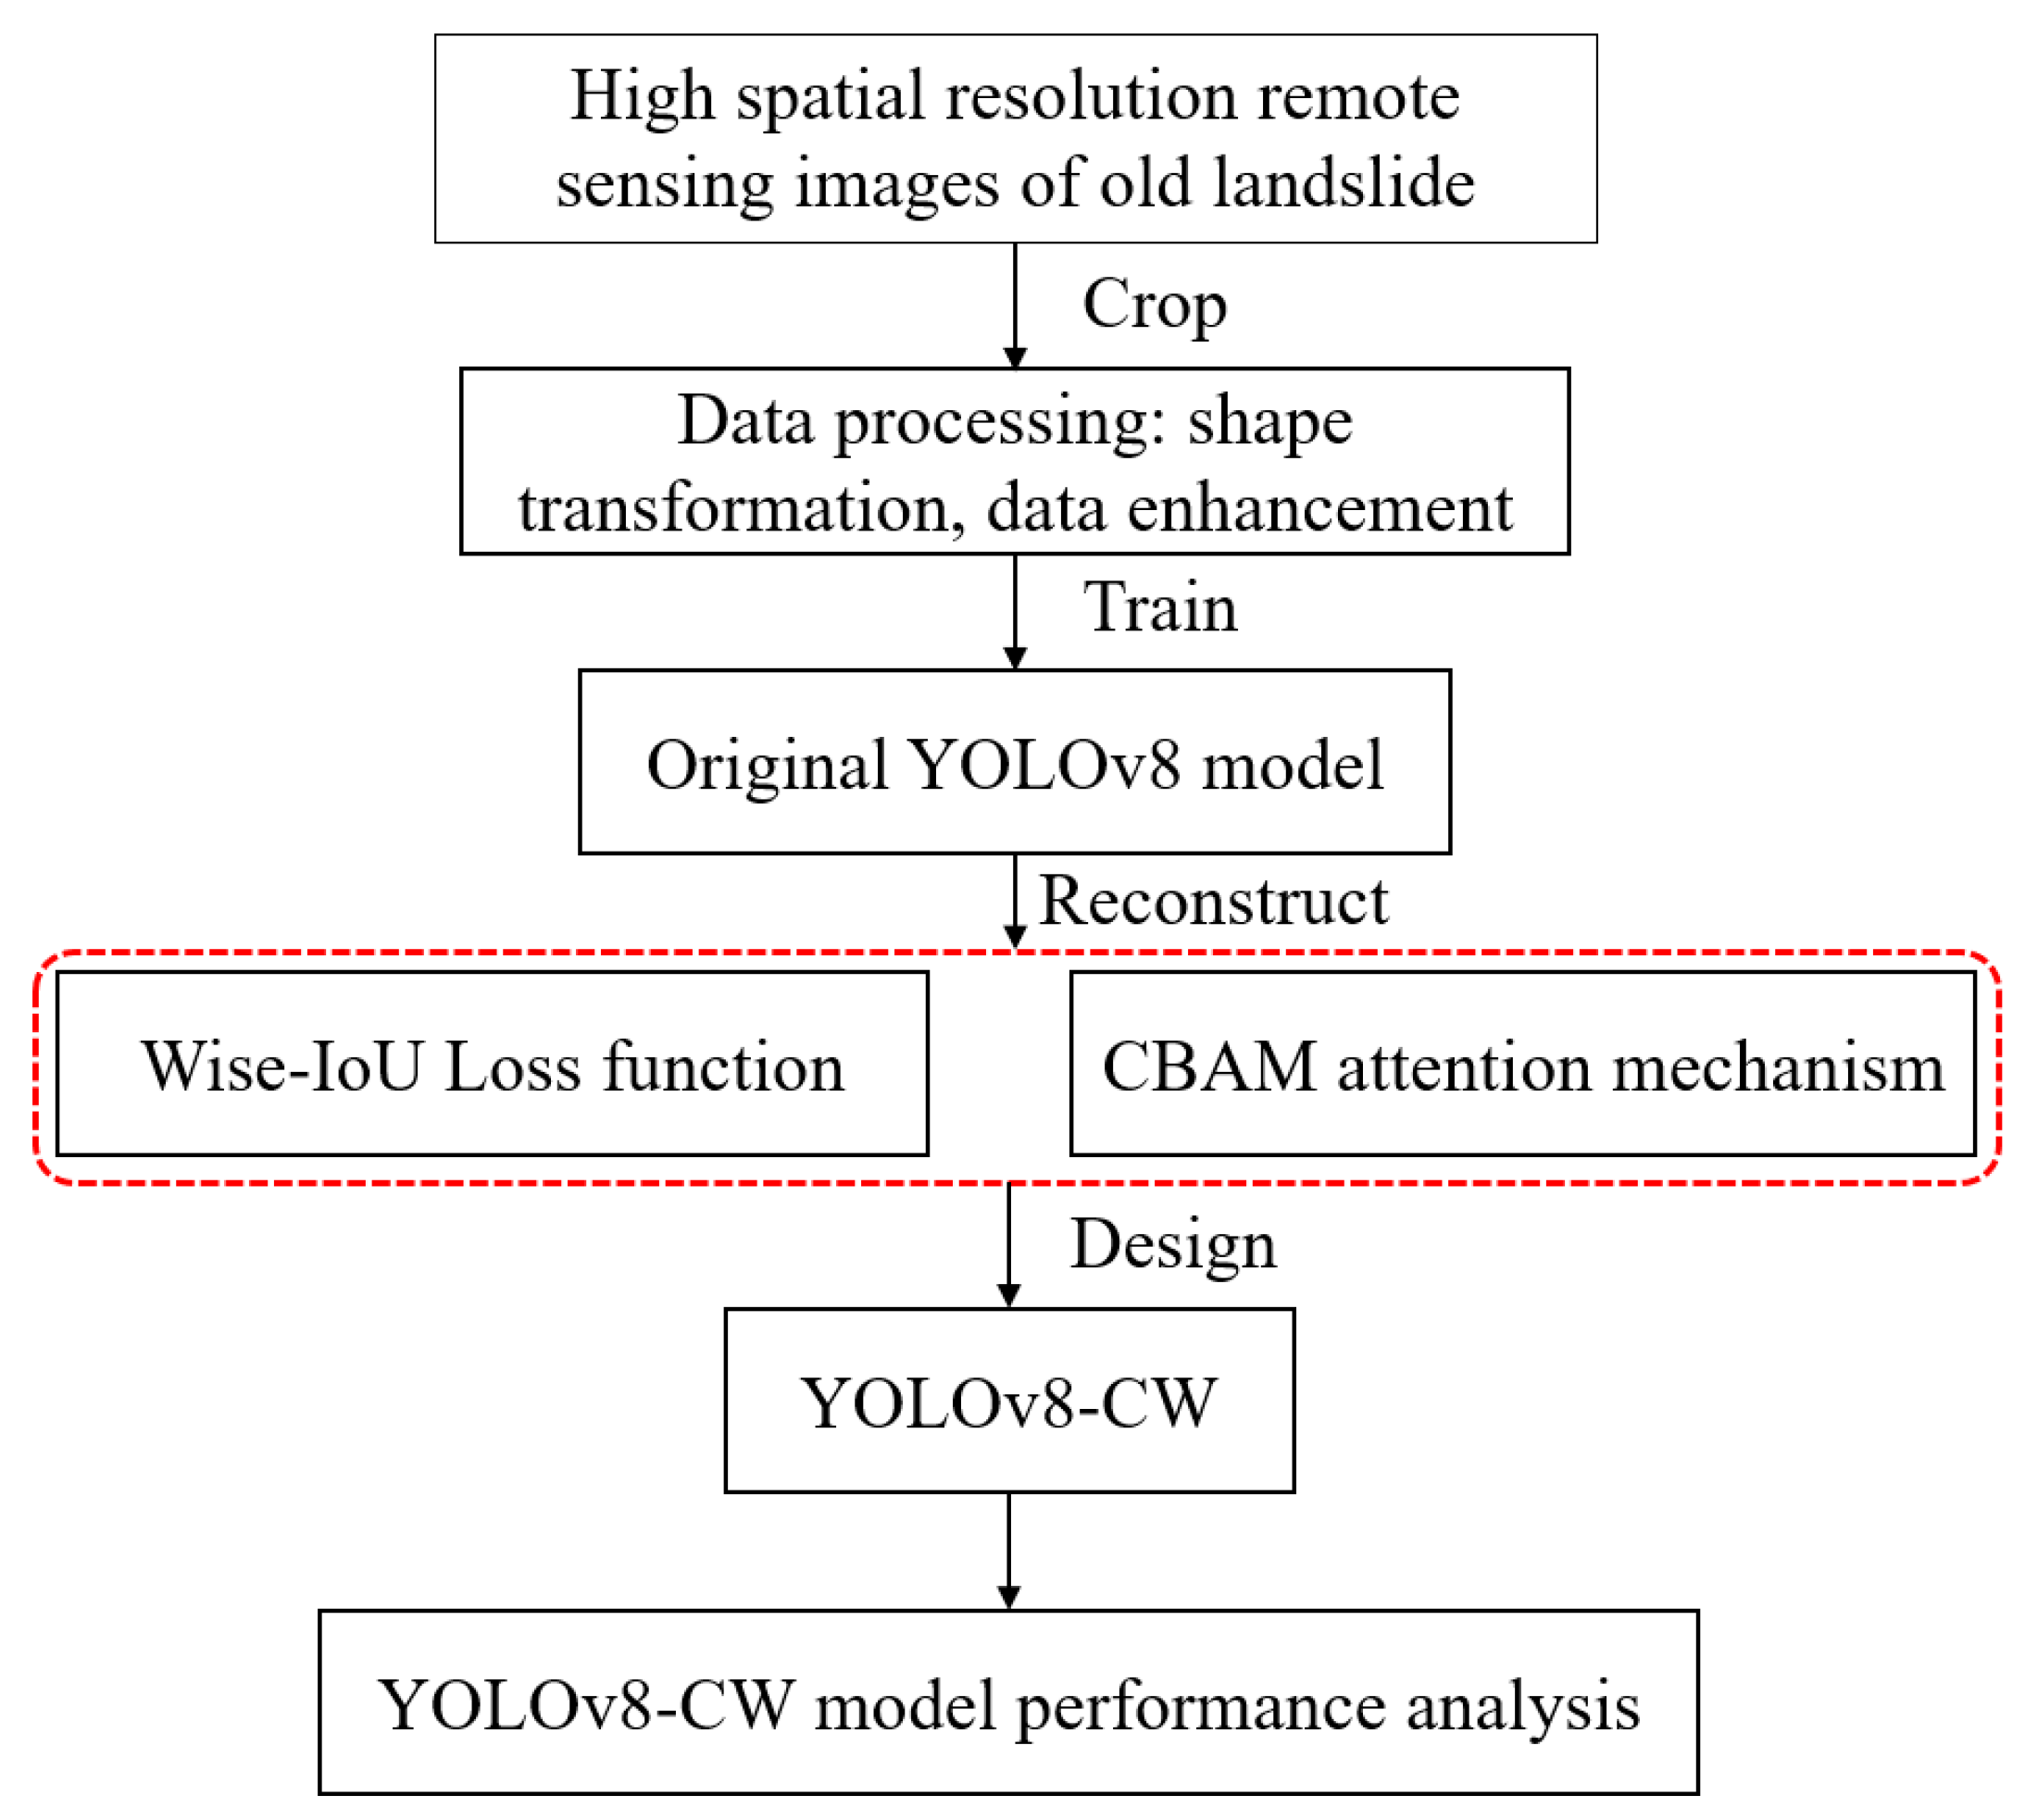
3. Method
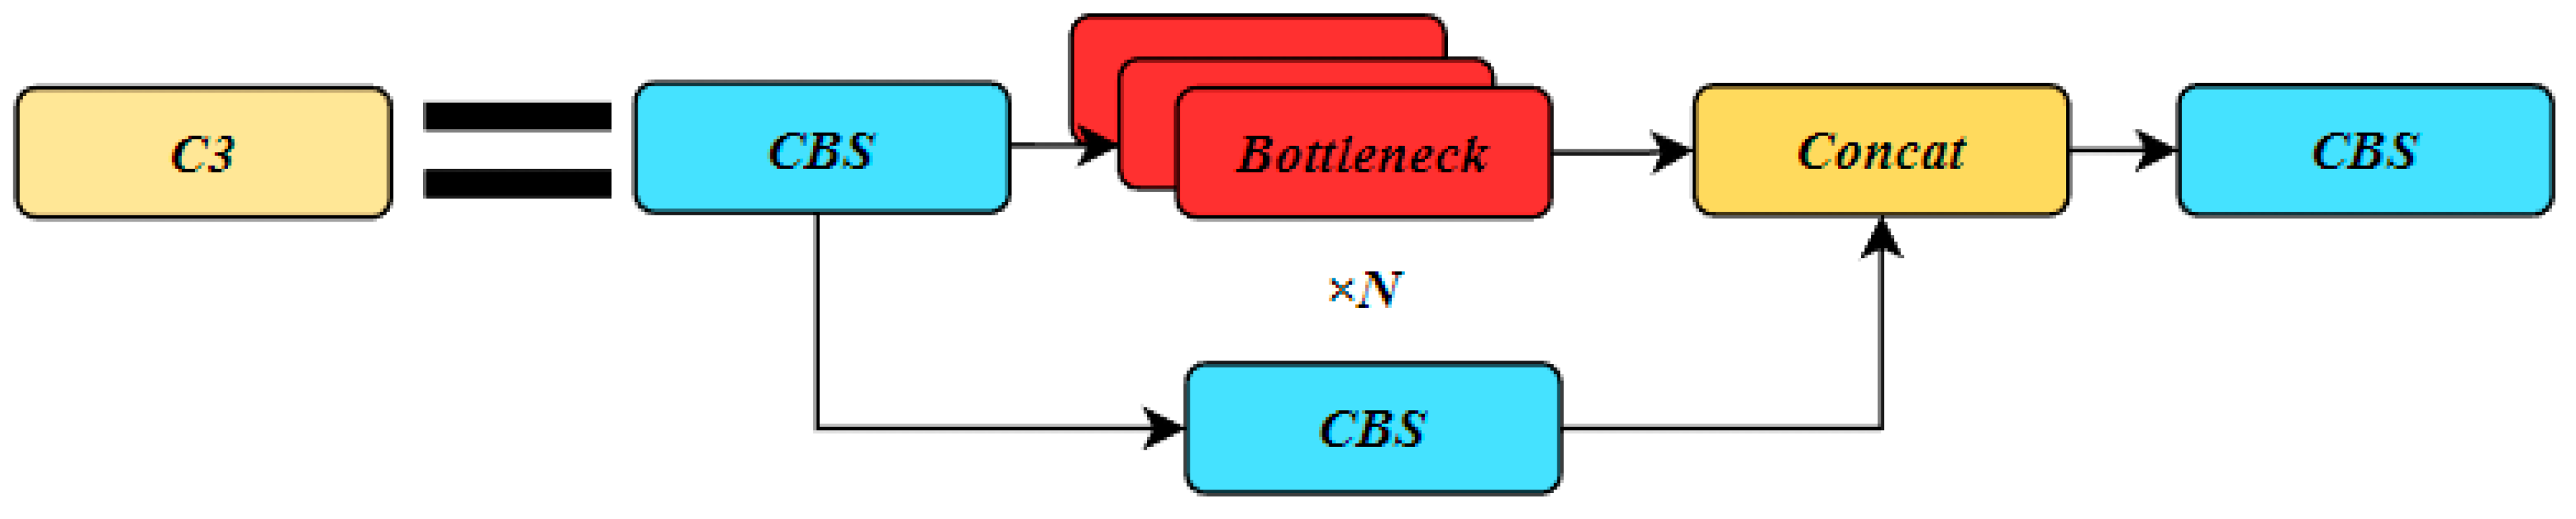
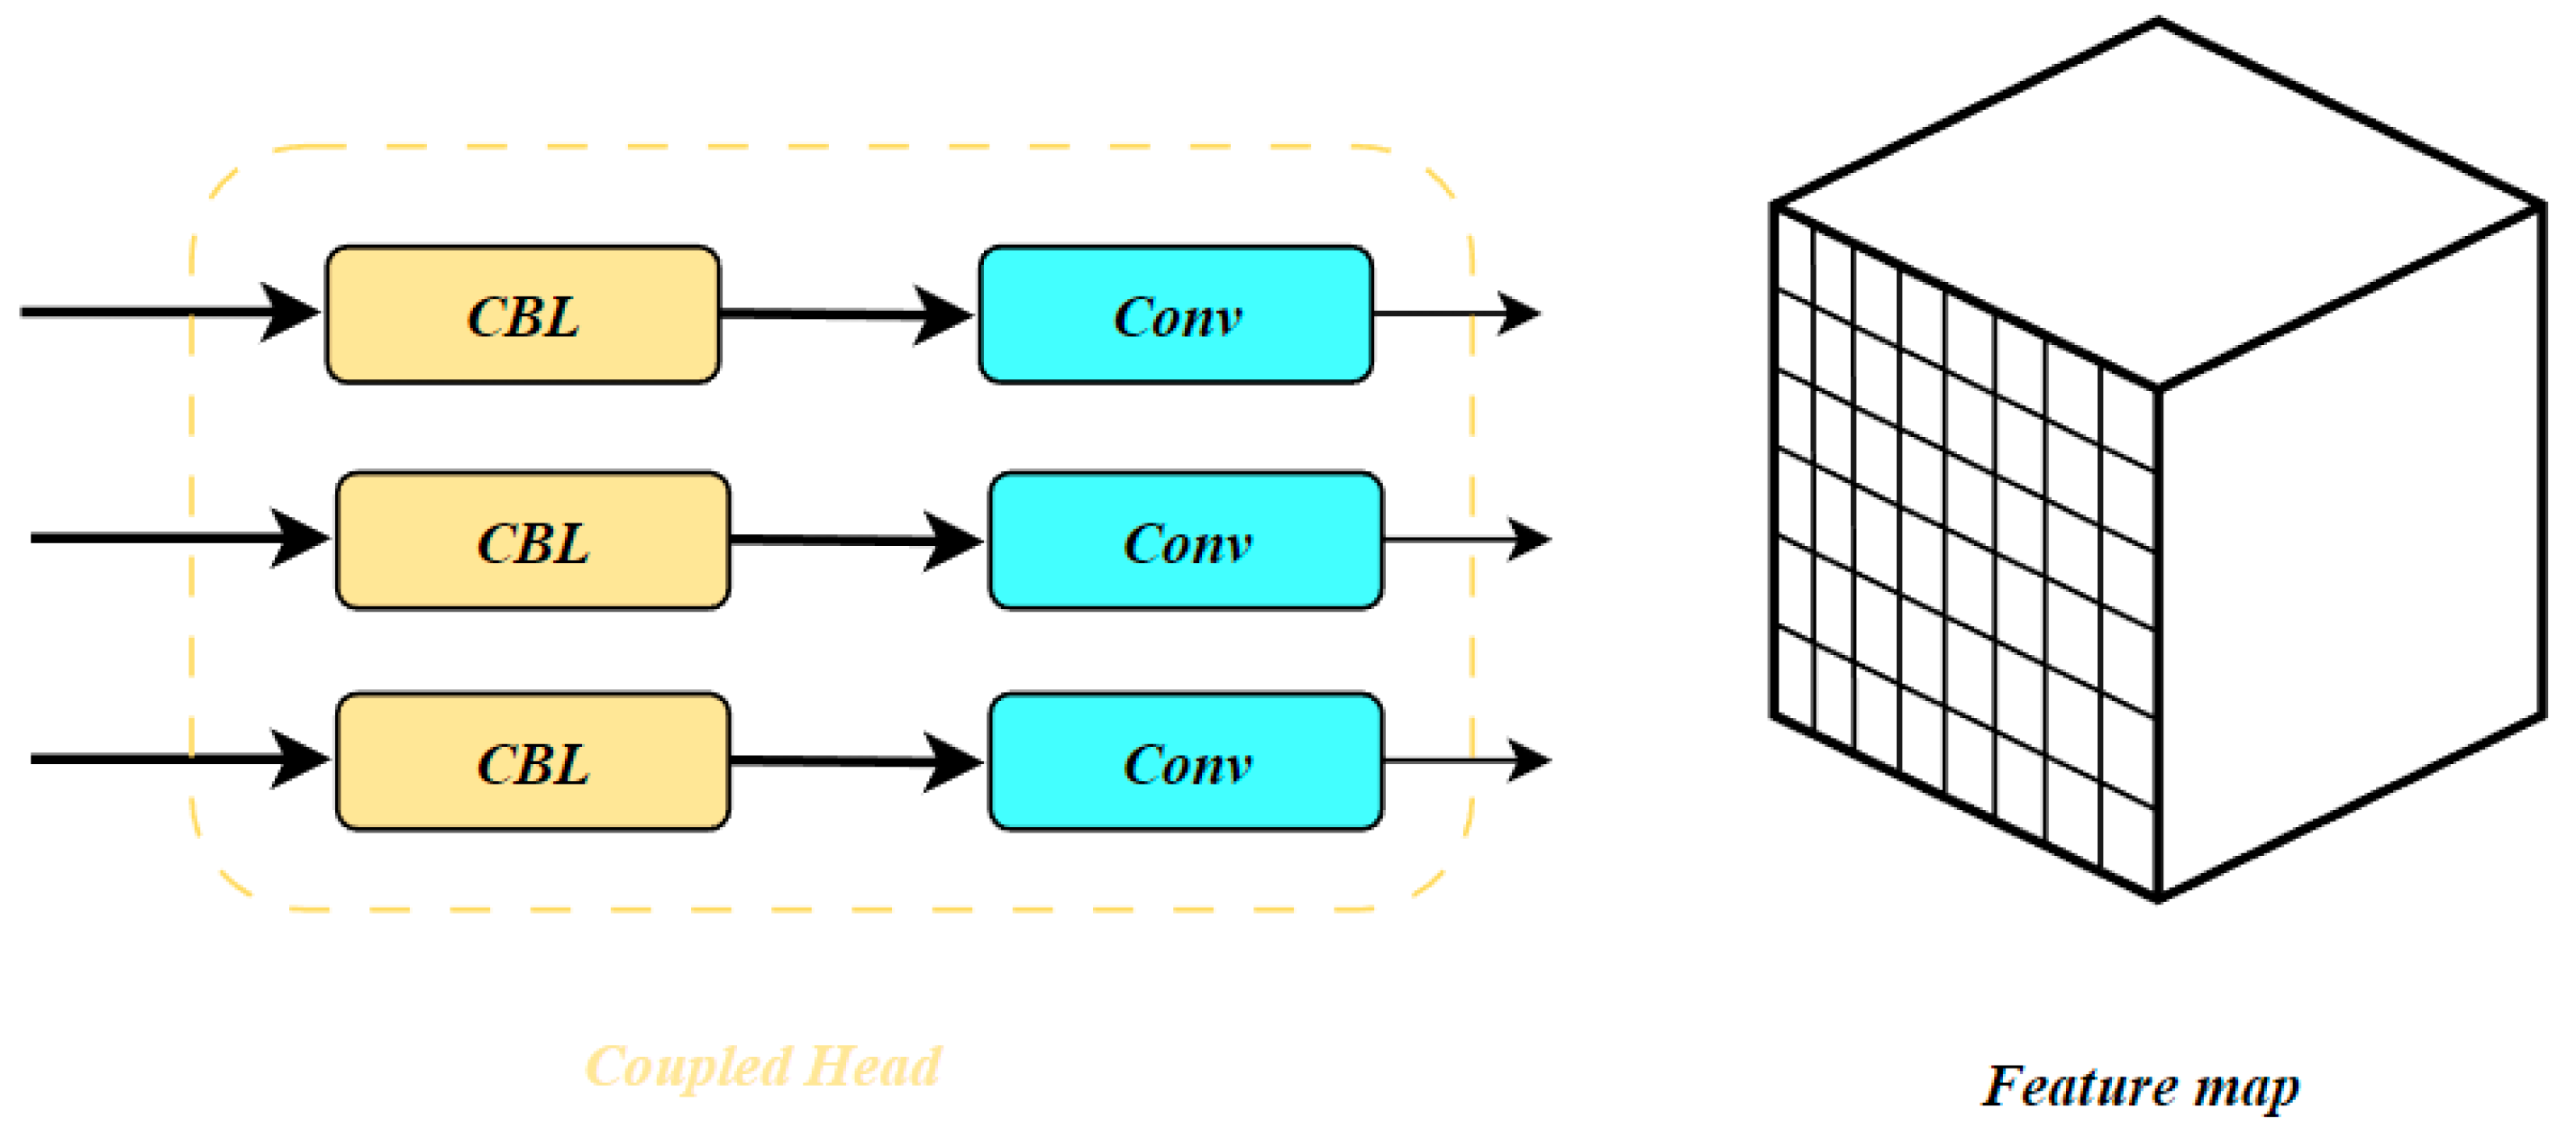
3.1. YOLOv8 Model
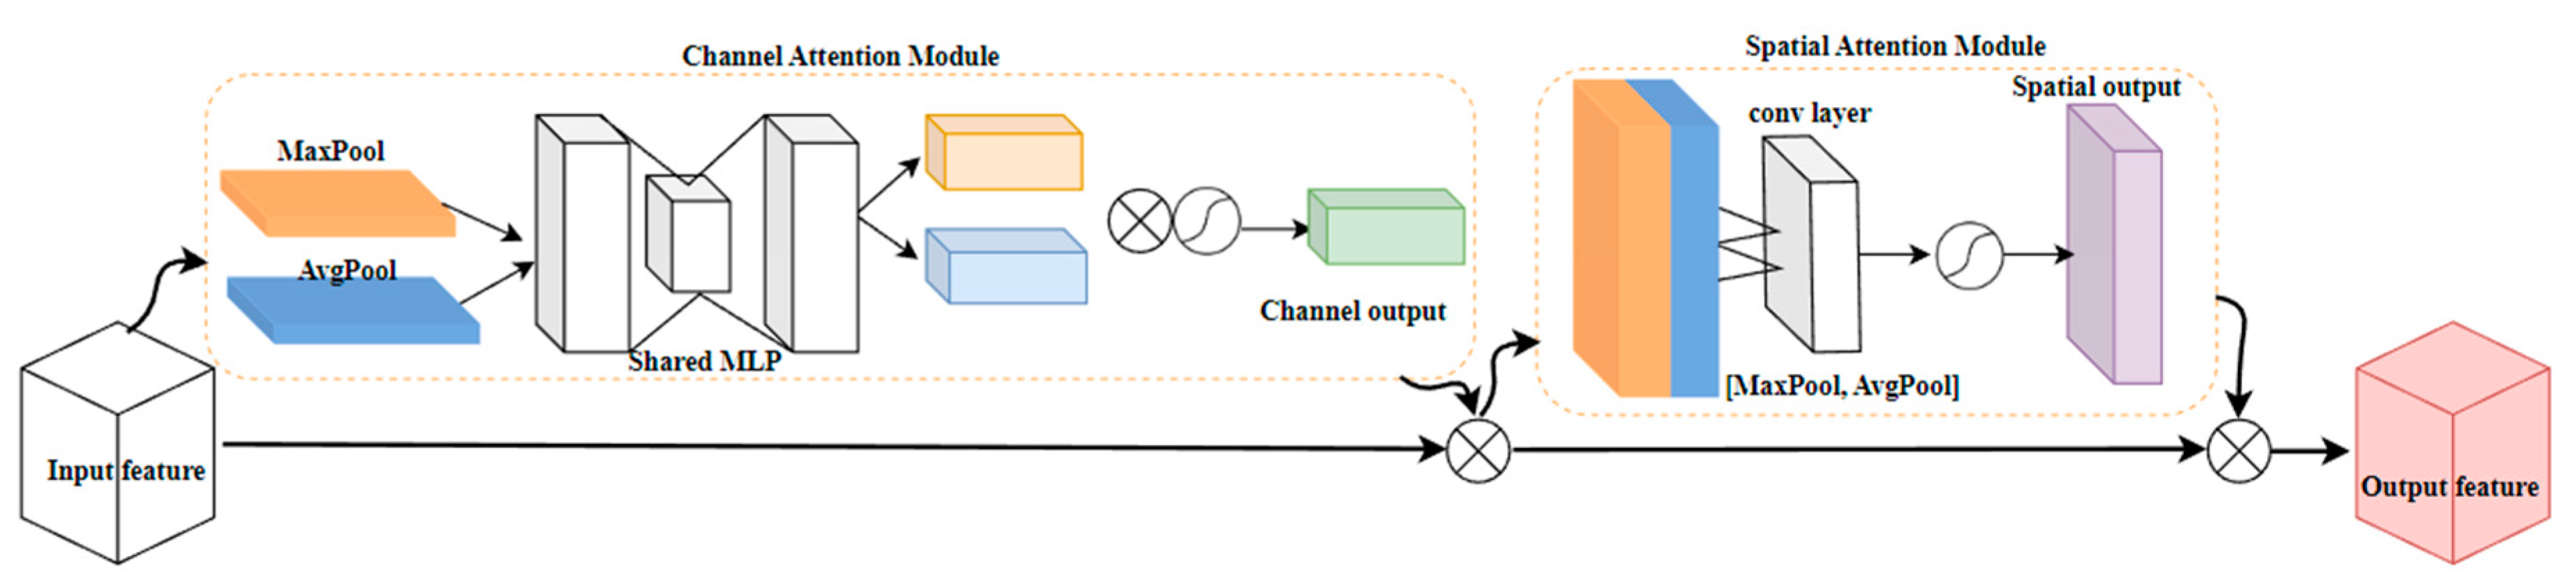
3.2. CBAM Attention Mechanisms
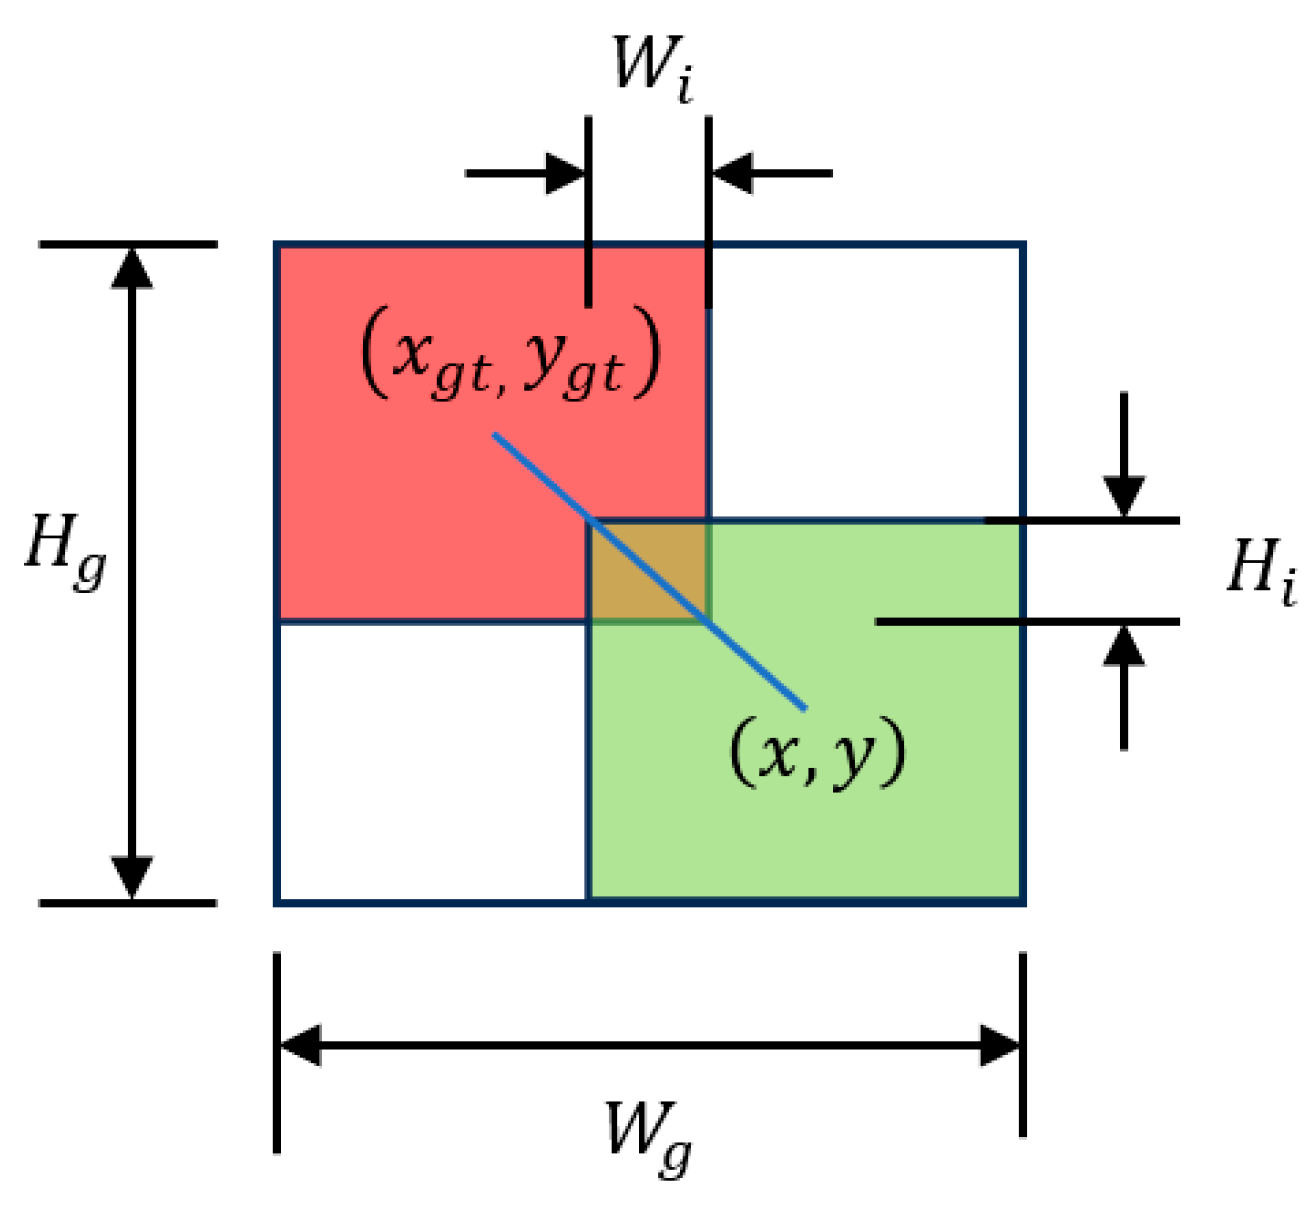
3.3. WIoU Loss Function
3.3.1. Wise-IoUv1
3.3.2. Wise-IoUv2
3.3.3. Wise-IoUv3
3.4. Model Evaluation Methods
4. Results
4.1. Experimental Setup
4.2. Model Assessment
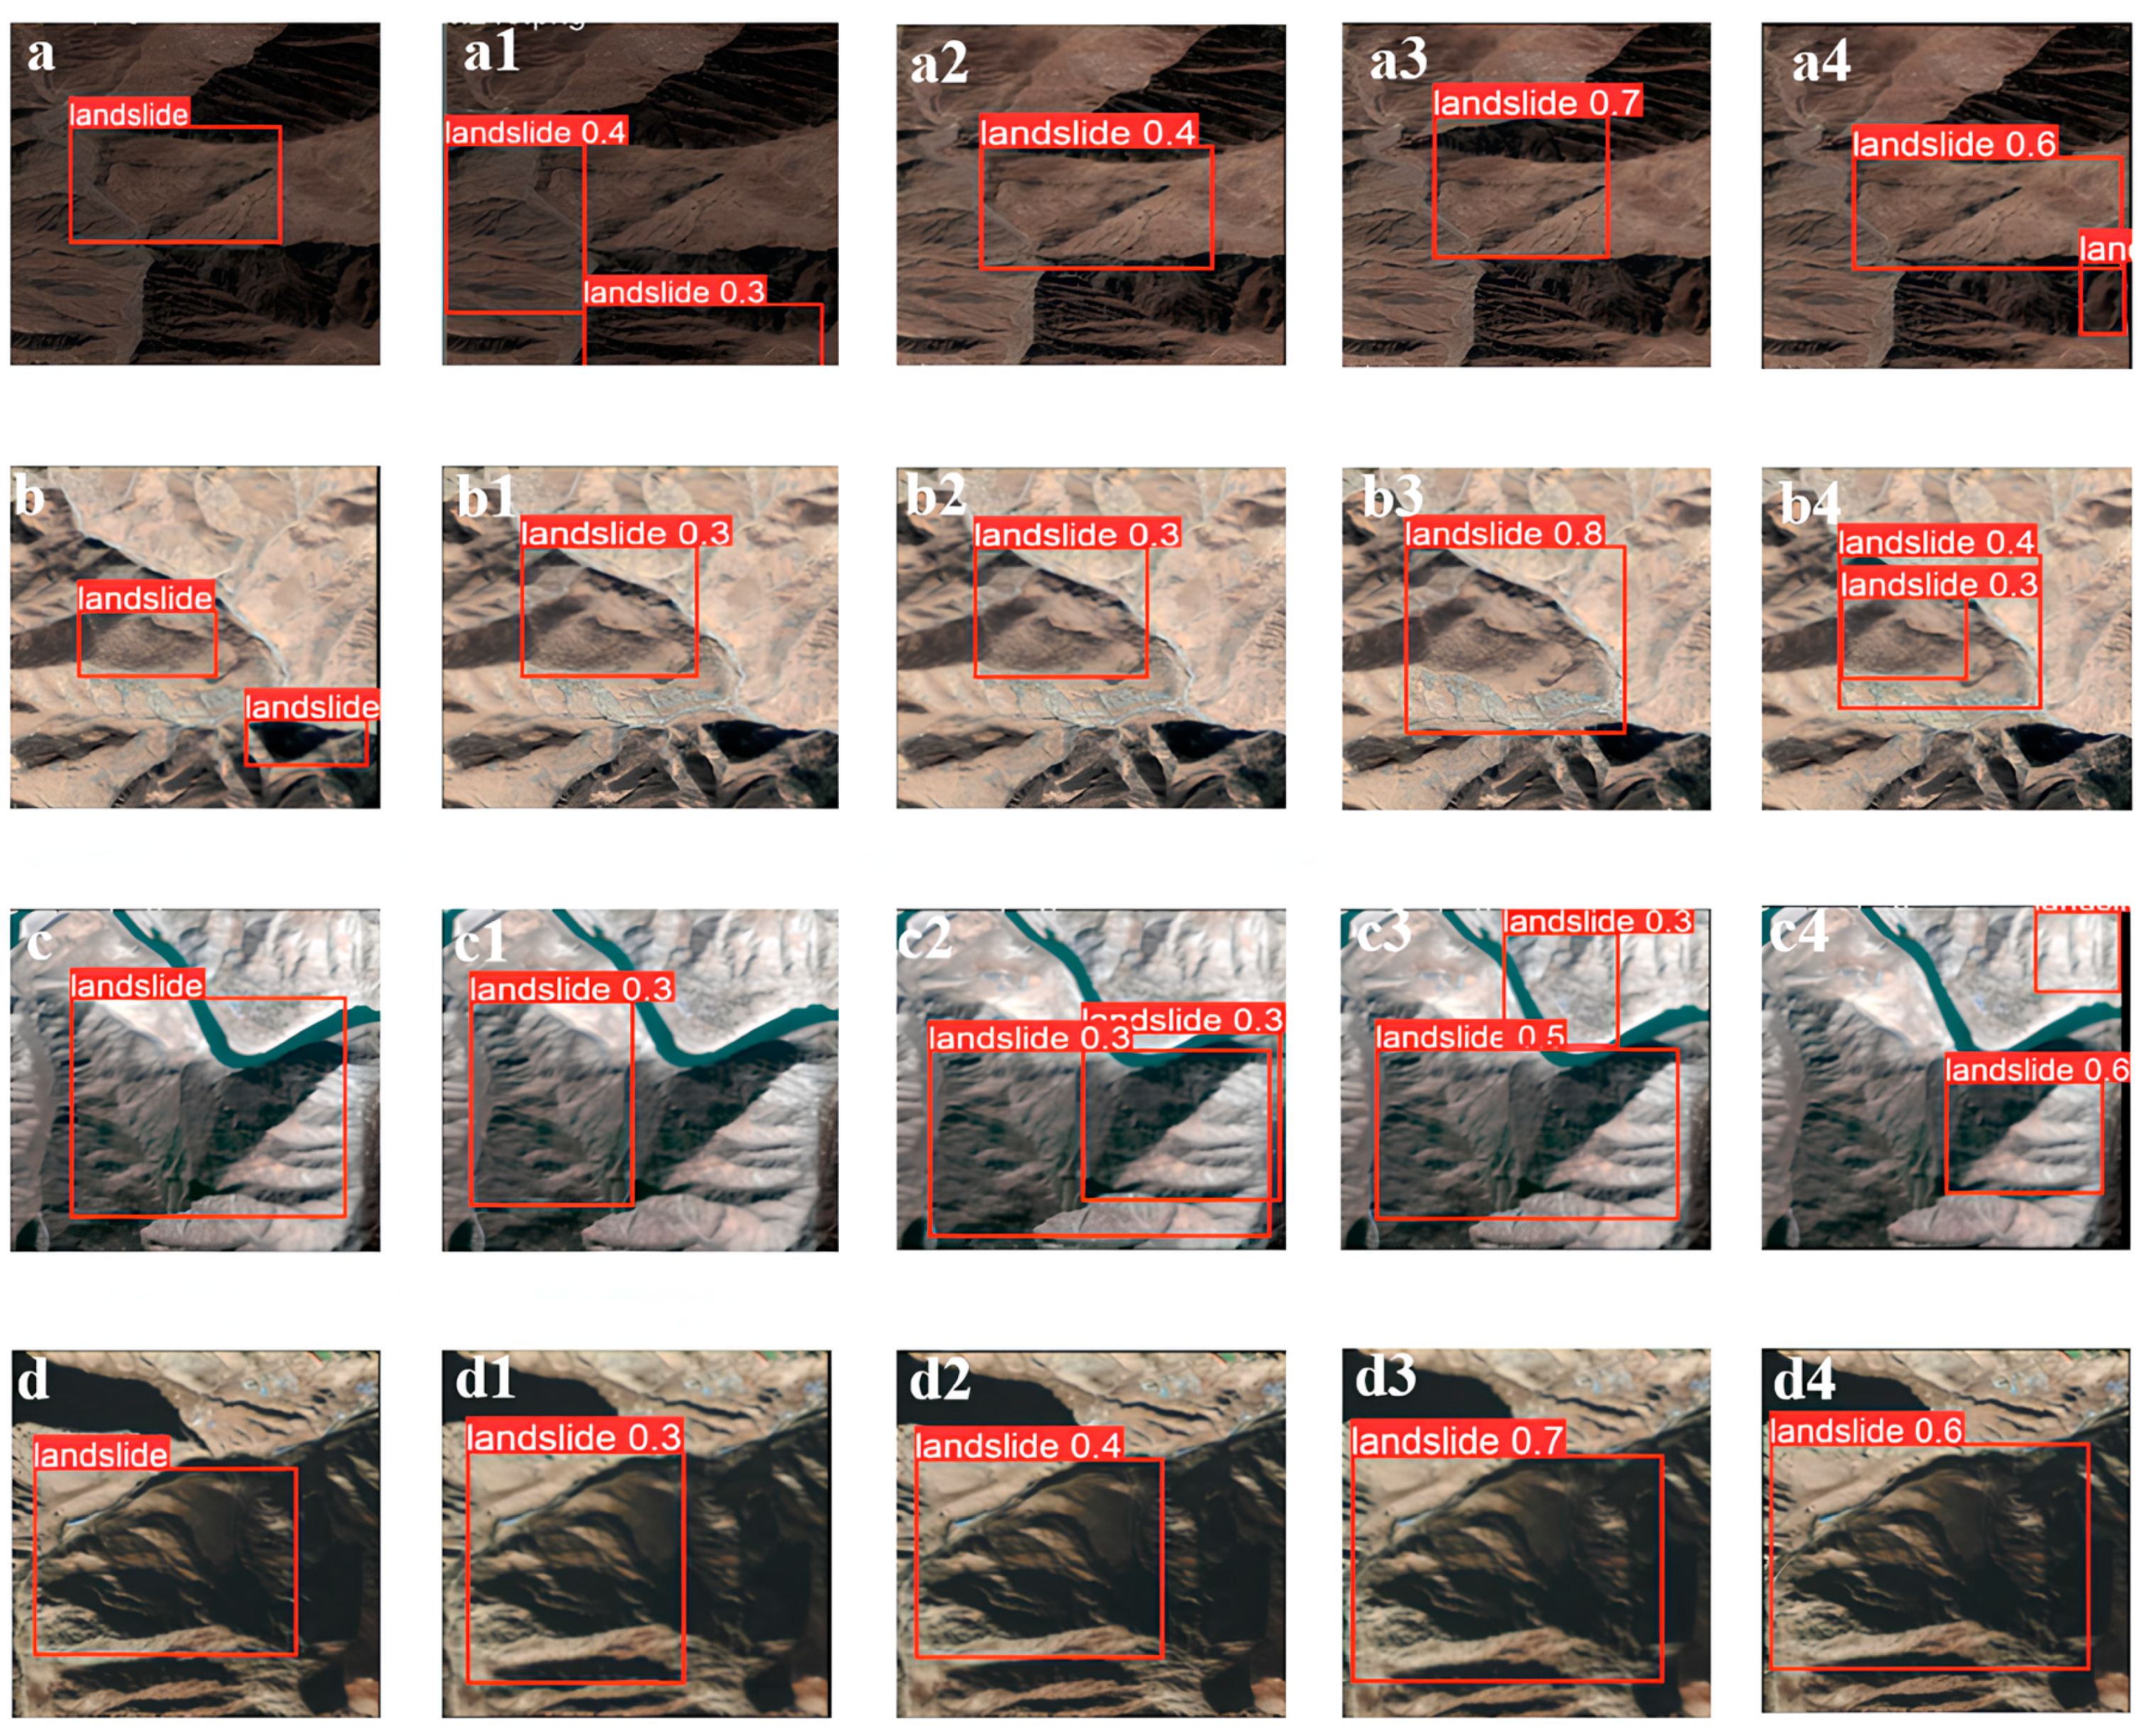
4.2.1. Model Results for Old Landslide Detection
4.2.2. Comparison of Different Attention Modules
5. Discussion
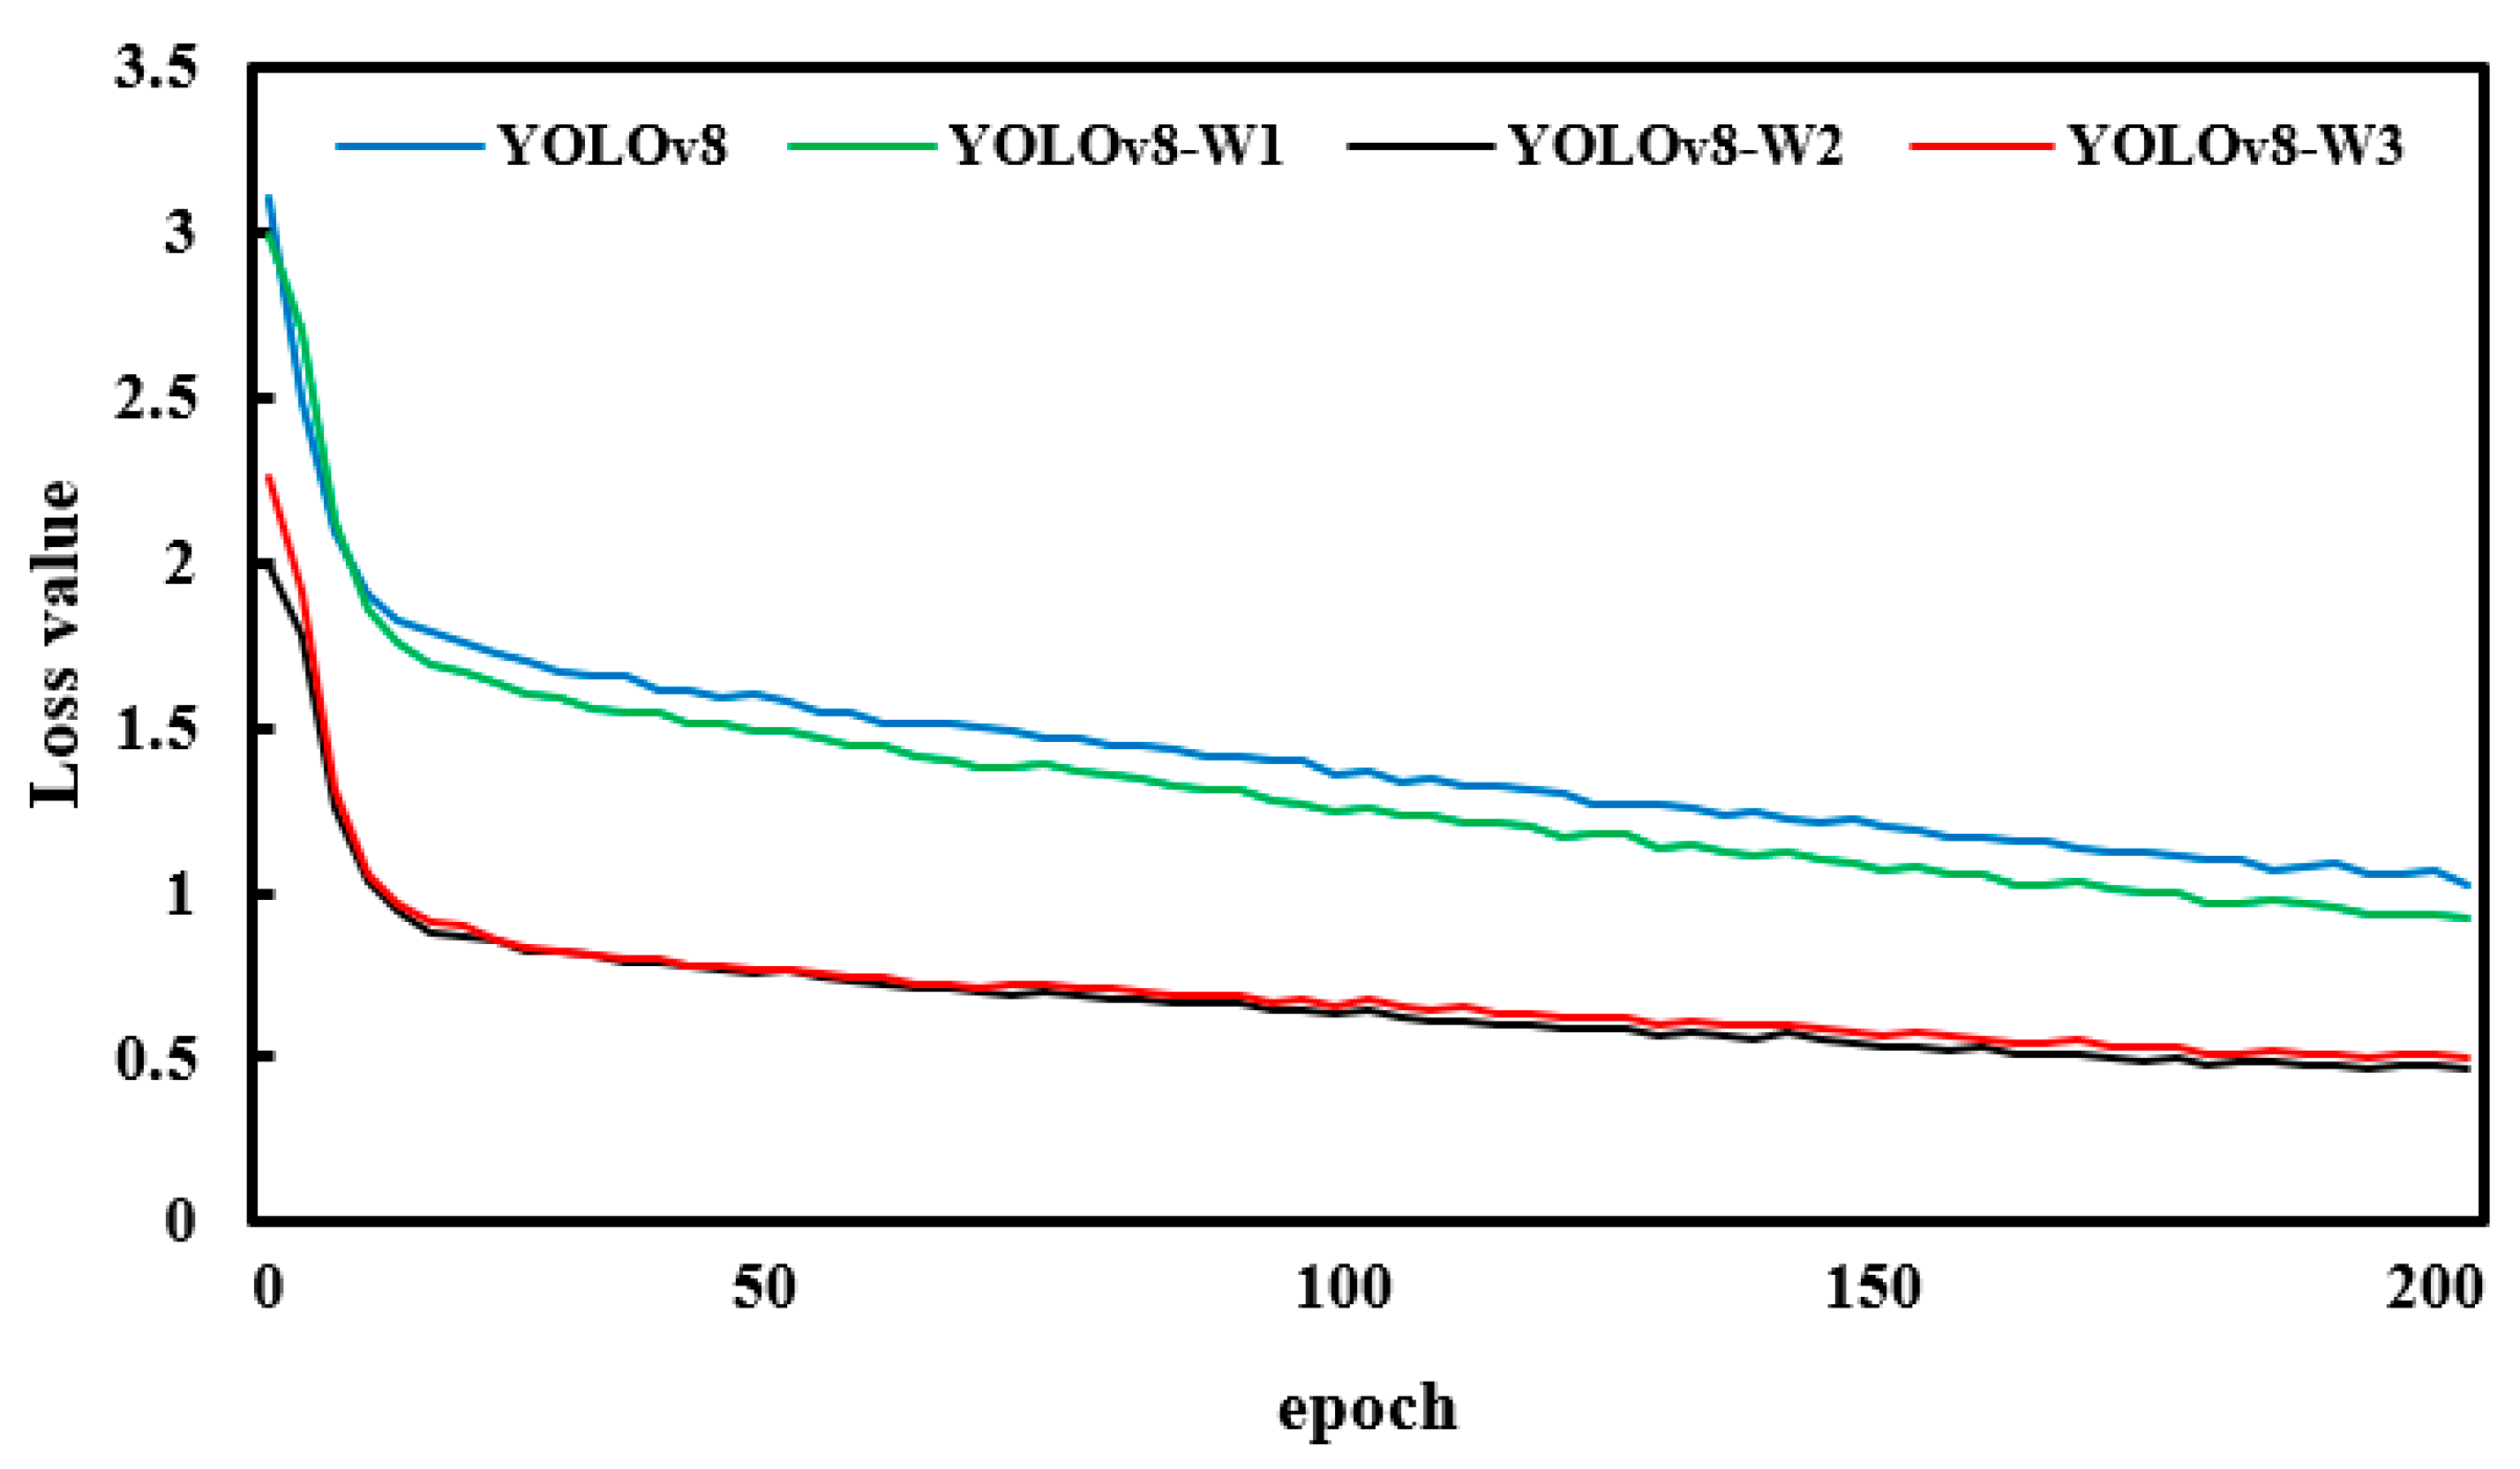
5.1. The Effects of the WIoU Loss Function on the Model
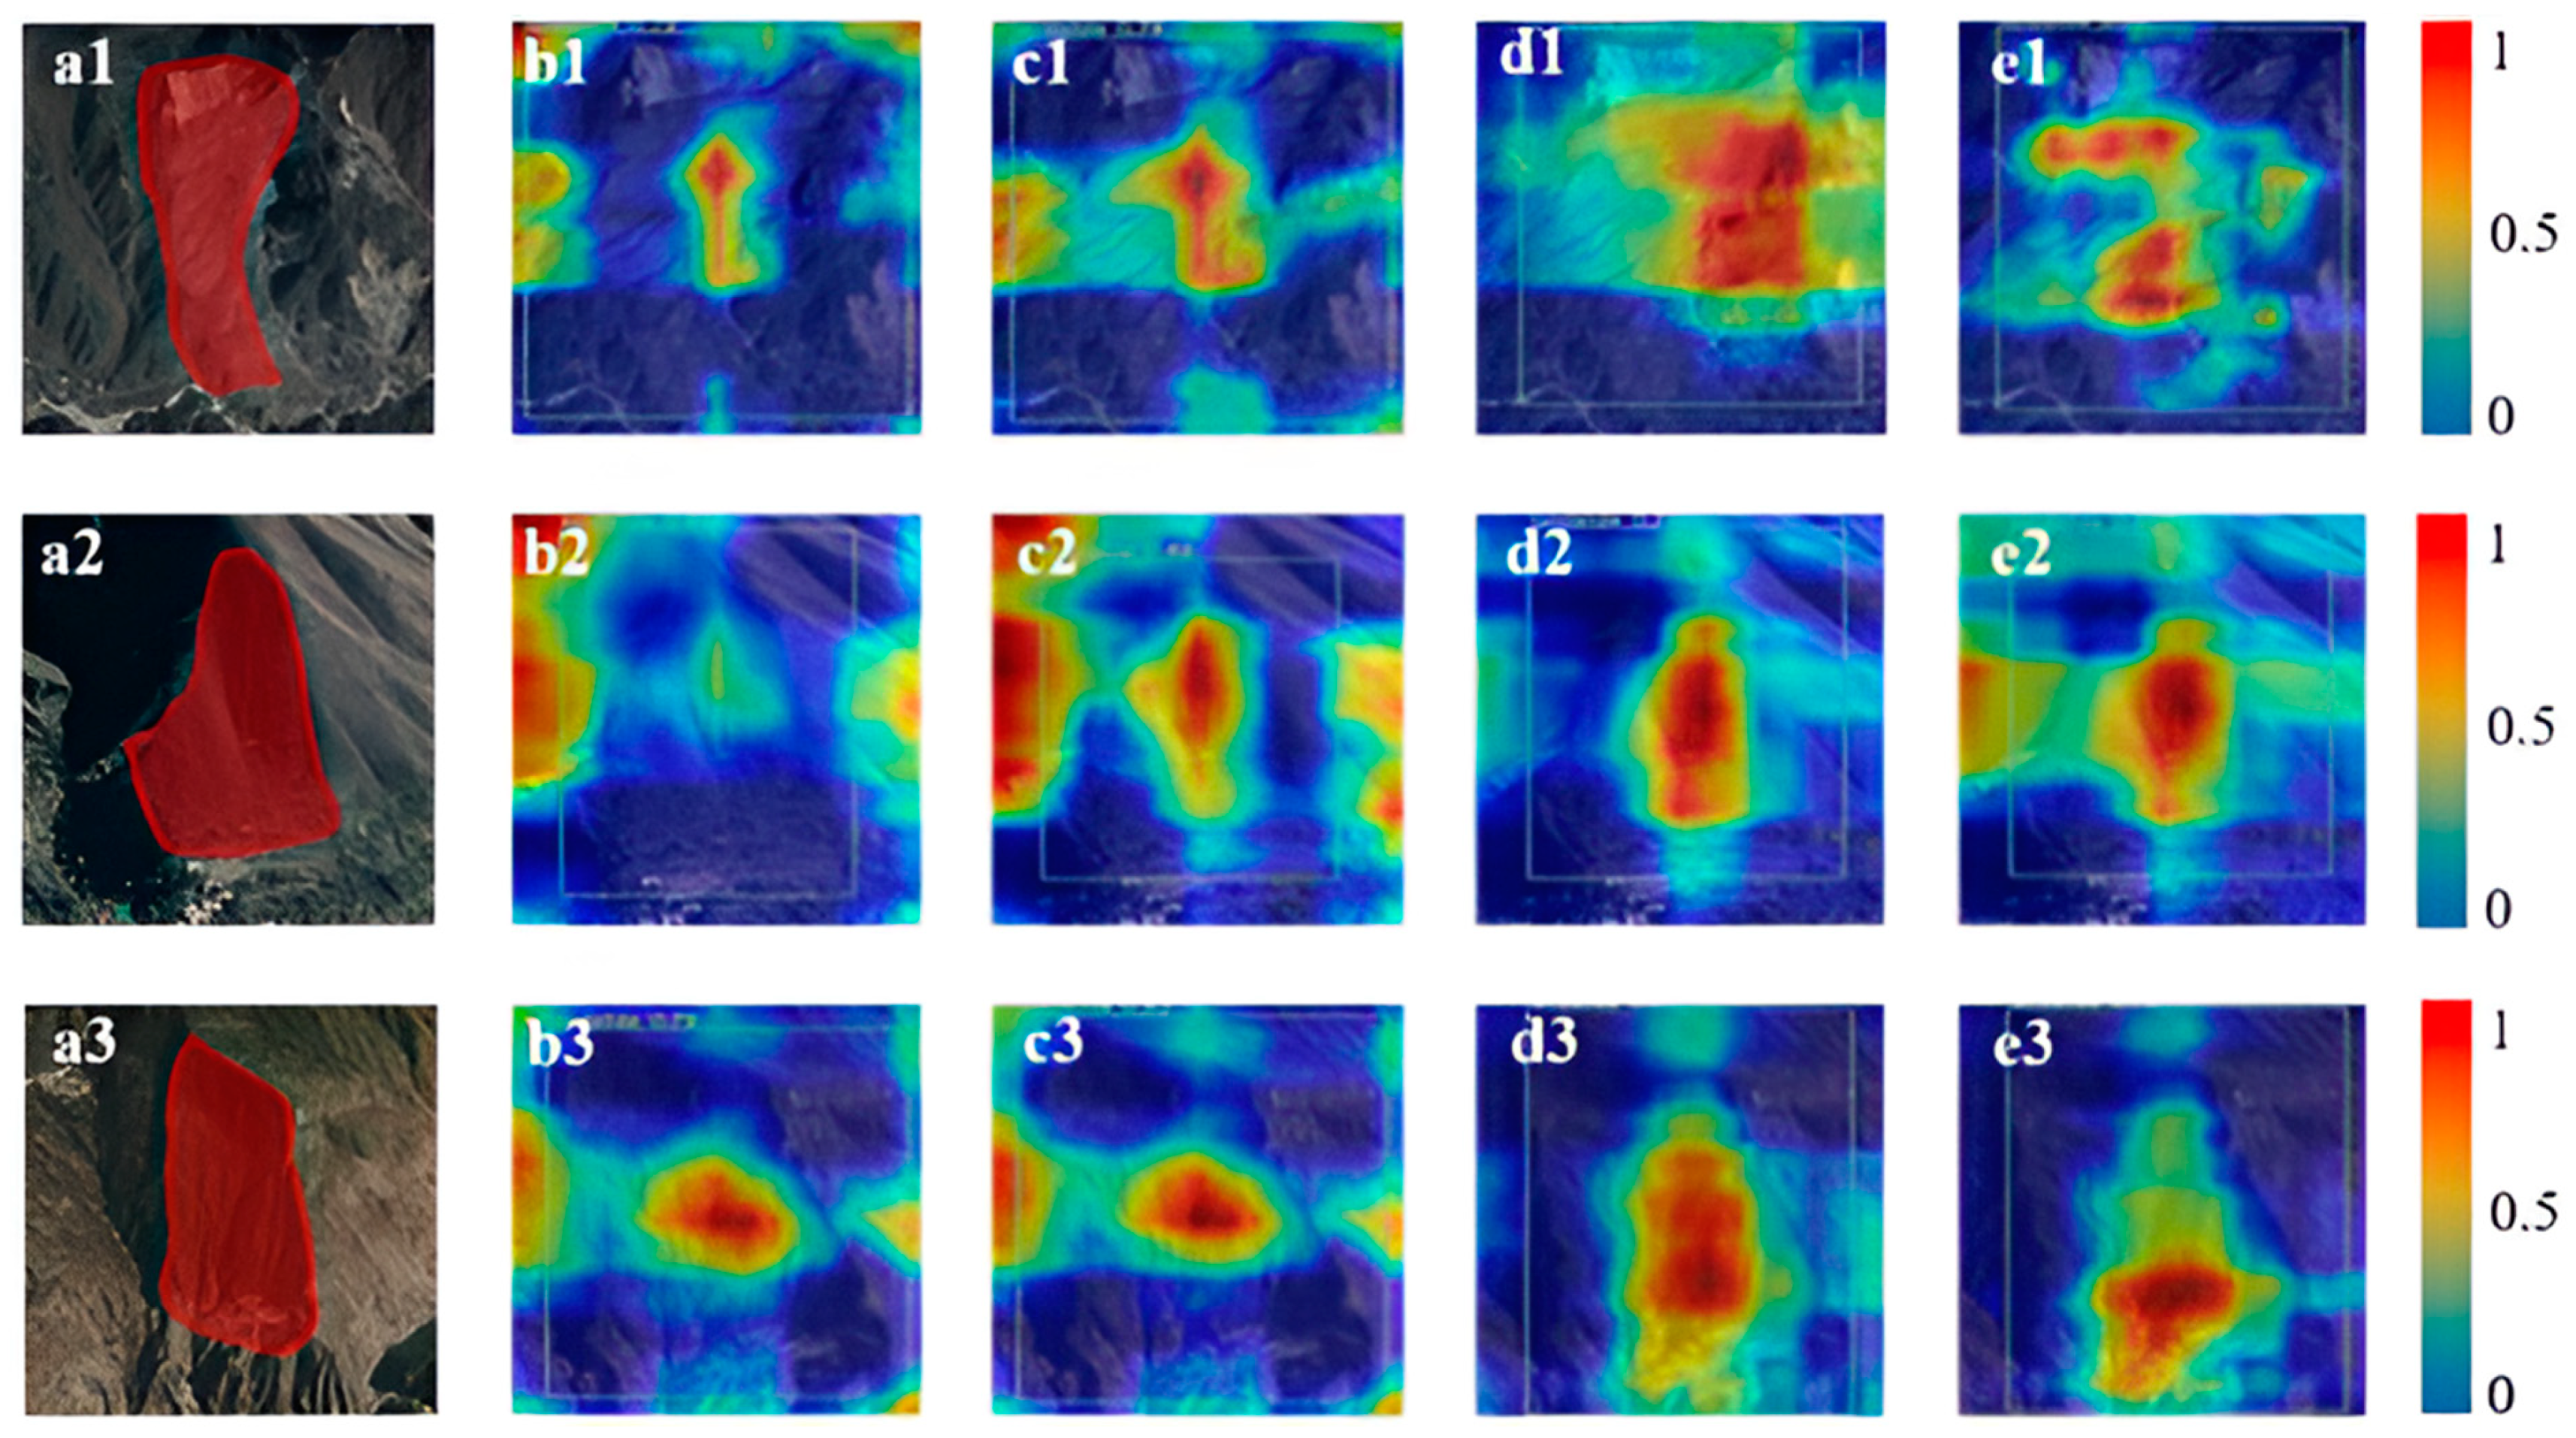
5.2. The Effects of the Attention Mechanism on the Model
5.3. Limitations and Future Challenges
- (1)
- Limited sample size: Deep learning models, including YOLOv8-CW2, require extensive datasets for optimal training. However, there is a critical shortage of old landslide data in the Sichuan and Tibet regions of China. It is anticipated that the performance of the model could be further improved with the availability of more comprehensive datasets.
- (2)
- Limited data type: The complexity of detecting old landslides in the Sichuan and Tibet regions is exacerbated by diverse topography, landforms, climate variations, and soil types, as well as the high level of vegetation coverage due to minimal human activity. These factors make the use of optical image data for landslide detection somewhat reductive. Therefore, we should integrate high-precision DEM (Digital Elevation Model) data and InSAR (Interferometric Synthetic Aperture Radar) data to enable a more thorough assessment of old landslides in these areas.
- (3)
- Limited model transferability: The transferability of the improved YOLOv8 model to other regions and landslide types has not been fully validated. To improve the model’s robustness and generalization capabilities, it is essential to expand the dataset with varied types of old landslide data, such as those from the Loess Plateau of China. This will allow the model to learn additional features relevant to different landslide characteristics and environments.
6. Conclusions
- In the detection of old landslides in the Sichuan–Tibet river basin, the improved YOLOv8-CW2 model achieves a detection accuracy of 80.1%, recall rate of 69.1%, mAP of 73.8%, and F1 score of 0.74. Compared to the original YOLOv8 model, the accuracy and recall rate are increased by 10.9% and 6%, respectively. The F1 score is increased from 0.66 to 0.74.
- Comparing the detection results of the YOLOv8-CW2 model and the original YOLOv8 model on the old landslide dataset reveals substantial improvements in the accuracy of both model types. This indicates the effectiveness and feasibility of detecting old landslides in the Sichuan–Tibet river basin using the proposed optimization method.
- To further enhance the stability and recognition ability of the model, multiple types of landslide data sources can be utilized for training, ultimately achieving accurate identification of multi-source data and various types of landslides. This approach provides timely and precise data support for landslide disaster rescue and disaster assessment.
Author Contributions
Funding
Institutional Review Board Statement
Informed Consent Statement
Data Availability Statement
Acknowledgments
Conflicts of Interest
References
- Zhang, Y.; Ren, S.; Liu, X.; Guo, C.; Li, J.; Bi, J.; Ran, L. Reactivation mechanism of old landslide triggered by coupling of fault creep and water infiltration: A case study from the east Tibetan Plateau. Bull. Eng. Geol. Environ. 2023, 82, 291. [Google Scholar] [CrossRef]
- Zhang, Y.; Wu, R.; Guo, C.; Wang, L.; Yao, X.; Yang, Z. Research Progress and Prospect on Reactivation of Ancient Landslides. Adv. Earth Sci. 2018, 33, 728–740. [Google Scholar]
- Huang, W.; Ding, M.; Li, Z.; Yu, J.; Ge, D.; Liu, Q.; Yang, J. Landslide susceptibility mapping and dynamic response along the Sichuan-Tibet transportation corridor using deep learning algorithms. Catena 2023, 222, 106866. [Google Scholar] [CrossRef]
- Huang, W.; Ding, M.; Li, Z.; Zhuang, J.; Yang, J.; Li, X.; Meng, L.e.; Zhang, H.; Dong, Y. An Efficient User-Friendly Integration Tool for Landslide Susceptibility Mapping Based on Support Vector Machines: SVM-LSM Toolbox. Remote Sens. 2022, 14, 3408. [Google Scholar] [CrossRef]
- Xu, W.-J.; Xu, Q.; Liu, G.-Y.; Xu, H.-Y. A novel parameter inversion method for an improved DEM simulation of a river damming process by a large-scale landslide. Eng. Geol. 2021, 293, 106282. [Google Scholar] [CrossRef]
- Huang, R.Q.; Li, W.L. Analysis of the geo-hazards triggered by the 12 May 2008 Wenchuan Earthquake, China. Bull. Eng. Geol. Environ. 2009, 68, 363–371. [Google Scholar] [CrossRef]
- Fariz, T.R.; Jatmiko, R.H.; Mei, E.T.W.; Lutfiananda, F. Interpretation on aerial photography for house identification on landslide area at Bompon sub-watershed. AIP Conf. Proc. 2023, 2683, 030013. [Google Scholar]
- Stumpf, A.; Kerle, N. Object-oriented mapping of landslides using Random Forests. Remote Sens. Environ. 2011, 115, 2564–2577. [Google Scholar] [CrossRef]
- Van Den Eeckhaut, M.; Kerle, N.; Poesen, J.; Hervas, J. Object-oriented identification of forested landslides with derivatives of single pulse LiDAR data. Geomorphology 2012, 173, 30–42. [Google Scholar] [CrossRef]
- Chen, W.; Li, X.; Wang, Y.; Chen, G.; Liu, S. Forested landslide detection using LiDAR data and the random forest algorithm: A case study of the Three Gorges, China. Remote Sens. Environ. 2014, 152, 291–301. [Google Scholar] [CrossRef]
- Gorsevski, P.V.; Brown, M.K.; Panter, K.; Onasch, C.M.; Simic, A.; Snyder, J. Landslide detection and susceptibility mapping using LiDAR and an artificial neural network approach: A case study in the Cuyahoga Valley National Park, Ohio. Landslides 2016, 13, 467–484. [Google Scholar] [CrossRef]
- Mezaal, M.R.; Pradhan, B. An improved algorithm for identifying shallow and deep-seated landslides in dense tropical forest from airborne laser scanning data. Catena 2018, 167, 147–159. [Google Scholar] [CrossRef]
- Ghorbanzadeh, O.; Blaschke, T.; Gholamnia, K.; Meena, S.R.; Tiede, D.; Aryal, J. Evaluation of Different Machine Learning Methods and Deep-Learning Convolutional Neural Networks for Landslide Detection. Remote Sens. 2019, 11, 196. [Google Scholar] [CrossRef]
- Ghorbanzadeh, O.; Meena, S.R.; Blaschke, T.; Aryal, J. UAV-Based Slope Failure Detection Using Deep-Learning Convolutional Neural Networks. Remote Sens. 2019, 11, 2046. [Google Scholar] [CrossRef]
- Sameen, M.I.; Pradhan, B. Landslide Detection Using Residual Networks and the Fusion of Spectral and Topographic Information. Ieee Access 2019, 7, 114363–114373. [Google Scholar] [CrossRef]
- Ji, S.; Yu, D.; Shen, C.; Li, W.; Xu, Q. Landslide detection from an open satellite imagery and digital elevation model dataset using attention boosted convolutional neural networks. Landslides 2020, 17, 1337–1352. [Google Scholar] [CrossRef]
- Prakash, N.; Manconi, A.; Loew, S. Mapping Landslides on EO Data: Performance of Deep Learning Models vs. Traditional Machine Learning Models. Remote Sens. 2020, 12, 346. [Google Scholar] [CrossRef]
- Yu, B.; Chen, F.; Xu, C. Landslide detection based on contour-based deep learning framework in case of national scale of Nepal in 2015. Comput. Geosci. 2020, 135, 104388. [Google Scholar] [CrossRef]
- Casagli, N.; Intrieri, E.; Tofani, V.; Gigli, G.; Raspini, F. Landslide detection, monitoring and prediction with remote-sensing techniques. Nat. Rev. Earth Environ. 2023, 4, 51–64. [Google Scholar] [CrossRef]
- Lu, Z.; Peng, Y.; Li, W.; Yu, J.; Ge, D.; Xiang, W. An Iterative Classification and Semantic Segmentation Network for Old Landslide Detection Using High-Resolution Remote Sensing Images. IEEE Trans. Geosci. Remote Sens. 2023, 61, 1–13. [Google Scholar] [CrossRef]
- Zhang, W.; Ding, B.; Zhang, W.; Zhang, G. Analysis on the Cause and Failure Mechanism of the Jiangdingya Large Landslide in Zhouqu, Gansu Province. J. Disaster Prev. Mitig. Eng. 2022, 42, 714–722. [Google Scholar]
- Ju, Y.; Xu, Q.; Jin, S.; Li, W.; Dong, X.; Guo, Q. Automatic Object Detection of Loess Landslide Based on Deep Learning. Geomat. Inf. Sci. Wuhan Univ. 2020, 45, 1747–1755. [Google Scholar]
- Ju, Y.; Xu, Q.; Jin, S.; Li, W.; Su, Y.; Dong, X.; Guo, Q. Loess Landslide Detection Using Object Detection Algorithms in Northwest China. Remote Sens. 2022, 14, 1182. [Google Scholar] [CrossRef]
- Yang, Z.; Han, L.; Zheng, X.; Li, W.; Feng, L.; Wang, Y.; Yang, Y. Landslide identification using remote sensing images and DEM based on convolutional neural network: A case study of loess landslide. Remote Sens. Nat. Resour. 2022, 34, 224–230. [Google Scholar]
- Yan, Y.; Guo, C.; Li, C.; Yuan, H.; Qiu, Z. The Creep-Sliding Deformation Mechanism of the Jiaju Ancient Landslide in the Upstream of Dadu River, Tibetan Plateau, China. Remote Sens. 2023, 15, 592. [Google Scholar] [CrossRef]
- Qi, J.; Liu, X.; Liu, K.; Xu, F.; Guo, H.; Tian, X.; Li, M.; Bao, Z.; Li, Y. An improved YOLOv5 model based on visual attention mechanism: Application to recognition of tomato virus disease. Comput. Electron. Agric. 2022, 194, 106780. [Google Scholar] [CrossRef]
- Wang, G.; Chen, Y.; An, P.; Hong, H.; Hu, J.; Huang, T. UAV-YOLOv8: A Small-Object-Detection Model Based on Improved YOLOv8 for UAV Aerial Photography Scenarios. Sensors 2023, 23, 7190. [Google Scholar] [CrossRef] [PubMed]
- Zhaohui, Z.; Ping, W.; Dongwei, R.; Wei, L.; Rongguang, Y.; Qinghua, H.; Wangmeng, Z. Enhancing Geometric Factors in Model Learning and Inference for Object Detection and Instance Segmentation. IEEE Trans. Cybern. 2022, 12, 8574–8586. [Google Scholar]
- Zheng, Z.; Wang, P.; Liu, W.; Li, J.; Ye, R.; Ren, D.; Association for the Advancement of Artificial Intelligence. Distance-IoU Loss: Faster and Better Learning for Bounding Box Regression. In Proceedings of the AAAI Conference on Artificial Intelligence, New York, NY, USA, 7–12 February 2020; pp. 12993–13000. [Google Scholar]
- Tong, Z.; Chen, Y.; Xu, Z.; Yu, R. Wise-IoU: Bounding Box Regression Loss with Dynamic Focusing Mechanism. arXiv 2023, arXiv:2301.10051. [Google Scholar]
- Tu, Z.; Lu, Z.; Liu, Y.; Liu, X.; Li, H. Modeling Coverage for Neural Machine Translation. In Proceedings of the 54th Annual Meeting of the Association-for-Computational-Linguistics (ACL), Berlin, Germany, 07–12 August 2016; pp. 76–85. [Google Scholar]
- Zhou, Q.; Yang, N.; Wei, F.; Zhou, M. Selective Encoding for Abstractive Sentence Summarization. In Proceedings of the 55th Annual Meeting of the Association-for-Computational-Linguistics (ACL), Vancouver, BC, Canada, 30 July–4 August 2017; pp. 1095–1104. [Google Scholar]
- Woo, S.; Park, J.; Lee, J.-Y.; Kweon, I.S. CBAM: Convolutional Block Attention Module. In Proceedings of the 15th European Conference on Computer Vision (ECCV), Munich, Germany, 8–14 September 2018; pp. 3–19. [Google Scholar]
- Hu, J.; Shen, L.; Albanie, S.; Sun, G.; Wu, E. Squeeze-and-Excitation Networks. IEEE Trans. Pattern Anal. Mach. Intell. 2020, 42, 2011–2023. [Google Scholar] [CrossRef]
- Zhang, S.; Liu, Z.; Chen, Y.; Jin, Y.; Bai, G. Selective kernel convolution deep residual network based on channel-spatial attention mechanism and feature fusion for mechanical fault diagnosis. Isa Trans. 2023, 133, 369–383. [Google Scholar] [CrossRef] [PubMed]
- Wu, R.; Zhang, Y.; Guo, C.; Yang, Z.; Ren, S.; Tong, B. Reactivation characteristics and dynamic hazard prediction of an ancient landslide in the east margin of Tibetan Plateau. Environ. Earth Sci. 2018, 77, 573. [Google Scholar] [CrossRef]
- Dai, Z.; Yang, L.; Zhang, N.; Zhang, C.; Zhang, Z.; Wang, H. Deformation characteristics and reactivation mechanism of an old landslide induced by combined action of excavation and heavy rainfall. Front. Earth Sci. 2023, 10, 1009855. [Google Scholar] [CrossRef]
- He, K.; Zhang, X.; Ren, S.; Sun, J. Spatial Pyramid Pooling in Deep Convolutional Networks for Visual Recognition. IEEE Trans. Pattern Anal. Mach. Intell. 2015, 37, 1904–1916. [Google Scholar] [CrossRef]
- Ioffe, S.; Szegedy, C. Batch Normalization: Accelerating Deep Network Training by Reducing Internal Covariate Shift. In Proceedings of the 32nd International Conference on Machine Learning, Lille, France, 7–9 July 2015; pp. 448–456. [Google Scholar]
- Wang, C.-Y.; Liao, H.-Y.M.; Wu, Y.-H.; Chen, P.-Y.; Hsieh, J.-W.; Yeh, I.H. CSPNet: A New Backbone that can Enhance Learning Capability of CNN. In Proceedings of the IEEE/CVF Conference on Computer Vision and Pattern Recognition (CVPR), Seattle, WA, USA, 14–19 June 2020; pp. 1571–1580. [Google Scholar]
- Tsung-Yi, L.; Goyal, P.; Girshick, R.; Kaiming, H.; Dollar, P. Focal loss for dense object detection. In Proceedings of the 2017 IEEE International Conference on Computer Vision (ICCV), Venice, Italy, 22–29 October 2017; pp. 2999–3007. [Google Scholar]
- Hou, H.; Chen, M.; Tie, Y.; Li, W. A Universal Landslide Detection Method in Optical Remote Sensing Images Based on Improved YOLOX. Remote Sens. 2022, 14, 4939. [Google Scholar] [CrossRef]


| Real | Predicate | |
|---|---|---|
| Landslide | Background | |
| Landslide | TP | FN |
| Background | FP | TN |
| Model | Precision (%) | Recall (%) | mAP (%) | F1 (%) |
|---|---|---|---|---|
| YOLOv8 | 69.2% | 63.1% | 62.8% | 66.0% |
| YOLOv8-CW1 | 76.7% | 65.9% | 68.2% | 71.0% |
| YOLOv8-CW2 | 80.1% | 69.1% | 73.8% | 74.0% |
| YOLOv8-CW3 | 79.0% | 66.8% | 70.3% | 72.0% |
| Model | Precision (%) | Recall (%) | mAP (%) | F1 (%) |
|---|---|---|---|---|
| YOLOv8-CW1 | 76.7% | 65.9% | 68.2% | 71.0% |
| YOLOv8-CW2 | 80.1% | 69.1% | 73.8% | 74.0% |
| YOLOv8-CW3 | 79.0% | 66.8% | 70.3% | 72.0% |
| YOLOv8-SEW1 | 73.2% | 68.3% | 63.4% | 71.0% |
| YOLOv8-SEW2 | 75.6% | 71.5% | 70.6% | 74.0% |
| YOLOv8-SEW3 | 76.6% | 63.4% | 66.1% | 69.0% |
| YOLOv8-SKW1 | 74.9% | 70.0% | 70.9% | 72.0% |
| YOLOv8-SKW2 | 74.4% | 70.3% | 70.7% | 72.0% |
| YOLOv8-SKW3 | 73.3% | 66.8% | 64.7% | 70.0% |
| CBAM | SE | SK | CIoU | WIoUv1 | WIoUv2 | WIoUv3 | mAP (%) | |
|---|---|---|---|---|---|---|---|---|
| Base line | - | - | - | √ | - | - | - | 62.8% |
| 1 | - | - | - | - | √ | - | - | 68.3% |
| 2 | - | - | - | - | - | √ | - | 67.2% |
| 3 | - | - | - | - | - | - | √ | 67.9% |
| 4 | √ | - | - | √ | - | - | - | 65.8% |
| 5 | √ | - | - | - | √ | - | - | 68.2% |
| 6 | √ | - | - | - | - | √ | - | 73.8% |
| 7 | √ | - | - | - | - | - | √ | 70.3% |
| 8 | - | √ | - | √ | - | - | - | 63.7% |
| 9 | - | √ | - | - | √ | - | - | 63.4% |
| 10 | - | √ | - | - | - | √ | - | 70.6% |
| 11 | - | √ | - | - | - | - | √ | 66.1% |
| 12 | - | - | √ | √ | - | - | - | 64.6% |
| 13 | - | - | √ | - | √ | - | - | 70.9% |
| 14 | - | - | √ | - | - | √ | - | 70.7% |
| 15 | - | - | √ | - | - | - | √ | 64.7% |
| Model | Precision (%) | Recall (%) | mAP (%) | F1 (%) |
|---|---|---|---|---|
| YOLOv8 | 69.2% | 63.1% | 62.8% | 66.0% |
| YOLOv8-CBAM | 77.6% | 64.8% | 65.8% | 71.0% |
| YOLOv9-SE | 74.4% | 64.6% | 63.7% | 70.0% |
| YOLOv8-SK | 72.2% | 65.4% | 64.6% | 69.0% |
Disclaimer/Publisher’s Note: The statements, opinions and data contained in all publications are solely those of the individual author(s) and contributor(s) and not of MDPI and/or the editor(s). MDPI and/or the editor(s) disclaim responsibility for any injury to people or property resulting from any ideas, methods, instructions or products referred to in the content. |
© 2024 by the authors. Licensee MDPI, Basel, Switzerland. This article is an open access article distributed under the terms and conditions of the Creative Commons Attribution (CC BY) license (https://creativecommons.org/licenses/by/4.0/).
Share and Cite
Li, Y.; Ding, M.; Zhang, Q.; Luo, Z.; Huang, W.; Zhang, C.; Jiang, H. Old Landslide Detection Using Optical Remote Sensing Images Based on Improved YOLOv8. Appl. Sci. 2024, 14, 1100. https://doi.org/10.3390/app14031100
Li Y, Ding M, Zhang Q, Luo Z, Huang W, Zhang C, Jiang H. Old Landslide Detection Using Optical Remote Sensing Images Based on Improved YOLOv8. Applied Sciences. 2024; 14(3):1100. https://doi.org/10.3390/app14031100
Chicago/Turabian StyleLi, Yunlong, Mingtao Ding, Qian Zhang, Zhihui Luo, Wubiao Huang, Cancan Zhang, and Hui Jiang. 2024. "Old Landslide Detection Using Optical Remote Sensing Images Based on Improved YOLOv8" Applied Sciences 14, no. 3: 1100. https://doi.org/10.3390/app14031100
APA StyleLi, Y., Ding, M., Zhang, Q., Luo, Z., Huang, W., Zhang, C., & Jiang, H. (2024). Old Landslide Detection Using Optical Remote Sensing Images Based on Improved YOLOv8. Applied Sciences, 14(3), 1100. https://doi.org/10.3390/app14031100