Article

Highway Construction Safety Analysis Using Large Language Models

1
Department of Civil and Environmental Engineering, University of Pittsburgh, Pittsburgh, PA 15261, USA
2
Department of Civil Engineering Technology, Environmental Management and Safety, Rochester Institute of Technology, Rochester, NY 14623, USA
*
Author to whom correspondence should be addressed.
Appl. Sci. 2024, 14(4), 1352; https://doi.org/10.3390/app14041352
Submission received: 14 December 2023 / Revised: 2 February 2024 / Accepted: 5 February 2024 / Published: 6 February 2024
(This article belongs to the Section Civil Engineering)

Abstract

:

Featured Application

Use of large language models and AI to analyze construction safety data.

Abstract

The highway construction industry carries substantial safety risks for workers, necessitating thorough accident analyses to implement effective preventive measures. Current research lacks comprehensive investigations into safety incidents, relying heavily on conventional statistical methods and overlooking valuable textual information in publicly available databases. This study leverages a state-of-the-art large language model (LLM), specifically OpenAI’s GPT-3.5 model. The primary focus is to enhance text-based incident analysis that is sourced from OSHA’s Severe Injury Reports (SIR) database. By incorporating novel natural language processing (NLP) techniques, dimensionality reduction, clustering algorithms, and LLM prompting of incident narratives, the study aims to develop an approach to the analysis of major accident causes in highway construction. The resulting cluster analysis, coupled with LLM summarization and cause identification, reveals the major accident types, such as heat-related and struck-by injuries, as well as commonalities between incidents. This research showcases the potential of artificial intelligence (AI) and LLM technology in data-driven analysis. By efficiently processing textual data and providing insightful analysis, the study fosters practical implications for safety professionals and the development of more effective accident prevention and intervention strategies within the industry.

1. Introduction

The highway construction industry, a critical aspect of infrastructure development, poses significant risks to worker safety. Work zone hazards such as high-speed passing traffic, large construction and maintenance equipment, material movement, and extreme environmental conditions make it a particularly dangerous environment [1].
Statistics from the Bureau of Labor Statistics (BLS) and the Occupational Safety and Health Administration (OSHA) reveal that the construction industry worker fatalities in the United States accounted for a staggering 20.5% of all private industry fatalities in 2014 and 21.1% in 2019 [2,3]. Incidents also account for huge costs in the construction industry [4]. As the deteriorating condition of highways is a pressing concern, with over 44% of highway systems in the United States exhibiting a poor condition, an increase in projects related to maintenance and rehabilitation is expected in the next years [5]. With these alarming figures, there remains a need for comprehensive accident analyses in the field to help mitigate safety hazards in the highway industry.
The primary causes contributing to construction-related fatalities, as identified by OSHA, remain prevailing areas of interest: struck-by accidents, falls, caught-in/between incidents, electrical shock, and others [6]. Multiple studies have also identified the top contributors to accidents in the industry; for example, historical data indicate that 70% of struck-by accidents resulted from being struck by a falling object or equipment, or being run over by heavy equipment or private vehicles [6].
It is important to recognize that work zone characteristics and the environment exert a significant influence on work zone accidents, injuries, and fatalities [7]. Additionally, human factors, such as worker behavior and ergonomics, play a crucial role in accidents in highway construction zones [1,6]. Even with safety improvements, injuries and fatalities in highway construction and maintenance continue to persist at alarming levels, underscoring the urgent need for more comprehensive safety measures [6].
Data-driven decision making is widely recognized as a pivotal approach to informed decision making in safety analyses, as it fulfills the requirement for effective categorization and analysis of safety incidents in diverse industries to understand their causes, attribute accidents to worker behavior, and enhance safety programs [1,8]. Nevertheless, the current methods employed for incident analysis have some limitations. While incident databases offer valuable insights for case studies, few researchers have explored the potential of utilizing OSHA databases to gain a deeper insight into safety incidents and their underlying causes. For example, Chokor et al. (2016) addressed this gap by utilizing the OSHA IMIS database along with machine learning techniques, emphasizing the time-consuming and expensive nature of manual analysis [9].
Furthermore, the examination of accident narratives, which are commonly present in accident reports, is an important approach to the analysis of construction safety data due to the wealth of detail that is available per incident. Researchers have employed natural language processing (NLP) techniques, such as text classification and mining, to extract valuable information from accident narratives [10]. Machine learning algorithms, including support vector machines (SVMs), random forests, and logistic regression, have been utilized to classify and predict accident severity levels [10]. Additionally, deep learning approaches have been explored to classify safety incidents, with a particular focus on understudied areas like near-misses [11]. Machine learning approaches coupled with NLP provide a means to tackle the inherent challenges in conventional methods, offering improved efficiency and depth of analysis [9]. In the construction industry, NLP approaches can streamline inspection practices, extract pertinent information from unstructured data, and classify textual data (i.e., project requirement sentences) [12].
Traditional NLP techniques, including word embeddings and topic modeling, provide valuable tools for analyzing safety narratives. Various approaches have been explored, including combining Term Frequency–Inverse Document Frequency (TFIDF) with machine learning classifiers, utilizing the K-means clustering algorithm for data mining and employing feature analysis through descriptive statistics [9]. TFIDF, a traditional method in text analytics, quantifies words’ importance in a document, but it has limitations in capturing word similarity and accurately reflecting their importance [7].
A novel network architecture in language processing and artificial intelligence (AI), the Transformer, was introduced by Vaswani et al. in 2017 [13]. Based on this architecture, several notable large language models (LLMs) have since evolved. Due to the sheer upscaling of the massive training corpus (45 TB) and the large number of model parameters (175 billion) that are encapsulated within models such as OpenAI’s GPT-3.5 (Generative Pre-trained Transformer) model, unique abilities have appeared that are not present in smaller models: namely, summarization, question answering, etc. [14]. OpenAI, the manufacturer of the GPT-3.5 model, is headquartered in San Fransisco, California, United States. These new advances open up possibilities for automating incident categorization and identifying contributing factors in highway construction accidents.
Overall, the categorization and analysis of safety incidents, along with the understanding of contributing factors and the use of data-driven decision making, are essential in preventing accidents and improving safety in the highway construction industry [2]. The application of text analytics techniques, dimensionality reduction, and clustering algorithms can provide valuable insights into safety incidents and facilitate further decision making [15].
This paper proposes an approach that utilizes LLMs to conduct a comprehensive analysis of textual narratives that are found in an injury report database. By leveraging the capabilities of state-of-the-art LLMs, such as GPT-3.5, the data-driven analysis of accidents in the field is significantly enhanced. The model’s proficiency in understanding and generating human-like text has allowed for an analysis that is complementary to traditional descriptive statistics of the dataset, focusing on accident reports, incident narratives, and related textual data.

2. Literature Review

2.1. Status of Construction Safety

Construction sites pose inherent hazards due to their dynamic and temporary nature, exposing workers to risks stemming from factors like a lack of awareness, experience, safety training, and inadequate personal protective equipment (PPE) [16]. These risks encompass natural hazards that are associated with construction activities, such as exposure to traffic, heavy equipment, material movement, and environmental conditions [1]. While proactive measures can address some risks, other challenging factors like overall negligence, inadequate site management, and insufficient training may require more intervention [17]. Common incidents, including man/machine interface and side falls of materials, especially for workers at heights, contribute to the hazardous nature, with falling hazards representing a significant portion of fatalities [3,15]. Recognizing these factors is crucial, as unidentified hazards can lead to safety incidents and work-related injuries, emphasizing the need for new methods to improve intervention [18].
To mitigate accidents in construction, a focus on major equipment is crucial, accompanied by specific recommendations and training [6]. Improving worker supervision during activities like demolition, painting, and cleaning is essential to ensure proper equipment usage and related precautions [19]. In highway construction safety, effective accident prevention methods, including heavy barriers, lane closures, road closures, and functioning audible systems, are important [6]. Furthermore, emphasizing robust safety protocols, training programs, and site inspections can further contribute to reducing inherent risks [20].
While successful methodologies for reducing fatalities have been identified, there is a need for a better understanding of incidents [9]. Findings from construction project safety studies play a crucial role in identifying and understanding equipment- and worker-related safety concerns, facilitating the development of intervention strategies for improved safety [2]. Specifically, in analyzing near-miss incidents, proposed guidelines aim to identify, analyze, and disseminate information to support safety management on construction sites [8]. Exploring optimal safety investments in preventative safety equipment and activities is also recommended [17]. Despite advancements in comprehending work zone hazards, the US continues to report a high number of incidents in the industry each year.
Transitioning to data-driven decision making in construction safety entails harnessing past health and safety data, employee feedback, and statistical tools [1]. Within the realm of construction safety, data-driven methods can provide valuable insights through model-based, knowledge-based, and data-driven approaches, highlighting their potential [21]. Moreover, the incorporation of natural language processing (NLP) analysis offers a new methodology for analyzing construction site safety. It offers a robust framework for uncovering patterns within accident records and databases [22].

2.2. Natural Language Processing in Construction

NLP is transforming construction safety management by automating tasks like interpreting textual data and enhancing worker well-being [20]. Combined with machine learning, these techniques achieve high accuracy in analyzing mine health and safety management system data and introduce new tools for safety risk identification [23,24]. In construction safety management, NLP focuses on syntactic and semantic analysis, automatically extracting relevant information from Building Information Modeling (BIM) models and streamlining information retrieval from lengthy textual documents [10,24].
The text analysis approach has demonstrated its potential by achieving an 82% accuracy in predicting construction accidents and extracting insights from language to understand safety incidents [22,23]. It excels in clustering construction schedules, revealing hidden safety insights [25]. In exploring the significance of learning from past accidents for accident prevention, advanced text mining techniques and various machine learning algorithms play a crucial role [26]. Ultimately, NLP aids in uncovering patterns and correlations within accident records, providing valuable insights into accident causes and automating risk extraction from accident narratives.
However, applying these techniques in construction safety management and accident prediction poses challenges. While it facilitates automated risk extraction from narratives [20], accurately classifying knowledge from safety reports remains challenging [27]. The shift to deep learning in safety occurrence reports introduces implementation and performance challenges [26]. Advanced NLP modeling techniques offer potential, but caution is needed in tailoring applications to tasks and ensuring the quality of safety management systems [22,27]. Despite its capabilities, limitations in the accuracy and efficiency of analysis, along with addressing potential dangers in the construction industry, must be considered when applying NLP.
Beyond safety protocols, NLP has evolved to integrate linguistics, computer science, and artificial intelligence (AI), enabling the extraction of information from construction documents and the analysis of data from construction sites [28]. Moreover, recent developments involve exploring new models that integrate AI to enhance public safety through AI-driven analysis and decision making [29]. These applications extend to intelligent presentations in safety rule checking, automatic text classification, and even into the mining industry, successfully classifying accident descriptions at mines, albeit with challenges related to word ambiguity [11,24,30]. In summary, NLP and AI serve as versatile tools that can be employed across various dimensions of the construction industry, contributing to enhanced safety management, automated information retrieval, and the provision of valuable insights into accident causes and risk management.

2.3. Limited Exploration of Generative AI

Large language models (LLMs) like GPT (Generative Pre-Trained) exhibit potential in construction safety, particularly in accident classification tasks and adaptability to varied input contexts [22]. Fine-tuned language models could revolutionize safety practices and predict construction accidents from unstructured free text data. However, their application in the construction industry is limited, necessitating further research and validation of use cases [28,31].
GPT models offer advantages in accident classification, including adaptability and multimodal (image, text, video, etc.) capabilities. They enhance demolition risk assessments, capture tacit knowledge, and provide multilingual support for knowledge management and training in construction [31]. Integration into site safety management opens opportunities for safety practices improvement, automated risk assessments, and real-time insights into hazards [31].
However, challenges in applying large language models like GPT in construction include understanding domain-specific knowledge, complex regulations, and technical requirements [31]. Concerns about using sensitive data, ethical and legal considerations, and potential harms like misuse, bias, fairness, and representation issues must be addressed [31,32]. Despite overcoming challenges, low GPT model application persists, and the limitations of language models are acknowledged [14,32]. Practical applicability, given expensive and inconvenient inference, requires addressing through clear regulations, the distillation of large models for specific tasks, and consideration of the evolving nature of regulations [32].

3. Database and Methods

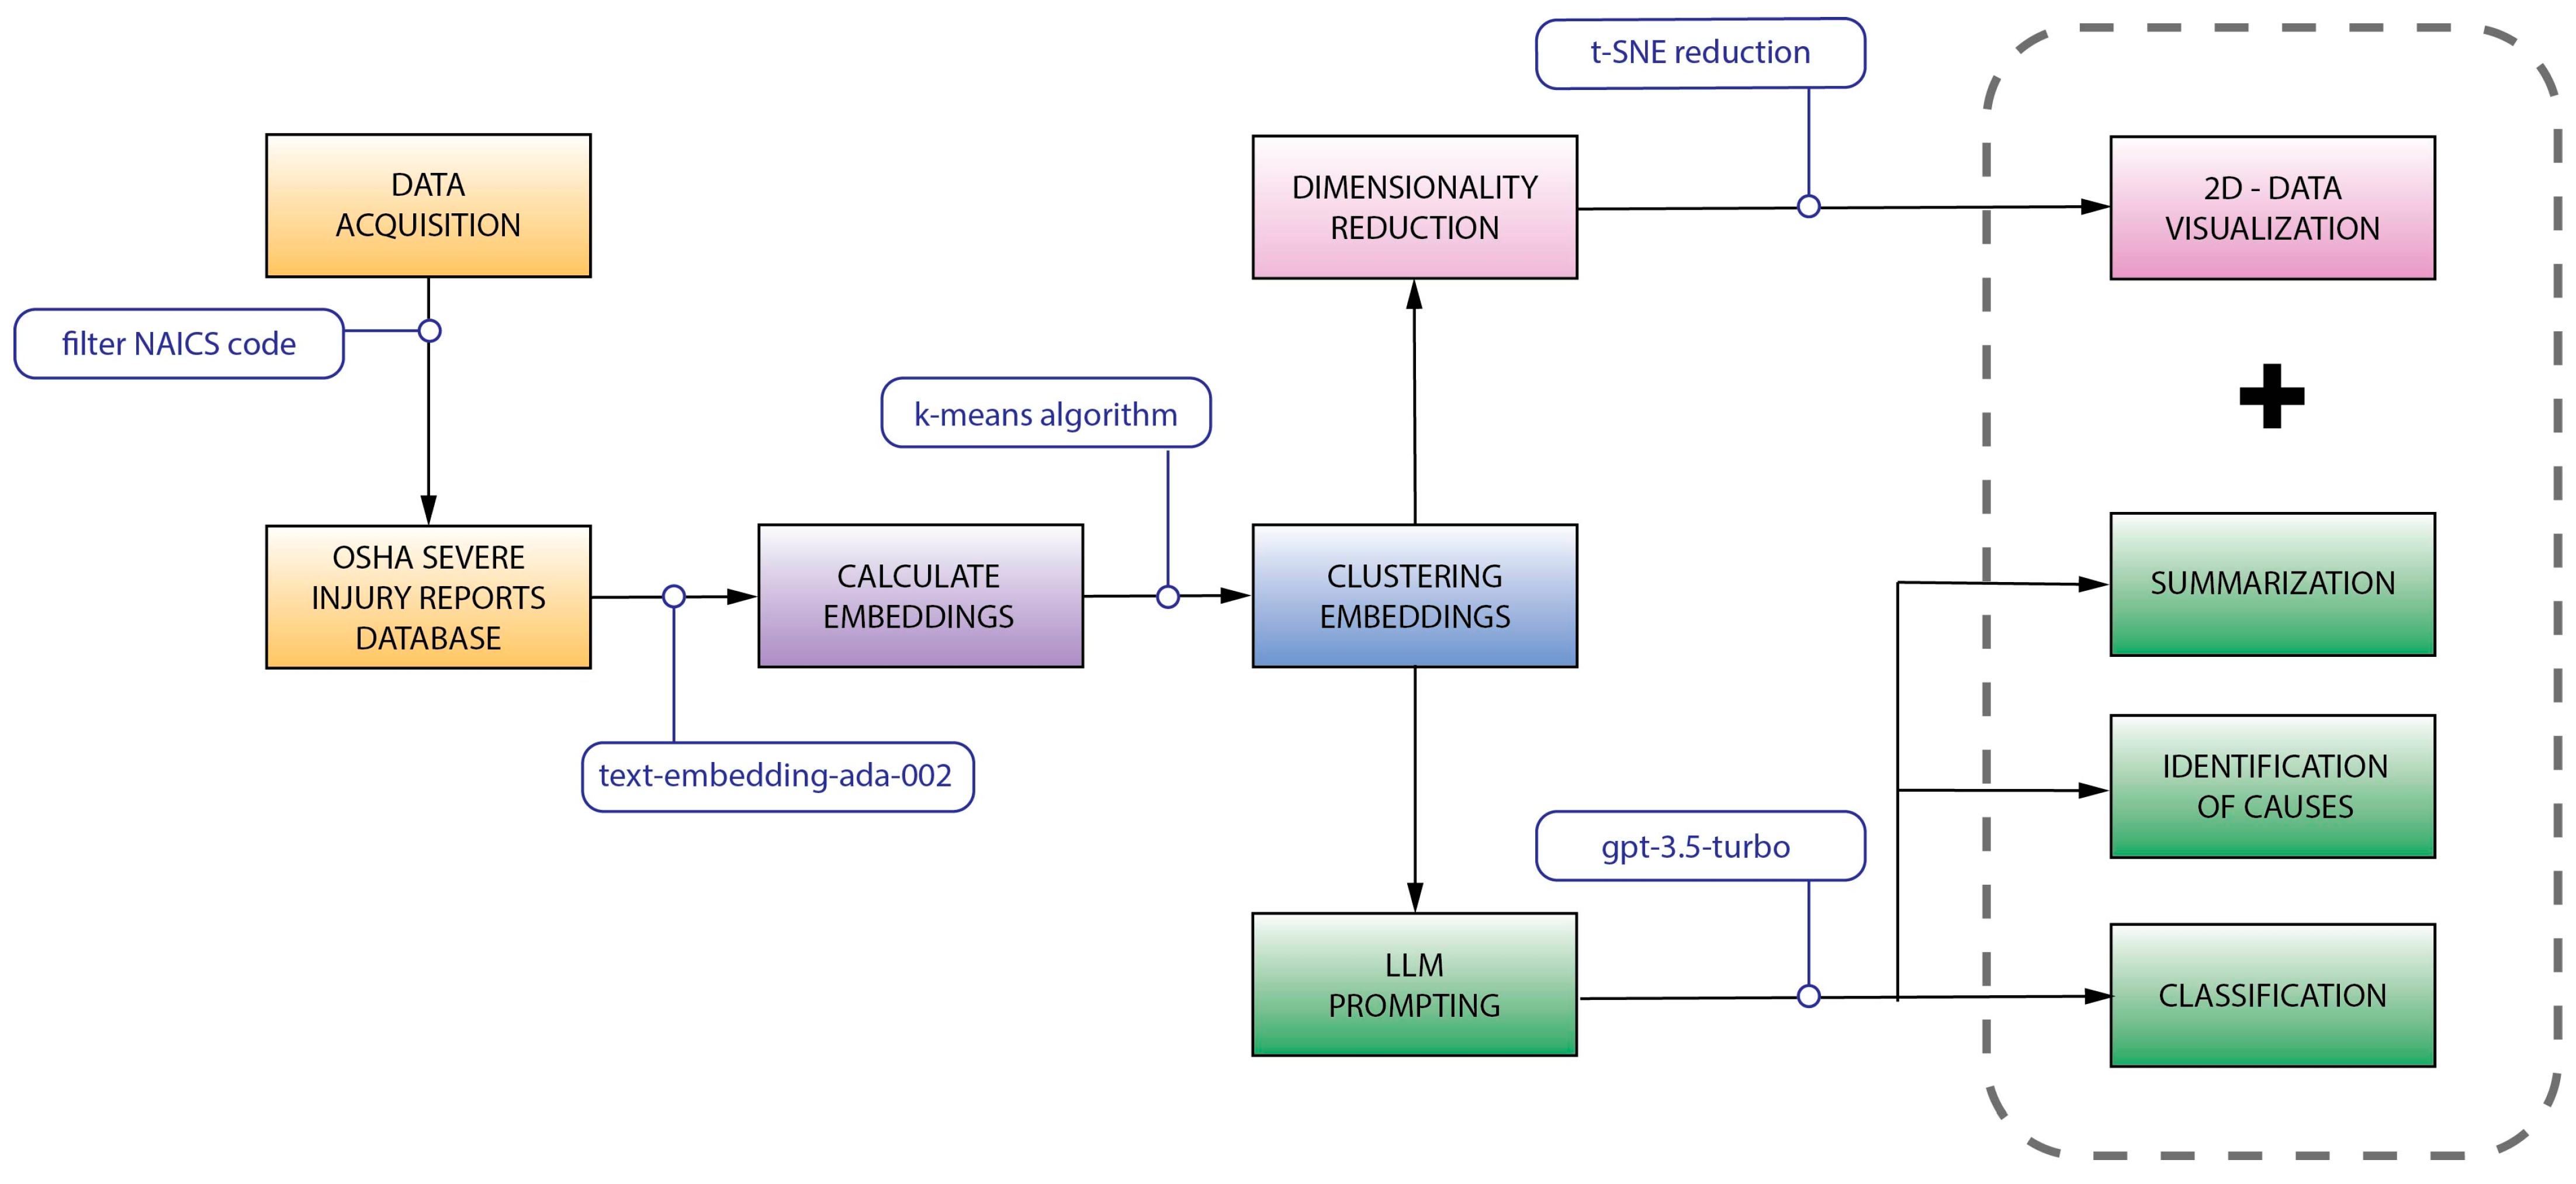
3.1. Research Framework: An Overview

To uncover the overarching types and causes of accidents in the highway construction industry beyond broad categories like struck-by and falls, a new approach was devised for this study (see Figure 1). The initial step involves identifying a substantial source of textual data. The Occupational Safety and Health Administration (OSHA) Severe Injury Reports (SIR) database was chosen due to its rich textual information, especially the descriptive narratives. Although this database covers various U.S. industries, the focus is exclusively on the highway construction industry. Beyond the categorical variables in this database, the narratives offer a comprehensive overview of each incident, capturing additional details that might be overlooked in traditional categorical classification.
In contrast to commonly used natural language processing (NLP) techniques, the focus of this approach is on fully leveraging the contextual nature of incident narratives, which is accomplished through using novel large language models (LLMs). To achieve this, incidents are initially grouped by contextual relevance. An embedding model calculates a numerical vector representation for each incident, preserving the natural meaning within the narratives. The K-means clustering algorithm is then employed to group these vectors based on similarities. Eventually, an advanced statistical visualization technique (t-SNE reduction) aids in disseminating two-dimensional plots of groups that exhibit higher similarity.
Once an appropriate number of groups, or clusters, is determined, the LLM is employed to carry out three main tasks: summarization, cause identification, and classification. Each task requires careful prompt design, guiding the language model to provide a probabilistically correct response for a specified action. Summarization aids in evaluating the resulting clusters, eliminating the time-consuming process of manually dissecting commonalities among incidents. Cause identification aims to pinpoint potential areas of improvement to prevent similar accidents in the future. Lastly, the language model re-evaluates the original coding of other categorical variables within the selected database through a more traditional classification approach.

3.2. OSHA SIR Database Acquisition and Description

For this study, data from the OSHA Severe Injury Reports (SIR) database were used. OSHA requires employers in the US to report all severe work-related injuries from 1 January 2015. This database was selected due to the completeness and heavy concentration of textual information in comparison to other publicly available databases.
The OSHA SIR database, covering data from 2015 to 2021, has over 70,000 entries, including all the industry codes from the North American Industry Classification System (NAICS). NAICS Code 237310, which refers to Highway, Street, and Bridge Construction was investigated in this study. This code encompasses a range of activities, from conventional paving to airport runway construction and painting of traffic lines. A total of 1032 accidents with severe injuries were reported under code 237310, about 1.5% of the total reported injuries, ranking the highway construction industry among the top 10 percent of contributors to severe injuries relative to all other industries. Figure 2 demonstrates the distribution of incidents across the United States. The legend in this figure shows arbitrary colors and symbols that were utilized to represent distinct states, with the number of incidents per state enclosed in parentheses.
Overall, the top three states reporting severe injuries are Texas, Florida, and Pennsylvania, with 18.5%, 14.3%, and 9% of contributions, respectively, but the figures may not account for incidents that are exclusively regulated by state OSHA plans in certain regions. These figures are based on incidents falling under federal OSHA jurisdiction only, excluding those under state jurisdiction.
The database comprises 26 columns, each providing descriptive information about each incident, including accident date, employer details, accident location and coordinates, and counts of hospitalizations, amputations, and more. For code 237310, 90.2% of accidents resulted in hospitalization, while 17.5% of cases involved an amputation. From the perspective of safety training and accident prevention, the columns containing the final narrative, the accident’s nature, the part of the body involved, event title, and source present the most relevant data. Aside from the final narrative, which is a complete textual description of the incident, these columns were coded as per the Occupational Injury and Illness Classification Manual (OIICS) manufactured by the BLS.
The “NatureTitle” signifies the nature of the worker’s injury or illness, while the “Part_of_Body_Title” specifies the injury’s location. The “EventTitle” offers a more quantifiable accident description compared to the final narrative, with numerous titles falling into classic accident types like “struck-by” or “fall”. The “SourceTitle” pinpoints the primary source of the accident, such as a vehicle or specific equipment.
Table 1 defines the top entries for each of the specified columns, but due to the plethora of information in these fields, deriving general statistics to identify major causes of accidents is challenging. The coding of injuries adheres to the OIICS system, resulting in a level of detail that may be overly fine-grained, as illustrated in Table 1, where columns like the source of injury have 1407 different categories, with 230 selected for the unique 237,310 industry code. In contrast, the “Final_Narrative” provides a text-based description of the accident, which appears to be relatively correlated with other characterizations. The narratives describing accidents can vary from brief single sentences to detailed descriptions, often containing valuable information that cannot be adequately captured by traditional descriptive statistics, highlighting the valuable role of NLP tools and LLMs in enhancing the analysis of these narratives.

3.3. Calculating Embeddings

NLP techniques, including word and text embeddings, provide valuable tools for analyzing construction incidents. Word embedding models, like Word2Vec and GloVe, create high-dimensional vectors to capture contextual relations within texts and enable the analysis of word similarity and syntactical meaning, while pre-trained text embedding models such as BERT have gained popularity in various NLP tasks [15,33,34]. Sentence embedding models, such as SBERT and various GPTs, are based on the Transformer architecture (akin to LLMs) and tend to excel in classification and clustering tasks [13].
Unlike the predecessor of word embedding models, these Transformer-based models are grounded in the concept that words that are used in similar context tend to share similar meanings [35,36]. Both word and sentence embedding models have been used extensively in prior research on roadway incidents and textual specification extraction [10,11,37]. Newer models like OpenAI’s Ada embedding model, known as text-embedding-ada-002, have demonstrated top performance among other models, as indicated by the Massive Text Embedding Benchmark (MTEB), making it particularly applicable for clustering safety-related incidents in this study [36].
The text embeddings derived in this study are associated to the “Final_Narrative” field, extracted from the SIR database. The initial step involves the tokenization of sentences, where the text is effectively divided into smaller, more manageable units using a tokenizer. The cl100k_base tokenizer utilized here operates automatically, employing algorithms to identify and separate words, punctuation, and other linguistic elements. These tokens are then fed into the text-embedding-ada-002 embedding model, where they are transformed into dense numerical vectors representing the semantic meaning and contextual information of each token, as demonstrated in Figure 3. The various colors in this figure symbolize a conceptual representation of the chunked tokens in the “Final_Narrative” field after the tokenizer algorithmically identifies linguistic elements.
To train text embedding models for generating embeddings, similar to the ada-002 model selected in this study, a Transformer encoder ( E ) is employed. Since OpenAI’s model is pre-trained, it does not need to be explicitly trained for the new data that are extracted from the SIR database. To assist in the comprehension of how the modern embedding models are initially trained, the following explanation is provided: The encoder, denoted as  E , maps input sequences  x  and  y  to embedding vectors  v x  and  v y , respectively [38]. This process involves the use of special tokens  S O S  (Start of Sequence) and  E O S   (End of Sequence), which are appended to the beginning and the end of a sequence, respectively. Additionally, the ⨁ symbol is used to indicate the concatenation of two strings. The similarity between these inputs is measured using the cosine similarity between their respective embeddings [38]. This comprehensive process, facilitated by the Transformer encoder, enables the model to create meaningful embeddings that capture the semantic nuances and contextual information of the input text.
v x = E S O S x   x E O S x
v y = E S O S y   y E O S y
S i m x , y = v x · v y v x · v x

3.4. Clustering Embeddings

The process of clustering calculated embeddings into categories based on their similarities facilitates a detailed examination of the major causes of accidents. The embedding model generates dense vectors of 1536 dimensions, necessitating advanced methods for analysis. Due to this, a machine learning algorithm, specifically the unsupervised K-means technique, is employed. The selection of K-means was driven by its proven ability to statistically cluster high-dimensional datasets, as evidenced by its successful application in numerous studies related to accident clustering [9,15,39,40,41]. The Euclidean distance ( d ) in n-dimensional space is a measure of the true straight-line distance between two points ( p ,   q ) in Euclidean space within the context of K-means clustering.
d p , q = p 1 q 1 2 + + p i q i 2 + + p n q n 2
This deliberate choice was informed by a wealth of studies showcasing the effectiveness of K-means in similar scenarios and its capacity to handle high-dimensional data. One method of evaluating cluster performance is the elbow technique, where the average sum of square errors ( S S E ) is plotted against the number of clusters ( n ). The  S S E , as represented in Equation (6), is a measure of how far each data point ( x i ) is from the mean of its respective cluster ( X ¯ j ), squared, and summed across all data points. The kink point where the rate of change is most drastic is typically selected as the optimal number of clusters.
S S E = i = 1 p j = 1 n x i X ¯ j 2

3.5. Dimensionality Reduction

In high-dimensional data analyses, dimensionality reduction and clustering techniques are essential for visualizing and understanding complex datasets such as the SIR database. Traditional dimensionality reduction techniques like Principal Component Analysis (PCA) and classical multidimensional scaling (MDS) have limitations on vectors of high magnitude [42]. To overcome them, t-Distributed Stochastic Neighbor Embedding (t-SNE), as proposed by Maaten and Hinton (2008), is employed for visualizing high-dimensional data while maintaining the original integrity, preserving relationships between data points, and facilitating a better understanding of the relationships between incidents [15,42]. t-SNE computes similarities between points, maps them into a lower-dimensional space, and minimizes the divergence between the original and reduced similarities. By using the t-distribution, t-SNE reveals patterns in K-means clusters, making it valuable for understanding complex data.

3.6. LLM Summarization and Cause Identification

The Transformer architecture employed by LLMs represents a novel neural network design. These models consist of three key components, an encoder, a decoder, and attention mechanisms, which collaborate to comprehend the relationships between different parts of the input data, allowing LLMs to process and generate text [13,32,43]. The Generative Pre-Trained (GPT) modeling approach involves estimating the probabilities of a symbol sequences  s 1 ,   s 2 , , s n    in an unsupervised manner. It learns from a set of examples  x 1 ,   x 2 , , x n    and calculates joint probabilities  p x  by factorizing them into products of condition probabilities based on the contextual information that is associated with the symbols [44].
p x = i = 1 n p s n | s 1 , , s n 1
GPT learns how likely certain words are to appear together by analyzing many example sentences. Without needing explicit labels for each example, it instead figures out the probability of each word based on the words that came before it, breaking down the overall probability of the entire sentence into smaller, context-based probabilities for each word. This way, it can generate more coherent and contextually appropriate text when given a prompt.
Interacting with these models is typically achieved through a process called prompting, where the LLM generates a response based on a provided prompt without further fine-tuning and/or training [14,32]. Nevertheless, using natural language can be comparatively intricate compared to conventional statistical machine learning models that primarily handle numerical data. Modifying user prompts can considerably impact the quality of responses, as the prompt guides the model to return a probabilistic response. To mitigate the loss of quality, leveraging the in-context learning capabilities of these models can yield accurate responses without requiring weight updates or additional training [32].
The GPT-3.5 model, OpenAI’s largest LLM, was selected to perform the tasks of summarization and classification of clusters and incidents. The final versions of the initial prompts and refinement prompts, after iterations of prompt refinement and manual evaluation, resulted in a process utilizing the entire dataset (1032 incidents), providing the model with a few entries at a time until all entries were evaluated. From this process, generated summaries and the top three causes that pertain to each cluster were derived.
To retrieve responses from the GPT-3.5 model (version: gpt-3.5-turbo-0613, last accessed on 8 June 2023), a Python script was written to execute repeated API calls to OpenAI’s platform. Unlike the familiar ChatGPT web interface, all inferences were performed through OpenAI’s backend, which requires proprietary access to their servers through a monetary-request-based procedure. This allows for fast and reliable access to GPT-3.5 inferencing, which is necessary for performing the tasks in this study. Each request is limited to a specific token count or word count, further increasing the number of subsequent requests to the model.

3.7. LLM Classification

The analysis also involved employing the LLM for classification to re-evaluate what was originally coded in the database. To facilitate this process, specific fields were isolated from the original OSHA SIR database, including “EventTitle”, “NatureTitle”, “Part_of_Body_Title”, “SourceTitle” “Hospitalized”, and “Amputation”.
By compiling a list of unique entries for each of these fields, the LLM was prompted to determine the most applicable entry for each incident. The following metrics were then used to evaluate the classification of the fields within the OSHA database: accuracy, recall, precision, and F1Score [39,40]. These metrics are defined as follows: True Positive ( T P ) indicates when the predicted class matches the actual class and is true in binary classification. True Negative ( T N ) signifies that the predicted class aligns with the actual class and is false in binary classification. False Positive ( F P ) occurs when the predicted class does not match the actual class, predicting true when the actual class is false in binary classification. False Negative ( F N ) corresponds to situations where the predicted class does not match the actual class, predicting false when the actual class is true in binary classification [39,40].
A c c u r a c y = T P + T N T P + F P + F N + T N
R e c a l l = T P T P + F N
P r e c i s i o n = T P T P + F P
F 1 S c o r e = 2 × P r e c i s i o n × R e c a l l P r e c i s i o n + R e c a l l
In scenarios where binary classification was not applicable, such as in cases other than hospitalization and amputation columns, accuracy, recall, and precision can be used to assess the classification capabilities of the LLM. Accuracy provides an overall measure of correctness in the model’s predictions. Recall and precision, on the other hand, focus on the model’s ability to correctly classify positive instances. To comprehensively evaluate the model’s performance, the F1Score combines precision and recall into a single metric, striking a balance between the two aspects.

4. Results and Discussion

4.1. Clustering Embeddings

With representative vectors of individual incidents, derived using the embedding methodology described in Section 3.4, K-means clustering was performed for a varying number of clusters. Selecting the optimal number of clusters ( n ) for the K-means algorithm did not appear to have innate relationships to the provided dataset. By evaluating the SSE of each cluster, there was no obvious kink point or elbow in Figure 4, where the rate of change in error drastically decreases. Thus, this elbow technique had to be coupled with visual and manual investigations of the resulting clusters (Figure 5). The outlined circle in this figure signifies the selected number of clusters for further analysis, as described through the following discussion.
Figure 5a,c demonstrate the edge cases for the number of clusters, four and ten clusters, respectively. Visually, the four clusters are too spread out and are much less centered than the ten clusters, which is key to a centric-based algorithm. Alternatively, the ten clusters appeared to be too fine-grained or too specific. As the number of clusters increases, the convoluted Cluster 1 and 3 in Figure 5a obtain a further distinction, indicating that the incidents in these clusters originally had significant overlap (based purely on the representative embeddings). The six clusters presented in Figure 5b were selected for further analysis. These clusters occupy distinct regions while maintaining minimal overlap between clusters.

4.2. LLM Summarization and Cause Identification

The prompt template conveyed in Figure 6 demonstrates the iterative process of the initial prompt and its subsequent refinement for cluster summarization. These prompts were carefully curated to guide the LLM in generating the most accurate responses. While inferencing the LLM, the initial prompt in Figure 6 was provided with a few randomly selected incidents for a distinct cluster. This initial prompt then queried GPT-3.5 through OpenAI’s API, where a first iteration of the cluster summary was obtained. In the next stage, prompt refinement, the previously generated summary was provided to the model to contribute more information from newly introduced highway construction incidents. This stage was repeated until all incidents in a distinct cluster were included in the summarization. Since the model lacks a history of previous requests, it would only create a summary based on the next iteration of incidents, inherently disregarding the previous iteration. This process was used to summarize each cluster and determine potential causes and was repeatedly applied until all 1032 accidents in the database were included.
Table 2 offers the conclusive generated summaries of each cluster, albeit with minor redactions due to spatial constraints. Extensive experimentation with various cluster numbers and queries underscored the consistency of well-defined results, obtained from the summaries of six clusters. These LLM-generated summaries (Table 2) closely resembled the insights gained through manual analysis (Table 3), eliminating the necessity for labor-intensive case-by-case investigations. The majority of the resulting cluster summaries concentrated on accident causes, with some alluding to specific body parts that were affected.
Similar to the prompt template designed for GPT-3.5 to summarize the distinct clusters, Figure 7 shows the final template that was curated for the language model to identify the top three major causes within each cluster. The resulting major causes are exemplified for clusters 1 through 6 in Table 4. While several causes that were highlighted by the LLM are common safety concerns such as “inadequate training or communication”, numerous causes were intricately related to incidents within the respective cluster. This analytical approach holds the potential to bolster safety training and reduce the likelihood of similar accidents. For example, it can underscore the importance of addressing issues like the absence of equipment guarding, contributing to a more effective prevention strategy for upper limb injuries.

4.3. LLM Classification

Following summarization and causation analysis, the LLM classification of multiple fields within the OSHA database was conducted, and performance was evaluated, as shown in Table 5. For non-binary classification, the LLM achieved the highest accuracy of 93.7% with the “EventTitle”, while other fields also demonstrated comparable accuracies.
Both binary fields, namely, hospitalization and amputation, were assessed alongside each of the four major non-binary fields, as depicted in the classification prompt template (Figure 8). These queries yielded consistent results, as they were not contingent on prior field coding. However, it is noteworthy that their classification varied when presented in conjunction with other fields. This variability could be attributed to the inherent randomness of the LLM or slight differences in the prompt templates. For instance, if hospitalization was prompted in the context of the “EventTitle” rather than the “NatureTitle”, the model might emphasize that a struck-by accident is more likely to result in hospitalization.
Manually assessing instances where GPT-3.5 classified the incidents differently also provides some valuable insight into the adequacy of the original database coding. Figure 9 demonstrates the model’s ability to classify incidents in a more allusive fashion. Even with a limited number of examples, which represent only a fraction of those generated during the analysis, new perspectives on evaluating existing database entries can be gained. Incidents #31 and #313 serve as clear illustrations, where the narrative explicitly mentions hospitalization or amputation, whereas the field entry suggests their absence in the original coding. Moreover, as exemplified in incident #178, although the incident resulted from a fall, the cause, in this case, was more likely attributed to the worker tripping over a railing. These revelations and discrepancies between the narrative and the original database coding underscore the model’s capacity to re-evaluate entries, offering a more comprehensive examination and more comprehensive findings for statistical purposes.

4.4. Post-Classification Summary Validation

GPT-3.5, when applied to the final narrative for summarization tasks, lacked awareness of the original content in the database’s other columns. In contrast, the auxiliary GPT-3.5 classification task demonstrated high accuracy across various columns, providing valuable insights into the database’s categorization quality. Initially kept separate for assessing (1) summarization performance and (2) database re-evaluation through classification, the classification results are considered more representative of the final narrative. The top entries for each cluster in the classification results should highlight distinct accident causes. By comparing LLM-generated summaries with these top entries, the relevance of each summary can be gauged. Therefore, after implementing the LLM classification, Table 6 summarizes the top three entries in each field for the respective cluster, aiding in the evaluation of the LLM’s summarization.
This table indicates that the resulting summaries effectively represent the leading entries in each field, exclusively relying on the information from the final narratives without reference to previous coding. This comprehensive analysis, beyond manual cluster evaluation, presents definitive outcomes that were not previously as easy to obtain. To demonstrate the interpretation of this table and the LLM’s capabilities, the generated summary of cluster 1 specifically focuses on vehicle struck-by accidents. Within this cluster, the “EventTitle” predominantly consists of cases labeled “Pedestrian struck by forward-moving vehicle in work zone” (21.9%), along with a high number of highway vehicles (24.6%), representing the source of accidents.
The notable consistency across all clusters and their respective fields further underscores the effectiveness of this approach. In addition to the correlation between the summary for cluster 1 and its categorization, cluster 2 (contact with objects) had a high number of cases involving “Injured by slipping or swinging object held by injured worker”, at 9.7%. Cluster 3 (heat-related) related to 90.6% of cases where the person was subjected to “Exposure to environmental heat”, and so on.
In addition to the confirmation of the consistency of summarization and their associated clusters, more insightful information can be derived when the other categories are brought to our attention. For example, cluster 2, associated with the contact of objects, identifies that powered saws significantly contribute to the incidents, at 10.5%, which may be mitigated by the “Lack of proper equipment maintenance, inspection, and training”, which was also identified by the LLM when prompted to identify potential causes.
These aggregations also clearly indicate that most clusters have a high rate of hospitalization, ranging from 95 to 100%, as shown in clusters 1–5. Interestingly, the final cluster, related to upper limb injuries, has the lowest rate of hospitalization (49.8%). Instead, this cluster has the highest rate of amputations at 72.3%. With only information about the final narrative, the LLM was able to properly discern an entire group of accidents related to these types of injuries. Since these incidents in cluster 6 had a relatively low hospitalization rate, the attention to other clusters may be attractive to personnel, yet 210 incidents indicate that upper limb injuries may be of relative importance.

5. Conclusions

This study introduced a large language model (LLM)-based approach that is able to analyze extensive textual data of accidents in the highway construction industry. The approach, applied to the OSHA Severe Injury Reports database, yielded a significant expansion of the scope of identifying major accident categories and their causes, exceeding the limits of traditional descriptive statistics that may confine results that may only be relevant to niche situations and overlook general incident details. The utilization of narratives provides insights that were not previously accessible, making it a powerful asset for safety research.
The study’s use of LLMs for narrative analysis surpassed conventional descriptive statistics, delving deeper into general trends in major accident categories. This leads to a better understanding of the causes and characteristics that might otherwise remain overlooked. The ability to identify accidents that are linked to specific factors, such as burns from heated materials or equipment, provides valuable insights for safety enhancements.
Furthermore, the global clustering of incidents based on narrative content, paired with advanced visualization and pattern discovery, offers a powerful tool for identifying intricate data relationships. Notably, the LLM classification revealed cases in which the narrative context offers critical details that were eluded from originally reported field entries, demonstrating the model’s ability to reassess entries and yield more precise and comprehensive statistical outcomes. The optimized approach to data clustering yielded datasets that indicate major accident causes, such as environmental heat or the involvement of specific body parts (e.g., upper limbs).
The outcomes that were derived from this approach can play a pivotal role in enhancing safety practices within the transportation industry. Federal and state DOTs, along with construction companies, can use these insights to craft more effective accident prevention and intervention strategies. Leveraging LLMs enables a holistic grasp of accident narratives, uncovering patterns, major causes, and specific areas of concern in highway construction safety. This, in turn, facilitates the implementation of targeted safety measures, improved training programs, and proactive policies.

Author Contributions

Conceptualization, L.K., M.S. and L.S.d.S.; methodology, M.S., I.S., L.K. and L.S.d.S.; software, M.S. and I.S.; validation, M.S., I.S. and L.S.d.S.; formal analysis, M.S., L.S.d.S. and I.S.; investigation, M.S., I.S. and L.S.d.S.; data curation, M.S., L.S.d.S. and I.S; writing—original draft preparation, M.S., L.S.d.S. and I.S.; writing—review and editing, M.S. and L.S.d.S.; supervision, L.K. and L.S.d.S. All authors have read and agreed to the published version of the manuscript.

Funding

This research was supported by the University of Pittsburgh Anthony Gill Chair and funded by the Impactful Resilient Infrastructure Science & Engineering (IRISE) Consortium, grant PITTIRISE2018.

Institutional Review Board Statement

Not applicable.

Informed Consent Statement

Not applicable.

Data Availability Statement

The SIR database is publicly available at the Department of Labor website: https://catalog.data.gov/dataset/severe-injury-report-sir-data-68a35 (accessed on 20 May 2023).

Acknowledgments

The authors acknowledge the advice and assistance provided by the IRISE technical panel.

Conflicts of Interest

The authors declare no conflicts of interest.

References

  1. Al-Shabbani, Z.; Sturgill, R.; Dadi, G.B. Developing a Pre-Task Safety Briefing Tool for Kentucky Maintenance Personnel. Transp. Res. Rec. 2018, 2672, 187–197. [Google Scholar] [CrossRef]
  2. Kazan, E.; Usmen, M.A. Worker safety and injury severity analysis of earthmoving equipment accidents. J. Saf. Res. 2018, 65, 73–81. [Google Scholar] [CrossRef]
  3. Abdolahi, F.H.; Variani, A.S.; Varmazyar, S. Predicting Ability of Dynamic Balance in Construction Workers Based on Demographic Information and Anthropometric Dimensions. Saf. Health Work 2021, 12, 511–516. [Google Scholar] [CrossRef] [PubMed]
  4. Kaur, H.; Wurzelbacher, S.J.; Bushnell, P.T.; Bertke, S.; Meyers, A.R.; Grosch, J.W.; Naber, S.J.; Lampl, M. Occupational Injuries among construction workers by age and related economic loss: Findings from Ohio workers’ compensation, USA: 2007–2017. Saf. Health Work 2023, 14, 406–414. [Google Scholar] [CrossRef] [PubMed]
  5. Das, S.; Tabesh, M.; Dadashova, B.; Dobrovolny, C. Diagnosis of Encroachment-Related Work-Zone Crashes by Applying Pattern Recognition. Transp. Res. Rec. 2023, 2677, 222–236. [Google Scholar] [CrossRef]
  6. Hinze, J.; Huang, X.; Terry, L. The Nature of Struck-by Accidents. J. Constr. Eng. Manag. 2005, 131, 262–268. [Google Scholar] [CrossRef]
  7. Valcamonico, D.; Baraldi, P.; Amigoni, F.; Zio, E. A framework based on Natural Language Processing and Machine Learning for the classification of the severity of road accidents from reports. Proc. Inst. Mech. Eng. Part O J. Risk Reliab. 2022. [Google Scholar] [CrossRef]
  8. Cambraia, F.B.; Saurin, T.A.; Formoso, C.T. Identification, analysis and dissemination of information on near misses: A case study in the construction industry. Saf. Sci. 2010, 48, 91–99. [Google Scholar] [CrossRef]
  9. Chokor, A.; Naganathan, H.; Chong, W.K.; Asmar, M.E. Analyzing Arizona OSHA Injury Reports Using Unsupervised Machine Learning. Procedia Eng. 2016, 145, 1588–1593. [Google Scholar] [CrossRef]
  10. Jeon, J.; Xu, X.; Zhang, Y.; Yang, L.; Cai, H. Extraction of Construction Quality Requirements from Textual Specifications via Natural Language Processing. Transp. Res. Rec. 2021, 2675, 222–237. [Google Scholar] [CrossRef]
  11. Fang, W.; Luo, H.; Xu, S.; Love, P.E.D.; Lu, Z.; Ye, C. Automated text classification of near-misses from safety reports: An improved deep learning approach. Adv. Eng. Inform. 2020, 44, 101060. [Google Scholar] [CrossRef]
  12. Chen, P.; Fu, G.; Wang, Y.; Meng, H.; Lv, M. Accident causation models: A comparison of SCM and 24Model. Proc. Inst. Mech. Eng. Part O J. Risk Reliab. 2022, 237, 810–822. [Google Scholar] [CrossRef]
  13. Vaswani, A.; Shazeer, N.; Parmar, N.; Uszkoreit, J.; Jones, L.; Gomez, A.N.; Polosukhin, I. Attention is All you Need; Curran Associates Inc.: Red Hook, NY, USA, 2017. [Google Scholar] [CrossRef]
  14. Wei, J.; Tay, Y.; Bommasani, R.; Raffel, C.; Zoph, B.; Borgeaud, S.; Fedus, W. Emergent Abilities of Large Language Models. arXiv 2022, arXiv:2206.07682v2. [Google Scholar]
  15. Dhalmahapatra, K.; Shingade, R.; Mahajan, H.; Verma, A.; Maiti, J. Decision support system for safety improvement: An approach using multiple correspondence analysis, t-SNE algorithm and K-means clustering. Comput. Ind. Eng. 2019, 128, 277–289. [Google Scholar] [CrossRef]
  16. Alateeq, M.M.; Fathimathul Rajeena, P.P.; Ali, M.A.S. Construction Site Hazards Identification Using Deep Learning and Computer Vision. Sustainability 2023, 15, 2358. [Google Scholar] [CrossRef]
  17. Shohet, I.M.; Luzi, M.; Tarshish, M. Optimal allocation of resources in construction safety: Analytical-empirical model. Saf. Sci. 2018, 104, 231–238. [Google Scholar] [CrossRef]
  18. Uddin, S.M.J.; Albert, A.; Ovid, A.; Alsharef, A. Leveraging ChatGPT to Aid Construction Hazard Recognition and Support Safety Education and Training. Sustainability 2023, 15, 7121. [Google Scholar] [CrossRef]
  19. Li, J.; Wu, C. Deep Learning and Text Mining: Classifying and Extracting Key Information from Construction Accident Narratives. Appl. Sci. 2023, 13, 10599. [Google Scholar] [CrossRef]
  20. Ballal, S.; Patel, D. Enhancing Construction Site Safety: Natural Language Processing for Hazards Identification and Prevention. J. Eng. Proj. Prod. Manag. 2024, 14, 1–11. [Google Scholar] [CrossRef]
  21. Zheng, Z.; Wang, F.; Gong, G.; Yang, H.; Han, D. Intelligent technologies for construction machinery using data-driven methods. Autom. Constr. 2023, 147, 104711. [Google Scholar] [CrossRef]
  22. Yoo, B.; Kim, J.; Park, S.; Ahn, C.R.; Oh, T. Harnessing Generative Pre-Trained Transformers for Construction Accident Prediction with Saliency Visualization. Appl. Sci. 2024, 14, 664. [Google Scholar] [CrossRef]
  23. Ganguli, R.; Miller, P.; Pothina, R. Effectiveness of Natural Language Processing Based Machine Learning in Analyzing Incident Narratives at a Mine. Minerals 2021, 11, 776. [Google Scholar] [CrossRef]
  24. Shen, Q.; Wu, S.; Deng, H.; Cheng, J.C.P. BIM-Based Dynamic Construction Safety Rule Checking Using Ontology and Natural Language Processing. Buildings 2022, 12, 564. [Google Scholar] [CrossRef]
  25. Hong, Y.; Xie, H.; Bhumbra, G.; Brilakis, I. Comparing Natural Language Processing Methods to Cluster Construction Schedules. J. Constr. Eng. Manag. 2021, 147. [Google Scholar] [CrossRef]
  26. Goh, Y.M.; Ubeynarayana, C.U. Construction accident narrative classification: An evaluation of text mining techniques. Accid. Anal. Prev. 2017, 108, 122–130. [Google Scholar] [CrossRef]
  27. Ricketts, J.; Barry, D.; Guo, W.; Pelham, J. A Scoping Literature Review of Natural Language Processing Application to Safety Occurrence Reports. Safety 2023, 9, 22. [Google Scholar] [CrossRef]
  28. Prieto, S.A.; Mengiste, E.T.; García de Soto, B. Investigating the Use of ChatGPT for the Scheduling of Construction Projects. Buildings 2023, 13, 857. [Google Scholar] [CrossRef]
  29. Li, G.; Wang, X. Construction and Path of Urban Public Safety Governance and Crisis Management Optimization Model Integrating Artificial Intelligence Technology. Sustainability 2023, 15, 7487. [Google Scholar] [CrossRef]
  30. Pothina, R.; Ganguli, R. Contextual Representation in NLP to Improve Success in Accident Classification of Mine Safety Narratives. Minerals 2023, 13, 770. [Google Scholar] [CrossRef]
  31. Saka, N.; Taiwo, R.; Salami, B.A.; Ajayi, S.; Akande, K.; Kazemi, H. GPT models in construction industry: Opportunities, limitations, and a use case validation. Dev. Built Environ. 2024, 17, 100300. [Google Scholar] [CrossRef]
  32. Brown, T.B.; Mann, B.; Ryder, N.; Subbiah, M.; Kaplan, J.D.; Dhariwal, P.; Amodei, D. Language Models Are Few-Shot Learners; Curran Associates Inc.: Red Hook, NY, USA, 2020. [Google Scholar] [CrossRef]
  33. Dieng, A.B.; Ruiz, F.J.R.; Blei, D.M. Topic Modeling in Embedding Spaces. Trans. Assoc. Comput. Linguist. 2020, 8, 439–453. [Google Scholar] [CrossRef]
  34. Reimers, N.; Gurevych, I. Sentence-BERT: Sentence Embeddings Using Siamese BERT-Networks; Association for Computational Linguistics: Toronto, ON, Canada, 2019; Available online: http://arxiv.org/abs/1908.10084 (accessed on 23 May 2023).
  35. Harris, Z.S. Distributional Structure. WORD 1954, 10, 146–162. [Google Scholar] [CrossRef]
  36. Muennighoff, N.; Tazi, N.; Magne, L.; Reimers, N. MTEB: Massive Text Embedding Benchmark; Association for Computational Linguistics: Toronto, ON, Canada, 2023; Available online: http://arxiv.org/abs/2210.07316 (accessed on 11 July 2023).
  37. Heidarysafa, M.; Kowsari, K.; Barnes, L.; Brown, D. Analysis of Railway Accidents’ Narratives Using Deep Learning. In Proceedings of the 2018 17th IEEE International Conference on Machine Learning and Applications (ICMLA), Orlando, FL, USA, 17–20 December 2018. [Google Scholar] [CrossRef]
  38. Neelakantan, A.; Xu, T.; Puri, R.; Radford, A.; Han, J.M.; Tworek, J.; Weng, L. Text and Code Embeddings by Contrastive Pre-Training. arXiv 2022, arXiv:2201.10005. [Google Scholar] [CrossRef]
  39. Yassin, S.S. Road accident prediction and model interpretation using a hybrid K-means and random forest algorithm approach. SN Appl. Sci. 2020, 2, 1576. [Google Scholar] [CrossRef]
  40. Ma, Z.; Mei, G.; Cuomo, S. An analytic framework using deep learning for prediction of traffic accident injury severity based on contributing factors. Accid. Anal. Prev. 2021, 160, 106322. [Google Scholar] [CrossRef] [PubMed]
  41. Deng, F.; Gu, W.; Zeng, W.; Zhang, Z.; Wang, F. Hazardous Chemical Accident Prevention Based on K-Means Clustering Analysis of Incident Information. IEEE Access 2020, 8, 180171–180183. [Google Scholar] [CrossRef]
  42. van der Maaten, L.; Hinton, G. Viualizing data using t-SNE. J. Mach. Learn. Res. 2008, 9, 2579–2605. Available online: http://jmlr.org/papers/v9/vandermaaten08a.html (accessed on 24 May 2023).
  43. Radford, A.; Narasimhan, K.; Salimans, T.; Sutskever, I. Improving Language Understanding by Generative Pre-Training. 2018. Available online: https://api.semanticscholar.org/CorpusID:49313245 (accessed on 17 July 2023).
  44. Radford, A.; Wu, J.; Child, R.; Luan, D.; Amodei, D.; Sutskever, I. Language Models Are Unsupervised Multitask Learners. 2019. Available online: https://api.semanticscholar.org/CorpusID:16002553 (accessed on 17 July 2023).
Figure 1. Data processing, visualization, and LLM usage approach.
Applsci 14 01352 g001
Figure 2. Map of OSHA SIR incidents with highway construction NAICS code.
Applsci 14 01352 g002
Figure 3. Narrative–to–embedding-vector flowchart.
Applsci 14 01352 g003
Figure 4. Cluster-wise average SSE and elbow technique for the optimal number of clusters.
Applsci 14 01352 g004
Figure 5. (a) Four, (b) six, and (c) ten clusters identified in highway construction incidents (t—SNE embedding).
Applsci 14 01352 g005aApplsci 14 01352 g005b
Figure 6. LLM summary prompt template.
Applsci 14 01352 g006
Figure 7. LLM major cause identification prompt template.
Applsci 14 01352 g007
Figure 8. LLM classification prompt template.
Applsci 14 01352 g008
Figure 9. Examples of LLM classification being different from original database coding.
Applsci 14 01352 g009
Table 1. OSHA SIR characterization and top entries for the highway construction industry.
Column *Unique ValuesTop 5 Entries Frequency §
SIR237310
“NatureTitle”
Nature of Injury or Illness
50358Fractures35%
Amputations18%
Soreness, pain, hurt—unspecified injury8%
Cuts, lacerations7%
Heat (thermal) burns, unspecified3%
“Part_of_Body_Title”
Part of Body Affected
16682Multiple body parts, n.e.c.9%
Leg(s), unspecified7%
Fingertip(s)7%
Finger(s), fingernail(s), n.e.c.6%
Body systems6%
“EventTitle”
Event or Exposure
342460Compressed or pinched by shifting objects or equipment8%
Injured by slipping or swinging object held by injured worker5%
Pedestrian struck by forward-moving vehicle in work zone 5%
Exposure to environmental heat5%
Other fall to lower level, unspecified4%
“SourceTitle”
Source of Injury or Illness
1407230Highway vehicle, motorized, unspecified5%
Heat—environmental5%
Nonclassifiable4%
Saw-powered, except chainsaws3%
Dump truck3%
* Obtained directly from the OSHA SIR database; entries pertaining only to NAICS code 237310; for highway construction industry (NAICS code 237310); § out of 1032 cases from database.
Table 2. LLM summarization of incidents (clusters 1–6).
Cluster No. and Title *Summary
Cluster 1

Struck by Vehicle or Heavy Equipment
The road construction incidents involve a wide range of injuries, including fractures, head injuries, and back injuries, with many employees requiring hospitalization. The incidents highlight the importance of proper safety protocols, such as wearing seat belts and using proper equipment, to prevent accidents and injuries on road construction sites. The incidents also demonstrate the need for ongoing safety training and vigilance in the road construction industry. The incidents involve employees being struck by vehicles or equipment, either while working alongside the road or while performing tasks such as loading or unloading equipment. The incidents emphasize the need for increased safety measures and awareness in the road construction industry to prevent further accidents and injuries, including the importance of proper traffic control and the dangers of distracted driving. The incidents also show the importance of proper footwear, the dangers of working in close proximity to moving vehicles, and the need for proper maintenance of equipment.
Cluster 2

Contact with Objects or Equipment
The incidents range from employees being struck by objects or run over by equipment to suffering severe lacerations and fractures, resulting in hospitalization and surgery. Many incidents involve the use of heavy machinery, while others involve slips and trips on uneven surfaces or debris. The incidents emphasize the importance of prioritizing safety in the workplace through ongoing safety training, awareness, supervision, communication, and hazard identification to ensure a safe work environment for all employees. Commonalities between the incidents include employees being struck by equipment, suffering fractures and lacerations, and being hospitalized for their injuries. The incidents also highlight the importance of proper clothing and equipment maintenance, as well as the need for caution when working in trenches or around heavy machinery.
Cluster 3

Heat-Related
All of the listed incidents involve employees working in road construction who suffered from heat-related illnesses or dehydration. Many employees were hospitalized due to symptoms such as heat exhaustion, cramping, and dehydration. The incidents occurred during hot weather conditions, with some employees working in temperatures as high as 86 degrees. The affected employees were performing a variety of tasks, including paving, welding, shoveling, and flagging. The incidents highlight the importance of proper hydration and heat safety measures in road construction work.
Cluster 4

Falling Objects or Personnel
The road construction incidents involved a variety of tasks and equipment, resulting in a range of injuries from falls, being struck by falling objects, being caught in between objects, and tripping. Safety equipment was not always used properly or was unhooked at the time of the incident, and employees were not always using proper equipment or following proper procedures. Many of the incidents resulted in hospitalization and required emergency surgery, with injuries ranging from broken bones to electrical burns and partial amputations. Commonalities between the incidents include falls from heights, being struck by falling objects, and improper use of equipment or failure to follow proper procedures.
Cluster 5

Heated Materials or Equipment
These road construction incidents involve a range of injuries, including burns from hot materials such as asphalt and oil, exposure to chemicals like battery acid and gasoline, and electrical hazards. Many incidents occur while employees are working on or near machinery and are injured due to equipment malfunctions or accidents. Other incidents involve employees being struck by vehicles or falling from heights. Employers must ensure that employees are aware of the potential hazards and are equipped with the necessary protective gear to prevent injuries. Commonalities between the incidents include hot materials causing burns, equipment malfunctions leading to accidents, and employees being exposed to hazardous materials.
Cluster 6

Upper Limb Injuries
The road construction incidents continue to involve hand and finger injuries, with many resulting in amputations. The injuries were caused by a variety of tools and equipment, including saws, forklifts, cranes, and excavators. Many of the incidents involved pinch points or kickbacks, where the worker’s hand or finger was caught between two objects or pulled into a dangerous area. The commonalities between the incidents include the use of heavy machinery, pinch points, kickbacks, and human error, emphasizing the importance of proper training, safety protocols, and equipment maintenance to prevent these types of injuries.
* Title manually disseminated from generated summary; slightly redacted from generated summary for spatial limitations.
Table 3. Manual dissemination of generated summaries (clusters 1–6).
Cluster No. Manual Dissemination of Generated Summary
Cluster 1Incidents pertained to moving vehicles or equipment. Most of these vehicles were passenger vehicles, vans, and SUVs, indicating issues with traffic control at the work zone. It is unclear if the trucks involved in the accidents were passing traffic or construction trucks. Issues within the work zone were observed as well, with 18% of accidents involving construction equipment such as pavers, rollers, scrapers, and others.
Cluster 2Mainly consisted of incidents resulting in contact with objects, equipment, or equipment parts. Most accidents in this cluster involved struck-by accidents between an object/equipment/equipment part and a worker. These incidents seemed to occur inside the work zone and were not related to passing passenger traffic.
Cluster 3Almost entirely comprised of heat-related incidents. Some incidents (3 of the 53 cases) were related to heart attacks that do not seem directly heat-induced
Cluster 4Focused on incidents that were related to falling (either a worker or an object) from a certain height, with a majority of cases involving a worker falling. Some other incidents were related to objects or equipment parts falling onto workers.
Cluster 5Mostly related to incidents where workers suffer burns from heated materials or equipment, also including incidents related to electrical hazards.
Cluster 6Consisted of cases where workers suffered injuries to upper limbs, including damage to hands, fingers, or arms. These accidents are less severe in consequence, with approximately half of the accidents requiring some level of hospitalization. However, these accidents tend to result in permanent upper limb damage, with most accidents requiring amputation procedures.
Table 4. LLM major causes of incidents (clusters 1–6).
Cluster No. and Title *Top Three Major Causes
Cluster 1

Struck by Vehicle or Heavy Equipment
1. 
Inadequate traffic control measures: The majority of incidents involved employees being struck by passing vehicles, indicating a lack of proper traffic control measures such as warning signs, barriers, or flaggers.
2. 
Inadequate training and supervision: Several incidents involved employees being injured while performing tasks such as loading or unloading equipment or working with heavy machinery.
3. 
Failure to follow safety procedures: Many of the incidents involved employees being injured while performing tasks that are known to be hazardous, such as working with heavy machinery or working in close proximity to traffic.
Cluster 2

Contact with Objects or Equipment
1. 
Inadequate hazard assessments: Many of the incidents were caused by hazards that were not properly identified or addressed, such as falling objects, collapsing trenches, and unexpected equipment movements.
2. 
Lack of proper equipment maintenance, inspection, and training: Several incidents were caused by equipment malfunctions or failures, such as saw blades kicking back, rigging slipping, and machinery grabbing onto employees.
3. 
Failure to follow established safety procedures and inadequate training: Many incidents were caused by employees not following established safety procedures, such as not wearing appropriate personal protective equipment, not properly securing materials and equipment, and not following proper operating procedures.
Cluster 3

Heat-Related
1. 
Heat exposure: Many of the incidents were caused by heat exposure, which can lead to heat exhaustion, heat stroke, dehydration, and other heat-related illnesses.
2. 
Lack of training and safety protocols: Some incidents were caused by a lack of training and safety protocols for working in hot conditions.
3. 
Physical exertion: Many of the incidents were caused by physical exertion, such as shoveling, lifting heavy objects, or operating heavy machinery.
Cluster 4

Falling Objects or Personnel
1. 
Inadequate fall protection: Many of the incidents involved falls from heights, such as falling off of formwork or aerial lifts. In several cases, employees were not wearing appropriate fall protection equipment, such as harnesses or guardrails, which could have prevented or minimized their injuries.
2. 
Insufficient equipment training and maintenance: Some of the incidents occurred because employees were not properly trained on how to use equipment safely or were using equipment that was not properly maintained.
3. 
Failure to follow established safety procedures: In several incidents, employees were injured because established safety procedures were not followed. Additionally, some incidents occurred because employees were not following established procedures for working at heights or in confined spaces.
Cluster 5

Heated Materials or Equipment
1. 
Inadequate handling of hot materials and lack of personal protective equipment: The incidents involving hot materials highlight the need for proper personal protective equipment and training on how to handle hot materials.
2. 
Lack of proper equipment maintenance and inspection: Equipment failure or malfunction was a major cause of incidents. Lack of proper maintenance and inspection of equipment contributed to these incidents.
3. 
Inadequate communication and training: Many incidents were caused by employees attempting tasks without proper training or safety procedures in place. Lack of communication between workers and with other contractors on the site also contributed to incidents.
Cluster 6

Upper Limb Injuries
1. 
Pinch points: Many incidents involved workers’ fingers getting caught in pinch points, such as between equipment and materials, resulting in partial or full amputations of fingers.
2. 
Lack of guarding: Several incidents involved workers using power tools, such as saws and table saws, without proper guarding. Additional incidents involving a lack of guarding include an employee’s finger being amputated while installing a soil/cave protection system, an employee’s finger being smashed by a T-post driver, and an employee’s fingers being crushed by an excavator bucket.
3. 
Inadequate communication: In some incidents, workers were injured due to miscommunication or lack of communication between coworkers. Additionally, incidents involving loading and unloading equipment onto trailers resulted in finger amputations due to a lack of communication between workers.
* Title manually disseminated from generated summary; slightly redacted from generated causes for spatial limitations.
Table 5. Performance of LLM classification.
FieldPrecisionRecallF1ScoreAccuracy
EventTitle97.496.196.793.7
NatureTitle96.094.495.290.8
Part_of_Body_Title96.895.196.092.2
SourceTitle96.896.696.793.6
Hospitalization *89.285.487.378.0
Amputation *88.492.390.396.5
Hospitalization 88.277.882.771.2
Amputation 95.695.695.698.4
Hospitalization 88.084.186.075.8
Amputation 91.595.093.297.6
Hospitalization §89.588.789.180.8
Amputation §84.593.488.795.8
* In the context of “EventTitle”; in the context of “NatureTitle”; in the context of “Part_of_Body_Title”; § in the context of “SourceTitle”.
Table 6. Top categorized OSHA fields, identified for each cluster after LLM classification.
ClusterEventTitleNatureTitlePart_of_Body_TitleSourceTitle
Cluster 1

Cases: 228/1031
Hospitalized: 99.6%
Amputation: 1.8%
Pedestrian struck by forward-moving vehicle in work zone (21.9%)Fractures (49.1%)Nonclassifiable (11.8%)Highway vehicle, motorized, unspecified (24.6%)
Pedestrian struck by vehicle in work zone, unspecified (9.6%)Traumatic injuries and disorders, unspecified (7.5%)Multiple body parts, n.e.c. (10.1%)Dump truck (9.2%)
Other fall to lower level, unspecified (7.0%)Internal injuries to organs and blood vessels of the trunk (6.1%)Leg(s), unspecified (10.1%)Truck-motorized freight hauling and utility, unspecified (8.8%)
Cluster 2

Cases: 238/1031
Hospitalized: 95.8%
Amputation: 8.4%
Injured by slipping or swinging object held by injured worker (9.7%)Fractures (49.6%)Leg(s), unspecified (14.7%)Saw-powered, except chainsaws (10.5%)
Pedestrian struck by vehicle in non-roadway area, unspecified (6.7%)Cuts, lacerations (17.2%)Lower leg(s) (11.8%)Excavating machinery, unspecified (9.7%)
Struck by falling object or equipment, n.e.c. (5.9%)Amputations (8.0%)Foot (feet), unspecified (10.9%)Milling machines, cold planers, and road profilers (3.8%)
Cluster 3

Cases: 53/1031
Hospitalized: 100%
Amputation: 0%
Exposure to environmental heat (90.6%)Effects of heat and light, n.e.c. (37.7%)BODY SYSTEMS (90.6%)Heat—environmental (90.6%)
Fall on same level, n.e.c. (1.9%)Effects of heat and light, unspecified (26.4%)Heart (5.7%)Floors, walkways, ground surfaces, unspecified (1.9%)
Fall through surface or existing opening, less than 6 feet (1.9%)Heat exhaustion, prostration (13.2%)Head, unspecified (1.9%)Nonclassifiable (1.9%)
Cluster 4

Cases: 210/1031
Hospitalized: 99%
Amputation: 1%
Struck by falling object or equipment, n.e.c. (10.0%)Fractures (68.6%)Multiple body parts, n.e.c. (11.4%)Bridges, dams, locks (12.9%)
Other fall to lower level, unspecified (9.5%)Soreness, pain, hurt, unspecified injury (6.2%)Leg(s), unspecified (10.5%)Structural elements, n.e.c. (6.2%)
Other fall to lower level, less than 6 feet (8.6%)Internal injuries to organs and blood vessels of the trunk (4.8%)Lower leg(s) (8.6%)Beams—unattached metal (5.7%)
Cluster 5

Cases: 89/1031
Hospitalized: 100%
Amputation: 1.1%
Contact with hot objects or substances (23.6%)Heat (thermal) burns, unspecified (25.8%)Multiple body parts, n.e.c. (25.8%)Paving asphalt, asphaltic cement (18.0%)
Ignition of vapors, gases, or liquids (9.0%)Second-degree heat (thermal) burns (16.9%)Nonclassifiable (11.2%)Nonclassifiable (10.1%)
Exposure through intact skin, eyes, or other exposed tissue (5.6%)Third- or fourth-degree heat (thermal) burns (11.2%)Leg(s), unspecified (6.7%)Gasoline, diesel fuel, jet fuel (9.0%)
Cluster 6

Cases: 213/1031
Hospitalized: 49.8%
Amputation: 72.3%
Compressed or pinched by shifting objects or equipment (34.3%)Amputations (71.4%)Fingertip(s) (32.9%)Nonclassifiable (8.9%)
Injured by slipping or swinging object held by injured worker (10.3%)Cuts, lacerations (9.4%)Finger(s), fingernail(s), n.e.c. (29.6%)Saw-powered, except chainsaws (4.7%)
Caught in running equipment or machinery during regular operation (8.5%)Fractures (5.2%)Finger(s), fingernail(s), unspecified (26.3%)Cranes, unspecified (4.7%)
Disclaimer/Publisher’s Note: The statements, opinions and data contained in all publications are solely those of the individual author(s) and contributor(s) and not of MDPI and/or the editor(s). MDPI and/or the editor(s) disclaim responsibility for any injury to people or property resulting from any ideas, methods, instructions or products referred to in the content.

