Article

Applying Microbial-Induced Calcium Carbonate Precipitation Technology to Improve the Bond Strength of Lightweight Aggregate Concrete after High-Temperature Damage

1
Department of Civil Engineering, National Chung-Hsing University, 145 Xingda Rd., South District, Taichung City 40227, Taiwan
2
Department of Civil Engineering and Geomatics, Cheng Shiu University, No. 840, Chengching Rd., Niaosong District, Kaohsiung 83347, Taiwan
3
Center for Environmental Toxin and Emerging-Contaminant Research, Cheng Shiu University, No. 840, Chengching Rd., Niaosong District, Kaohsiung 83347, Taiwan
4
Super Micro Mass Research and Technology Center, Cheng Shiu University, No. 840, Chengching Rd., Niaosong District, Kaohsiung 83347, Taiwan
*
Author to whom correspondence should be addressed.
Appl. Sci. 2024, 14(4), 1416; https://doi.org/10.3390/app14041416
Submission received: 17 January 2024 / Revised: 3 February 2024 / Accepted: 4 February 2024 / Published: 8 February 2024

Abstract

:
High temperatures and external force can easily lead to a decline in the bond strength of reinforced concrete components. Microbial-induced calcium carbonate precipitation (MICP) technology has considerable potential for repairing concrete. Given this, this study utilized MICP technology to improve the bond strength of heat- and pull-damaged lightweight aggregate concrete (LWAC). The specimens of a control group (Group A) and two experimental groups (Group B and Group C) were prepared. The experimental group was prepared using lightweight aggregates (LWAs) that had been immersed in a nutrient solution and a bacterial solution. The control group was prepared using LWAs that were not immersed in a nutrient solution or bacterial solution. These specimens healed themselves in different ways after exposure to high temperatures (300 °C and 500 °C) and pull-out damage. Groups A and B adopted the same self-healing method; that is, their specimens were placed in a computer-controlled incubator at 40 °C. Group C used different self-healing methods. The specimens in this group were soaked in a mixed solution of urea and calcium acetate at 40 °C for two days and then taken out and placed in an incubator at 40 °C for two days. A cycle took four days until the expected self-healing age was reached. After being exposed to 300 °C and self-healed for 90 days, the residual bond strengths of the secondary pull-out tests in Groups A, B, and C were 20.63, 22.13, and 25.69 MPa, respectively. Moreover, compared with Group A, the relative bond strength ratios of the secondary pull-out tests in Groups B and C increased by 5.8% and 20.3%, respectively. This demonstrates that MICP technology could effectively improve the bond strength of LWAC after high-temperature and pull-out damage.

1. Introduction

Concrete mixed with lightweight aggregates (LWAs) instead of normal-weight aggregates is called lightweight aggregate concrete (LWAC). Since most LWAs are porous and have a low specific gravity, LWAC is lightweight and has better seismic resistance than traditional normal-weight aggregate concrete (NWC) [1]. Taking structural LWAC as an example, its main benefit is to reduce the weight of the structure so the size of columns, foundations, and other stress-bearing members can be reduced. Therefore, the inertial force generated by an earthquake due to the structure is relatively small, and the design load can be reduced to save on construction costs. Moreover, LWAC has very good thermal insulation performance, and its thermal conductivity is only half that of ordinary NWC. However, LWAC usually has higher levels of brittleness and worse mechanical properties compared with NWC, which has the same compressive strength [2]. With the innovation of modern science and technology, on the one hand, the production technology used for artificial lightweight aggregates (LWAs) has been continuously improved. On the other hand, nanosilica, nanoscale titanium oxide, and various fibers have been appropriately mixed into LWAC [3,4,5,6]. Therefore, fiber-reinforced LWAC with a high strength and good toughness has emerged as the times required, making its application in structural concrete more common [7,8,9,10].
In reinforced concrete (RC) members, most researchers agree that the bond behavior between the rebars and the concrete mainly consists of three resistance mechanisms: adhesion, friction resistance, and rib support [11,12,13,14,15,16,17]. In terms of exploring the bond behavior between concrete and rebar, pull-out tests are generally used. Many studies have explored the bond behavior of rebar to LWAC at room temperature. Previously, the strength of LWAs was lower, resulting in LWAC having a worse bond strength than NWC at the same level of compressive strength [18]. However, some studies have shown the opposite result, namely, that LWAC has a better bond strength. The research conducted by Mo et al. [19] showed that the peak bond stress of a well-confined LWAC could be expressed as 3.5 f c . This is significantly larger than the value of 2.5 f c suggested by the CEB-FIP standard [20]. Wang et al. [21] established a theoretical analysis model for the bond stress slip between rebar and LWAC. Liu et al. [22] studied the bond–slip behavior between corroded bars and LWAC. Yang et al. [23] proposed a bond–slip relationship of rebar in LWAC under the influence of additional embedded rebar around the central rebar. Tang [1] studied the uniaxial bond stress–slip behavior of reinforcing bars in LWAC. The results showed that the larger the rib height to the diameter ratio of the rebar, the greater the peak bond stress.
In contrast, there is relatively little research on the bond behavior between rebar and LWAC after being exposed to high temperatures. The chemical composition, physical structure, and water vapor moisture content of LWAC change when it is exposed to high temperatures. This results in a severe decrease in its mechanical properties, thereby affecting its bond behavior with steel bars. Varghese et al. [24] pointed out that the failure of RC members exposed to fire mainly arises due to the reduction in the bond strength between the embedded rebar and concrete. Kelvinley et al. [25] conducted experimental studies on the bond–slip behavior of rebar in fiber-reinforced LWAC at ambient and elevated temperatures, respectively. Their experimental results showed that exposure to high temperatures changed the failure mode from a more ductile pull-out mode to a brittle splitting mode. As a result, the peak bond strength and toughness of the specimen’s bond–slip behavior were reduced. Tang [26] studied the effects of steel fiber and polypropylene fiber blending on the bond strength of LWAC after being exposed to high temperatures. The results showed that the blending method of using one type of fiber or mixing two types of fiber had no significant effect on the residual bond strength of LWAC after being exposed to a temperature of 800 °C.
Due to many unavoidable factors, RC members often exhibit cracks or local damage. If these cracks or local damage are not repaired in time or are handled improperly, it will further lead to the loss of bond strength between the rebar and concrete [27]. Therefore, repairing damaged concrete to ensure the performance of RC components has always been a research focus in academic circles. General repairs use commercially available chemicals and polymers, which are sources of health and environmental risks [28]. In addition, these methods of repairing damaged concrete structures are less than satisfactory. In view of this, many researchers have changed their approach to biomineralization technology [29,30,31,32,33]. The use of insoluble compounds produced through microbial metabolism to fill cracks in concrete materials is a developing self-healing technology for concrete [34,35,36]. Therefore, research on microbial-induced calcium carbonate precipitation (MICP) to repair concrete cracks is gaining prominence. However, if unprotected bacteria are added directly to concrete, which is highly alkaline in nature, it can easily lead to bacterial death. This results in a substantial reduction in bacterial populations [29]. Jonkers et al. [30] confirmed that alkali-resistant spore bacteria have the ability to repair cracks in concrete. To avoid the reduction in or disappearance of the bacterial population, appropriate carriers must be used to protect the bacteria [31]. Nimafar et al. [32] used bacteria to repair concrete cracks caused by high temperatures and improve concrete properties. Their test results showed that specimens repaired using Saccharomyces pasteurianus and Bacillus sphaeroides showed a 31–93% increase in compressive strength. Chen et al. [33] explored the feasibility of using biomineralization technology to repair the performance of fiber-reinforced LWAC after exposure to high temperatures. The test results showed that, in the absence of nutrient sources, the bacterial mineralization rate of the test specimen was slow. Chen et al. [9] applied biomineralization technology to improve the bond strength of fiber-reinforced LWAC damaged in pull-out tests. Their test results show that biomineralization technology could effectively improve the residual bond strength of the damaged specimens.
The principle of MICP technology is to use the bacteria found in nature that can produce urease through their own metabolic activities to decompose carbon sources in the surrounding environment [37]. It then undergoes a biomineralization reaction with the calcium source material to form dense calcium carbonate precipitation with a cementing effect. The minerals formed are naturally pollution-free and have high cementing properties. They can better replace the traditional cementing building materials currently on the market, such as epoxy resin, polyurethane, cement, etc., effectively avoiding chemical erosion of the environment [38]. The concept of this technology was proposed in the early 21st century and is still being improved. Research directions include the selection and culture of bacteria and the effects of changes in temperature, acid, liquid concentration, injection rate, and other conditions on cementation strength during the mineralization process. At present, this technology can be realized relatively stably under certain experimental conditions, and it is mainly used in four applications: solidifying soil, repairing concrete cracks, impermeabilizing building materials, and controlling heavy metals or radioactive metals. From this point of view, MICP technology contributes to the sustainability of building materials [39,40].
This study aims to apply MICP technology to improve the bond strength of fiber-reinforced LWAC after high-temperature and pull-out damage. This is an innovative research topic, as we found few studies exploring this topic. In view of this, fiber-reinforced LWAC specimens were prepared and sorted into a control group and two experimental groups. The experimental groups were prepared using specially treated LWAs. The control group was prepared using ordinary LWAs. The planned testing included high-temperature testing, compressive strength testing, and a series of tensile tests. In addition, the precipitates filling the cracks in the MICP-repaired specimens were also analyzed.

2. Experimental Programs

2.1. Test Items and Parameters

The novelty of this study is the application of MICP technology to improve the bond strength of LWAC after high temperatures and pull-out damage. Specimens for a control group (Group A) and two experimental groups (Group B and Group C) were prepared. The control group was prepared using LWAs that were not immersed in a nutrient solution or bacterial solution. The experimental group was prepared using LWAs that had been immersed in a nutrient solution and a bacterial solution. Each liter of nutrient source solution contained 80 g of calcium lactate and 1 g of yeast extract. The concentration of bacterial solution was approximately 108 cells/mL. When the concrete specimens had been cured to the age of 28 days, they were divided into two parts. A portion of the specimens was designed to undergo compressive strength and pull-out tests at room temperature. Another part of the specimen was first subjected to a high-temperature test. After reaching the target temperature and cooling to room temperature, the specimens were divided into unhealed ones and healed ones. The unhealed specimens were immediately subjected to the pull-out test. The healed specimens were first self-healed to the planned age, and then the pull-out test was performed. Groups A and B used the same self-healing method, which involved placing their specimens in a programmable incubator at 40 °C. Group C used different self-healing methods. The specimens in this group were soaked in a nutrient solution at 40 °C for two days and then taken out and placed in a programmable incubator at 40 °C for two days. A cycle took four days until the expected self-healing age was reached, such as 28 days or 90 days. After self-healing, the damaged specimens were subjected to a secondary pull-out test.
Table 1 lists the test items and test parameters of this study. The test project is mainly a series of pull-out tests. The test parameters include the self-healing method, self-healing age, and target temperature. Research on the repair of fire-damaged reinforced concrete shows that the fire damage temperature is mostly between 300 °C and 500 °C. When the temperature is higher than 500 °C, the hydrate of cement has been severely decomposed, and the aggregates have also degraded to varying degrees. In this case, there is no need to repair the concrete. Based on the above, this study conducted high-temperature exposure of LWAC specimens at specific temperatures of 300 °C and 500 °C. This is different from a real-world fire scenario, but it still provides insight into the effectiveness of MICP technology in repairing LWAC specimens within the temperature range discussed.

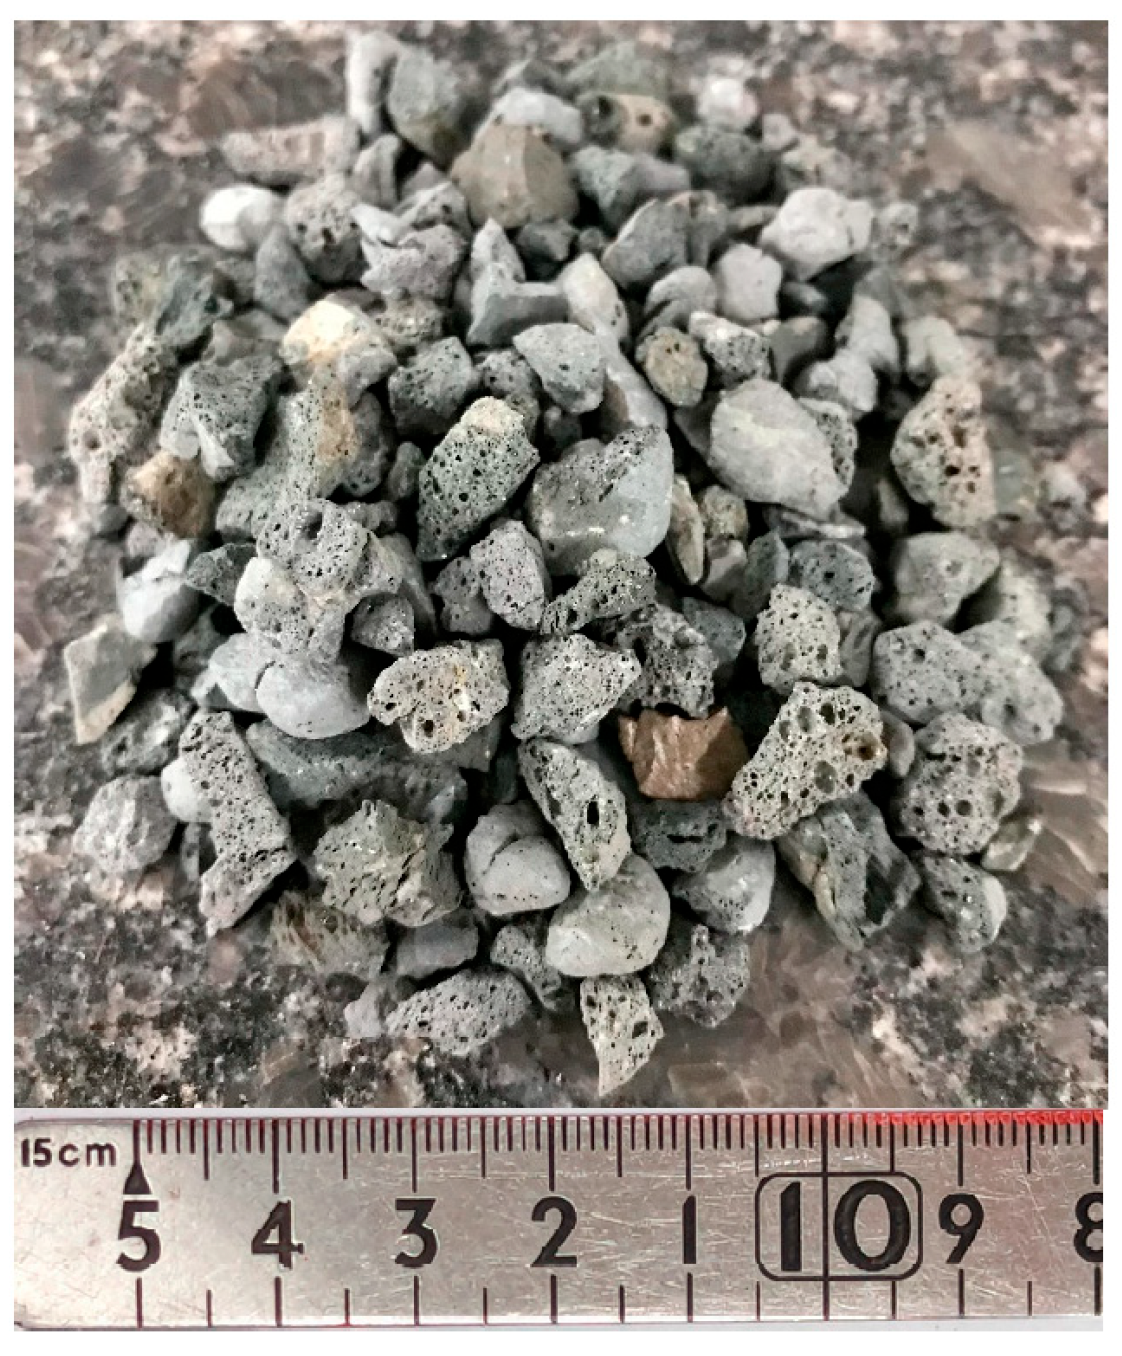
2.2. Microbial Culture and Raw Materials Used

In terms of the bacterial culture, the materials used included Sporosarcina pasteurii (S. pasteurii), calcium lactate, yeast extract, calcium acetate, and urea. The details of these materials can be found in the authors’ previously published paper [9]. For the concrete testing, the materials used included cement, water, fine aggregate, lightweight coarse aggregate (as shown in Figure 1), superplasticizer, fiber, reinforcement, and a thermocouple. The thermocouple was a K-type nickel–aluminum alloy, with a sensitivity of 41 μV/° Cand a temperature range of −50 °C to 1200 °C. Detailed information on the remaining materials can be found in the authors’ previously published paper [9].

2.3. Strain Implantation and Mixture Proportion

The details on the culture and sporulation of the strains can be found in the authors’ previously published article [41]. The LWAC specimens of the control group (Group A) and the experimental groups (Group B and Group C) were made. The LWAs used in Group A were not implanted with bacterial strains, while the LWAs used in Groups B and C were implanted with bacterial strains. The detailed steps for the implanting the bacterial strains into the LWAs can be found in the authors’ previously published article [9]. The required 28-day compressive strength of each group of LWAC was 45 MPa. The amount of each material was determined based on trial mixing, taking into account both the fresh and hardened characteristics of the concrete. Each group of LWAC had the same mix proportions, as shown in Table 2. The mixing of each group of concrete followed ASTM C511 [42] specifications.

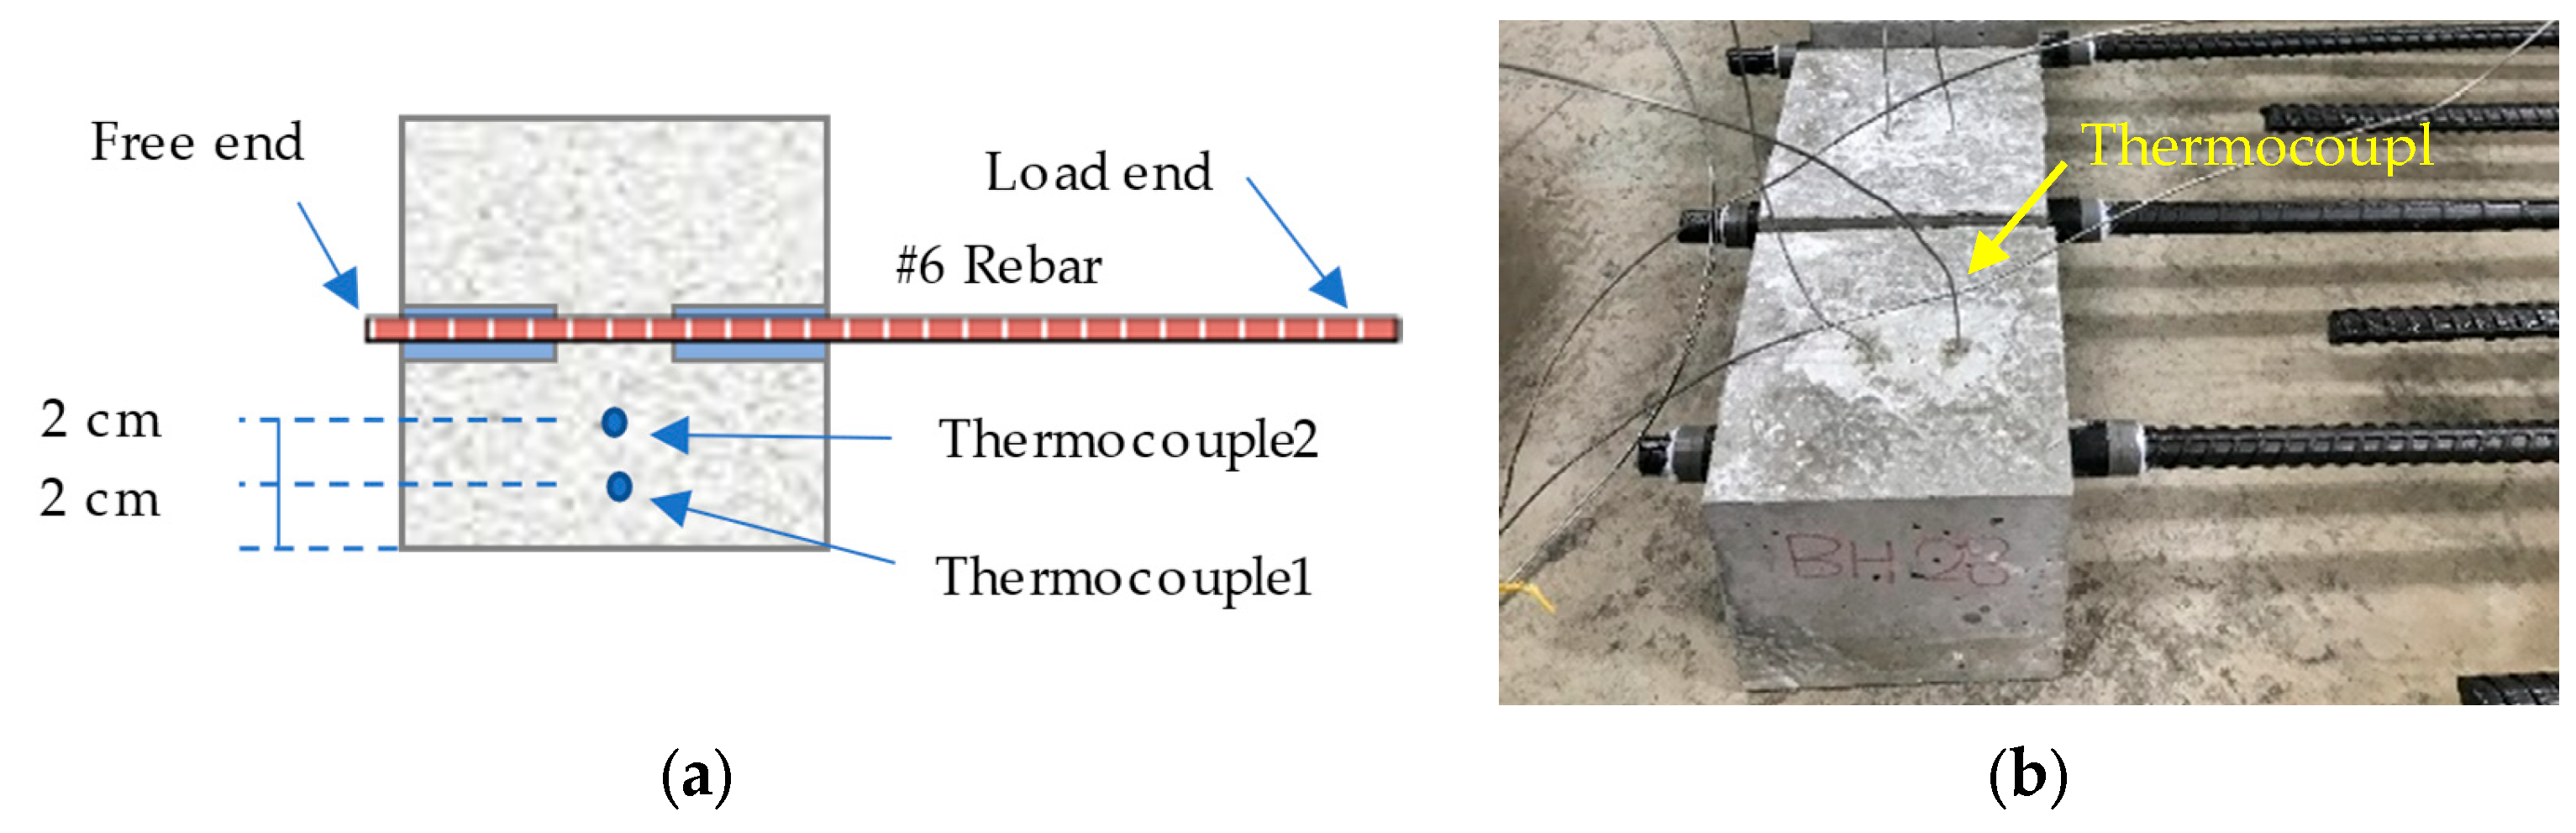
2.4. Specimen Preparation

The compression test was performed on cylindrical specimens with a diameter of 100 mm and a height of 200 mm. The pull-out specimen was a cube with a side of 150 mm, and a #6 rebar was embedded vertically along its central axis, as shown in Figure 2. The embedded length ( l e ) was three times the rebar diameter ( d b ) to create a local bonding. To achieve the effect of local bonding, when casting the pull-out specimen, the unbounded area of the rebar was sealed with PVC sleeves. In addition, to prevent the rebar of the specimens from being corroded during the curing process, the joints between the PVC sleeves and the rebar were filled with water-based sealant, and high-temperature anti-rust paint was sprayed on the surface of the protruding rebar. Moreover, the specimen contained three transverse stirrups made of #3 rebar to prevent its splitting failure when the longitudinal rebar was under tension.
After the mixing operation of each group of concrete mixtures was completed, a slump test was performed, and the slump value was recorded. Then, twenty-four cylindrical specimens and twenty-one pull-out specimens were cast for each group of concrete mixtures. The specimens were demolded after 24 h. All the specimens were then immersed in laboratory-saturated limewater tanks. On the 14th day, the specimens were taken out and placed in a programmable incubator at 40 °C for 14 days. After casting and curing for 28 days, compressive strength, high-temperature, and pull-out tests were conducted for each group of specimens. Then, different self-healing methods were used for each group of specimens damaged in the high-temperature and pull-out tests.

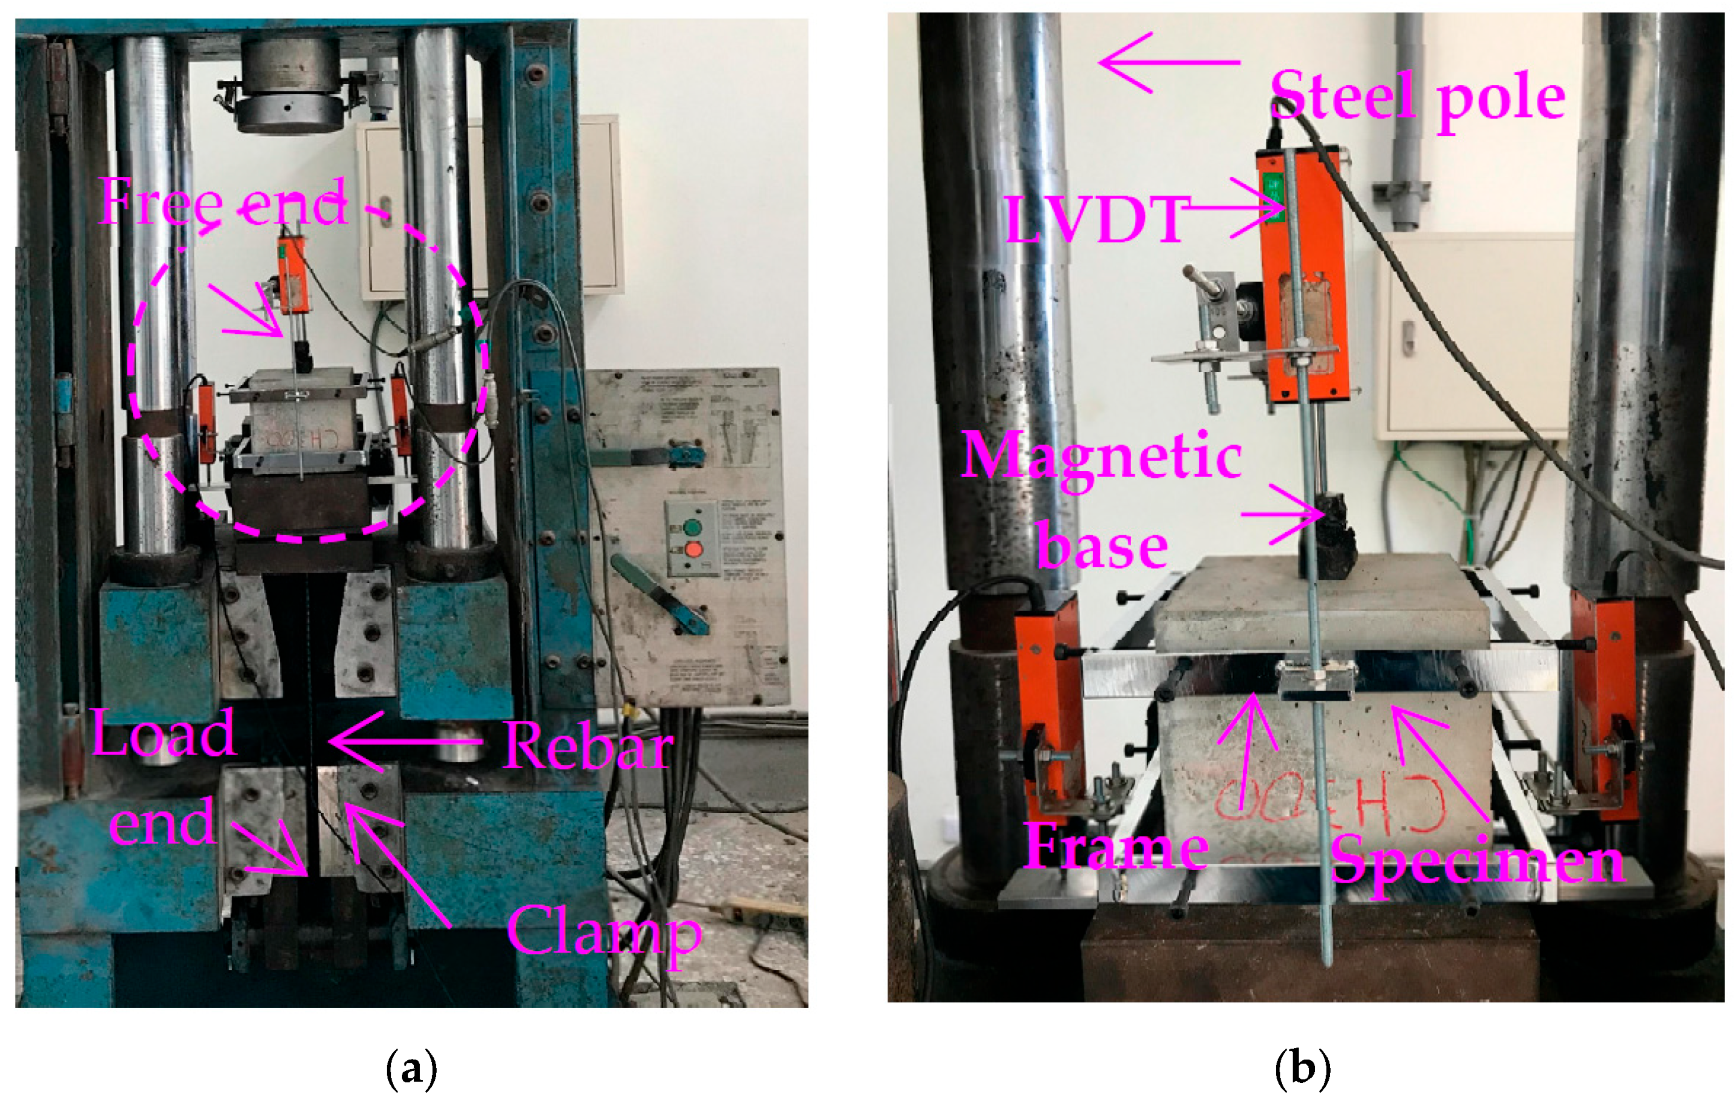
2.5. Testing Methods

The concrete slump was carried out in accordance with ASTM C143 [43]. The concrete unit weight was determined in accordance with ASTM C138 [44]. Cylindrical concrete specimens were tested for compressive strength according to ASTM C39 [45], and their static modulus of elasticity were tested according to ASTM C469 [46]. The compressive strength and static modulus of elasticity were the average values of three specimens. The pull-out test was carried out following the specifications of ASTM C234 [47]. A 200 kN MTS servo valve-controlled machine equipped with a special test frame was used to apply the tensile force to the pull-out specimen, as shown in Figure 3.
The embedded rebar of the pull-out specimen was loaded at one end and was set to a free state at the other end, as shown in Figure 3a. Three linear variable differential transformers (LVDTs) were set up using a test frame, as shown in Figure 3b. The purpose is to measure the relative slip between the longitudinal rebar and the surrounding concrete. During the entire pull-out test process, displacement control was adopted. The load was applied at a constant displacement rate of 0.01 mm/s. In the first pull-out test, the test was stopped when the slippage of the specimen reached 5 mm. In the secondary pull-out test, the test was terminated only when the specimen failed completely.
Assuming that the bond stress is uniformly distributed along the length of the steel bar, the bond stress can be calculated as follows [48]:
τ = P π d b l e
where τ = the bond stress; P = the applied load; d b = the rebar diameter; and l e   = the embedded length.
After the specimens were cured for 28 days, the incubator was adjusted to 60 °C for five days to dry the moisture inside the concrete specimens, to reduce the risk of the specimens spalling at high temperatures. To understand the relationship between the temperature of the concrete inside the pull-out specimen and the heating time, thermocouples were embedded at different places inside the specimen. Two thermocouples were embedded in the 150 mm cubic concrete block of the pull-out specimen: one 2 cm away from the surface of the specimen and the other 4 cm away (as shown in Figure 4).
When the specimen was subjected to high-temperature testing, the heating rate of the high-temperature furnace was 10 °C/min. After the target temperature was reached, the power supply of the high-temperature furnace was turned off immediately. After the specimens were naturally cooled to room temperature in the high-temperature furnace, the residual bond strength (BS) was tested. The pull-out test was divided into five types according to the state of the LWAC specimen. The test sequences for these five types of pull-out tests are shown in Table 3.
Furthermore, field emission scanning electron microscopy (FESEM) and energy dispersive spectroscopy (EDS) were used to conduct microscopic morphology and elemental analysis of the precipitation. The cylindrical concrete specimen damaged after the compression test was used for FESEM observation. Samples were taken from two different parts of each group of cylindrical specimens; that is, two centimeters near the surface and the center. In addition, X-ray diffraction (XRD) analysis was used to determine the type of crystals that precipitated.

3. Tests Results and Discussion

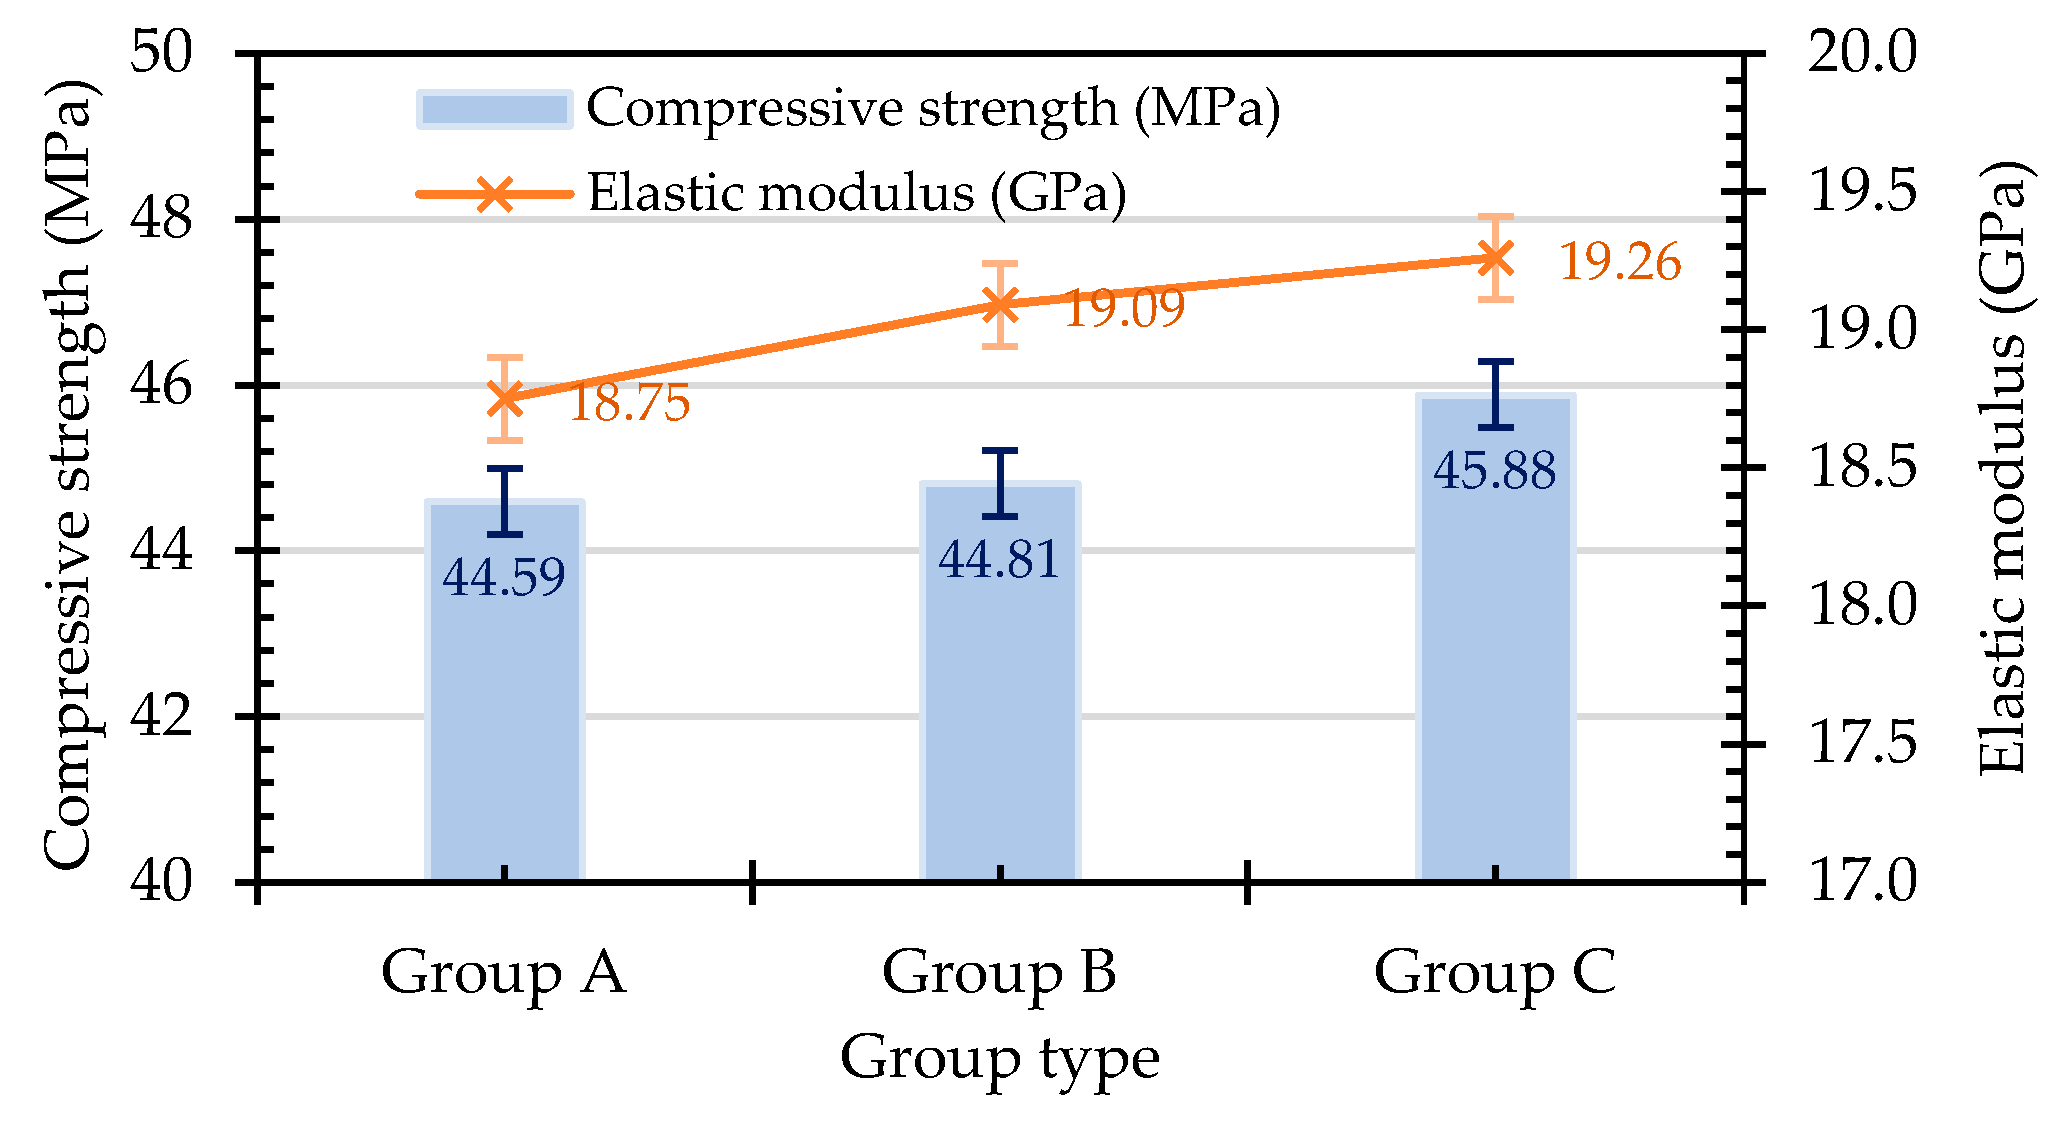
3.1. Fresh and Hardened Properties of Concrete

The slump test results show that each mixture had appropriate workability, with a slump value of 13 cm. At the same time, the unit weight of each mixture was 1849 kg/m3 (20% less than ordinary NWC), which met the requirements of general LWAC. At room temperature, the 28-day compressive strength of each mixture is shown in Figure 5. As shown in Figure 5, the 28-day compressive strength of each group was similar to the required 28-day compressive strength. Overall, the structural efficiency (strength/density) of each group was 24.3 MPa/(t/m3). This value was already within the structural efficiency range of most LWACs; that is, 10–40 MPa/(t/m3) [49]. On the other hand, the 28-day elastic modulus of each mixture was also almost the same, ranging from 18.75 to 19.26 GPa. For a typical expanded clay–LWA-cast LWAC, its elastic modulus is generally in the range of 10–20 GPa. Therefore, these results are consistent with the literature [50,51].

3.2. Results of the Pull-Out Test

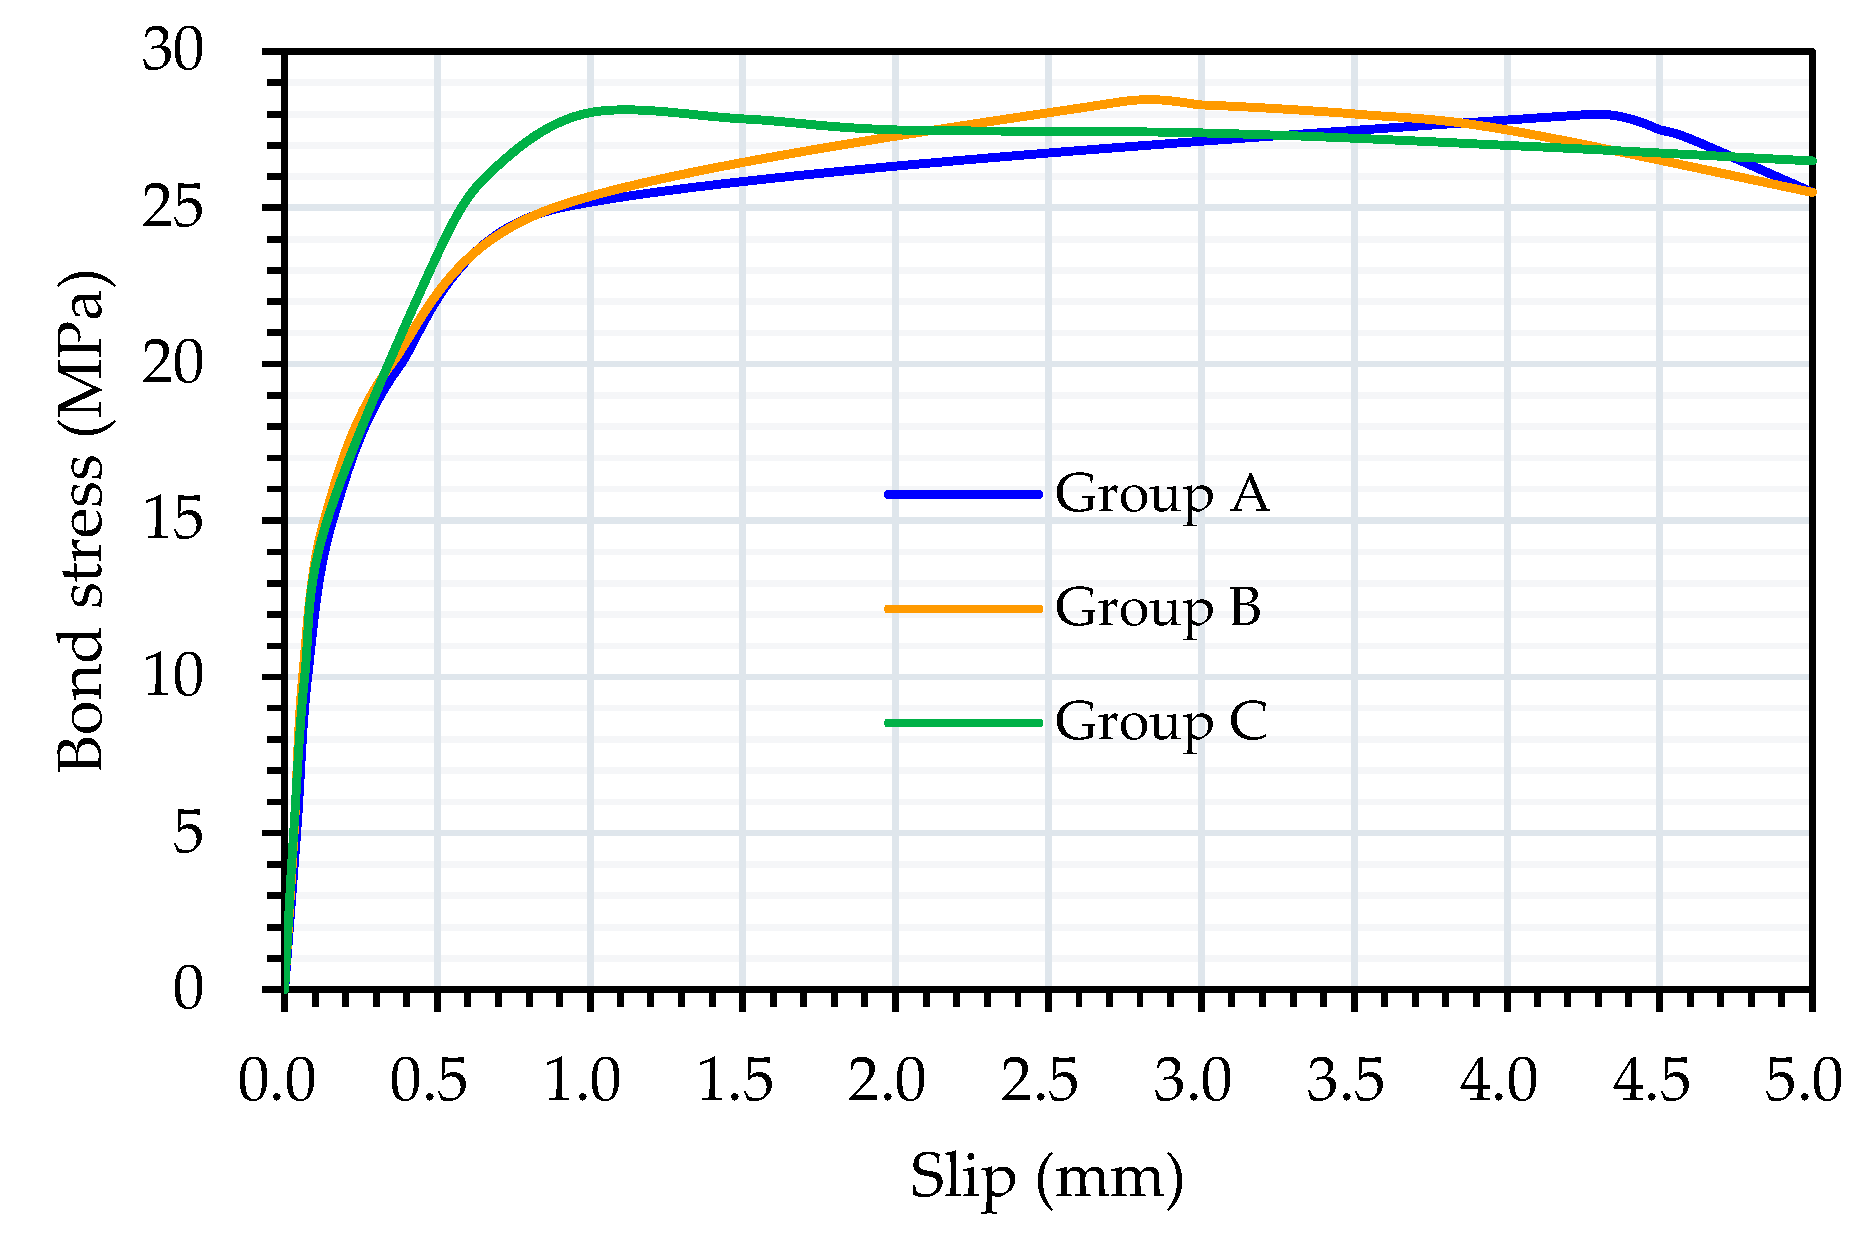
3.2.1. Local Bond–Slip Relationship and Bond Strength of LWAC at Room Temperature

Under room-temperature conditions, the failure modes of the specimens in each group showed rebar pull-out failure. One characteristic of this phenomenon is that the longitudinal rebar of the specimen was pulled out of the concrete, while only a few cracks appeared in the surrounding concrete. In other words, no splitting failure occurred in the specimen during the pull-out test process. This can be attributed to the presence of stirrups, which effectively confined the specimen and limited the development of cracks. In this study, the concrete cover of the pull-out specimens was 6.5 cm and surrounded by transverse stirrups. The concrete between the transverse ribs was sheared off due to punching, causing the rebar to be pulled out of the concrete directly. Generally speaking, if the concrete cover-to-diameter of the rebar (C/D) ratio of the pull-out specimen is within the range of 2.5–3.0, the failure mode is mostly rebar pull-out failure [52]. The C/D ratio of the pull-out specimen in this study was 3.4; thus, all the pull-out specimens suffered rebar pull-out failure.
The literature data shows that the rebar slipping at the end of the peak bond stress of the pull-out specimen is roughly in the range of 2–6 mm [20,53]. In view of this, the first pull-out test of the specimen was terminated when the rebar slippage reached 5 mm. Then, the damaged specimens were allowed to heal themselves in a planned manner before conducting a secondary pullout test. Therefore, when analyzing the first pull-out test of each group of specimens, the slip amount of the rebar was limited to the range of 0 to 5 mm. The local bond stress–slip (τs) relationship curves of the pull-out tests for each group of specimens at room temperature are shown in Figure 6.
As shown in Figure 6, with the increase in load, the curves of each group of specimens in the pull-out test could be divided into linear ascending, nonlinear ascending, and descending stages. Notably, the ascending branch of the τs relationship exhibited linear behavior. In addition, the surfaces of the specimens that suffered pull-out failure exhibited neither any splitting cracks nor any sudden drop in bond stress when it reached its peak. The peak bond stress of Groups B and C was slightly higher than that of Group A, but the corresponding slip to the peak bond stress was smaller, and its value was about 1–3 mm.
Figure 7 shows the bond strength of the first pull-out test for each group of specimens. As shown in Figure 7, at room temperature, the average bond strengths of each group at the age of 28 days were close to 28 MPa. The standard deviations of the compressive strength of Groups A, B, and C were 1.56, 1.34, and 0.40 MPa, respectively. These bond strength values significantly exceeded the values recommended by Mo et al. [19] and the CEB-FIP standard [20]. This is mainly attributed to the stronger overall interlocking effect of the LWAs.

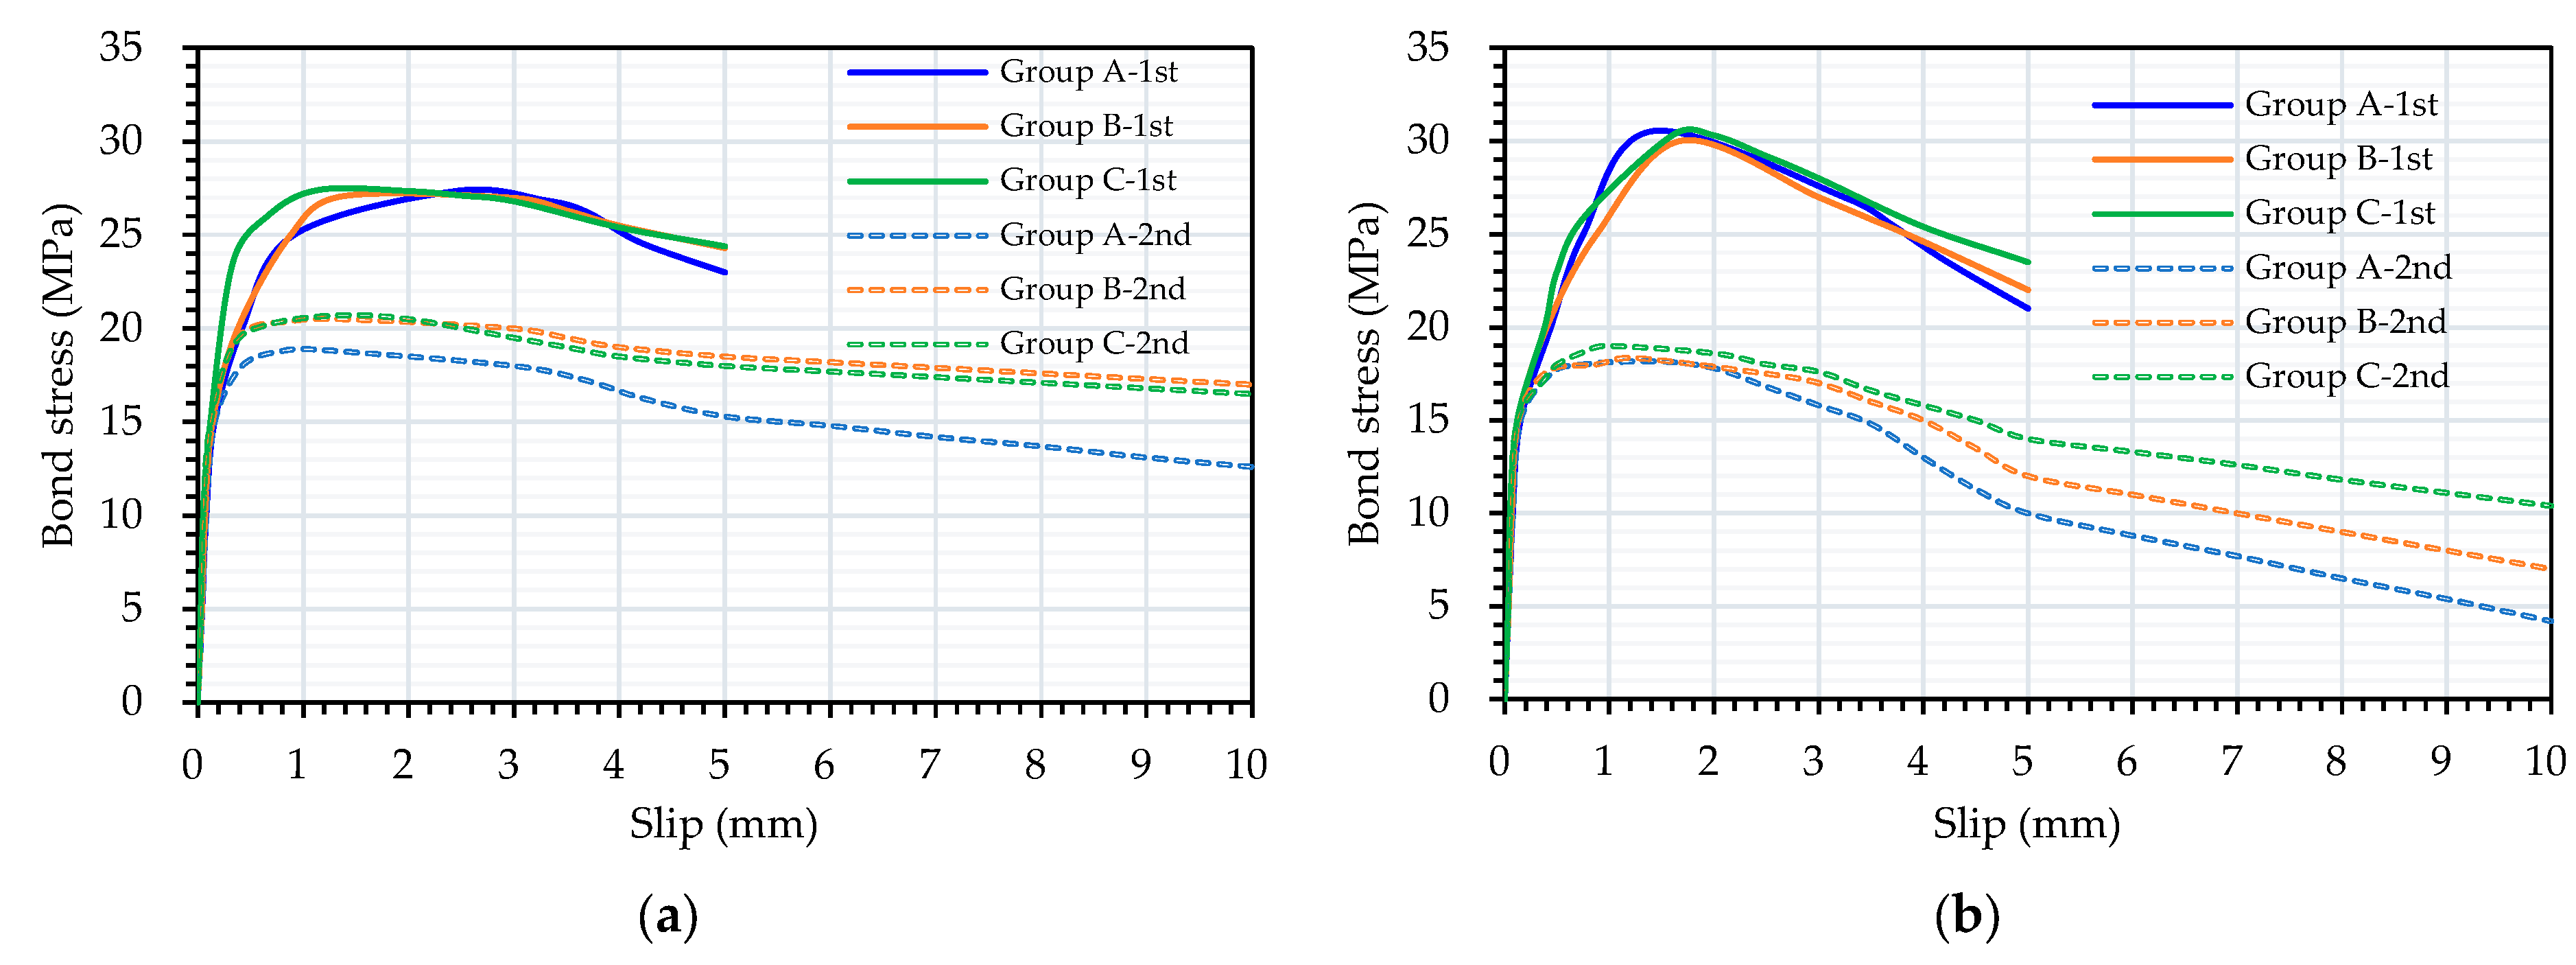
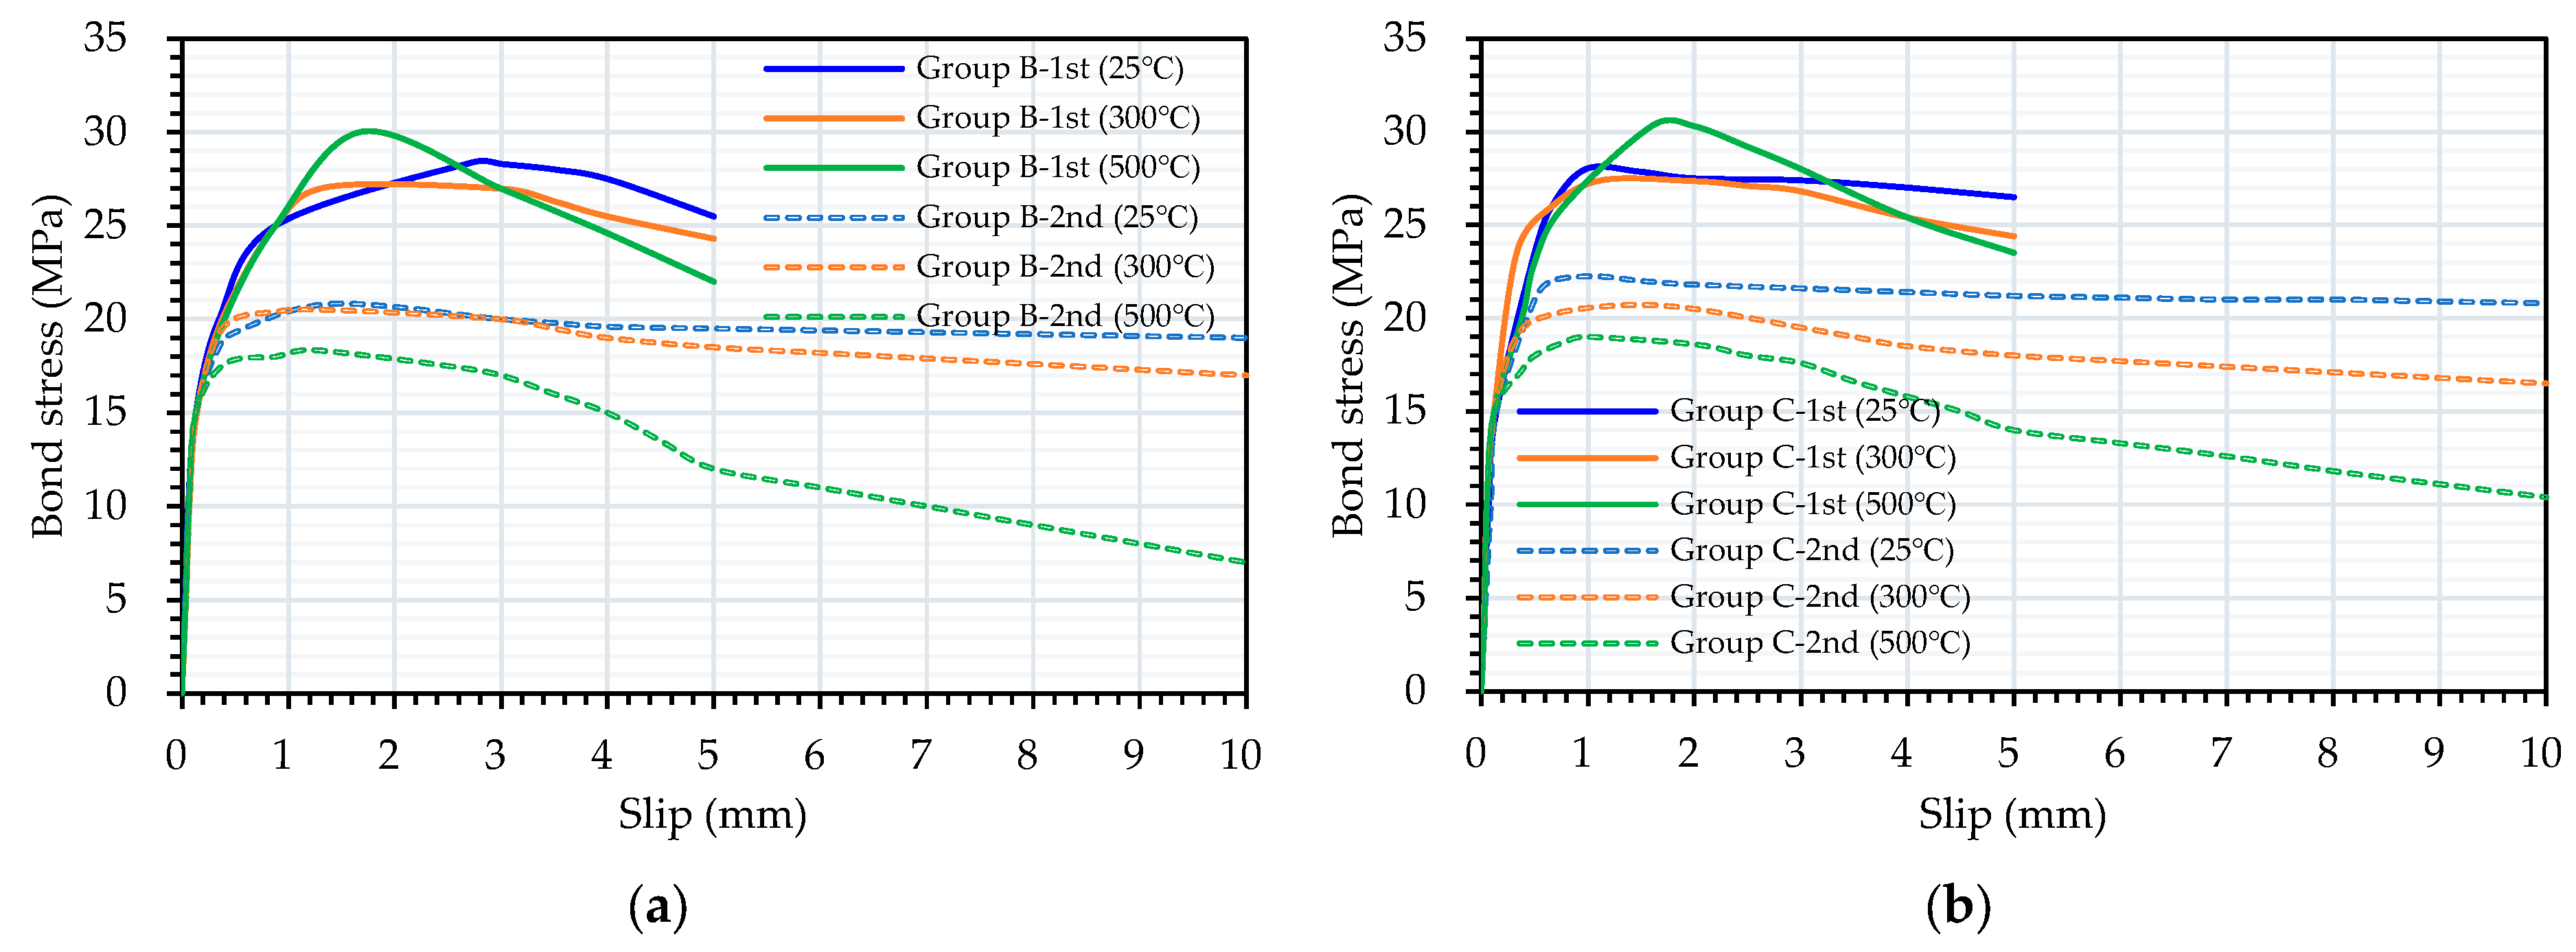
3.2.2. Local Bond–Slip Relationship and Bond Strength in Unhealed LWAC after Exposure to High Temperatures

According to the plan, the high-temperature test was conducted immediately after the specimens were cast and cured for 28 days. The high-temperature test used a faster heating rate; that is, 10 °C/min. Once the high-temperature furnace reached the target temperature, the power was turned off. After exposure to 300 °C and 500 °C, there was no obvious spalling of the two groups of LWAC specimens. Theoretically, a longer embedded length of rebar will lead to strain penetration [54], which makes the strain distribution of the rebar along the longitudinal direction uneven, resulting in lower bond strength in the concrete. In the pull-out test, the bond anchorage length of the rebar was set to be short ( l e = 3 d b ). Therefore, the rebar remained in the elastic stage [55]. As mentioned above, for rebar with short bonded anchor lengths, good restraint, and adequate cover, the pull-out specimen should exhibit rebar pull-out failure. After being exposed to high temperatures, the concrete specimens suffered some degree of heat damage. Regardless of the control group or the experimental group, the pullout test showed rebar pull-out failure.
As mentioned previously, thermocouples 1 and 2 were embedded inside the pull-out specimens, as shown in Figure 4. Under different target temperatures, the relationship between the internal concrete temperature and the heating time of each group of specimens was roughly the same. Therefore, only the results of certain specimens were selected as representatives. Figure 8 shows the results of a single measurement. In the case of a target temperature of 300 °C, the maximum temperatures of the two thermocouples were approximately 98.2 °C and 90.8 °C, respectively, as shown in Figure 8a. In the case of 500 °C, the maximum temperatures of the two thermocouples were approximately 235.7 °C and 230 °C, respectively, as shown in Figure 8b. From this point of view, the temperature difference between these two places inside the concrete was approximately 5.7–7.4 °C. In addition, even though the target temperature was 500 °C, the maximum temperature inside the specimen did not yet reach 240 °C. Metha and Monteiro [56] pointed out that when the heating temperature of concrete reaches above 200 °C, cement hydrates gradually decompose. For example, calcium silicate hydrate (C-S-H) colloids begin to lose bonding water. However, the internal temperature of the specimen did not exceed 250 °C, and the changes in its microstructure and properties were still slight. In other words, the high-temperature test in this study did not cause significant degradation of the matrix of the specimens. This is mainly because the high-temperature furnace was shut down after reaching the set temperature, resulting in the maximum temperature inside the specimen not exceeding the critical temperature of rebar and concrete materials. Therefore, the strength of the specimen did not significantly degrade.
The τs relationship curves of the unhealed specimens after exposure to high temperatures are shown in Figure 9. As shown in Figure 9, the τs relationship curves of the LWAC specimens after exposure to high temperatures could be divided into different stages; that is, linear ascending, nonlinear ascending, and descending stages. Regardless of whether the target temperature was 300 °C or 500 °C, there was no significant difference in the peak bond stress between the experimental group and the control group, and the corresponding slip to the peak bond stress was between 1 and 3 mm.
On the other hand, each group of specimens that experienced rebar pull-out failure healed themselves according to the aforementioned self-healing method. Once these specimens healed themselves to the planned age, a secondary pull-out test was performed. The test was stopped only when the specimen failed completely; that is, the rebar slippage was no longer limited to 5 mm. Taking each group of specimens exposed to 300 °C as an example, an obvious plateau appeared in the τs relationship curve, as shown in Figure 9a. At this stage, the bond stress decreased slowly, but the slip continued to increase. Then, the bond stress decreased significantly. Overall, the bond–slip curve of each group of LWAC specimens was still consistent with the model suggested by CEB-FIP 2000 [20]. In the linear ascending branch, the specimen had no obvious cracks. In the nonlinear ascending branch, the cracks in the specimen expanded and were in a continuous cracking state. In the descending branch, the specimen was completely cracked and was penetrated by cracks. In the residual branch, the bond stress of the specimen was mainly composed of pure friction resistance. Moreover, after exposure to 300 °C, Figure 9a shows that the peak bond stress of the secondary pull-out test in Groups B and C was significantly higher than that in Group A. However, after exposure to 500 °C, Figure 9b shows that there was no significant difference in the peak bond stress of the secondary pull-out test between the experimental group and the control group.
The τs relationship curves of each group after being exposed to different temperatures without healing are shown in Figure 10 and Figure 11. As shown in Figure 10 and Figure 11, as the target temperature increased, the slope of the linear ascending branch in the figures tended to become steeper. The load of each group was the largest after being exposed to a temperature of 500 °C, followed by room temperature and 300 °C. Compared with room-temperature conditions, the maximum load of each group of specimens after being subjected to 500 °C increased by approximately 6% to 9%. Regarding the plateau sections of each group shown in Figure 10 and Figure 11, the experimental group had a smaller attenuation range after entering the plateau section than Group A. This strength attenuation rate increased with the increase in the target temperature, and it can be seen that the specimens subjected to temperatures of 500 °C were particularly obvious. As shown in Figure 10, in the case of 300 °C, the peak bond stress of the Group A specimens decayed only slightly. In the case of 500 °C, the peak bond stress of Group A showed a phenomenon of increasing instead of decreasing. Moreover, in terms of the peak bond stress in the secondary pull-out test, there was little difference in Group A after exposure to different temperatures.
Under the conditions of different temperatures, the τs relationship curve of the experimental group is shown in Figure 11. As shown in Figure 11a, in the case of 300 °C, the peak bond stress of the specimens in Group B decayed only slightly. In the case of 500 °C, the peak bond stress of the Group B specimens showed a phenomenon of increasing instead of decreasing. In addition, after being subjected to different temperatures, the peak bond stress of the secondary pull-out test of Group B was significantly different. In the case of 500 °C, the peak bond stress of the specimen decreased sharply. Furthermore, as shown in Figure 11b, in the case of 300 °C, the peak bond stress of the Group C specimens decayed only slightly. In the case of 500 °C, the peak bond stress of the Group C specimens did not decrease but instead increased. After being subjected to different temperatures, the peak bond stress of the secondary pull-out test of Group C was significantly different. That is, the higher the target temperature, the smaller the limit of the bond stress. Compared with the control group, the slope in the linear ascending branch of the experimental group was higher and became steeper as the target temperature increased, as shown in Figure 10 and Figure 11. Observing the slip growth trend after 3 mm at room temperature and 300 °C, the curve of the experimental group tended to be flat and slightly attenuated, while the curve of Group A exhibited an obvious downward trend.
After the high-temperature test and without self-healing, the results of the first pull-out test for each group are shown in Table 4. In the case of 300 °C, the maximum temperature of the concrete inside the pull-out specimen was approximately 98.2 °C. In this case, there was no degradation of the concrete substrate. Therefore, the residual BS of the specimen did not decrease significantly. Table 4 shows that, after exposure to 300 °C, the average bond strength of the unhealed specimens in each group was close to 27 MPa. These bond strength values were only slightly lower than their bond strength values at room temperature. After being subjected to 500 °C, the average first bond strength of the unhealed specimens in each group was close to 30 MPa. These bond strength values were higher than those of each group of specimens at room temperature. In the case of 500 °C, the maximum temperature of the concrete inside the pull-out specimen was approximately 235.7 °C. Under this temperature condition, water vapor evaporated inside the specimen, causing a drying effect [57]. As a result, the bond strength of the specimen increased slightly. Furthermore, the residual BS after exposure to high temperatures was divided by that at room temperature. The calculated relative bond strength (BS) ratios are shown in Table 4. As shown in Table 4, the relative BS ratios of Groups A, B, and C after exposure to 500 °C were 1.09, 1.06, and 1.08, respectively.
In addition, the specimens damaged by high temperatures and the first pull-out test were subjected to self-healing. The results of the secondary pull-out test after 28 days of self-healing are shown in Table 5. It can be seen that, in the case of 300 °C, the residual bond strengths of the secondary pull-out test results of Groups A, B, and C were 18.89, 20.48, and 20.70 MPa, respectively. Compared with Group A, the relative BS ratios in Groups B and C after 28 days of self-healing increased by 5.9% and 8.8%, respectively. However, in the case of 500 °C, the residual bond strengths of the secondary pull-out test results of Groups A, B, and C were 18.17, 18.35, and 19.00 MPa, respectively. As shown in Table 5, the relative BS ratios of Groups A, B, and C in the secondary pull-out test after exposure to 300 °C were 0.68, 0.72, and 0.74, respectively. Compared with Group A, the relative BS ratios in Group C after 28 days of self-healing increased by 8.4%. Overall, the relative BS ratio of the secondary pull-out test results of Group C was higher than that of Groups A and B. This result once again means that the healing method with an ambient temperature of 40 °C and a two-day cycle had a better effect.
In summary, for the specimens that did not heal themselves after being exposed to high temperatures, the residual BS of each group in the first pull-out test was not significantly reduced. This is attributed to the fact that the high-temperature test did not cause serious degradation of the internal composition of the concrete in each group of specimens. However, the damage caused during the first pull-out test was more severe. The experimental group healed itself in a better environment, resulting in a significant improvement in the residual BS in the secondary pull-out test.

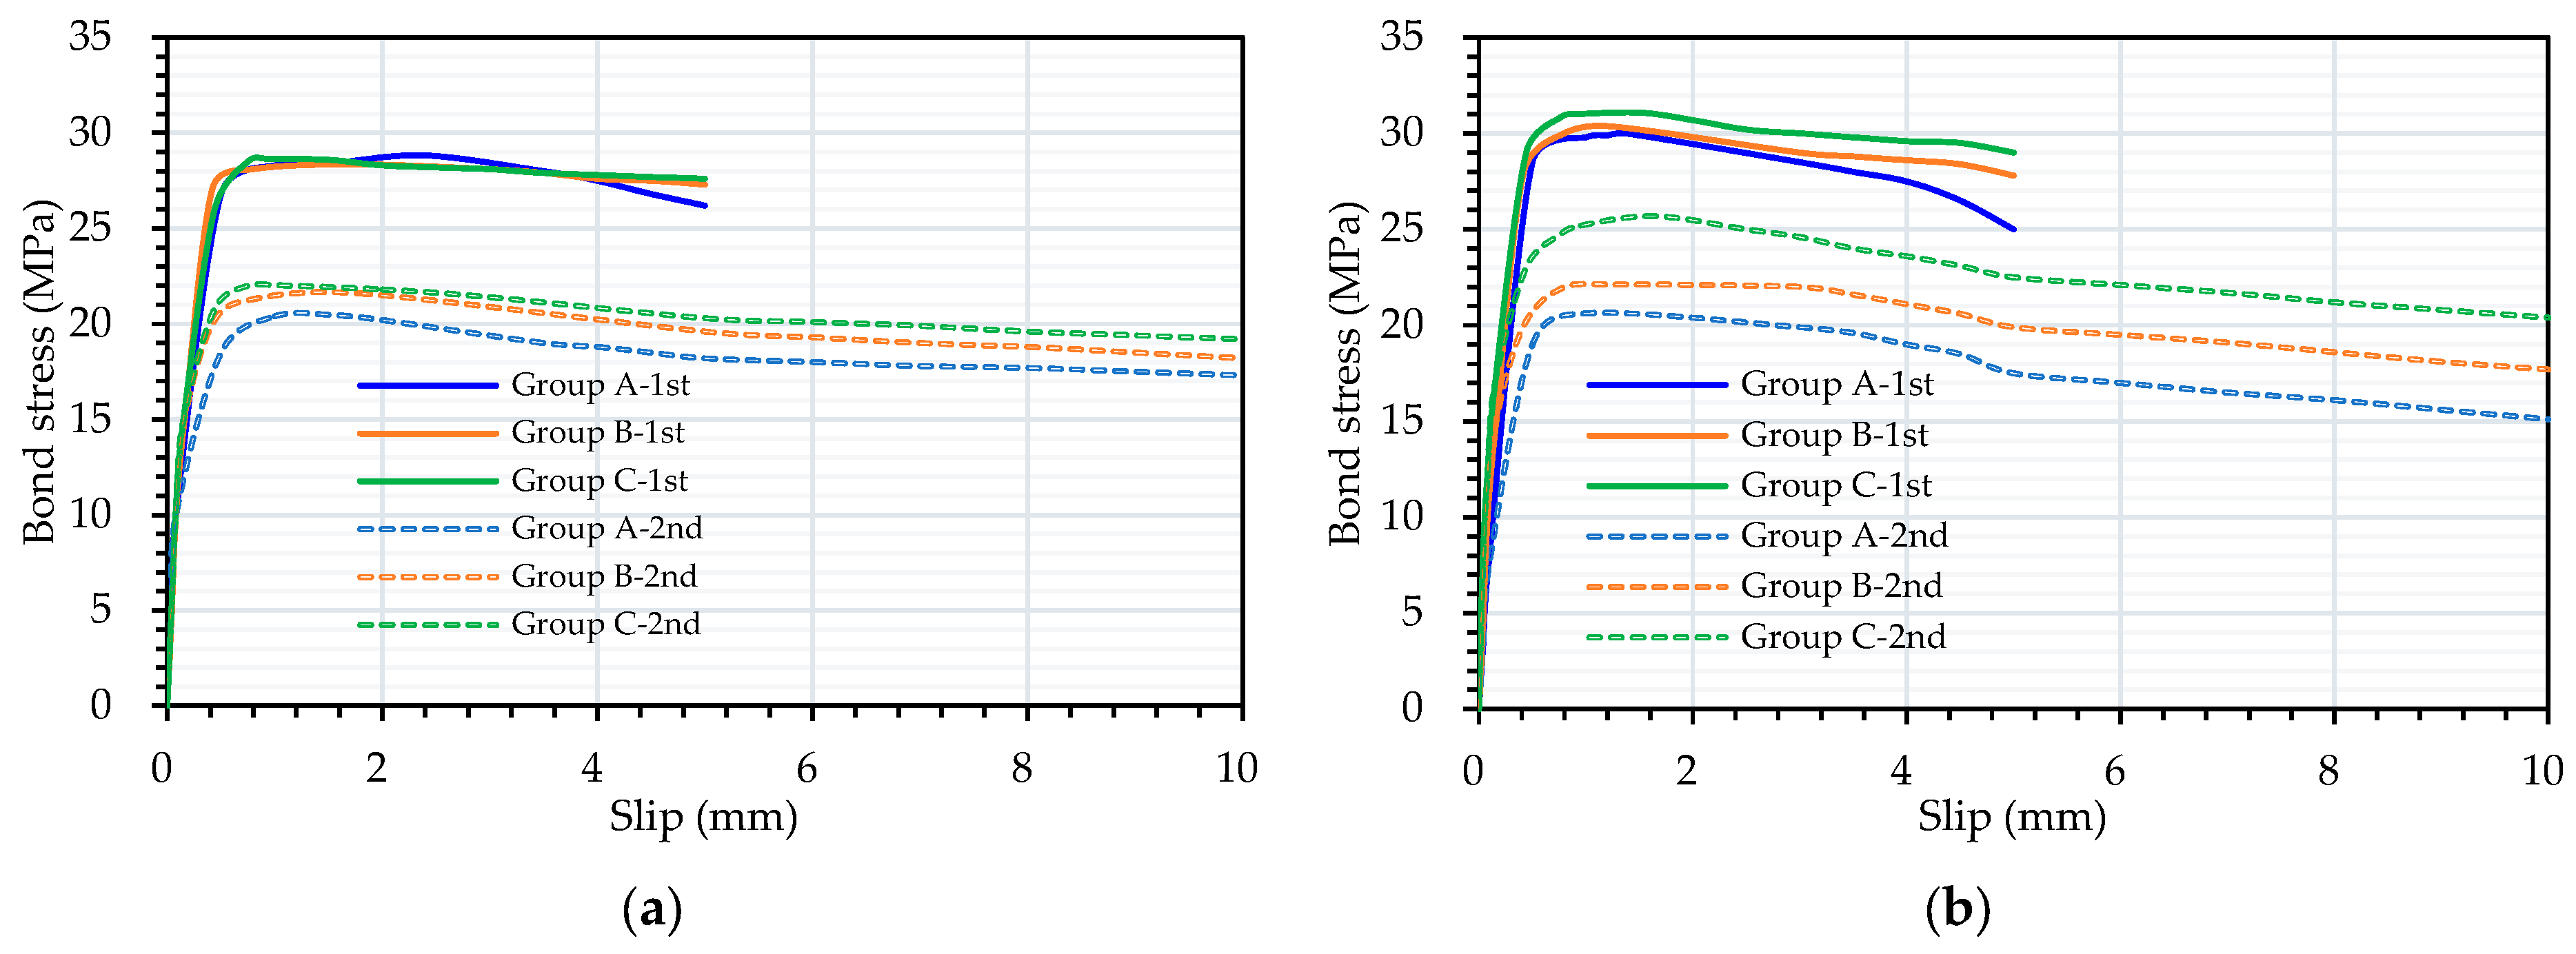
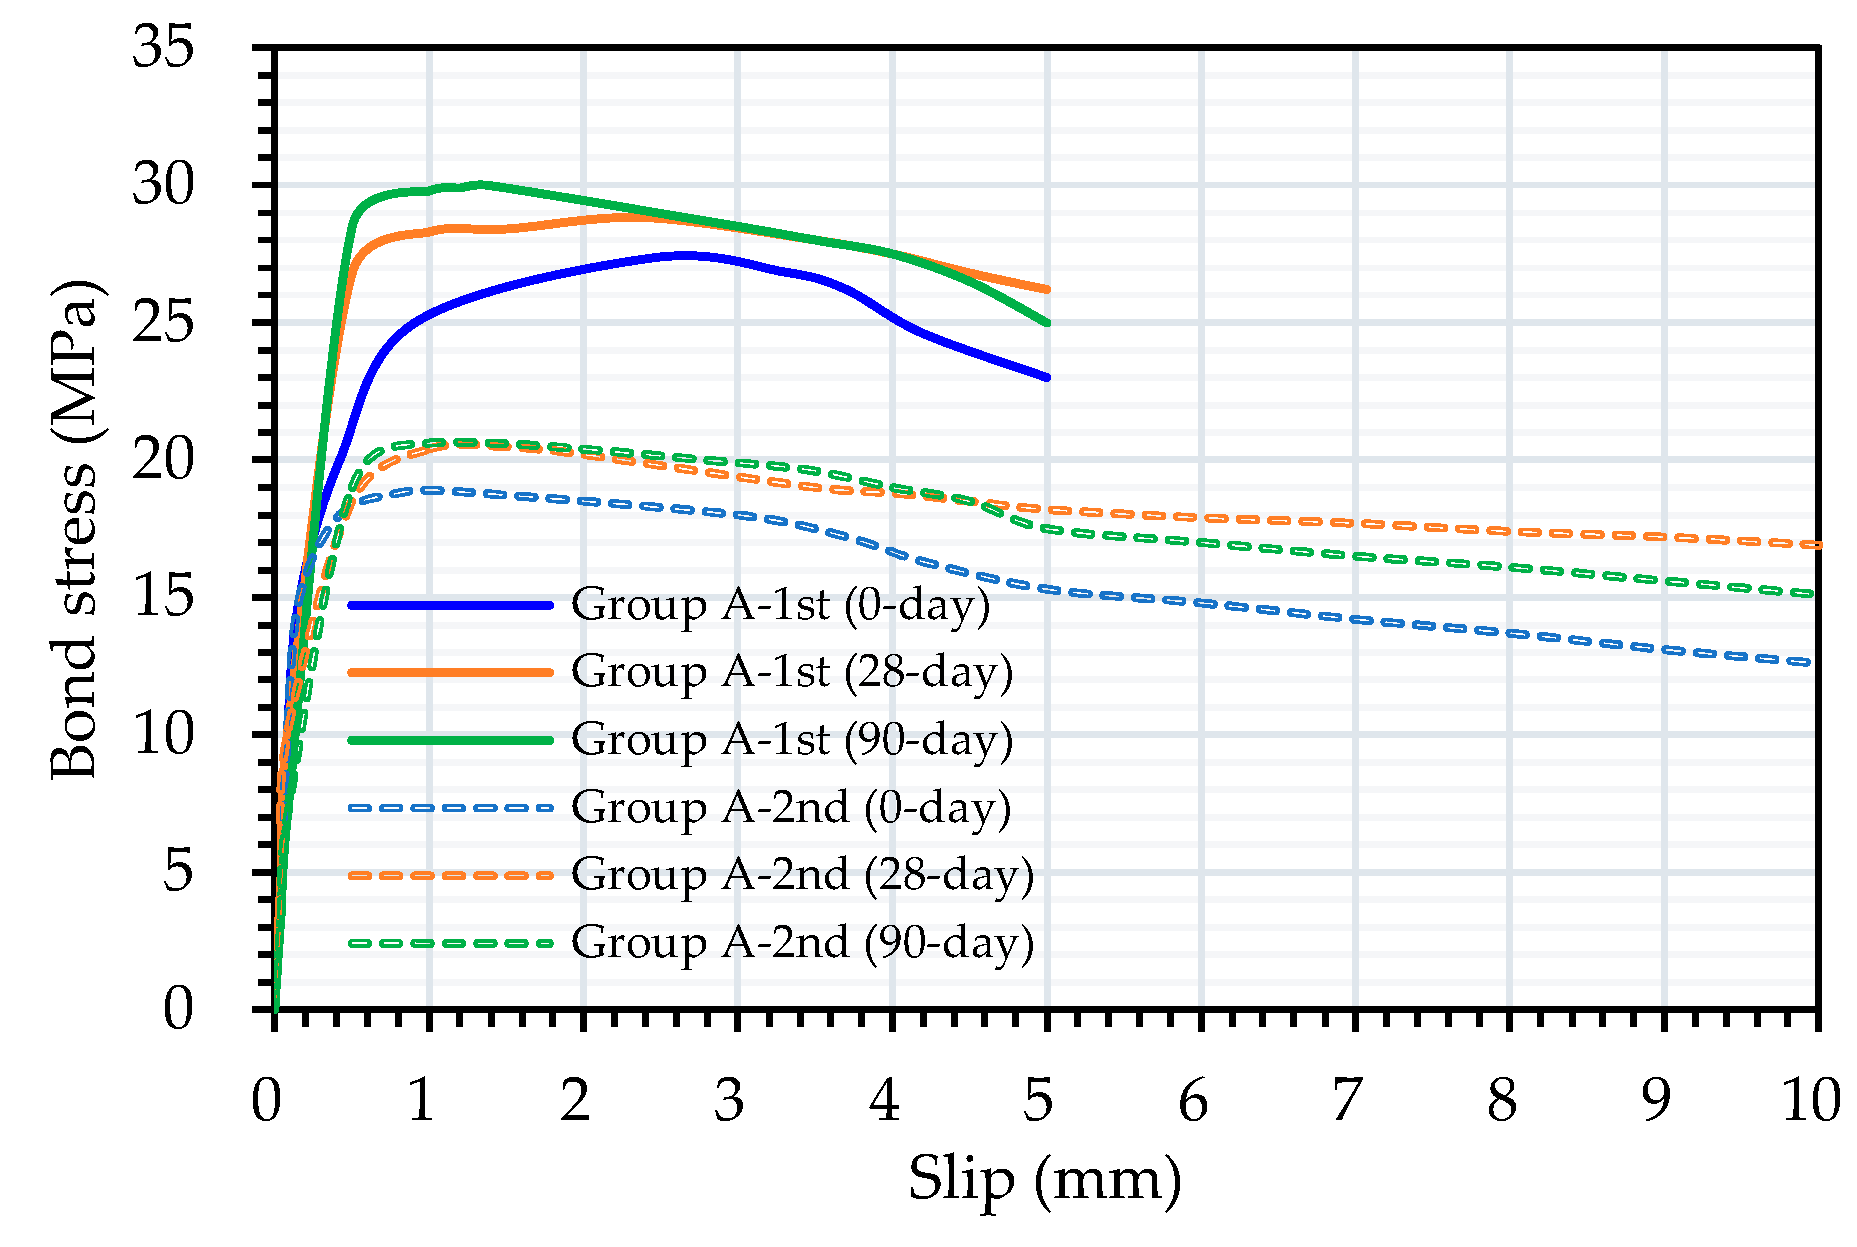
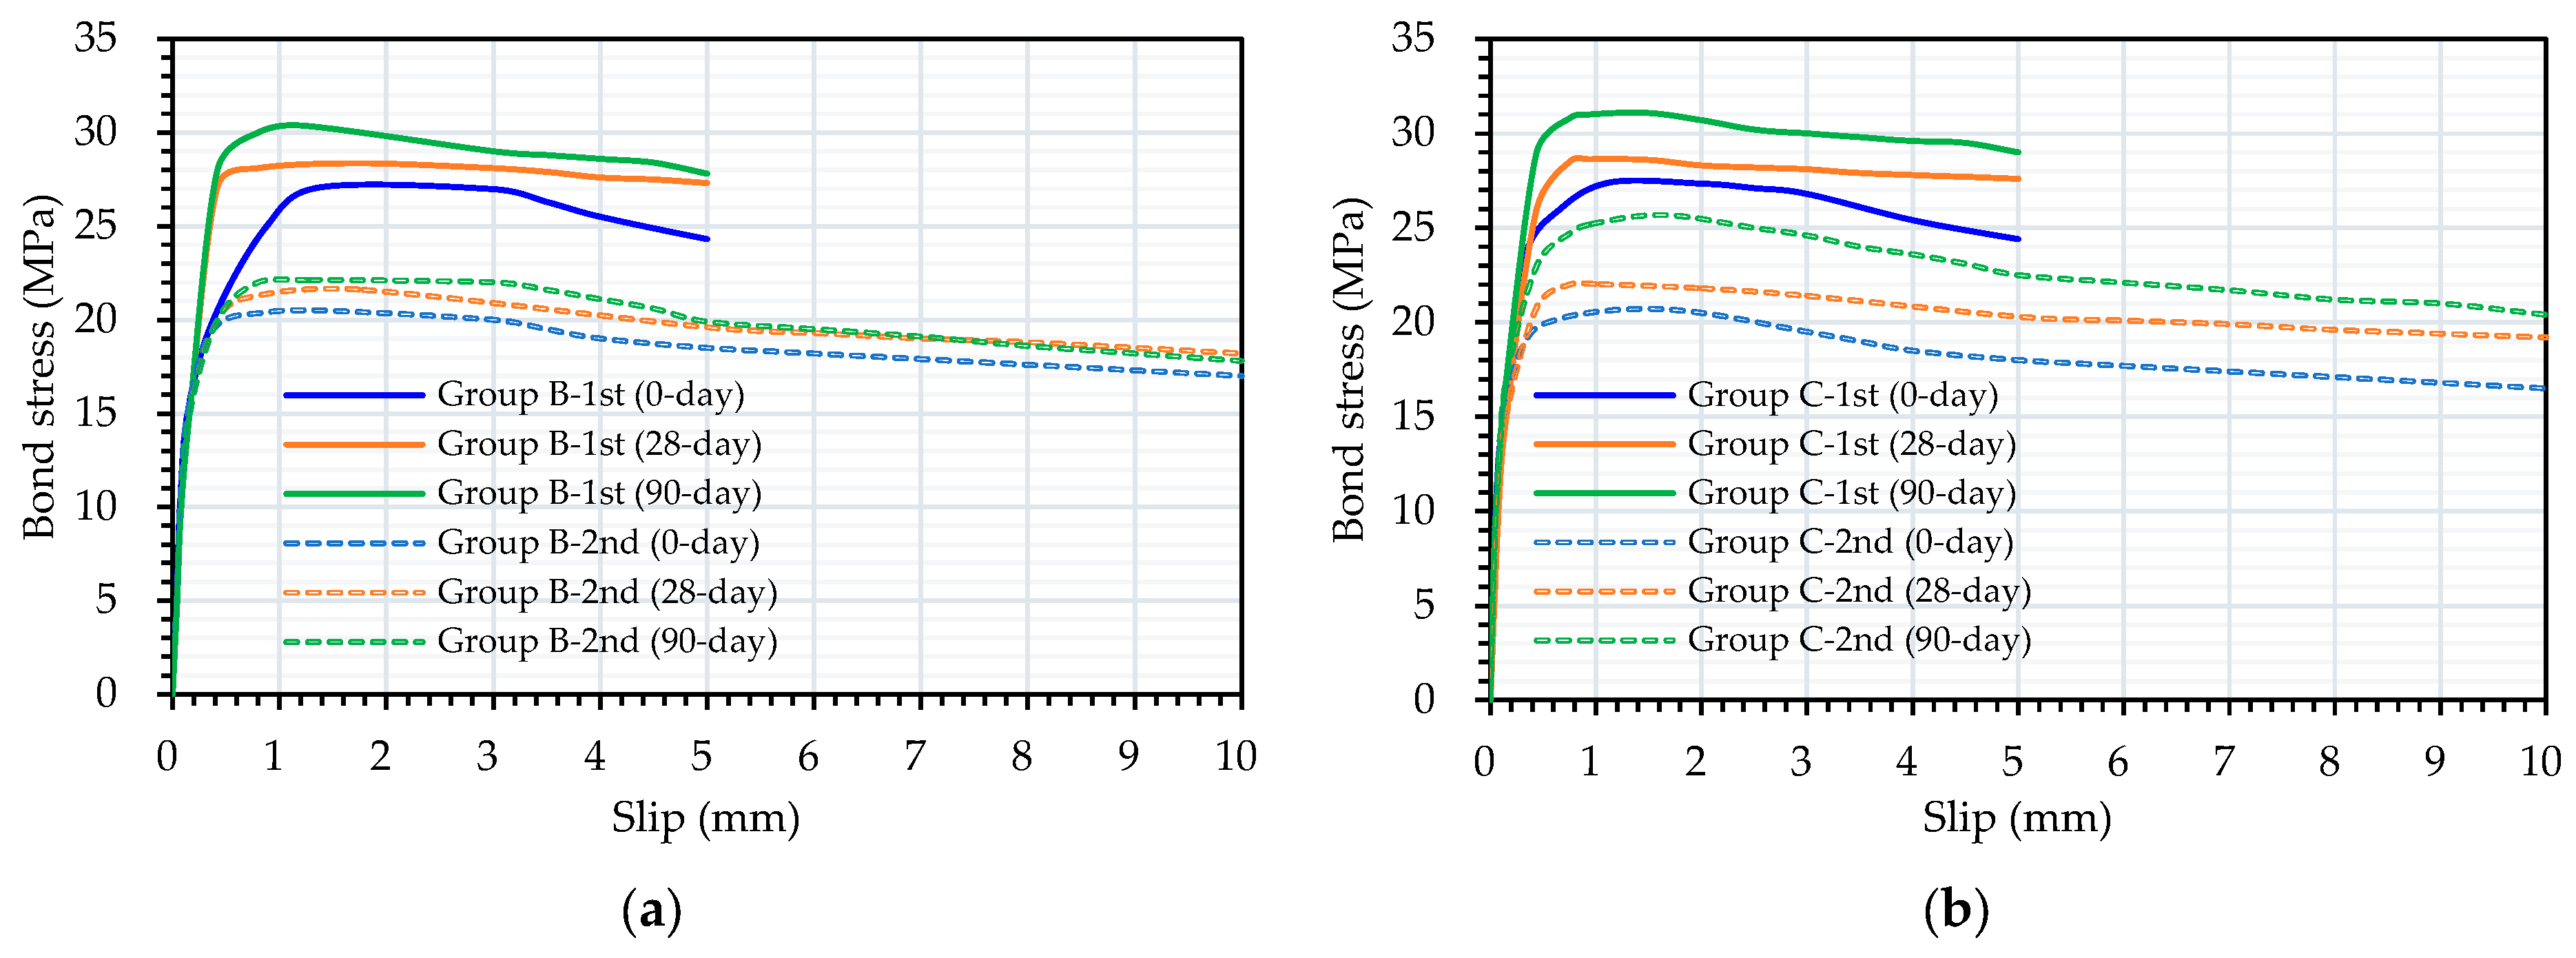
3.2.3. Local Bond–Slip Relationship and Bond Strength in Healed LWAC after Exposure to High Temperatures

The results of the pull-out tests indicated rebar pull-out failures in all the samples after exposure to a temperature of 300 °C and being subjected to healing, as shown in Figure 12. The corresponding τs curve is shown in Figure 13. The τs curve of the first pull-out test of the healed specimen after 300 °C was the same as that of the unhealed specimen and could be divided into three stages. As shown in Figure 13a, after 28 days of healing, the peak bond stresses of the experimental group and the control group were similar. In addition, the corresponding slip to the peak bond stress was very small, approximately 0.5–1 mm. In contrast, as shown in Figure 13b, after 90 days of healing, the peak bond stress of Group C was higher than that of Group A. Furthermore, the corresponding slip to the peak bond stress was approximately 1–1.5 mm. From this point of view, the improvement in the peak bond stress in Group C was better after 90 days of healing. Moreover, after the 28-day healing period of the first pull-out specimen, the τs curve of the secondary pull-out test still went through the four stages described previously. On the other hand, after 28 days of healing, the peak bond stress of Group C was slightly higher than that of Group A in the secondary pull-out test. However, after 90 days of healing, the peak bond stress of Group C was significantly higher than that of Group A in the secondary pull-out test.
After being subjected to 300 °C, the τs curves of the Group A specimens under different healing age conditions are shown in Figure 14. As shown in Figure 14, with the increase in healing age, the peak bond stress of the Group A specimens increased significantly. In addition, with the increase in the healing age, the peak bond stress of the secondary pull-out test in Group A also increased.
Moreover, the τs relationship curves of the experimental group specimens at different healing ages after being subjected to a temperature of 300 °C are shown in Figure 15. As shown in Figure 15a, with the increase in the healing age, the peak bond stress of the Group B specimens increased significantly. As the healing age increased, the peak bond stress in the secondary pull-out test of Group B also increased. As shown in Figure 15b, with the increase in the healing age, the peak bond stress of the Group C specimens increased significantly. With the increase in the healing age, the peak bond stress of the secondary pull-out test in Group C also increased significantly. As shown in Figure 9 and Figure 13, the slip in the experimental group was slightly smaller than that of the control group when the maximum load occurred, and this phenomenon showed the same trend in each healing age and target temperature. In addition, as shown in Figure 14, the trends of Group A at the healing ages of 28 days and 90 days were similar. This result shows that the hydration reaction of the cement itself had been roughly developed in 28 days, and there was no obvious increase in the late age. In contrast, as shown in Figure 15, as the age increased, the bond strength of Group C showed a more obvious improvement. This was especially true in the secondary pull-out test, where the repair rate was higher when the healing age was 90 days. From this perspective, the curing method of Group C was more effective.
The pull-out test results of the healed specimens after exposure to 300 °C are shown in Table 6. As shown in Table 6, taking the specimen that underwent 28 days of self-healing as an example, the residual bond strengths of Groups A, B, and C were 28.82, 28.36, and 28.64 MPa, respectively. In addition, taking the specimen that underwent 90 days of self-healing as an example, the residual bond strengths of Groups A, B, and C were 29.99, 30.37, and 31.08 MPa, respectively. Moreover, for the specimens of different self-healing ages after 300 °C, the relative BS ratio was calculated based on the bond strength without self-healing after 300 °C, and the results are shown in Table 6. As shown in Table 6, taking the specimen that underwent 90 days of self-healing as an example, the relative BS ratios of Groups A, B, and C were 1.10, 1.12, and 1.13, respectively. Compared with Group A, the relative BS ratios in Groups B and C after 90 days of self-healing increased by 2.3% and 3.4%, respectively. In terms of self-healing for 90 days, the relative BS ratio of Group C was the highest, which again proved that the curing method with a curing temperature of 40 °C and a two-day cycle was better.
On the other hand, each group of specimens exposed to a temperature of 300 °C that underwent different self-healing ages and were damaged in the first pull-out test were allowed to self-heal for another 28 days. The results of the secondary pull-out test after self-healing for 28 days were analyzed. As shown in Figure 16, taking the case after exposure to 300 °C and a healing period of 90 days as an example, the relative BS ratios of the secondary pull-out test results of Groups A, B, and C were 0.69, 0.73, and 0.83, respectively. Compared with Group A, the relative BS ratios in Groups B and C after 90 days of self-healing increased by 5.8% and 20.3%, respectively.
In summary, for the specimens that healed themselves after being exposed to 300 °C, the residual BS of the first pull-out test in each group did not significantly attenuate. This is attributed to the fact that the high-temperature test did not cause serious degradation of the internal composition of the concrete in each group of specimens. However, the damage caused by the first pull-out test was relatively severe. Group C healed itself in a better environment. As a result, its residual BS in the secondary pull-out test was significantly better than that of Group A.

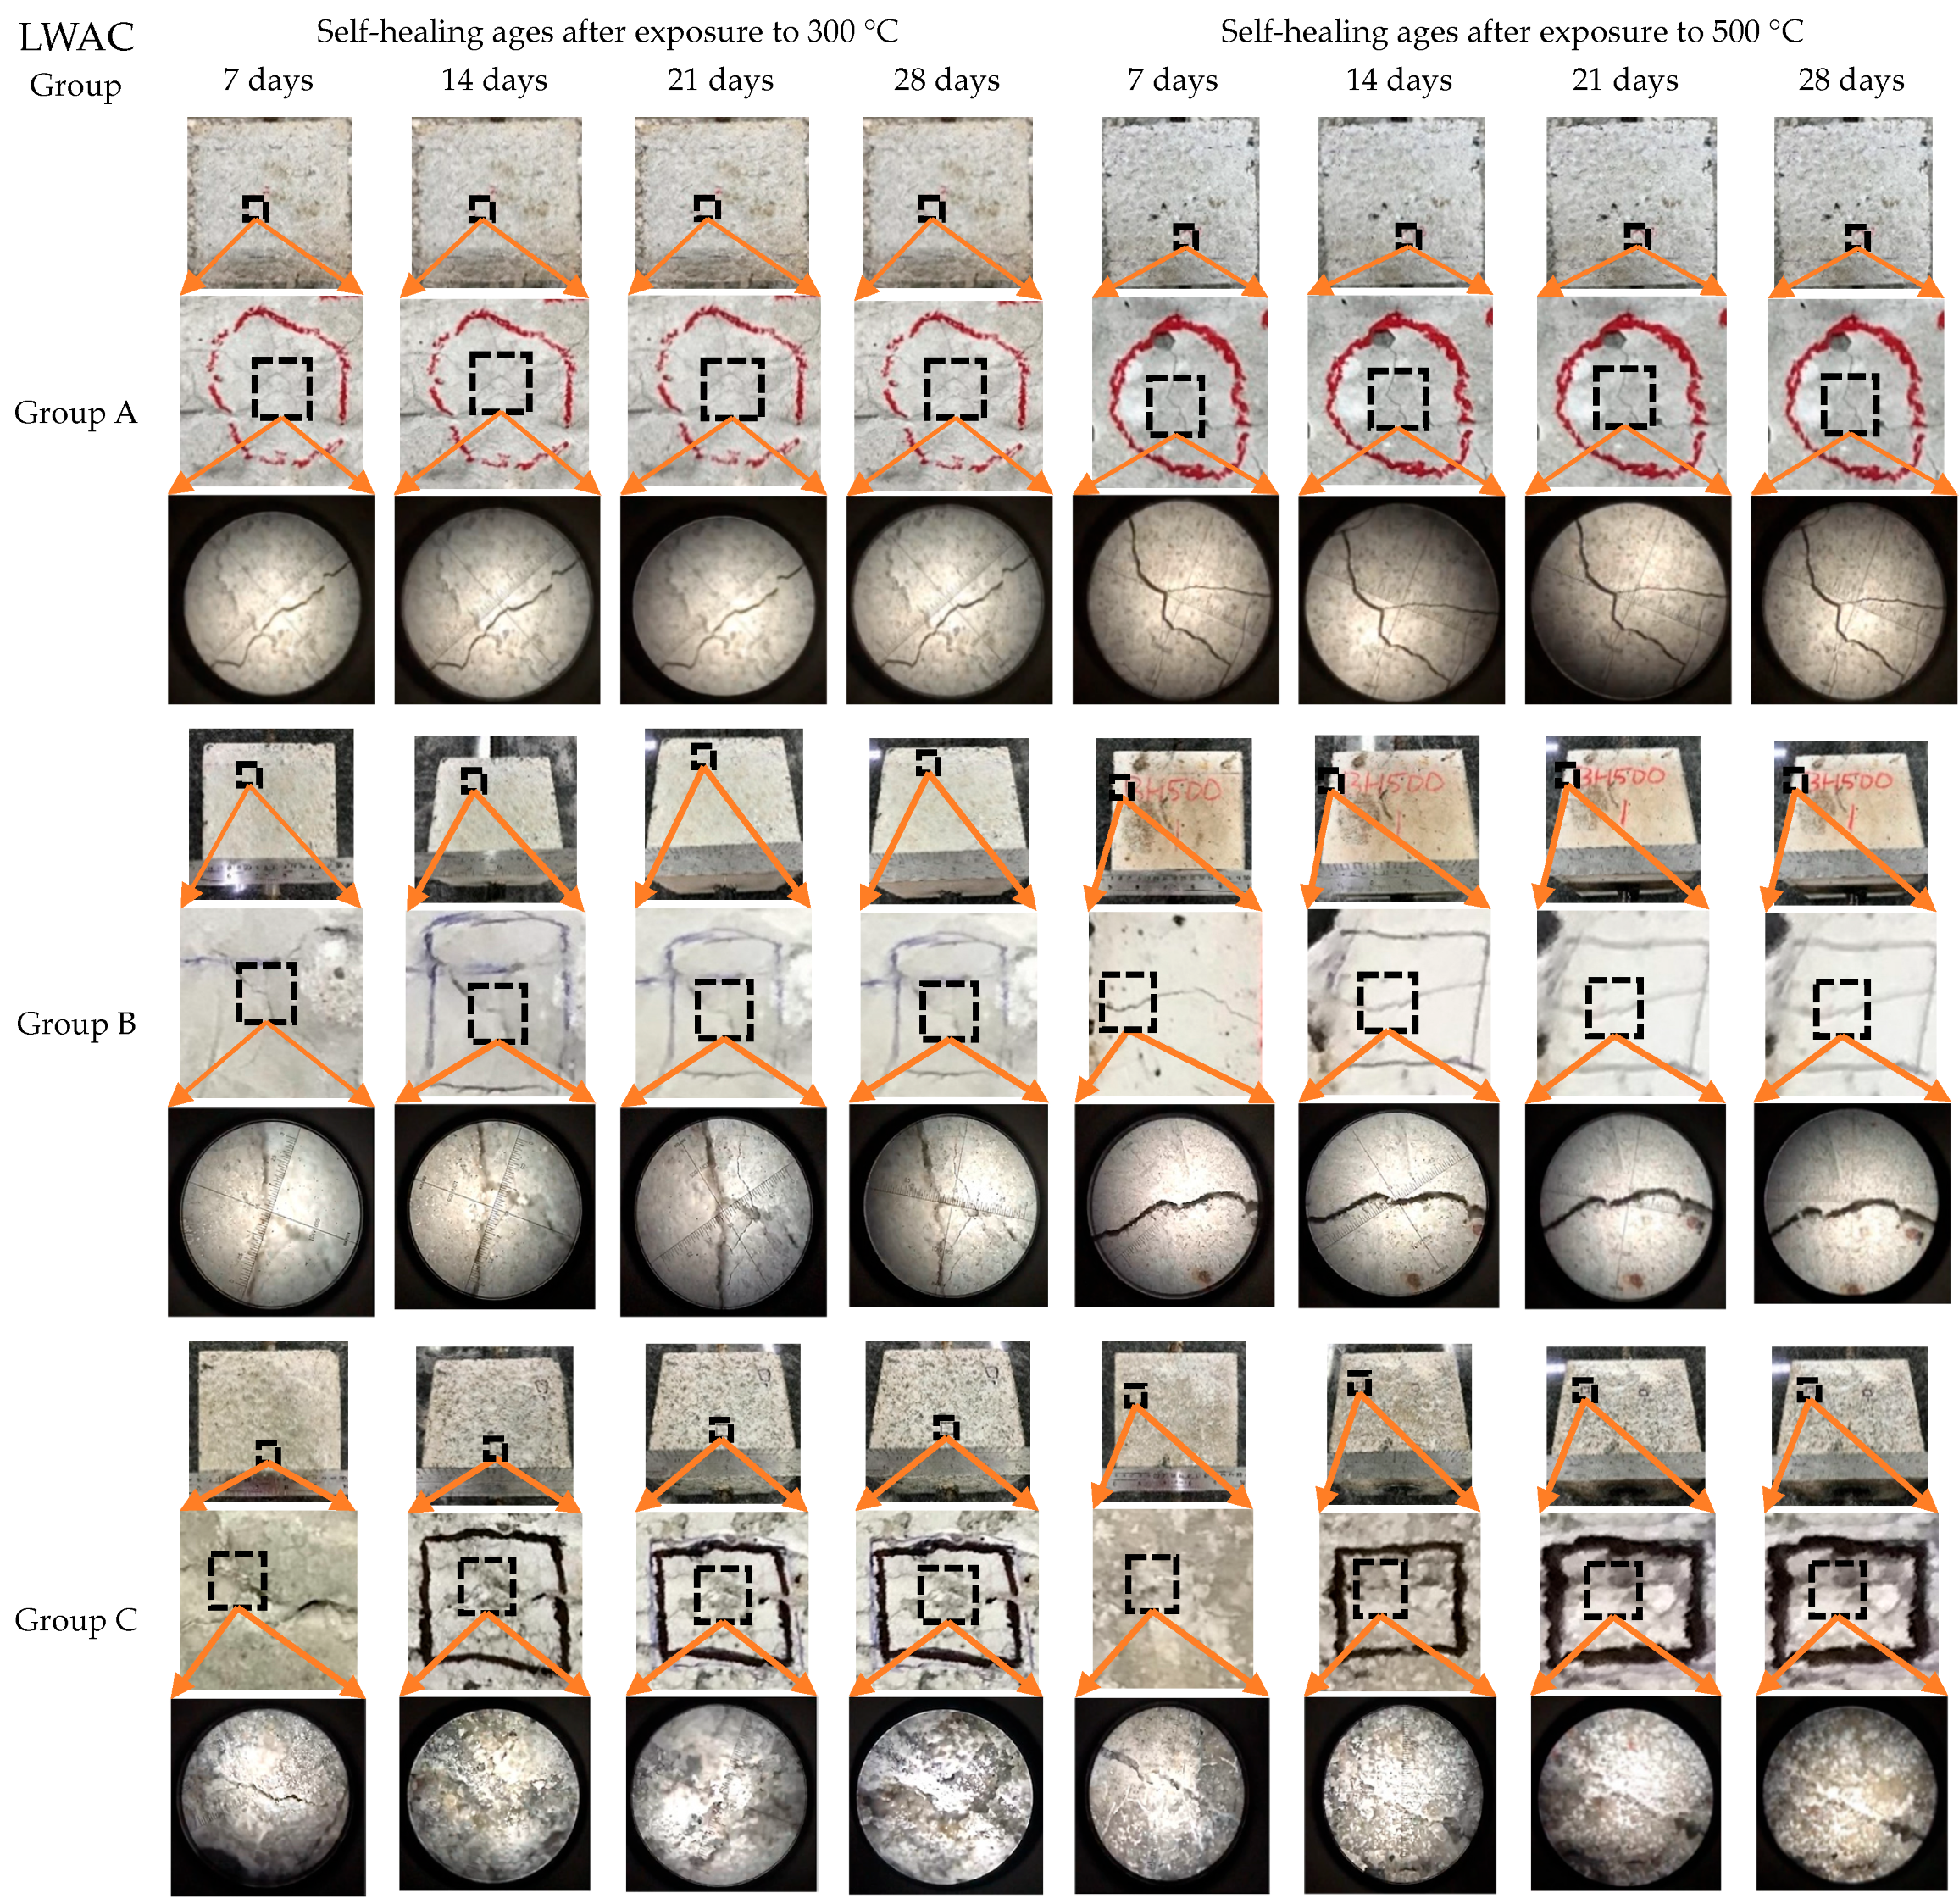
3.3. Crack Healing of the Pull-Out Specimens

After the pull-out specimens were exposed to high temperatures, the cracks on their surfaces were observed at different self-healing ages. In terms of exposure to 300 °C, obvious crystal precipitations began to appear on both sides of the cracks in Group C after 7 days of self-healing, as shown in Figure 17. These precipitates were confirmed to be calcium carbonate (CaCO3) in Section 3.4. In addition, the distribution of CaCO3 crystal particles was visible on the surface around the crack. In contrast, only sporadic CaCO3 particles appeared in the cracks in Groups A and B. The crystallization of Group C reached its peak on the 14th day of the self-healing age. The interior of the cracks was more or less filled with CaCO3 crystals and tended to gradually expand outward. However, for Groups A and B, there was no significant difference from the situation at the self-healing age of seven days. Then, at the self-healing age of 21 days, it was found that the concrete surface of Group C exhibited some peeling of the surface. This may be due to the long-term soaking in the curing solution causing some slight erosion damage to the concrete surface. However, when the healing time was extended to 28 days, CaCO3 crystal crystallization again occurred on the surface of Group C. It is speculated that, as the age increased, the CaCO3 crystals continued to penetrate deep into the interior of the specimen to crystallize, causing tension damage near the surface and falling off. This inference could reasonably explain the results of the pull-out test of Group C, which showed better strength performance with increasing age. Furthermore, more granular crystal accumulation can be seen in the cracks of Groups A and B. Although the deposition rate was slower, there was still a continuous reaction. In terms of exposure to 500 °C, as the self-healing age increased, the CaCO3 crystals in Groups A and B were not obvious, with only quite sparse granular crystals. In comparison, Group C showed crystallization at the self-healing age of seven days. However, compared with the situation at 300 °C, the crystals were fine and localized. On the 14th day of self-healing, the healing of Group C was more obvious and began to develop widely outward. There was a better repair trend at the self-healing ages of 21 and 28 days, but there was still some surface peeling on the concrete surface.

3.4. Microstructure and Phase Analysis

Under the attack of heat, the physical structure and chemical composition of concrete will undergo a series of changes. Precisely because of the change in the form of hydration products, concrete gradually or even drastically loses its mechanical strength and durability [58]. Essentially, after being exposed to high temperatures, concrete can improve its microstructure to a certain extent through appropriate curing, thereby enhancing its mechanical properties [59].

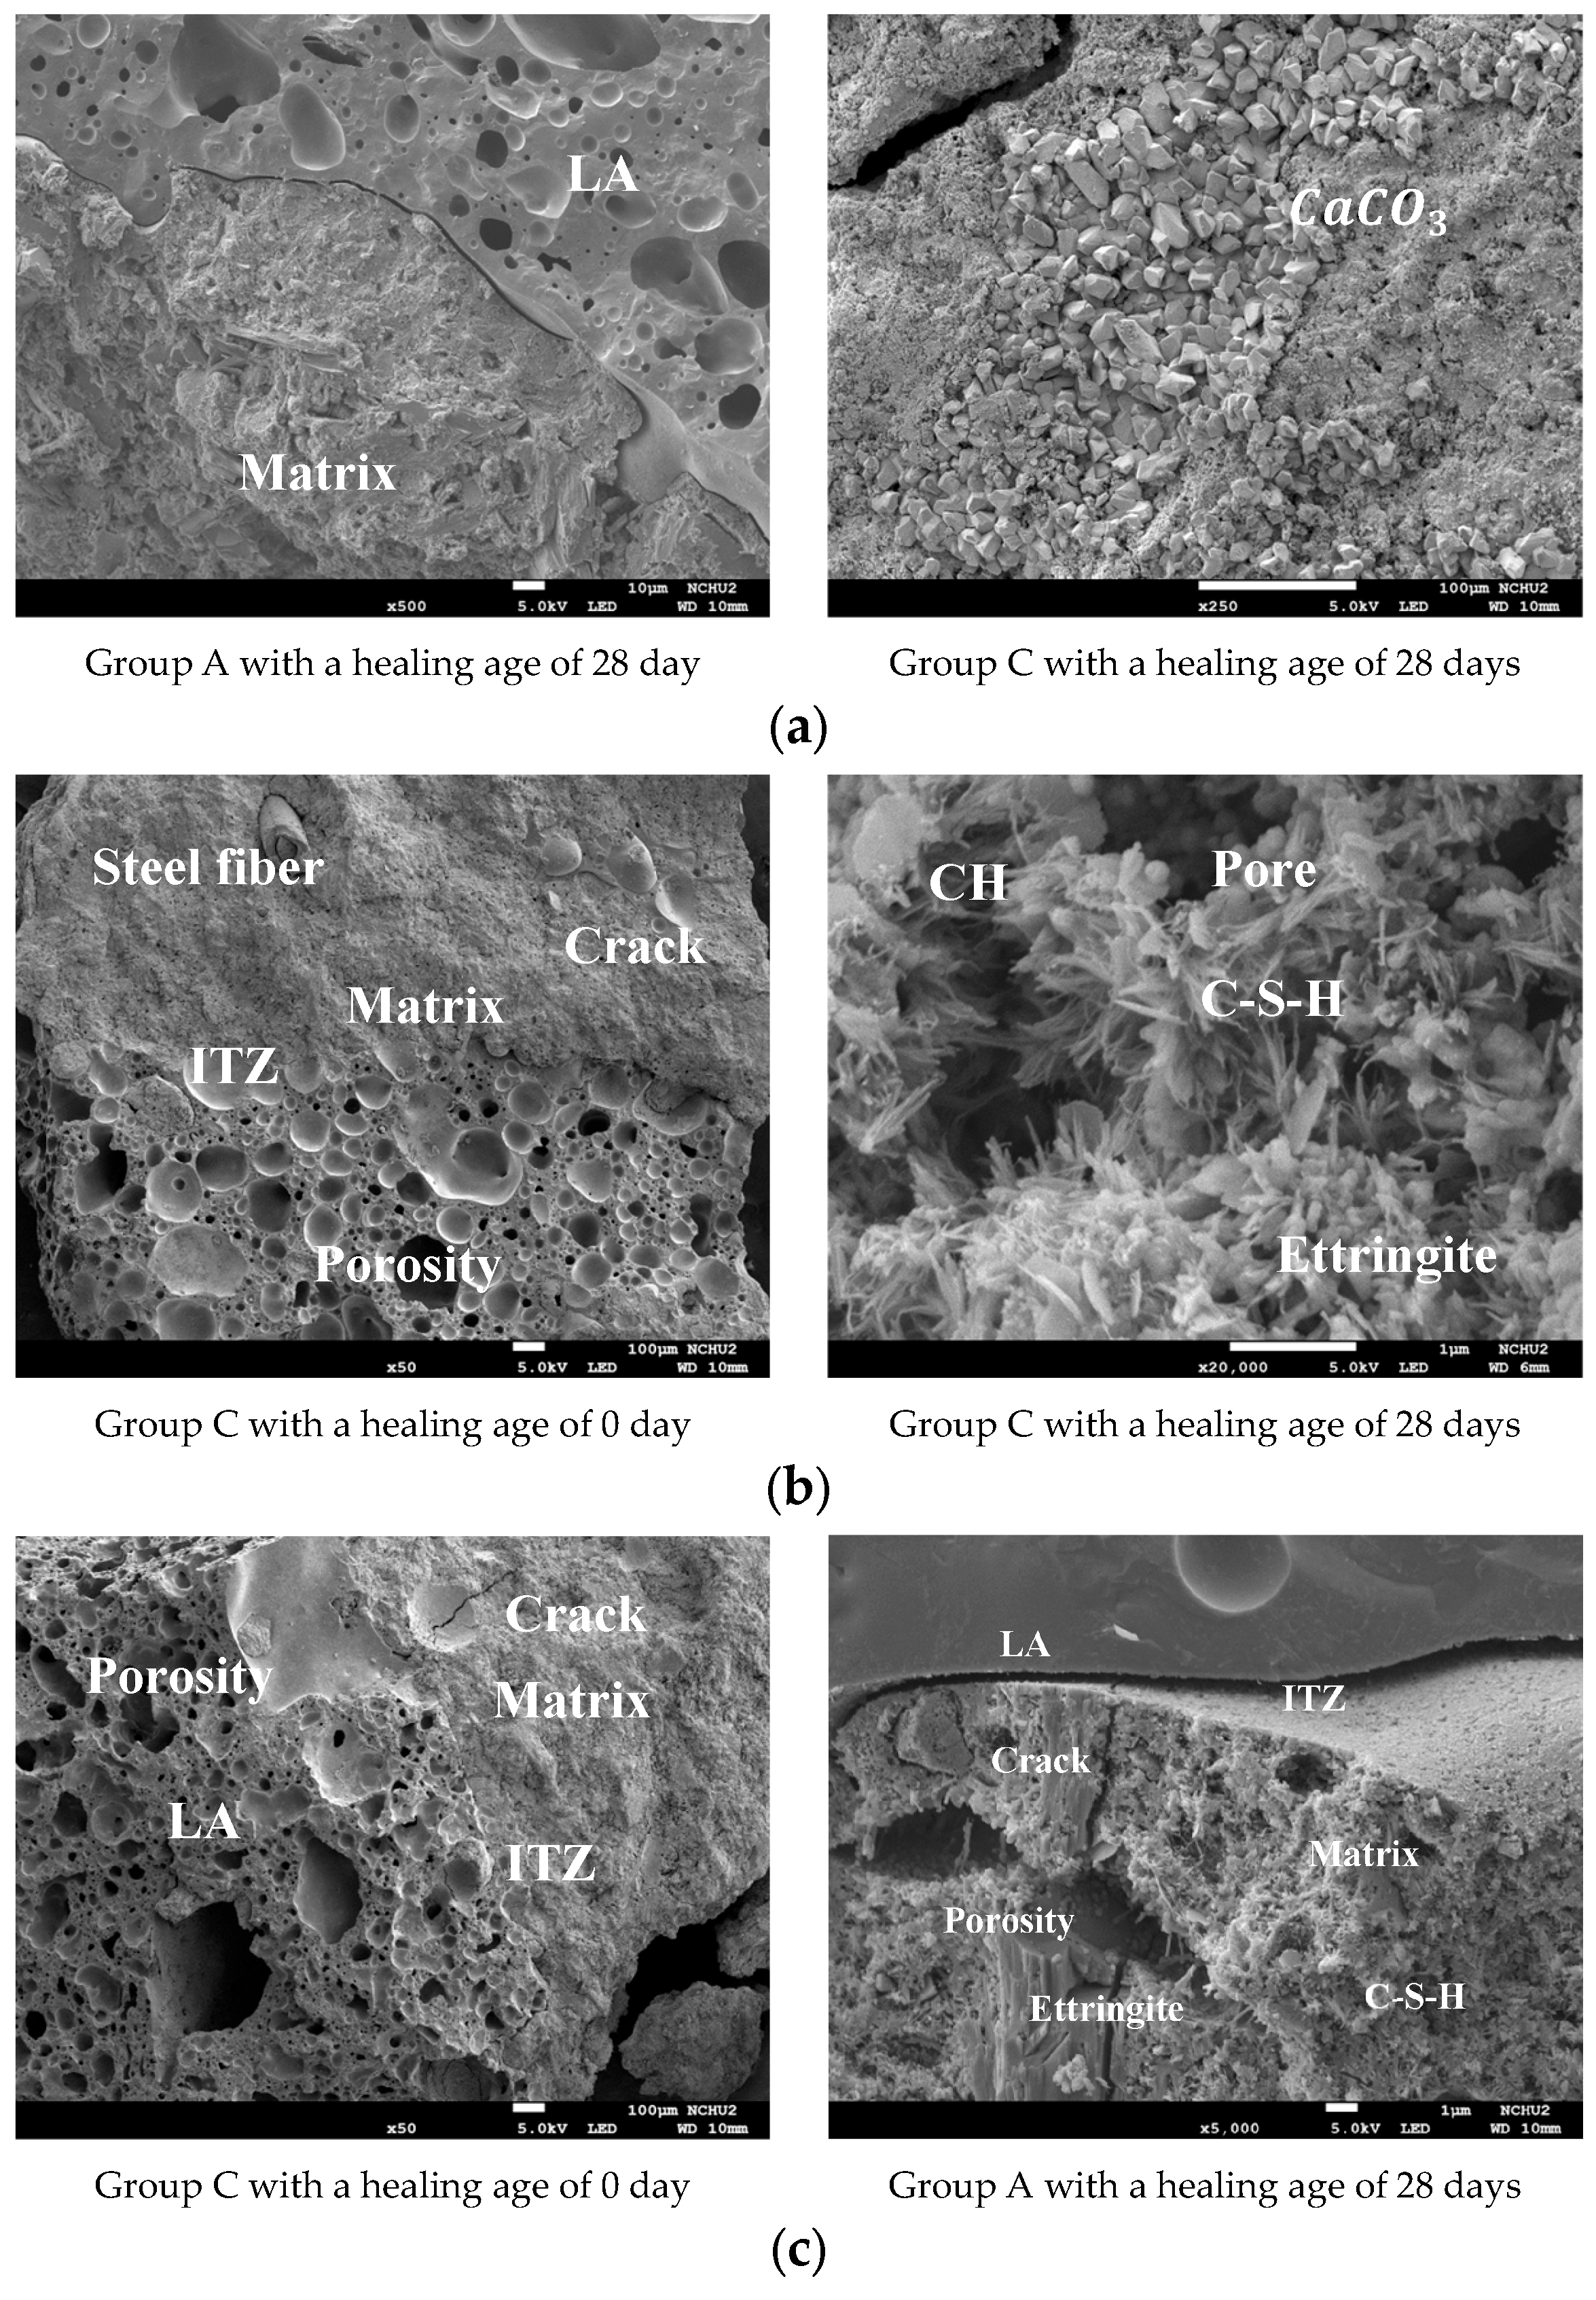
3.4.1. Results of the FESEM Images

Figure 18 shows the FESEM images of the LWAC samples. The figure shows that there were many fine pores inside the LWAs. Essentially, the porosity and pore size distribution in the matrix are key factors controlling the strength of concrete [56]. At room temperature, the CaCO3 crystal particles in the Group C sample had a parallel polygonal cubic structure mixed with some spherical structures, as shown in Figure 18a. Therefore, it is speculated that there were a large number of CaCO3 crystals that precipitated. In other words, Group C specimens exhibited microbially induced CaCO3 precipitation. Because of this, the specimens in Group C showed better improvement effects. This is consistent with the results of Kadapure and Deshannavar [60]. This is because the bacterial metabolic activity during mineralization increased the local saturation state of the cells [61]. This is beneficial to the precipitation of CaCO3. After the high-temperature treatment, Group C had a relatively dense structure around the interfacial transition zones (ITZ) at 300 °C, as shown in Figure 18b. While the ITZ at 500 °C was relatively loose, multiple small cracks could be seen around the matrix. Furthermore, the high-temperature environment of 500 °C indeed caused the hydrated C-S-H colloid to lose its bound water and undergo decay. In addition, parts of the ettringite and calcium hydroxide (CH) were destroyed and dispersed, resulting in the texture of the block having a smoother appearance, as shown in Figure 18c.

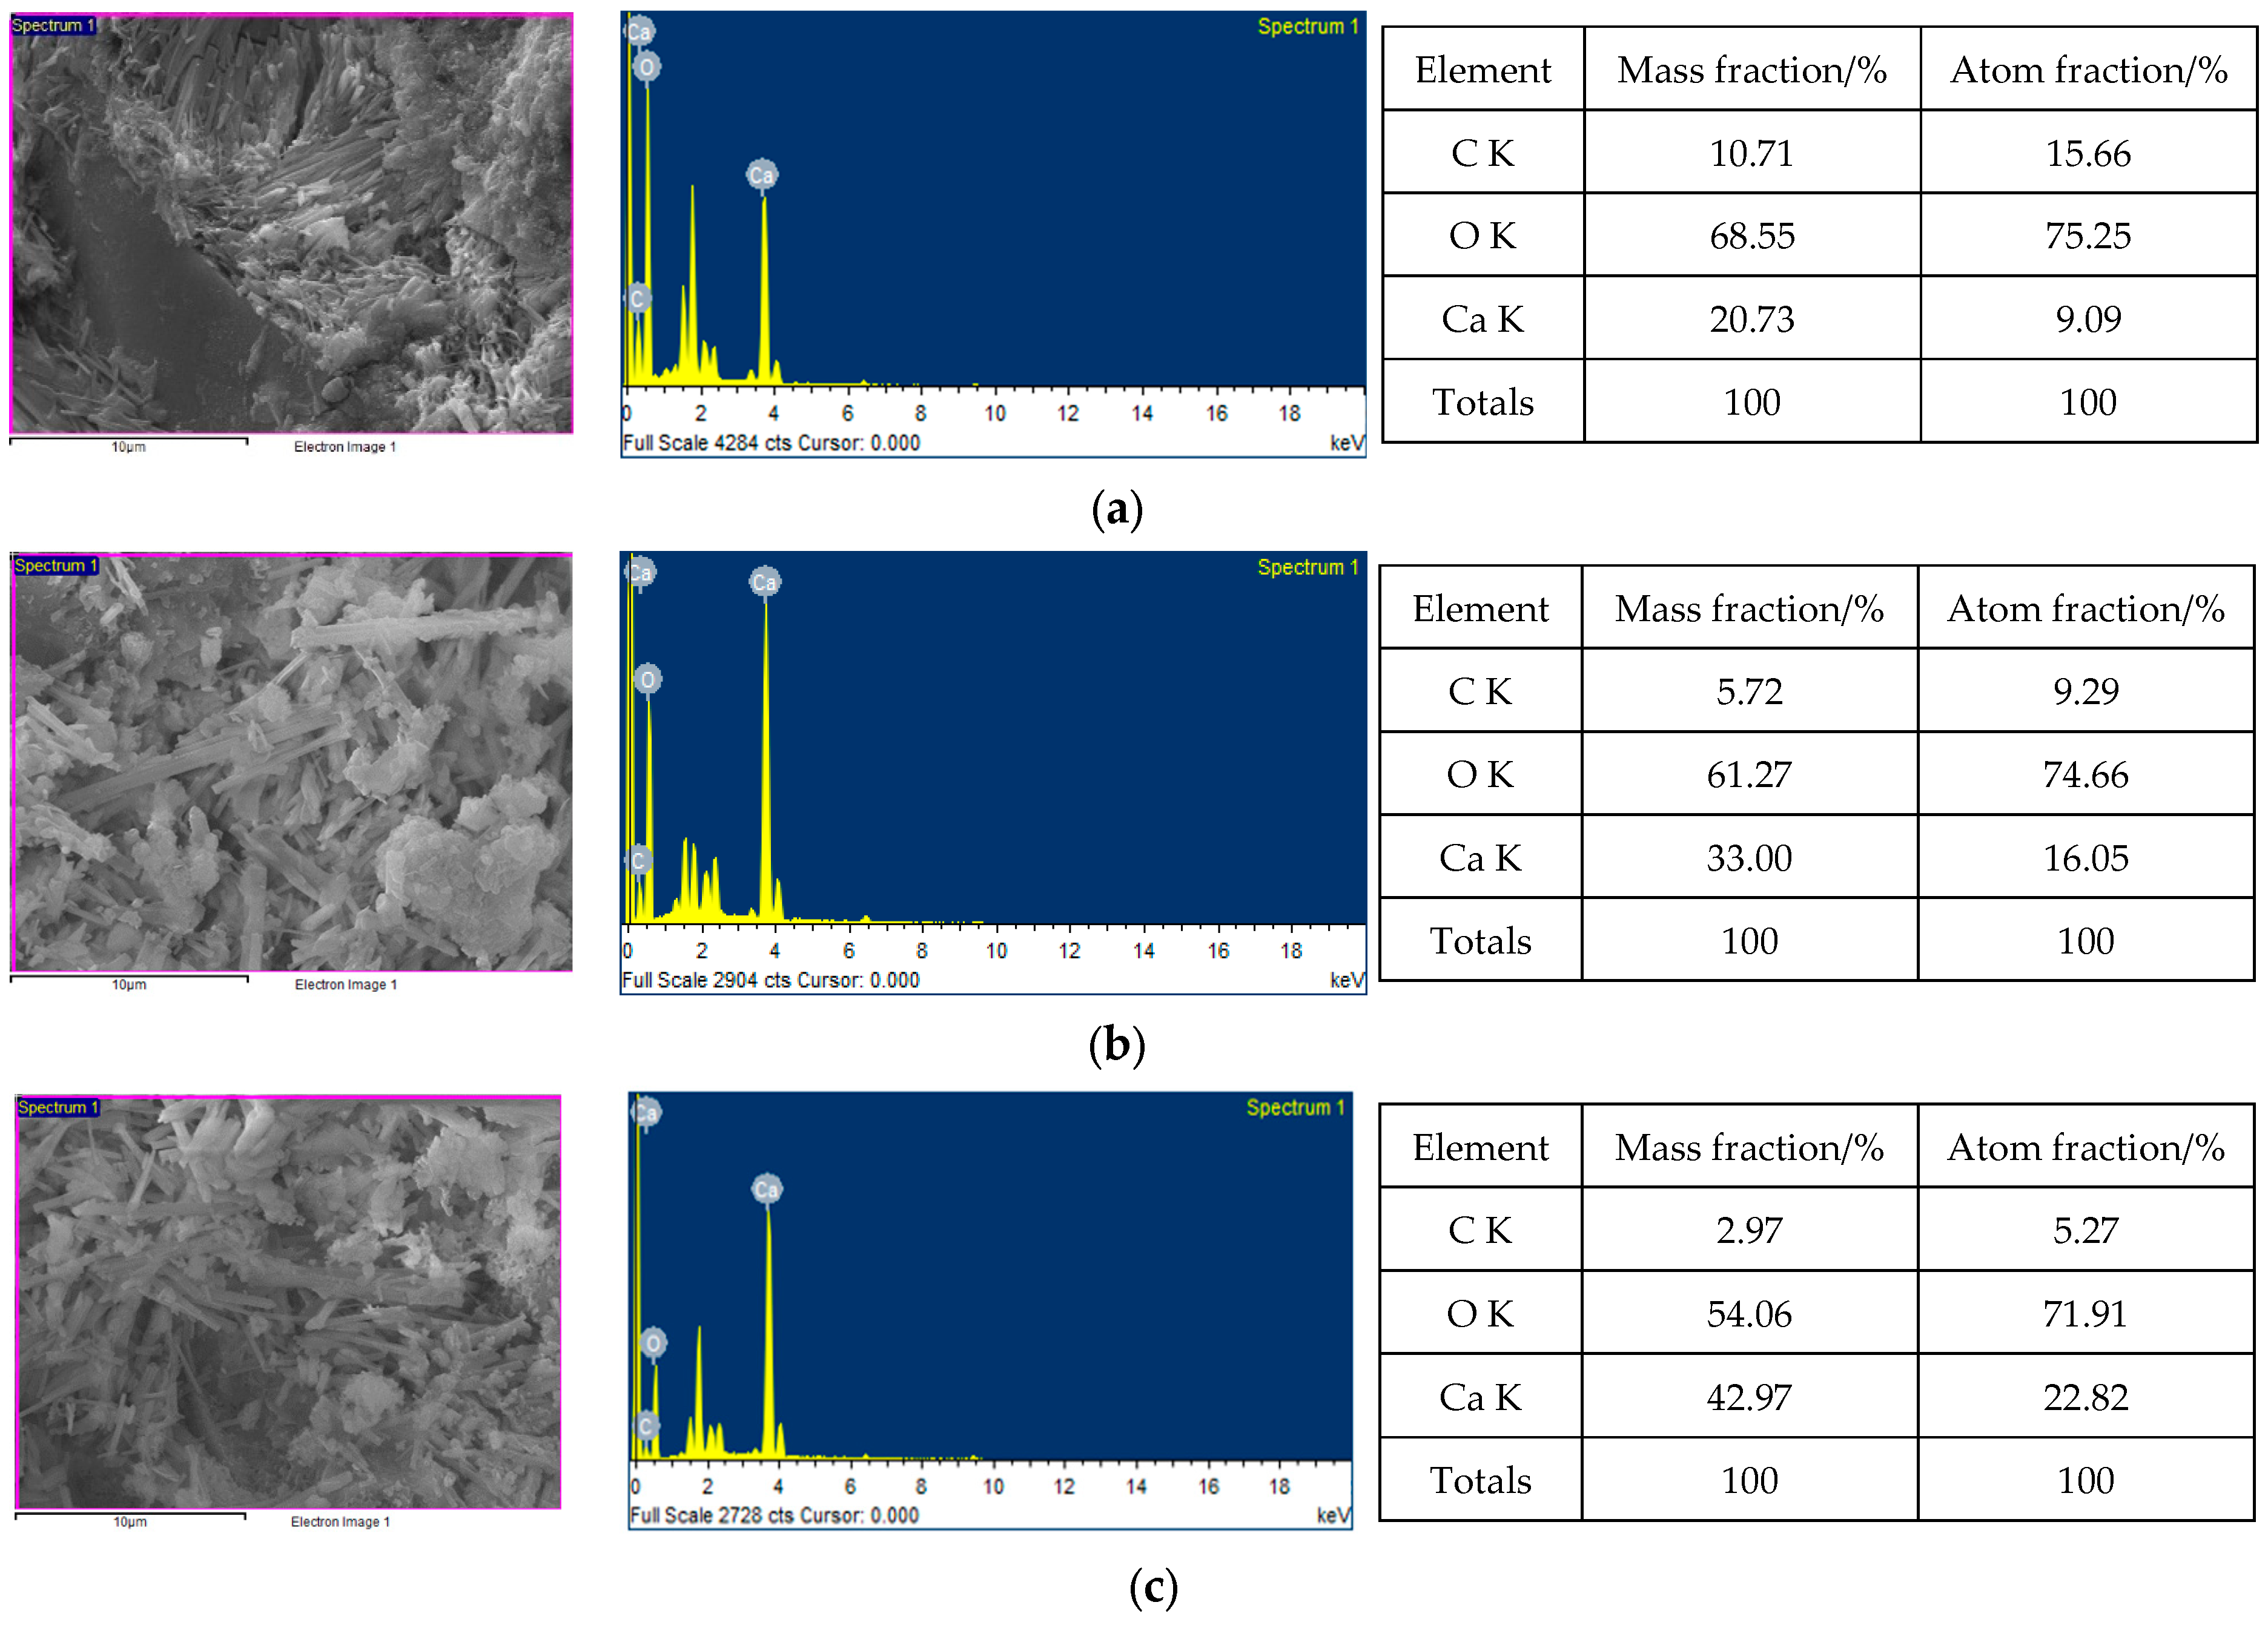
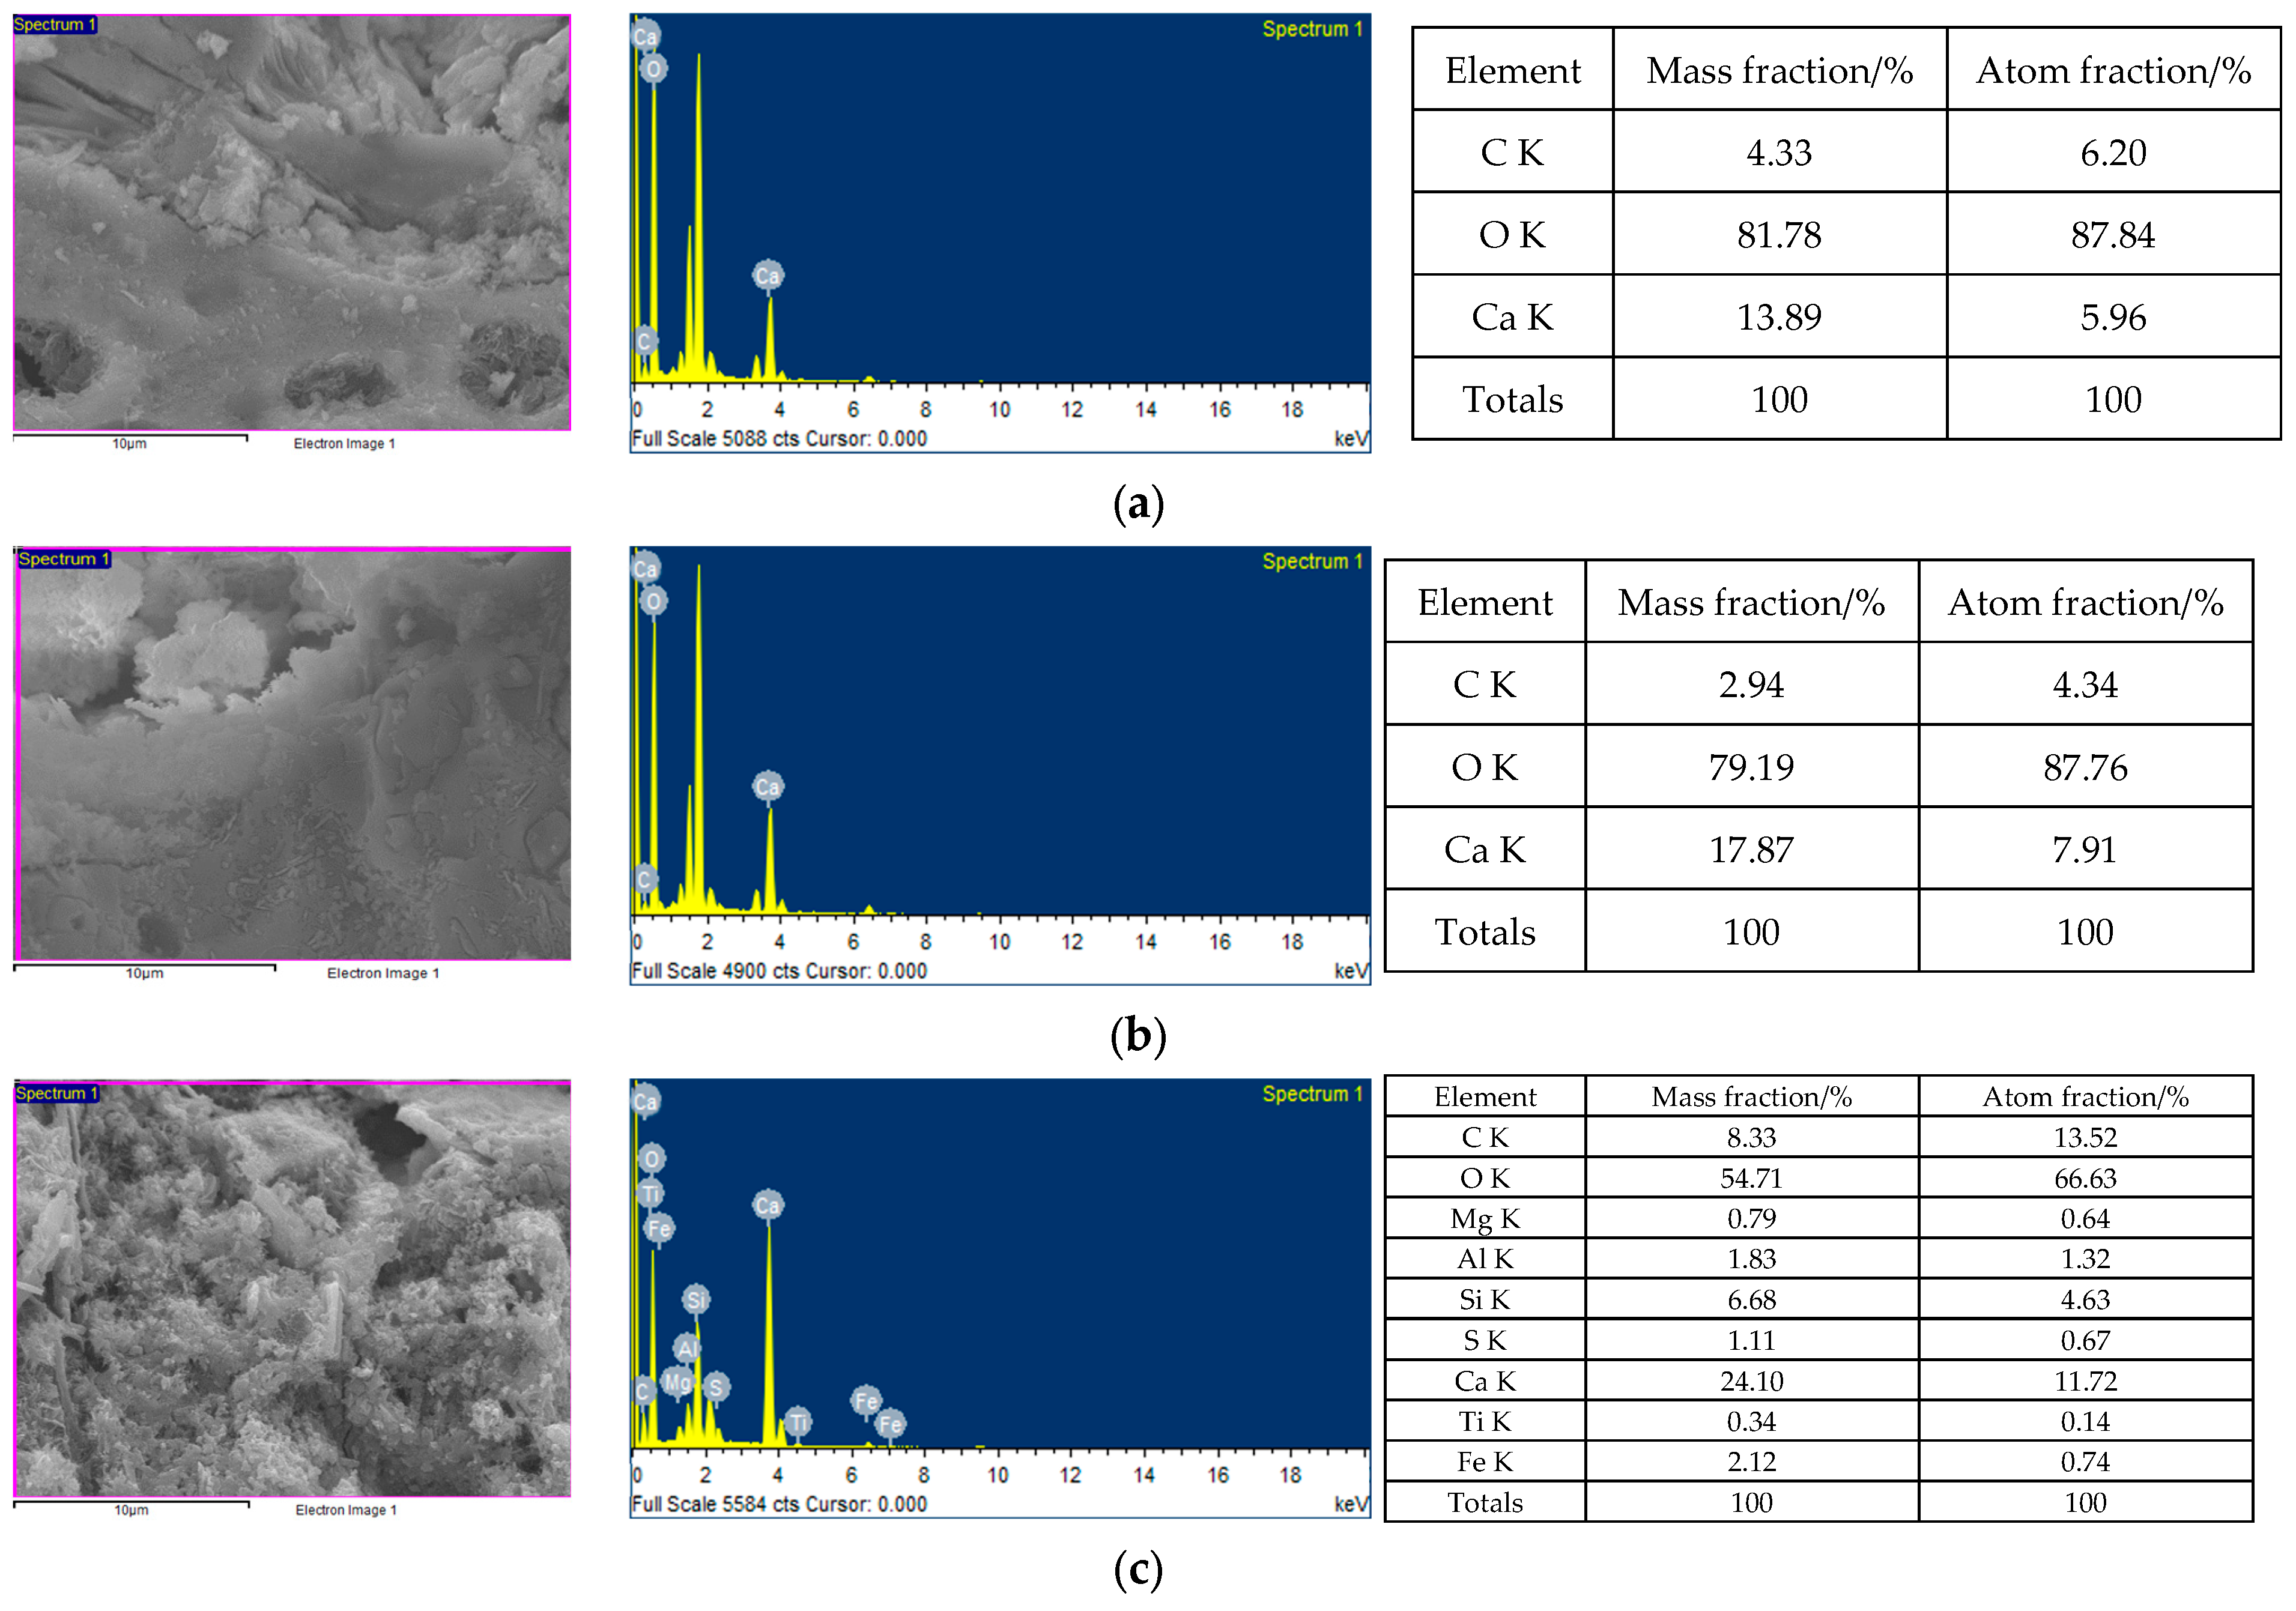
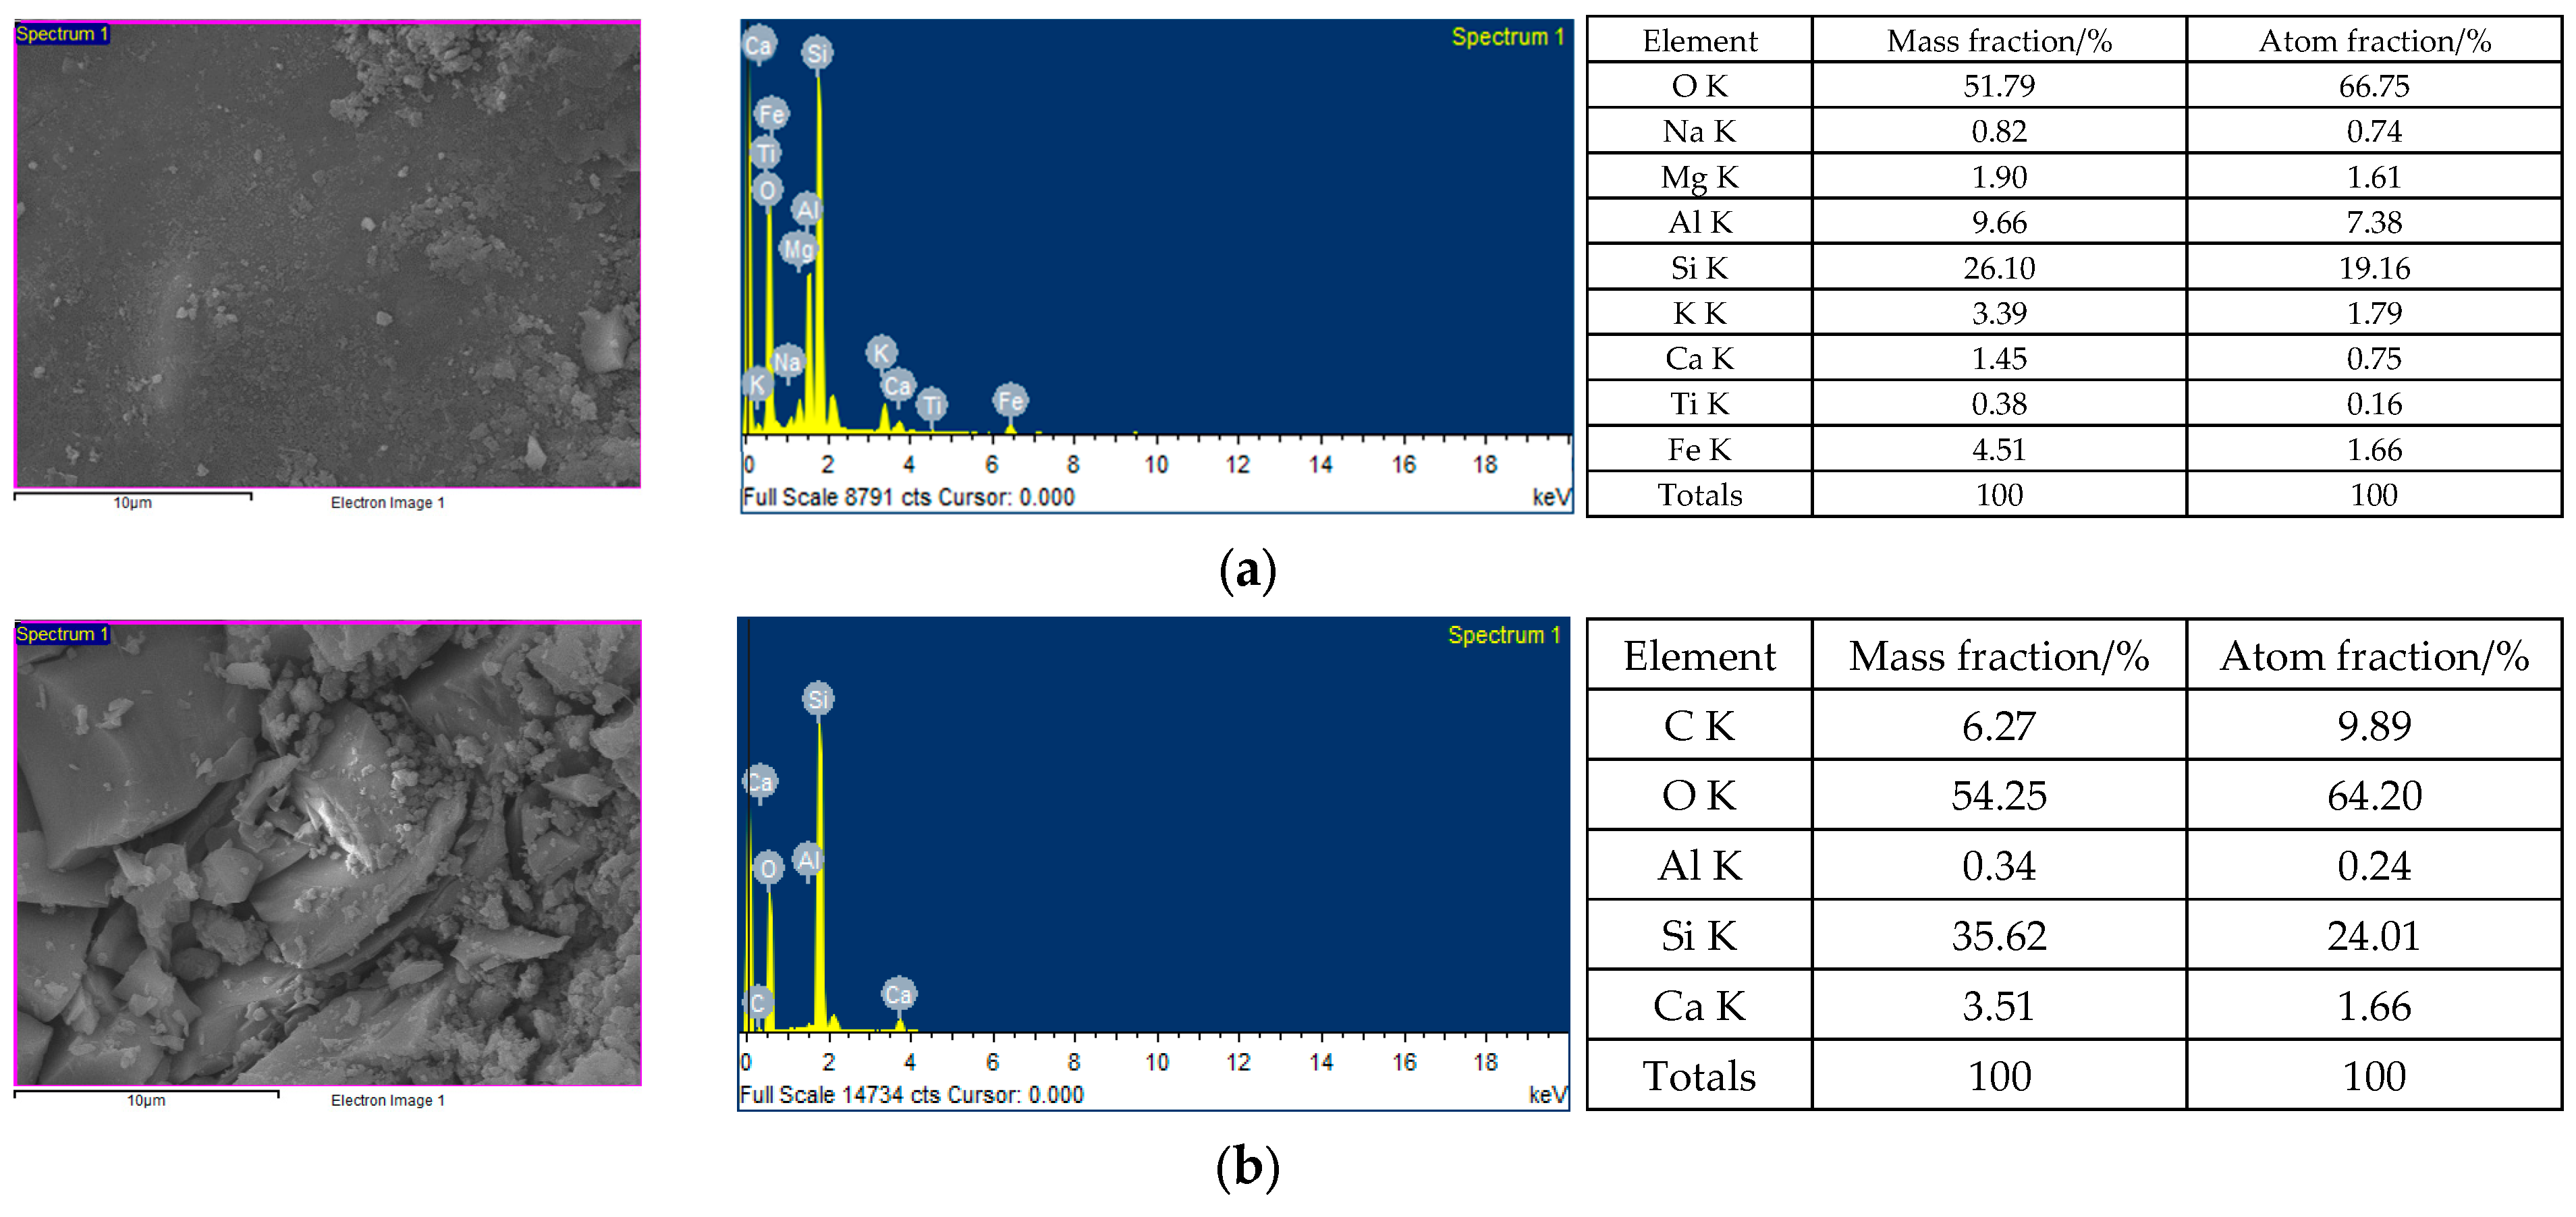
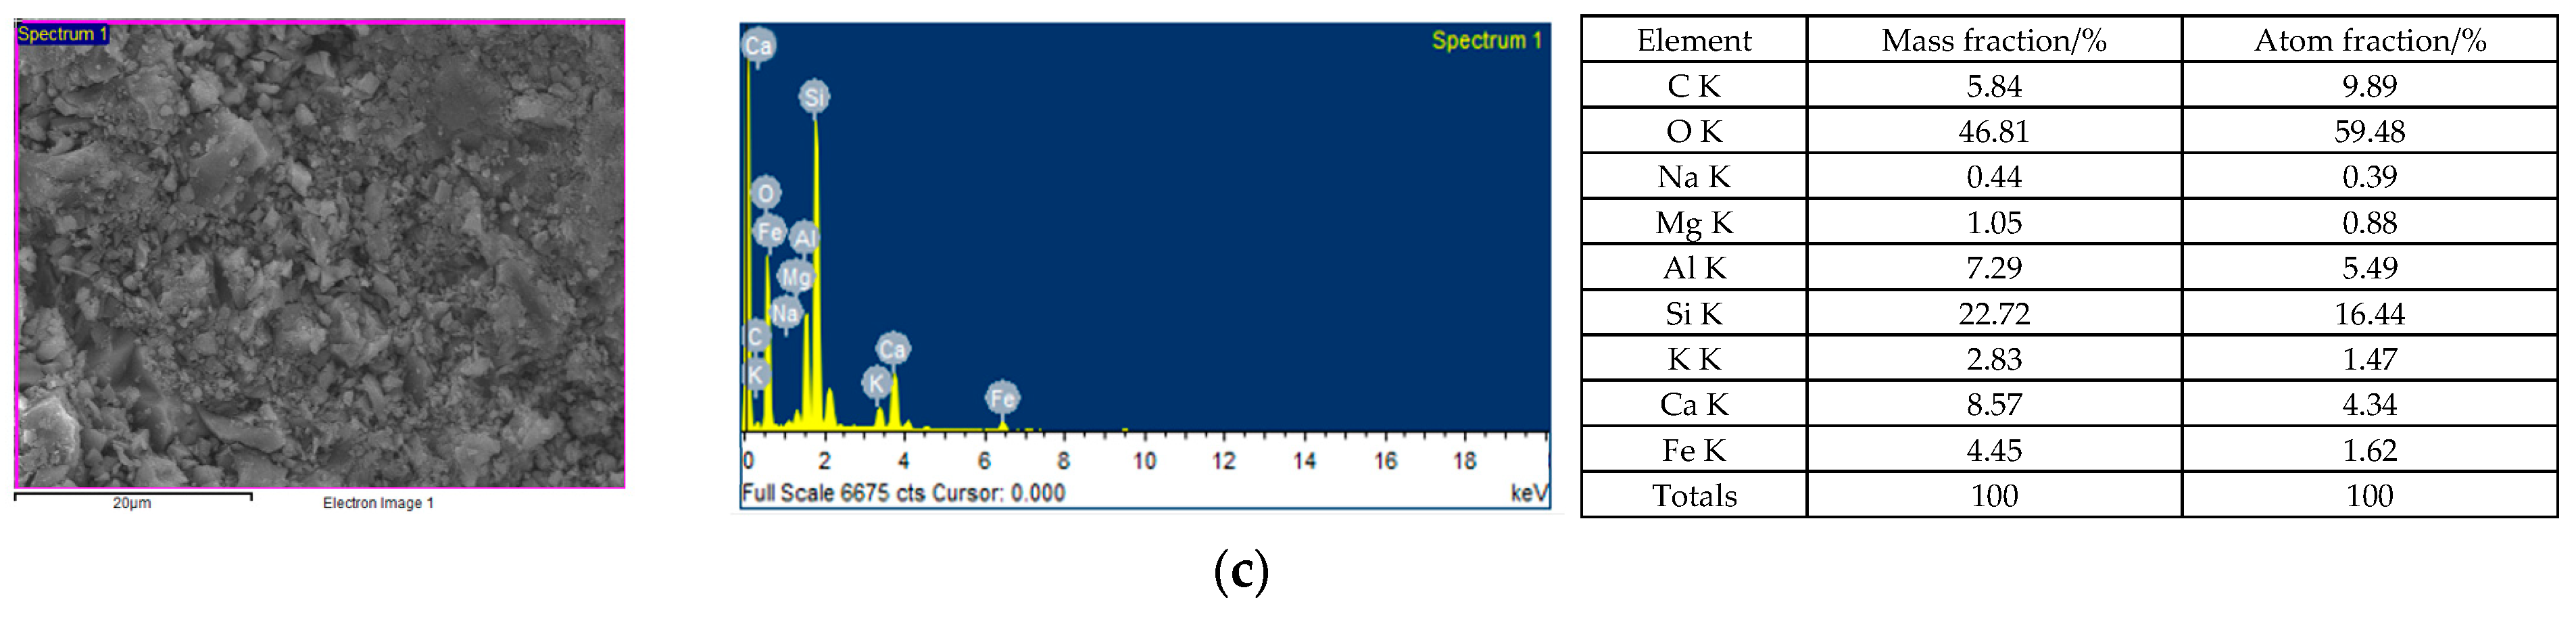
3.4.2. Results of the EDS Analysis

The EDS spectra of each group of samples at different target temperatures are shown in Figure 19, Figure 20 and Figure 21. The EDS analysis indicated that as the ambient temperature and sampling location varied, the main elements (mass fraction) in the sample also varied. Overall, the elements contained in the precipitate samples of each group were mainly C, O, and Ca. In addition, some samples also contained other elements such as Mg and Al. Observing the samples of Group C, it can be seen that after 28 days of self-healing, Ca, C, and O bonded to form CaCO3, which filled the crack area. It can be concluded that the large number of polygonal blocks observed in the previous FESEM images were CaCO3 crystals. Based on this, it can be reasonably inferred that there should be microbial mineralization in the specimens of Group C. This is consistent with the results of Kadapure and Deshannavar [60]. Therefore, Group C achieved a better performance than Group A. In the case of 500 °C, compared with the block in the center, there was a large difference in the amount of CaCO3 precipitate in the blocks at the edges. This corroborated the inference that the strains near the surface of the test specimen died at a high temperature of 500 °C and that the strains inside could partially survive. This could reasonably explain the results of the pull-out test in Group C. The EDS analysis results showed that there were CaCO3 crystals in the samples of the experimental group. It is worth noting that a higher mass fraction of calcium was found in the experimental group samples. Moreover, the ratio of the atom fractions of calcium to silicon is an important parameter. It can be used to reflect the changes in the chemical composition of C-S-H colloids in ITZ and cement matrix [62]. As shown in Figure 21, in the Group A sample, the Ca/Si ratio was 0.04; in the Group B sample, the Ca/Si ratio was 0.07; and in the Group C sample, the Ca/Si ratio was 0.26.

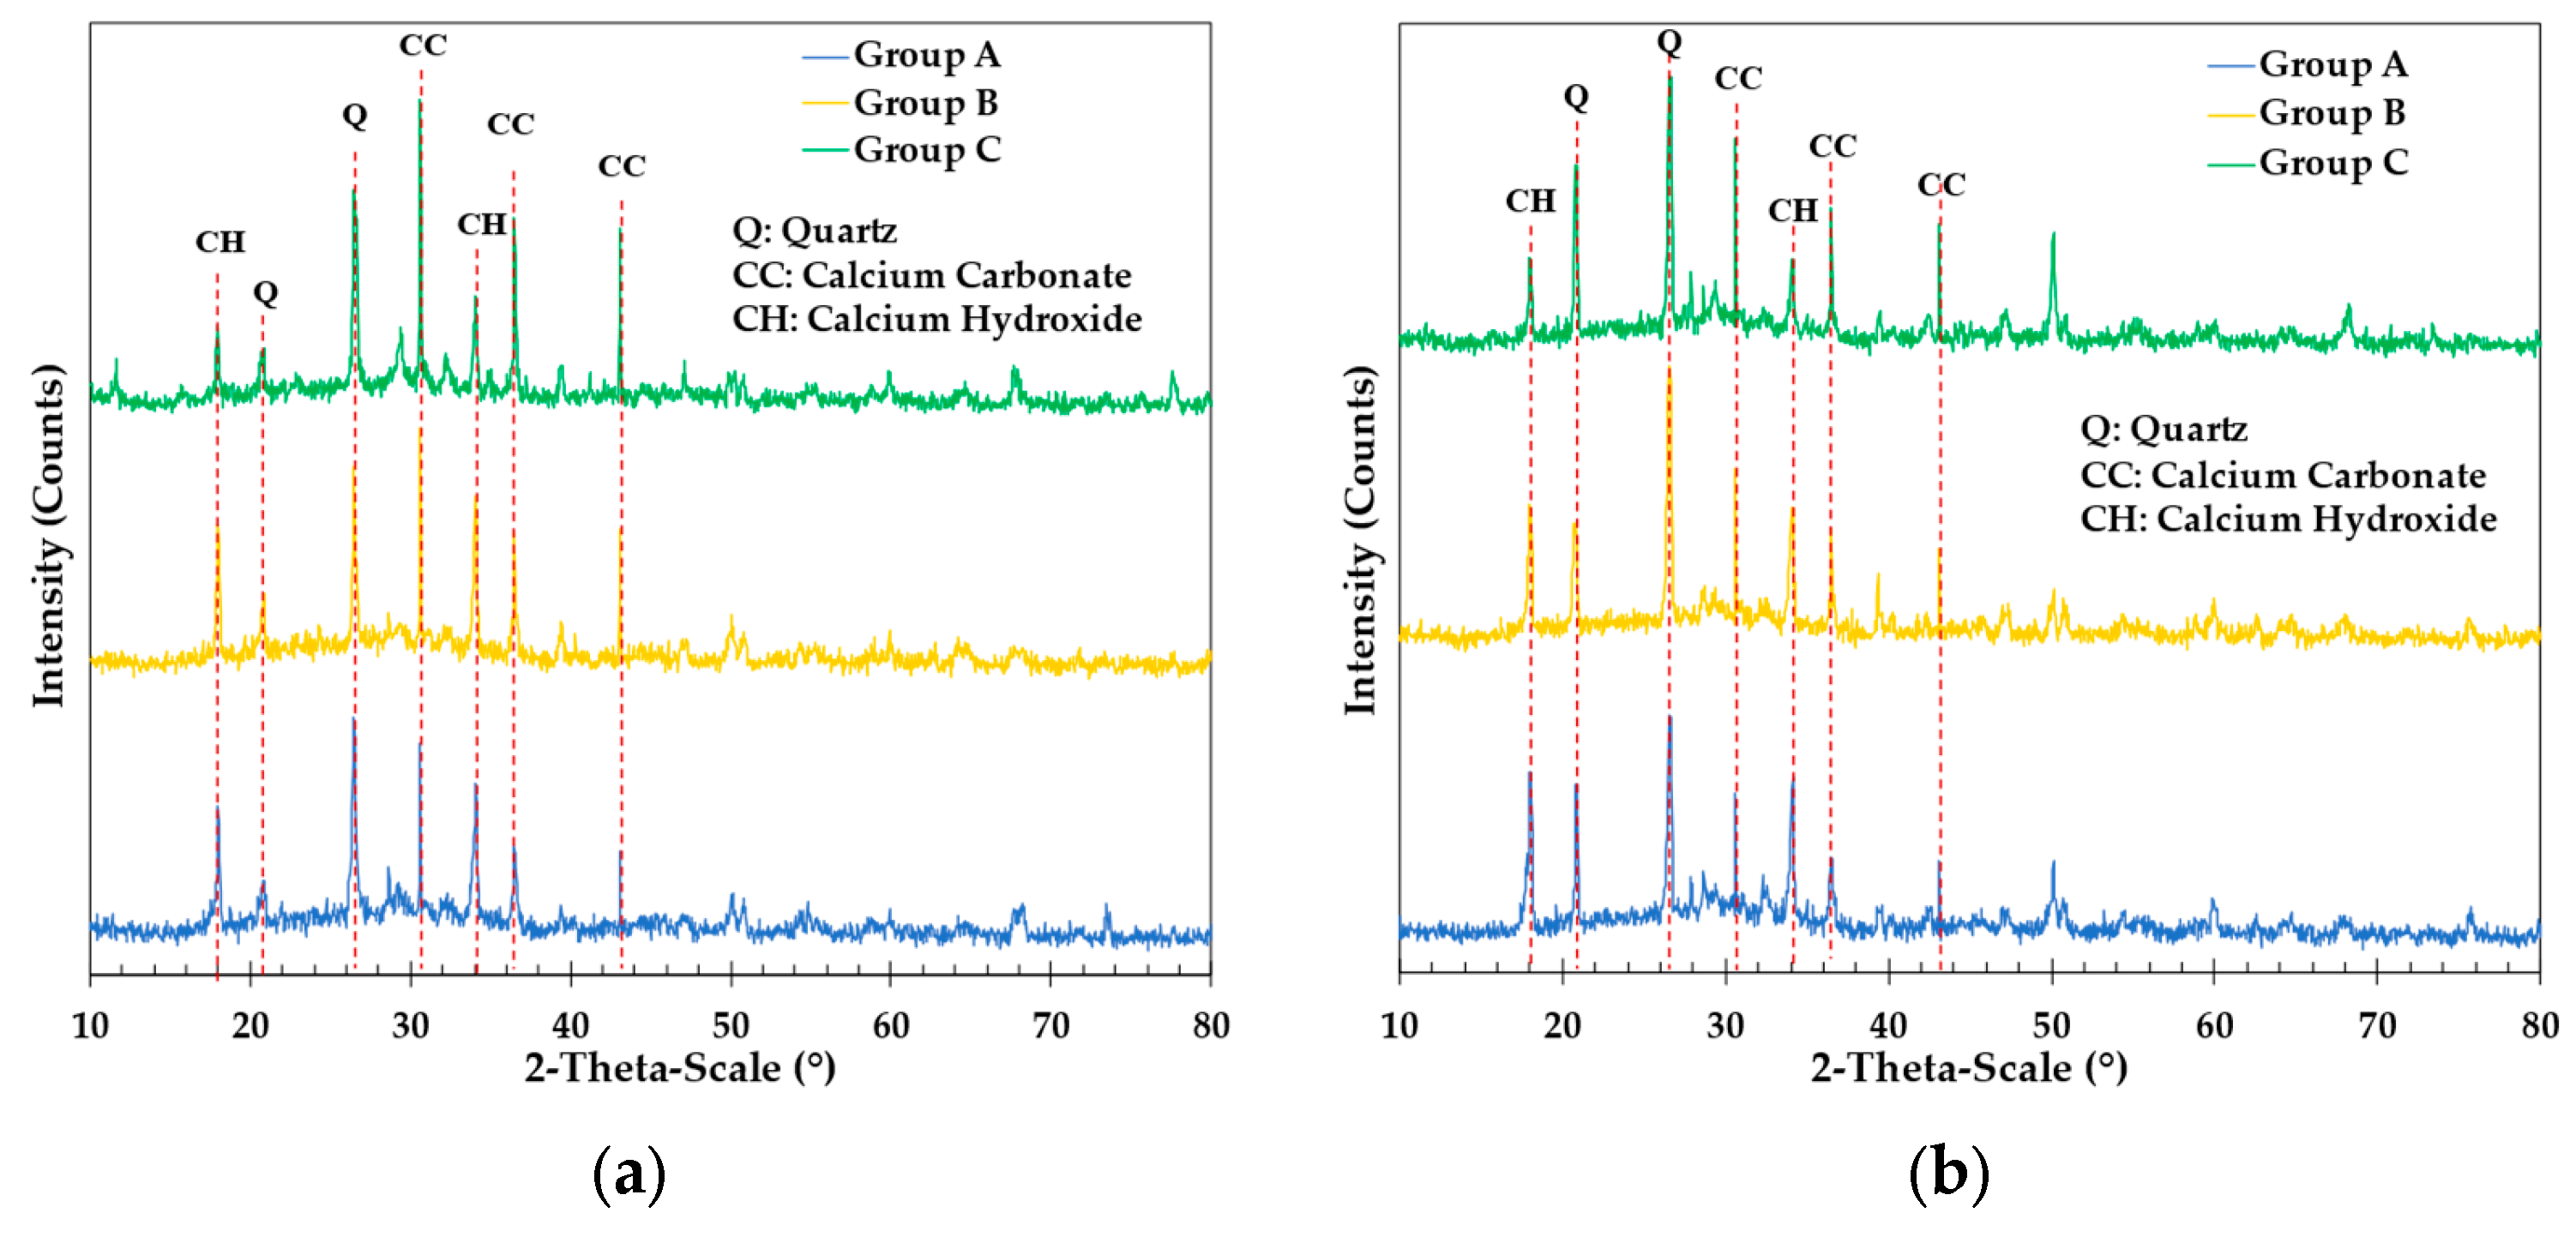
3.4.3. Results of the XRD Analysis

As shown in Figure 22, the diffraction spectrum indicated an obvious peak at the main reflection angle (2-theta) of 30.6°. This is in good agreement with the strong peaks of pure calcite. At the same time, the 2-theta values corresponding to other peaks of the mineralized precipitate had a high degree of matching with the peaks of pure calcite crystals. This result shows that the main component of the induced precipitation was calcite crystal-based CaCO3. Regardless of the target temperature, the X-ray reflected energy intensity of Groups B and C at all angles was higher than that of Group A. Another strong peak appeared at a 2-theta angle of 26.5°, which had a high degree of matching with the peak of quartz crystal. In addition, there were also strong peaks at 2-theta angles of 18.0° and 34.1°, which had a high degree of matching with the peaks of CH crystals. At different temperatures, the X-ray reflection energy intensity of Groups B and C at all angles was lower than that of Group A. In essence, CH crystals are hexagonal sheets with a loose structure, and their contribution to the strength of concrete is less significant. It can be seen from the test results of the experimental group that adding the S. pasteurii strain could effectively reduce the formation of CH crystals and convert them into cubic crystals and agglomerated substances. This illustrates that the experimental group indeed showed a higher strength in the pull-out test.

4. Conclusions

In this study, biomineralization technology was applied to improve the bond strength of fiber-reinforced LWAC after exposure to high temperatures. After exposure to high temperatures, the residual bond strength of each group in the first pull-out test did not decrease significantly, regardless of whether the specimens were unhealed or healed. This is attributed to the fact that the high-temperature test did not cause serious degradation of the internal composition of the concrete in each group of specimens. However, the damage caused during the first pull-out test was relatively severe. Therefore, the residual bond strength of each group in the secondary pull-out test was significantly reduced, regardless of whether the specimens were unhealed or healed. After being exposed to a temperature of 300 °C and undergoing self-healing for 90 days, the residual bond strengths of the secondary pull-out tests in Groups A, B, and C were 20.63, 22.13, and 25.69 MPa, respectively. Moreover, compared with Group A, the relative bond strength ratios of the secondary pull-out tests in Groups B and C increased by 5.8% and 20.3%, respectively. The test results verified that biomineralization can effectively improve the bond strength of LWAC after high-temperature and pull-out damage.
After high-temperature action, the τs relationship curve of each group of concrete pull-out specimens during the first pull-out could be divided into linear ascending, nonlinear ascending, and descending stages. However, the τ–s curve of each group of concrete pull-out specimens during the secondary pull-out process could be divided into four stages. As the healing age increased, the bond strength of Group C increased significantly. In the secondary pull-out test, the 90-day healing period had a higher repair rate, which confirmed that the biomineralization curing method of Group C was more effective. Groups A and B were healed in a constant-temperature incubator, and there was no significant difference in the bond strength after self-healing. This is because the high temperatures caused the bacterial strain of Group B to be lost, resulting in less obvious mineralization. Additionally, the strains mineralized slowly in the absence of adequate nutrient sources. In contrast, biomineralization in Group C operated effectively due to the provision of nutrient sources. Its EDS and XRD analysis results confirmed that the precipitate formed at the crack was CaCO3, which improved the bond strength after self-healing. As a result, the test results of Group C were better than those of Groups A and B.

5. Future Recommendations

Self-healing concrete based on biomineralization uses bacteria to trigger microbial-induced calcium precipitation, thereby promoting the healing of concrete cracks. Preliminary results have been achieved using MICP technology to improve the bond strength of damaged concrete after high temperatures. We can further explore the use of MICP technology to improve the flexural behavior of damaged concrete beam components after high temperatures, such as flexural strength, stiffness, and ductility. This self-healing concrete technology depends on environmental conditions such as pH and temperature, as well as factors such as the implementation methods of bacteria in concrete. In order to extend the life of bacteria, protection strategies for bacteria have been discussed in the literature. However, understanding the interplay between environmental factors and bacterial permanence is crucial to optimize biomineralization-based self-healing and improve the durability of concrete infrastructure. At present, the impact of some harsh environmental conditions on the performance of bacterial carriers has not been studied. In actual projects, self-healing concrete needs to face complex temperature, humidity, and salinity conditions, among other factors, which requires further research. Furthermore, the cost of encapsulating materials increases the initial expense of bacterially based cement composites. Based on the consideration of microbial self-healing concrete being more widely accepted, it is crucial to further study the performance and cost-effectiveness of bacterial self-healing technology under real environmental conditions. At the same time, attention should also be paid to the sourcing of carrier materials, as well as their eco-friendliness and economy. In the future, this technology can be applied to small-scale projects first to continuously make up for the technical deficiencies according to the application situation until a set of technical processes can be formed for actual construction operations.

Author Contributions

Conceptualization, H.-J.C. and C.-W.T.; methodology, H.-J.C. and C.-W.T.; software, C.-W.T. and H.-W.C.; validation, H.-J.C. and Y.-H.L.; formal analysis, C.-W.T.; investigation, H.-J.C. and Y.-H.L.; resources, C.-W.T.; data curation, H.-J.C., H.-W.C. and Y.-H.L.; writing—original draft preparation, H.-J.C. and C.-W.T.; writing—review and editing, C.-W.T.; visualization, H.-W.C.; supervision, C.-W.T. and Y.-H.L.; project administration, C.-W.T.; funding acquisition, C.-W.T. All authors have read and agreed to the published version of the manuscript.

Funding

This research was funded by the Ministry of Science and Technology of Taiwan, grant number MOST 110-2221-E-230-001-MY3.

Institutional Review Board Statement

Not applicable.

Informed Consent Statement

Not applicable.

Data Availability Statement

The data presented in this study are available upon request from the corresponding author. The data are not publicly available due to privacy.

Acknowledgments

The authors are grateful to the Department of Civil Engineering of National Chung-Hsing University for providing the experimental equipment and technical support. In addition, the authors thank Yi-Hao Guo from the Chunmin Construction Company for providing bacterial solutions and technical support.

Conflicts of Interest

The authors declare no conflicts of interest.

Abbreviations

BS: bond strength, C/D: concrete cover-to-diameter of the rebar ratio, CH: calcium hydroxide, C-S-H: calcium silicate hydrates, d b : rebar diameter, EDS: energy dispersive spectroscopy, FA: fine aggregate, f c : concrete compressive strength, FESEM: field emission scanning electron microscope, ITZ: interfacial transition zones, LWAC: lightweight aggregate concrete, LWAs: lightweight aggregates, l e : embedded length, MICP: microbial-induced calcium carbonate precipitation, NWC: normal-weight aggregate concrete, P: applied load, RC: reinforced concrete, RT: room temperature, S. pasteurii: Sporosarcina pasteurii, s: slip, XRD: X-ray diffraction, τ: bond stress.

References

  1. Tang, C.-W. Uniaxial bond stress-slip behavior of reinforcing bars embedded in lightweight aggregate concrete. Struct. Eng. Mech. 2017, 62, 651–661. [Google Scholar] [CrossRef]
  2. Gao, J.; Suqa, W.; Morino, K. Mechanical properties of steel fiber-reinforced, high-strength, lightweight concrete. Cem. Concr. Compos. 1997, 19, 307–313. [Google Scholar] [CrossRef]
  3. Guneyisi, E.; Gesoglu, M.; Azez, O.A.; Öz, H.Ö. Effect of nano silica on the workability of self-compacting concretes having untreated and surface treated lightweight aggregates. Construct. Build. Mater. 2016, 115, 371–380. [Google Scholar] [CrossRef]
  4. Inozemtcev, A.S.; Epikhin, S.D. Conditions for the Preparation of Self-Compacting Lightweight Concrete with Hollow Microspheres. Materials 2023, 16, 7288. [Google Scholar] [CrossRef] [PubMed]
  5. Bicer, A.; Celik, N.; Ozgen, F.; Kistak, C.; Taskiran, A. Thermomechanical Properties of a Concrete Composed of Cherry Tree Resin and Expanded Clay (Exclay) Aggregate. Appl. Sci. 2024, 14, 336. [Google Scholar] [CrossRef]
  6. Stratoura, M.C.; Lazari, G.-E.D.; Badogiannis, E.G.; Papadakis, V.G. Perlite and Rice Husk Ash Re-Use As Fine Aggregates in Lightweight Aggregate Structural Concrete—Durability Assessment. Sustainability 2023, 15, 4217. [Google Scholar] [CrossRef]
  7. Youssf, O.; Roychand, R.; Elchalakani, M.; Tahwia, A.M. Assessment of the Efficiency of Eco-Friendly Lightweight Concrete as Simulated Repair Material in Concrete Joints. Buildings 2024, 14, 37. [Google Scholar] [CrossRef]
  8. Różycki, M.; Hager, I.; Zdeb, T.; Sitarz, M.; Mróz, K.; Zdeb, J.; Smorońska, N. Mechanical Properties and Water Permeability of Textile-Reinforced Reactive Powder Concrete with Lightweight Aggregate. Materials 2023, 16, 7619. [Google Scholar] [CrossRef]
  9. Chen, H.-J.; Chen, T.-K.; Tang, C.-W.; Chang, H.-W. The Evaluation of the Effectiveness of Biomineralization Technology in Improving the Strength of Damaged Fiber-Reinforced LWAC. Materials 2024, 17, 214. [Google Scholar] [CrossRef]
  10. Zhao, M.; Zhao, M.; Chen, M.; Li, J.; Law, D. An experimental study on strength and toughness of steel fiber reinforced expanded-shale lightweight concrete. Constr. Build. Mater. 2018, 183, 493–501. [Google Scholar] [CrossRef]
  11. Kovács, T.; Gyurkó, Z.; Jakab, L.; Nemes, R. Influence of Unidirectional Cyclic Loading on Bond between Steel Bars Embedded in Lightweight Aggregate Concrete. Solids 2022, 3, 397–415. [Google Scholar] [CrossRef]
  12. Abed, M.A.; Alkurdi, Z.; Fořt, J.; Černý, R.; Solyom, S. Bond Behavior of FRP Bars in Lightweight SCC under Direct Pull-Out Conditions: Experimental and Numerical Investigation. Materials 2022, 15, 3555. [Google Scholar] [CrossRef] [PubMed]
  13. Solyom, S.; Di Benedetti, M.; Balázs, G.L. Bond of FRP bars in air-entrained concrete: Experimental and statistical study. Constr. Build. Mater. 2021, 300, 124193. [Google Scholar] [CrossRef]
  14. Solyom, S.; Balázs, G.L. Analytical and statistical study of the bond of FRP bars with different surface characteristics. Compos. Struct. 2021, 270, 113953. [Google Scholar] [CrossRef]
  15. Huang, L.; Chi, Y.; Xu, L.; Chen, P.; Zhang, A. Local bond performance of rebar embedded in steel-polypropylene hybrid fiber reinforced concrete under monotonic and cyclic loading. Constr. Build. Mater. 2016, 103, 77–92. [Google Scholar] [CrossRef]
  16. ACI Committee 408; Bond and Development of Straight Reinforcing Bars in Tension (ACI 408R–03). American Concrete Institute: Farmington Hills, MI, USA, 2003.
  17. ACI Committee 318-19; Building Code Requirements for Structural Concrete and Commentary. American Concrete Institute: Farmington Hills, MI, USA, 2019.
  18. Hossain, K.M.A. Bond characteristics of plain and deformed bars in lightweight pumice concrete. Constr. Build. Mater. 2008, 22, 1491–2149. [Google Scholar] [CrossRef]
  19. Mo, K.H.; Alengaram, U.J.; Visintin, P.; Goh, S.H.; Jumaat, M.Z. Influence of lightweight aggregate on the bond properties of concrete with various strength grades. Constr. Build. Mater. 2015, 84, 377–386. [Google Scholar] [CrossRef]
  20. CEB-FIP; Fib Model Code for Concrete Structures 2010. Comité Euro international du Béton/Federation Internationale de la Precontrainte: Lausanne, Switzerland, 2013.
  21. Wang, B.; Zhu, E.; Zhang, Z.; Zhu, C. Bond-slip behaviour of lightweight aggregate concrete based on virtual crack model with exponential softening characteristics. Constr. Build. Mater. 2022, 345, 128349. [Google Scholar] [CrossRef]
  22. Liu, Y.; Liu, X.; Wu, T.; Luo, X.; Feng, W. Bond-slip behavior between corroded rebar and lightweight aggregate concrete. Constr. Build. Mater. 2023, 367, 130268. [Google Scholar] [CrossRef]
  23. Yang, X.; Wu, T.; Liu, X.; Liu, Y. Bond-slip relationship of rebar in lightweight aggregate concrete. Structures 2022, 45, 2198–2209. [Google Scholar] [CrossRef]
  24. Varghese, A.; Anand, N.; Arulraj, G.P.; Alengaram, U.J. Influence of fibers on bond strength of concrete exposed to elevated temperature. J. Adhe. Sci. Tech. 2019, 33, 1521–1543. [Google Scholar] [CrossRef]
  25. Kevinly, C.; Du, P.; Tan, K.H. Local bond-slip behaviour of reinforcing bars in fibre reinforced lightweight aggregate concrete at ambient and elevated temperatures. Constr. Build. Mater. 2023, 377, 131010. [Google Scholar] [CrossRef]
  26. Tang, C.-W. Local bond–slip behavior of fiber reinforced LWAC after exposure to elevated temperatures. Struct. Eng. Mech. 2020, 73, 437–445. [Google Scholar] [CrossRef]
  27. Hermawan, H.; Wiktor, V.; Gruyaert, E.; Serna, P. Experimental investigation on the bond behaviour of steel reinforcement in self-healing concrete. Constr. Build. Mater. 2023, 383, 131378. [Google Scholar] [CrossRef]
  28. Dry, C.M. Three designs for the internal release of sealants, adhesives, and waterproofing chemicals into concrete to reduce permeability. Cem. Concr. Res. 2000, 30, 1969–1977. [Google Scholar] [CrossRef]
  29. Stanaszek-Tomal, E. Bacterial Concrete as a Sustainable Building Material? Sustainability 2020, 12, 696. [Google Scholar] [CrossRef]
  30. Jonkers, H.M.; Thijssen, A.; Muyzer, G.; Copuroglu, O.; Schlangen, E. Application of bacteria as self-healing agent for the development of sustainable concrete. Ecol. Eng. 2010, 36, 230–235. [Google Scholar] [CrossRef]
  31. Xu, J.; Wang, X.; Zuo, J.; Liu, X. Self-healing of concrete cracks by ceramsite-loaded microorganisms. Adv. Mater. Sci. Eng. 2018, 2018, 5153041. [Google Scholar] [CrossRef]
  32. Nimafar, M.; Samali, B.; Hosseini, S.J.; Akhlaghi, A. Use of Bacteria Externally for Repairing Cracks and Improving Properties of Concrete Exposed to High Temperatures. Crystals 2021, 11, 1503. [Google Scholar] [CrossRef]
  33. Chen, H.-J.; Chang, H.-L.; Tang, C.-W.; Yang, T.-Y. Application of biomineralization technology to self-healing of fiber-reinforced lightweight concrete after high temperatures. Materials 2022, 15, 7796. [Google Scholar] [CrossRef]
  34. Krishnapriya, S.; Babu, D.L.V.; Arulraj, G.P. Isolation and identification of bacteria to improve the strength of concrete. Microbiol. Res. 2015, 174, 48–55. [Google Scholar] [CrossRef] [PubMed]
  35. Wiktor, V.; Jonkers, H.M. Case Studies in Construction Materials Field performance of bacteria-based repair system: Pilot study in a parking garage. Case Stud. Constr. Mater. 2015, 2, 11–17. [Google Scholar]
  36. De Muynck, W.; Verstraete, W. Bacterial carbonate precipitation as an alternative surface treatment for concrete. Constr. Build. Mater. 2008, 22, 875–885. [Google Scholar] [CrossRef]
  37. Zhang, Y.S.; Liu, Y.; Sun, X.D.; Zeng, W.; Xing, H.P.; Lin, J.Z.; Kang, S.B.; Yu, L. Application of microbially induced calcium carbonate precipitation (MICP) technique in concrete crack repair: A review. Constr. Build. Mater. 2024, 411, 134313. [Google Scholar] [CrossRef]
  38. Vekariya, M.S.; Pitroda, J. Bacterial concrete: New era for construction industry. Int. J. Eng. Trends Technol 2013, 4, 4128–4137. [Google Scholar]
  39. Ramagiri, K.K.; Chintha, R.; Bandlamudi, R.K.; Kara De Maeijer, P.; Kar, A. Cradle-to-Gate Life Cycle and Economic Assessment of Sustainable Concrete Mixes—Alkali-Activated Concrete (AAC) and Bacterial Concrete (BC). Infrastructures 2021, 6, 104. [Google Scholar] [CrossRef]
  40. Justo-Reinoso, I.; Arena, N.; Reeksting, B.J.; Gebhard, S.; Paine, K. Bacteria-based self-healing concrete—A life cycle assessment perspective. Dev. Built Environ. 2023, 16, 100244. [Google Scholar] [CrossRef]
  41. Chen, H.-J.; Peng, C.-F.; Tang, C.-W.; Chen, Y.-T. Self-Healing Concrete by Biological Substrate. Materials 2019, 12, 4099. [Google Scholar] [CrossRef]
  42. ASTM C511-21; Standard Specification for Mixing Rooms, Moist Cabinets, Moist Rooms, and Water Storage Tanks Used in the Testing of Hydraulic Cements and Concretes. ASTM International: West Conshohocken, PA, USA, 2021.
  43. ASTM C143/C143M-15a; Standard Test Method for Slump of Hydraulic-Cement Concrete. ASTM International: West Conshohocken, PA, USA, 2015.
  44. ASTM C138/C138M-17a; Standard Test Method for Density (Unit Weight), Yield, and Air Content (Gravimetric) of Concrete. ASTM International: West Conshohocken, PA, USA, 2017.
  45. ASTM C39/C39M-18; Standard Test Method for Compressive Strength of Cylindrical Concrete Specimens. ASTM International: West Conshohocken, PA, USA, 2018.
  46. ASTM C469/C469M-14; Standard Test Method for Static Modulus of Elasticity and Poisson’s Ratio of Concrete in Compression. ASTM International: West Conshohocken, PA, USA, 2014.
  47. ASTM C234; Standard Test Method for Comparing Concretes on the Basis of the Bond Developed with Reinforcing Steel. ASTM International: West Conshohocken, PA, USA, 1991.
  48. Tang, C.-W. Local bond stress-slip behavior of reinforcing bars embedded in lightweight aggregate concrete. Comput. Concr. 2015, 16, 449–466. [Google Scholar] [CrossRef]
  49. Meng, L.; Zhang, C.; Wei, J.; Li, L.; Liu, J.; Wang, S.; Ding, Y. Mechanical properties and microstructure of ultra-high strength concrete with lightweight aggregate. Case Stud. Constr. Mater. 2023, 18, e01745. [Google Scholar] [CrossRef]
  50. Bremner, T.W.; Holm, T.A. Elastic compatibility and the behavior of concrete. ACI J. 1986, 83, 244–250. [Google Scholar] [CrossRef]
  51. Lu, J.X. Recent advances in high strength lightweight concrete: From development strategies to practical applications. Constr. Build. Mater. 2023, 400, 132905. [Google Scholar] [CrossRef]
  52. Cairns, J.; Jones, K. An evaluation of the bond-splitting action of ribbed bars. ACI Mater. J. 1996, 93, 10–19. [Google Scholar]
  53. Harajli, M.H.; Hout, M.; Jalkh, W. Local bond stress-slip behaviour of reinforcing bars embedded in plain and fibre concrete. ACI Mater. J. 1995, 92, 343–353. [Google Scholar] [CrossRef]
  54. Shima, H.; Chou, L.L.; Okamura, H. Micro and macro models for bond in reinforced concrete. J. Fac. Eng. 1987, 39, 133–194. [Google Scholar]
  55. Soroushian, P.; Mirza, F.; Alhozaimy, A. Bonding of confined steel fiber reinforced concrete to deformed bars. ACI Mater. J. 1994, 91, 144–149. [Google Scholar]
  56. Metha, P.K.; Monteiro, P.J.M. Concrete: Microstructure, Properties and Materials, 3rd ed.; McGraw-Hill: New York, NY, USA, 2006. [Google Scholar]
  57. Siddique, R.; Kaur, D. Properties of concrete containing ground granulated blast furnace slag (GGBFS) at elevated temperatures. J. Adv. Res. 2012, 3, 45–51. [Google Scholar] [CrossRef]
  58. Bazant, Z.P.; Kaplan, M.F. Concrete at High Temperatures; Longman Group: London, UK, 1996; pp. 1–20. [Google Scholar]
  59. Wang, H.; Lyu, H.; Liu, T.; Li, Y.; Tan, K.H. Effect of post-fire curing on compressive strength of ultra-high performance concrete and mortar. Constr. Build. Mater. 2022, 346, 128447. [Google Scholar] [CrossRef]
  60. Kadapure, S.A.; Deshannavar, U.B. (Bio-smart material in self-healing of concrete. Mater. Today Proc. 2022, 49, 1498–1503. [Google Scholar] [CrossRef]
  61. Phillips, A.J.; Gerlach, R.; Lauchnor, E.; Mitchell, A.C.; Cunningham, A.B.; Spangler, L. Engineered applications of ureolytic biomineralization: A review. Biofouling 2013, 29, 715–733. [Google Scholar] [CrossRef]
  62. Gao, Y.; Zhu, X.; Corr, D.J.; Konsta-Gdoutos, M.S.; Shah, S.P. Characterization of the interfacial transition zone of CNF-Reinforced cementitious composites. Cem. Concr. Compos. 2019, 99, 130–139. [Google Scholar] [CrossRef]
Figure 1. Appearance of expanded shale LWAs.
Applsci 14 01416 g001
Figure 2. Configuration of the pull-out specimen: (a) transverse section; (b) longitudinal section; (c) photo of the specimen mold.
Applsci 14 01416 g002
Figure 3. Setup of the pull-out test: (a) overall configuration; (b) local configuration.
Applsci 14 01416 g003
Figure 4. Thermocouple for the pull-out test specimen: (a) schematic diagram of the location of the thermocouple; (b) actual pull-out specimens.
Applsci 14 01416 g004
Figure 5. Compressive strength and elastic modulus of LWAC.
Applsci 14 01416 g005
Figure 6. The τs curve of each group of specimens at room temperature.
Applsci 14 01416 g006
Figure 7. Bond strength of LWAC at room temperature.
Applsci 14 01416 g007
Figure 8. Relationship curve between the temperature of the concrete and time inside the pull-out specimen: (a) target temperature: 300 °C; (b) target temperature: 500 °C.
Applsci 14 01416 g008
Figure 9. The τs curves of the unhealed LWAC specimens after exposure to high temperatures: (a) target temperature: 300 °C; (b) target temperature: 500 °C.
Applsci 14 01416 g009
Figure 10. The τs curves of unhealed Group A specimens after exposure to different temperatures.
Applsci 14 01416 g010
Figure 11. The τ–s curves of unhealed experimental group specimens after exposure to different temperatures: (a) Group B; (b) Group C.
Applsci 14 01416 g011
Figure 12. Pull-out failure of healed LWAC specimens after exposure to a temperature of 300 °C: (a) a healing age of 28 days; (b) a healing age of 90 days.
Applsci 14 01416 g012
Figure 13. The τ–s curves of healed LWAC specimens after exposure to 300 °C: (a) a healing age of 28 days; (b) a healing age of 90 days.
Applsci 14 01416 g013
Figure 14. The τ–s curves of healed Group A specimens after different healing ages.
Applsci 14 01416 g014
Figure 15. The τ–s curves of the healed experimental group after different healing ages: (a) Group B; (b) Group C.
Applsci 14 01416 g015
Figure 16. Secondary relative BS ratio of the healed specimens after they were exposed to 300 °C and damaged in the first pull-out test.
Applsci 14 01416 g016
Figure 17. Images of the crack healing of the pull-out specimens.
Applsci 14 01416 g017
Figure 18. FESEM images of the surface blocks of LWAC samples: (a) at room temperature; (b) after exposure to 300 °C; (c) after exposure to 500 °C.
Applsci 14 01416 g018
Figure 19. EDS analysis of the center block of each group of samples (after being subjected to 300 °C and with a healing period of 28 days): (a) Group A; (b) Group B; (c) Group C.
Applsci 14 01416 g019
Figure 20. EDS analysis of the center block of each group of samples (after being subjected to a temperature of 500 °C and with a healing period of 28 days): (a) Group A; (b) Group B; (c) Group C.
Applsci 14 01416 g020
Figure 21. EDS analysis of the near-surface blocks of each group of samples (after being subjected to a temperature of 500 °C and with a healing period of 28 days): (a) Group A; (b) Group B; (c) Group C.
Applsci 14 01416 g021aApplsci 14 01416 g021b
Figure 22. XRD analysis of the center block of each group of samples with a healing period of 28 days: (a) after exposure to 300 °C; (b) after exposure to 500 °C.
Applsci 14 01416 g022
Table 1. Test items and test parameters.
Test ItemsNumber of SpecimensTest Parameters
Curing/Healing MethodSelf-Healing Age (Day)Target Temperature (°C)
Pull-out test (before and after exposure to high temperatures)Group A: 21Group A: incubator0, 28, 90300, 500
Group B: 21Group B: incubator
Group C: 21Group C: cyclical treatment
Secondary pull-out test (after self-healing)Group A: 18Group A: incubator28, 90300, 500
Group B: 18Group B: incubator
Group C: 18Group C: cyclical treatment
Observation of crack repair of the pull-out specimens after exposure to high temperaturesGroup A: 18Group A: incubator7, 14, 21, 28300, 500
Group B: 18Group B: incubator
Group C: 18Group C: cyclical treatment
FESEM, EDS, and XRD analysesGroup A: 18Group A: incubator0, 28300, 500
Group B: 18Group B: incubator
Group C: 18Group C: cyclical treatment
Table 2. Mix proportions of the concrete.
Water–Binder RatioWater
(kg/m3)
Cement
(kg/m3)
Lightweight Aggregate
(kg/m3)
Fine Aggregate
(kg/m3)
Steel Fiber
(kg/m3)
Polypropylene Fiber
(kg/m3)
Superplasticizer
(kg/m3)
0.4522048934573458.51.170.978
Table 3. Pull-out test items and test sequence.
Test ItemTest Sequence
Pull-out test of the LWAC after 28 days of curing at room temperatureCuring→loading
First pull-out test of the unhealed LWAC damaged in high-temperature testsCuring→heating→loading
Secondary pull-out test of the unhealed LWAC damaged in high-temperature and first pull-out testsCuring→heating→loading→self-healing→reloading
First pull-out test of the healed LWAC damaged in high-temperature testsCuring→heating→self-healing→loading
Secondary pull-out test of the healed LWAC damaged in high-temperature and first pull-out testsCuring→heating→self-healing→loading→self-healing→reloading
Table 4. Bond strength of unhealed LWAC after exposure to high temperatures.
GroupBS at RT
(MPa)
Residual BS (MPa)Relative BS Ratio
300 °C500 °C300 °C500 °C
Group A27.99 (1.56)27.35 (0.68)30.53 (1.75)0.981.09
Group B28.38 (1.34)27.07 (1.14)30.02 (1.97)0.951.06
Group C28.02 (0.40)27.41 (0.69)30.34 (1.20)0.981.08
Note: BS: bond strength; RT: room temperature. The data in brackets are standard deviations.
Table 5. Results of the secondary pull-out test of the unhealed LWAC after exposure to high temperatures.
GroupBS at RT
(MPa)
Residual BS (MPa)Relative BS Ratio
300 °C500 °C300 °C500 °C
Group A27.99 (1.56)18.89 (0.89)18.17 (1.20)0.680.65
Group B28.38 (1.34)20.48 (1.57)18.35 (1.24)0.720.65
Group C28.02 (0.40)20.70 (1.46)19.00 (0.58)0.740.68
Note: BS: bond strength; RT: room temperature.
Table 6. Residual BS and relative BS ratios of the healed LWAC after exposure to a temperature of 300 °C.
GroupUnhealed
BS (MPa)
Residual BS (MPa)Relative BS Ratio
28 Days of Self-Healing90 Days of Self-Healing28 Days of Self-Healing90 Days of Self-Healing
Group A27.35 (0.68)28.82 (0.55)29.99 (1.19)1.051.10
Group B27.07 (1.14)28.36 (2.23)30.37 (0.63)1.051.12
Group C27.41 (0.69)28.64 (0.32)31.08 (0.72)1.051.13
Note: BS: bond strength.
Disclaimer/Publisher’s Note: The statements, opinions and data contained in all publications are solely those of the individual author(s) and contributor(s) and not of MDPI and/or the editor(s). MDPI and/or the editor(s) disclaim responsibility for any injury to people or property resulting from any ideas, methods, instructions or products referred to in the content.

