Abstract
In the context of global climate change, the implementation of building energy conservation and carbon reduction, as well as the realization of zero-energy buildings, is a key measure to cope with climate change and resource depletion. A substation is an indispensable building in the process of urbanization construction. However, in existing cold areas, the heating form of substations generally adopts electric heating, which consumes a large amount of energy. This paper optimizes the existing HVAC form of substations through the rational utilization of surrounding environmental resources and puts forward reasonable building energy-saving and carbon-reduction methods. It demonstrates the feasibility of combining solar photovoltaic power generation systems, air source heat pumps, and natural ventilation to optimize energy savings and carbon reduction in the main control building of a substation in a cold area. The computational fluid dynamics (CFD) method is used to demonstrate the feasibility of natural ventilation during the summer and transition seasons. The data indicate that the installation of a solar photovoltaic power generation system results in an average annual power generation of 18.75 MWh. Additionally, using an air source heat pump can save 44.5% of electricity compared to electric heating. When both a solar photovoltaic power generation system and an air source heat pump are used to provide a building with cold and heat sources, the annual emissions of CO2 can be reduced by 4.90 tons compared to a traditional electric heating system.
1. Introduction
In the present social context, with people’s increasing demand for a better quality of life, energy consumption is on the rise. Building energy consumption constitutes a significant portion of the total social energy consumption. Among the various components of building energy consumption, energy consumed by daily operations such as air conditioning, heating, lighting, and hot water accounts for more than 80%. Based on statistics from the International Energy Agency, terminal energy consumption in buildings accounts for 36% of social carbon emissions, with carbon emissions reaching 39%. Furthermore, during a building’s operational phase, carbon emissions account for 70% to 80% of its entire life cycle [1]. Although building energy efficiency has received increasing attention, many countries have introduced the concepts of low-energy buildings, ultra-low-energy buildings, near-zero-energy buildings, and zero-energy buildings [2,3]. It is crucial to control carbon emissions during the building operation stage to achieve the goal of carbon peaking and carbon neutrality. Achieving zero-energy and zero-carbon buildings is a general trend [4]. Although building energy consumption is increasing, it is important for building design to propose a reasonable carbon emission mechanism and reduce building energy consumption. A building energy conservation development model should be established as soon as possible, specifically targeting the existing domestic environment.
Zeyghami et al. [5] investigated the realization of zero-energy buildings by studying buildings in a specific area of Egypt. The authors aimed to utilize natural cold heat to provide the necessary temperature control for the buildings under examination. They concluded that in certain areas with favorable natural conditions, the use of solar photovoltaic systems can significantly reduce the costs of transforming buildings into near-zero-energy consumption buildings by collecting and storing renewable energy through solar panels on the roof. Lee et al. [6] conducted a field study on a building photovoltaic system. The study shows that the building’s annual energy consumption was 104,602.4 kWh, and the power generation of the building’s photovoltaic system was 105,266.6 kWh. This proves that the building meets the requirements of zero-energy buildings. Cao et al. [7] analyzed the relationship between the body type coefficient and the energy consumption of building cooling and heating. The data indicate a positive linear correlation between the building size coefficient and total energy consumption. In other words, as the building size coefficient increases, so does the total energy consumption. However, this correlation is not as pronounced in mild and sunny areas during the heating period. Li et al. [8] investigated the use of photovoltaic glass in cold regions of China. They evaluated the energy-saving performance of photovoltaic glass by altering its orientation, visible light transmission ratio, and comprehensive heat transfer coefficient. When the photovoltaic system is arranged facing south, the energy-saving effect is as high as 60%. However, if the system is facing east, the energy-saving is reduced to about 13%. It is important to note that the orientation of the photovoltaic glass has a significant impact on the energy-saving effect.
Lebied et al. [9] analyzed the impact of the perimeter structure and system equipment operation on the energy consumption of an office building in Denmark. They sorted the degree of impact of different variables through sensitivity analysis. Balali et al. [10] conducted a study on a single-sided lighting office. They used computer software to evaluate various influencing factors, such as building size and the ratio of windows to walls. By analyzing the impact of different design variables on the total energy consumption of the building, they obtained the most energy-efficient combination design scheme of influencing factors. Sivaram et al. [11] conducted a study on office buildings in Tokyo, Japan. They investigated the impact of four design variables of the outer envelope structure on the cold and heat load of buildings. These variables were the solar heat gain coefficient of the outer window, the heat transfer coefficient of the outer window, the heat transfer coefficient of the opaque envelope, and the solar reflectivity of the opaque envelope. Tariq [12] provides the comprehensive mechanism of using the digital twin and the impact assessment of interventions at the local as well as global scales. The measures of passive energy storage based on phase-change energy storage materials are studied, and the energy efficiency can be increased by 40% by adding relevant interventions.
Natural ventilation refers to the use of natural airflow to achieve indoor air circulation and renewal in a ventilation mode. The principle of natural ventilation mainly includes three aspects: the buoyancy principle, the wind pressure difference principle, and the wind force principle. Natural ventilation is a fundamental and sustainable solution to reduce the energy needs of buildings for ventilation and cooling [13]. Research in this field has demonstrated that natural ventilation has the potential to save energy. Tong et al. [14] conducted a study on the energy-saving potential of natural ventilation in various Chinese cities. The results indicated that natural ventilation could save between 8% and 78% of cooling energy. Similarly, in warm weather, the use of natural ventilation can avoid the need for 54.4% of the power required for cooling [15]. Stasi et al. [16] investigated the impact of mixed ventilation on zero-energy residential buildings. The results indicate that the combination of night ventilation and mechanical ventilation can reduce the demand for cooling capacity by 14.4%, while natural cooling can reduce power consumption by 7.7%. Domjan et al. [17] analyzed the importance of natural cooling and mixed ventilation systems for near-zero-energy buildings. Studies on all-glass buildings have shown that energy consumption can be reduced by up to 26% through night ventilation and mixed ventilation cooling.
In summary, numerous scholars have conducted extensive research on the influence of various parameters, including window-to-wall ratio, building size coefficient, and thermal resistance of outer protective structures, on building energy conservation. It is worth noting that China’s construction industry accounts for over 20% of the country’s total energy consumption, with winter heating alone accounting for 20% of the total building energy consumption [13]. The energy-saving potential of HVAC systems in substation sites located in cold areas requires further investigation. Substations are typically situated in remote areas, far from residential areas. As a result, there is no urban heating network available, and traditional urban central heating is not feasible. Additionally, heating pipes cannot pass through the transformer room, distribution unit room, and other electrical equipment rooms in most substations. Therefore, given the extreme outdoor conditions of −30 °C in winter in high-cold areas, improving heating efficiency and reducing heating energy loss in substations are crucial to enhancing the energy consumption structure and efficiency of substation buildings. This is necessary to ensure the normal operation of zero-carbon building design concepts and typical room equipment in substations under low-temperature conditions. Based on theoretical calculations and software simulations, this paper provides recommendations for selecting ventilation and heating equipment for typical rooms in high-cold area substations.
2. Architectural Models and Research Methods
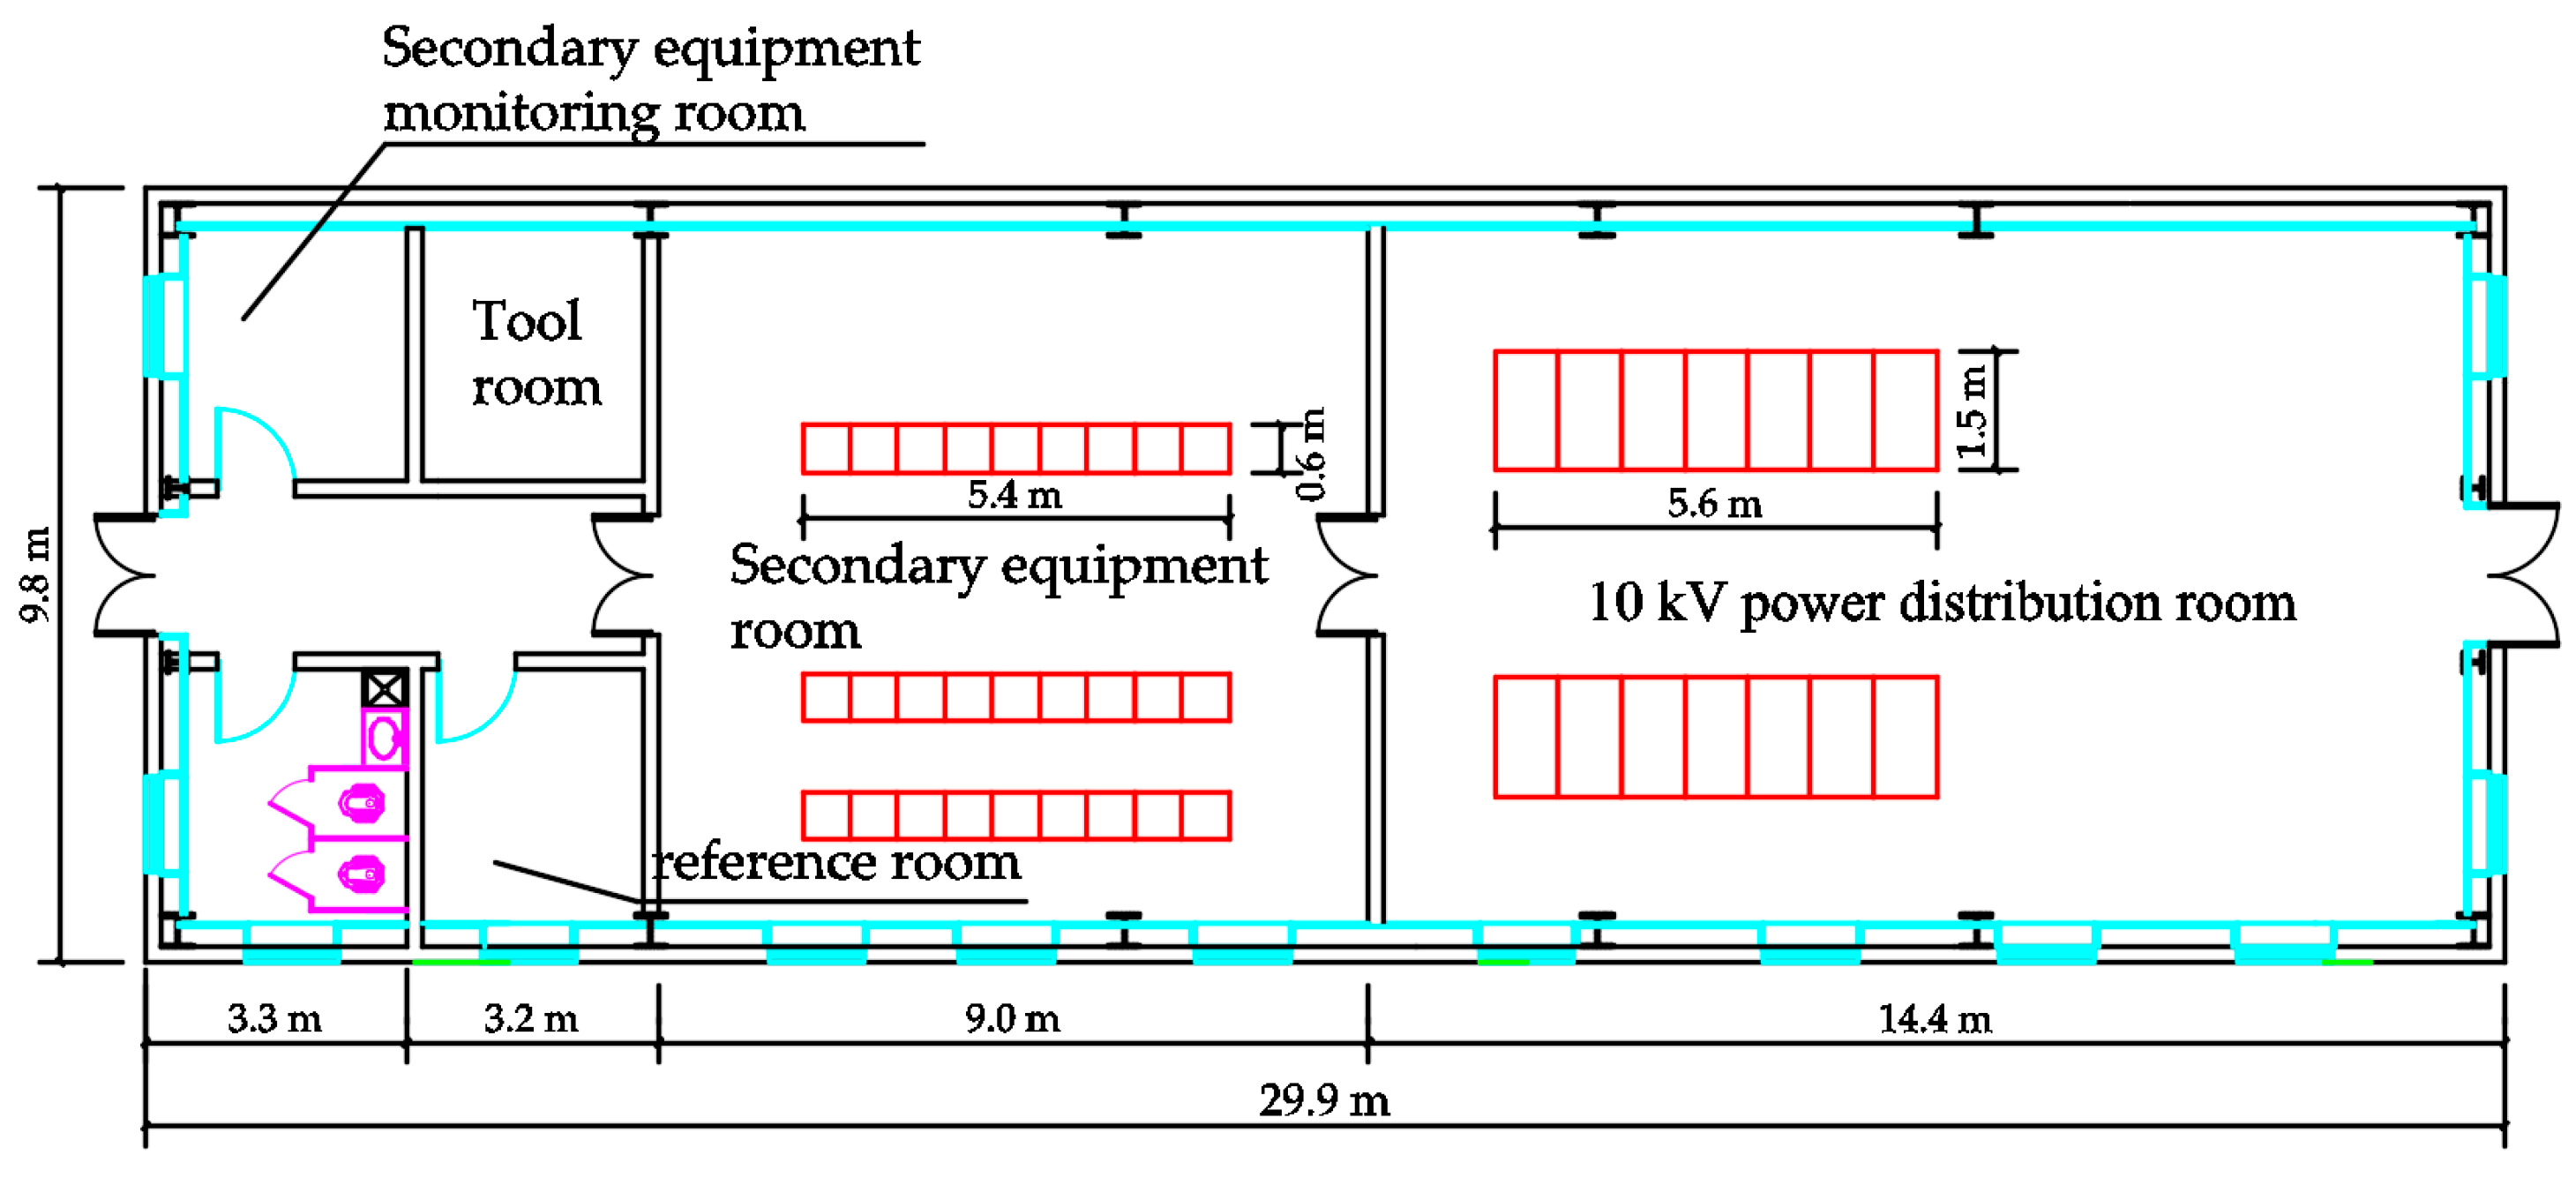
The research subject is the main control building of a substation located in Yichun City, Heilongjiang Province, China. It consists of a 10 kV equipment distribution room, a secondary equipment room, a secondary equipment operation monitoring room, and other rooms. The main transformer is located outside. The building has a construction area of 293.02 m2 and a total height of 5.00 m. Please refer to Figure 1 for the building plan. The red portion in Figure 1 represents the distribution of electrical equipment within the main control building of the substation. Currently, the building is equipped with a mechanical exhaust system for summer ventilation. The main HVAC systems comprise split air conditioning units for cooling in the summer and electric heating for warming in the winter.
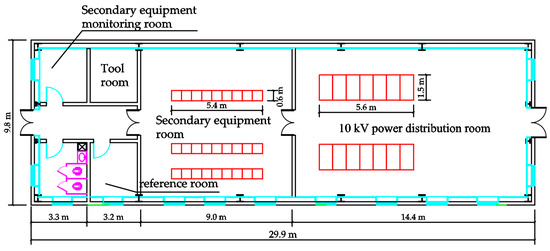
Figure 1.
Substation main control building plan.
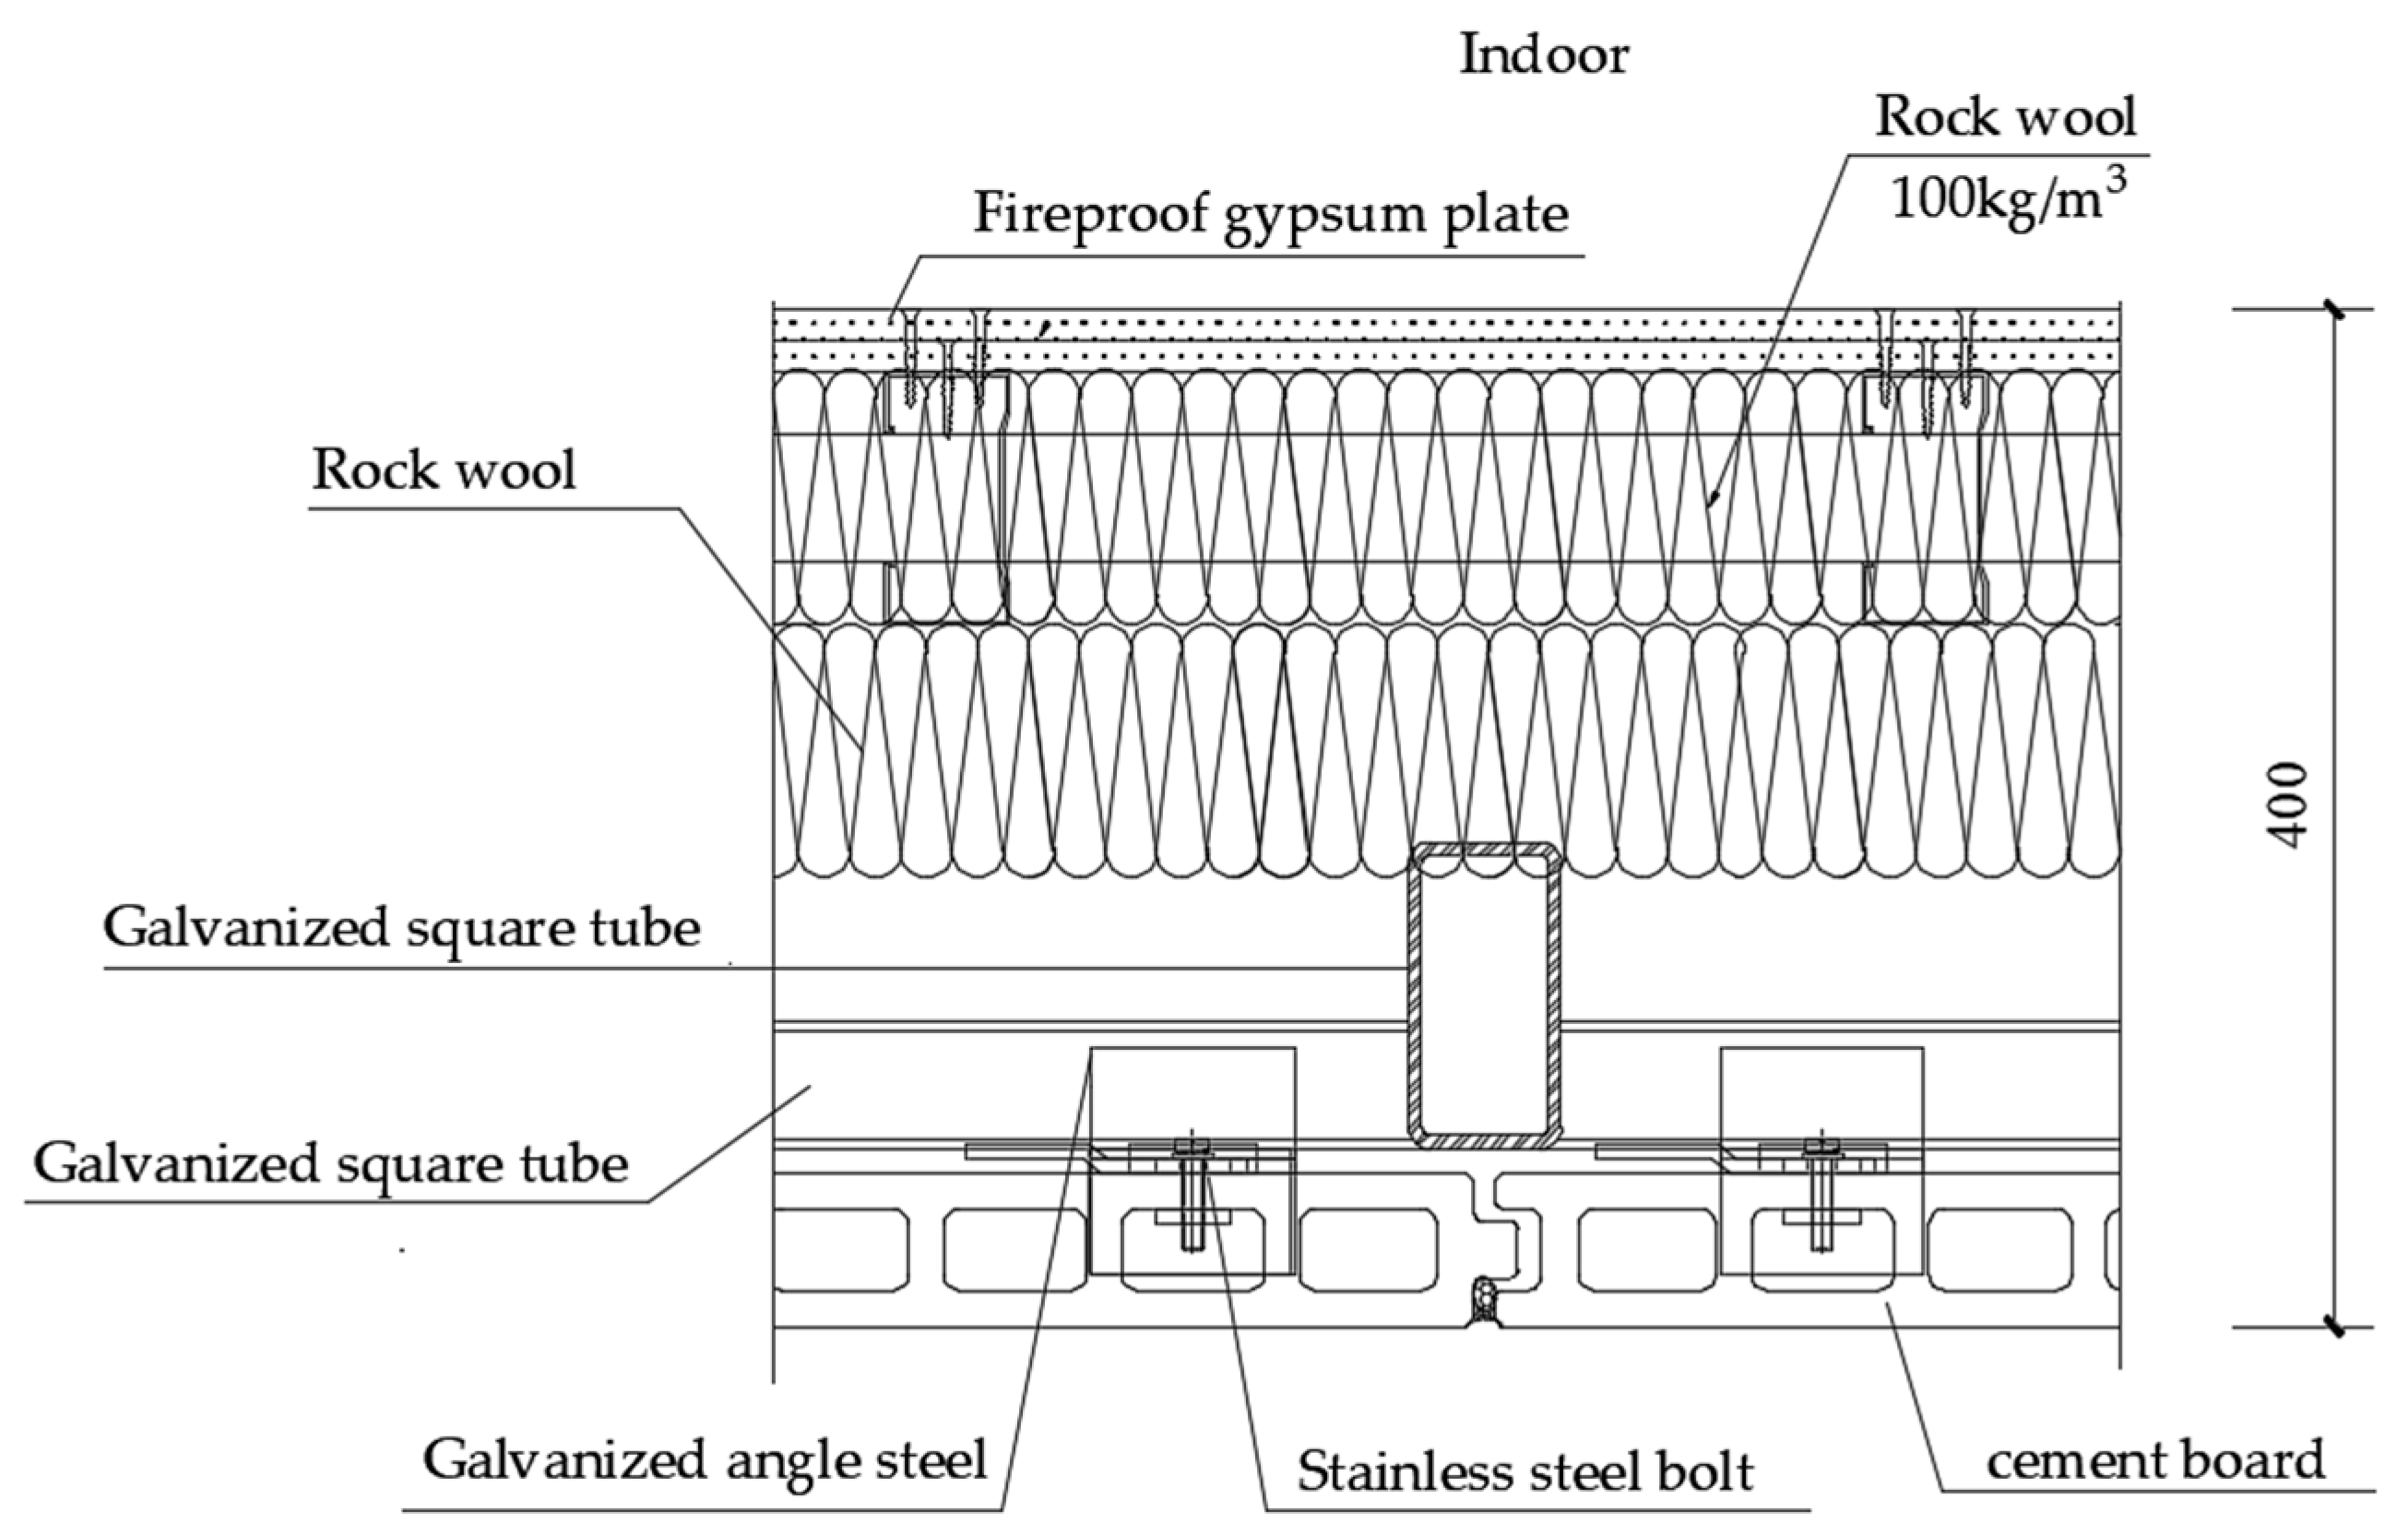
The diagram in Figure 2 illustrates the actual exterior wall structure of the building. Based on the physical properties and thickness of the wall materials, the exterior wall heat transfer coefficient was calculated to be 0.22 W/(m2·K) using the GBSWARE2024 software. The thermal performance of the reference building in Table 1 was determined based on parameters such as wall and window materials. The reference building’s thermal performance was obtained according to the regulations for thermal transfer coefficients for doors and windows outlined in the “Unified Standard for Energy-saving Design of Industrial Buildings” GB51245-2017 [18]. The building’s thermal performance complies with energy-saving standards.

Figure 2.
Actual building exterior wall construction.

Table 1.
Comparison of heat transfer coefficients.
The heat load is calculated based on the principle of steady-state heat transfer, considering both heat loss and gain in the room. The focus of the heat load calculation is on heat loss. To achieve heat balance, the calculation includes heat lost through the enclosure structure, heat lost through the heating of cold air, and heat produced by equipment operation.
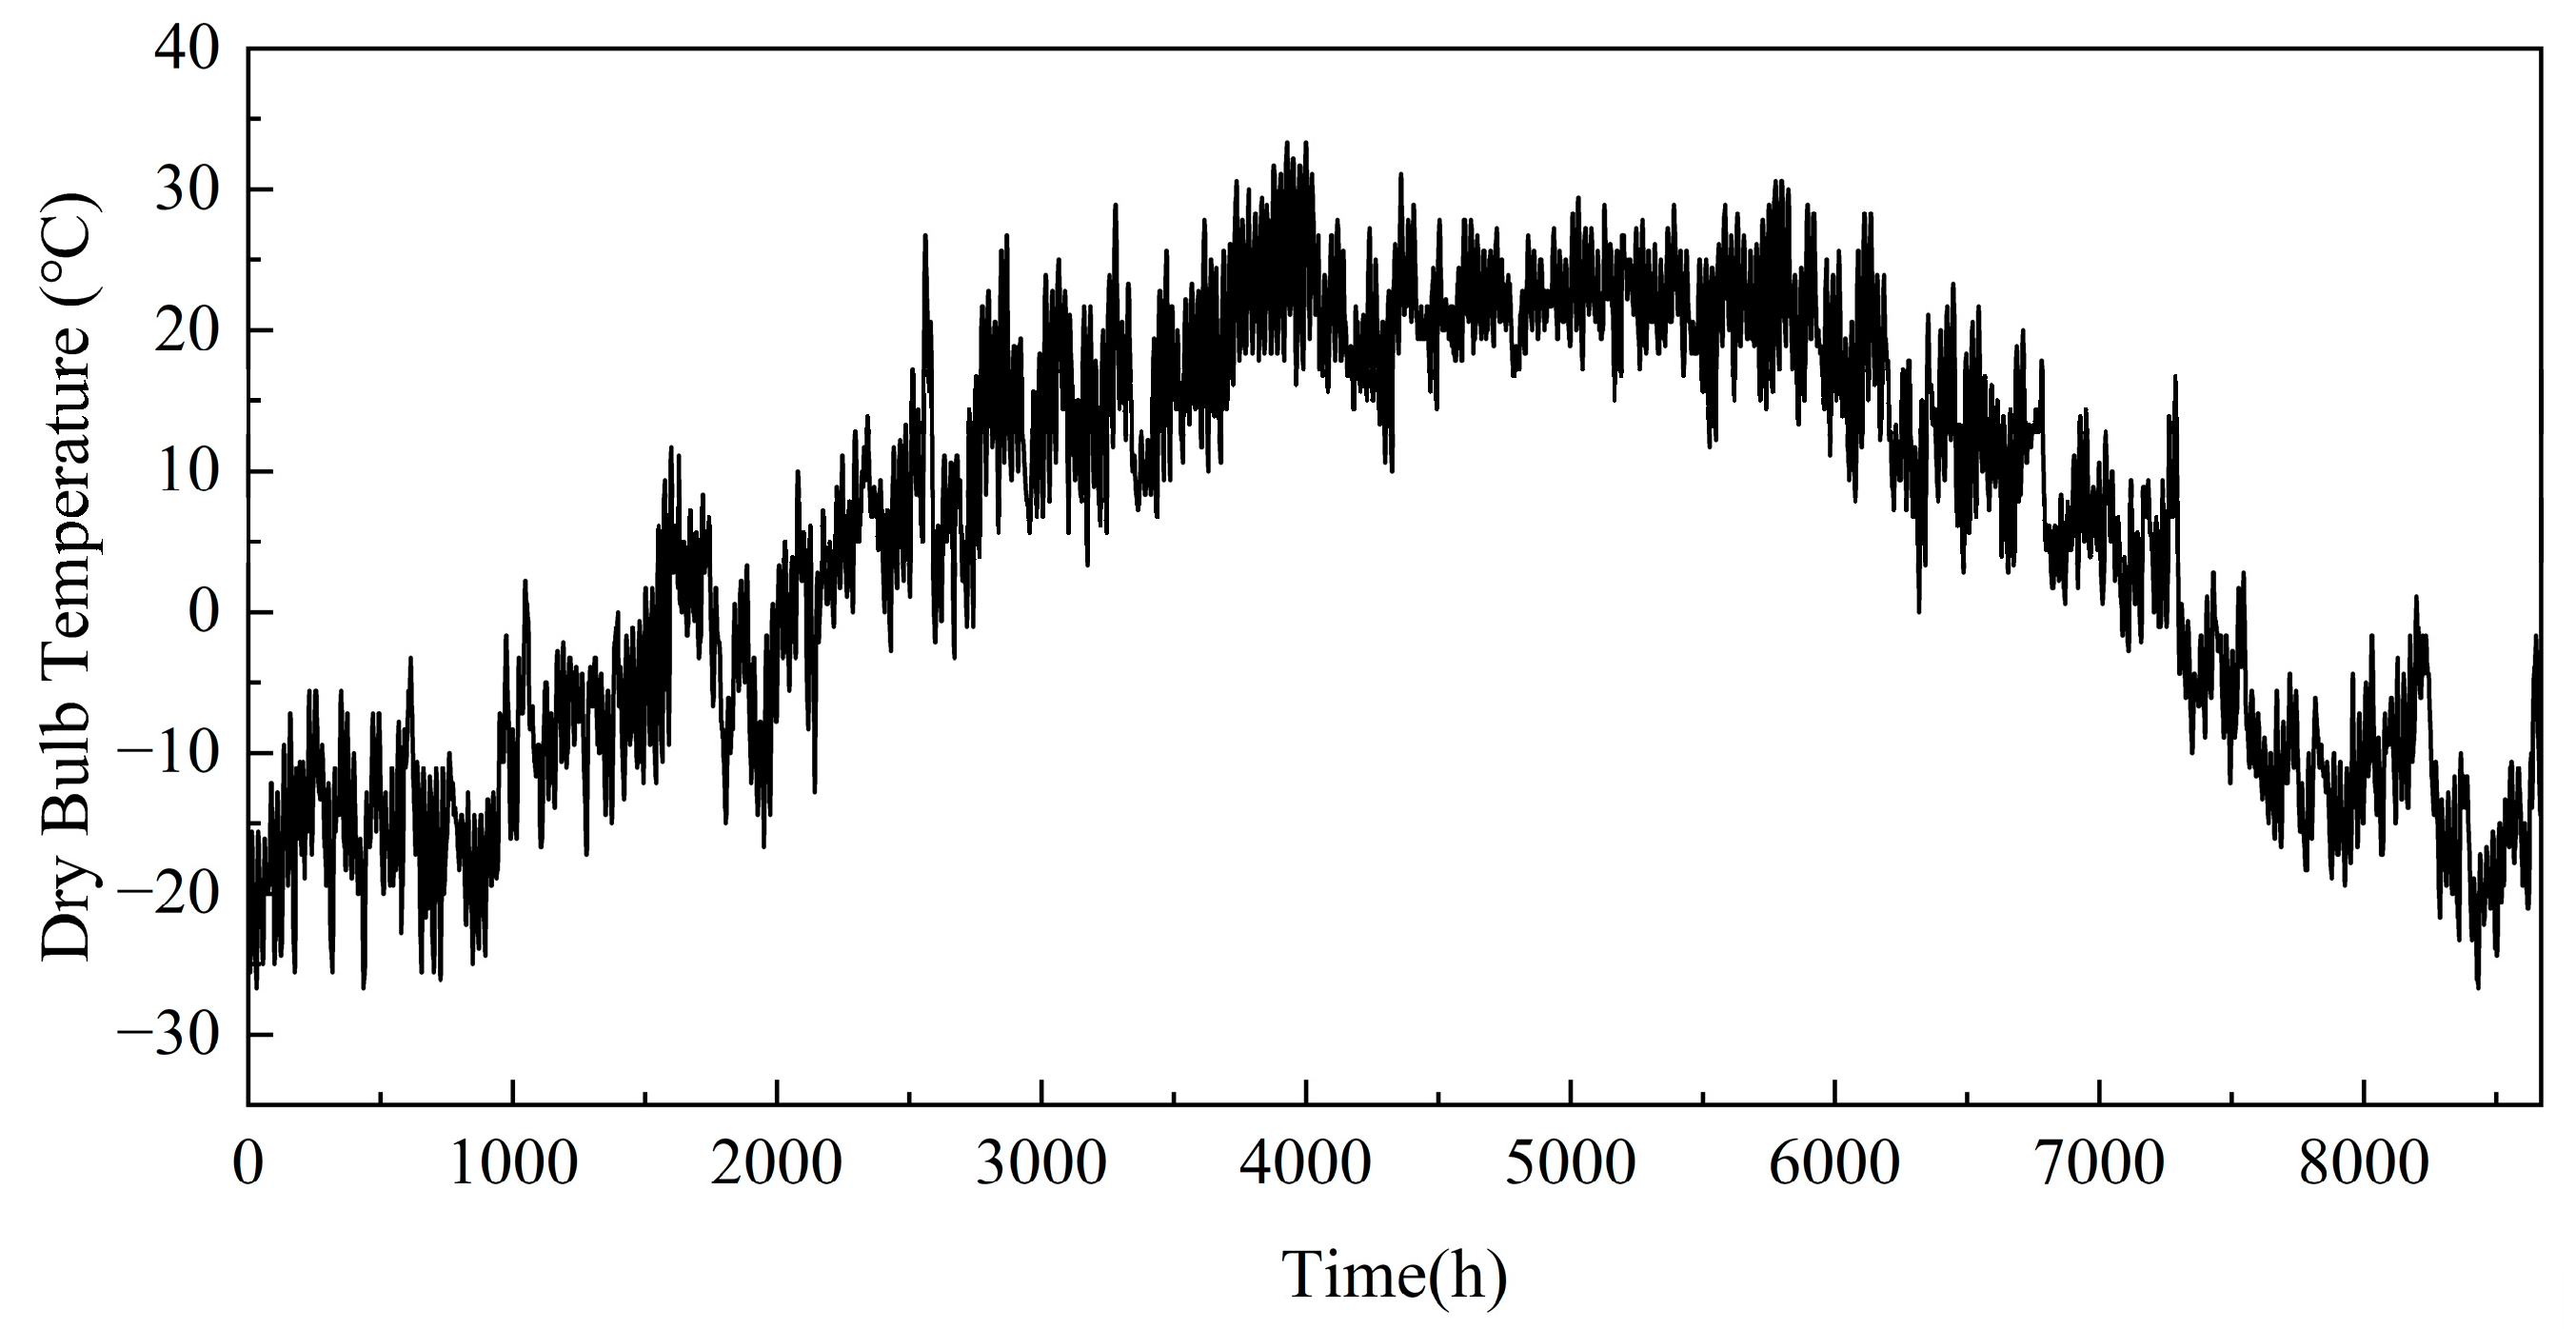
According to Section 4.5.5 of the “35 kV~110 kV Substation Design Code” GB50059-2012 [19]: “Distribution unit room, reactor room, and other electrical equipment rooms should have a mechanical ventilation system set up, and the indoor temperature should be maintained at no more than 40 °C in summer.” According to Section 8.3.2 of the “Technical Regulations for the Design of 220 kV~750 kV Substation” DL/T5218-2012 [20]: “The main control room, computer room, relay room, communication room, and other rooms required by process equipment of the substation should be equipped with air conditioning.” The indoor temperature and humidity of the air-conditioned room should meet the process requirements, and the process has no special requirements. The design temperature in summer is 26 °C to 28 °C, the design temperature in winter is 18 °C to 20 °C, and the relative humidity should not exceed 70%. Generally, there is no backup for air conditioners. The working time of the substation is set by BESI, the energy consumption calculation software of GBWARE2024, and the indoor temperature is set at 20 °C in the heating season and 28 °C in the cooling season. The hourly temperature throughout the year is obtained by invoking meteorological parameters, with the highest temperature being 33.3 °C and the lowest temperature being −26.7 °C, as shown in Figure 3.
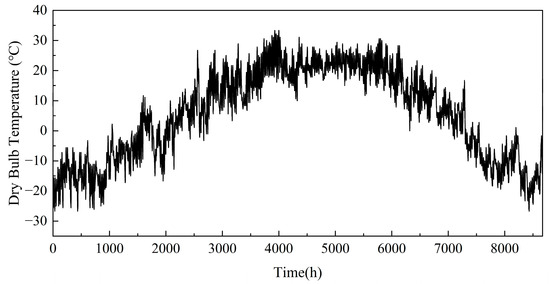
Figure 3.
Hourly dry bulb temperature and load chart throughout the year.
Meteorological parameters of outdoor design are given in Table 2.
Table 2.
Outdoor design meteorological parameters.
Formula (1) shows the heat consumption Qj (W)of the enclosure structure.
where F(m2) represents the area of the enclosure structure, K is the heat transfer coefficient of the enclosure structure (W/m2∙K), tn is the design temperature of the heating room (K), tw is the calculated temperature of the heating outside (K), and a is the temperature difference correction coefficient of the maintenance structure.
There are gaps and openings in the building envelope, including doors and windows. These gaps and openings allow outdoor air to penetrate into the room due to the pressure difference between indoor and outdoor environments caused by factors such as wind pressure and temperature differences. It is important to seal these gaps and openings to prevent energy loss and maintain indoor comfort. This results in the infiltration of cold or hot air, depending on the outdoor temperature. When calculating the heat load, the usually considered factor is the permeable air load. The calculation of the air infiltration load Qx (W) is as follows:
where ρW represents the air density (kg/m3) outside the heating room at the calculated temperature, cp is the specific heat coefficient of air (J/(kg K)), and L is the amount of permeated cold air (m3/h).
The ventilation and air conditioning system are designed to dissipate the heat generated by the electrical equipment, ensuring efficient operation and preventing equipment failure due to excessive temperature. The calculation of the equipment’s heat load includes the heat loss of the transformer, high-voltage switchgear, and low-voltage switchgear, as well as the power loss of the cable, heat gain of the enclosure structure, and heat dissipation of the room lighting. Formula (3) is used to calculate the equipment heat load Qe (W).
where n1 is the coefficient of simultaneous use, n2 is the installation coefficient, n3 is the load coefficient, N is the installation power of the electric heating equipment, and Ccl is the cooling load coefficient of the heat dissipation of electric equipment and appliances.
Based on the formula and relevant software modeling analysis described above, specific parameters are depicted in Figure 4. The conclusive calculation results reveal that the peak heat load of the substation’s main control building is 9.842 kW, with a peak cooling load of 5.052 kW. Additionally, the annual heating heat consumption is 19,425.519 kWh, while the cooling consumption is 2524.104 kWh.
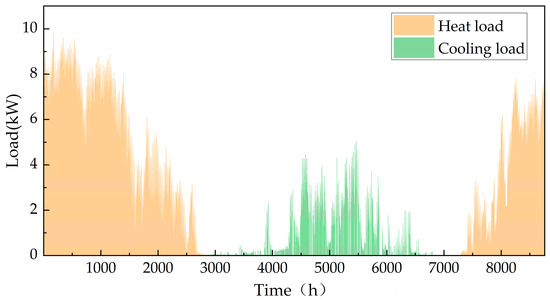
Figure 4.
Hourly load of substation main control building throughout the year.
This paper uses CFD to calculate the distribution of indoor flow velocity and airflow direction, presenting a comprehensive view of indoor wind speed and airflow organization. The turbulence model reflects the fluid flow state. When conducting numerical simulations of fluid mechanics, it is important to select an appropriate turbulence model for different fluid flows to simulate the real flow field value as accurately as possible. In this paper, the indoor flow field is calculated using the standard k-ε turbulence model.
The CFD method is used to solve the wind field by establishing the conservation of mass, momentum, and energy of the fluid flow in the computational domain. This is carried out by establishing a mathematical governing equation, which has the following general form:
ϕ in this formula can be physical quantities such as velocity (m/s), turbulent kinetic energy (m2/s2), turbulent dissipation rate (m2/s3), and temperature (T), as shown in Table 3.
Table 3.
Governing equations of computational fluid mechanics.
μ is the dynamic viscosity of air (Pa∙s), μt is the component of the fluid along the t direction, ρ is the density of air (kg/m³), α is the thermal diffusivity (m2/s), Gk is the turbulent momentum caused by the average velocity gradient,, , , and σ is the turbulence parameter.
The equations are discretized using the second-order upwind scheme, which meets the accuracy requirements for general fluid simulation calculations.
The inlet boundary conditions for the calculation model mainly consist of wind speed and direction data under different working conditions. The inlet wind speed is calculated using Formula (5), while the free flow is used as the exit boundary condition. The wind field’s two side boundaries and top boundary are set as sliding wall surfaces. This ensures that the air flow is not affected by wall surface friction, allowing for a simulation of real outdoor wind flow. The ground boundary of the wind field is set as a non-slip wall, which affects the air flow due to ground friction.
where v is the average wind speed of any point, Z represents the height of the point, and subscript R represents the parameter under the standard height. Additionally, α1 represents the ground roughness coefficient.
The multi-area network method is used to simulate and calculate the natural ventilation volume of multi-room for natural ventilation, in order to obtain the ventilation times. The software extracts the wind pressure of single building doors and windows through outdoor ventilation calculation and then calculates the air exchange times of the whole building through the multi-area network method.
The heating and air conditioning systems used in the above-mentioned system are electric heating and split air conditioning, respectively. However, according to Article 9.1.2 of the “Design Code for Heating, Ventilation and Air Conditioning of Industrial Buildings” [21] GB50019-2015, industrial plants and auxiliary buildings should not use electric direct heating equipment as a heat source for heating and air conditioning, unless they meet one of the following conditions and cannot use heat pumps. Isolated buildings without access to central heating and lacking any other heat source can be challenging to heat. In such cases, the use of fuel oil and coal-fired equipment is strictly restricted due to environmental and fire safety concerns. In areas with sufficient electricity supply and peak and valley electricity prices, heat can be stored during the low power period at night and used during peak hours or periods of non-use. Additionally, important electrical premises that cannot be heated by hot water or steam may require alternative heating solutions. Renewable energy can be used to generate electricity, which can then be used for electric heating. Therefore, the original heating system does not meet current standards and requires improvement. Considering local meteorological conditions, solar energy can be converted into electricity through solar photovoltaic power generation to supply power to equipment on site, reducing energy loss.
The main control building system of the substation has the following issues:
- (1)
- The consideration of renewable energy or heat pump forms to meet the heating load requirements was not considered.
- (2)
- The building’s ventilation system design is imperfect.
- (3)
- There is potential for more energy-efficient heating methods that need to be further optimized.
3. Analyzing Systems Improvement Programs
The ideal energy-saving building should aim to minimize energy consumption while also ensuring the maintenance of thermal and humidity conditions indoors throughout different seasons, ensuring necessary ventilation and air exchange indoors, and rational utilization of solar radiation in various seasons and regions. Energy-saving methods in building primarily involve several aspects: minimizing reliance on non-renewable energy sources, enhancing energy utilization efficiency, reducing energy loss in building maintenance structures, and maximizing the use of renewable energy sources. Achieving these goals is closely related to cutting-edge technology in today’s society. By combining existing scientific technology with traditional building structures, a new passive low-carbon building structural system has been proposed for optimizing and renovating existing substation building systems, focusing on the rational use of renewable energy and reducing equipment operating energy consumption.
3.1. Efficient Use of Solar Energy Resources
China possesses a vast territory and abundant solar energy resources. The solar energy resources on Earth are generally expressed in terms of the total annual irradiation (J/(m2·a)) and the annual sunshine duration (h). The solar radiation energy received by the land surface of China is about 5.0 × 10¹⁹ kJ. More than two-thirds of the country experiences annual sunshine hours exceeding 2200 h, and the total radiation amount is higher than 5.86 × 10⁶ kJ/(m2·a) [22]. Figure 5 illustrates the monthly distribution of total solar radiation in the Yichun area.
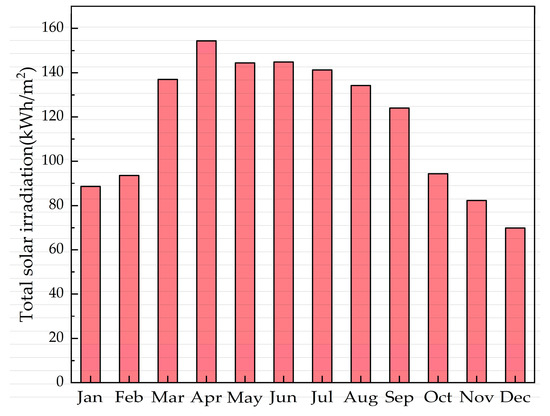
Figure 5.
Monthly distribution of total solar radiation in the Yichun area.
According to the Assessment Method for Solar Energy Resource classification method GB/T37526-2019 [23], global horizontal irradiance (GHR) is divided into four levels: most abundant (A), very abundant (B), abundant (C), and general (D), as shown in Table 4.
Table 4.
Classification and regional distribution of total solar radiation in China.
The total annual horizontal irradiance of the area where the substation is located is 4118.1 MJ/m2, which belongs to class C, indicating an area rich in solar energy resources. It can be considered to use solar power generation to provide electricity for the HVAC system on the site to achieve a zero-energy consumption building.
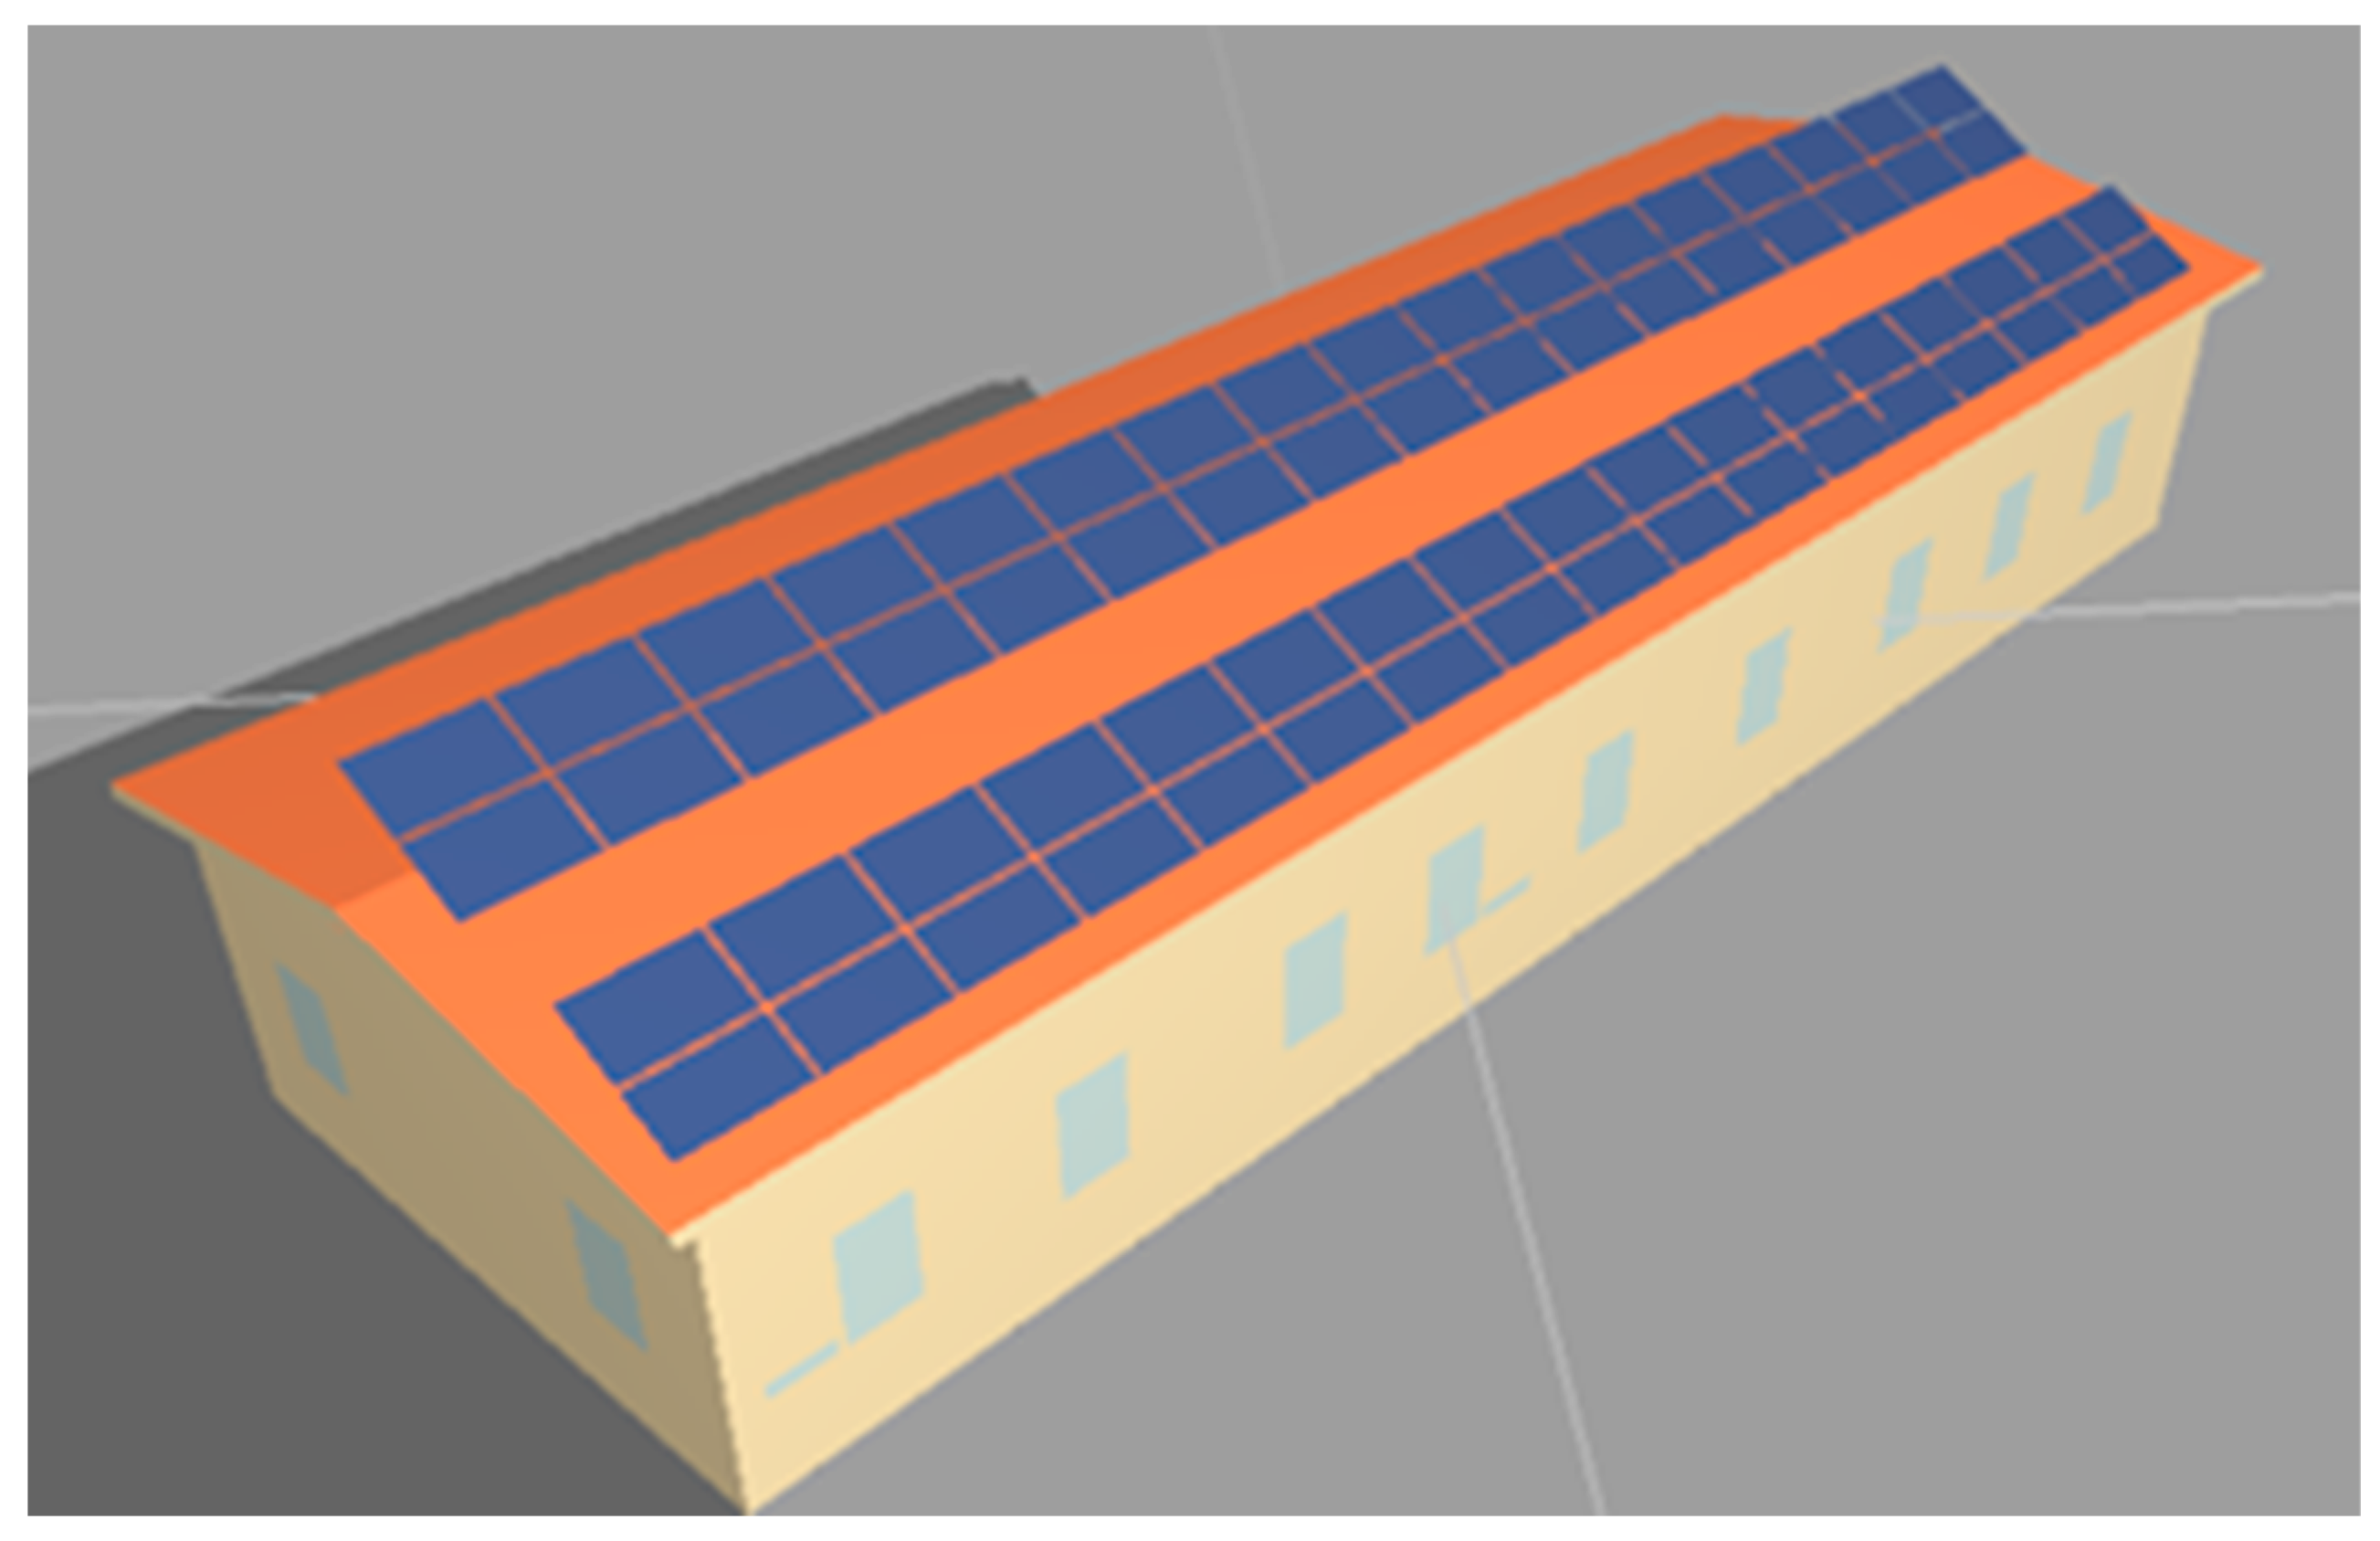
To simulate the building’s solar irradiance and other parameters, the Building Photovoltaic Software (BPV2024) in GBWARE2024 is used. By setting the project location and constructing the building model, the solar resource data can be reasonably analyzed, and the best tilt angle and installation position can be calculated, along with the power generation of the photovoltaic panels. As shown in Figure 6, the substation unit is modeled.
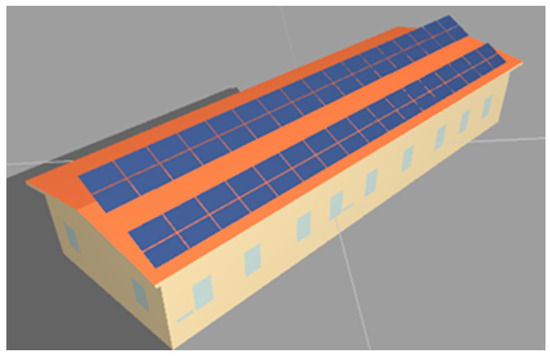
Figure 6.
Photovoltaic power generation simulation modeling diagram.
The calculation of a building’s photovoltaic system’s power generation should consider the solar energy resources of the location, the design of the photovoltaic system, the arrangement of the photovoltaic array, and environmental conditions. To obtain the power generation value of a photovoltaic system, one should refer to the “Design Code for Photovoltaic Power Station” GB 50797 [24] and other relevant standards. The formula for calculating power generation (EP) is as follows:
where HA is the total solar irradiance of the horizontal plane (kWh/m2), ES is the irradiance (constant) under standard conditions (1 kW/m2), P is the installed capacity (kWp), and Kt is the comprehensive efficiency coefficient. The latter is affected by various parameters, including inverter efficiency, collector line loss coefficient, photovoltaic module surface pollution coefficient, and correction coefficient. The specific parameters are given in Table 5.
Table 5.
Calculation parameters for photovoltaic system.
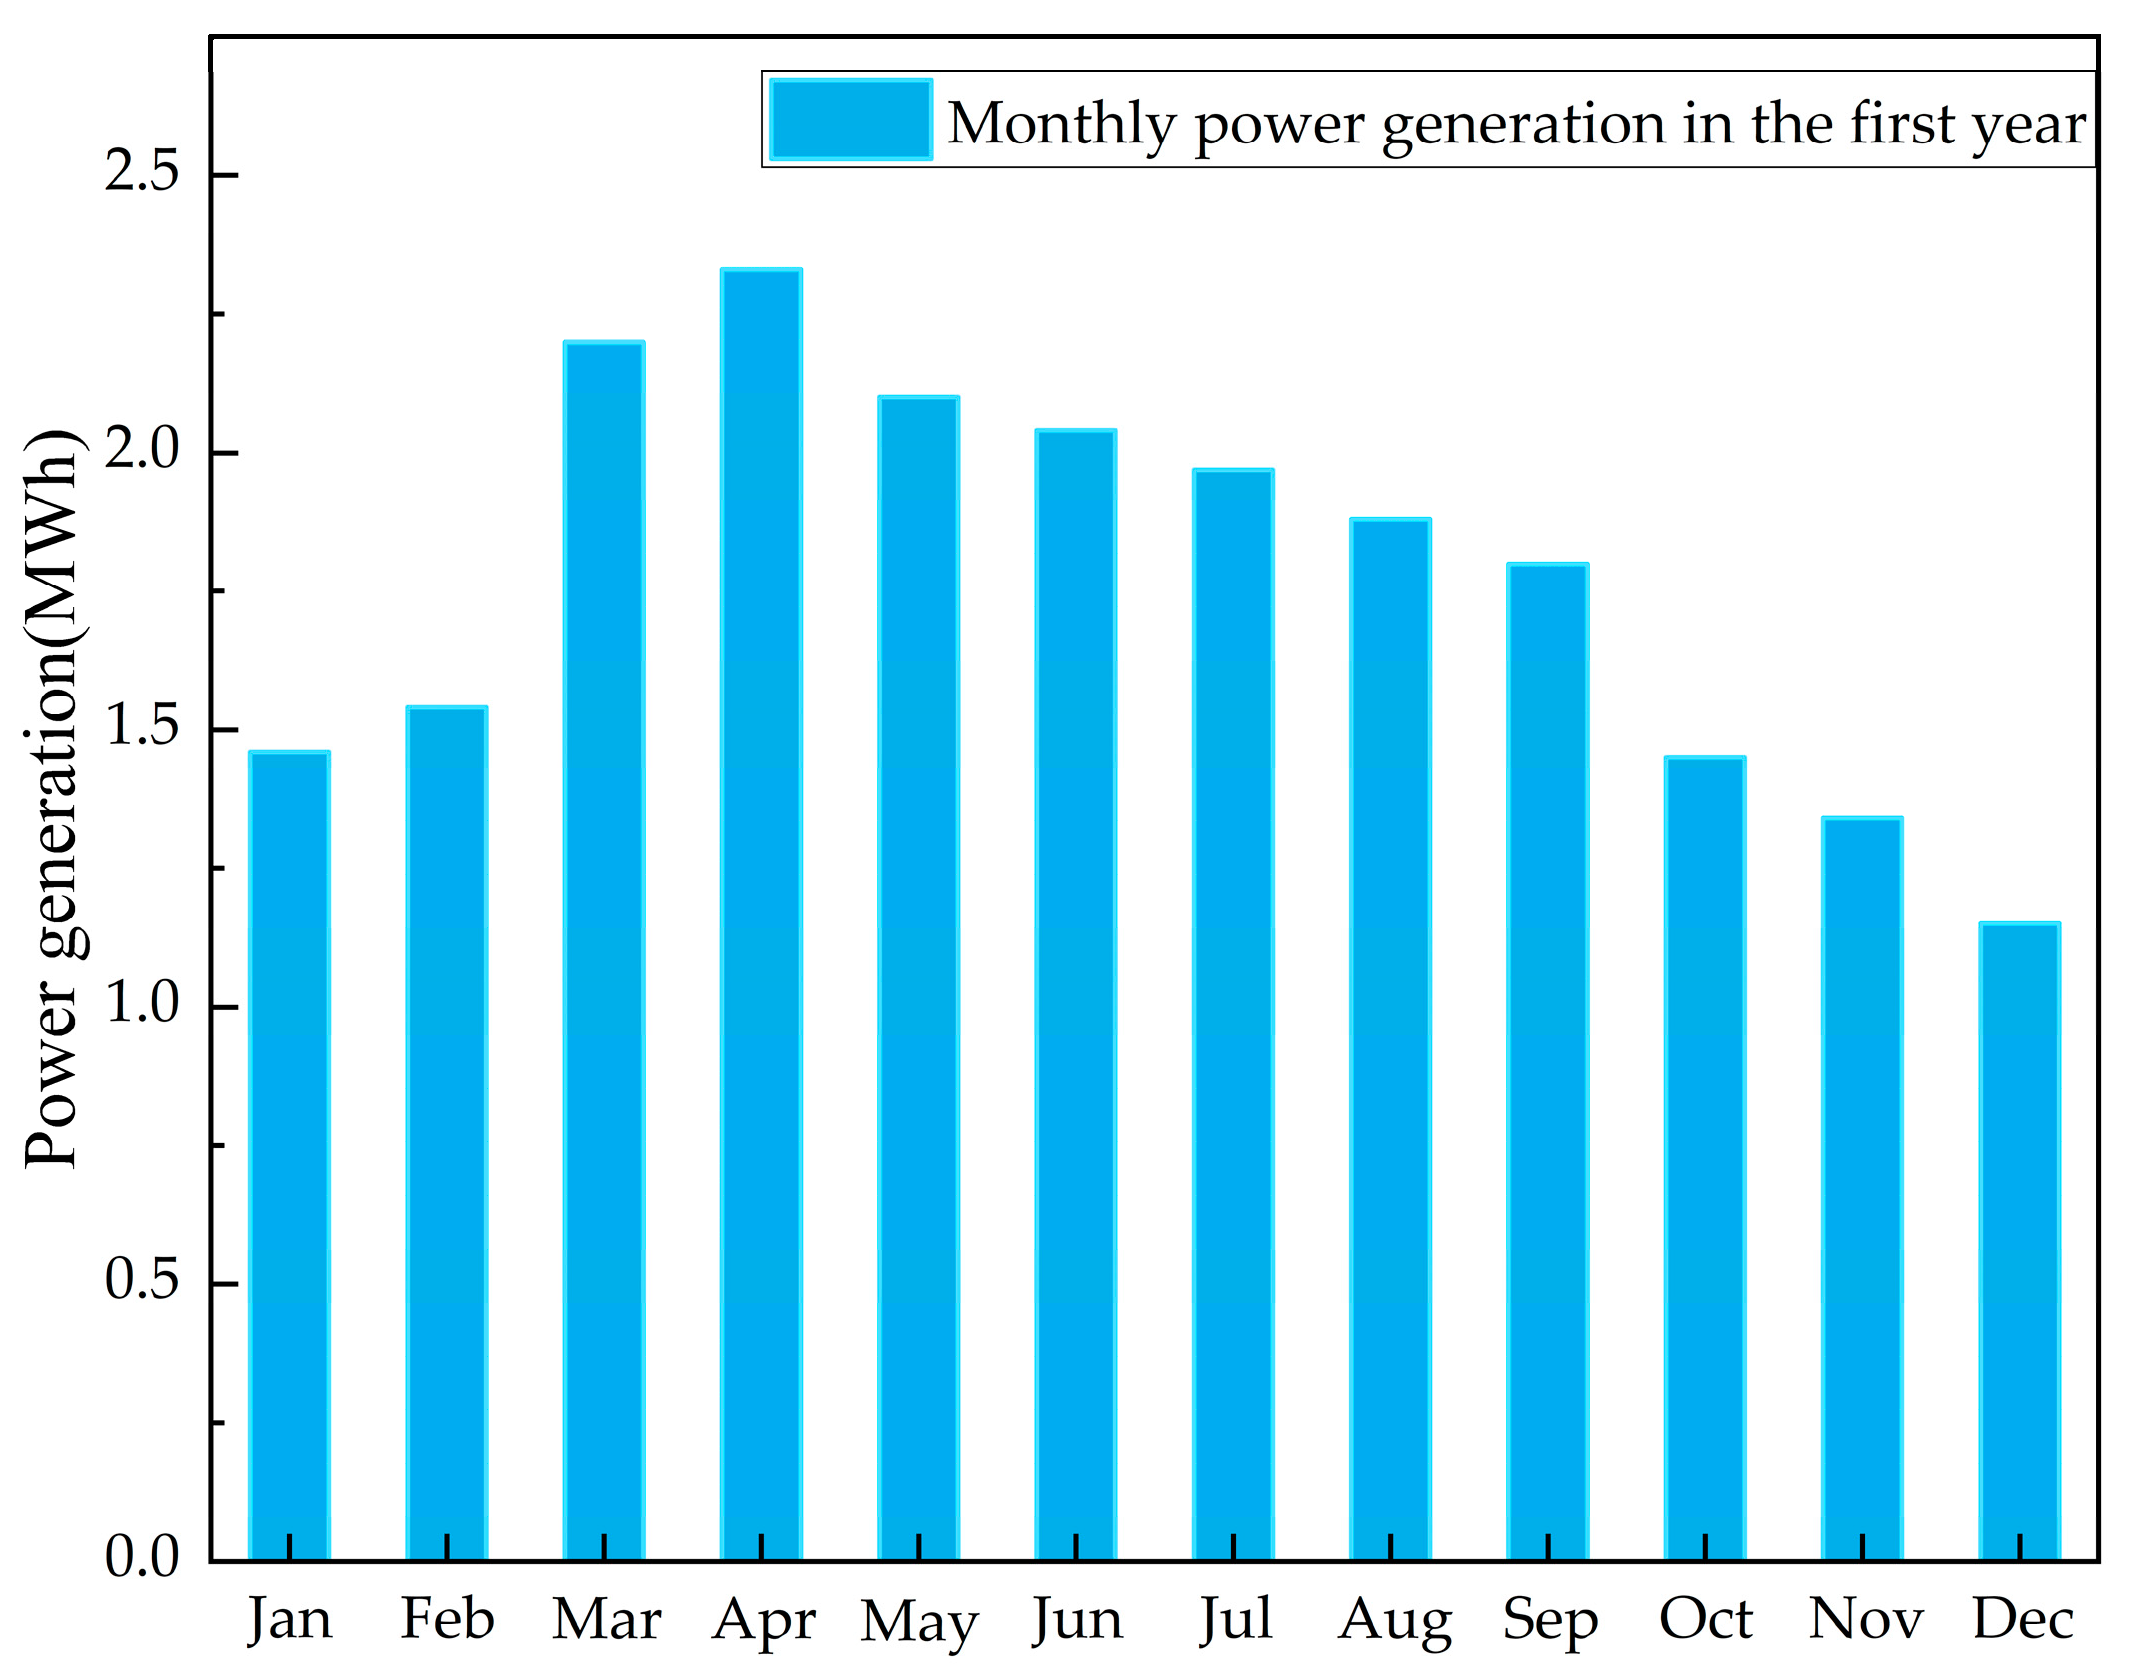
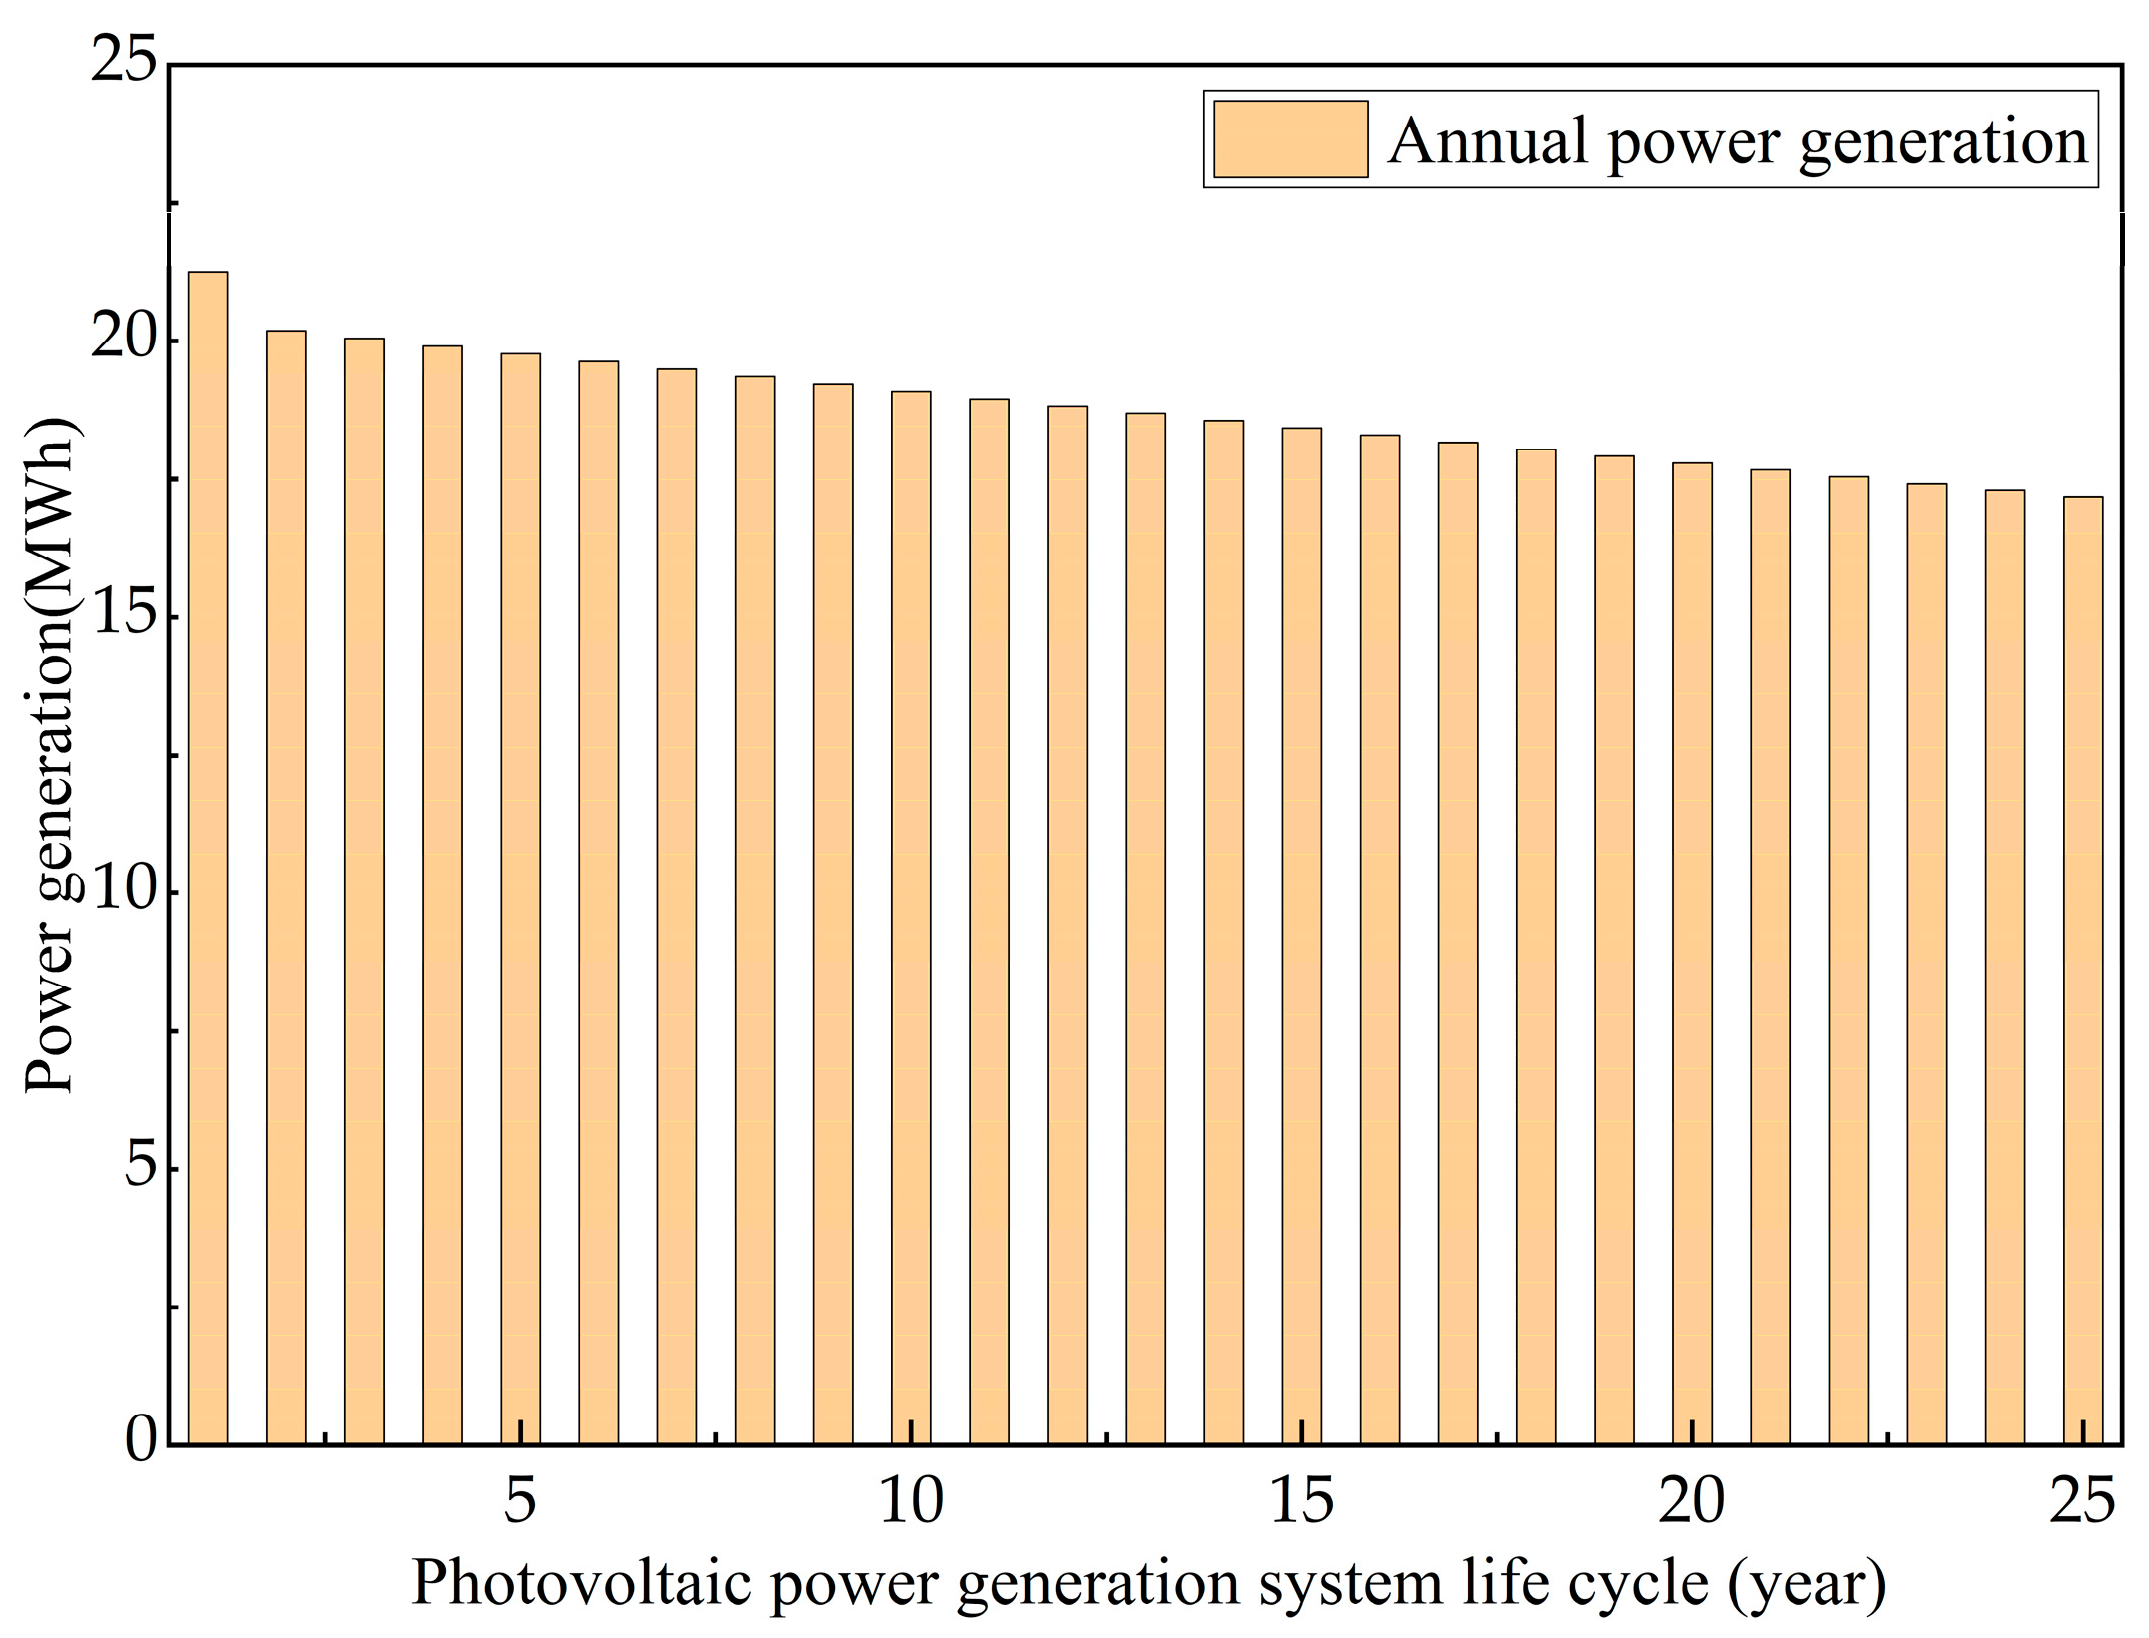
A total of 68 photovoltaic modules with a surface area of 111 m2 and a total installed capacity of 17.68 kW can be installed through the rational use of the roof of the main control building. The photovoltaic system has a life cycle of 25 years and is estimated to generate a total of 468.7 MWh during this period. Figure 7 illustrates the monthly power generation during the first year, with April recording the highest generation of 2.33 MWh. Figure 8 shows the annual power generation of a building’s PV system over its 25-year life cycle, with the first year generating 21.25 MWh.

Figure 7.
Monthly electricity generation during the first year.
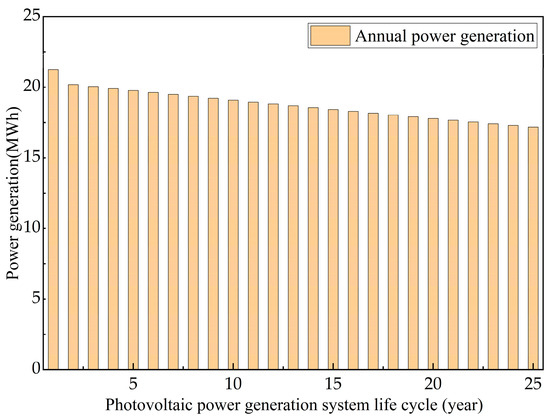
Figure 8.
Annual production of electricity.
The economic analysis of photovoltaic power generation involves evaluating the costs and benefits of solar photovoltaic power generation systems, both quantitatively and qualitatively. This paper selects photovoltaic modules with a peak power of 260 Wp, costing 5 RMB/W, and a total installed capacity of 17.68 kW. The total investment, with component investment accounting for 50% of the total investment ratio, is 176,800 yuan. Table 6 provides specific data. Figure 9 illustrates the cost benefits of investing in photovoltaic power generation systems. The data show that the investment can be recovered after 13 years of operation.
Table 6.
Economic benefit analysis of solar power generation systems.
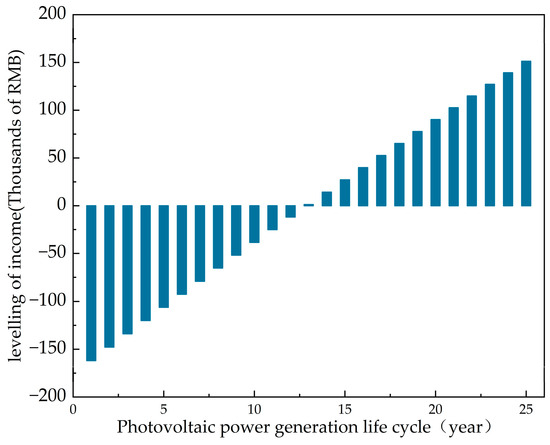
Figure 9.
Profitability of photovoltaic power generation.
The photovoltaic power generation system offers several advantages, including no depletion risk, no fuel consumption, and no pollution emissions. These advantages play a crucial role in achieving China’s carbon-neutral goal. According to the Annual Development Report of China Power Industry 2022, Table 7 presents the calculated environmental impact of solar photovoltaic power generation systems and the effect of energy conservation based on the statistics of CO2, SO2, and nitrogen oxide emissions per unit of thermal power generation.
Table 7.
Analysis of the benefits of emission reduction from photovoltaic systems.
In summary, this project has a PV module installation area of 111 m2, a total installed capacity of 17.68 kW, and a system efficiency of 85.3%. The power generation in the first year is expected to be 21.3 MWh, with a total power generation of 468.7 MWh expected over 25 years. The investment required is 176,800 yuan, with an income of 328,100 yuan. Additionally, the project is expected to emit approximately 267.3 tCO2.
3.2. Minimize the Power Consumption of the Device
Based on the structural parameters of the main control building of the substation, a hexahedral unstructured mesh, which is simple to partition and shape, was used for modeling. Since the quality of the mesh partition directly affects the accuracy of calculations, the “Normal” method was employed for partitioning. Furthermore, areas with significant temperature and velocity gradients, such as air supply and exhaust outlets, underwent local refinement after coarse partitioning. The maximum size of the mesh did not exceed 0.2 m, and the mesh quality was above 0.8. This simulation involved a total of 166,685 mesh elements and 181,139 nodes. The simulation results and analysis are discussed below.
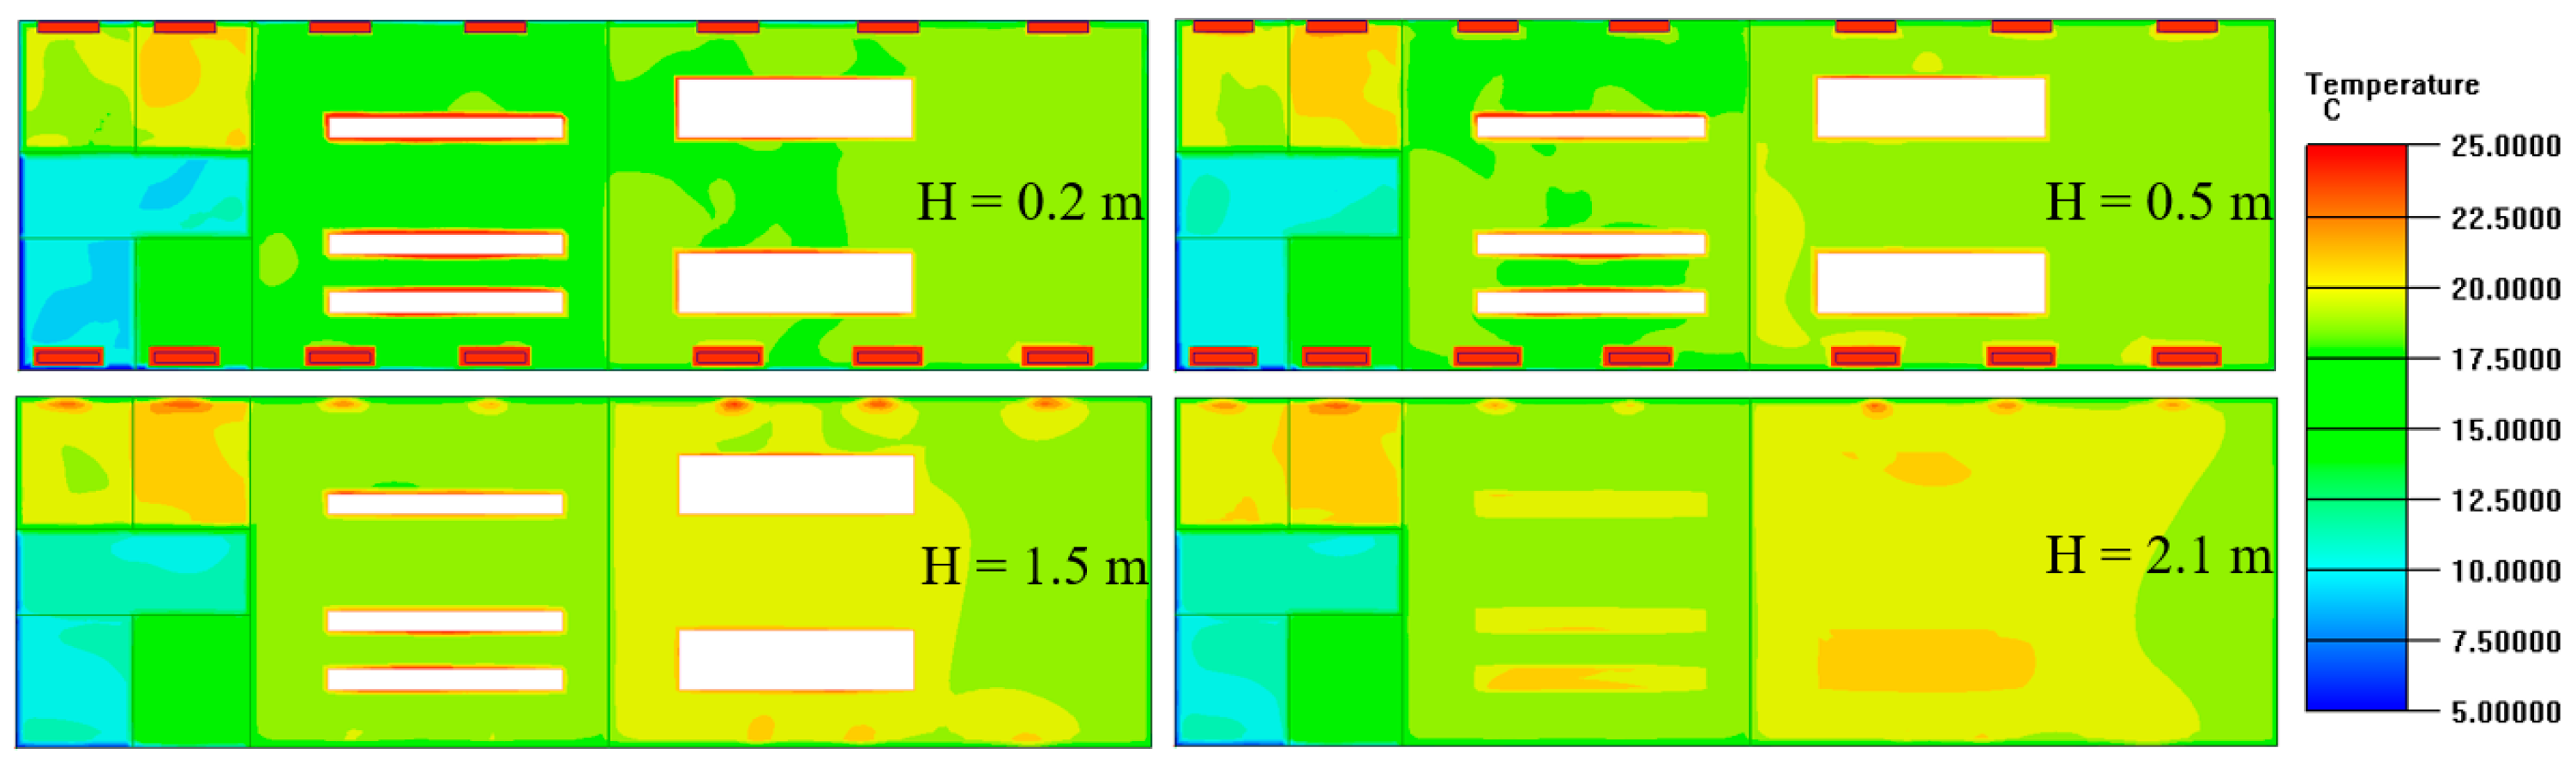
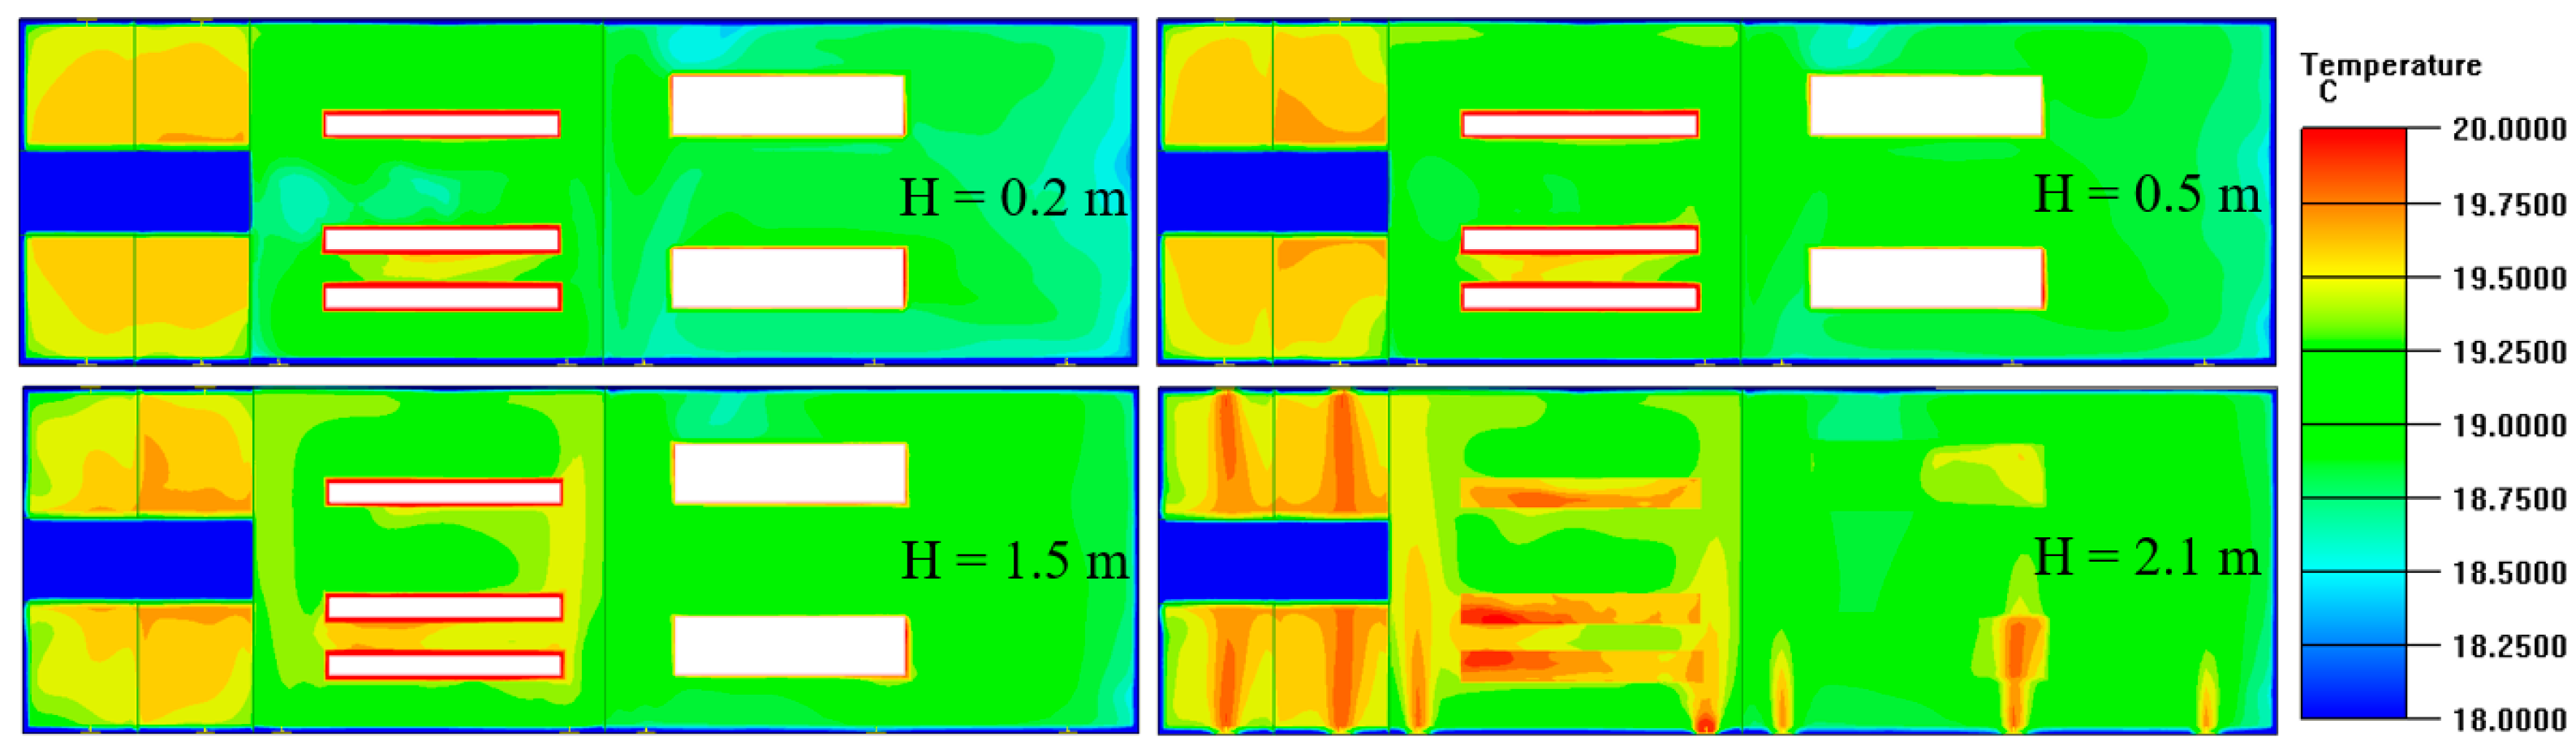
Electric heating is a natural convection heat transfer terminal device, which has the advantages of low investment cost, but it can lead to uneven heating and cooling, high surface temperature, and high maintenance costs. Aiming to address the issue of uneven heating and cooling, Airpak3.0.16 is used to simulate the temperature field of each room in the main control building during electric heating and analyze the possibility of condensation in the room. Figure 10 displays the temperature field distribution of the main control building of the substation at four different heights (0.2 m, 0.5 m, 1.5 m, and 2.1 m) with an outdoor ambient temperature of −30 °C. It can be observed that the temperature of the 10 kV equipment distribution room, secondary equipment room, and secondary equipment room monitoring room falls within the range of 17 to 20 °C, meeting the design requirements. No low-temperature phenomenon is observed in any part of the room. Figure 11 displays the distribution diagram of indoor temperature when the heat supply is at its peak and the outdoor ambient temperature is −20 °C. It is evident from the figure that an increase in outdoor temperature leads to a significant rise in temperature (by 4 to 6 °C) of the 10 kV equipment distribution room, secondary equipment room, and secondary equipment room monitoring room, if the heat supply of the radiator is not reduced. The reason for this is that the electric heater in the substation cannot be adjusted for heat production, and the equipment’s heat supply is designed based on the maximum heat load. As a result, when the outdoor temperature increases, the required heat load decreases, but the heat supply remains the same, causing the indoor temperature to rise. This results in unnecessary energy waste and makes it difficult to achieve the goal of energy conservation and emission reduction.
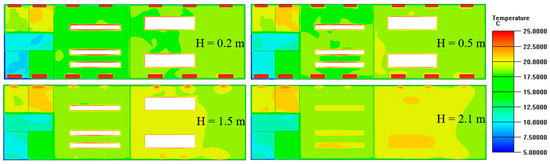
Figure 10.
Outdoor ambient temperature −30 °C and temperature distribution in the room when electric heating is used.
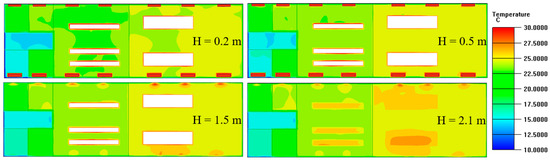
Figure 11.
Outdoor ambient temperature −20 °C and temperature distribution in the room when electric heating is used.
The air source heat pump utilizes a compressor to convert low-grade heat energy from the air into high-grade heat energy that can be used for industrial production with the aid of electric energy. This makes it possible to save non-renewable energy. As air is an inexhaustible renewable energy source, air source heat pumps can significantly reduce carbon dioxide emissions during winter heating or even achieve zero emissions. In comparison to electric heaters that consume non-renewable energy, such as electricity and gas, to produce heat, air source heat pumps can generate several times more heat under the same electrical energy input. They are energy-efficient, safe, and have adjustable heating capabilities at a lower cost [25]. Therefore, the air source heat pump combined with a fan coil is being considered as a replacement for electric heating in the main control building.
According to the “Fire Protection Standard for Design of Thermal Power Plants and Substations” GB50229-2019 [26], heating pipes must not pass through rooms containing electrical equipment, such as transformer and distribution device rooms. As a result, separate heating must be provided to the 10 kV equipment distribution room and secondary equipment room. The terminal heating is achieved through fan coil units. Regardless of the type of heating used, it is crucial to maintain a stable indoor temperature and humidity environment. To achieve this, an air source heat pump can be installed to simulate the temperature field inside the substation. Figure 12 illustrates the indoor temperature distribution when a fan coil is used at an outdoor ambient temperature of −20 °C. The figure illustrates that the indoor temperature distribution is more uniform with this heating method compared to direct electric heating. This method can adjust indoor temperature and humidity changes by detecting indoor and outdoor temperature changes and adjusting the indoor supply wind speed and heating temperature of the air source heat pump.
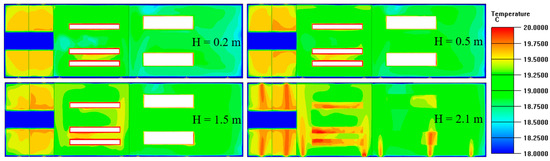
Figure 12.
When the outdoor temperature drops to −20 °C, an air source heat pump is used to distribute heat throughout the room.
In accordance with the standard GB/T25127.1 [27] for low ambient temperature air source heat pump (water chilling) packages—Part 1: Heat pump (water chilling) packages for industrial and commercial and similar applications, the energy efficiency ratio of the system at −25 °C is determined to be 1.8. This means that for every 1 kW of electricity consumed, the system is capable of producing 1.8 kW of heat. It is important to note that the performance of the air source heat pump system is significantly influenced by the ambient temperature. As the ambient temperature rises, the heating energy efficiency ratio of the system also increases. The use of an air source heat pump system can provide real-time adjustment of indoor temperature and other parameters, reduce personnel requirements, and save at least 55% of annual electricity consumption.
As stated in Section 3.1, solar radiant panels generate an average of 18.748 MWh of power annually, while the annual heat consumption for heating and cooling, calculated in Section 2, is 19.425 MWh and 2.524 MWh, respectively. When using electric heating, the solar power generated annually can meet 96.51% of the annual heating heat consumption. If the air source heat pump requires no more than 65.04% of the annual power generated by the photovoltaic system, it can satisfy the annual cooling and heating needs. However, Figure 13 shows that the monthly power generation of the solar photovoltaic system does not align with the cooling and heating demands. Therefore, while the building has achieved near-zero-energy consumption in terms of total energy usage, it is necessary to fully achieve this goal by increasing the installed capacity of the photovoltaic system and reducing the heat load required for winter heating.
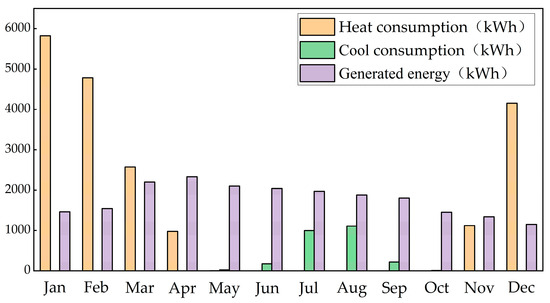
Figure 13.
Comparison chart of monthly heat consumption, cooling consumption, and electricity generation.
The carbon emissions during the operational phase of the building should be determined based on the energy consumption of different types of systems and the carbon emission factors of different types of energy. The total carbon emissions per unit building area (CM) during the operational phase of the building should be calculated according to the following formula:
where CM represents the carbon emissions per unit area during the operational phase of the building (kgCO2/m2), Ei denotes the annual consumption of the ith energy type in the building (units/year), EFi stands for the carbon emission factor of the ith type of energy, Ei,j represents the consumption of the ith energy type by the jth type of system (units/year), ERi,j is the amount of the ith energy type provided by renewable energy systems for the jth type of system (in units per year), i refers to the type of terminal energy consumption in the building (including electricity, gas, and oil), j denotes the type of energy system in the building (including HVAC and lighting), Cp represents the annual carbon reduction amount of the building’s green space carbon sink system (kgCO2/year), y is the design life of the building (in years), and A is the building area (m2).
Table 8 presents the total CO2 emissions during the operational phase of the building over its lifecycle (50 years).
Table 8.
Building operational carbon emissions.
The energy consumption during the operational phase of the research object mainly comes from electricity, and the emission factor for the electricity grid is selected based on the data released in February 2023 by the Ministry of Ecology and Environment in the notice “Regarding the Management of Greenhouse Gas Emission Reports for Power Generation Enterprises for the Period of 2023–2025.” The average emission factor for the national electricity grid in 2022 was 0.5703 kg CO2/kWh. From Table 8, it can be observed that the heating system using an air source emits 4.9 fewer tCO2 per year compared to the electric heating system. Over the 50-year lifecycle of the building, the carbon emissions per unit area during the operational phase of the building are 1638 CO2/m2.
3.3. Efficient Use of Solar Energy Resources
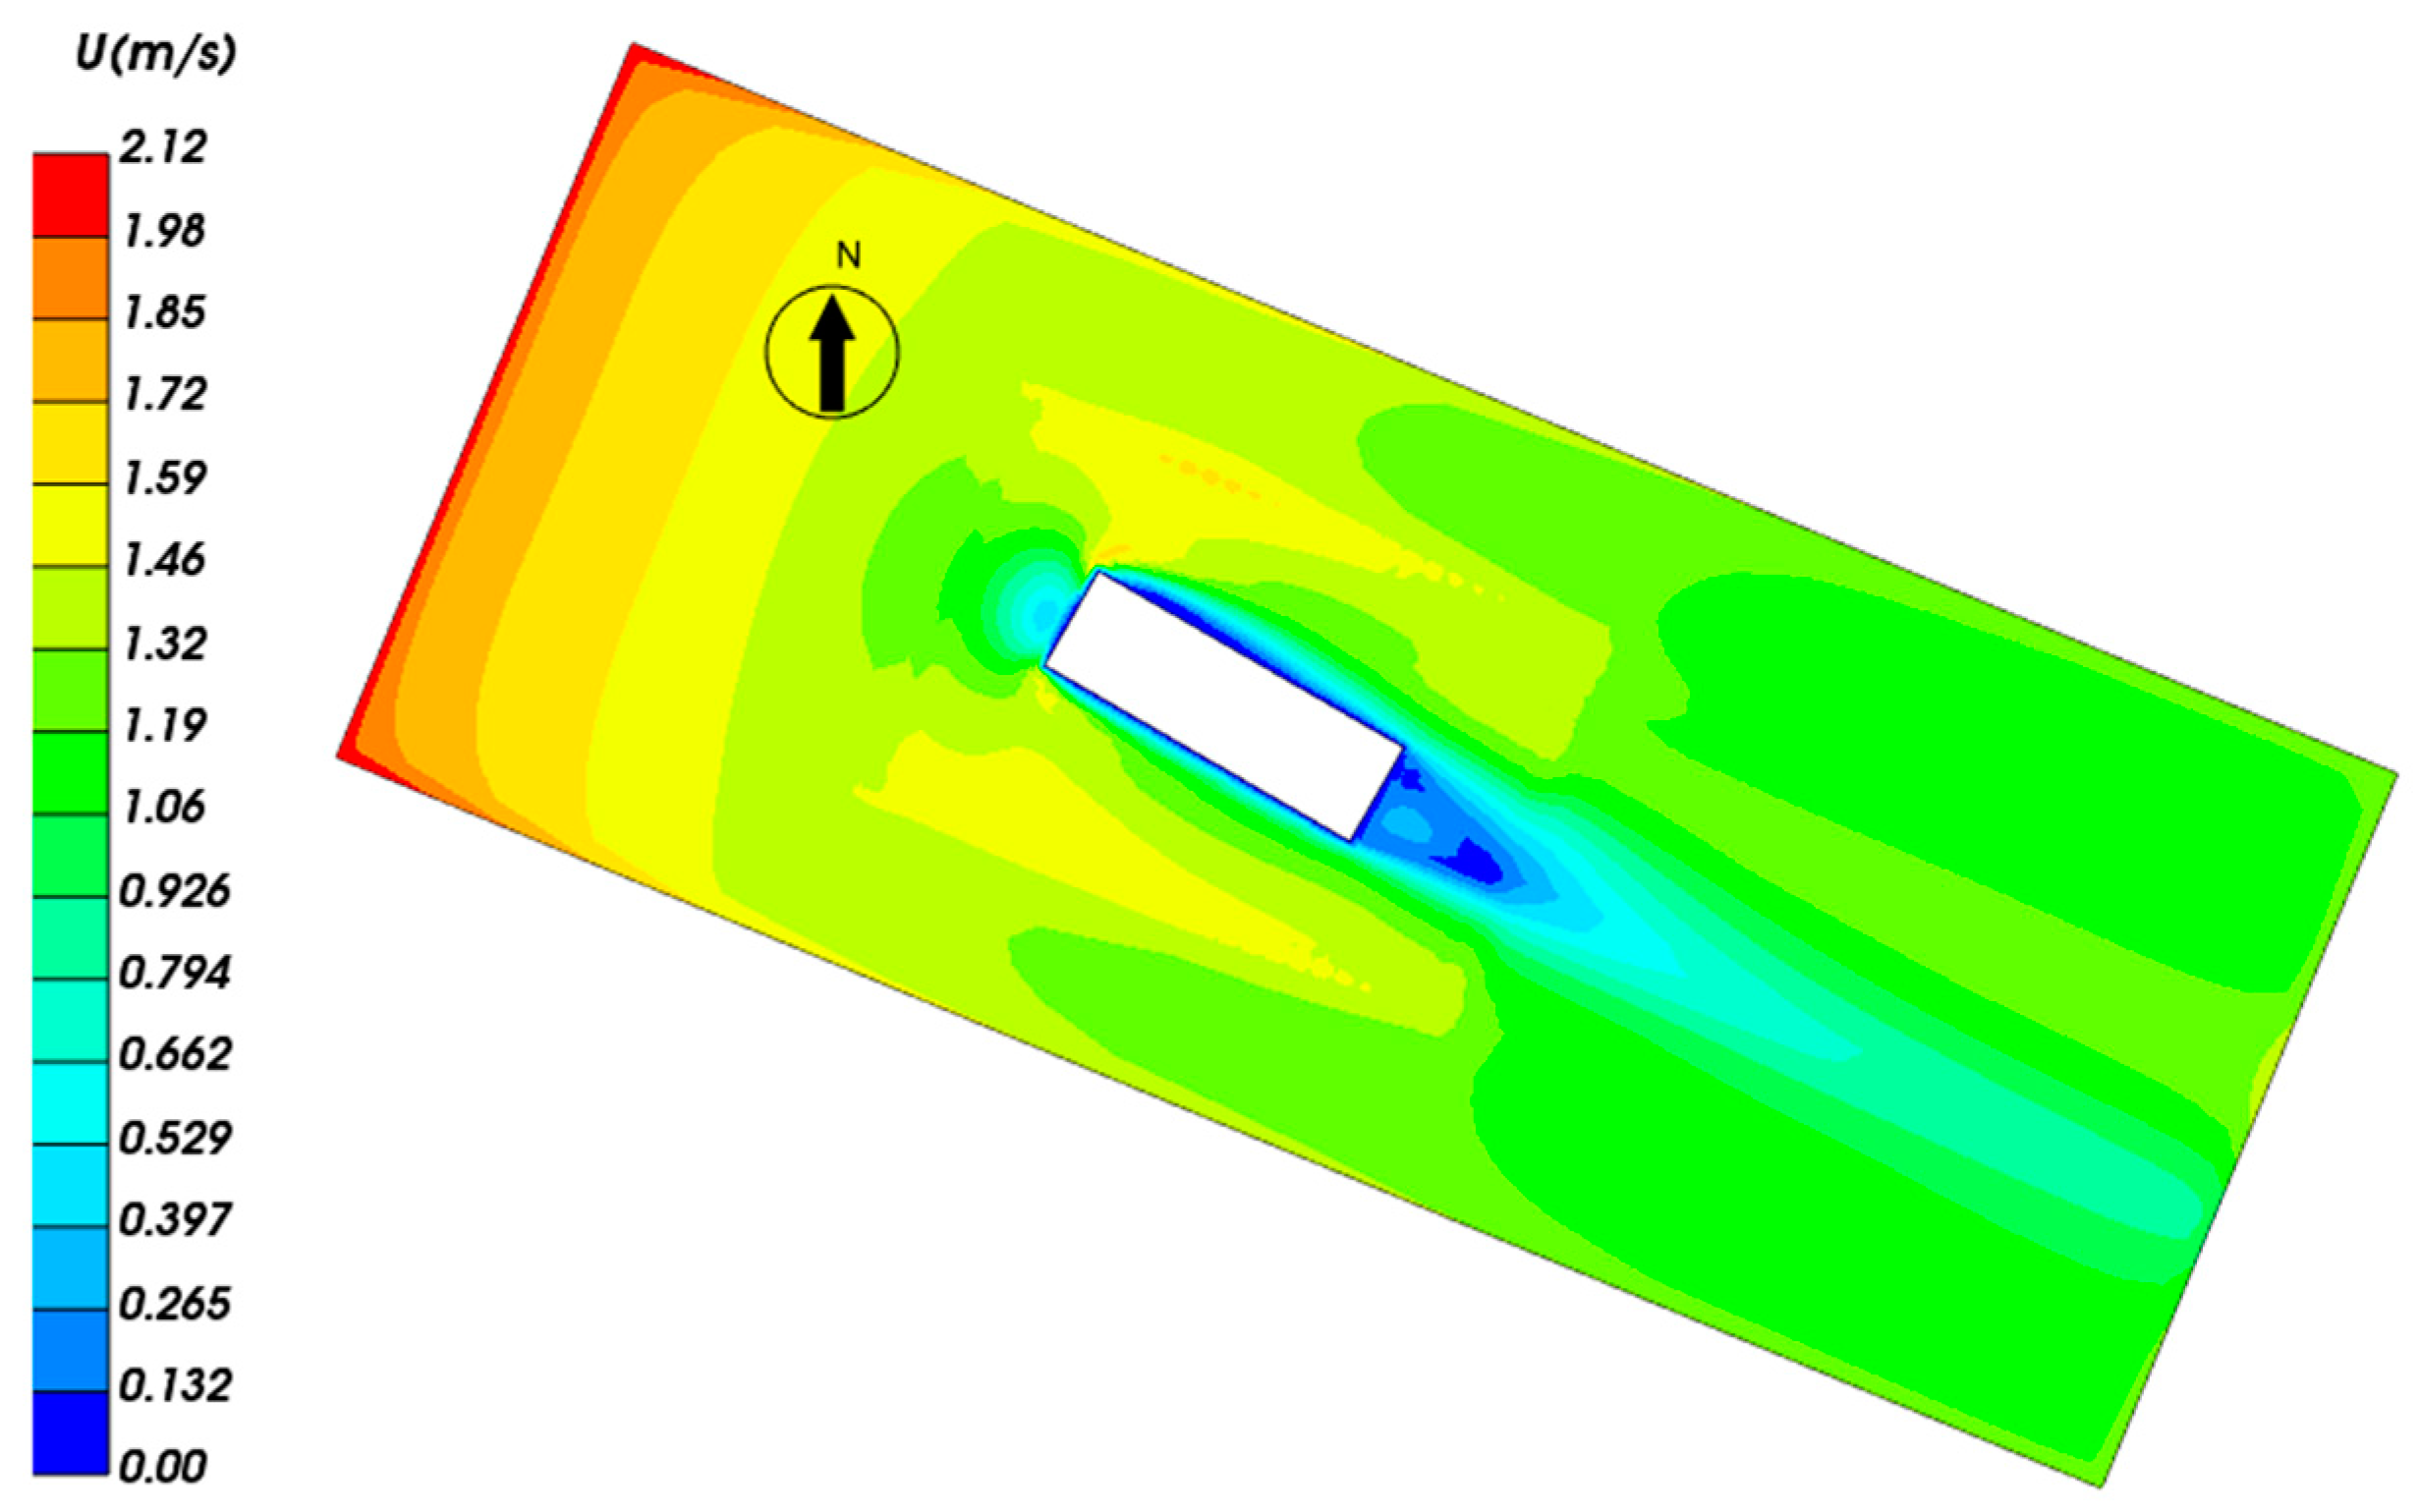
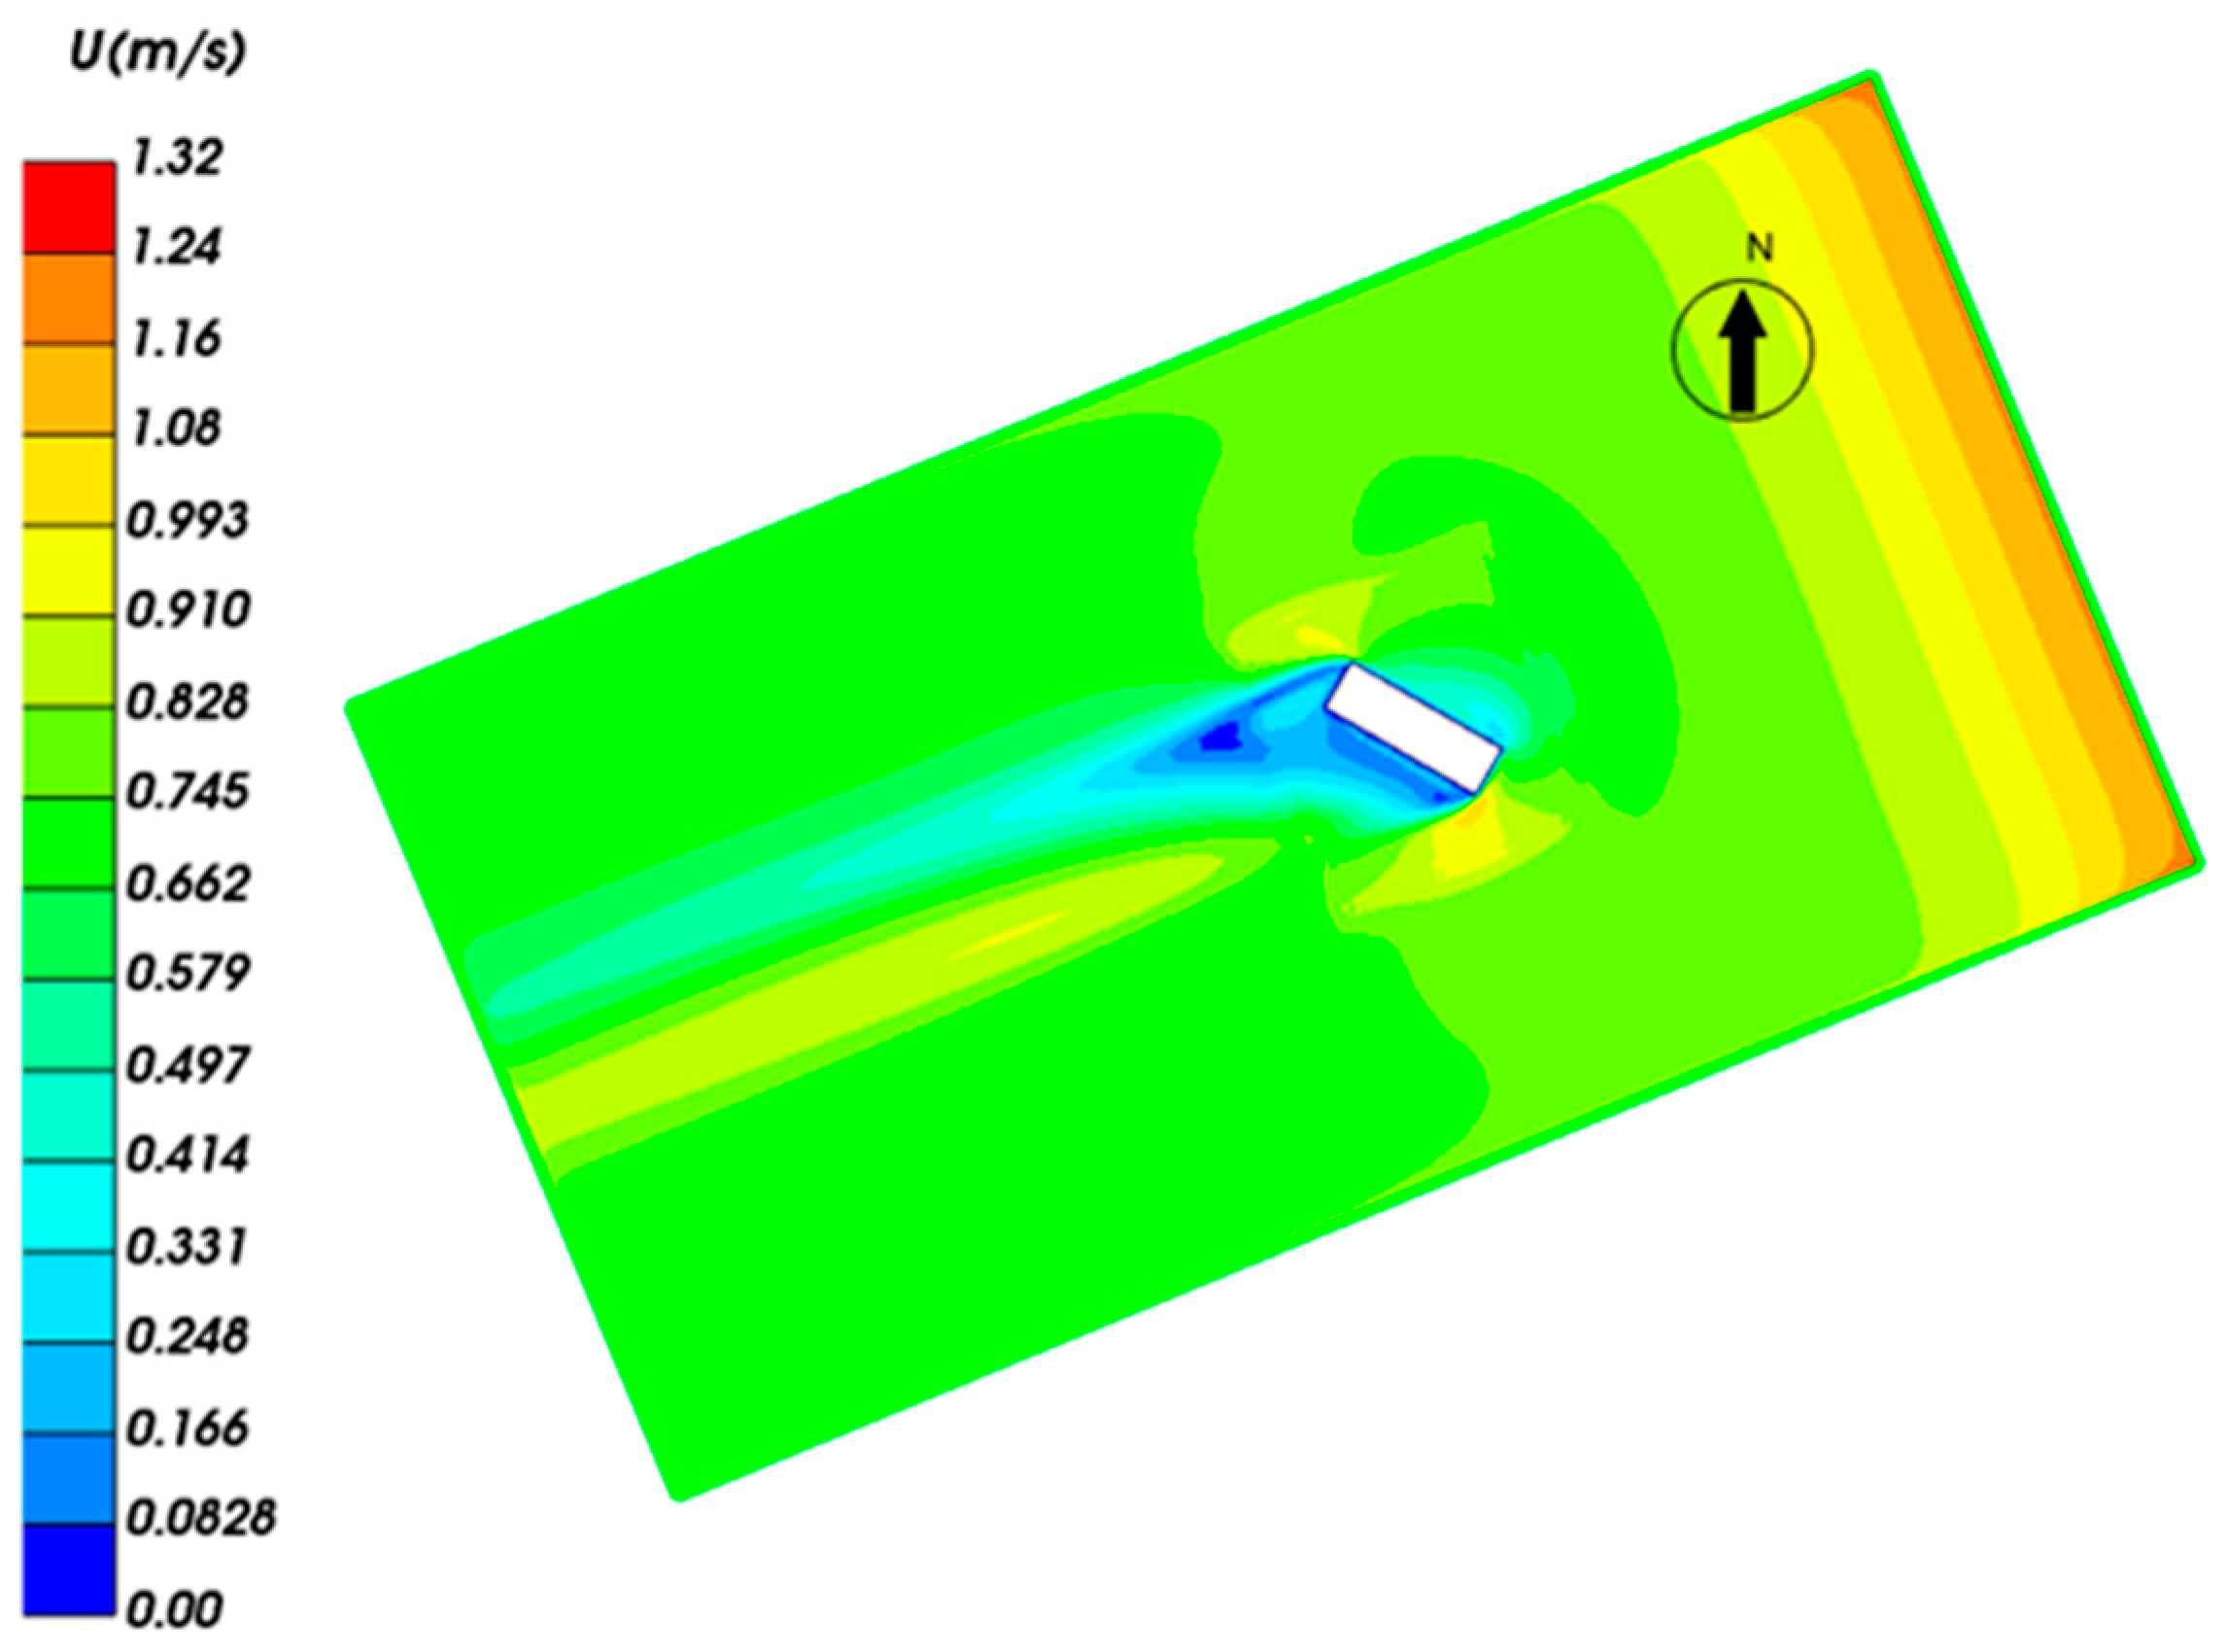
Table 9 presents the primary wind directions and speeds for the winter and summer seasons in the region where the main control building is located. The data were obtained by consulting the relevant literature. Simulations of the outdoor airflow around the substation’s main control building were conducted for both winter and summer seasons using the Ventilation Analysis module in the GBWARE2024, based on the main control building model and related parameters. Figure 14 and Figure 15 show the wind speed distribution at a height of 1.5 m outdoors during winter and summer, respectively. The wind speed on the windward side of the building ranges from 0.4 to 0.7 m/s under typical summer outdoor conditions.
Table 9.
Main wind direction and wind speed in each season.

Figure 14.
Diagram showing wind speed at 1.5 m in the outdoor wind field during winter.

Figure 15.
Diagram showing wind speed at 1.5 m in the outdoor wind field during summer.
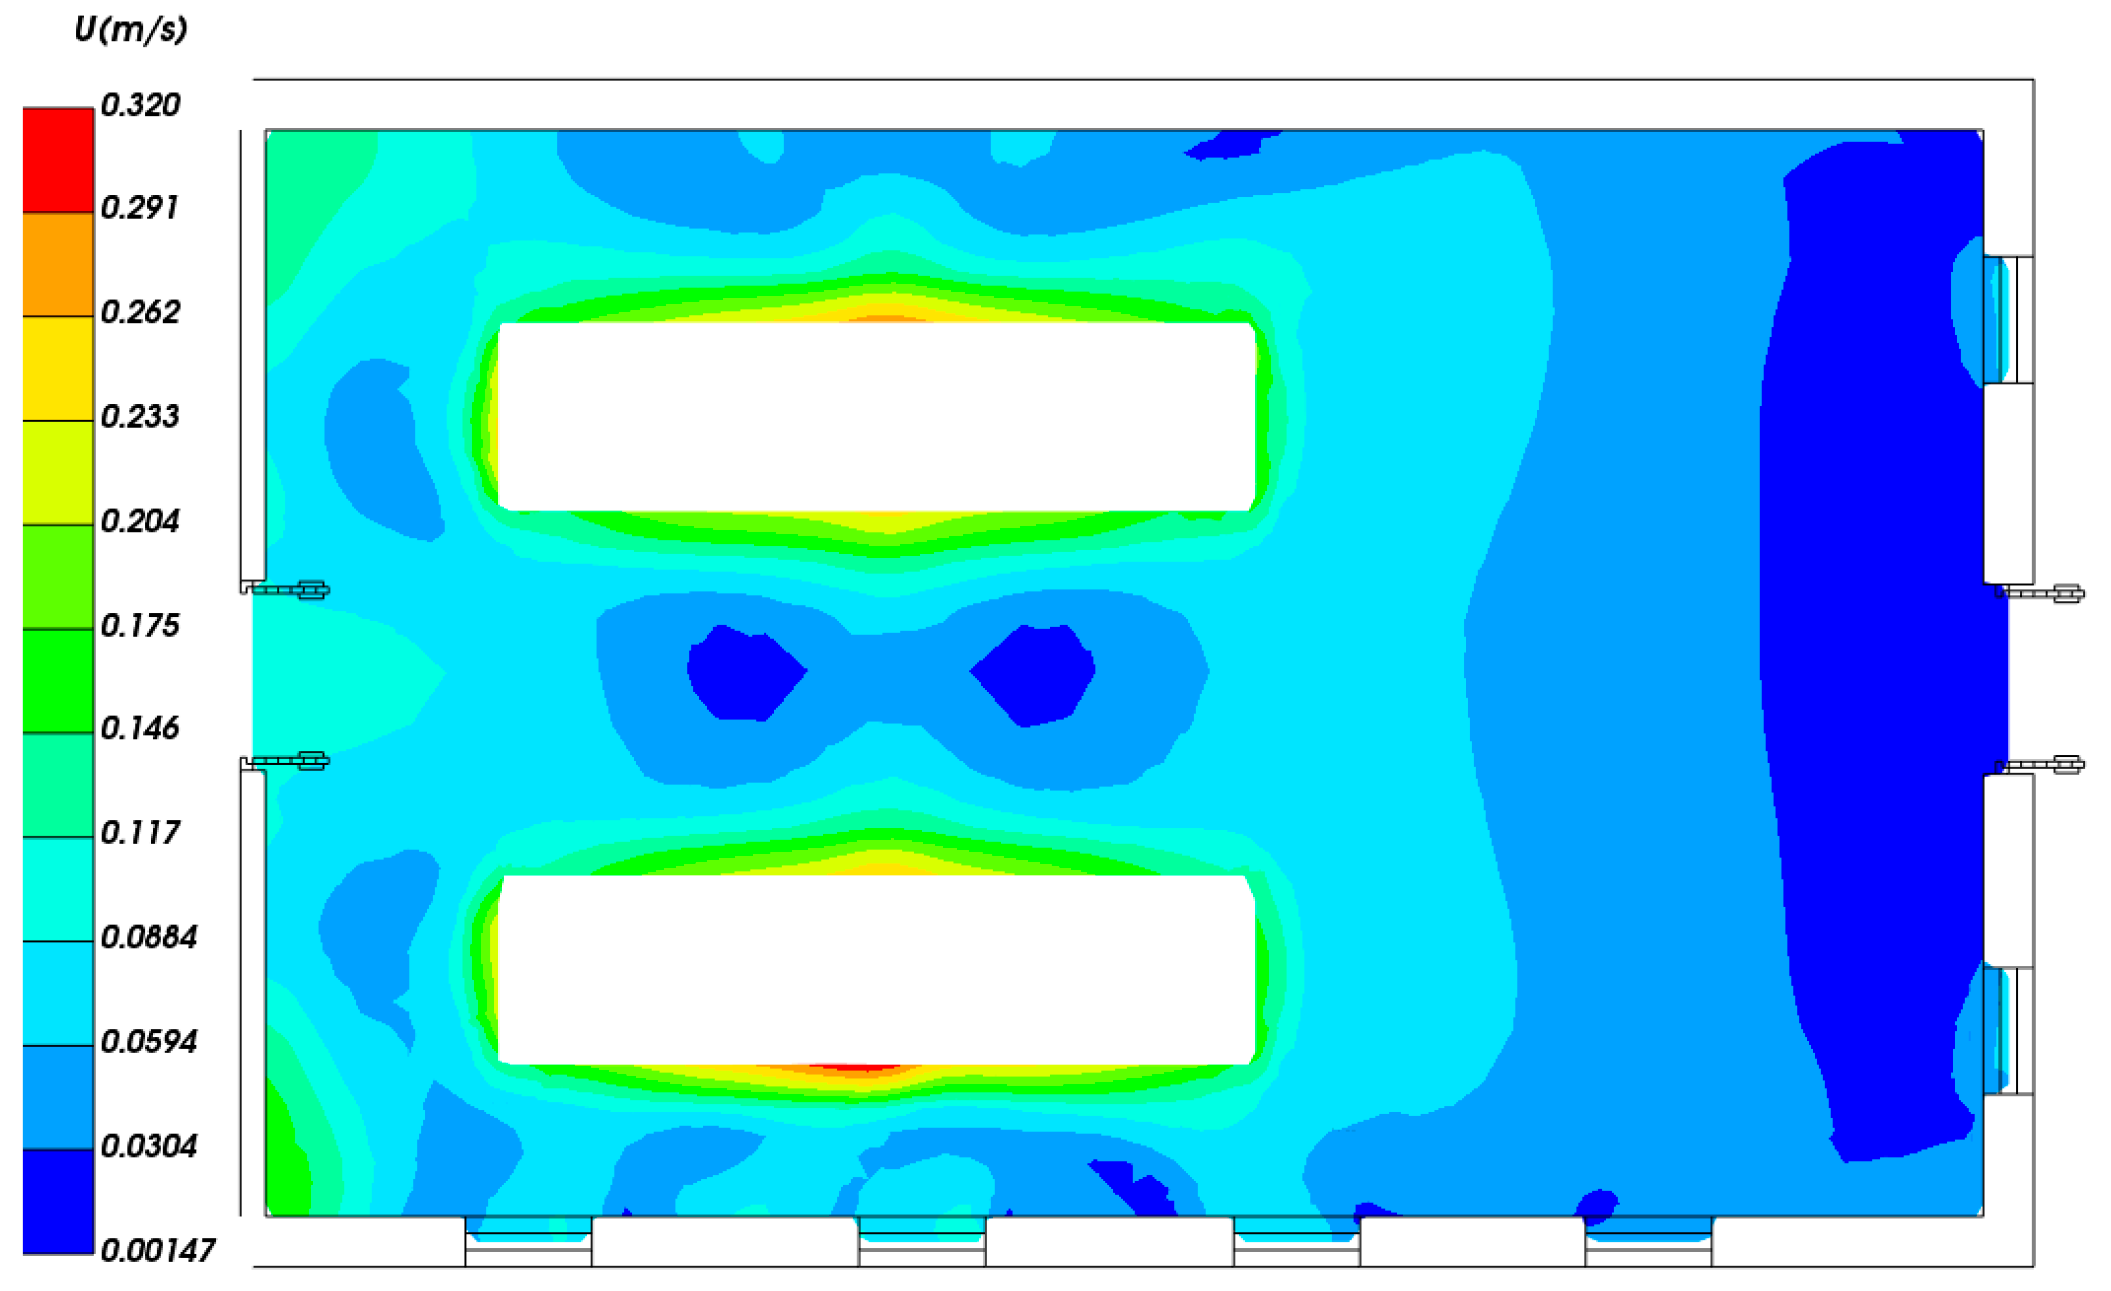
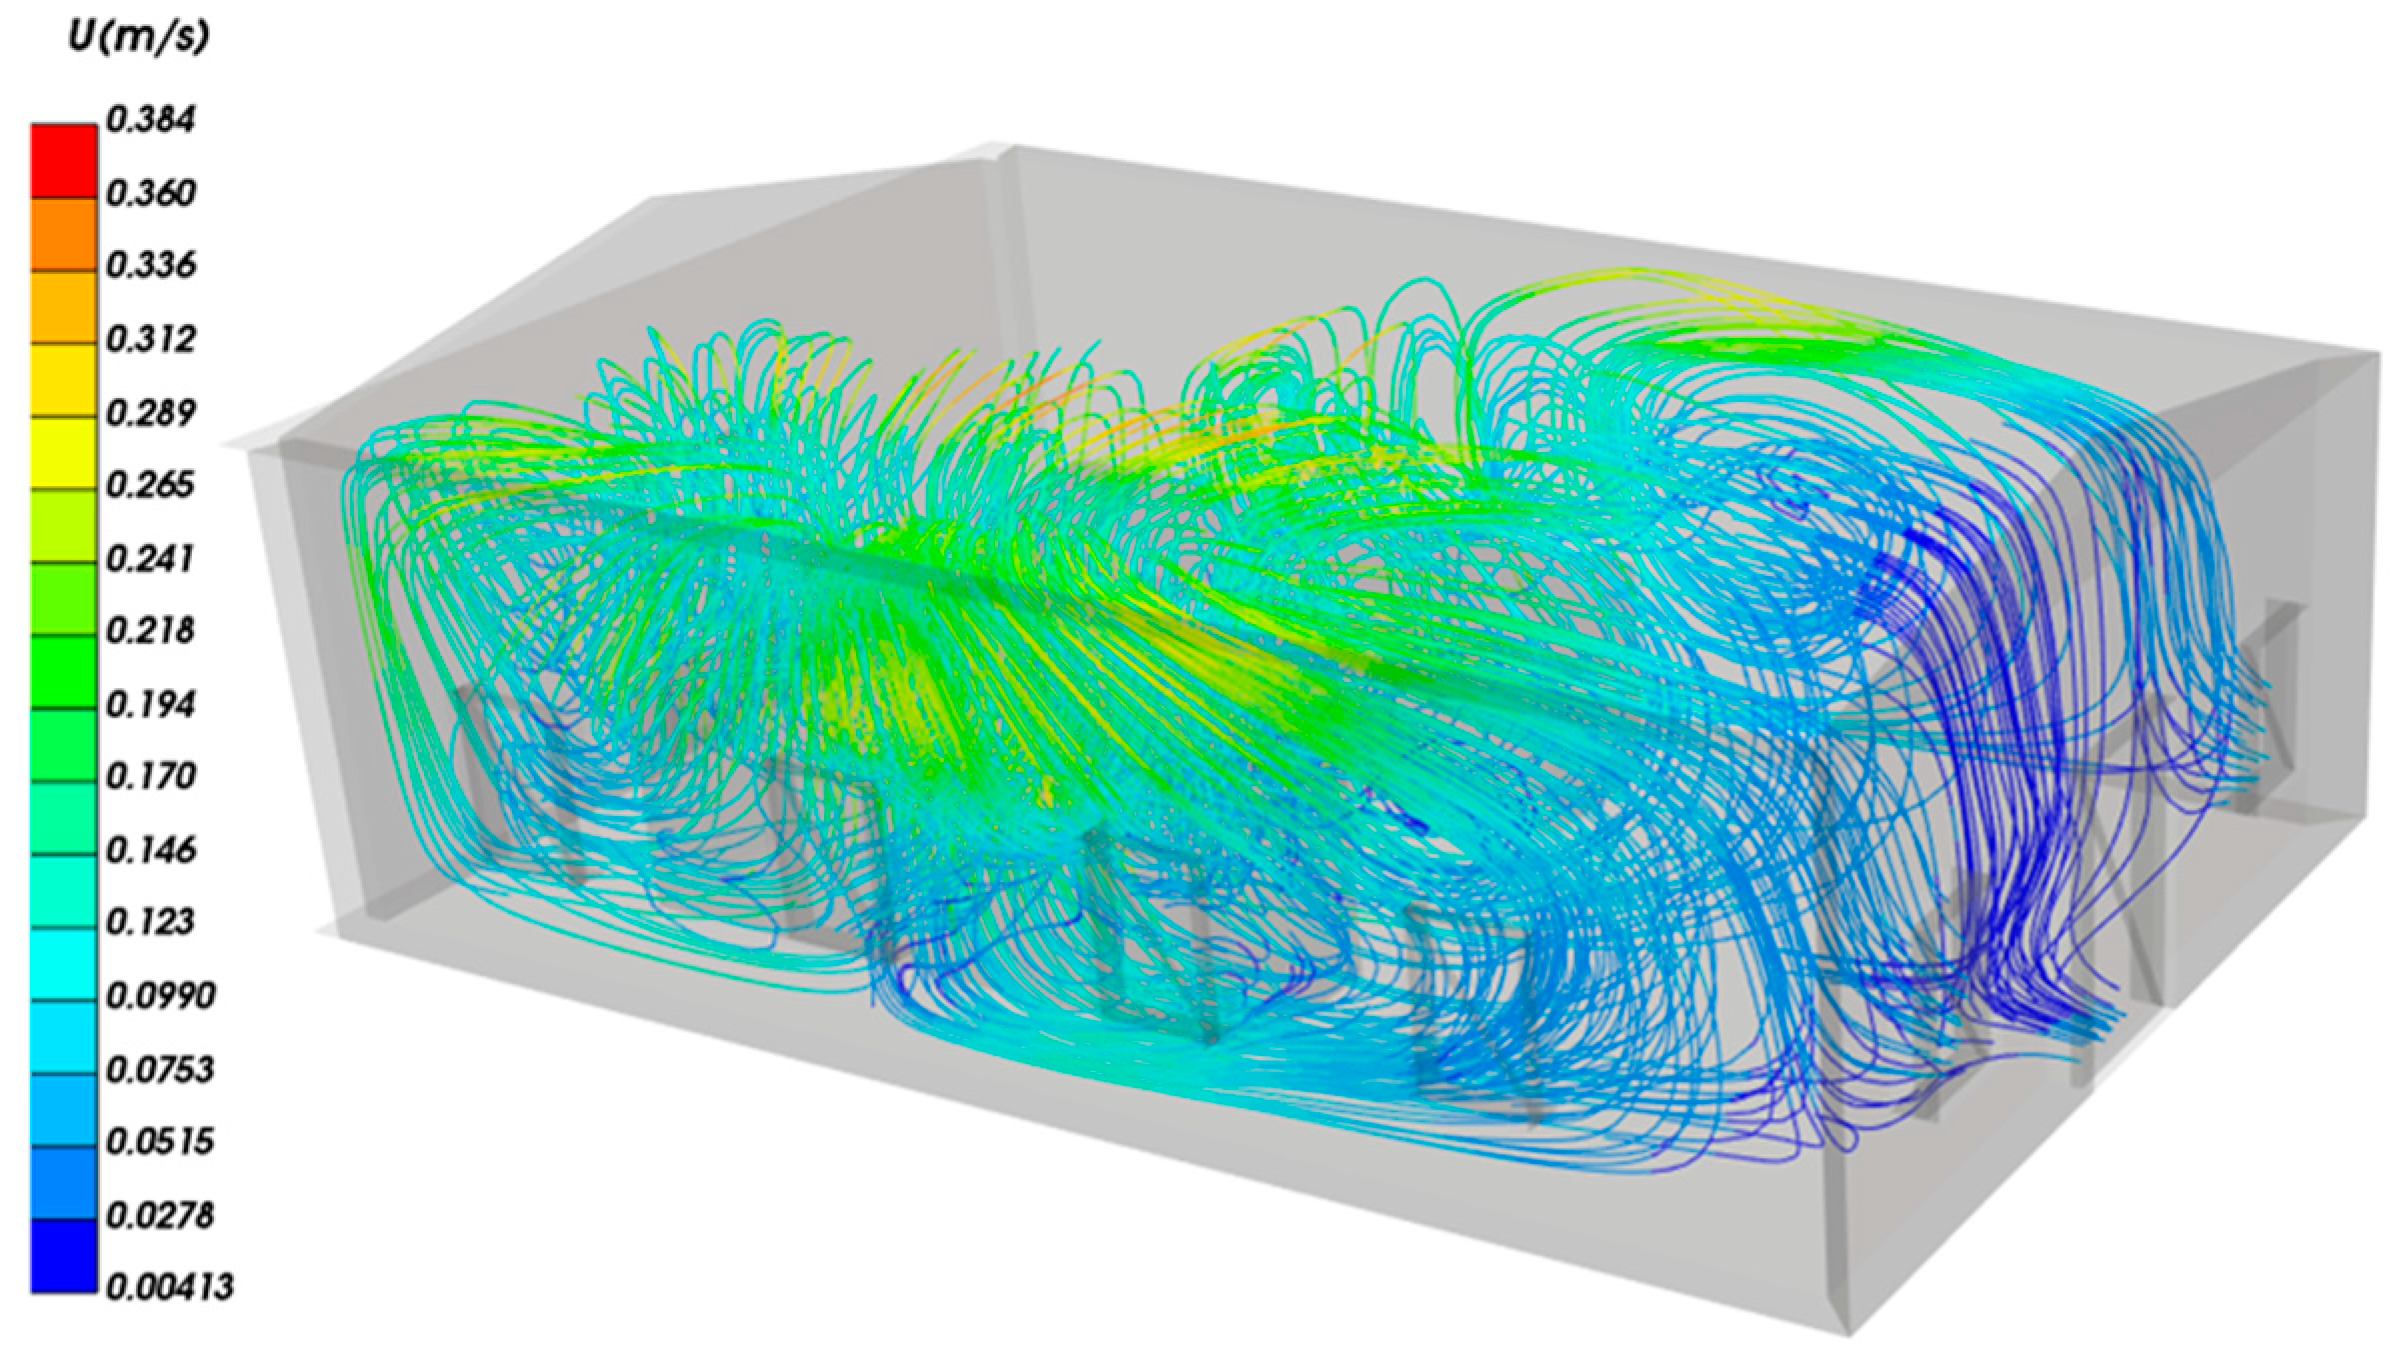
Due to the indoor design temperature not exceeding 28 °C in the summer and the calculated outdoor ventilation temperature in the Yichun area being 26.7 °C during the summer, natural ventilation can be used to remove the heat entering the room and the heat generated by the room’s equipment. Figure 16 shows the distribution of indoor wind speed at a height of 1.5 m in the 10 kV distribution room under summer natural ventilation conditions. Figure 17 shows the cloud map of indoor temperature distribution at a height of 1.5 m in the 10 kV distribution room under natural ventilation conditions in summer. Figure 18 presents the streamline map of indoor conditions in the same room under the same conditions. The maximum indoor wind speed, as shown in the figures, is 0.384 m/s. However, Figure 17 shows a temperature field distribution of around 27.8 °C, which is relatively uniform. The central area between two rows of equipment has a slightly higher temperature of 28.1–28.4 °C due to poor ventilation conditions caused by the obstructive effect of equipment heat load and obstacles, which prevent effective dissipation of equipment heat through natural ventilation. Despite its effectiveness in regulating temperature in most summer conditions, natural ventilation has limitations when it comes to indoor environmental control. Specifically, there is an upper limit on outdoor meteorological temperature beyond which natural ventilation alone cannot effectively reduce indoor heat load and create a comfortable indoor environment. Therefore, the use of air conditioning and fresh air systems is necessary for maintenance. Research indicates that when the indoor temperature reaches 28 °C, the outdoor ambient temperature for the study object is 26.4 °C due to changes in outdoor temperature. Therefore, activating the air source heat pump is necessary to maintain optimal indoor temperature conditions when the outdoor ambient temperature exceeds 26.4 °C.
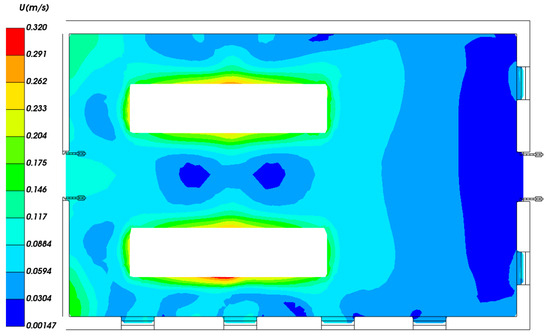
Figure 16.
Wind speed distribution cloud map of the 10 kV distribution room during summer.
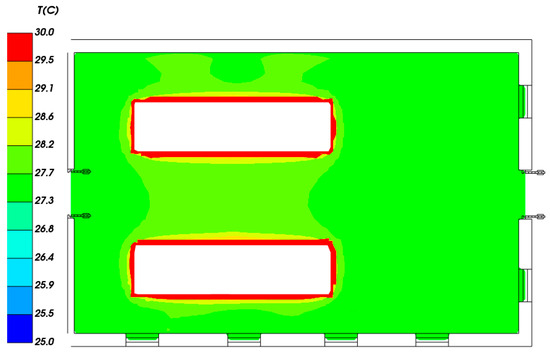
Figure 17.
Temperature distribution cloud map of the 10 kV distribution room during summer.

Figure 18.
Indoor air streamline diagram of 10 kV distribution room during summer.
During the heating season, the indoor design temperature should not be set lower than 20 °C. In transitional seasons, outdoor ventilation temperatures can fluctuate widely. By adjusting the opening range of windows judiciously, excess indoor heat load can be effectively dissipated. This study simulates conditions with an outdoor temperature of 20 °C as the benchmark for transitional seasons. Figure 19 analyzes the distribution of indoor wind speeds at a height of 1.5 m in the 10 kV distribution room during the transitional season under natural ventilation conditions. Figure 20 illustrates the cloud map of indoor temperature distribution at the same height in the 10 kV distribution room under natural ventilation conditions during the transitional season. Figure 21 presents the streamline map of indoor conditions in the same room under the same conditions. During the transitional seasons, the maximum indoor wind speed is 0.467 m/s, and the temperature ranges from 20.3 °C to 21 °C. Natural ventilation is an effective method for removing indoor heat load, resulting in significant energy savings compared to air conditioning or mechanical ventilation.
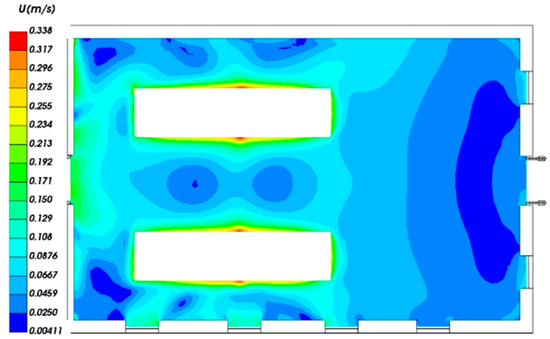
Figure 19.
Wind speed distribution cloud map of the 10 kV distribution room during transition season.
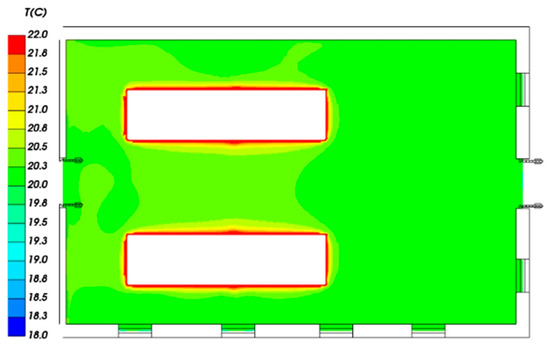
Figure 20.
Temperature distribution cloud map of the 10 kV distribution room during transition season.
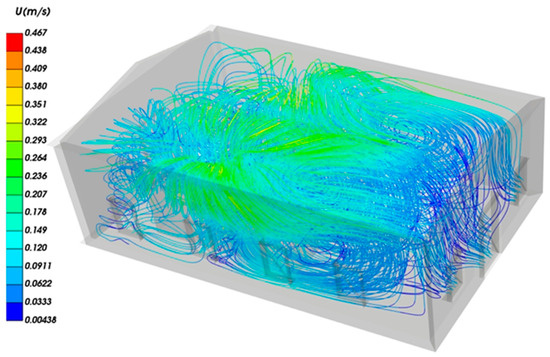
Figure 21.
Indoor air streamline diagram of 10 kV distribution room during transition season.
In addition to studying the temperature and velocity fields during the summer and transition seasons, the substation must also ensure a sufficient number of indoor air changes. Based on the above calculation parameters, it has been determined that the maximum number of indoor air exchanges that can be guaranteed for the 10 kV distribution room is 16 times in the summer and 17 times in the excessive season.
4. Conclusions
In the context of actively achieving the goals of carbon peaking and carbon neutrality in China, building energy consumption is influenced by various factors such as geographical conditions, climate, and architectural form. Therefore, energy-saving and carbon reduction in substation buildings should be tailored to local conditions and comprehensively considered. This paper focuses on substation buildings in cold regions as the research object. It employs two methods: photovoltaic power generation systems and computational fluid dynamics (CFD) simulations. By integrating the climatic characteristics of cold regions and practical engineering considerations, suitable energy-saving technology routes are proposed, emphasizing two aspects: the effective utilization of surrounding renewable energy sources and the reduction in equipment operational energy consumption. To expand new avenues of innovation in the technological advancement of energy conservation and carbon reduction in substation buildings, the relevant results are as follows:
- (1)
- The solar photovoltaic power generation system in this study has an annual average electricity generation of 18.75 MWh. Solar power generation can meet the annual electricity supply for HVAC load. Using a solar photovoltaic power generation system in the building energy supply system can save 10.7 tCO2.
- (2)
- Additionally, using an air source heat pump can save 44.5% of electricity when compared to electric heating. When both a solar photovoltaic power generation system and an air source heat pump are used to provide a building with a cold and heat source, the annual emissions of CO2 can be reduced by 4.90 t compared to a traditional electric heating system. It provides some design ideas for realizing zero-energy consumption building and building energy savings and carbon reduction.
- (3)
- To ensure the efficient operation of indoor equipment in the main control building of the substation, natural ventilation can be used during summer and transitional seasons when the outdoor air temperature is between 20 °C and 26.4 °C. Automated control can be implemented to maximize energy-saving and carbon-reduction measures.
Author Contributions
Conceptualization, X.J. and Y.W.; methodology, J.Z and Y.W.; software, J.Z and L.Z.; validation, S.S., Y.W. and C.Z.; formal analysis, J.Z.; investigation, X.G.; writing—original draft preparation, J.Z.; writing—review and editing, X.J., Y.W., X.G. and C.Z.; visualization, S.S.; funding acquisition, C.Z. All authors have read and agreed to the published version of the manuscript.
Funding
This research was funded by the Science and Technology Project of Heilongjiang Power Grid Company, grant number 522448220005, “Research on the key technology of energy-saving systems for power transmission and transformation projects in high-cold areas”.
Institutional Review Board Statement
Not applicable.
Informed Consent Statement
Not applicable.
Data Availability Statement
The data presented in this study are available on request from the corresponding author. The data are not publicly available due to privacy.
Conflicts of Interest
Author Ying Wang, Xiuyun Gao and Lei Zhao was employed by Economic and Technological Research Institute of State Grid Heilongjiang Electric Power Co. Ltd. The remaining authors declare that the research was conducted in the absence of any commercial or financial relationships that could be construed as a potential conflict of interest. The authors declare that this study received funding from Heilongjiang Power Grid Company. The funder was not involved in the study design, collection, analysis, interpretation of data, the writing of this article or the decision to submit it for publication.
References
- Lin, Y.; Shan, P.; Huang, W.; Lin, D.; Huang, H.; Zhang, C.; Zhuo, Z. Evaluation method of building carbon emission in Fujian Province based on CIE-AHP. Fujian Constr. Sci. Technol. 2021, 02, 77–80. [Google Scholar]
- Voss, K.; Goetzberger, A.; Bopp, G.; Häberle, A.; Heinzel, A.; Lehmberg, H. The self-sufficient solar house in Freiburg-Results of 3 years of operation. Sol. Energy 1996, 58, 17–23. [Google Scholar] [CrossRef]
- Zhang, S. Research on Energy Saving Potential and Technical Path of Ultra-Low Energy Consumption Buildings; Harbin Institute of Technology: Harbin, China, 2016. [Google Scholar]
- Wang, L.; Zheng, L.; Liu, C.; Zheng, N. There are technical routes for zero energy consumption transformation of public buildings in cold areas. Build. Energy Effic. 2023, 51, 98–104. [Google Scholar]
- Zeyghami, M.; Goswami, D.Y.; Stefanakos, E. A review of clear sky radiative cooling developments and applications in renewable power systems and passive building cooling. Sol. Energy Mater. Sol. Cells 2018, 178, 115–128. [Google Scholar] [CrossRef]
- Lee, J.B.; Park, J.W.; Yoon, J.H.; Baek, N.C.; Shin, U.C. An empirical study of performance characteristics of BIPV (Building Integrated Photovoltaic) system for the realization of zero energy building. Energy 2014, 66, 25–34. [Google Scholar] [CrossRef]
- Cao, V.D.; Pilehvar, S.; Salas-Bringas, C.; Szczotok, A.M.; Bui, T.Q.; Carmona, M.; Rodriguez, J.F.; Kjøniksen, A.-L. Thermal performance and numerical simulation of geopolymer concrete containing different types of thermoregulating materials for passive building applications. Energy Build. 2018, 173, 678–688. [Google Scholar] [CrossRef]
- Li, Z.; Peng, W.; Yujiao, H.; Wei, T.; Yong, S. Relationships between design parameters of see-through thin film photovoltaic facade and energy performance of office building in China cold zone. Energy Procedia 2018, 152, 401–406. [Google Scholar] [CrossRef]
- Lebied, M.; Sick, F.; Choulli, Z.; El Bouardi, A. Improving the passive building energy efficiency through numerical simulation–A case study for Tetouan climate in northern of Morocco. Case Stud. Therm. Eng. 2018, 11, 125–134. [Google Scholar] [CrossRef]
- Balali, A.; Hakimelahi, A.; Valipour, A. Identification and prioritization of passive energy consumption optimization measures in the building industry: An Iranian case study. J. Build. Eng. 2020, 30, 101239. [Google Scholar] [CrossRef]
- Sivaram, P.; Mande, A.B.; Premalatha, M.; Arunagiri, A. Investigation on a building-integrated passive solar energy technology for air ventilation, clean water and power. Energy Convers. Manag. 2020, 211, 112739. [Google Scholar] [CrossRef]
- Tariq, R.; Torres-Aguilar, C.E.; Sheikh, N.A.; Ahmad, T.; Xamán, J.; Bassam, A. Data engineering for digital twining and optimization of naturally ventilated solar façade with phase changing material under global projection scenarios. Renew. Energy 2022, 187, 1184–1203. [Google Scholar] [CrossRef]
- Liu, X.; Ge, Q.; Jiang, L.; Cui, L.; Li, B.; Du, X. Thinking on the path of total coal consumption control in China. China Population. Resour. Environ. 2019, 29, 160–166. [Google Scholar]
- Tong, Z.; Chen, Y.; Malkawi, A.; Liu, Z.; Freeman, R.B. Energy saving potential of natural ventilation in China: The impact of ambient air pollution. Appl. Energy 2016, 179, 660–668. [Google Scholar] [CrossRef]
- Oropeza-Perez, I.; Østergaard, P.A. Energy saving potential of utilizing natural ventilation under warm conditions—A case study of Mexico. Appl. Energy 2014, 130, 20–32. [Google Scholar] [CrossRef]
- Stasi, R.; Ruggiero, F.; Berardi, U. The efficiency of hybrid ventilation on cooling energy savings in NZEBs. J. Build. Eng. 2022, 53, 104401. [Google Scholar] [CrossRef]
- Gilani, S.; O’brien, W. Natural ventilation usability under climate change in Canada and the United States. Build. Res. Inf. 2021, 49, 367–386. [Google Scholar] [CrossRef]
- GB51245-2017; Unified Standard for Energy Saving Design of Industrial Buildings. China Planning Press: Beijing, China, 2017.
- GB50059-2012; 35~110 kV Substation Design Code. China Planning Press: Beijing, China, 2012.
- DL/T5218-2012; Technical Regulations for the Design of 220~750 kV Substation. China Planning Press: Beijing, China, 2012.
- GB50019-2015; Design Code for Heating, Ventilation and Air Conditioning of Industrial Buildings. China Planning Press: Beijing, China, 2012.
- An, Y. Thermal Performance Research and Optimization Design of U-Shaped Glass Vacuum Tube Solar Collector; Beijing Institute of Civil Engineering and Architecture: Beijing, China, 2011. [Google Scholar]
- GB/T 37526-2019; Assessment Method for Solar Energy Resource. State Administration for Maket Regulation. Standardization Administration: Beijing, China, 2016.
- GB 50797-2012; Design Code for Photovoltaic Power Station. China Planning Press: Beijing, China, 2012.
- Zhang, Q.; Li, Y.; Liu, B.; Di, H. Study on suitability of low temperature air source heat pump heating method in northern heating area. Build. Sci. 2015, 31, 140–145. [Google Scholar]
- GB50229-2019; Fire Protection Standard for Design of Thermal Power Plants and Substations. China Planning Press: Beijing, China, 2019.
- GB/T25127.1; Low Ambient Temperature Air Source Heat Pump (Water Chilling) Packages—Part 1: Heat Pump (Water Chilling) Packages for Industrial & Commercial and Similar Application. State Administration for Market Regulation. Standardization Administration: Beijing, China, 2020.


Disclaimer/Publisher’s Note: The statements, opinions and data contained in all publications are solely those of the individual author(s) and contributor(s) and not of MDPI and/or the editor(s). MDPI and/or the editor(s) disclaim responsibility for any injury to people or property resulting from any ideas, methods, instructions or products referred to in the content. |
© 2024 by the authors. Licensee MDPI, Basel, Switzerland. This article is an open access article distributed under the terms and conditions of the Creative Commons Attribution (CC BY) license (https://creativecommons.org/licenses/by/4.0/).