
Assessing Extreme Drought Events and Their Temporal Impact: Before and after the Operation of a Hydropower Plant


 ,
,  ,
, 
Abstract
1. Introduction
2. Case Study
3. Materials and Methods
3.1. Available Information
3.2. Drought Hydrographs
3.3. Probability Distributions, Fit Methods, and Inferential Statistics
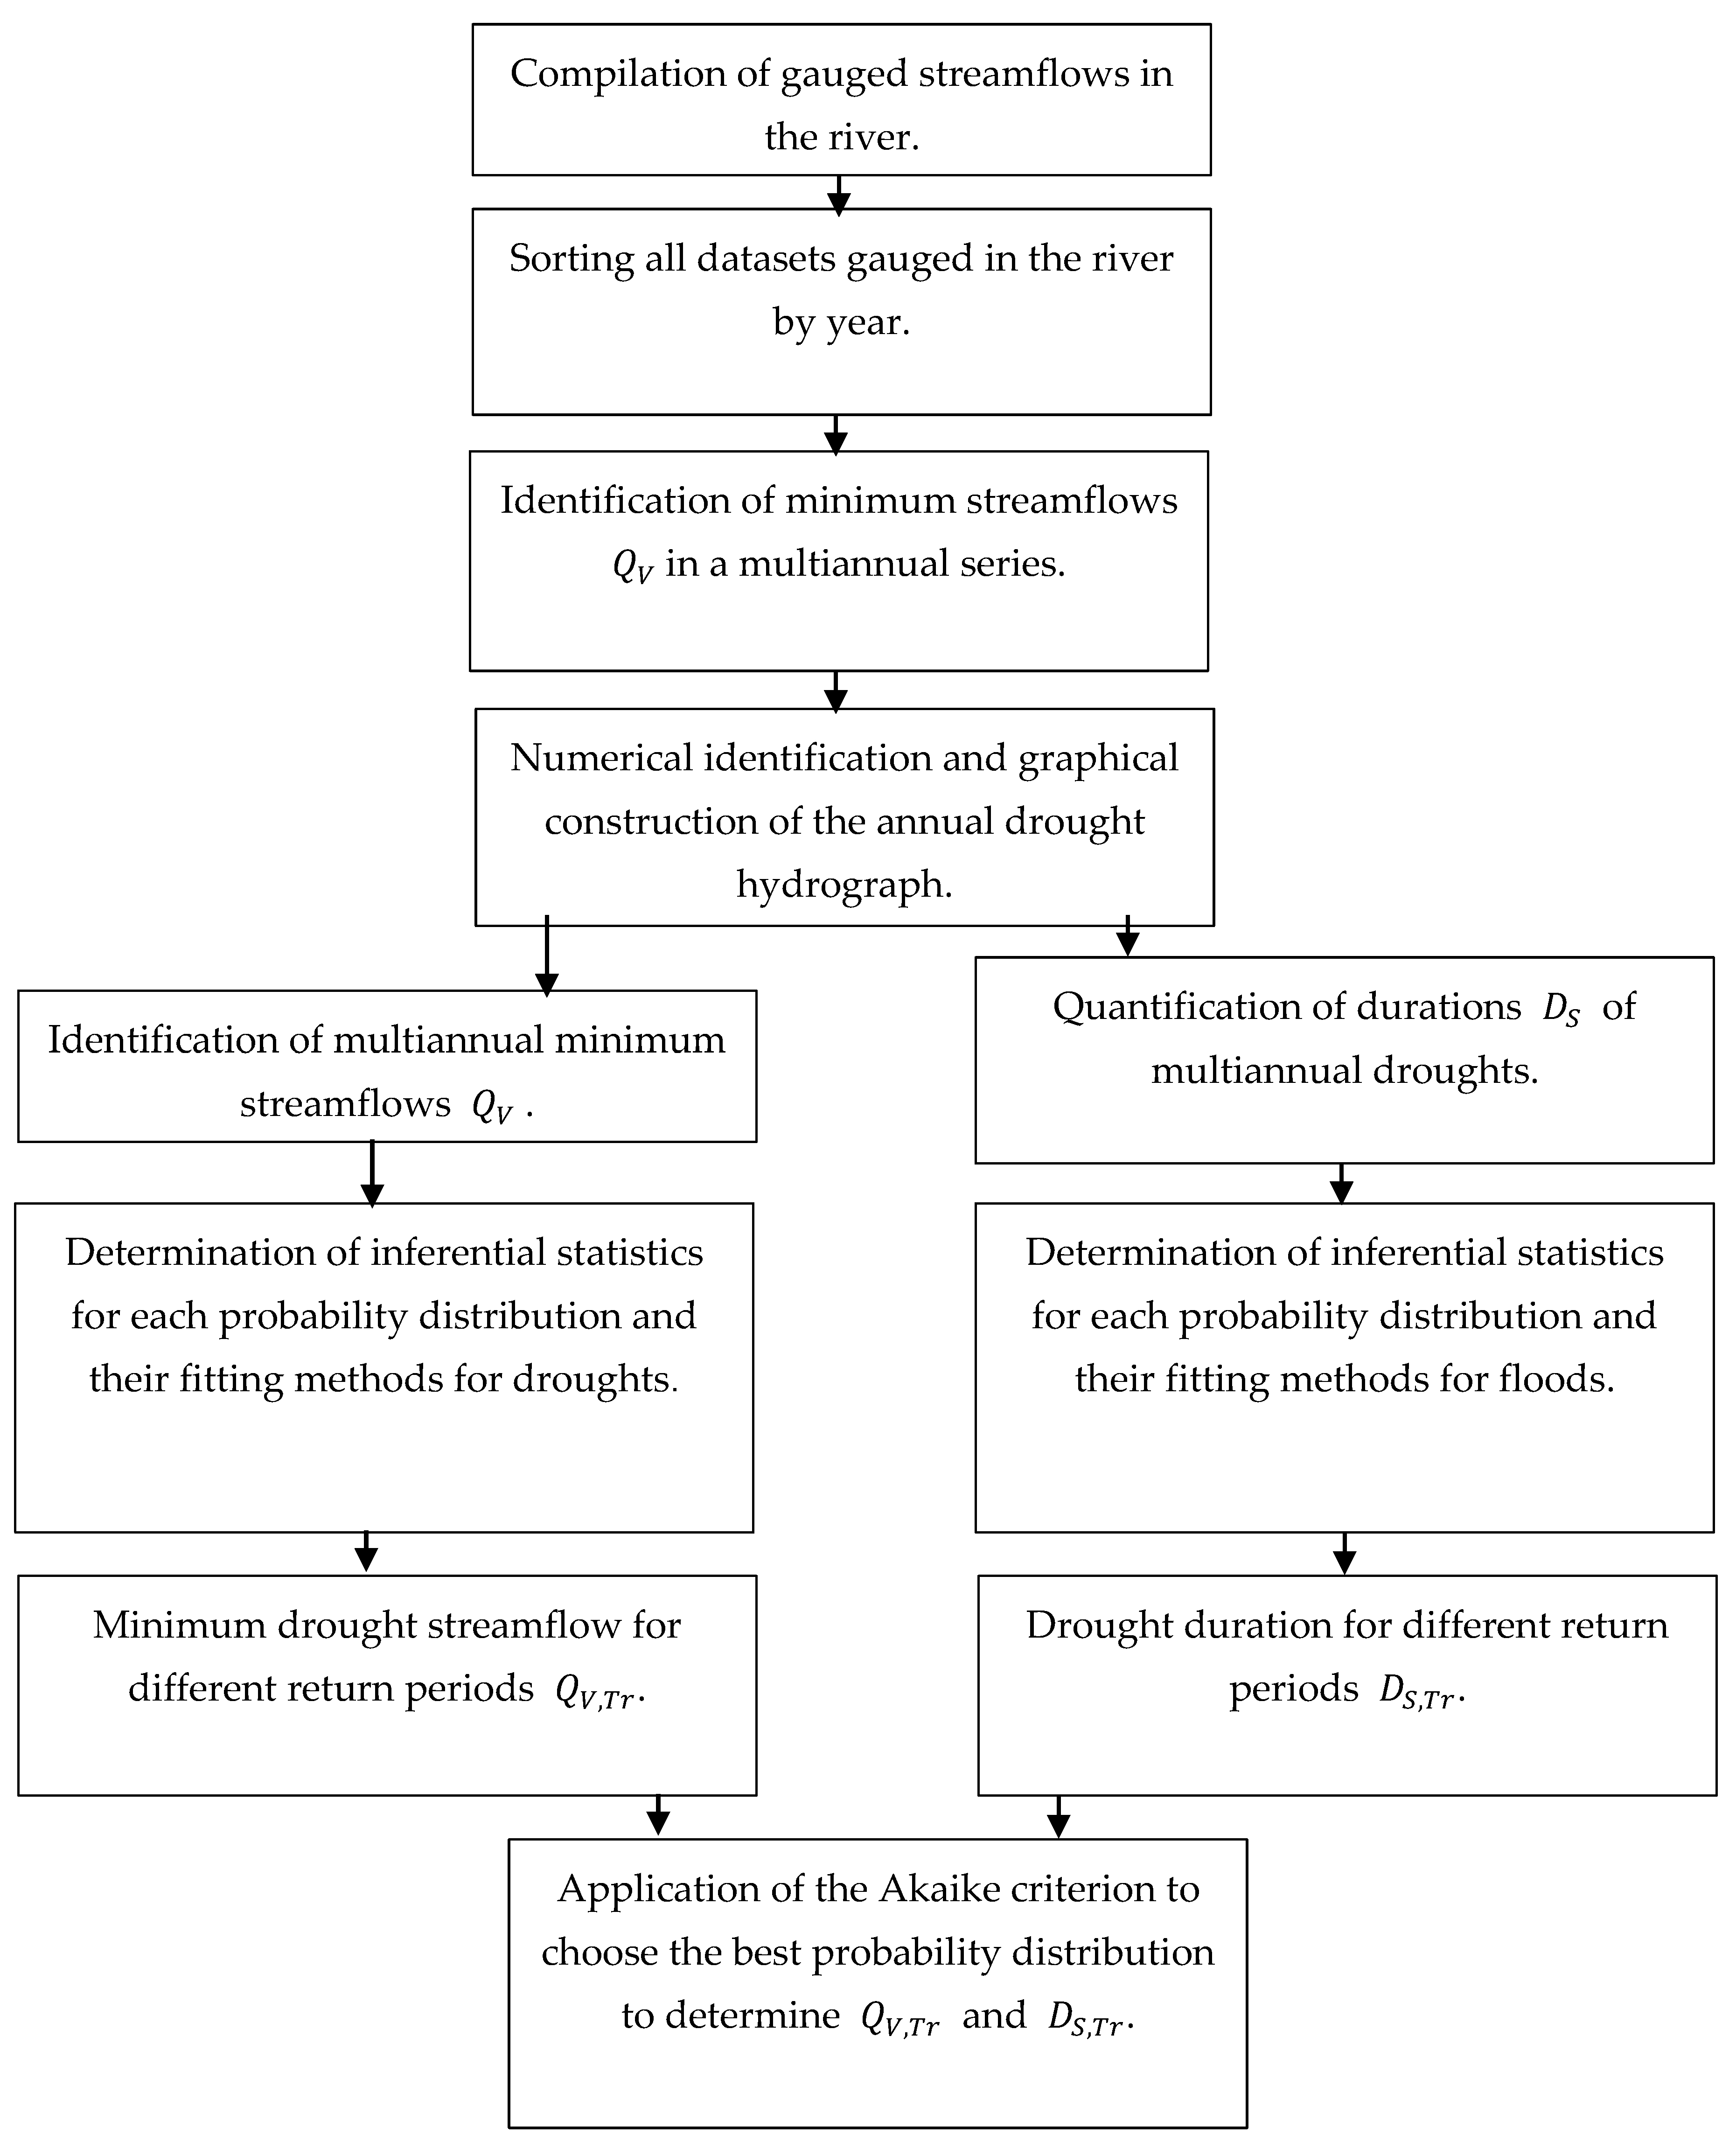
3.4. Methodological Flow Chart
4. Results
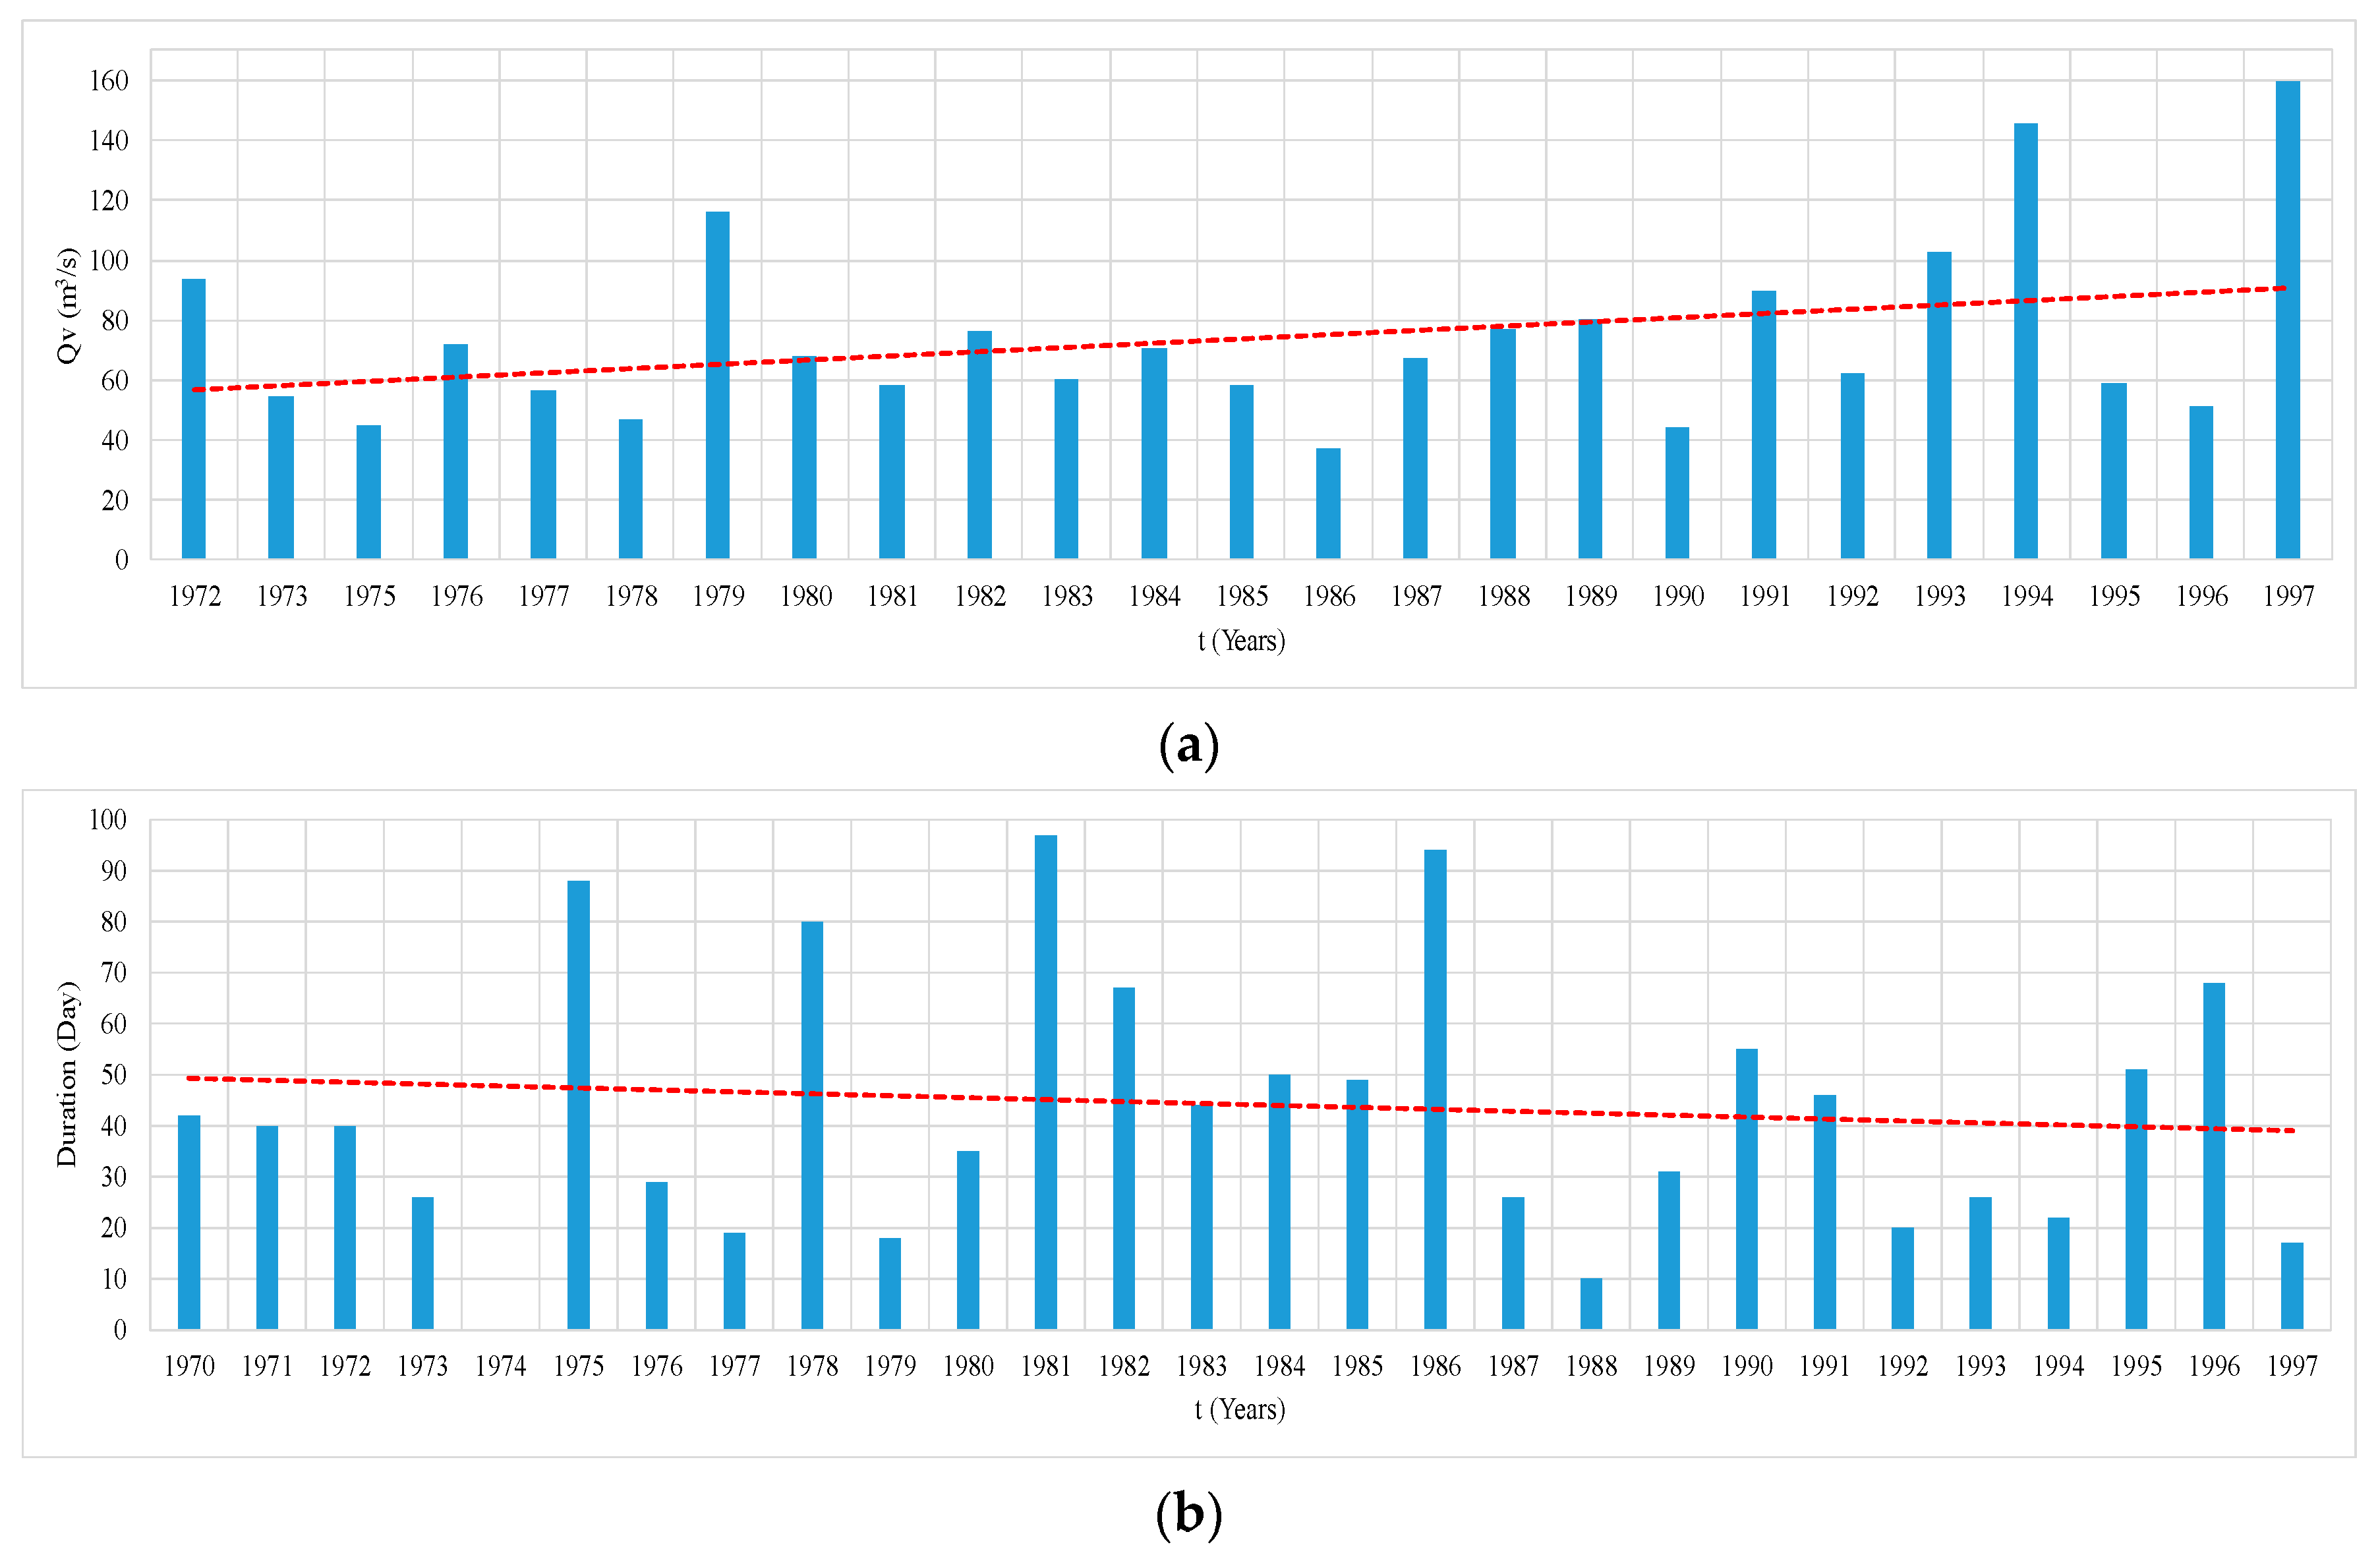
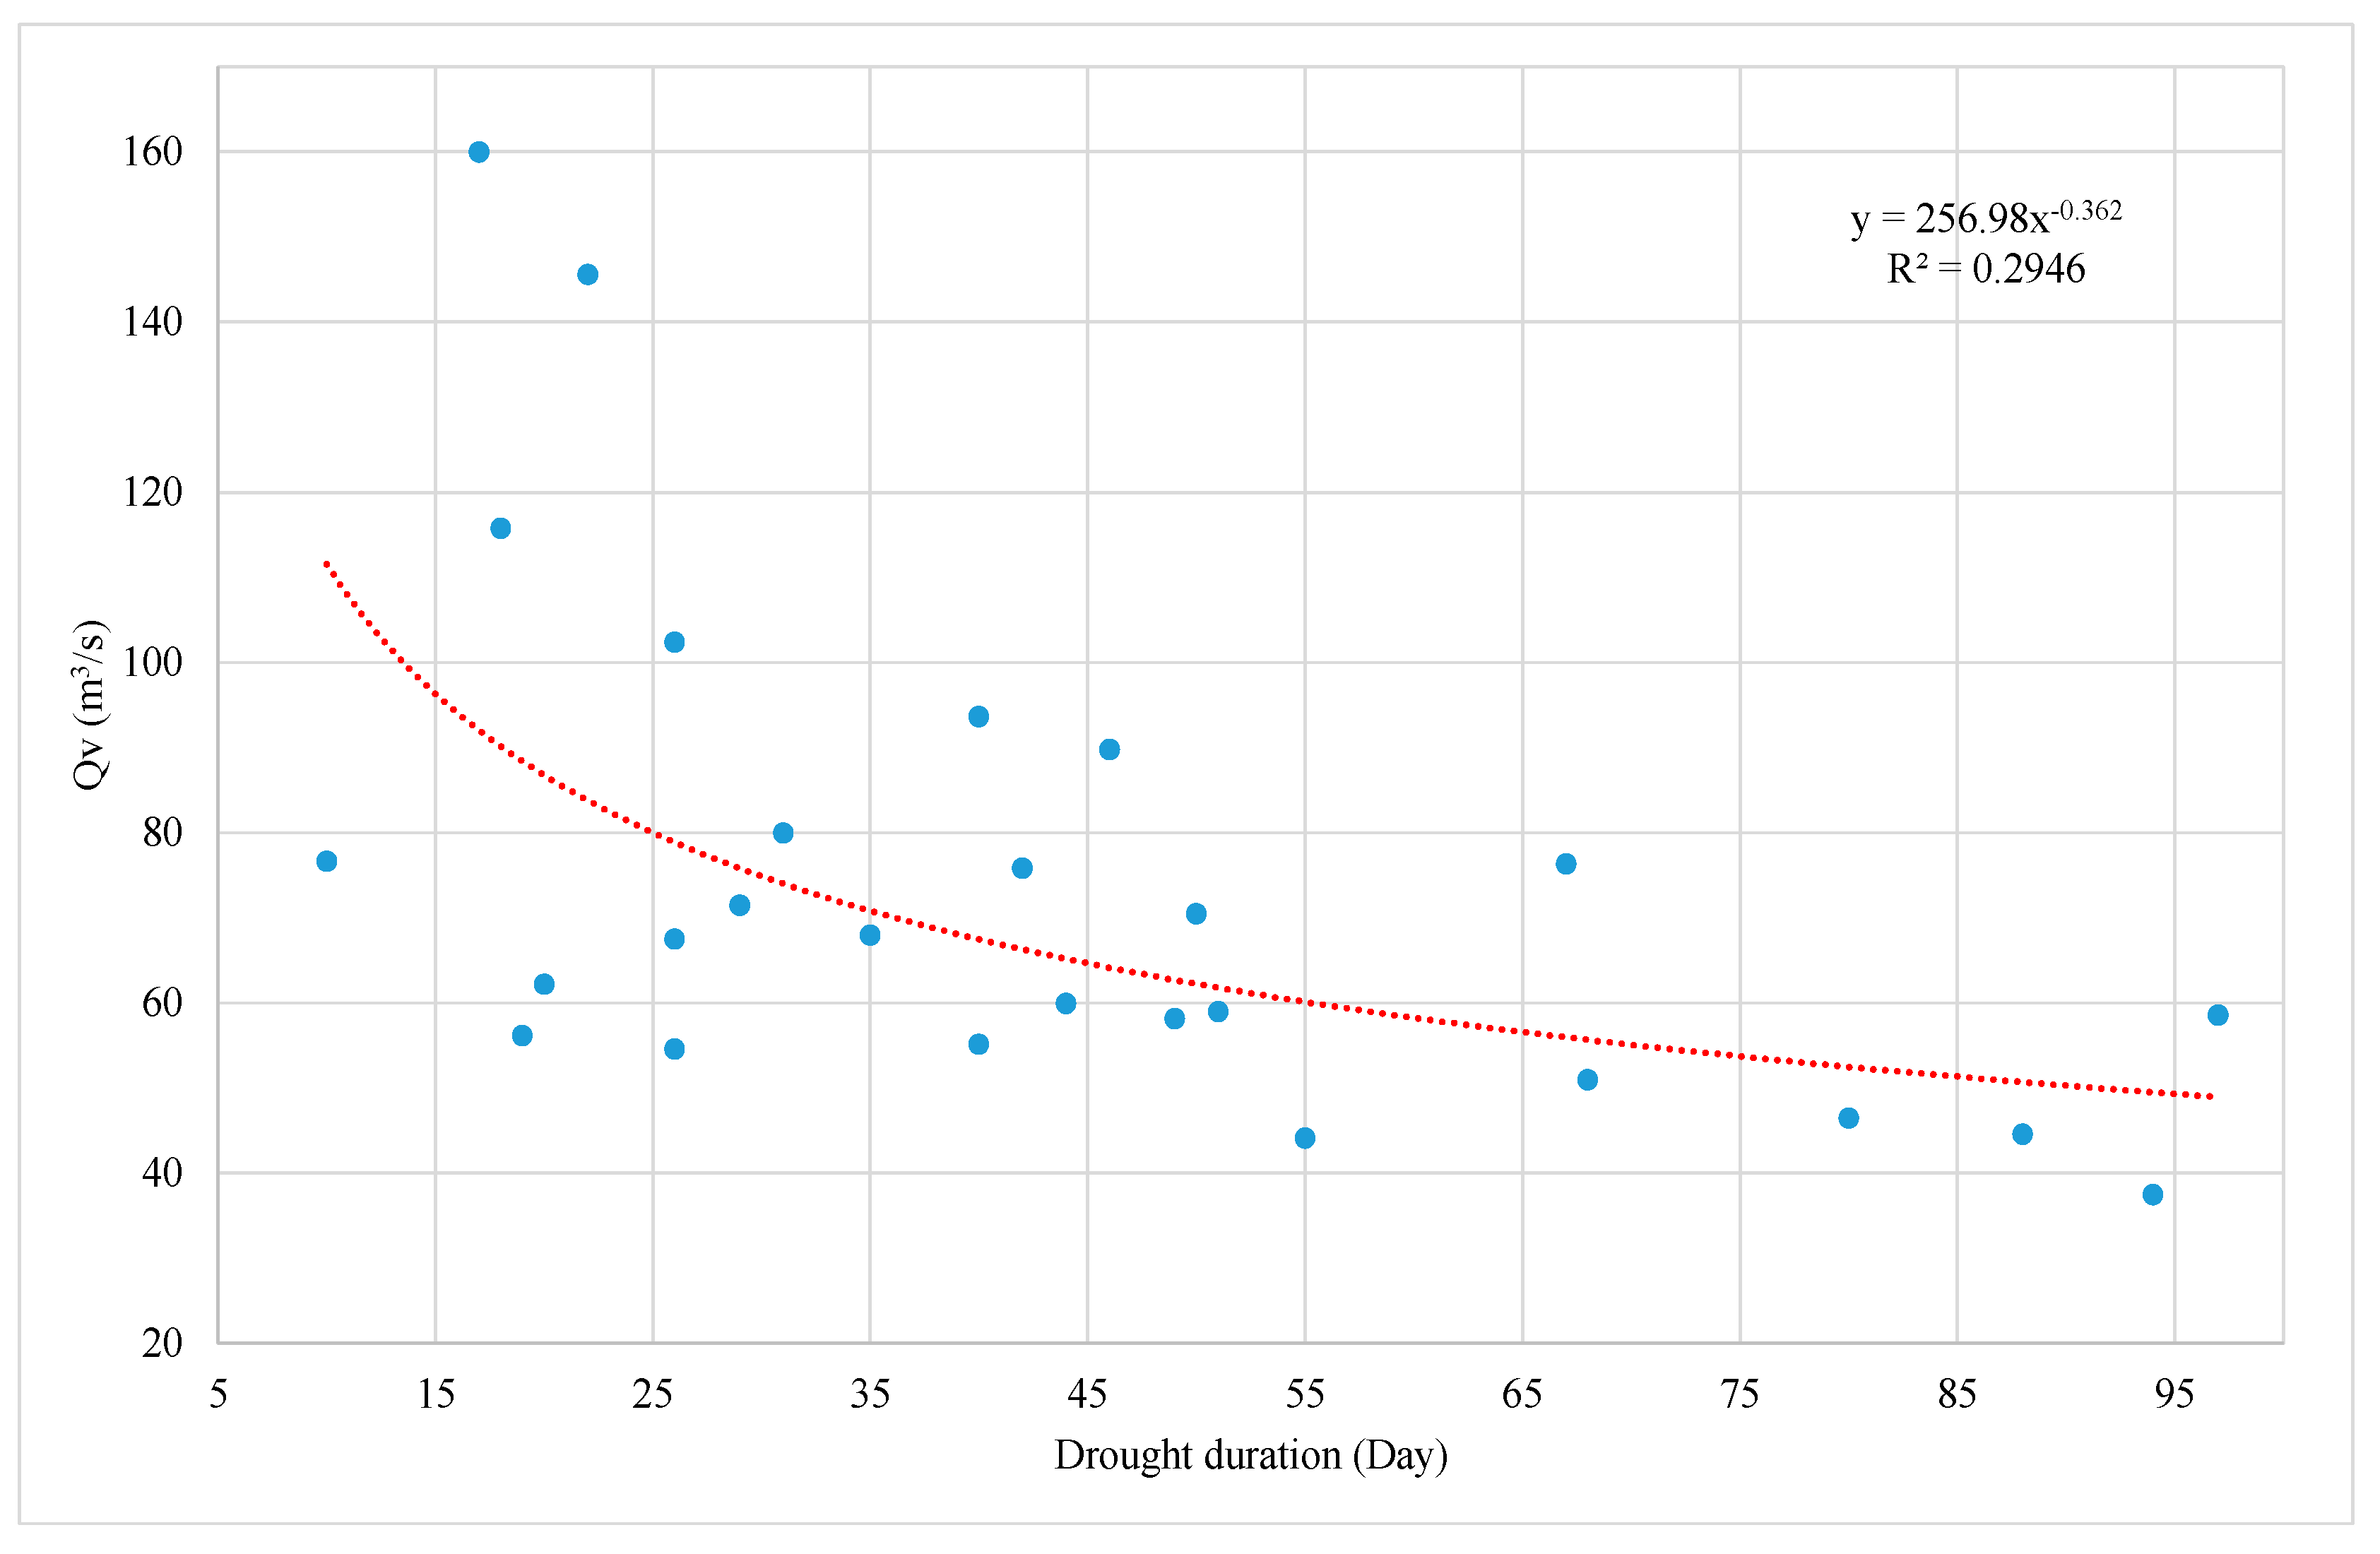
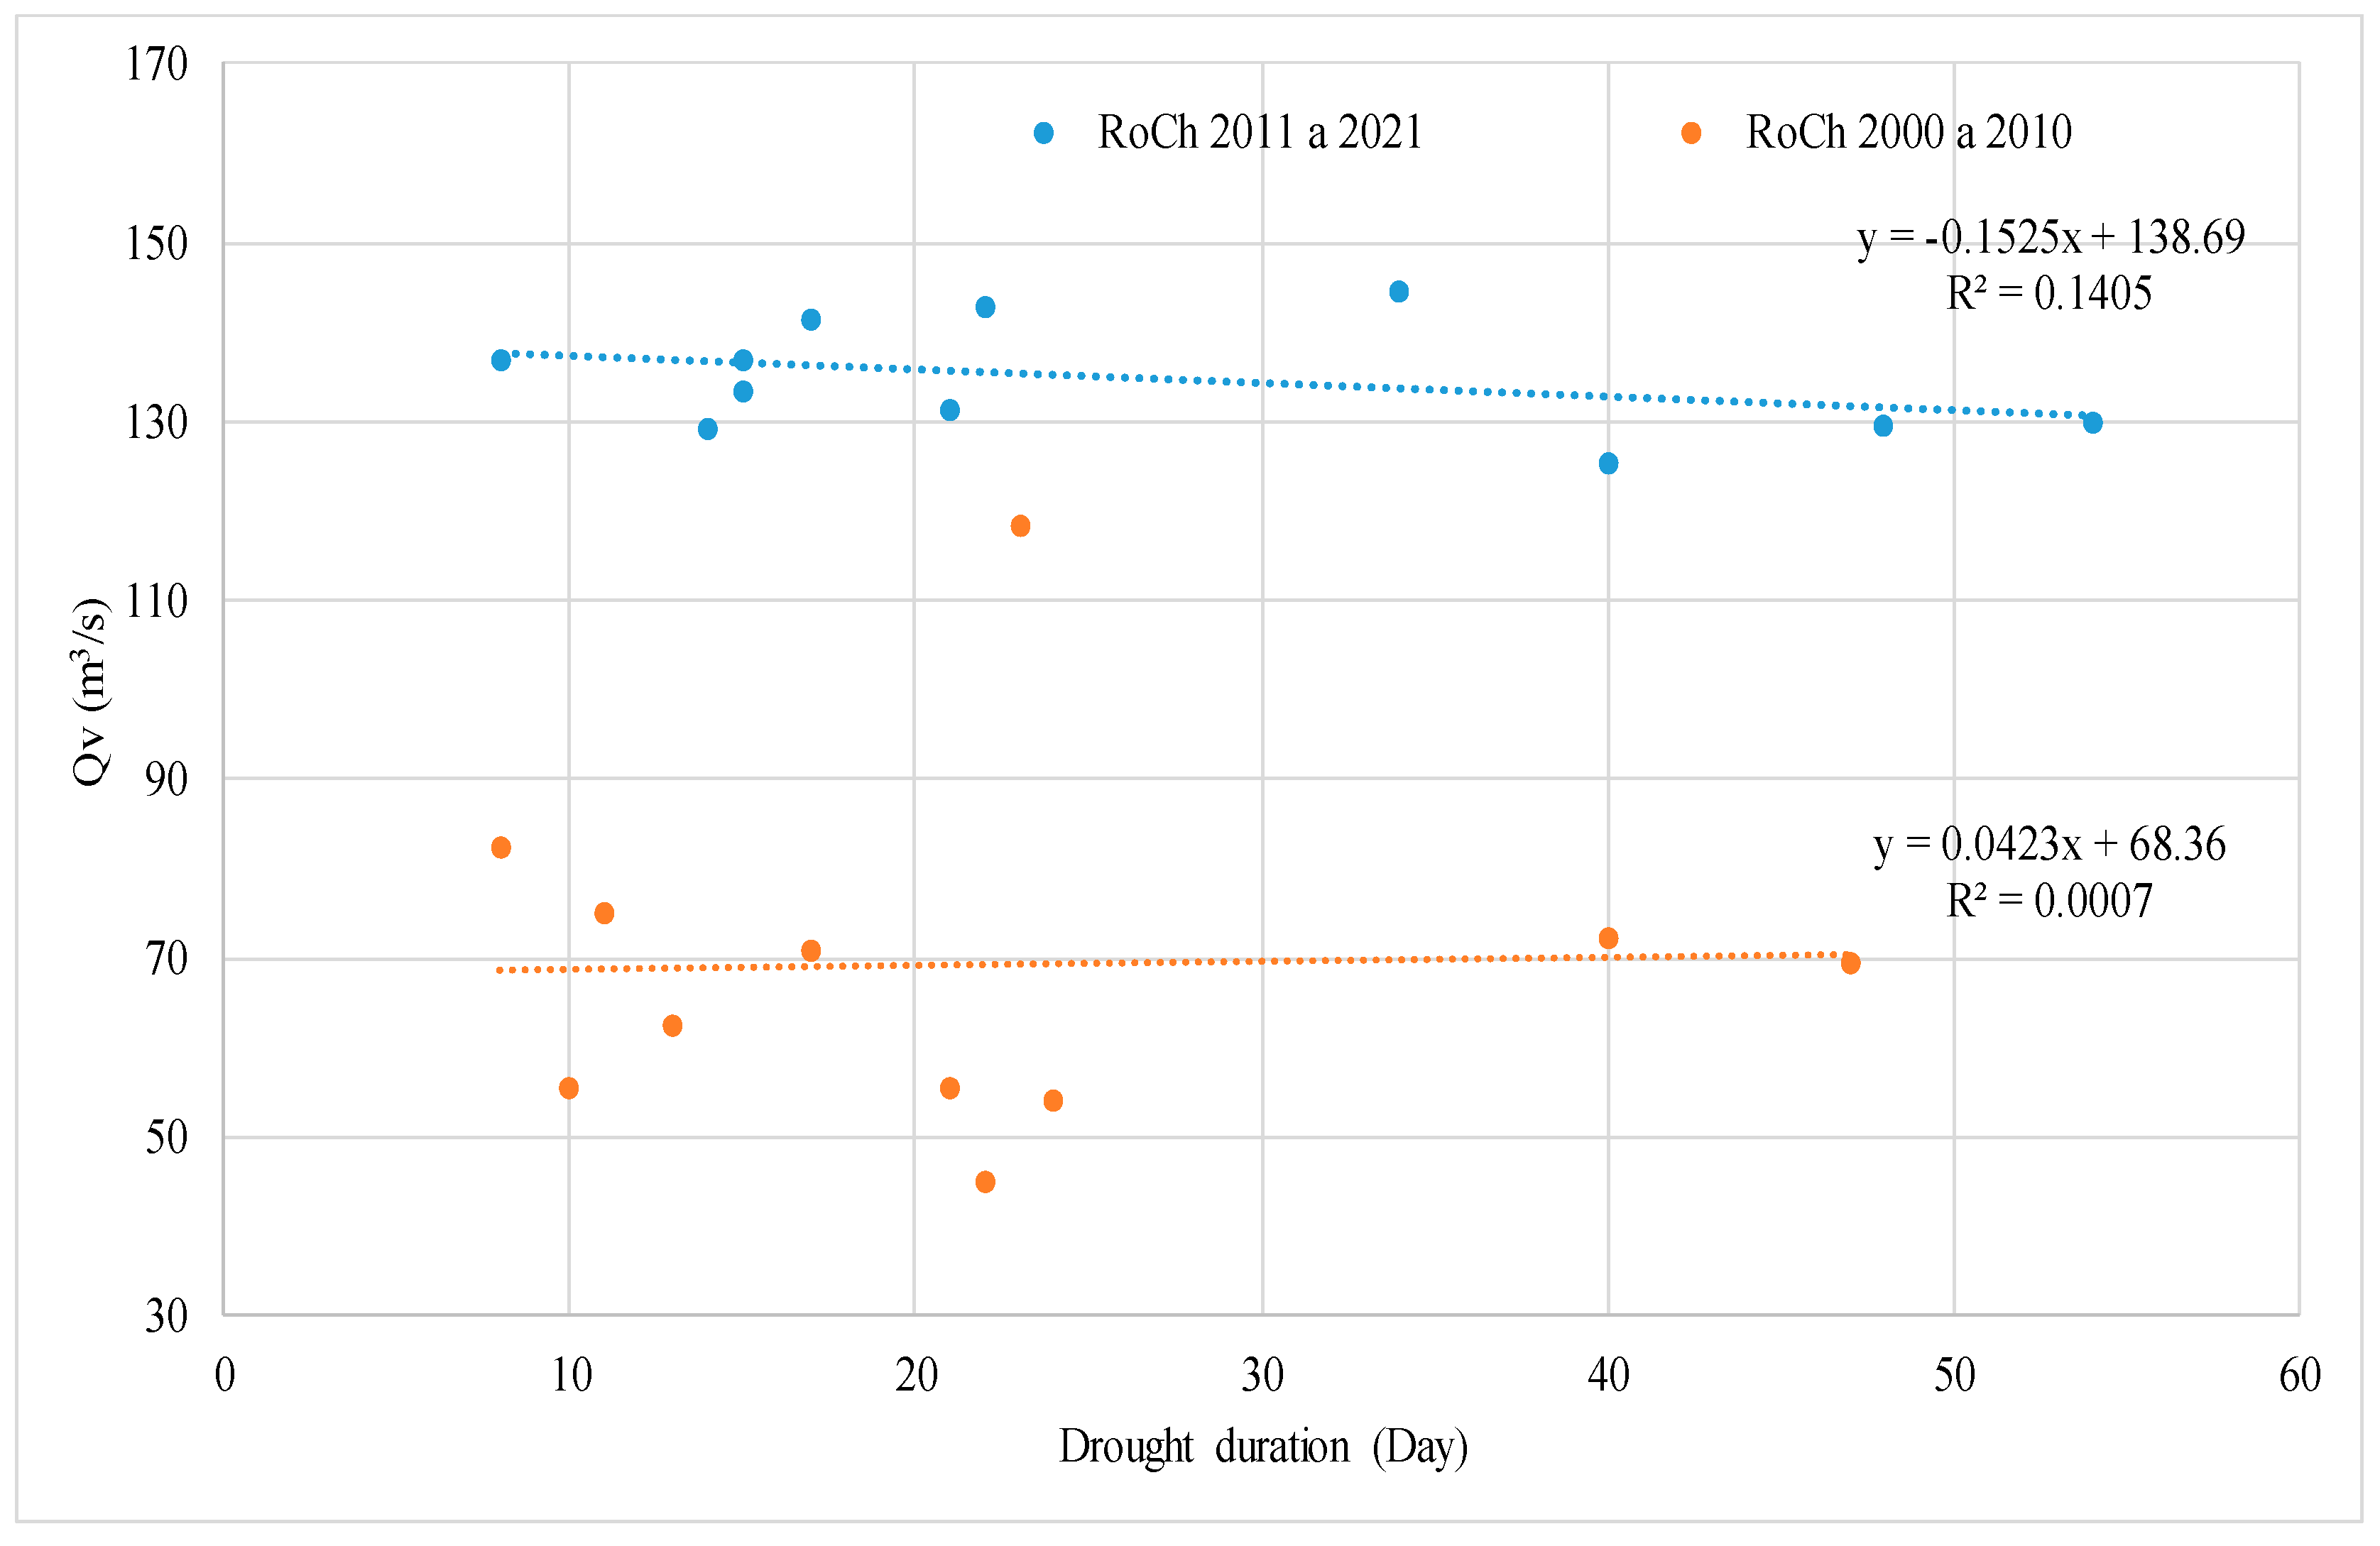
4.1. Minimum Streamflows and Drought Durations
4.2. Extreme Values for Different Return Periods
4.2.1. Minimum Streamflows
4.2.2. Drought Durations of the Sinú River
5. Discussion
Author Contributions
Funding
Institutional Review Board Statement
Informed Consent Statement
Data Availability Statement
Conflicts of Interest
Appendix A


References
- Brubaker, K.L.; Entekhabi, D.; Eagleson, P.S. Estimation of continental precipitation recycling. J. Clim. 1993, 6, 1077–1089. [Google Scholar] [CrossRef]
- Entekhabi, D.; Rodriguez-Iturbe, I.; Bras, R.L. Variability in large-scale water balance with land surface-atmosphere interaction. J. Clim. 1992, 5, 798–813. [Google Scholar] [CrossRef]
- Namias, J. Some causes of United States drought. J. Appl. Meteorol. Climatol. 1983, 22, 30–39. [Google Scholar] [CrossRef]
- Yang, G.; Block, P. Enhancing season-ahead streamflow forecasts with GCMs, climate indices, and their interactions. J. Water Resour. Plan. Manag. 2023, 149, 04023055. [Google Scholar] [CrossRef]
- Wong, G.; Van Lanen, H.A.J.; Torfs, P.J.J.F. Probabilistic analysis of hydrological drought characteristics using meteorological drought. Hydrol. Sci. J. 2013, 58, 253–270. [Google Scholar] [CrossRef]
- Sun, H.; Sun, X.; Chen, J.; Deng, X.; Yang, Y.; Qin, H.; Chen, F.; Zhang, W. Different types of meteorological drought and their impact on agriculture in Central China. J. Hydrol. 2023, 627, 130423. [Google Scholar] [CrossRef]
- Rind, D.; Goldberg, R.; Hansen, J.; Rosenzweig, C.; Ruedy, R. Potential evapotranspiration and the likelihood of future drought. J. Geophys. Res. Atmos. 1990, 95, 9983–10004. [Google Scholar] [CrossRef]
- Palmer, W.C. Meteorological Drought; US Department of Commerce, Weather Bureau: Washington, DC, USA, 1965; Volume 30.
- Karl, T. Atlas of Monthly Palmer Moisture Anomaly Indices (1895–1930) for the Contiguous United States (Volume 3, No. 8–9); National Climatic Data Center: Asheville, NC, USA, 1985.
- Karl, T. Atlas of Monthly Palmer Hydrological Drought Indices (1931–1983) for the Contiguous United States (Volume 3); National Climatic Data Center: Asheville, NC, USA, 1985.
- Rajsekhar, D.; Singh, V.P.; Mishra, A.K. Hydrologic drought atlas for Texas. J. Hydrol. Eng. 2015, 20, 05014023. [Google Scholar] [CrossRef]
- Chow, V.T.; Maidment, D.R.; Mays, L.W. Applied Hydrology; McGraw-Hill: New York, NY, USA, 1988. [Google Scholar]
- Villalba-Barrios, A.F.; Coronado-Hernández, O.E.; Fuertes-Miquel, V.S.; Coronado-Hernández, J.R.; Ramos, H.M. Statistical Approach for Computing Base Flow Rates in Gaged Rivers and Hydropower Effect Analysis. Hydrology 2023, 10, 137. [Google Scholar] [CrossRef]
- Gupta, S.C.; Kapoor, V.K. Fundamentals of Mathematical Statistics; Sultan Chand & Sons: Delhi, India, 2020. [Google Scholar]
- Nguyen, H.T.; Rogers, G.S. Fundamentals of Mathematical Statistics: Probability for Statistics; Springer Science & Business Media: Berlin/Heidelberg, Germany, 2012. [Google Scholar]
- Archer, D.; Foster, M.; Faulkner, D.; Mawdsley, J. The synthesis of design flood hydrographs. In Proceedings of the ICE/CIWEM Conf. Flooding–Risks and Reactions; Terrace Dalton: London, UK, 2000. [Google Scholar]
- Weibull, W. A statistical distribution function of wide applicability. J. Appl. Mech. 1951, 18, 293–297. [Google Scholar] [CrossRef]
- Coles, S.; Bawa, J.; Trenner, L.; Dorazio, P. An Introduction to Statistical Modeling of Extreme Values; Springer: London, UK, 2001; Volume 208, p. 208. [Google Scholar]
- Gumbel, E.J. Statistics of Extremes; Courier Corporation: North Chelmsford, MA, USA, 2004. [Google Scholar]
- Grego, J.M.; Yates, P.A. Point and standard error estimation for quantiles of mixed flood distributions. J. Hydrol. 2010, 391, 289–301. [Google Scholar] [CrossRef]
- Coronado-Hernández, Ó.E.; Merlano-Sabalza, E.; Díaz-Vergara, Z.; Coronado-Hernández, J.R. Selection of hydrological probability distributions for extreme rainfall events in the regions of Colombia. Water 2020, 12, 1397. [Google Scholar] [CrossRef]
- El Adlouni, S.; Bobée, B. Hydrological Frequency Analysis Using HYFRAN-PLUS Software. User’s Guide Available with the Software DEMO. 2015. Available online: http://www.wrpllc.com/books/HyfranPlus/indexhyfranplus3.html (accessed on 8 August 2023).
- Seckin, N.; Yurtal, R.; Haktanir, T.; Dogan, A. Comparison of probability weighted moments and maximum likelihood methods used in flood frequency analysis for Ceyhan River Basin. Arab. J. Sci. Eng. 2010, 35, 49. [Google Scholar]
- Ji, X.; Jing, D.; Shen, H.W.; Salas, J.D. Plotting positions for Pearson type-III distribution. J. Hydrol. 1984, 74, 1–29. [Google Scholar]
- Greis, N.P. Flood frequency analysis: A review of 1979–1982. Rev. Geophys. 1983, 21, 699–706. [Google Scholar] [CrossRef]
- Chatfield, C. Statistics for Technology: A Course in Applied Statistics; Routledge: London, UK, 2018. [Google Scholar]
- Tong, Y.L. Engineering Statistics; Mathematics for Mechanical Engineers; Taylor and Francis Group: New York, NY, USA, 2022; pp. 11-1–11-12. [Google Scholar]
- Wagenmakers, E.J.; Farrell, S. AIC model selection using Akaike weights. Psychon. Bull. Rev. 2004, 11, 192–196. [Google Scholar] [CrossRef] [PubMed]
- Obeysekera, J.; Salas, J. Hydrologic designs for extreme events under nonstationarity. In Engineering Methods for Precipitation under a Changing Climate; Florida International University: Miami, FL, USA, 2020; pp. 63–82. [Google Scholar]
- Paredes-Trejo, F.; Olivares, B.O.; Movil-Fuentes, Y.; Arevalo-Groening, J.; Gil, A. Assessing the Spatiotemporal Patterns and Impacts of Droughts in the Orinoco River Basin Using Earth Observations Data and Surface Observations. Hydrology 2023, 10, 195. [Google Scholar] [CrossRef]
- Geng, G.; Zhang, B.; Gu, Q.; He, Z.; Zheng, R. Drought propagation characteristics across China: Time, probability, and threshold. J. Hydrol. 2024, 631, 130805. [Google Scholar] [CrossRef]


| 1972–1999 | 2000–2021 | ||
|---|---|---|---|
| Year | Year | ||
| 1972 | 75.88 | 2000 | 72.40 |
| 1973 | 55.20 | 2001 | 118.40 |
| 1974 | 93.74 | 2002 | 69.60 |
| 1975 | 54.60 | 2003 | 45.00 |
| 1976 | 2004 | 55.60 | |
| 1977 | 44.60 | 2005 | 71.00 |
| 1978 | 71.50 | 2006 | 75.20 |
| 1979 | 56.20 | 2007 | 55.60 |
| 1980 | 46.50 | 2008 | 54.20 |
| 1981 | 115.80 | 2009 | 62.60 |
| 1982 | 68.00 | 2010 | 82.35 |
| 1983 | 58.60 | 2011 | 144.35 |
| 1984 | 76.36 | 2012 | 137.00 |
| 1985 | 60.00 | 2013 | 133.50 |
| 1986 | 70.50 | 2014 | 137.00 |
| 1987 | 58.20 | 2015 | 133.50 |
| 1988 | 37.50 | 2016 | 137.00 |
| 1989 | 67.56 | 2017 | 129.25 |
| 1990 | 76.68 | 2018 | 130.70 |
| 1991 | 80.00 | 2019 | 125.50 |
| 1992 | 44.17 | 2020 | 129.50 |
| 1993 | 89.80 | 2021 | 130.30 |
| 1994 | 62.25 | ||
| 1995 | 102.40 | ||
| 1996 | 145.60 | ||
| 1997 | 59.00 | ||
| 1998 | 51.00 | ||
| 1999 | 160.00 | ||
| 1970–1999 | 2000–2021 | ||
|---|---|---|---|
| Year | Duration (Days) | Year | Duration (Days) |
| 1972 | 42 | 2000 | 40 |
| 1973 | 40 | 2001 | 23 |
| 1974 | 40 | 2002 | 47 |
| 1975 | 26 | 2003 | 22 |
| 1976 | Not available | 2004 | 21 |
| 1977 | 88 | 2005 | 17 |
| 1978 | 29 | 2006 | 11 |
| 1979 | 19 | 2007 | 10 |
| 1980 | 80 | 2008 | 24 |
| 1981 | 18 | 2009 | 13 |
| 1982 | 35 | 2010 | 8 |
| 1983 | 97 | 2011 | 34 |
| 1984 | 67 | 2012 | 22 |
| 1985 | 44 | 2013 | 17 |
| 1986 | 50 | 2014 | 8 |
| 1987 | 49 | 2015 | 15 |
| 1988 | 94 | 2016 | 15 |
| 1989 | 26 | 2017 | 14 |
| 1990 | 10 | 2018 | 21 |
| 1991 | 31 | 2019 | 40 |
| 1992 | 55 | 2020 | 48 |
| 1993 | 46 | 2021 | 54 |
| 1994 | 20 | ||
| 1995 | 26 | ||
| 1996 | 22 | ||
| 1997 | 51 | ||
| 1998 | 68 | ||
| 1999 | 17 | ||
| Probability Distribution | Formulation | Equation Number |
|---|---|---|
| Weibull | : Probability density function, : Randon variable, : scale parameter, : parameter of the distribution. | (1) |
| GEV | : Probability density function, : Randon variable, : mean of the data, : scale parameter, : shape parameter. | (2) |
| Gumbel | : Probability, : Randon variable, : mean of the data, : scale parameter | (3) |
| Normal | : Probability density function, : Randon variable, : parameter of the distribution, : standard deviation. | (4) |
| Log-normal | : Probability density function, : Randon variable, : parameter of the distribution, : standard deviation. | (5) |
| Three-parameter log-normal | : Probability density function, : Randon variable, : arithmetic average, : parameter of the distribution, : standard deviation. | (6) |
| Gamma | : Probability density function, : Randon variable, : gamma function, : shape parameter, : scale parameter. | (7) |
| Generalized gamma | : Probability density function, : Randon variable, : gamma function, : shape parameter, : scale parameter, : standard deviation. | (8) |
| Inverse gamma | : Probability density function, : Randon variable, : gamma function, : shape parameter, : scale parameter. | (9) |
| Pearson type III | : Probability density function, : Randon variable, : mean of the data, : scale parameter, : shape parameter, : gamma function, : location parameter. | (10) |
| Log Pearson type III | : Probability density function, : Randon variable, : mean of the data, : scale parameter, : shape parameter, : gamma function, : location parameter. | (11) |
| Fitting Method | Formulation | Equation Number |
|---|---|---|
| Maximum likelihood | : likelihood function, : derivative of the logarithm of the function | (12) |
| Moments | : Moments, : data number, : ith data observed, : data observed, : mean, : standard deviation, : expected value operator. | (13) |
| Weighted moments | (14) | |
| Method of moments (BOB) | : Moments, : data number, : ith data observed, : is its non-exceedance probability estimated. : Moments, : data number, : ith data observed, : is its non-exceedance probability estimated. | (15) |
| WRC | : weighting coefficient, : true variance, : minimum variance. | (16) |
| Statistics | Formulation | Equation Number |
|---|---|---|
| : Chi-squared | : Chi-square statistic, : is the observed number of events in the ith sub-interval, : is the number of events, k: is an integer number for sub-intervals. | (17) |
| : Coefficient of variation | : coefficient of variation, : observed variable, : arithmetic average, n: data number. | (18) |
| : Skewness coefficient | : skewness coefficient, : observed variable, : arithmetic average, n: data number, k: number of classes, : mode. | (19) |
| : Kurtosis coefficient | : kurtosis coefficient, : observed variable, : arithmetic average, n: data number, S: standard deviation. | (20) |
| Akaike Information Criterion (AIC) | : the maximized value of the likelihood function for the model, : number of parameters | (21) |
| Probability Dist. | Fitting Method | Statistics | |||
|---|---|---|---|---|---|
| Weibull | MV | 9.56 | 0.411 | 0.308 | 2.81 |
| MM | 9.56 | 0.041 | 0.279 | 2.79 | |
| GEV | MVA | 1.26 | 0.43 | 3.6 | 51.3 |
| MM | 4.37 | 0.401 | 1.63 | 8.51 | |
| MMP | 2.81 | 0.454 | 4.54 | 14.3 | |
| Gumbel | MVA | 1.26 | 0.346 | 1.14 | 2.4 |
| MM | 3.33 | 0.401 | 1.14 | 2.4 | |
| MMP | 2.3 | 0.385 | 1.14 | 2.4 | |
| Normal | MVA | 9.04 | 0.401 | 0 | 3 |
| Log-normal | MVA | 1.26 | 0.362 | 1.13 | 5.36 |
| Three-parameter log-normal | MVA | 3.33 | 0.4 | 2.17 | 12.4 |
| MM | 4.37 | 0.401 | 1.63 | 8.1 | |
| Gamma | MV | 1.78 | 0.353 | 0.707 | 3.75 |
| MM | 5.41 | 0.401 | 0.802 | 3.96 | |
| Inverse Gamma | MV | 2.3 | 0.37 | 1.72 | 9.38 |
| Generalized Gamma | MV | 209.3 | 0.433 | 3.94 | 91.3 |
| MM | 219.5 | 0.401 | 1.63 | 8.53 | |
| Pearson type III | MV | 3.85 | 0.38 | 1.46 | 6.19 |
| MM | 5.41 | 0.401 | 1.63 | 7.01 | |
| Log Pearson type III | SAM | 2.81 | 0.404 | 2.4 | 17.4 |
| BOB | 3.85 | 0.393 | 1.54 | 7.76 | |
| WRC | 3.33 | 0.42 | 2.7 | 21.1 | |
| Tr (Years) | (m3/s) | |||
|---|---|---|---|---|
| Before the Operation of the Hydropower Plant | After the Operation of the Hydropower Plant | |||
| 1970–1999 | 2000–2021 | 2000–2010 | 2011–2021 | |
| 500 | 25.00 | 12.30 | 35.40 | 117.00 |
| 100 | 30.30 | 21.90 | 39.50 | 120.00 |
| 50 | 33.30 | 28.20 | 41.80 | 122.00 |
| 20 | 38.50 | 39.80 | 45.50 | 124.00 |
| 10 | 43.70 | 52.00 | 49.20 | 126.00 |
| 5 | 51.00 | 68.90 | 54.30 | 129.00 |
| Tr | (Day) | ||
|---|---|---|---|
| Before the Operation of the Hydropower Plant | After the Operation of the Hydropower Plant | ||
| 1970–1999 | 2000–2010 | 2011–2021 | |
| 500 | 155.00 | 67.70 | 86.50 |
| 100 | 124.00 | 55.50 | 70.50 |
| 50 | 111.00 | 50.10 | 63.30 |
| 20 | 92.00 | 43.50 | 53.40 |
| 10 | 77.30 | 36.40 | 45.40 |
| 5 | 61.60 | 29.90 | 36.90 |
Disclaimer/Publisher’s Note: The statements, opinions and data contained in all publications are solely those of the individual author(s) and contributor(s) and not of MDPI and/or the editor(s). MDPI and/or the editor(s) disclaim responsibility for any injury to people or property resulting from any ideas, methods, instructions or products referred to in the content. |
© 2024 by the authors. Licensee MDPI, Basel, Switzerland. This article is an open access article distributed under the terms and conditions of the Creative Commons Attribution (CC BY) license (https://creativecommons.org/licenses/by/4.0/).
Share and Cite
Villalba-Barrios, A.F.; Coronado Hernández, O.E.; Fuertes-Miquel, V.S.; Arrieta-Pastrana, A.; Ramos, H.M. Assessing Extreme Drought Events and Their Temporal Impact: Before and after the Operation of a Hydropower Plant. Appl. Sci. 2024, 14, 1692. https://doi.org/10.3390/app14051692
Villalba-Barrios AF, Coronado Hernández OE, Fuertes-Miquel VS, Arrieta-Pastrana A, Ramos HM. Assessing Extreme Drought Events and Their Temporal Impact: Before and after the Operation of a Hydropower Plant. Applied Sciences. 2024; 14(5):1692. https://doi.org/10.3390/app14051692
Chicago/Turabian StyleVillalba-Barrios, Andrés F., Oscar E. Coronado Hernández, Vicente S. Fuertes-Miquel, Alfonso Arrieta-Pastrana, and Helena M. Ramos. 2024. "Assessing Extreme Drought Events and Their Temporal Impact: Before and after the Operation of a Hydropower Plant" Applied Sciences 14, no. 5: 1692. https://doi.org/10.3390/app14051692
APA StyleVillalba-Barrios, A. F., Coronado Hernández, O. E., Fuertes-Miquel, V. S., Arrieta-Pastrana, A., & Ramos, H. M. (2024). Assessing Extreme Drought Events and Their Temporal Impact: Before and after the Operation of a Hydropower Plant. Applied Sciences, 14(5), 1692. https://doi.org/10.3390/app14051692