Article

Enhancing Soft Tissue Differentiation with Different Dual-Energy CT Systems: A Phantom Study

by
Pasqualina Gallo
1,2,†,
Andrea D’Alessio
3,†,
Riccardo Pascuzzo
2,*,
Salvatore Gallo
4,*,‡,
Maria Luisa Fumagalli
2,
Ornella Ortenzia
5,
Chiara Tenconi
6,
Claudia Cavatorta
6,
Emanuele Pignoli
4,6,
Caterina Ghetti
5,
Maria Grazia Bruzzone
2 and
Elena De Martin
2
1
Department of Radiotherapy and Radiosurgery, Humanitas Research Center-IRCCS, Via G. Manzoni 56, Rozzano, 20089 Milan, Italy
2
Fondazione IRCCS Istituto Neurologico Carlo Besta, Via G. Celoria 11, 20133 Milan, Italy
3
Medical Physics Department, University Hospital “Maggiore della Carità”, Corso G. Mazzini 18, 28100 Novara, Italy
4
Physics Department “Aldo Pontremoli”, University of Milano, Via G. Celoria 16, 20133 Milan, Italy
5
Medical Physics Department, University Hospital of Parma, Via A. Gramsci 14, 43126 Parma, Italy
6
Medical Physics Department, Fondazione IRCCS Istituto Nazionale dei Tumori, Via G. Venezian 1, 20133 Milan, Italy
*
Authors to whom correspondence should be addressed.
These authors contributed equally to this work.
Current address: Physics and Astronomy Department “Ettore Majorana”, University of Catania, Via S. Sofia 64, 95125 Catania, Italy.
Appl. Sci. 2024, 14(5), 1724; https://doi.org/10.3390/app14051724
Submission received: 28 December 2023 / Revised: 16 February 2024 / Accepted: 18 February 2024 / Published: 20 February 2024
(This article belongs to the Special Issue Medical Physics: Latest Advances and Prospects)

Abstract

:
To quantitatively evaluate the possible advantages of quantifying and differentiating various soft tissues using virtual monochromatic images (VMI) derived from different dual-energy computed tomography (DECT) technologies. This study involved four DECT scanners with different technologies. CIRS phantom images were acquired in single-energy (SECT) and DECT modes with each scanner. The analysis focused on five equivalent soft-tissue inserts: adipose, breast, liver, muscle, and bone (200 mg). The signal-to-noise ratio (SNR) was calculated for each equivalent soft-tissue insert. Finally, the contrasts of tissue pairs between DECT and SECT images were compared using Wilcoxon signed-rank tests adjusted for multiple comparisons. Average CT numbers and noise showed a significant difference pattern between DECT with respect to SECT for each CT scanner. Generally, energy levels of 70 keV or higher led to improved SNR in VMI for most of the equivalent soft-tissue inserts. However, energy levels of 40–50 keV showed significantly higher contrasts in most of the equivalent soft-tissue insert pairs. DECT images at low energies, especially at 40–50 keV, outperform SECT images in discriminating soft tissues across all four DECT technologies. The combined use of DECT images reconstructed at different energy levels provides a more comprehensive set of information for diagnostic and/or radiotherapy evaluation compared to SECT. Some differences between scanners are evident, depending on the DECT acquisition technique and reconstruction method.

1. Introduction

Computed tomography (CT) plays an important role in quantitative imaging research. However, materials with different elementary compositions can be represented by very similar CT numbers, hindering the differentiation and classification of biological tissues.
These difficulties are due to the similar linear attenuation coefficient, which depends on various factors such as the atomic composition of the material and photon energy.
In the diagnostic energy range (up to 150 keV), the attenuation of X-rays is dominated by two physical processes, the photoelectric effect and the Compton effect. The relative probability of photoelectric absorption is approximately proportional to Z3/E3, where Z is the atomic number and E is the energy of the incident photon. The relative probability of a Compton interaction increases, compared to photoelectric absorption, as the photon energy increases and is approximately proportional to the Z of the material. The attenuation coefficient is approximately a linear combination of these two probabilities. Two different materials that show a similar attenuation coefficient (which is not unique for any given material) on images acquired with one energy spectrum, may show substantial differences in their attenuation on the images acquired with two different spectra and, hence, may be easily differentiated [1,2].
Dual-energy computed tomography (DECT) is a valuable technique that utilizes the dependence of the attenuation coefficient on photon energy to provide additional quantitative and qualitative information about material composition. It uses two different X-ray spectra to acquire two datasets of the same anatomic region, allowing analysis of energy-dependent changes in the attenuation of different materials. This has led to a transition from CT attenuation-based imaging to material-specific or spectral imaging that provides specific information about the composition of materials [3].
Clinical applications of DECT have become possible thanks to the overcoming of some technical issues, such as X-ray spectra generation time, difficulties in X-ray tube cooling, and management of the resulting data amount [4,5]. Today, five DECT diagnostic techniques are commercially available, based on single or double X-ray sources, dual detectors, or dual beam filters, depending on the manufacturer: sequential scans, fast kVp-switching, dual-layer detector, split filter, and dual source.
One of the earliest and simplest DECT systems was based on the sequential acquisition of high- and low-energy data by performing two consecutive scans with different tube potentials. This DECT mode can be obtained with any CT scanner since it does not require special hardware.
A DECT scanner equipped with fast kVp-switching acquires data with high- and low-energy spectra by modulating the X-ray generator voltage from low to high kVp between alternating projections.
When a dual-layer detector is present, the spectra energy separation is obtained by the detector itself and does not rely on different energies generated by the source. The detector configuration consists of two layers, one on top of another. The top layer preferentially absorbs lower-energy photons, while the bottom one absorbs the remaining photons with higher energy. This configuration takes advantage of the polychromatic nature of the X-ray beam and the fact that detector sensitivities are optimized for different energies.
A split-filter DECT consists of a single source–detector combination, and spectral separation is achieved by two filters of different materials that change the beam quality along the bed movement direction. The corresponding halves of the detector are then used for the detection of the low- and high-energy spectra.
A dual-source DECT consists of two perpendicular source-detector combinations, allowing for scanning the same volume simultaneously with high- and low-energy spectra. Each X-ray tube has its own high-voltage generator, allowing independent control of both kVp and tube current.
Several studies on phantoms and patients have evaluated the effect of the technical differences of the DECT platforms on spectral separation and performance [6,7,8,9,10,11,12,13,14,15].
Data resulting from the low- and high-energy acquisitions can be combined in multiple ways to produce images suitable for diagnostic radiology or radiotherapy treatment planning, encouraging the use of DECT imaging in clinical practice. It has been demonstrated that the virtual monochromatic images (VMI) reconstructed at energies greater than 100 keV allow for reducing beam hardening, scatter, and metal artifacts with respect to SECT imaging [16,17]. Moreover, VMI may even present a better quality as compared to a standard CT acquired at the same dose; when the optimal energy is selected, a better visualization of contrast-enhanced tissues and noise reduction can be obtained [18,19,20,21,22]. DECT data may also be used for the classification of materials [23,24]. The possibility to obtain the effective atomic number (Zeff) and electron density (ρel) maps of tissues yields a more precise dose calculation with protons and photons in radiotherapy [25,26]. Finally, DECT may be employed for the virtual suppression of the contrast medium to visualize which image regions were enhanced and how they would appear without iodine or, alternatively, to create maps reflecting the iodine distribution in tissues. The virtual non-contrast-enhanced DECT imaging is useful for a more accurate dose calculation in radiotherapy treatment planning to avoid the tissue composition manual attribution needed in iodine-enhanced structures [8,27,28].
Although several studies explored the potential of DECT images in diagnostic radiology for improving tasks such as iodine quantification and material differentiation, few have focused on the quantitative and qualitative assessment among different technologies. The aim of this study was to quantitatively investigate the advantages of VMI in differentiating various soft tissues compared to single-energy CT images (SECT), considering four CT scanners each representing a different DECT technology. We specifically aimed to find the optimal energy of VMI to differentiate soft tissues of multiple anatomical regions (e.g., breast, abdomen, and pelvis) with similar densities (from 0.96 g/cm3 of adipose to 1.16 g/cm3 of trabecular bone) across DECT technologies. Finally, an evaluation was conducted on the performance differences among the various scanners.

2. Materials and Methods
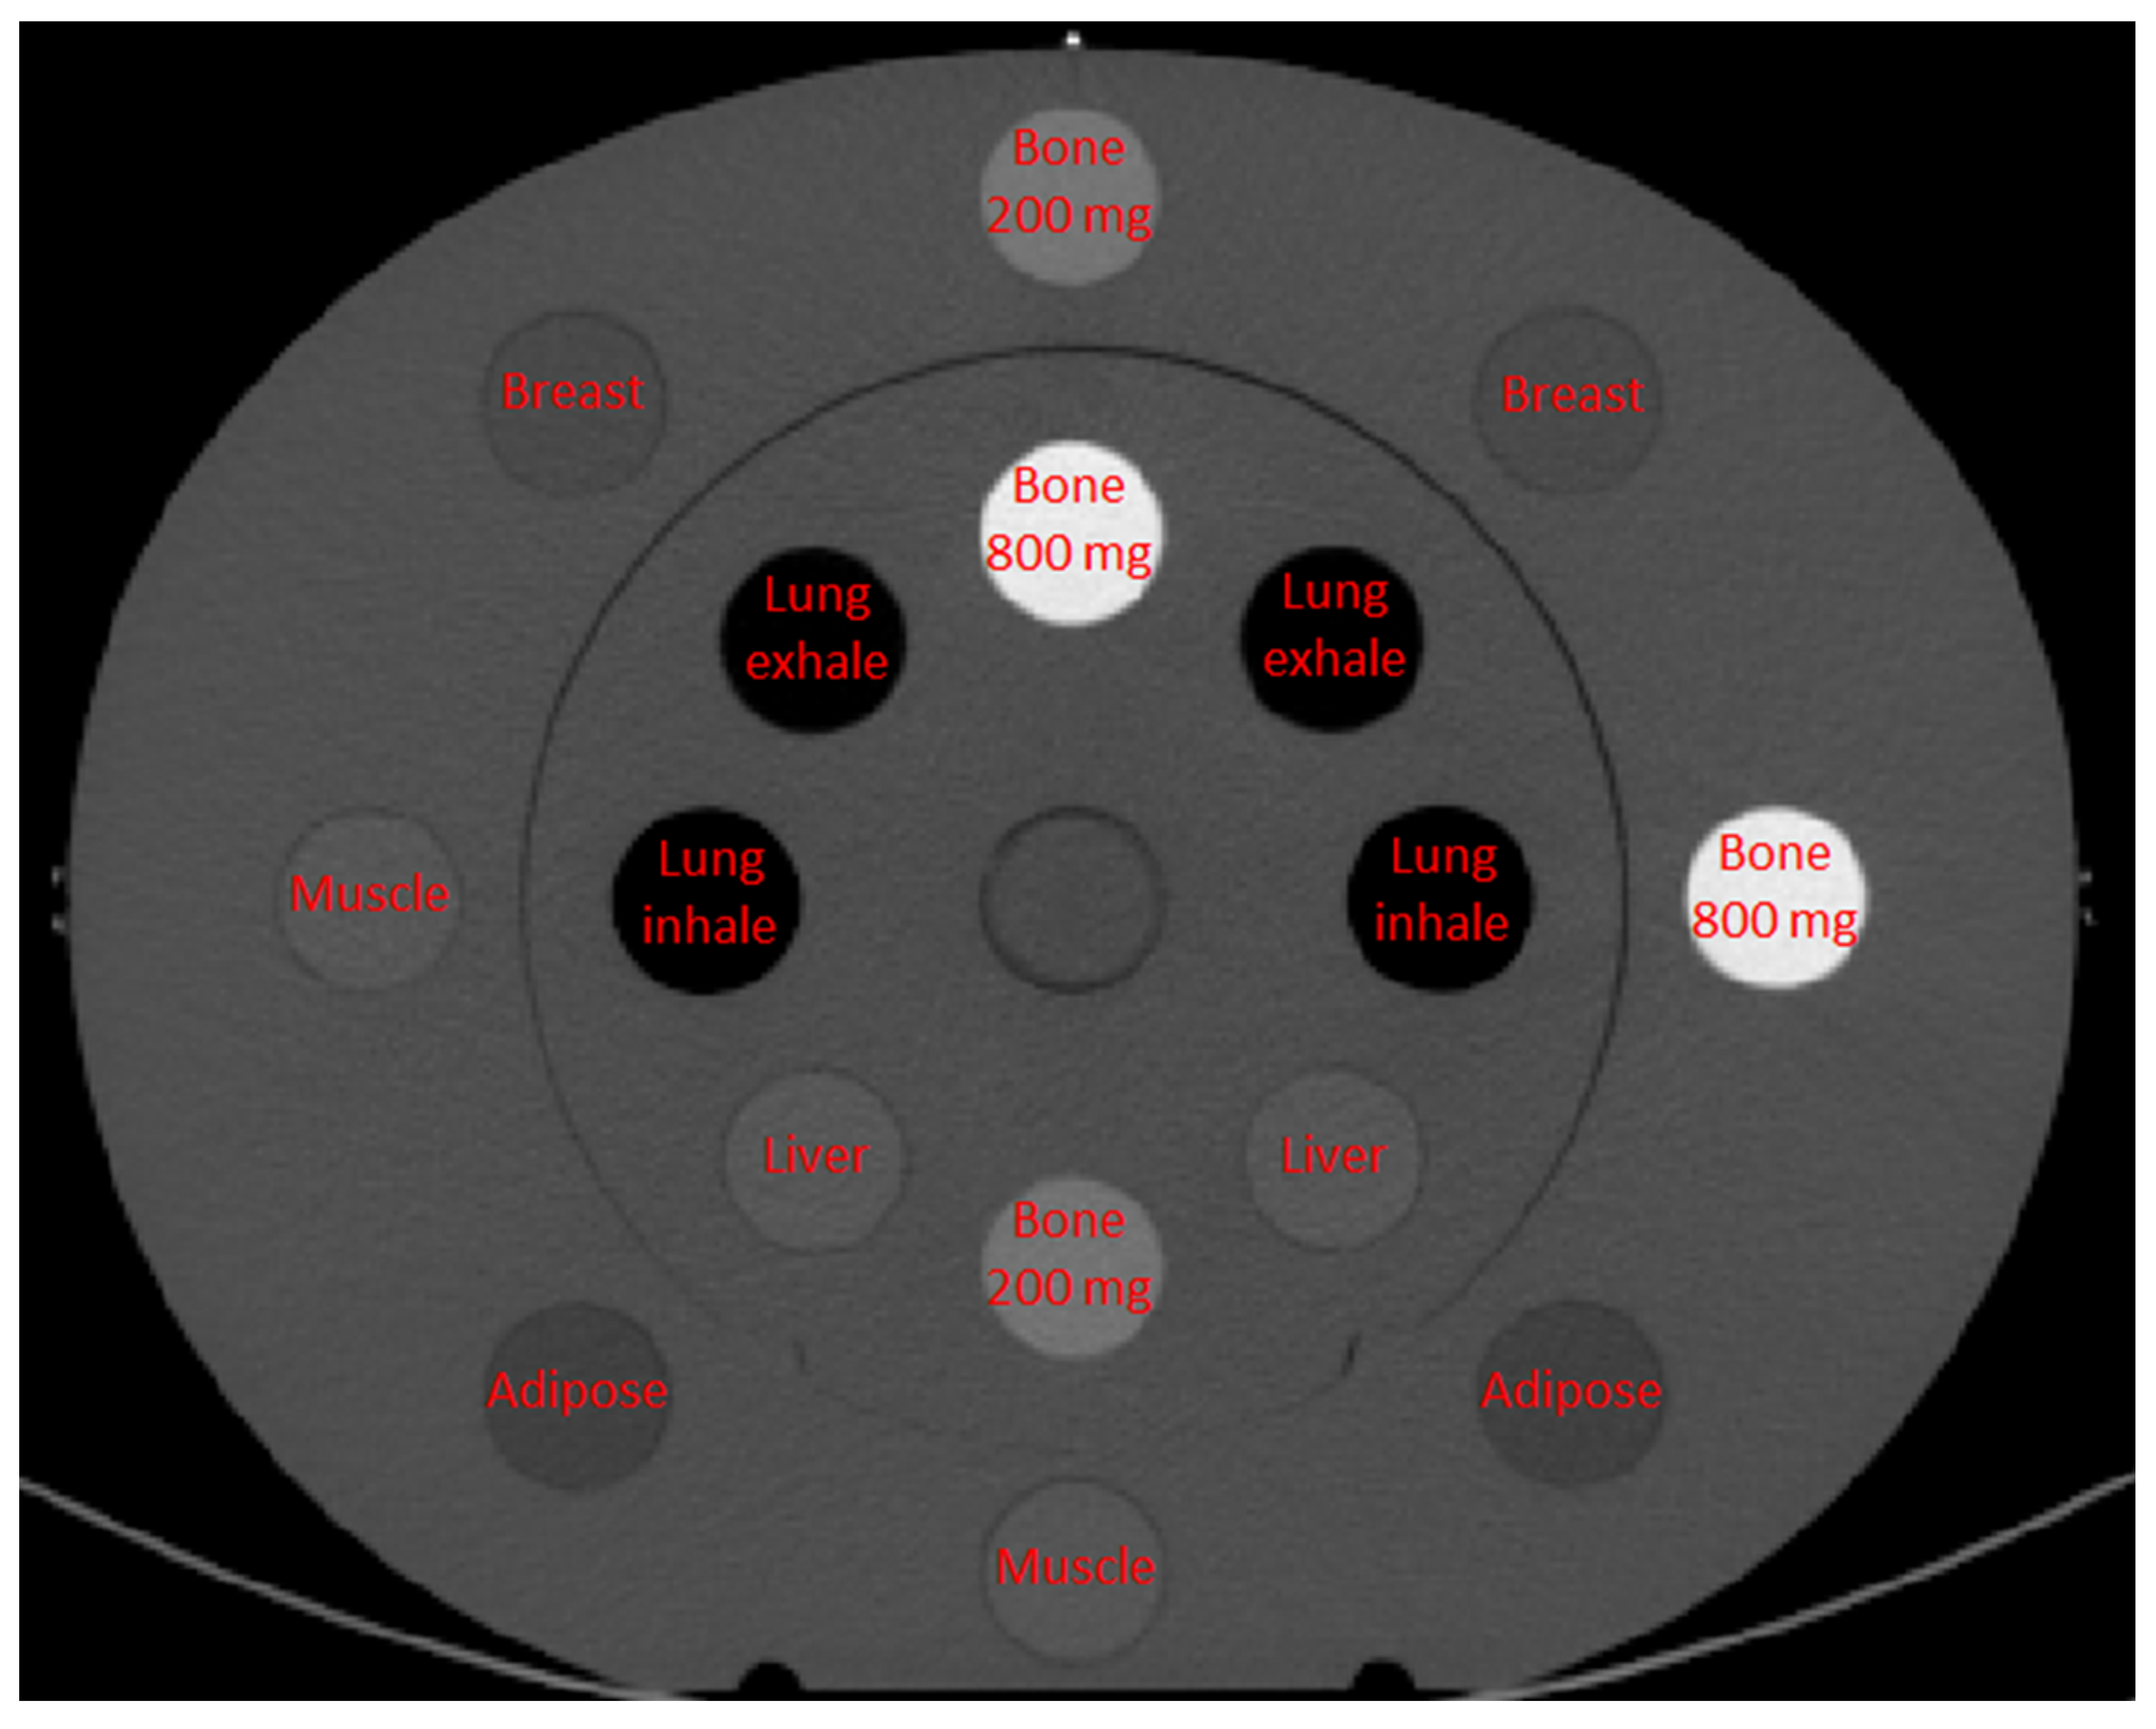
SECT and DECT images of the same phantom were acquired using four different CT scanners equipped with different DECT technologies. Details on phantom, CT scanners, acquisition and reconstruction protocols, and analysis are provided in the following paragraphs.

2.1. Phantom

The CIRS Electron Density Phantom (Model 062M) containing different equivalent tissue inserts was used in a configuration for simulating the body sites. The same phantom in the same configuration was used at the four sites (Figure 1). The phantom has an elliptical section of 33 cm width, 27 cm height, and 5 cm thickness and simulates an abdominal section (density of 1.029 g/cm3) [29]. It contains 16 holes that were filled with rod-shaped interchangeable equivalent tissue inserts (a pair for each of the following: breast, adipose, bone 200 mg, lung exhale, lung inhale, muscle, liver, and bone 800 mg). Standard elemental composition and density of the various inserts were provided together with the phantom by the manufacturer.

2.2. CT Scanners and Acquisition Protocols

The phantom images were acquired with four different CT scanners: Siemens Somatom Confidence, Siemens Somatom Force, Siemens Somatom Definition Edge, and GE Revolution GSI. Each of these CT scanners represents different DECT technologies.
  • The Siemens Somatom Confidence scanner is a single source-detector system that performs the dual-energy acquisition by two sequential scans of the entire volume at 80 and 140 kVp. The advantage of this approach is that no hardware modification is required. This scanner is equipped with an ultrafast ceramic (UFC) detector [30];
  • The Siemens Somatom Force DECT is equipped with a dual-source–dual-detector configuration. This configuration enables optimization of the separation of the low- and high-energy spectra (80 or 100 kV and 140 kVp or 150 kVp generally), with also the addition of tin filters. This scanner is equipped with the Stellar Detector, which reduces the electronic noise during image acquisition [31,32];
  • The Siemens Somatom Definition Edge uses the split-filter technology, achieving spectral separation by using two filters of tin and gold. Also, this scanner is equipped with the Stellar detector;
  • The GE Revolution GSI scanner is based on the concept of rapid kVp-switching. This technology is realized due to a high performance generator capable of very rapid transitions in tube potential (between 80 and 140 kVp) and a fast-sampling scintillator detector with very low afterglow (Gemstone [6]).
The acquisition parameters are summarized in Table 1. Images were first acquired in SECT mode at 120 kVp. The tube current (without automatic tube current modulation) was adjusted to have a similar Volume CT Dose Index (CTDIvol) across CT scanners. A good agreement (10 ± 4%) between displayed and measured values of CTDIvol was obtained on all CT scanners using calibrated pencil chambers [33]. All scanners operated in helical mode (pitch 0.95). Then, the images were acquired in DECT mode while maintaining the settings and the dose level as similar as possible to SECT. The use of the same settings was not always possible. For example, the twin-beam DECT mode required a lower pitch (0.25) due to the halved beam used to acquire low- and high-energy images. To test repeatability and obtain sufficient statistical power for the subsequent analyses, CT scans of the phantom were repeated six times for each protocol and for both the SECT and DECT images modes on the same day for each CT scanner, taking care to reposition the phantom between one scan and the next. Both SECT and DECT images were reconstructed through filtered back-projection (FBP) and iterative algorithms. The iterative algorithms available on the various scanners were SAFIRE on Siemens Confidence, ADMIRE on Siemens Force and Edge, and ASIR on GE Revolution GSI [34,35,36]. A medium strength of three was used with SAFIRE and ADMIRE, while a percentage of 30% was used with ASIR (standard values used in clinical practice). Medium smooth kernels typical of the various scanner models were used to reconstruct the various SECT and DECT images. The FOV of the abdominal clinical protocol was used (50 cm). A matrix of 512 × 512 was used. Moreover, FBP and iterative DECT images were reconstructed at different VMI energies available on the various scanners (40, 50, 70, 100, 120, and 140 keV). DECT images were reconstructed with Monoenergetic plus (Siemens, image domain) and GSI (GE, projection domain) algorithms [37,38,39].

2.3. Image Analysis and Statistics

Images were analyzed using an in-house MATLAB R2018a script (MathWorks, Natick, MA, USA). Once the central slice was identified along the longitudinal axis, a threshold mask of the phantom was created and its center was identified. A set of regions of interest (ROIs) of 10 mm diameter was placed at known distances from the phantom center in correspondence with the various equivalent soft-tissue inserts (30 mm diameter), sufficiently inside the outer edges to avoid the blurring effect on the boundaries. Mean values and standard deviations (SD) of CT numbers were extracted from each ROI on nine consecutive central slices (i.e., the central slice, plus the first four slices above and the first four slices below the central slice along the longitudinal axis). Data extraction was performed for each VMI reconstruction, each of the six acquisitions, and each of the nine slices. We calculated that, with six acquisitions and nine slices (therefore a total of 54 measurements for each equivalent soft-tissue insert), we reached a statistical power of 80% to detect significant differences assuming to observe a “medium” effect size d = 0.4 and setting the probability of a type-I error to 5%. To confirm the consistency of the measurements, a repeatability analysis was performed. The methods and results of this part can be viewed in Supplementary Section S1 and Supplementary Table S1.
As a first analysis, the accuracy of the CT numbers (CTm) measured on VMI at different energies was assessed. The elemental compositions of the soft-tissue (accuracy of 1% certified by the manufacturer) inserts were entered in the NIST XCOM online database [40] to determine the mass attenuation coefficients in the range of 40–140 keV.
The mass attenuation coefficients were then multiplied by the mass densities to determine the linear attenuation coefficients. A density of 0.9982 ± 0.002 g/cm3 was used for water at 20 °C. Next, the nominal CT numbers (CTNIST) corresponding to the various inserts were calculated using the definition of the Hounsfield Unit (HU). The CTm and CTNIST were finally compared, and the root mean square errors (RMSE [41]) were calculated as:
R M S E = i , j N C T m   i , j C T N I S T 2 N
where the indices i and j represent acquisitions (6) and slices (9), respectively, and N is the total number of measurements for each type of insert (2 × 6 × 9 = 108).
Next, the signal-to-noise ratio (SNR) was calculated as the ratio between the mean value and the standard deviation measured for each equivalent soft-tissue insert (adipose, breast, liver, muscle, and bone 200 mg). For each CT scanner, an SNR comparison between DECT (at different energies) and SECT images was evaluated separately with the Wilcoxon signed-rank test, pooling together all insert measurements (at the level of the individual slice) obtained from SECT images paired with the corresponding ones reconstructed at different energy levels from the DECT images. The Bonferroni procedure was used to adjust for multiple comparisons performed within each CT scanner.
Finally, differences between SECT and multiple levels of DECT energies in discriminating all pairwise combinations of equivalent soft-tissue phantom inserts (adipose vs. breast, adipose vs. muscle, adipose vs. liver, breast vs. bone 200 mg, and muscle vs. liver) were evaluated using Wilcoxon signed-rank tests, pairing the inserts as in the previous analysis, and adjusting for multiple comparisons over all tests with the Bonferroni method.
Statistical significance was set at p < 0.05. Statistical analyses were performed using R software (version 3.6.0). A repeatability analysis was conducted using the “metafor” R package (version 3.0-2).

3. Results

To explore the relationship between the average CT numbers and noise across all acquisitions and the VMI energy levels, a preliminary qualitative analysis was performed for each insert (Figure 2 and Figure 3). This analysis showed a marked difference between the DECT and SECT images, particularly at 40 and 50 keV, for the inserts that simulated soft tissues.
As the results obtained from FBP and iterative reconstruction algorithms were comparable and led to the same conclusions, only the results obtained through FBP are reported in the following paragraphs. The results obtained through iterative reconstruction algorithms are reported in the Supplementary Materials.

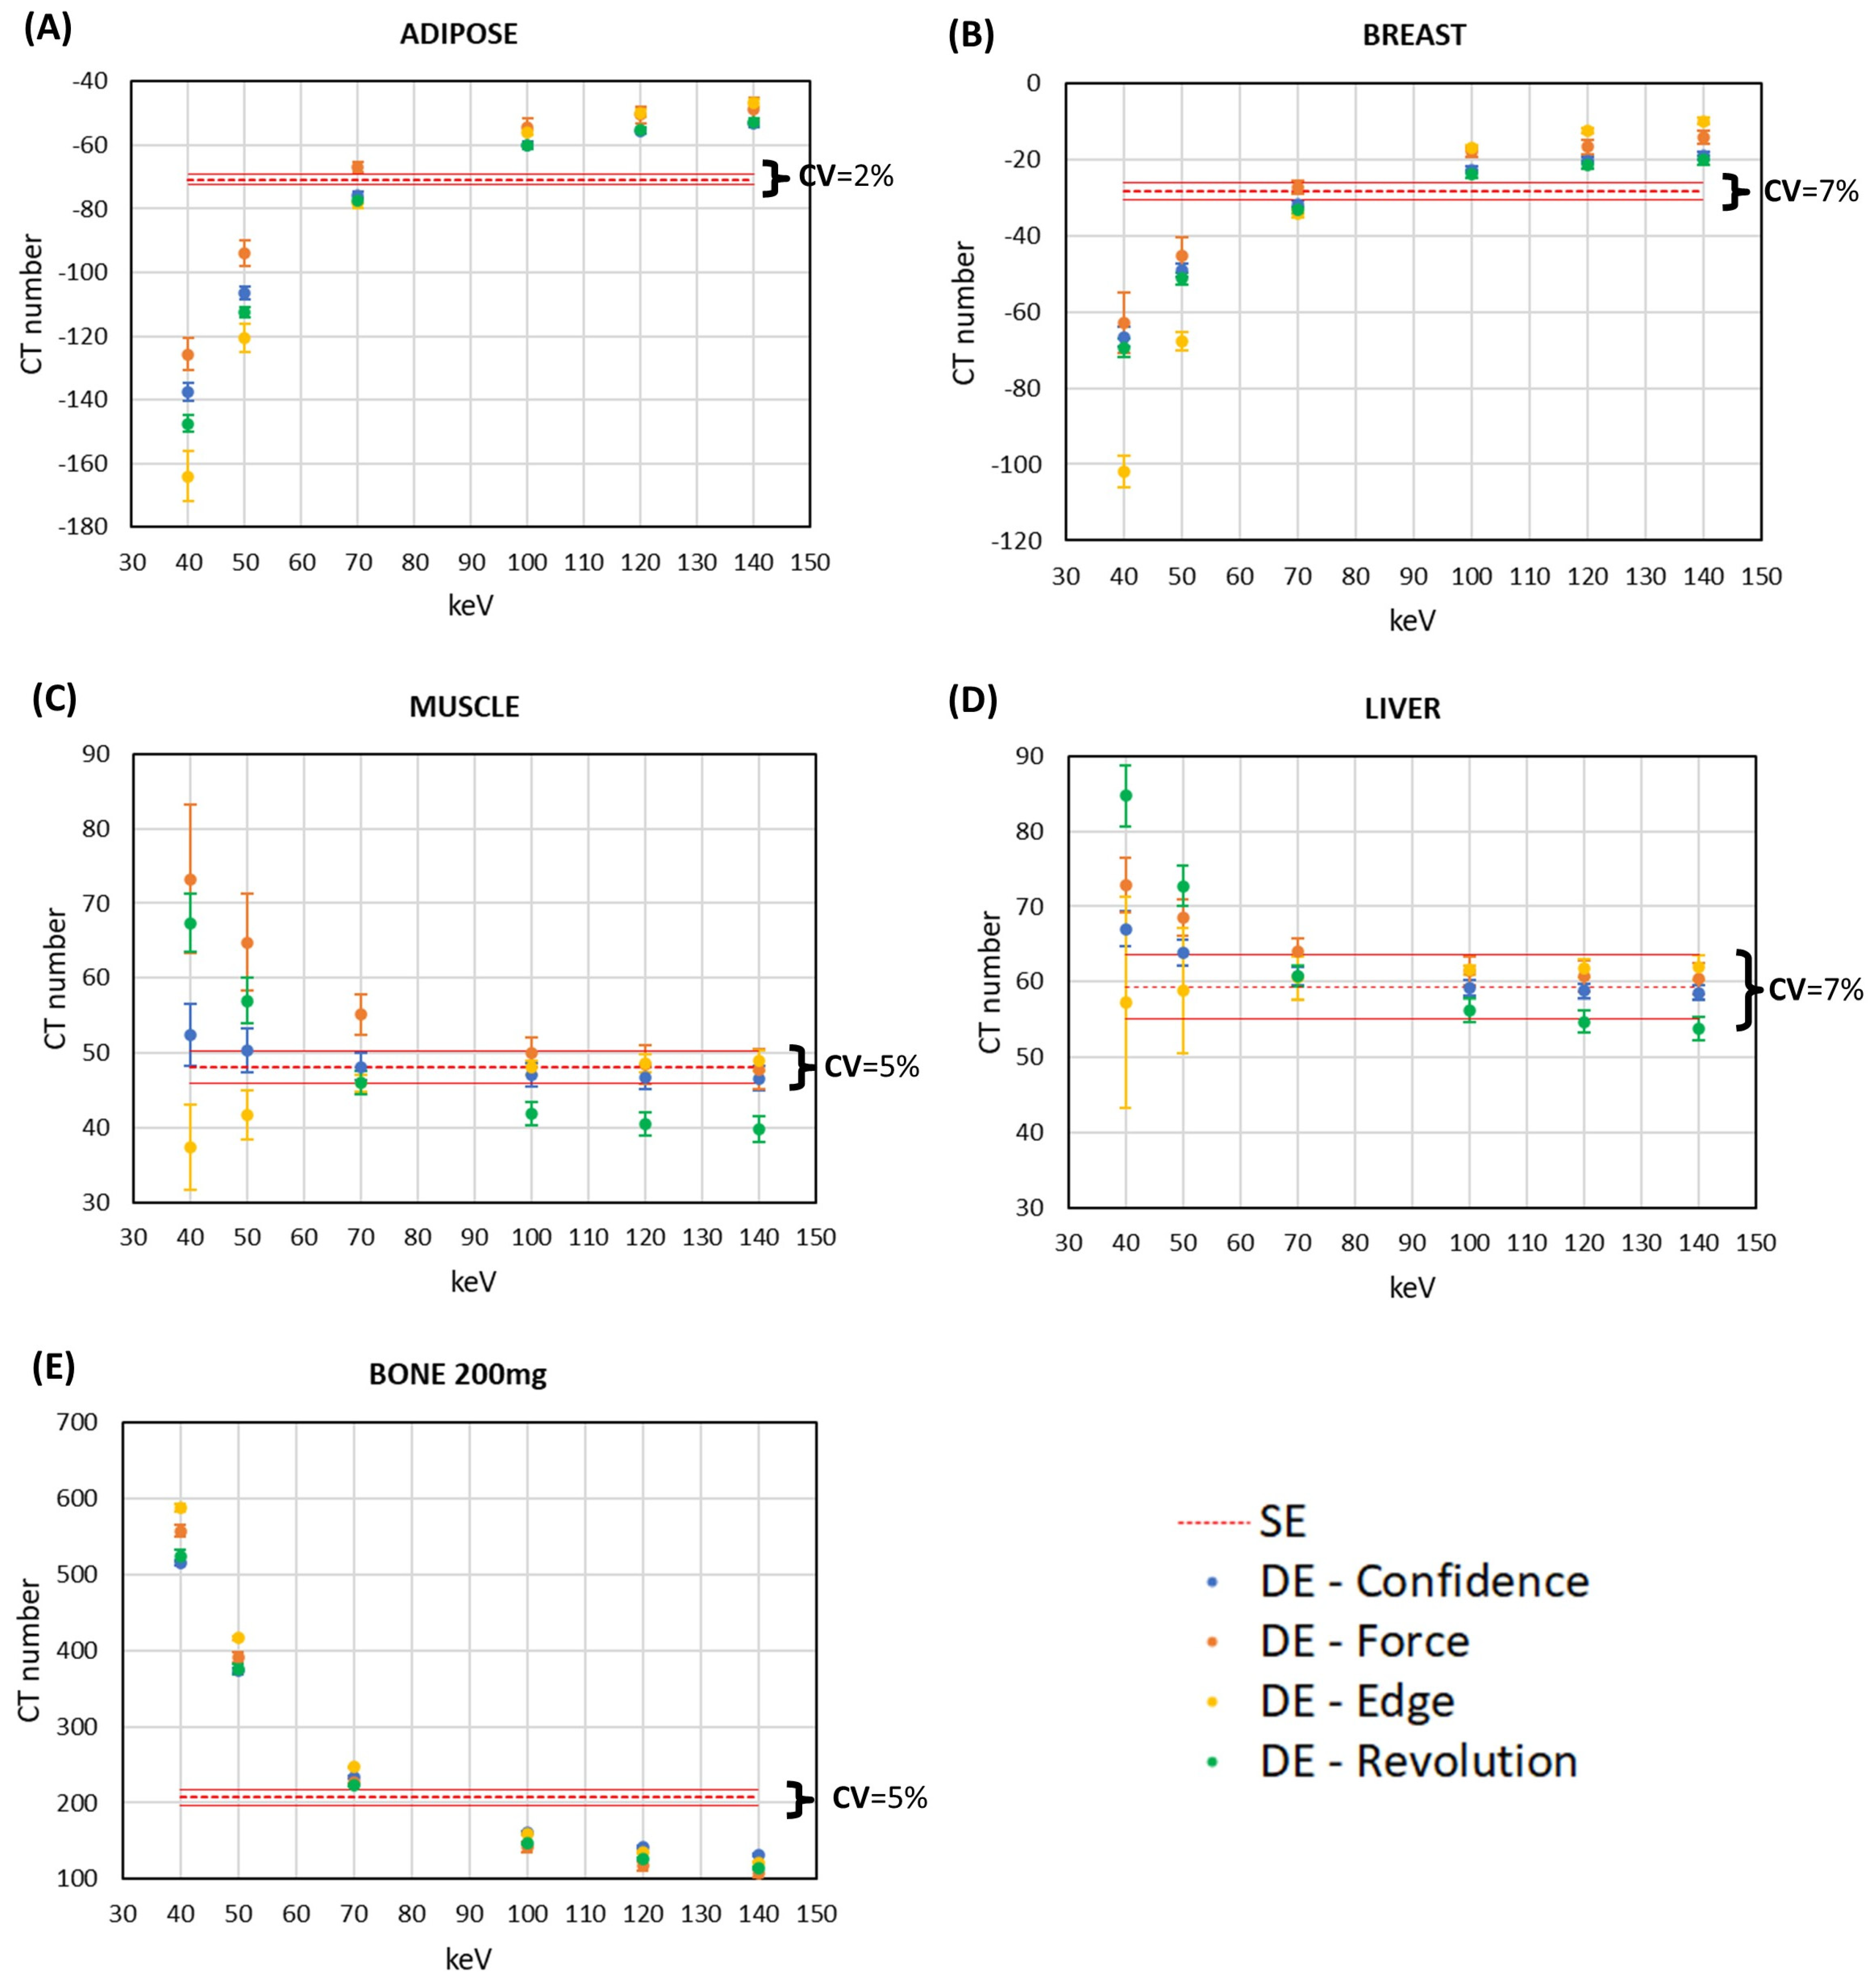
3.1. CT Number Accuracy

Table 2 shows the RMSE between CTm and CTNIST for the soft-tissue inserts obtained from all acquisitions and reconstructions from 40 to 140 keV and FBP. Regardless of the DECT acquisition mode, the RMSE ranged from 1.0 HU to 170.8 HU across energy reconstructions. A higher RMSE was generally observed with 40 keV reconstruction for all inserts, the highest of all for the bone 200 mg insert (from 97.8 HU to 170.8 HU). RMSE tended to decrease (up to 94%) with increasing the VMI energy from 40 keV to 140 keV, with the exceptions of breast tissue acquired with Siemens Edge, for which the RMSE was almost constant (11.8 HU on average), as well as of muscle and liver tissues acquired with Siemens Confidence (RMSE of 3.8 HU and 5.9 HU on average, respectively).
With soft-tissue inserts, Siemens Confidence and Revolution GSI CT scanners showed the highest accuracy of HU, with the lowest RMSE (average values of 6.2 HU, range [1.0–21.9] HU, and 6.3 HU, range [1.1–22.5] HU, respectively), followed by Siemens Edge (9.0 HU, range [1.4–17.5] HU) and Siemens Force (11.8 HU, range [5.4–26.7] HU). With bone material, Siemens Edge showed the best accuracy (average RMSE of 36.5 HU, range [16.9–97.8] HU), followed by Siemens Confidence (54.5 HU, range [10.4–170.8] HU), Siemens Force (57.5 HU, range [34.7–128.9] HU) and GE Revolution GSI (62.5 HU, range [27.1–161.4] HU). Subtle differences were observed using iterative reconstructions with respect to FBP (see Supplementary Table S2).

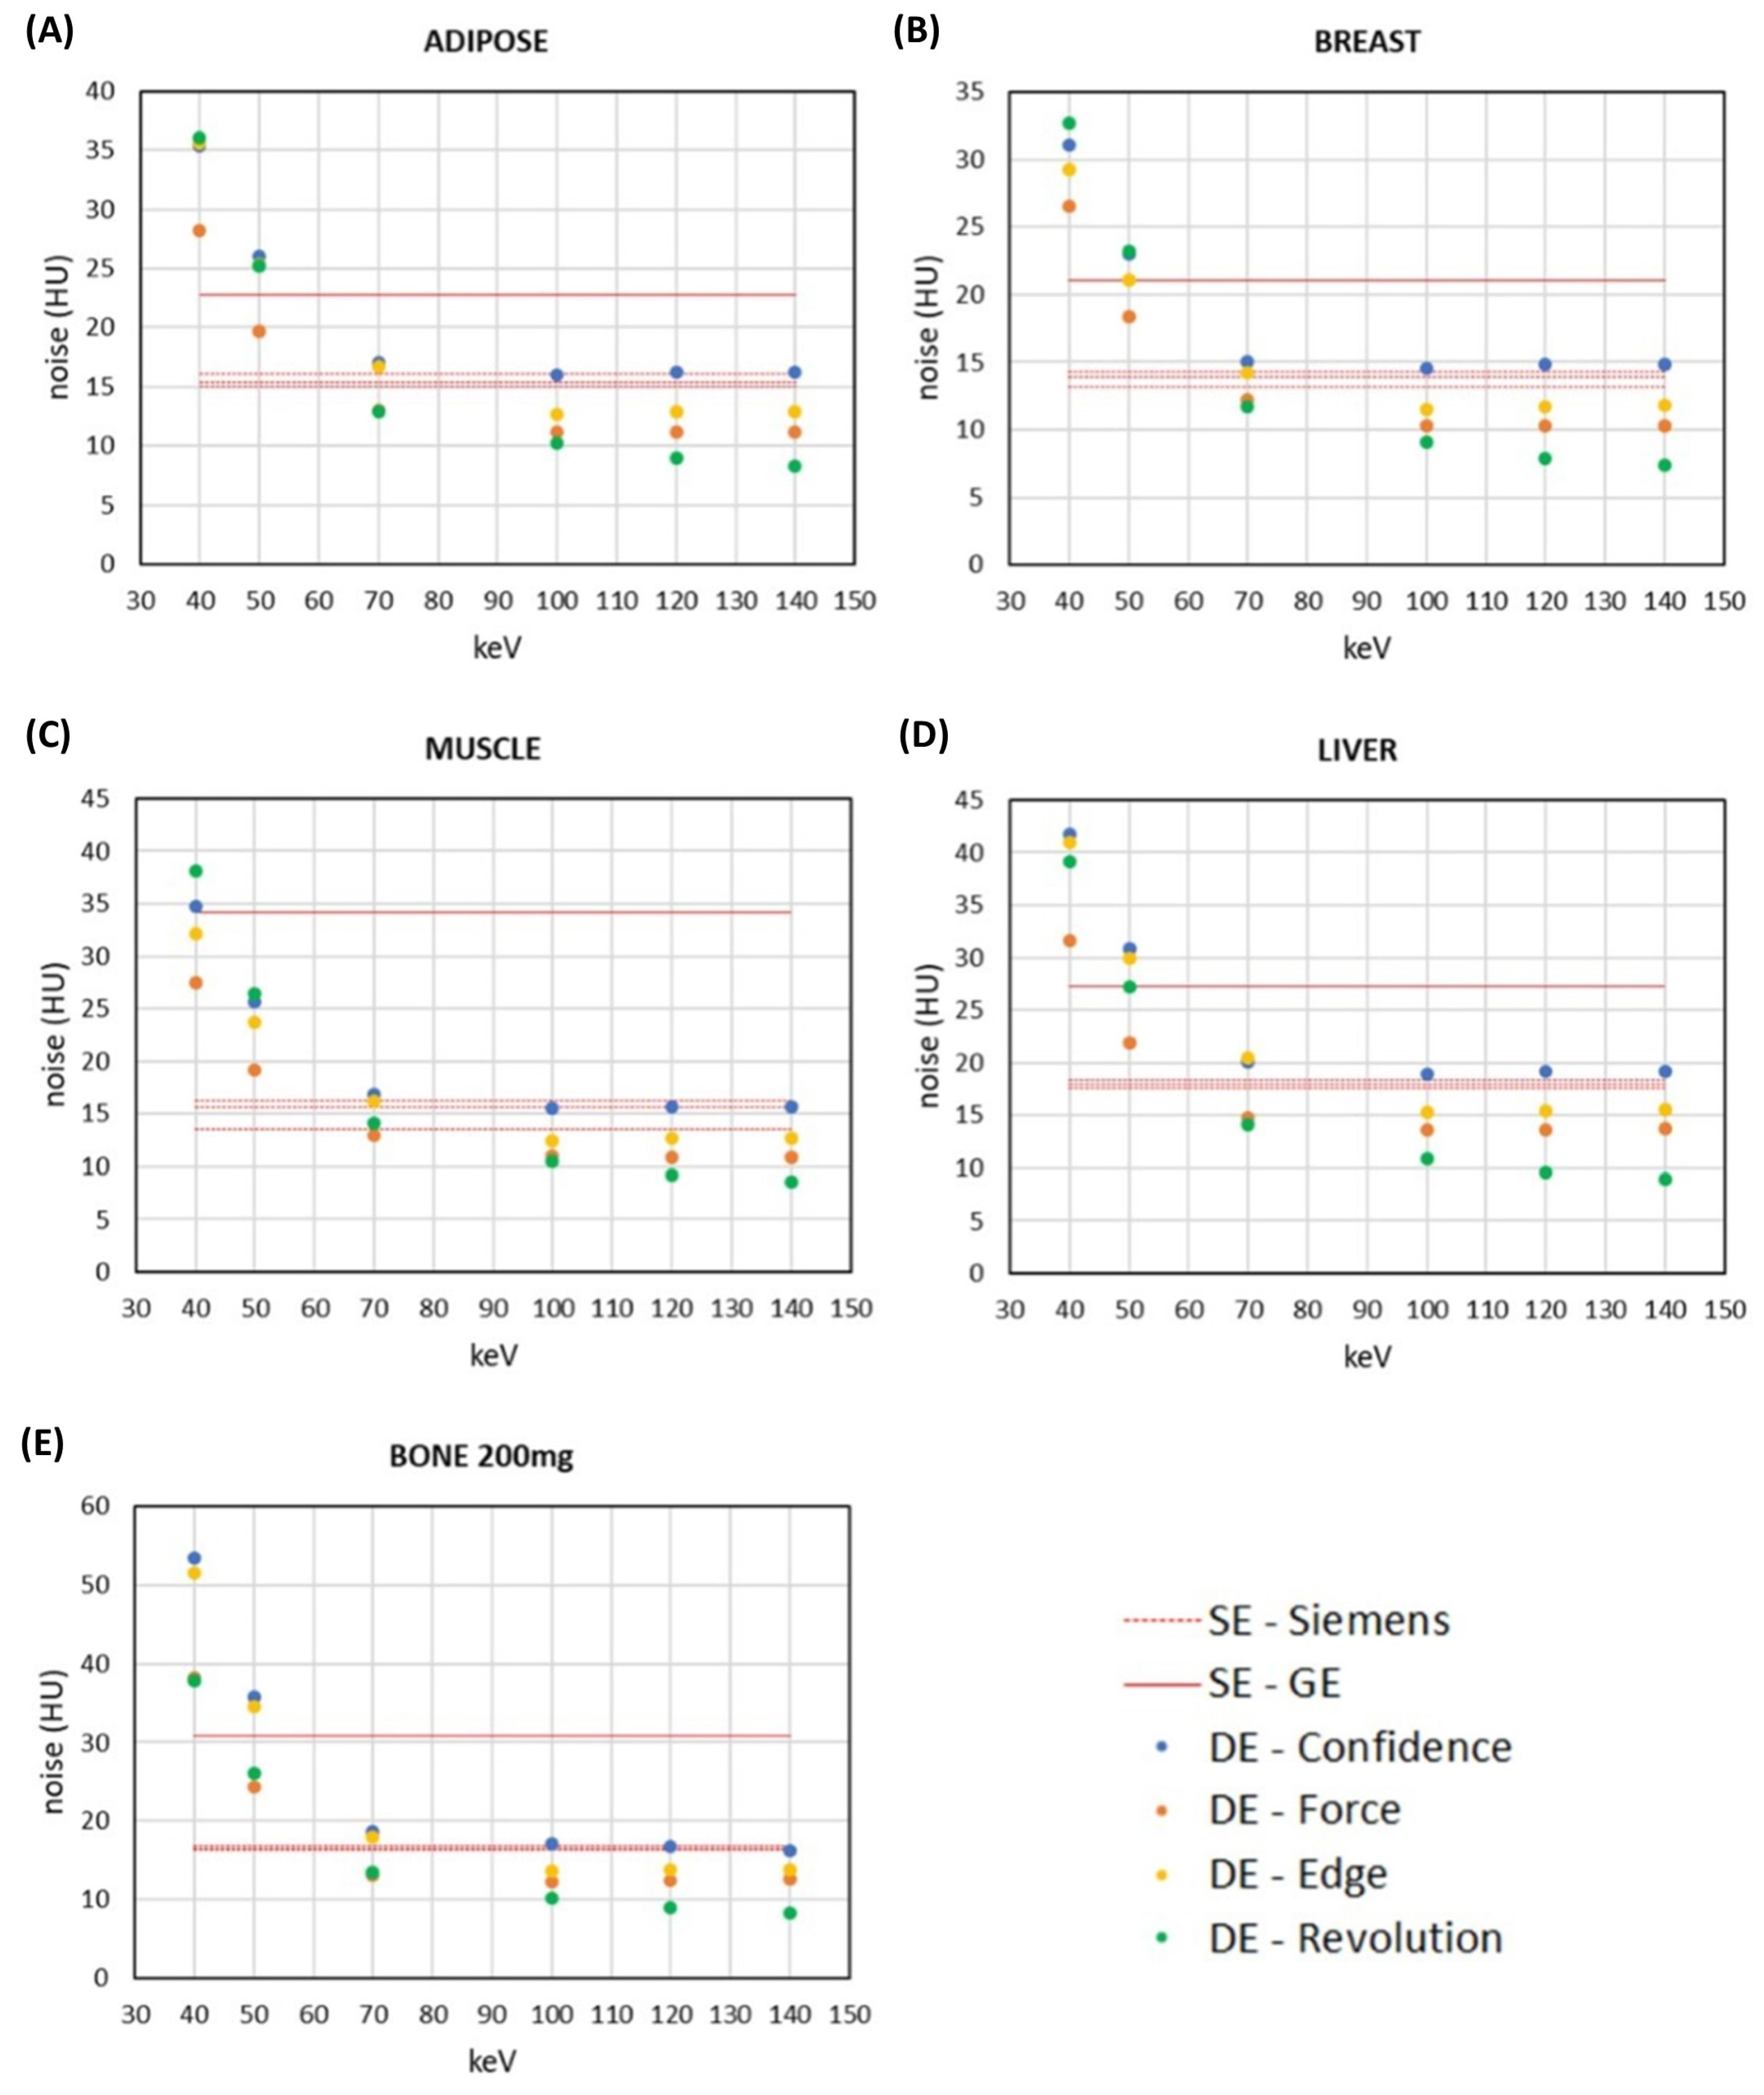
3.2. Comparison of Signal and Noise between DECT and SECT Images within the Same CT Scanner

The comparison of the average signal and noise between the SECT images and each energy level of the DECT images using the FBP reconstruction method is illustrated in Figure 2 and Figure 3. The results show that each DECT image had a specific pattern of significant difference with respect to SECT images.
The signal shows similar values of the DECT images with respect to the SECT images in all cases except for Siemens EDGE CT. In Figure 3, it is noticeable that, particularly for the muscle and liver inserts, for the Siemens EDGE CT there is a trend opposite to what occurs in other technologies. On the other hand, the noise for the Revolution, Siemens Edge, and Siemens Confidence was higher at low energy (40–50 keV). While at high energies, Revolution has lower noise compared to Siemens technologies for all inserts.
Finally, the SNR has been calculated (Supplementary Figure S1). Similar results were obtained considering the SNR values computed from the images reconstructed using the iterative algorithms, but with absolute values higher than those obtained with FBP due to the lower noise (see Supplementary Figure S2).

3.3. Discrimination of Soft Tissues with DECT Images and SECT Images at Low Energy Levels

The differences between the SECT and DECT images in discriminating all pairwise combinations of the five equivalent soft-tissue phantom inserts were investigated focusing on the 40, 50, and 70 keV.
Table 3 reports the most clinically relevant comparisons, whereas the other comparisons are reported in Supplementary Table S3.
The results were quite similar for the different CT scanners. In particular, the adipose insert was better discriminated from breast, muscle, and liver using DECT images at 40 keV rather than SECT images. The same occurred for the comparison between breast and bone 200 mg. By contrast, for the comparison between muscle and liver, DECT had similar performances to SECT images at every energy. Of note, a general trend of progressive decrease in the differences was observed between DECT and SECT images for each tissue pairwise comparison as the energy increased from 40 to 70 keV. Similar results were obtained when the iterative reconstruction algorithms were used (see Supplementary Table S4).

4. Discussion

This study aimed to compare the performance of each of the four different DECT modes offered by two vendors, Siemens and GE, concerning SECT. The primary focus was on evaluating the impact of the DECT acquisition modes and energy levels (ranging from 40 keV to 140 keV) in distinguishing specific soft tissues (adipose, breast, liver, muscle, and bone 200 mg) using quantitative parameters, such as SNR and contrast. The results confirmed and expanded upon previous research, highlighting that VMI at low energies achieved the best contrast enhancement. Furthermore, the study identified the optimal energy level for discriminating soft tissues, considering both contrast enhancement and noise contribution in the images (SNR). Furthermore, a comparison was made among the various technologies, evaluating differences in quantitative parameters.
Several other studies have also demonstrated the potential of DECT in achieving stable material quantification and high image contrast resolution. Koukou et al. [42] explored a DECT method for improving the detectability of microcalcifications in breast imaging. Toia et al. [43] outlined the different quantitative clinical applications of DECT in the abdomen and pelvis. Greffier et al. [44] confirmed that spectral performance depends on the DECT platform and phantom size. Papadakis et al. [45] examined the quality of VMI in fast kVp-switching DECT, highlighting how objective image quality varies with different radiation dose levels and different settings with the IR algorithm. Noda et al. [46] showed that VMI at 40 keV exhibited significantly improved SNR for the pancreas, CNR, and tumor visibility, along with high reproducibility in measuring tumor size for the assessment of pancreatic ductal adenocarcinoma.
This study, instead, assessed various parameters across different types of DECT image technologies. The results showed that VMIs outperform SECT images in the discrimination of soft tissues. The differences in CT numbers between DECT images and SECT images increased as the energy level decreased in all pairwise comparisons of soft-tissue inserts. Notably, adipose and breast tissues showed superior discrimination, using 40–50 keV DECT images compared to SECT images across all CT scanners. However, the discrimination between muscle and liver using DECT images, while statistically significant in some instances, demonstrated relatively small differences (<10 HU) compared to SECT images for all scanners, suggesting limited clinical utility in those scenarios.
When comparing results across different technologies, the following observations were made.
Adipose vs. breast showed that the GE system effectively discriminates these two tissues using energies at 40–50 keV. However, at higher reconstruction energies, Confidence prevails.
Adipose vs. muscle showed that the GE system distinctly discriminates adipose and muscle tissues at 40 keV. At 50 keV, Edge becomes the preferable discriminator, while at 70 keV, both Confidence and Edge demonstrate equal discriminative power.
Adipose vs. liver shows that at 40 keV, the GE and Edge systems perform similarly in tissue discrimination. However, at 70 keV, Edge emerges as the superior discriminator between these tissues.
Breast vs. bone (200 mg) shows that Confidence and GE show equivalent discrimination abilities at 40–50 keV, while Edge outperforms them all at 70 keV.
Muscle vs. liver shows that Edge is better suited for discriminating between these soft tissues at lower energies.
The results showed that, although low energies are desirable for optimal contrast, they suffer from increased noise and reduced accuracy in CT number quantification.
In particular, for all tissues, Siemens Edge CT exhibited a deviation in average mean CT numbers compared to the other evaluated CT scanners. This difference is evident in the muscle and liver inserts, where the average CT numbers at low energies (40–50 keV) were particularly divergent. Furthermore, the coefficient of variation was assessed, which shows a dispersion of values that were around the mean of 7% for the breast and liver, 5% for muscle and bone 200 mg, and 2% for adipose.
As for the noise, it is observed that it increases as energy decreases. In particular, the Siemens Force was the one with the lowest noise overall.
The study also evaluated the RMSE of CT numbers to ensure the robustness of the acquisition technique with respect to the NIST reference standard. An improvement of the RMSE was observed as the VMI energy increased from 40 keV to 140 keV for all DECT systems and tissues. In particular, the RMSE stabilized at energies above 70 keV, showing that high energies can be employed for accurate quantification. An accurate quantification is particularly relevant for clinical applications, such as material characterization, bone mineral density inspection, nondestructive evaluation, and dose calculation, where precision in tissue imaging is essential for the dosimetry.
The obtained results show how, when choosing the most appropriate reconstruction energy, it is important to consider various factors depending on whether contrast or accuracy in quantification is preferred, without neglecting the contribution of noise. While low energies may be preferred for better visualization and delineation of some soft tissues, the increase in noise and the reduction in HU accuracy must be carefully considered, particularly in contexts of quantification or other applications requiring high precision. In this case, the use of high energies is recommended.
DECT can play a crucial role in optimizing the radiotherapy treatment planning workflow. With its ability to differentiate between different types of tissues and accurately identify tumor boundaries, DECT enables healthcare providers to design targeted treatments that maximize therapeutic efficacy and minimize damage to surrounding healthy tissues. Furthermore, the material decomposition offered by DECT allows for better tissue characterization and a significant reduction in artifacts, ensuring a clearer view of anatomical structures and facilitating treatment planning, especially in cases involving metallic implants or high-density material. In summary, the application of DECT in radiotherapy represents an important technological advancement that has a significant impact on the precision and effectiveness of oncology treatments, enhancing healing prospects and overall patient well-being [26,39,47,48,49,50].
Possible applications that emerge from the present study, although they have not yet been clinically tested, may concern breast imaging. This is due to the superior ability of DECT compared to SECT to discriminate glandular and adipose tissues, as well as abdomino-pelvic imaging. Moreover, adding DECT to all those exams that use contrast medium in order to increase vascular enhancement may have a significant aid in diagnostic reporting and radiation dose saving [51,52].
Research into quantitative imaging biomarkers derived from DECT data, such as iodine concentration, material density, and tissue perfusion parameters, holds promise for applications in disease diagnosis, treatment monitoring, and prognostication. Integration of artificial intelligence (AI) and machine-learning techniques with DECT imaging and derived quantitative imaging biomarkers is expected to play a significant role in future research. AI algorithms can assist in image reconstruction, artifact correction, automated lesion detection and characterization, and personalized treatment planning. Future studies may focus on establishing the clinical significance and predictive value of AI techniques based on DECT imaging in various medical conditions.
It is important to acknowledge certain limitations of the study. First, it should be noted that no direct clinical study was conducted to assess the practical applicability of the results obtained. Second, the comparison was limited to a specific group of equipment and DECT modes, involving only two vendors. While different generations of DECT from one vendor (Siemens) were included, the same was not performed for the other vendor (GE). Future studies should evaluate a broader range of equipment from various manufacturers for a more comprehensive comparison. Another limitation was the use of a single-dose protocol for quantitative comparison, which was consistent across all clinical applications. It would be valuable to assess the results at different exposure levels (e.g., varying levels of CTDIvol) to examine how noise affects the final image reconstructed at different energies. Additionally, future studies could focus on “contrast medium” and artificial materials, such as metallic prostheses, as the current analysis primarily focused on soft tissues.

5. Conclusions

This study has provided important insights into the clinical applicability of the various DECT modes offered by two vendors (Siemens and GE), highlighting the importance of a balanced evaluation of the tradeoffs between image quality and noise levels. The results indicate that the GE system tends to enhance the discrimination of soft tissues at lower energies but at the expense of a higher SNR compared to the Siemens technology. This knowledge is crucial for clinicians to optimize diagnostic and therapeutic planning. While low-energy images may be successfully used for precise visualization and delineation of some soft tissues, the increase in noise must be carefully evaluated, particularly in contexts of quantification or other applications requiring high precision. It is, therefore, essential for clinicians to carefully consider the clinical implications of such results, balancing the need for high-quality images with the importance of patient care. Optimizing DECT technologies can contribute to improving the accuracy of diagnosis and treatment planning, promoting personalized and effective care for patients.

Supplementary Materials

The following supporting information can be downloaded at: https://www.mdpi.com/article/10.3390/app14051724/s1. Section S1: Methods and results on measurement repeatability; Table S1: Measurement variability; Table S2: RMSE obtained with iterative reconstructions; Table S3: Mean difference between DECT and SECT of other pairwise comparisons using FBP reconstruction method; Table S4: Mean difference between DECT and SECT of all pairwise comparisons using iterative algorithms for reconstruction; Figure S1: Comparison of the average SNR between DECT and SECT using FBP reconstruction method; Figure S2: Comparison of the average SNR between DECT and SECT using iterative reconstruction methods.

Author Contributions

Conceptualization, P.G. and A.D.; methodology, P.G. and A.D.; validation, E.D.M.; formal analysis, R.P., P.G. and A.D.; investigation, P.G. and A.D.; resources, S.G., E.P., C.T., C.C., O.O. and C.G.; data curation, R.P., P.G. and A.D.; writing—original draft preparation, R.P., P.G. and A.D.; writing—review and editing, P.G., A.D., R.P., S.G., M.L.F., O.O., C.T., C.C., E.P., C.G., M.G.B. and E.D.M.; visualization, P.G., A.D., R.P., S.G., M.L.F., O.O., C.T., C.C., E.P., C.G., M.G.B. and E.D.M.; supervision, E.D.M. and M.G.B. All authors have read and agreed to the published version of the manuscript.

Funding

This work was supported by the Italian Ministry of Health (RRC).

Institutional Review Board Statement

Not applicable.

Informed Consent Statement

Not applicable.

Data Availability Statement

The data presented in this study are available in the institutional repository of Fondazione IRCCS Istituto Neurologico Carlo Besta (doi: 10.5281/zenodo.10683773).

Conflicts of Interest

The authors declare that they have no known competing financial interests or personal relationships that could have appeared to influence the work reported in this paper.

References

  1. McCollough, C.H.; Leng, S.; Yu, L.; Fletcher, J.G. Dual- and Multi-Energy CT: Principles, Technical Approaches, and Clinical Applications. Radiology 2015, 276, 637–653. [Google Scholar] [CrossRef]
  2. Alvarez, R.E.; Macovski, A. Energy-selective reconstructions in X-ray computerised tomography. Phys. Med. Biol. 1976, 21, 733–744. [Google Scholar] [CrossRef]
  3. Johnson, T.R.C.; Krauß, B.; Sedlmair, M.; Grasruck, M.; Bruder, H.; Morhard, D.; Fink, C.; Weckbach, S.; Lenhard, M.; Schmidt, B.; et al. Material differentiation by dual energy CT: Initial experience. Eur. Radiol. 2007, 17, 1510–1517. [Google Scholar] [CrossRef]
  4. Johnson, T.R.C. Dual-Energy CT: General Principles. Am. J. Roentgenol. 2012, 199, S3–S8. [Google Scholar] [CrossRef]
  5. Borges, A.P.; Antunes, C.; Curvo-Semedo, L. Pros and Cons of Dual-Energy CT Systems: “One Does Not Fit All”. Tomography 2023, 9, 195–216. [Google Scholar] [CrossRef]
  6. Chandra, N.; Langan, D.A. Gemstone Detector: Dual Energy Imaging via Fast kVp Switching. In Dual Energy CT in Clinical Practice; Johnson, T., Fink, C., Schönberg, S.O., Reiser, M.F., Eds.; Springer: Berlin/Heidelberg, Germany, 2011; pp. 35–41. [Google Scholar] [CrossRef]
  7. Goodsitt, M.M.; Christodoulou, E.G.; Larson, S.C. Accuracies of the synthesized monochromatic CT numbers and effective atomic numbers obtained with a rapid kVp switching dual energy CT scanner. Med. Phys. 2011, 38, 2222–2232. [Google Scholar] [CrossRef]
  8. Euler, A.; Parakh, A.; Falkowski, A.L.; Manneck, S.; Dashti, D.; Krauss, B.; Szucs-Farkas, Z.; Schindera, S.T. Initial Results of a Single-Source Dual-Energy Computed Tomography Technique Using a Split-Filter: Assessment of Image Quality, Radiation Dose, and Accuracy of Dual-Energy Applications in an In Vitro and In Vivo Study. Investig. Radiol. 2016, 51, 491–498. [Google Scholar] [CrossRef]
  9. Kaemmerer, N.; Brand, M.; Hammon, M.; May, M.; Wuest, W.; Krauss, B.; Uder, M.; Lell, M.M. Dual-Energy Computed Tomography Angiography of the Head and Neck With Single-Source Computed Tomography: A New Technical (Split Filter) Approach for Bone Removal. Investig. Radiol. 2016, 51, 618–623. [Google Scholar] [CrossRef] [PubMed]
  10. Petersilka, M.; Bruder, H.; Krauss, B.; Stierstorfer, K.; Flohr, T.G. Technical principles of dual source CT. Eur. J. Radiol. 2008, 68, 362–368. [Google Scholar] [CrossRef] [PubMed]
  11. Flohr, T.G.; McCollough, C.H.; Bruder, H.; Petersilka, M.; Gruber, K.; Süβ, C.; Grasruck, M.; Stierstorfer, K.; Krauss, B.; Raupach, R.; et al. First performance evaluation of a dual-source CT (DSCT) system. Eur. Radiol. 2006, 16, 256–268. [Google Scholar] [CrossRef] [PubMed]
  12. Almeida, I.P.; Schyns, L.E.J.R.; Öllers, M.C.; Van Elmpt, W.; Parodi, K.; Landry, G.; Verhaegen, F. Dual-energy CT quantitative imaging: A comparison study between twin-beam and dual-source CT scanners. Med. Phys. 2017, 44, 171–179. [Google Scholar] [CrossRef]
  13. Jacobsen, M.C.; Schellingerhout, D.; Wood, C.A.; Tamm, E.P.; Godoy, M.C.; Sun, J.; Cody, D.D. Intermanufacturer Comparison of Dual-Energy CT Iodine Quantification and Monochromatic Attenuation: A Phantom Study. Radiology 2018, 287, 224–234. [Google Scholar] [CrossRef]
  14. Li, B.; Pomerleau, M.; Gupta, A.; Soto, J.A.; Anderson, S.W. Accuracy of Dual-Energy CT Virtual Unenhanced and Material-Specific Images: A Phantom Study. Am. J. Roentgenol. 2020, 215, 1146–1154. [Google Scholar] [CrossRef]
  15. Ohira, S.; Karino, T.; Ueda, Y.; Nitta, Y.; Kanayama, N.; Miyazaki, M.; Koizumi, M.; Teshima, T. How Well Does Dual-energy CT with Fast Kilovoltage Switching Quantify CT Number and Iodine and Calcium Concentrations? Acad. Radiol. 2018, 25, 519–528. [Google Scholar] [CrossRef]
  16. Bamberg, F.; Dierks, A.; Nikolaou, K.; Reiser, M.F.; Becker, C.R.; Johnson, T.R.C. Metal artifact reduction by dual energy computed tomography using monoenergetic extrapolation. Eur. Radiol. 2011, 21, 1424–1429. [Google Scholar] [CrossRef]
  17. Zhou, C.; Zhao, Y.E.; Luo, S.; Shi, H.; Li, L.; Zheng, L.; Zhang, L.J.; Lu, G. Monoenergetic Imaging of Dual-energy CT Reduces Artifacts from Implanted Metal Orthopedic Devices in Patients with Factures. Acad. Radiol. 2011, 18, 1252–1257. [Google Scholar] [CrossRef] [PubMed]
  18. Matsumoto, K.; Jinzaki, M.; Tanami, Y.; Ueno, A.; Yamada, M.; Kuribayashi, S. Virtual Monochromatic Spectral Imaging with Fast Kilovoltage Switching: Improved Image Quality as Compared with That Obtained with Conventional 120-kVp CT. Radiology 2011, 259, 257–262. [Google Scholar] [CrossRef]
  19. Pomerantz, S.R.; Kamalian, S.; Zhang, D.; Gupta, R.; Rapalino, O.; Sahani, D.V.; Lev, M.H. Virtual Monochromatic Reconstruction of Dual-Energy Unenhanced Head CT at 65–75 keV Maximizes Image Quality Compared with Conventional Polychromatic CT. Radiology 2013, 266, 318–325. [Google Scholar] [CrossRef] [PubMed]
  20. Wichmann, J.L.; Nöske, E.-M.; Kraft, J.; Burck, I.; Wagenblast, J.; Eckardt, A.; Frellesen, C.; Kerl, J.M.; Bauer, R.W.; Bodelle, B.; et al. Virtual Monoenergetic Dual-Energy Computed Tomography: Optimization of Kiloelectron Volt Settings in Head and Neck Cancer. Investig. Radiol. 2014, 49, 735–741. [Google Scholar] [CrossRef] [PubMed]
  21. Böning, G.; Feldhaus, F.; Adelt, S.; Kahn, J.; Fehrenbach, U.; Streitparth, F. Clinical routine use of virtual monochromatic datasets based on spectral CT in patients with hypervascularized abdominal tumors—Evaluation of effectiveness and efficiency. Acta Radiol. 2019, 60, 425–432. [Google Scholar] [CrossRef] [PubMed]
  22. Van Ommen, F.; Kauw, F.; Bennink, E.; Heit, J.J.; Wolman, D.N.; Dankbaar, J.W.; de Jong, H.W.; Wintermark, M. Image Quality of Virtual Monochromatic Reconstructions of Noncontrast CT on a Dual-Source CT Scanner in Adult Patients. Acad. Radiol. 2021, 28, e323–e330. [Google Scholar] [CrossRef] [PubMed]
  23. Glazebrook, K.N.; Guimarães, L.S.; Murthy, N.S.; Black, D.F.; Bongartz, T.; Manek, N.J.; Leng, S.; Fletcher, J.G.; McCollough, C.H. Identification of Intraarticular and Periarticular Uric Acid Crystals with Dual-Energy CT: Initial Evaluation. Radiology 2011, 261, 516–524. [Google Scholar] [CrossRef] [PubMed]
  24. Van Elmpt, W.; Landry, G.; Das, M.; Verhaegen, F. Dual energy CT in radiotherapy: Current applications and future outlook. Radiother. Oncol. 2016, 119, 137–144. [Google Scholar] [CrossRef]
  25. Kruis, M.F. Improving radiation physics, tumor visualisation, and treatment quantification in radiotherapy with spectral or dual-energy CT. J. Appl. Clin. Med. Phys. 2022, 23, e13468. [Google Scholar] [CrossRef] [PubMed]
  26. Peters, N.; Wohlfahrt, P.; Hofmann, C.; Möhler, C.; Menkel, S.; Tschiche, M.; Krause, M.; Troost, E.G.; Enghardt, W.; Richter, C. Reduction of clinical safety margins in proton therapy enabled by the clinical implementation of dual-energy CT for direct stopping-power prediction. Radiother. Oncol. 2022, 166, 71–78. [Google Scholar] [CrossRef] [PubMed]
  27. Gupta, R.; Phan, C.M.; Leidecker, C.; Brady, T.J.; Hirsch, J.A.; Nogueira, R.G.; Yoo, A.J. Evaluation of Dual-Energy CT for Differentiating Intracerebral Hemorrhage from Iodinated Contrast Material Staining. Radiology 2010, 257, 205–211. [Google Scholar] [CrossRef]
  28. Virarkar, M.K.; Vulasala, S.S.R.; Gupta, A.V.; Gopireddy, D.; Kumar, S.; Hernandez, M.; Lall, C.; Bhosale, P. Virtual Non-contrast Imaging in The Abdomen and The Pelvis: An Overview. Semin. Ultrasound CT MRI 2022, 43, 293–310. [Google Scholar] [CrossRef] [PubMed]
  29. Sun Nuclear. CIRS. Electron Density Phantom, Model 062M. Available online: https://www.cirsinc.com/products/radiation-therapy/electron-density-phantom/ (accessed on 19 July 2023).
  30. Siemens Healthcare. Ultra Fast Ceramic. Available online: https://www.siemens-healthineers.com/it/computed-tomography/technologies-innovations/ufc-ultra-fast-ceramic (accessed on 19 July 2023).
  31. Ulzheimer, S.; Freund, J. The Stellar detector. Siemens Whitepaper. 2016. Available online: https://cdn0.scrvt.com/39b415fb07de4d9656c7b516d8e2d907/1800000003369873/c3565f4372f7/Computed-Tomography_Machine-Technology_Stellar-detector_Whitepaper_1800000003369873.pdf (accessed on 19 July 2023).
  32. Christe, A. CT dose and image quality in the last three scanner generations. World J. Radiol. 2013, 5, 421. [Google Scholar] [CrossRef]
  33. IAEA Human Health. International Atomic Energy Agency, Quality Assurance Programme for Computed Tomography: Diagnostic and Therapy Applications, IAEA Human Health Series No. 19, IAEA, Vienna 2012. Available online: https://www-pub.iaea.org/MTCD/Publications/PDF/Pub1557_web.pdf (accessed on 24 October 2023).
  34. Grant, K.; Raupach, R. SAFIRE: Sinogram Affirmed Iterative Reconstruction. Siemens Whitepaper. 2012. Available online: https://cdn0.scrvt.com/39b415fb07de4d9656c7b516d8e2d907/1800000000306520/d80046026fd1/ct_SAFIRE_White_Paper_1800000000306520.pdf (accessed on 19 July 2023).
  35. Ramirez Giraldo, J.C.; Grant, K.; Raupach, R. ADMIRE: Advanced Modeled Iterative Reconstruction. Siemens Whitepaper. 2018. Available online: https://cdn0.scrvt.com/39b415fb07de4d9656c7b516d8e2d907/1800000005678345/c5bb3dd343ed/CT_Whitepaper_ADMIRE_1800000005678345.pdf (accessed on 19 July 2023).
  36. Fan, J.; Yue, M.; Melnyk, R. Benefits of ASiR-V Reconstruction for Reducing Patient Radiation Dose and Preserving Diagnostic Quality in CT Exams. GE Whitepaper. n.d. 2014. Available online: https://www.gehealthcare.co.uk/-/media/6862ed3b10424182924e03a49f4a46d7.pdf (accessed on 19 July 2023).
  37. Geyer, L.L.; Schoepf, U.J.; Meinel, F.G.; Nance, J.W.; Bastarrika, G.; Leipsic, J.A.; Paul, N.S.; Rengo, M.; Laghi, A.; De Cecco, C.N. State of the Art: Iterative CT Reconstruction Techniques. Radiology 2015, 276, 339–357. [Google Scholar] [CrossRef] [PubMed]
  38. Grant, K.L.; Flohr, T.G.; Krauss, B.; Sedlmair, M.; Thomas, C.; Schmidt, B. Assessment of an Advanced Image-Based Technique to Calculate Virtual Monoenergetic Computed Tomographic Images From a Dual-Energy Examination to Improve Contrast-To-Noise Ratio in Examinations Using Iodinated Contrast Media. Investig. Radiol. 2014, 49, 586–592. [Google Scholar] [CrossRef]
  39. D’Angelo, T.; Cicero, G.; Mazziotti, S.; Ascenti, G.; Albrecht, M.H.; Martin, S.S.; Othman, A.E.; Vogl, T.J.; Wichmann, J.L. Dual energy computed tomography virtual monoenergetic imaging: Technique and clinical applications. Br. J. Radiol. 2019, 92, 20180546. [Google Scholar] [CrossRef]
  40. NIST XCOM Database. 2023. Available online: https://physics.nist.gov/PhysRefData/Xcom/html/xcom1.html (accessed on 19 July 2023).
  41. Chai, T.; Draxler, R.R. Root mean square error (RMSE) or mean absolute error (MAE)?—Arguments against avoiding RMSE in the literature. Geosci. Model. Dev. 2014, 7, 1247–1250. [Google Scholar] [CrossRef]
  42. Koukou, V.; Martini, N.; Michail, C.; Sotiropoulou, P.; Fountzoula, C.; Kalyvas, N.; Kandarakis, I.; Nikiforidis, G.; Fountos, G. Dual Energy Method for Breast Imaging: A Simulation Study. Comput. Math. Methods Med. 2015, 2015, 574238. [Google Scholar] [CrossRef] [PubMed]
  43. Toia, G.V.; Mileto, A.; Wang, C.L.; Sahani, D.V. Quantitative dual-energy CT techniques in the abdomen. Abdom. Radiol. 2021, 47, 3003–3018. [Google Scholar] [CrossRef] [PubMed]
  44. Greffier, J.; Van Ngoc Ty, C.; Fitton, I.; Frandon, J.; Beregi, J.-P.; Dabli, D. Impact of Phantom Size on Low-Energy Virtual Monoenergetic Images of Three Dual-Energy CT Platforms. Diagnostics 2023, 13, 3039. [Google Scholar] [CrossRef]
  45. Papadakis, A.E.; Damilakis, J. Technical Note: Quality assessment of virtual monochromatic spectral images on a dual energy CT scanner. Phys. Med. 2021, 82, 114–121. [Google Scholar] [CrossRef]
  46. Noda, Y.; Goshima, S.; Kaga, T.; Ando, T.; Miyoshi, T.; Kawai, N.; Kawada, H.; Tanahashi, Y.; Matsuo, M. Virtual monochromatic image at lower energy level for assessing pancreatic ductal adenocarcinoma in fast kV-switching dual-energy CT. Clin. Radiol. 2020, 75, 320.e17–320.e23. [Google Scholar] [CrossRef]
  47. Charyyev, S.; Wang, T.; Lei, Y.; Ghavidel, B.; Beitler, J.J.; McDonald, M.; Curran, W.J.; Liu, T.; Zhou, J.; Yang, X. Learning-based synthetic dual energy CT imaging from single energy CT for stopping power ratio calculation in proton radiation therapy. Br. J. Radiol. 2022, 95, 20210644. [Google Scholar] [CrossRef]
  48. Noid, G.; Zhu, J.; Tai, A.; Mistry, N.; Schott, D.; Prah, D.; Paulson, E.; Schultz, C.; Li, X.A. Improving Structure Delineation for Radiation Therapy Planning Using Dual-Energy CT. Front. Oncol. 2020, 10, 1694. [Google Scholar] [CrossRef]
  49. Dedes, G.; Dickmann, J.; Niepel, K.; Wesp, P.; Johnson, R.P.; Pankuch, M.; Bashkirov, V.; Rit, S.; Volz, L.; Schulte, R.W.; et al. Experimental comparison of proton CT and dual energy x-ray CT for relative stopping power estimation in proton therapy. Phys. Med. Biol. 2019, 64, 165002. [Google Scholar] [CrossRef]
  50. Ehn, S.; Sellerer, T.; Muenzel, D.; Fingerle, A.A.; Kopp, F.; Duda, M.; Mei, K.; Renger, B.; Herzen, J.; Dangelmaier, J.; et al. Assessment of quantification accuracy and image quality of a full-body dual-layer spectral CT system. J. Appl. Clin. Med. Phys. 2018, 19, 204–217. [Google Scholar] [CrossRef] [PubMed]
  51. Alius, C.; Serban, D.; Tribus, L.C.; Costea, D.O.; Cristea, B.M.; Serboiu, C.; Motofei, I.; Dascalu, A.M.; Velescu, B.; Tudor, C.; et al. When Not to Operate on Acute Cases—A Surgeon’s Perspective on Rapid Assessment of Emergency Abdominopelvic Computed Tomography. J. Imaging 2023, 9, 200. [Google Scholar] [CrossRef] [PubMed]
  52. Cicero, G.; Ascenti, G.; Albrecht, M.H.; Blandino, A.; Cavallaro, M.; D’Angelo, T.; Carerj, M.L.; Vogl, T.J.; Mazziotti, S. Extra-abdominal dual-energy CT applications: A comprehensive overview. Radiol. Med. 2020, 125, 384–397. [Google Scholar] [CrossRef] [PubMed]
Figure 1. Phantom configuration used on all CT scanners.
Applsci 14 01724 g001
Figure 2. Plot of the mean CT numbers against the VMI energies for the various CT scanners and soft tissues: (A) adipose, (B) breast, (C) muscle, (D) liver, and (E) bone 200 mg. The CT numbers reported for the SECT mode are the average of the four CT scanners; the dashed line represents the average value and the solid line represents the variation from the average value. Abbreviations: VMI = virtual monochromatic images, SECT = single-energy CT, DECT = dual-energy CT, CV = coefficient of variation (standard deviation/average).
Applsci 14 01724 g002
Figure 3. Plot of the noise against the VMI energies for the various CT scanners and soft tissues: (A) adipose, (B) breast, (C) muscle, (D) liver, and (E) bone 200 mg. The noise for SECT mode is reported as follows. The dashed lines represent the noise of each Siemens CT scanner; the solid line represents the noise of the GE CT scanner. Abbreviations: VMI = Virtual Monochromatic images, SECT = single-energy CT, DECT = dual-energy CT.
Applsci 14 01724 g003
Table 1. SECT and DECT scan protocols used for phantom acquisitions.
SECT
PROTOCOL
GE
Revolution GSI
Siemens ConfidenceSiemens
Edge
Siemens
Force
kVp120120120120
mAs380380380380
Rotation time (s)1111
Collimation (mm)20 × 1.2516 × 1.232 × 1.296 × 0.6
FOV (cm)50505050
Pitch0.960.950.950.95
Slice Thickness (mm)1.251.501.501.50
Reconstruction algorithm (strength)FBP,
ASIR (30%)
FBP,
SAFIRE (3)
FBP,
ADMIRE (3)
FBP,
ADMIRE (3)
Reconstruction kernelMedium smoothB30Br40Br40
CTDIvol (mGy)34313035
DECT PROTOCOLGE
Revolution GSI
Siemens ConfidenceSiemens
Edge
Siemens
Force
DECT techniquekVp switchingsequential scansplit filterdual source
kVp80–14080–14012080–140
Added filterNoNoAu, SnNo
mAs600600–1421450600–109
Rotation time (s)1111
Collimation (mm)20 × 1.2516 × 1.264 × 0.696 × 0.6
FOV (cm)50505050
Pitch0.960.950.250.95
Slice Thickness (mm)1.251.501.001.50
Reconstruction algorithm (strength)FBP,
ASIR (30%)
FBP,
SAFIRE (3)
FBP,
ADMIRE (3)
FBP,
ADMIRE (3)
Reconstruction kernelMedium smoothD30Qr40Qr40
VMI energy40–140 keV40–140 keV40–140 keV40–140 keV
CTDIvol (mGy)36313132
Abbreviations: SECT = single-energy CT, FOV = field of view, FBP = filtered back projection, DECT = dual-energy CT.
Table 2. RMSE obtained with FBP reconstructions. The values reported are averaged over all acquisitions and slices.
Tissue and EnergyRMSE (HU)
Siemens
Confidence
Siemens
Force
Siemens
Edge
GE
Revolution GSI
Adipose
40 keV14.726.714.35.2
50 keV4.717.210.92.5
70 keV1.38.63.22.2
100 keV1.35.53.21.5
120 keV1.05.45.31.1
140 keV1.15.46.01.1
Breast
40 keV21.926.614.119.0
50 keV13.117.56.310.9
70 keV8.613.06.07.0
100 keV7.311.912.96.3
120 keV7.311.015.26.3
140 keV7.112.116.16.0
Muscle
40 keV4.421.717.514.0
50 keV2.915.89.27.3
70 keV3.510.41.41.8
100 keV4.17.14.82.1
120 keV4.36.36.02.7
140 keV3.85.46.03.8
Liver
40 keV5.110.914.822.5
50 keV5.09.68.213.8
70 keV6.39.66.66.3
100 keV6.58.98.83.8
120 keV6.58.79.62.8
140 keV5.97.99.41.9
Bone 200 mg
40 keV170.8128.997.8161.4
50 keV89.672.547.187.2
70 keV31.638.819.142.4
100 keV13.934.016.929.1
120 keV10.836.418.027.1
140 keV10.434.719.927.7
Abbreviations: RMSE = root mean square error, FBP = filtered back projection.
Table 3. Mean CT number difference (with unadjusted 95% confidence interval) between each of three low energy levels (40, 50, and 70 keV) of DECT with respect to SECT of the most clinically relevant pairwise comparison of five tissue-equivalent inserts for four CT scanners using the FBP reconstruction method. Bold numbers indicate differences between DECT and SECT with statistical significance (p-value < 0.05/30 after multiple comparison correction with the Bonferroni procedure).
Tissue ComparisonDECT Level vs. SECT ImagesMean Difference in HU (95% CI)
Siemens
Confidence
Siemens
Edge
Siemens
Force
GE
Revolution GSI
Adipose
vs.
Breast
40 keV29.7 (28.4; 30.9)14.4 (11.5; 17.2)22.2 (19.4; 25.1)36.0 (35.1; 37.0)
50 keV16.1 (15.2; 17.0)5.7 (4.0; 7.5)8.4 (6.4; 10.5)19.2 (18.6; 19.9)
70 keV2.8 (2.2; 3.4)−2.6 (−3.5; −1.7)−0.8 (−1.5; 0.0)1.9 (1.5; 2.4)
Adipose
vs.
Muscle
40 keV73.9 (72.5; 75.2)89.4 (87.6; 91.3)79.2 (75.9; 82.6)93.6 (92.3; 94.8)
50 keV40.5 (39.5; 41.4)48.3 (47.1; 49.4)39.1 (37.1; 41.2)47.9 (47.0; 48.9)
70 keV7.8 (7.2; 8.3)8.0 (7.3; 8.7)2.9 (1.8; 3.9)1.8 (1.1; 2.5)
Adipose
vs.
Liver
40 keV75.3 (74.3; 76.2)97.4 (94.6; 100.2)67.6 (66.1; 69.2)96.5 (95.0; 98.0)
50 keV41.1 (40.4; 41.8)55.3 (53.4; 57.2)31.6 (30.3; 32.9)49.7 (48.7; 50.6)
70 keV7.6 (7.2; 8.1)14.1 (13.0; 15.2)0.2 (−0.6; 1.0)2.3 (1.7; 2.9)
Breast
vs.
Bone 200 mg
40 keV349.3 (347.8; 350.7)471.3 (469.3; 473.4)376.9 (374.1; 379.7)348.0 (345.5; 350.5)
50 keV189.9 (188.9; 191.0)265.1 (263.6; 266.6)192.9 (190.6; 195.1)181.3 (179.3; 183.3)
70 keV33.4 (32.7; 34.0)62.3 (61.0; 63.5)11.6 (9.7; 13.5)10.5 (9.7; 11.4)
Muscle
vs.
Liver
40 keV1.4 (0.1; 2.7)8.4 (5.5; 11.3)−2.5 (−4.1; −0.9)2.9 (1.3; 4.5)
50 keV0.7 (−0.3; 1.6)7.0 (4.9; 9.1)−4.6 (−5.7; −3.6)1.7 (0.7; 2.7)
70 keV−0.1 (−0.8; 0.5)6.1 (4.8; 7.3)−2.7 (−3.5; −1.8)0.5 (−0.2; 1.2)
Abbreviations: DECT = dual-energy CT, SECT = single-energy CT, FBP = filtered back projection, CI = confidence interval.
Disclaimer/Publisher’s Note: The statements, opinions and data contained in all publications are solely those of the individual author(s) and contributor(s) and not of MDPI and/or the editor(s). MDPI and/or the editor(s) disclaim responsibility for any injury to people or property resulting from any ideas, methods, instructions or products referred to in the content.

