

Influence of Particle Size on Compressed Earth Blocks Properties and Strategies for Enhanced Performance


 ,
,  ,
,  and
and 
Abstract
1. Introduction
Aim of the Study
2. Materials and Methods
2.1. Soil Characterisation
2.2. Compressed Earth Blocks Production and Curing
2.3. Compressed Earth Blocks Characterisation
2.3.1. Bulk Density, Open Porosity, and Moisture Content
2.3.2. Thermal Resistance, Conductivity, and Diffusivity
2.3.3. Compressive Strength, E-Modulus and UPV
2.3.4. Flexural Strength
2.3.5. Water Absorption by Capillarity and Electrical Resistivity Test
2.3.6. Water Absorption by Total Immersion
2.3.7. Erodibility Index
3. Results and Discussion
3.1. Bulk Density, Open Porosity, and Natural Moisture Content
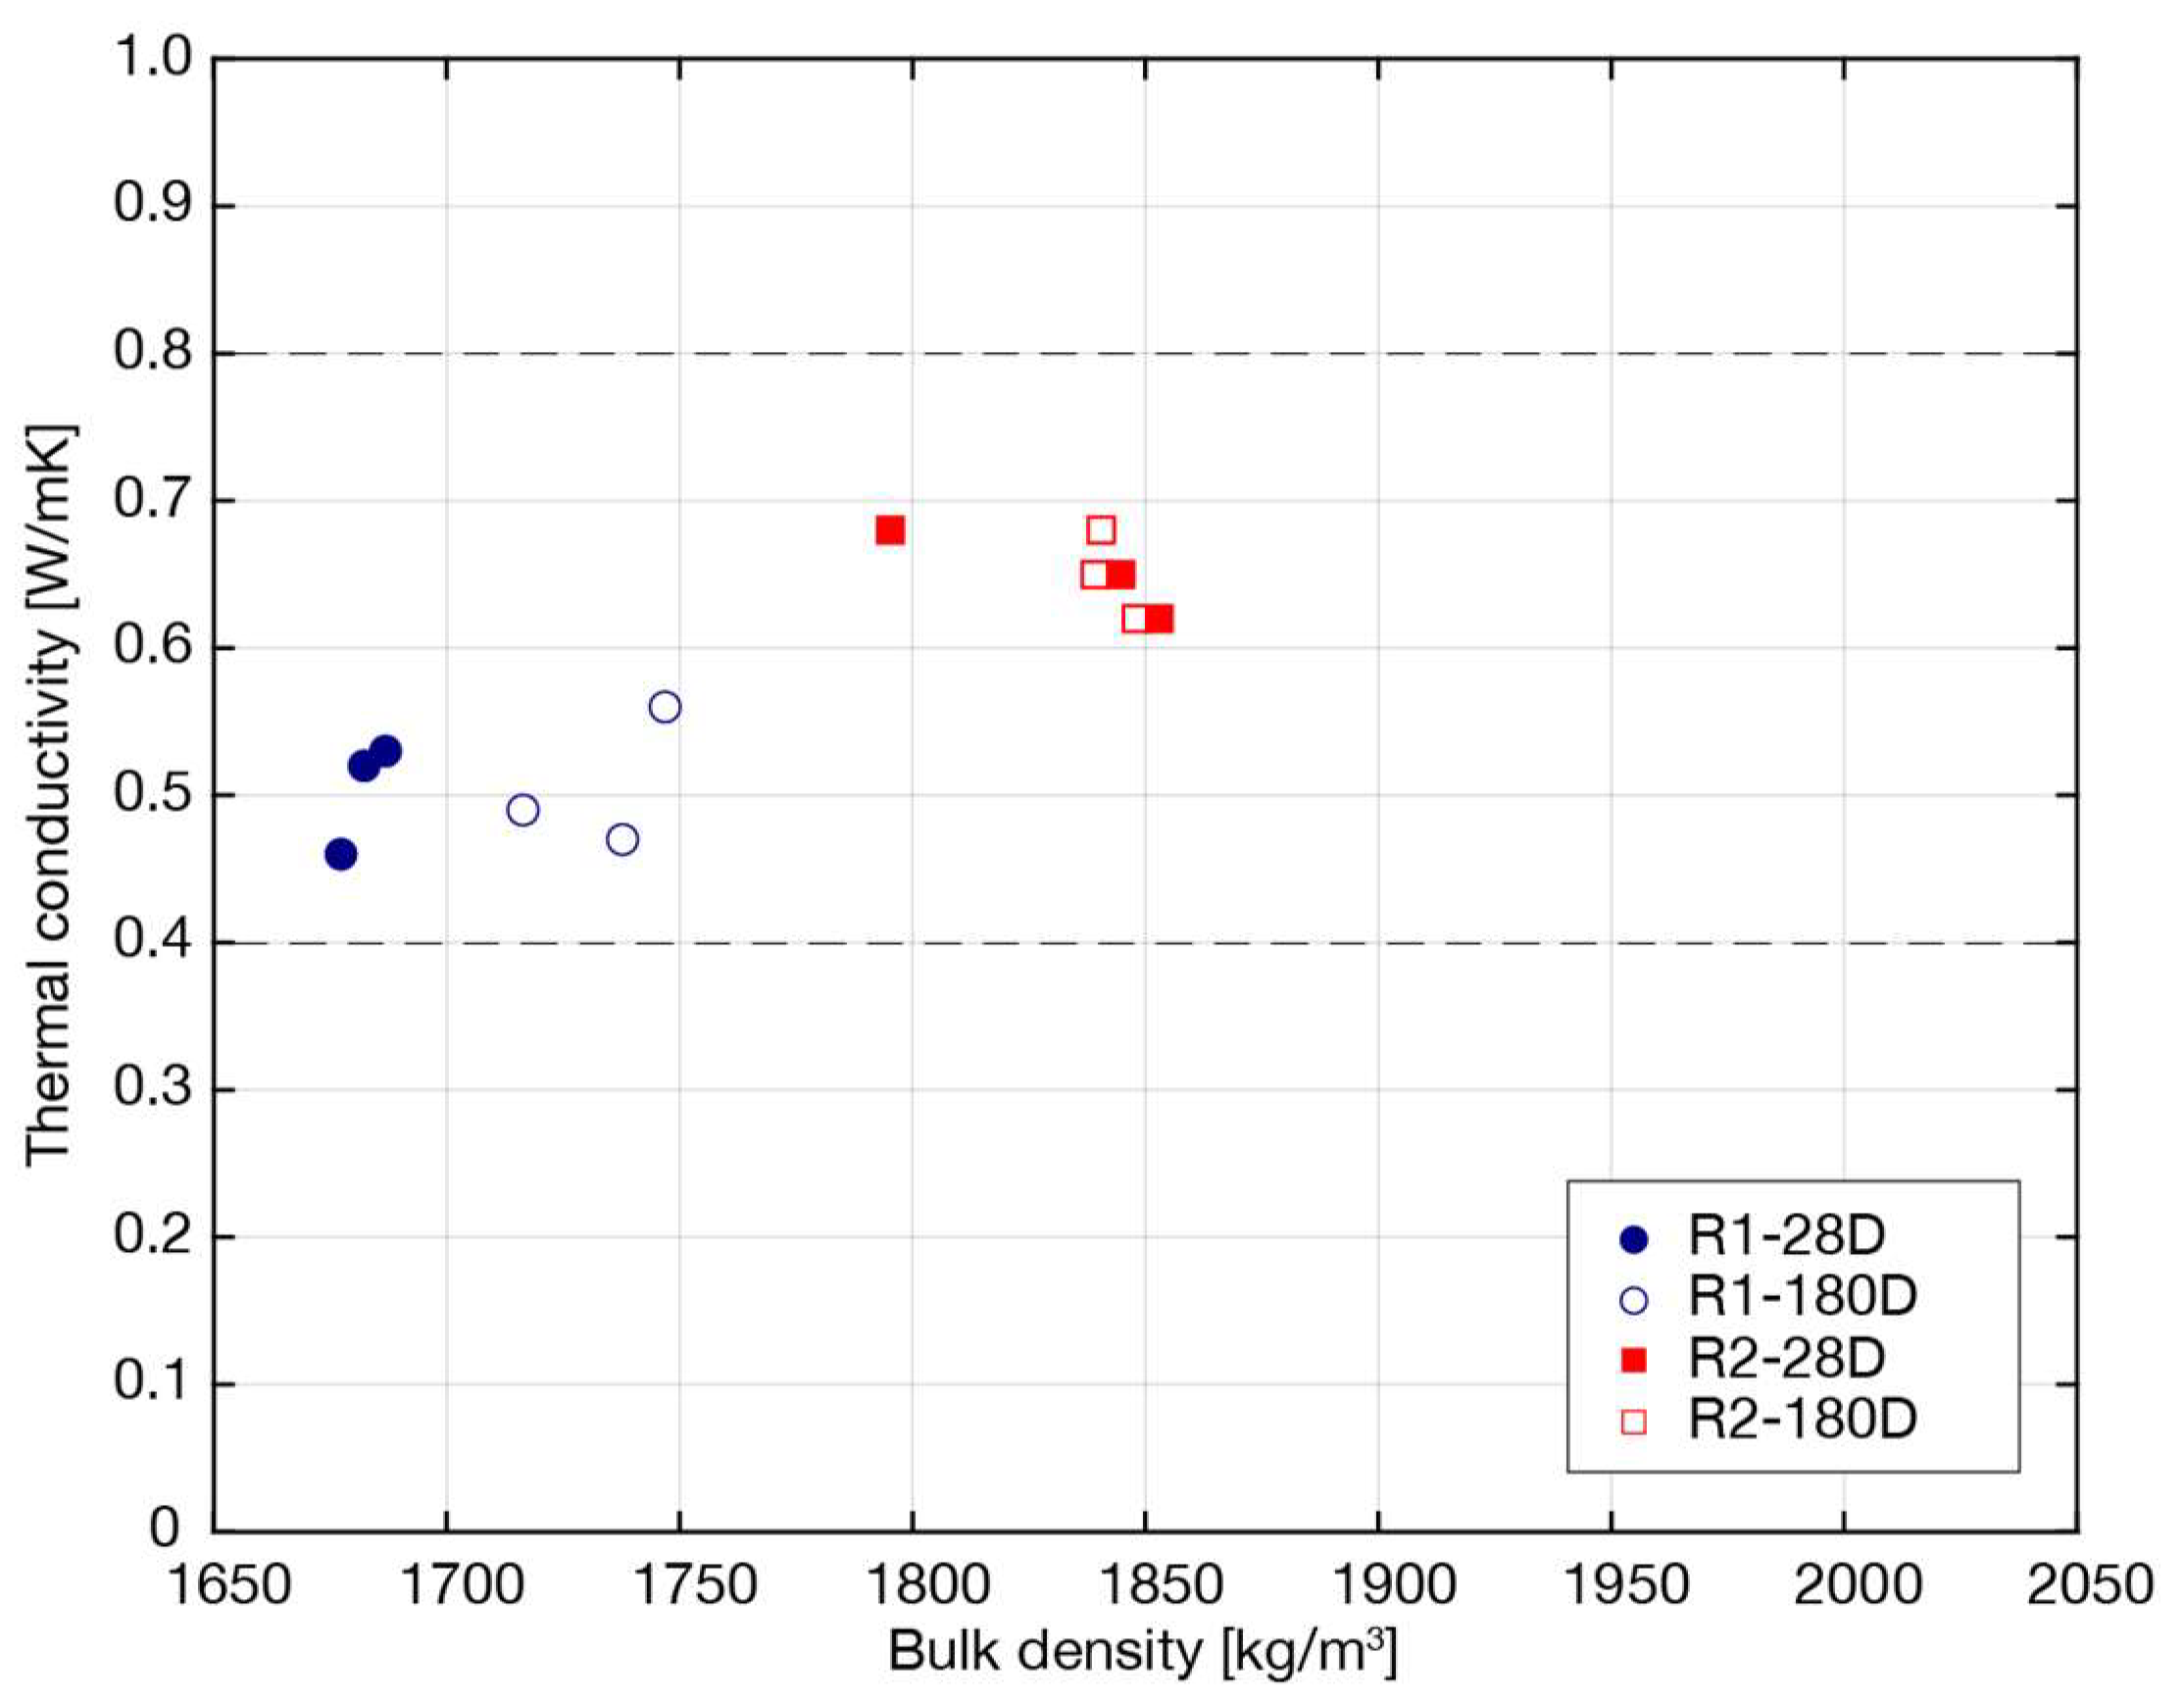
3.2. Thermal Resistance, Conductivity, and Diffusivity
- Soil particle mineralogy—the sieving strategy adopted to modify the grain size curve of the natural soil made it possible not to alter its mineralogy. Alternatively, sand should have been added. Considering that quartz, the most common constituent of sand can have three times higher the thermal conductivity of clay minerals, i.e., 8.80 W/mK vs. 3.0 W/mK [41], it is reasonable to suspect that, when this element is added to alter the PSD of the soil, the thermal response will inevitably be altered as well.
- Moisture content—thermal results presented refer to a dry-reached state. It is generally acknowledged that moisture content has a great influence on the thermal attributes of a hygroscopic material such as soil. However, the extent of this influence has not been conclusively established [4]. Consequently, when presenting thermal parameters, it is common to refer to dry-state conditions to avoid excessive fluctuations in results and to establish a baseline. Indeed, depending on the degree of saturation, water menisci between soil particles act as bridges for heat transfer. A study from 2015 [38] showed that thermal conductivity was lower in fine sands than in coarse ones under dry conditions but higher in fine sands than in coarser ones at low moisture content.
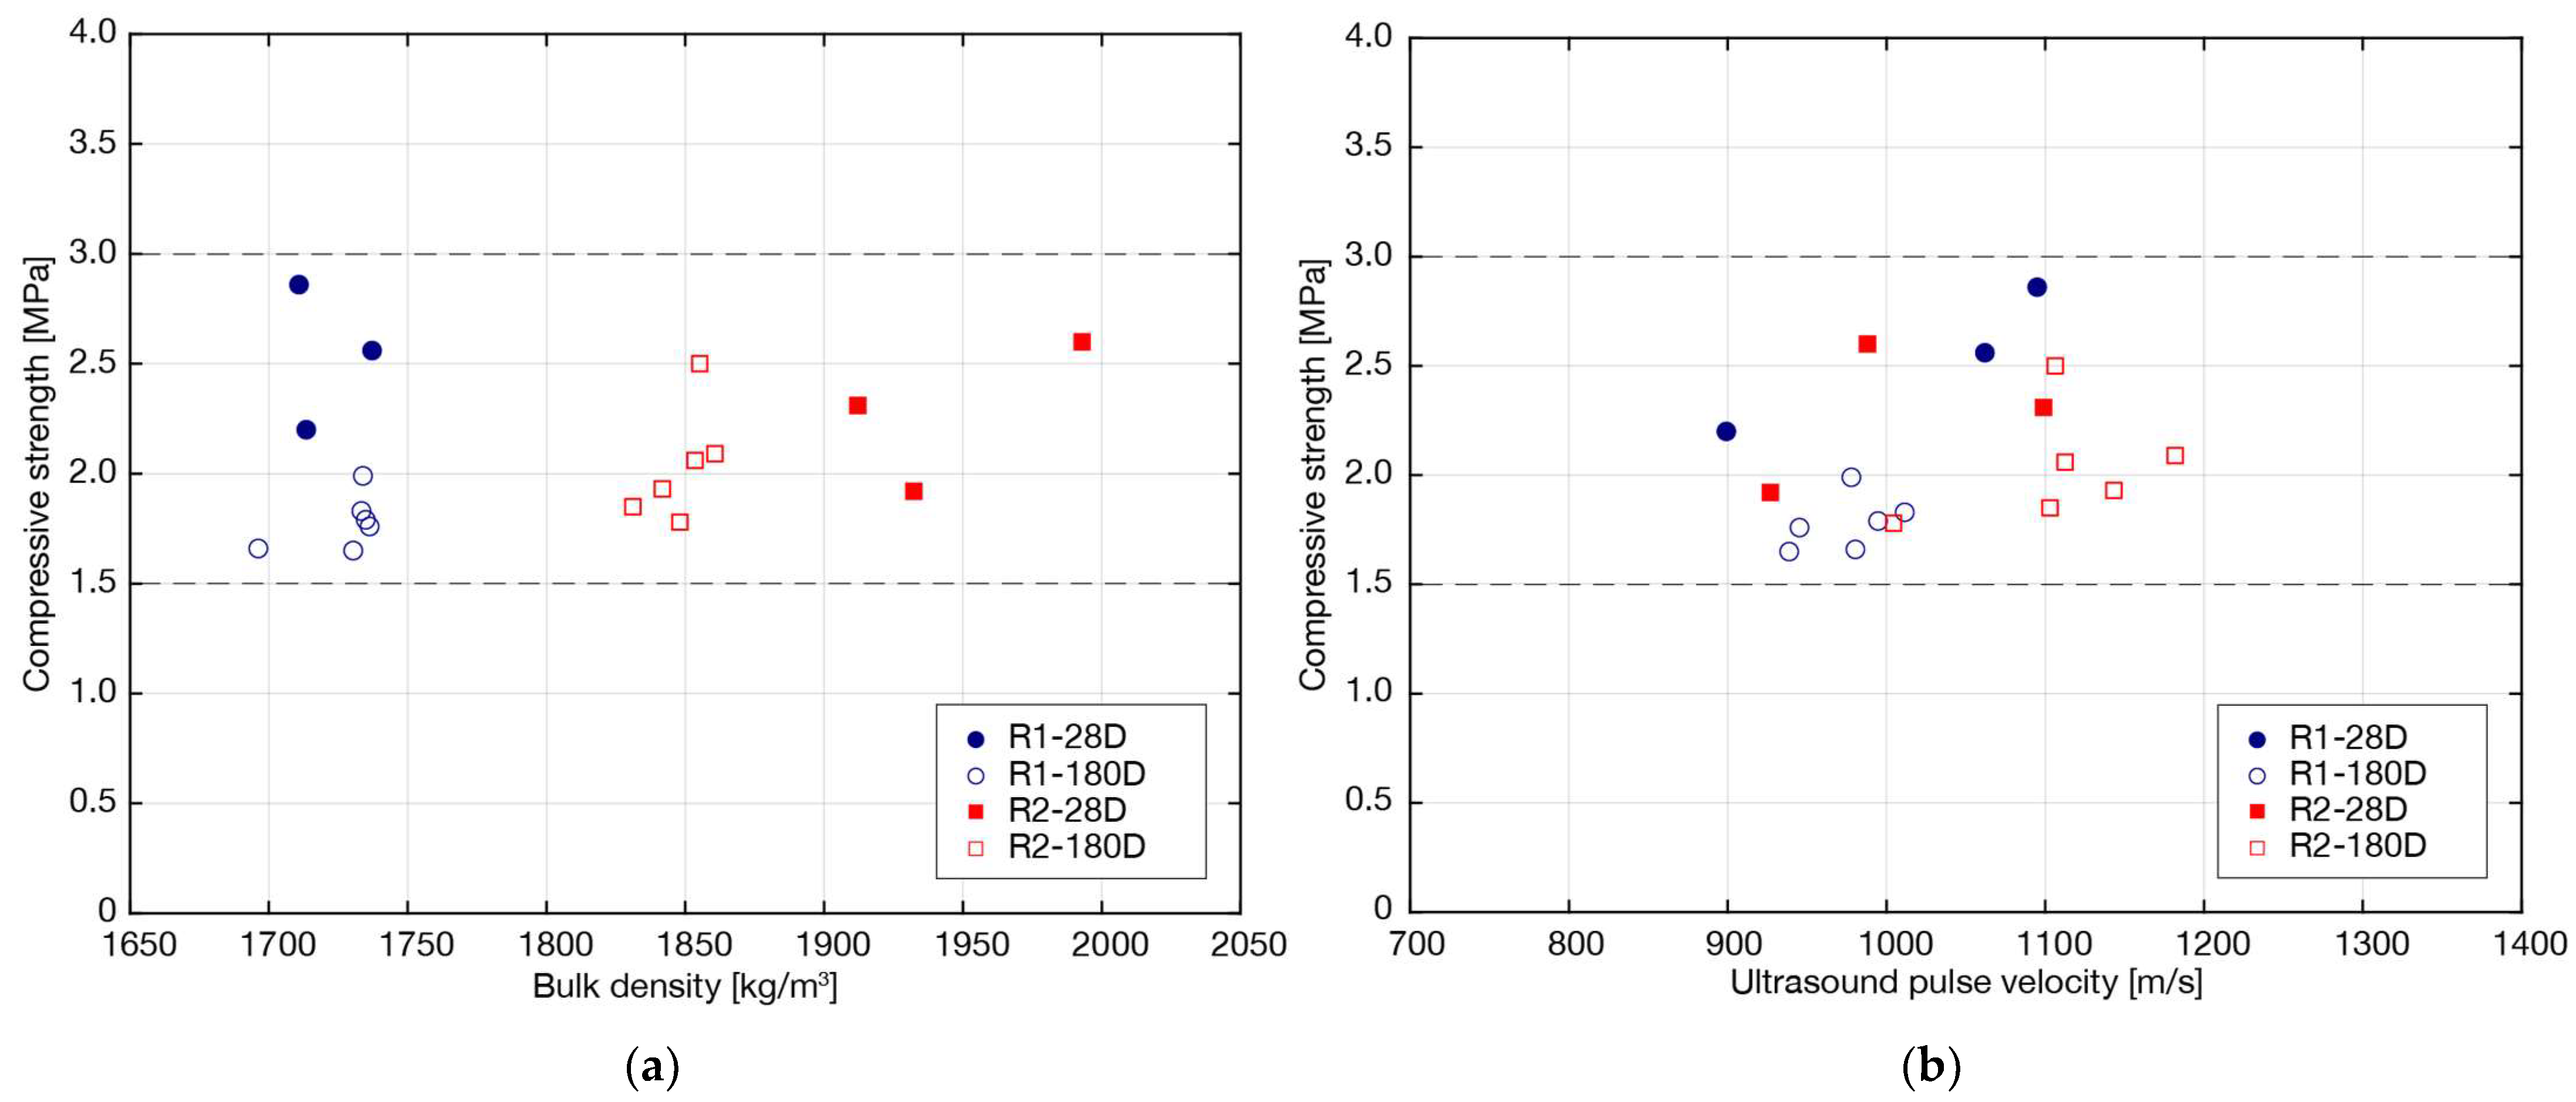
3.3. Compressive Strength, E-Modulus and UPV
3.4. Flexural Strength
3.5. Water Absorption by Capillarity and Electrical Resistivity
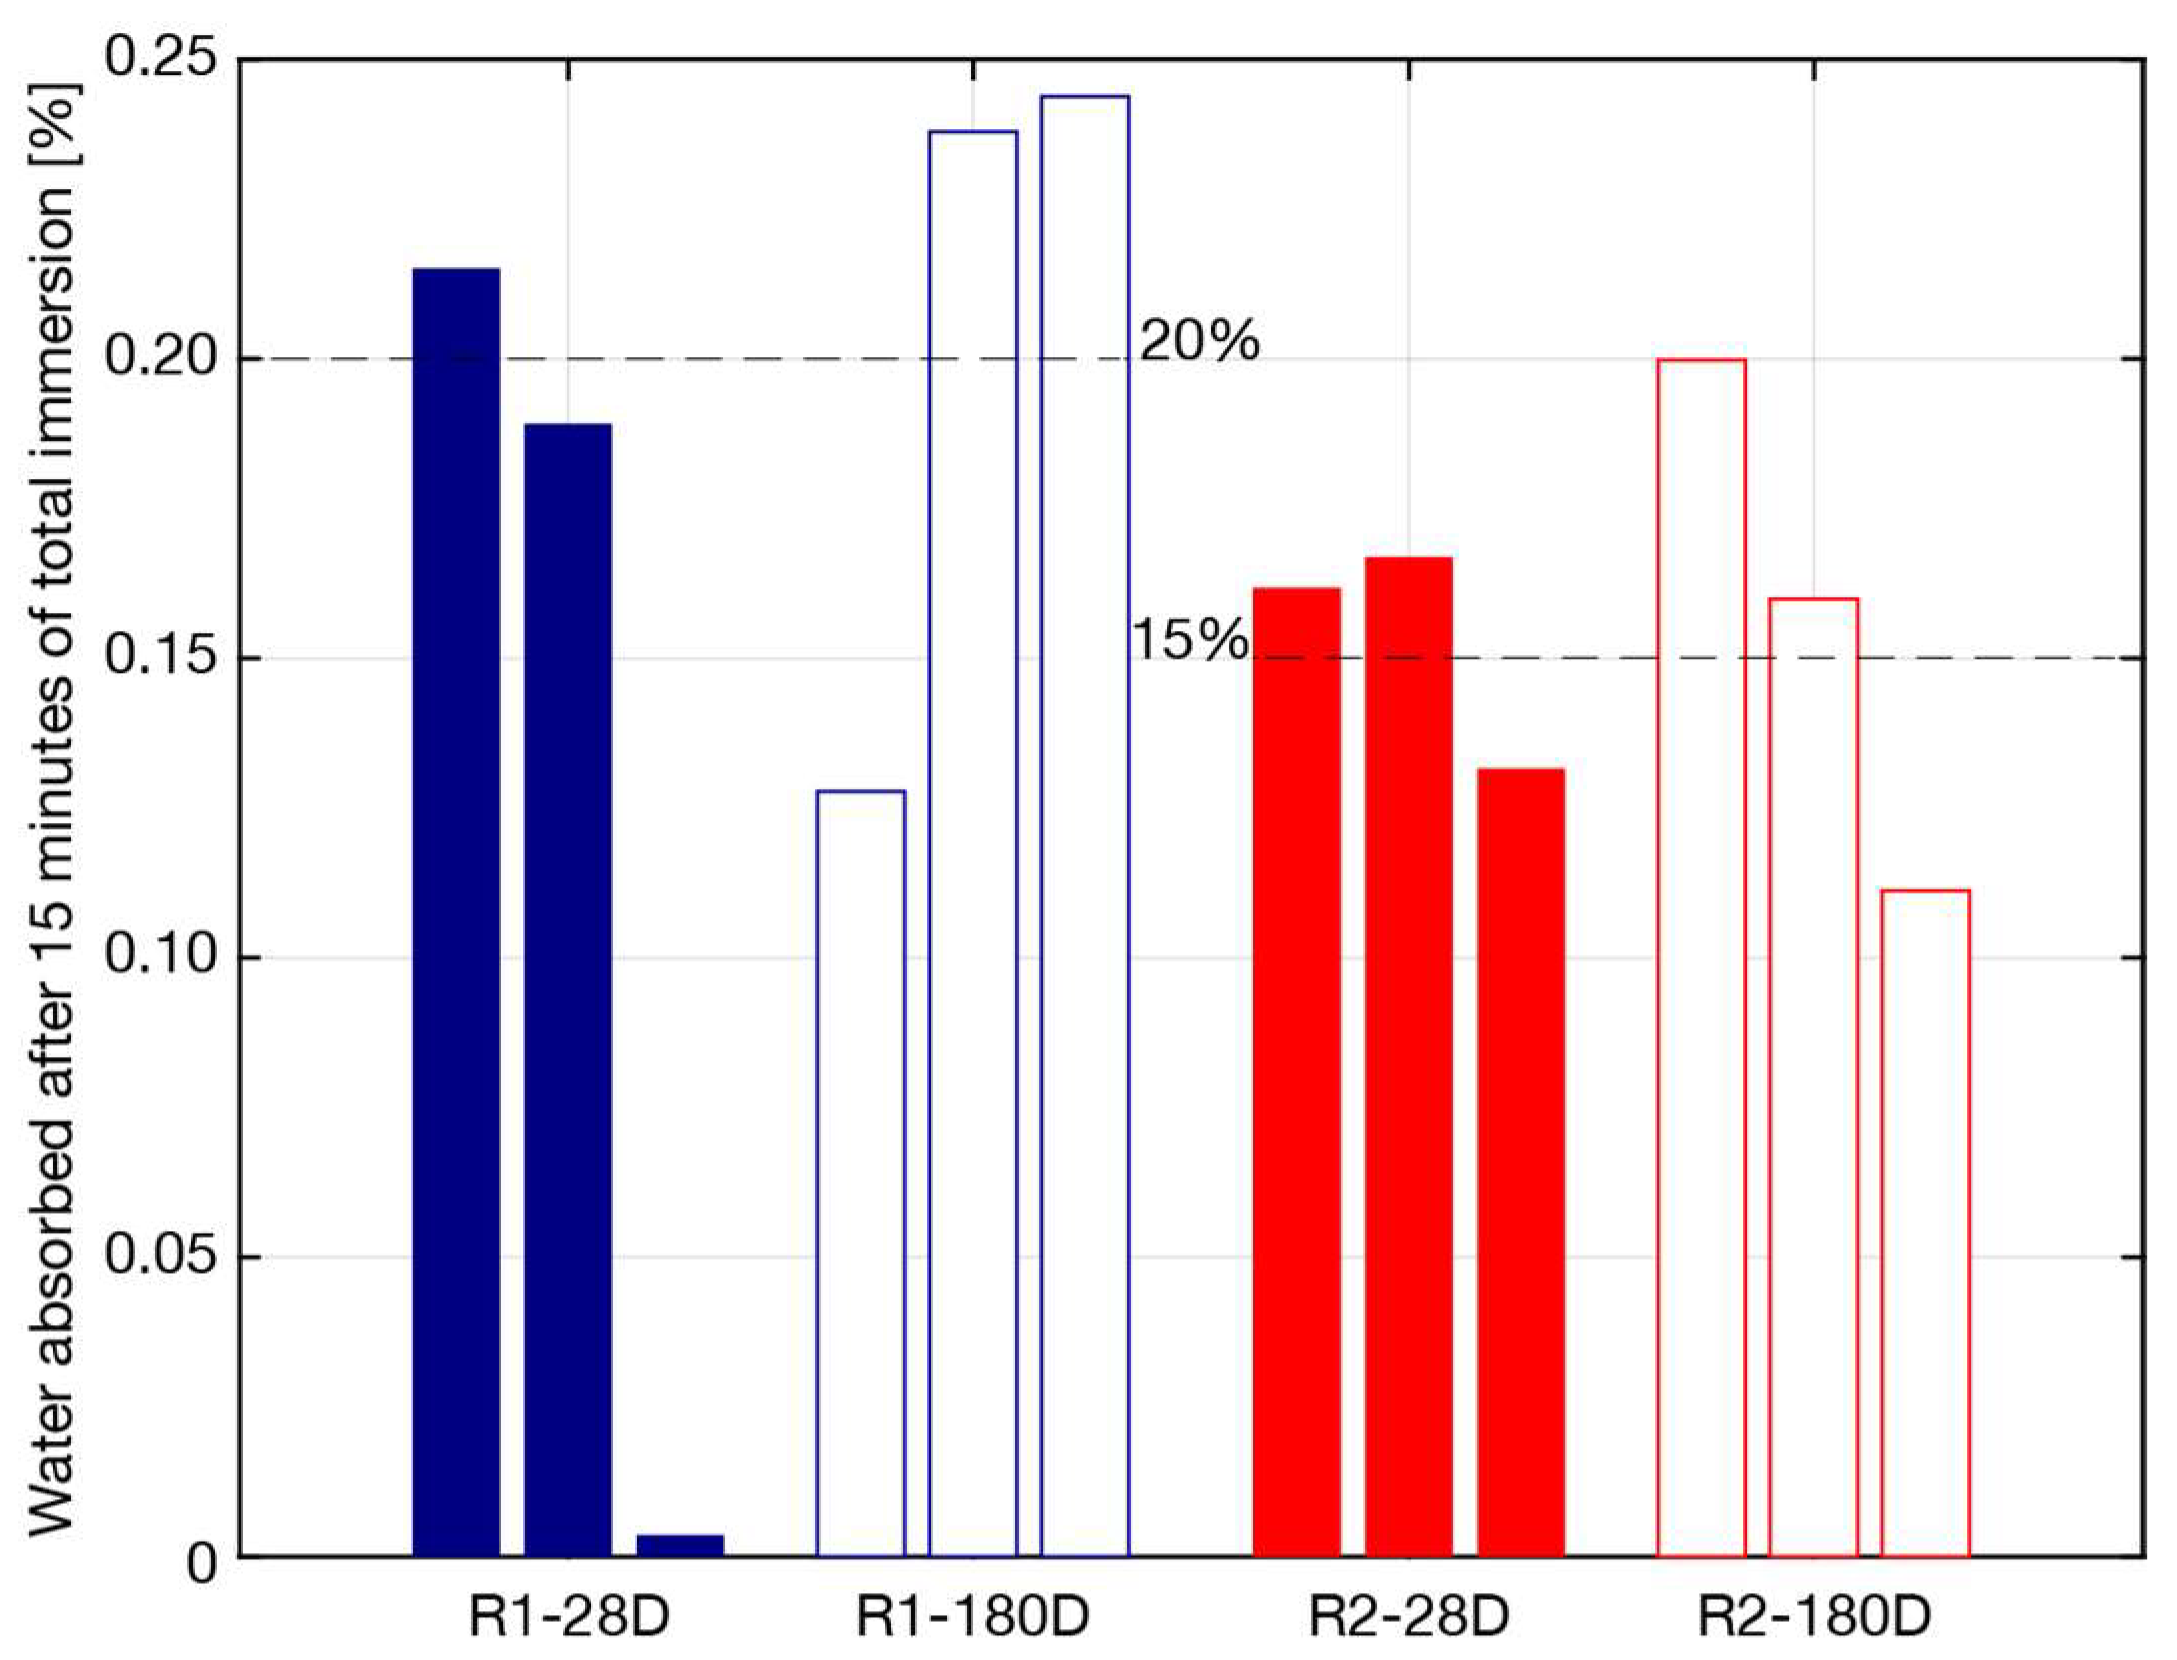
3.6. Water Absorption by Total Immersion
3.7. Erodibility Index
3.8. Overview and Final Remarks
4. Conclusions
Author Contributions
Funding
Institutional Review Board Statement
Informed Consent Statement
Data Availability Statement
Conflicts of Interest
References
- Fernandes, J.; Peixoto, M.; Mateus, R.; Gervásio, H. Life cycle analysis of environmental impacts of earthen materials in the Portuguese context: Rammed earth and compressed earth blocks. J. Clean. Prod. 2019, 241, 118286. [Google Scholar] [CrossRef]
- Schweiker, M.; Endres, E.; Gosslar, J.; Hack, N.; Hildebrand, L.; Creutz, M.; Klinge, A.; Kloft, H.; Knaack, U.; Mehnert, J.; et al. Ten questions concerning the potential of digital production and new technologies for contemporary earthen constructions. Build. Environ. 2021, 206, 108240. [Google Scholar] [CrossRef]
- Ben-Alon, L.; Rempel, A.R. Thermal comfort and passive survivability in earthen buildings. Build. Environ. 2023, 238, 110339. [Google Scholar] [CrossRef]
- Fabbri, A.; Aubert, J.-E.; Bras, A.A.; Faria, P.; Gallipoli, D.; Goffart, J.; McGregor, F.; Perlot-Bascoules, C.; Soudani, L. Hygrothermal and Acoustic Assessment of Earthen Materials. In Testing and Characterisation of Earth-Based Building Materials and Elements; Springer: Berlin/Heidelberg, Germany, 2022; pp. 83–126. [Google Scholar] [CrossRef]
- Rigassi, V. Compressed Earth Blocks: Manual of Production; Deutsches Zentrum für Entwicklungstechnologien: Tübingen, Germany, 1985. [Google Scholar]
- Fabbri, A.; Morel, J.C.; Aubert, J.-E.; Bui, Q.-B.; Gallipoli, D.; Ventura, A.; Reddy, V.B.V.; Hamard, E.; Pelé-Peltier, A.; Abhilash, H.N. An overview of the remaining challenges of the RILEM TC 274-TCE, testing and characterisation of earth-based building materials and elements. RILEM Tech. Lett. 2022, 6, 150–157. [Google Scholar] [CrossRef]
- Mansour, M.B.; Jelidi, A.; Cherif, A.S.; Jabrallah, S.B. Optimizing thermal and mechanical performance of compressed earth blocks (CEB). Constr. Build. Mater. 2016, 104, 44–51. [Google Scholar] [CrossRef]
- Cuccurullo, A.; Gallipoli, D.; Bruno, A.W.; Augarde, C.; Hughes, P.; La Borderie, C. Influence of particle grading on the hygromechanical properties of hypercompacted earth. J. Build. Pathol. Rehabil. 2020, 5, 2. [Google Scholar] [CrossRef]
- Cuccurullo, A.; Gallipoli, D.; Bruno, A.W.; Augarde, C.; Hughes, P.; La Borderie, C. A comparative study of the effects of particle grading and compaction effort on the strength and stiffness of earth building materials at different humidity levels. Constr. Build. Mater. 2021, 306, 124770. [Google Scholar] [CrossRef]
- Reddy, B.V.V.; Latha, M.S. Influence of soil grading on the characteristics of cement stabilised soil compacts. Mater. Struct. Mater. Et. Constr. 2013, 47, 1633–1645. [Google Scholar] [CrossRef]
- Hall, M.; Allinson, D. Assessing the effects of soil grading on the moisture content-dependent thermal conductivity of stabilised rammed earth materials. Appl. Therm. Eng. 2009, 29, 740–747. [Google Scholar] [CrossRef]
- Van Damme, H.; Houben, H. Earth concrete. Stabilization revisited. Cem. Concr. Res. 2018, 114, 90–102. [Google Scholar] [CrossRef]
- Nagaraj, H.B.; Rajesh, A.; Sravan, M.V. Influence of soil gradation, proportion and combination of admixtures on the properties and durability of CSEBs. Constr. Build. Mater. 2016, 110, 135–144. [Google Scholar] [CrossRef]
- Malkanthi, S.N.; Perera, A. Particle Packing Application for Improvement in the Properties of Compressed Stabilized Earth Blocks with Reduced Clay and Silt. Eng. Technol. Appl. Sci. Res. 2019, 9, 4538–4542. Available online: www.etasr.com (accessed on 4 August 2023). [CrossRef]
- Malkanthi, S.N.; Wickramasinghe, W.G.S.; Perera, A. Use of construction waste to modify soil grading for compressed stabilized earth blocks (CSEB) production. Case Stud. Constr. Mater. 2021, 15, e00717. [Google Scholar] [CrossRef]
- CRATerre-EAG. Compressed Earth Blocks: Standards—Technology Series No.11; CRATerre-EAG: Rome, Italy, 1998. [Google Scholar]
- Delgado, M.C.J.; Guerrero, I.C. The selection of soils for unstabilised earth building: A normative review. Constr. Build. Mater. 2007, 21, 237–251. [Google Scholar] [CrossRef]
- LNEC NP 143, Solos; Determinação dos Limites de Consistencia—Soils. Determination of Consistency Limits. LNEC: Lisbon, Portugal, 1969. (In Portuguese)
- LNEC NP-83, Solos; Determinação da Densidade das Partículas—Soils. Determination of Particle Density. LNEC: Lisbon, Portugal, 1965. (In Portuguese)
- E1269-11; Standard Test Method for Determining Specific Heat Capacity by Differential Scanning Calorimetry. ASTM International: West Conshohocken, PA, USA, 2011.
- LNEC E 197, Solos; Ensaio de Compactação—Soils. Compaction Test. LNEC: Lisbon, Portugal, 1966. (In Portuguese)
- NP EN 933-8; Ensaios das Propriedades Geométricas dos Agregados: Parte 8: Determinação do Teor de Finos: Ensaio do Equivalente de Areia—Tests for Geometrical Properties of Aggregates: Part 8: Assessment of Fines: Sand Equivalent Test. Instituto Português da Qualidade: Caparica, Portugal, 2002. (In Portuguese)
- NP EN 933-9; Ensaios das Propriedades Geométricas dos Agregados: Parte 9: Determinação do Teor de Finos: Ensaio do Azul de Metileno—Tests for Geometrical Properties of Aggregates: Part 9: Assessment of Fines: Methylene Blue Test. Instituto Português da Qualidade: Caparica, Portugal, 2002. (In Portuguese)
- ASTM D 2974; Standard Test Methods for Moisture, Ash, and Organic Matter of Peat and Other Organic Soils. ASTM International: West Conshohocken, PA, USA, 2014.
- Minke, G. Building with Earth: Design and Technology of a Sustainable Architecture; Walter de Gruyter GmbH: Berlin, Germany, 2009. [Google Scholar] [CrossRef]
- ASTM C1363; 11 Standard Test Method for Thermal Performance of Building Materials and Envelope Assemblies by Means of a Hot Box Apparatus 1. American Society for Testing Materials 90: West Conshohocken, PA, USA, 2014.
- ISO 9869-1:2014; Thermal Insulation—Building Elements—Insitu Measurement of Thermal Resistance and Thermal Transmittance; Part 1: Heat Flow Meter Method. BSI: London, UK, 2014.
- Teixeira, E.R.; Machado, G.; De Adilson, P.; Guarnier, C.; Fernandes, J.; Silva, S.M.; Mateus, R. Mechanical and thermal performance characterisation of compressed earth blocks. Energies 2020, 13, 2978. [Google Scholar] [CrossRef]
- NP EN 772-1; Método de Ensaio de Blocos Para Alvenaria. Parte 1: Determinação da Resistência à Compressão—Methods of Test for Masonry Units. Part 1: Determination of Compressive Strength. Instituto Português da Qualidade: Caparica, Portugal, 2002. (In Portuguese)
- NP EN 12504-4; Ensaios do Betão nas Estruturas. Parte 4: Determinação da Velocidade de Propagação dos Ultra-Sons—Testing Concrete in Structures. Part 4: Determination of Ultrasonic Pulse Velocity. Instituto Português da Qualidade: Caparica, Portugal, 2007. (In Portuguese)
- Carrasco, E.V.M.; Silva, S.R.; Mantilla, J.N.R. Assessment of Mechanical Properties and the Influence of the Addition of Sawdust in Soil–Cement Bricks Using the Technique of Ultrasonic Anisotropic Inspection. J. Mater. Civ. Eng. 2014, 26, 219–225. [Google Scholar] [CrossRef]
- Kasinikota, P.; Tripura, D.D. Prediction of physical-mechanical properties of hollow interlocking compressed unstabilized and stabilized earth blocks at different moisture conditions using ultrasonic pulse velocity. J. Build. Eng. 2022, 48, 103961. [Google Scholar] [CrossRef]
- LNEC E 393, Betões; Determinação da Absorção de Água por Capilaridade—Concrete. Determination of the Absorption of Water through Capillarity. LNEC: Lisbon, Portugal, 1993. (In Portuguese)
- LNEC E 394, Betões; Determinação da Absorção de Água por Imersão—Concrete. Determination of the Absorption of Water by Immersion. LNEC: Lisbon, Portugal, 1993. (In Portuguese)
- NZS 4298; Materials and Workmanship for Earth Buildings. Standards New Zealand: Wellington, New Zealand, 1998.
- Zheng, J.; Carlson, W.B.; Reed, J.S. The packing density of binary powder mixtures. J. Eur. Ceram. Soc. 1995, 15, 479–483. [Google Scholar] [CrossRef]
- Kwan, A.K.H.; Chan, K.W.; Wong, V. A 3-parameter particle packing model incorporating the wedging effect. Powder Technol. 2013, 237, 172–179. [Google Scholar] [CrossRef]
- Zhang, N.; Yu, X.; Pradhan, A.; Puppala, A.J. Effects of Particle Size and Fines Content on Thermal Conductivity of Quartz Sands. Transp. Res. Rec. 2015, 2510, 36–43. [Google Scholar] [CrossRef]
- Moevus, M.; Anger, R.; Fontaine, L. Hygro-Thermo-Mechanical Properties of Earthen Materials for Construction: A Literature Review. In Proceedings of the Terra 2012, XIth International Conference on the Study and Conservation of Earthen Architectural Heritage, Lima, Peru, 22–27 April 2012; pp. 1–10. [Google Scholar]
- Gemant, A. The thermal conductivity of soils. J. Appl. Phys. 1950, 21, 750–752. [Google Scholar] [CrossRef]
- Ochsner, T. Rain or Shine: An Introduction to Soil Physical Properties and Processes; Oklahoma State University Library: Stillwater, OK, USA, 2019. [Google Scholar] [CrossRef]
- He, H.; He, Y.; Cai, G.; Wang, Y.; Zhang, G. Influence of particle size and packing on the thermal conductivity of carbonate sand. Granul. Matter 2022, 24, 117. [Google Scholar] [CrossRef]
- Persson, B.N.J. Heat transfer in granular media consisting of particles in humid air at low confining pressure. Eur. Phys. J. B 2023, 96, 14. [Google Scholar] [CrossRef]
- Midttømme, K.; Roaldset, E. The effect of grain size on thermal conductivity of quartz sands and silts. Pet. Geosci. 1998, 4, 165–172. [Google Scholar] [CrossRef]
- Boulmaali, M.; Belhamri, A. Investigation of thermal inertia and hydric properties of an eco-building material: Compressed stabilized earth blocks. Heat. Mass. Transf. 2023, 59, 713–727. [Google Scholar] [CrossRef]
- Zhang, L.; Gustavsen, A.; Jelle, B.P.; Yang, L.; Gao, T.; Wang, Y. Thermal conductivity of cement stabilized earth blocks. Constr. Build. Mater. 2017, 151, 504–511. [Google Scholar] [CrossRef]
- Bruno, A.W.; Gallipoli, D.; Perlot, C.; Kallel, H. Thermal performance of fired and unfired earth bricks walls. J. Build. Eng. 2020, 28, 101017. [Google Scholar] [CrossRef]
- Adam, E.A.; Jones, P.J. Thermophysical properties of stabilised soil building blocks. Build. Env. 1995, 30, 245–253. [Google Scholar] [CrossRef]
- Turco, C.; Junior, A.C.P.; Teixeira, E.; Mateus, R. Optimisation of Compressed Earth Blocks (CEBs) using natural origin materials: A systematic literature review. Constr. Build. Mater. 2021, 309, 125140. [Google Scholar] [CrossRef]
- Turco, C.; de Paula Junior, A.; Teixeira, E.; Mateus, R. Authors closure to the Discussion of the Review article “Optimisation of Compressed earth blocks (CEBs) using natural origin materials: A systematic literature review”. Constr. Build. Mater. 2022, 325, 126888. [Google Scholar] [CrossRef]
- Fabbri, A.; Morel, J.C.; Aubert, J.E.; Bui, Q.B.; Gallipoli, D.; Reddy, B.V.V. Testing and Characterisation of Earth-Based Building Materials and Elements: State-of-the-Art Report of the RILEM TC 274-TCE; Springer: Berlin/Heidelberg, Germany, 2022. [Google Scholar]
- Atiki, E.; Taallah, B.; Feia, S.; Almeasar, K.S.; Guettala, A. Effects of Incorporating Date Palm Waste as a Thermal Insulating Material on the Physical Properties and Mechanical Behavior of Compressed Earth Block. J. Nat. Fibers 2022, 19, 8778–8795. [Google Scholar] [CrossRef]
- Galán-Marín, C.; Rivera-Gómez, C.; Bradley, F. Ultrasonic, molecular and mechanical testing diagnostics in natural fibre reinforced, polymer-stabilized earth blocks. Int. J. Polym. Sci. 2013, 2013, 130582. [Google Scholar] [CrossRef]
- Idder, A.; Hamouine, A.; Labbaci, B.; Abdeldjebar, R. The porosity of stabilized earth blocks with the addition plant fibers of the date palm. Civ. Eng. J. 2020, 6, 478–494. [Google Scholar] [CrossRef]
- Sturm, T.; Ramos, L.F.; Lourenço, P.B. Characterization of dry-stack interlocking compressed earth blocks. Mater. Struct./Mater. Et. Constr. 2015, 48, 3059–3074. [Google Scholar] [CrossRef]
- Samouëlian, A.; Cousin, I.; Tabbagh, A.; Bruand, A.; Richard, G. Electrical resistivity survey in soil science: A review. Soil. Tillage Res. 2005, 83, 173–193. [Google Scholar] [CrossRef]
- Beckett, C.T.S.; Jaquin, P.A.; Morel, J.C. Weathering the storm: A framework to assess the resistance of earthen structures to water damage. Constr. Build. Mater. 2020, 242, 118098. [Google Scholar] [CrossRef]
- Panagiotou, R.; Kyriakides, M.A.A.; Illampas, R.; Ioannou, I. An experimental approach for the investigation of the performance of non-stabilized Compressed Earth Blocks (CEBs) against water-mediated weathering. J. Cult. Herit. 2022, 57, 184–193. [Google Scholar] [CrossRef]


| R1 Soil (≤2.0 mm) | R2 Soil (≤12.5 mm) | Test Methods | Standards | |||
|---|---|---|---|---|---|---|
| Consistency limits 1 | wL = 29.5%, wP = 18.5%, IP = 11% | Atterberg limits | NP-143 [18] | |||
| Particle density 1 | 2.71 g/cm3 | Pycnometer test | NP-83 [19] | |||
| Specific heat (at 26.85 °C) 1,2 | 883.93 J/kg°C | Diff. Scan. Calorim. | ASTM E1269 [20] | |||
| Maximum dry density | 1.97 | g/cm3 | 2.01 | g/cm3 | Proctor test | E 197 (1966) [21] |
| Optimum water content | 12.2 | % | 12.0 | % | ||
| Sand content | 15.34 | % | 18.80 | % | Sand equivalent test | NP EN933-8 (2002) [22] |
| Activity of clay minerals | 0.57 | mg/g | 0.67 | mg/g | Blue methylene test | NP EN933-9 (2002) [23] |
| Organic content | 3.90 | % | 3.50 | % | Loss on ignition test | ASTM D2974 [24] |
| Characteristics | Equations | Units | Symbols | |
|---|---|---|---|---|
| Bulk density | γ = m/V | (1) | [kg/m3] | m and V are the mass and the volume of the block |
| Open porosity | φ = 1 – (γd/γs) | (2) | [%] | γd is the dry bulk density, γs and is the soil particle density (Table 1) |
| Natural moisture content | ω = (γ−γd)/γ | (3) | [%] | γ is the bulk density at the natural moisture content, γd is the dry bulk density |
| Characteristics | Equations | Units | Symbols | |
|---|---|---|---|---|
| Thermal resistance | R = ΔT/q | (4) | [m2K/W] | ΔT is the temperature difference, and q is the heat flux |
| Thermal conductivity | λ = d/R | (5) | [W/mK] | d is the thickness of the material, and R is the thermal resistance |
| Thermal diffusivity | α = λ/(γ Cp) | (6) | [m2/s] | λ is the dry-state thermal conductivity, γ is the bulk density, and Cp is the specific heat (see Table 1) |
| Characteristics | Equations | Units | Symbols | |
|---|---|---|---|---|
| Ultimate compressive strength | σc = F/A | (7) | [MPa] | F is the maximum load achieved before rupture, and A is the contact area |
| E-Modulus | E = σ/ε | (8) | [MPa] | σ and ε are stress and strain of the elastic section |
| Ultrasound Pulse Velocity | UPV = L/t | (9) | [m/s] | L is the distance between the transducers considered, and t is the time |
| Ultimate flexural strength | σf = 3FL/2bd2 | (10) | [MPa] | F is the maximum load achieved before rupture, L is the support span, and b and d are the block’s width and thickness, respectively |
| Characteristics | Equations | Units | Symbols | |
|---|---|---|---|---|
| Water absorptionby capillarity | Cb = (m1 − m0)/A√t | (11) | [g/(cm2√min)] | m0 is the mass of the block before immersion in water, m1 is the mass of the block after immersion in water, A is the contact area, and t is the immersion time |
| Electrical resistivity | ρ = V/I | (12) | [kΩcm] | V is the voltage, and I is the current |
| Water absorptionby total immersion | W = (m1 − m0)/(m1 − m2) | (13) | [%] | m0 is the dry mass of the specimen, m1 is the saturated mass of the specimen in the air, and m2 is the hydrostatic mass of the saturated specimen |
| Erodibility index | D = d/t | (14) | [mm/hr] | d is the thickness of the block, and t is the time taken for full penetration |
| R1 CEBs | R2 CEBs | |||||||
|---|---|---|---|---|---|---|---|---|
| γd [kg/m3] | R-Value [m2K/W] | λ [W/mK] | α [m2/s] | γd [kg/m3] | R-Value [m2K/W] | λ [W/mK] | α [m2/s] | |
| 28 days | 1682.16 ± 4.78 (0.28%) | 0.302 ± 0.023 (7.65%) | 0.501 ± 0.039 (7.72%) | 3.37 × 10⁻⁷ ± 2.52 × 10⁻⁸ (7.46%) | 1830.98 ± 31.21 (1.70%) | 0.232 ± 0.010 (4.31%) | 0.653 ± 0.030 (4.66%) | 4.04 × 10⁻⁷ ± 2.56 × 10⁻⁸ (6.33%) |
| 180 days | 1733.67 ± 15.64 (0.90%) | 0.299 ± 0.026 (8.55%) | 0.505 ± 0.045 (8.90%) | 3.29 × 10⁻⁷ ± 2.76 × 10⁻⁸ (8.37%) | 1842.59 ± 4.75 (0.26%) | 0.231 ± 0.010 (4.13%) | 0.650 ± 0.027 (4.11%) | 3.99 × 10⁻⁷ ± 1.72 × 10⁻⁸ (4.32%) |
| R1 CEBs | R2 CEBs | |||||||
|---|---|---|---|---|---|---|---|---|
| γ [kg/m3] | σc [MPa] | E-Modulus [MPa] | UPV [m/s] | γ [kg/m3] | σc [MPa] | E-Modulus [MPa] | UPV [m/s] | |
| 28 days | 1720.47 ± 14.50 (0.84%) | 2.54 ± 0.33 (13.01%) | 55.65 ± 21.22 (38.13%) | 1018.65 ± 104.83 (10.29%) | 1945.79 ± 42.05 (2.16%) | 2.27 ± 0.34 (15.00%) | 53.61 ± 1.69 (3.15%) | 1004.57 ± 87.21 (8.68%) |
| 180 days | 1727.49 ± 15.47 (0.90%) | 1.78 ± 0.11 (6.42%) | 40.46 ± 2.12 (5.25%) | 974.71 ± 28.15 (2.89%) | 1848.36 ± 10.66 (0.58%) | 2.03 ± 0.23 (11.49%) | 46.21 ± 1.86 (4.02%) | 1113.33 ± 63.46 (5.70%) |
| R1 CEBs | R2 CEBs | |||
|---|---|---|---|---|
| γ [kg/m3] | σf [MPa] | γ [kg/m3] | σf [Mpa] | |
| 28 days | 1737.45 ± 18.53 (1.07%) | 0.25 ± 0.014 (5.59%) | 1944.29 ± 44.92 (2.32%) | 0.21 ± 0.008 (3.66%) |
| 180 days | 1730.14 ± 20.32 (1.17%) | 0.25 ± 0.030 (11.92%) | 1859.05 ± 7.92 (0.43%) | 0.22 ± 0.019 (8.41%) |
| R1 CEBs | R2 CEBs | |||||
|---|---|---|---|---|---|---|
| γd [kg/m3] | Cb [g/(cm2 √min)] | ρ [kΩcm] | γd [kg/m3] | Cb [g/(cm2 √min)] | ρ [kΩcm] | |
| 28 days | 1716.65 ± 11.80 (0.69%) | 0.191 ± 0.018 (9.16%) | 1.06 ± 0.04 (3.65%) | 1847.66 ± 20.37 (1.10%) | 0.094 ± 0.037 (39.48%) | 1.44 ± 0.08 (5.81%) |
| 180 days | 1718.14 ± 9.21 (0.54%) | 0.200 ± 0.012 (6.04%) | 1.27 ± 0.06 (4.56%) | 1830.52 ± 17.73 (0.97%) | 0.147 ± 0.037 (25.40%) | 1.57 ± 0.15 (9.75%) |
| R1 CEBs | R2 CEBs | |||
|---|---|---|---|---|
| γd [kg/m3] | W15’ [%] | γd [kg/m3] | W15’ [%] | |
| 28 days | 1735.81 ± 5.18 (0.30%) | 20.22 ± 1.83 (9.06%) | 1890.74 ± 15.93 (0.84%) | 15.34 ± 1.91 (12.45%) |
| 180 days | 1686.72 ± 33.42 (1.98%) | 20.32 ± 6.53 (32.17%) | 1837.39 ± 21.53 (1.17%) | 15.70 ± 4.43 (28.25%) |
| R1 CEBs | R2 CEBs | |||||
|---|---|---|---|---|---|---|
| γ [kg/m3] | Rate of Erosion [mm/min] | Erodibility Index | γ [kg/m3] | Rate of Erosion [mm/min] | Erodibility Index | |
| 28 days | 1717.65 ± 21.15 (1.23%) | 5.18 ± 0.08 (1.54%) | 5 (test failed) | 1821.61 ± 9.49 (0.52%) | 5.71 ± 0.10 (1.75%) | 5 (test failed) |
| Physical | Thermal | Mechanical | Durability | |||||||||||
|---|---|---|---|---|---|---|---|---|---|---|---|---|---|---|
| ID | γ | φ | ω | R | λ | α | σc | E | UPV30cm | σf | Cb | ρ | W15′ | D |
| R1-28D | 1.72 | 36 | 1.40 | 0.30 | 0.50 | 3.37 × 10⁻⁷ | 2.54 | 55.65 | 1018.65 | 0.25 | 0.19 | 1.06 | 20 | 310.67 |
| R2-28D | 1.90 | 31 | 1.40 | 0.23 | 0.65 | 4.04 × 10⁻⁷ | 2.27 | 53.61 | 1004.57 | 0.21 | 0.09 | 1.44 | 15 | 342.67 |
| R1-180D | 1.73 | 37 | 0.79 | 0.30 | 0.50 | 3.29 × 10⁻⁷ | 1.78 | 40.46 | 974.71 | 0.25 | 0.20 | 1.27 | 20 | - |
| R2-180D | 1.85 | 32 | 0.60 | 0.23 | 0.65 | 3.99 × 10⁻⁷ | 2.03 | 46.21 | 1079.09 | 0.21 | 0.15 | 1.57 | 16 | - |
Disclaimer/Publisher’s Note: The statements, opinions and data contained in all publications are solely those of the individual author(s) and contributor(s) and not of MDPI and/or the editor(s). MDPI and/or the editor(s) disclaim responsibility for any injury to people or property resulting from any ideas, methods, instructions or products referred to in the content. |
© 2024 by the authors. Licensee MDPI, Basel, Switzerland. This article is an open access article distributed under the terms and conditions of the Creative Commons Attribution (CC BY) license (https://creativecommons.org/licenses/by/4.0/).
Share and Cite
Turco, C.; Paula Junior, A.; Jacinto, C.; Fernandes, J.; Teixeira, E.; Mateus, R. Influence of Particle Size on Compressed Earth Blocks Properties and Strategies for Enhanced Performance. Appl. Sci. 2024, 14, 1779. https://doi.org/10.3390/app14051779
Turco C, Paula Junior A, Jacinto C, Fernandes J, Teixeira E, Mateus R. Influence of Particle Size on Compressed Earth Blocks Properties and Strategies for Enhanced Performance. Applied Sciences. 2024; 14(5):1779. https://doi.org/10.3390/app14051779
Chicago/Turabian StyleTurco, Chiara, Adilson Paula Junior, Cláudia Jacinto, Jorge Fernandes, Elisabete Teixeira, and Ricardo Mateus. 2024. "Influence of Particle Size on Compressed Earth Blocks Properties and Strategies for Enhanced Performance" Applied Sciences 14, no. 5: 1779. https://doi.org/10.3390/app14051779
APA StyleTurco, C., Paula Junior, A., Jacinto, C., Fernandes, J., Teixeira, E., & Mateus, R. (2024). Influence of Particle Size on Compressed Earth Blocks Properties and Strategies for Enhanced Performance. Applied Sciences, 14(5), 1779. https://doi.org/10.3390/app14051779