Article

Utilizing Differences in Mercury Injection Capillary Pressure and Nuclear Magnetic Resonance Pore Size Distributions for Enhanced Rock Quality Evaluation: A Winland-Style Approach with Physical Meaning

State Key Laboratory of Oil and Gas Reservoir Geology and Exploitation, Southwest Petroleum University, Chengdu 610500, China
*
Authors to whom correspondence should be addressed.
Appl. Sci. 2024, 14(5), 1881; https://doi.org/10.3390/app14051881
Submission received: 31 January 2024 / Revised: 21 February 2024 / Accepted: 22 February 2024 / Published: 25 February 2024
(This article belongs to the Topic Petroleum and Gas Engineering)

Abstract

:
Pore structure is a fundamental parameter in determining the hydrocarbon storage capacity and flow characteristics of a reservoir. Mercury injection capillary pressure (MICP) and nuclear magnetic resonance (NMR) are two commonly utilized techniques for characterizing rock pore structures. However, current studies indicate that disparities in testing methodologies due to distinct physical characteristics lead to a partial misalignment in pore size distributions. We conducted MICP (dynamic) and NMR (static) experiments on eight tight sandstone and eight shale samples and proposed a method to utilize information from the differences in MICP and NMR pore size distributions, aiming to enhance the accuracy of rock quality analysis. We observed that in rock cores where large pores are interconnected with smaller pore throats, MICP tends to overestimate the proportion of these smaller pores and underestimate the larger ones. Furthermore, we integrated information from both dynamic and static experimental processes based on physical significance and found that the fitting accuracy of the newly proposed method is superior to the Winland r35 equation. Compared to the Winland r35 equation, our new method significantly improves fitting accuracy, increasing the R-squared value from 0.46 to 0.93 in sandstones and from 0.80 to 0.87 in shales. This represents a potential high-precision, comprehensive tool for rock quality analysis, offering a new perspective for an in-depth understanding of rock properties.

1. Introduction

Tight oil and gas, as crucial components for increasing petroleum resources [1,2], are important resources in oil and gas exploration and development. However, the development of tight reservoirs is challenging due to their poor petrophysical properties, strong heterogeneity, and ultra-low permeability [3,4]. The porosity, permeability, pore types and micro-pore structures in tight reservoirs play a crucial role in determining the fluid flow and storage capacity of a rock, which are critical factors in rock quality analysis [5,6,7]. These fundamental petrophysical studies are commonly conducted using the Winland method and its derivatives [8,9]. Hence, an accurate understanding of the micro-pore and throat structures in tight reservoirs will benefit the study of their storage capacity and flow patterns.
At present, micro-CT imaging [10,11,12], mercury injection capillary pressure (MICP) [13,14,15] and nuclear magnetic resonance (NMR) [16,17,18,19] experiments, as methods capable of accurately reflecting micro-to-nano scale pore features, are extensively employed for microscopic porosity studies in tight reservoirs. All techniques have certain limitations. The micro-CT imaging method utilizes 2D CT scan data to construct 3D visualizations of pore structures within core samples. However, high-resolution CT equipment is expensive, and completing 3D imaging often requires multiple scans, which will increase the cost and duration of research. The minimum throat radius measured using MICP is contingent upon the injection pressure; a heightened injection pressure allows for the measurement of a smaller throat radius. Additionally, the permeability of the core can also be predicted based on the capillary pressure curve obtained from MICP [20]. Yet, excessive injection pressure can easily damage the original pore structure of the sample. In addition, 100% mercury saturation is hard to reach since the mercury is not in the wetting phase [6,21].
NMR experiments can effectively detect non-connected pores and nano-scale pores in core samples [22]. Analyzing the distribution and peak positions of the transverse relaxation time, T2, enables the determination of pore types and their size distribution. Additionally, the continuity of NMR signals in the T2 relaxation time distribution spectrum provides insights into the connectivity between pores and fractures [23,24,25]. However, NMR experiments cannot intuitively reflect pore diameter size. Fuyong et al. amalgamated findings from NMR and MICP methods and uncovered that the relationships between NMR relaxation time T2 and pore size are more in accordance with the power function relations than the linear relation [26]. Hugh and Andrew utilized accessibility functions for cubic lattices, combined with coordination numbers obtained from the MICP method, to determine surface relaxivity and percolating cluster size [27]. Chaohui et al. identified a novel method that utilizes the transverse relaxation time value (T2c) of the right endpoint of negative intervals and the corresponding centrifugal radius (rc) to determine the coefficient C, enabling the conversion of NMR T2 relaxation times into pore sizes [28]. Overall, integration with other experiments or the use of empirical parameters is necessary to convert the T2 relaxation time distribution spectrum into a pore size distribution diagram.
In comparative analyses conducted by some researchers on the curves obtained from MICP and NMR techniques, a degree of discrepancy between the two methods was observed, with the pore size distributions revealed by each not aligning perfectly.
As shown in Table 1, researchers have observed in various porous media that there exists a crosspoint in the longer T2 relaxation times when comparing NMR and MICP experimental methods. The MICP method tends to underestimate the proportion of macro-pores where T2 is greater than the crosspoint, while it overestimates the proportion of meso-pores. We have prepared a schematic diagram to depict this phenomenon, as illustrated in Figure 1.
Figure 1 illustrates a schematic where the MICP method overestimates meso-pores and underestimates macro-pores. The overestimated part is almost equal to the underestimated part. The occurrence of this phenomenon is commonly ascribed to “ink-bottle” phenomenon [32].
Some scholars believe that NMR measures the pore size distribution (PSD), while MICP assesses the pore throat distribution (PTD) [34,35,36]. Mercury injection is a dynamic process with recorded pressure, while NMR PSD is a static process where brine pre-saturates the core to almost 100%. NMR PSD could reflect all the pores saturated with brine, while MICP is more sensitive to the throat due to the ink bottle effect [37,38]. Multiple researchers have reported that MICP overestimates the percentage of the meso-pores, corresponding to the relatively low capillary pressure range [32,39]. This phenomenon reflects the detailed pore throat matching pattern and is closely linked to the permeability of the core. We believe that this information could be used to gain a better understanding of pore structure.
In this study, we focused on Tuha tight sandstones and Hechuan shales, performing both NMR and MICP assays on a collection of 16 tight reservoir core specimens. Firstly, the observed difference between mercury injection and NMR PSD is consistent with the reported cases [29,30,34]. Furthermore, we integrated information from both methods to explain the reasons behind these discrepancies. Secondly, we proposed a rock quality assessment method to utilize this information from such differences.
In the Winland r35 method, the percolation threshold [40] is determined based on statistical principles. Although our method is also based on the principle of the Winland percolation threshold, our percolation threshold is determined based on the phenomenon of differences in pore size distribution between MICP and NMR, as demonstrated in Table 1. Our defined percolation threshold originates from the difference between MICP and NMR; specifically, it is determined by smaller throats that control the connectivity of larger pores. By applying Winland fitting results that have actual physical significance, we found it to be superior to fitting results based on statistical principles. Our innovation lies in utilizing the differential information between dynamic (NMR) and static (MICP) pore size distributions to find a percolation threshold that can be applied to the Winland method, providing a more effective tool for the analysis of rock pore structures.

2. Materials and Techniques

2.1. Rock Samples

MICP and NMR tests were conducted on rock core samples sourced from Jurassic wells in the Tuha Santanghu basin [41], a tight oil production region [42], and the Permian wells in the Sichuan Hechuan–Tongnan block [43], a shale gas production region [44]. Specifically, 8 sandstone samples from three distinct wells in the Tuha oil field and 8 shale samples from four different wells in the Hechuan–Tongnan block were analyzed; the representative samples are shown in Figure 2.
In the Tuha oil field, wells S1-2, S1-3, and S1-4 contained conglomerate sandstones, while the remaining samples from this field were identified as tight sandstones. The dominant minerals in these samples were quartz and feldspar, accompanied by trace amounts of clay minerals and dolomite. The helium porosity of these sandstone samples ranged between 13.66% and 15.88%, with permeabilities spanning from 1.06 mD to 8.20 mD. For the samples from the Hechuan block, an average helium porosity of 6.86% was recorded, with an average permeability value of 0.0394 mD. Detailed physical properties of these samples are presented in Table 2.

2.2. Experimental Setups

The NMR measurements were conducted using a MesoMR12-060H-I instrument from Suzhou Niumag Analytical Instrument Corporation (Suzhou, Jiangsu, China). The magnetic field strength of the instrument is 0.3 T, and the spectrometer frequency is 12 MHz.
The MICP experiments were performed using a Poremaster-60 high-pressure mercury intrusion porosimeter from Quantachrome Instruments (Boynton Beac, FL, USA).

2.3. Experimental Procedures

2.3.1. Permeability and Porosity Measurements

The porosity of all 16 core samples was determined using the helium porosity measurement method. The permeability of sandstone was measured using the steady-state method, while the permeability of shale was determined using the pulse decay method. Specific measurement steps refer to the Chinese National Standards “GB/T 34533-2023 Determination of porosity, permeability, and saturation of shale [45]”.

2.3.2. NMR and MICP Measurements

The NMR method primarily involves scanning the core for T2 spectra to detect hydrogen nuclei in the core, thereby determining the volume of fluid within the core. The specific experimental procedure follows the standards of the Chinese petroleum and natural gas industry: Chinese oil and natural gas industry standard “SY/T 6490-2023 Specification for laboratory measurement of NMR parameter of rock samples [46]”.
The MICP method involves applying pressure to liquid mercury, allowing it to overcome capillary resistance and enter the pores. Then, based on the fraction of pore volume filled with mercury and the corresponding pressure, the pore size distribution of the core is obtained. The specific experimental procedure follows the Chinese National Standard “GB/T 29171-2023 Rock capillary pressure measurement [47]”.
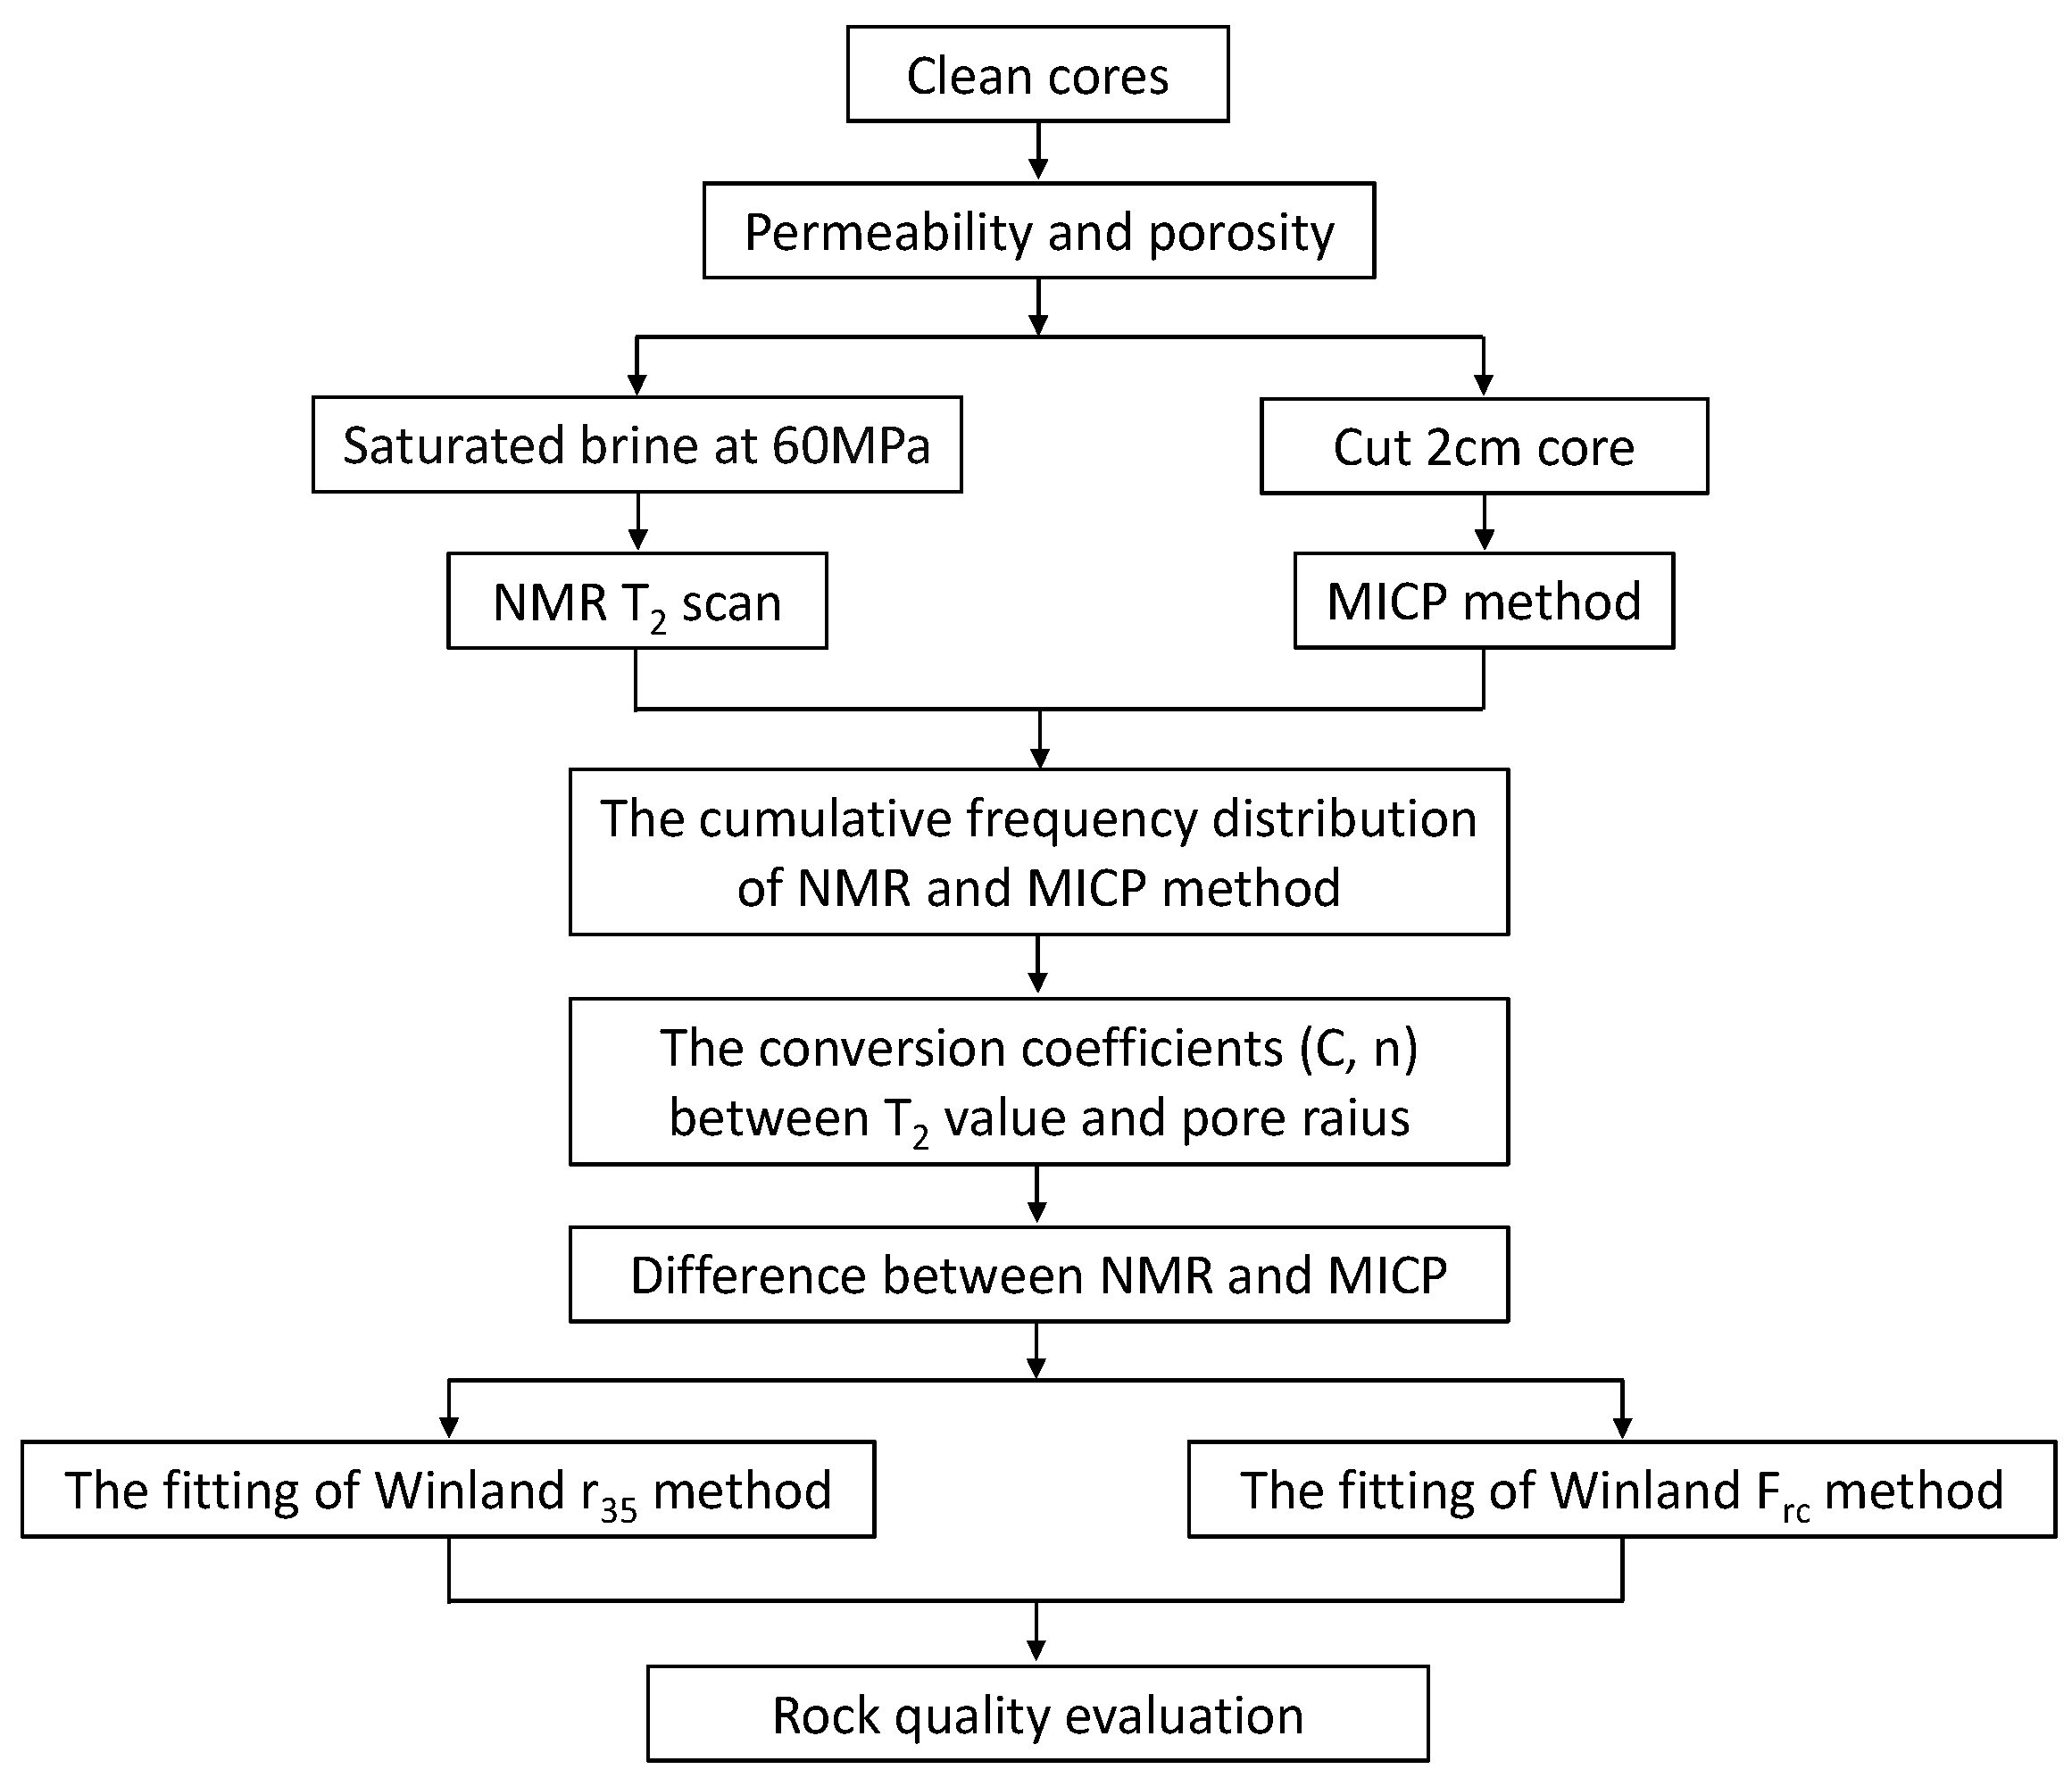
The primary signals detected using NMR in the rock core were mainly water signals (with shales containing kerogen, asphaltene, and structural water). The maximum mercury intrusion pressure for the MICP could reach up to 200 MPa. The pore throat distribution obtained from MICP and the T2 relaxation time distribution from the NMR test can be further analyzed to examine the fluid distribution in different pore sizes of the rock core. The specific experimental steps are shown in Figure 3.
(1)
All samples underwent an extensive cleaning process using Dean–Stark apparatus. After cleaning, the core samples were dried at 80 °C for 72 h. The status of the heated samples was ascertained using the T2 relaxation time distribution spectrum. If the T2 signal intensity is high, an additional 72 h of vacuum heating is required until the T2 signal intensity becomes constant.
(2)
After confirming that the rock core is thoroughly cleaned, a piece is cut for the MICP experiment with a thickness of 2 cm. The experimental maximum injection pressure is selected based on the lithology. The compressive strength of tight sandstone is usually higher than that of shale. Therefore, we have set the maximum injection pressure for tight sandstone and shale at 200 MPa and 100 MPa, respectively.
(3)
The clean rock core is placed in a container and subjected to evacuation treatment for 24 h. Subsequently, simulated formation brine is injected into the container, and the pressure is gradually increased to 60 MPa using the step-wise pressure build-up method [48] at a rate of 5 MPa/h. Water porosity is compared with helium porosity to confirm full saturation of the rock core (with an error of less than 2% [49]). The T2 relaxation time distribution spectrum of the rock sample is then measured.
(4)
Based on the cumulative frequency distribution from both MICP and the NMR T2 relaxation time distribution spectrum, translate the T2 relaxation times into a pore size distribution.

2.3.3. NMR Pore Size Distribution Calibration

The techniques for measuring nuclear magnetic resonance (NMR) spectroscopy enable the rapid acquisition of reservoir properties, such as porosity, permeability, oil saturation, and water saturation, by analyzing the volume, properties, and NMR T2 relaxation time distribution spectrum characteristics of fluids within rock core pores. The transverse relaxation time, T2, of the fluid in the rock core can be determined via surface relaxation, bulk relaxation, and diffusion relaxation [50,51], as illustrated in Equation (1):
1 T 2 = 1 T 2 S + 1 T 2 D + 1 T 2 B
where T2 is the transverse relaxation time in milliseconds (ms), T2S denotes the surface relaxation time in ms, T2B stands for the bulk relaxation time in ms, and T2D represents the diffusion relaxation time in ms.
Kleinberg et al. discovered that in scenarios where the pore fluid is water, the contribution of T2B is typically insignificant. Conversely, in cases where the pore fluid consists of a viscous oil or a solution with a high concentration of paramagnetic ions, bulk relaxation mechanisms may predominate [52]. When the pore fluid is a single-phase wetting fluid, the bulk relaxation time T2B is much larger than the surface relaxation time T2S, which can be neglected in Equation (1). In an NMR system utilizing a homogeneous magnetic field, the effect of diffusion relaxation becomes negligible. Furthermore, when the gradient of the magnetic field is minimal and the echo time in the Carr–Purcell–Meiboom–Gill (CPMG) sequence is adequately brief (less than 1 ms), diffusion effects can also be effectively ignored [53]. The expression for the transverse relaxation time, T2, of porous media can then be expressed to Equation (2), as per references [31,54]
1 T 2 1 T 2 S = ρ 2 ( S V ) pore
where ρ2 is the transverse relaxation rate, which characterizes the strength of fluid relaxation at the pore surface, in μm/ms. S/V denotes the specific surface area of a single pore, in μm2/μm3.
Equation (2) suggests that the transverse relaxation time T2 is related to the specific surface area of the porous medium. If we simplify the pore structure to be either spherical or cylindrical, then Equation (2) can be transformed into Equation (3):
T 2 = 1 ρ 2 ( V S ) pore = r ρ 2 F S
where FS is the pore shape factor (FS is 3 for spherical pores and 2 for tubular pores, dimensionless), and r represents the pore radius, measured in micrometers (μm).
According to Equation (3), the transverse relaxation time T2 of the rock core is linearly proportional to pore radius r. However, after extensive experimental matching, it has been observed that due to the complexity of the formation pore structure, T2 is proportional to the pore radius r with a power index (n) [26,33,55]. Therefore, Equation (3) is modified to obtain Equations (4) and (5):
T 2 = r n ρ 2 F S
r = ( ρ 2 F S T 2 ) 1 n
In experimental settings, obtaining definitive values for ρ2 and FS is complex. Consequently, converting the transverse relaxation time T2 distribution into a pore diameter distribution curve by determining the values of ρ2 and FS presents significant challenges. By referencing the T2 distribution diagram of the 100% water-saturated rock core and the high-pressure mercury injection pore throat distribution curve, a conversion between T2 distribution and pore throat radius can be achieved. Let C = ( ρ 2 F S ) 1 n , where C is the conversion coefficient, then
r = C T 2 1 n
In porous rock cores, due to the varied sizes of the pores and throats, high-pressure mercury intrudes preferentially into the larger pores. As the pressure escalates, it gradually permeates into the smaller-sized pores. Given that the MICP method has a pressure ceiling, pores below these thresholds cannot be discerned. On the other hand, the T2 relaxation time distribution spectrum of rock cores saturated with water at 60 MPa can reflect information on almost all the pores present within the rock core. Directly juxtaposing the MICP curve with the NMR pore size distribution curve can lead to significant deviations.
To minimize the discrepancies between the pore size distribution curves obtained from MICP and NMR, one should begin by plotting the cumulative distribution curves for both methods. Based on these cumulative curves, calculate the radii of the pore throats from mercury intrusion and the T2 relaxation times corresponding to the same cumulative frequencies. Subsequently, by determining the relationship between these two sets of values, one can derive the constants C and n, facilitating the conversion between the T2 relaxation time and the pore throat radius.

3. Result and Discussion

3.1. T2 Relaxation Time Distribution Spectrum

In the state where the sandstone core is fully saturated with formation brine (TDS: 4500 ppm), the characteristics of the NMR T2 relaxation time distribution spectrum distribution can effectively elucidate the distribution features of its pore throats. The greater the number of peaks in the spectrum, the more complex the distribution of the pore throats [56]. Concerning the Tuha oilfield, the fully water-saturated T2 spectra of the eight tight sandstones are shown in Figure 4. Based on the T2 spectra, the sandstone cores can be categorized into two types: monomodal (comprising S1-1, S1-2, S2-5, S2-6, S3-7, and S3-8) and bimodal (S1-3 and S1-4). The six monomodal cores demonstrate a wide distribution range for T2 relaxation time, with nuclear magnetic signals mainly detected from 0.03 ms to 1000 ms. However, their peak values are relatively concentrated, primarily distributed between 1.5 and 5 ms, indicating that they predominantly feature micropores. The T2 spectra of the two bimodal cores are strikingly similar, both showcasing a left peak with a signal intensity slightly higher than the right one, and the two peaks are continuous, suggesting that the reservoir’s overall pore throat distribution is continuous. Both bimodal cores exhibit a left peak corresponding to a T2 relaxation time of 0.8 ms, which is lower than the peak T2 time observed in the monomodal state. The right peak’s T2 relaxation time is 20 ms, aligning with the peak T2 time of the monomodal state. It is noteworthy that the porosity distribution range for these eight cores is between 13.66% and 15.88%; however, there is a considerable variation in the total amount of nuclear magnetic signals. This variation is not due to errors in core saturation but is attributable to the disparities in the core volume, which leads to significant differences in signal magnitude.
Figure 5 illustrates the 100% formation brine (TDS: 174,000 ppm) saturated T2 relaxation time distribution spectra of shales from eight different core samples of four wells in the Hechuan area. From the T2 spectra, it is evident that the T2 distribution of the Hechuan shale primarily spans from 0.02 ms to 1000 ms. The T2 relaxation time distribution spectra of cores H1-2, H2-4, and H3-5 exhibit a distinct bimodal distribution. Notably, core H2-3 is considerably distinct from the other seven cores, with its signal peak T2 relaxation time being 0.6 ms, which is lower than the rest. Moreover, the peak position of the H2-3 core has shifted significantly to the left compared to the other cores, suggesting that this specific core mainly comprises smaller pore sizes than the others, which implies a relatively lower permeability. Consulting the physical properties of the eight Hechuan shale samples (Table 2), it is evident that the H2-3 core exhibits the lowest permeability amongst the eight, measuring 0.0065 mD, which aligns with the T2 spectra measurements.
Dhananjay pointed out that the horizontal anisotropy of porous media and the chemical reaction of fluid and core in the reservoir will affect core permeability. Yadav pointed out that the horizontal anisotropy of porous media and the chemical reaction of fluid and core in the reservoir will affect core permeability [57,58].
Further observation reveals a trend in the NMR signal peak corresponding to T2 relaxation times for the following core samples: H2-3 < H4-8 < H3-6 ≈ H1-2 ≈ H4-7 < H1-1. This pattern aligns with the distribution of core permeabilities, indicating that for the Hechuan shale samples, as permeability increases, the peak value of T2 also rises. However, a notable exception is observed in the case of the H3-5 sample. Even though H3-5 has the highest permeability of all the samples, clocking in at 0.0753 mD, the NMR experiment did not display the longest T2 relaxation time. On the contrary, for core H2-4, it can be observed that the T2 relaxation time distribution spectrum has a bimodal shape, and the left peak is about 0.18 ms, indicating that this core has lower permeability.
From Figure 5, it can be observed that although the curve of the H3-5 core exhibits a lower peak T2 value, its signal distribution in the short T2 range from 0.02 to 0.3 ms is minimal, suggesting the least presence of micro-pores. Furthermore, its signal quantity in the medium to long T2 range from 20 to 600 ms is substantially greater than other cores, indicating a greater number of macro-pores. These two factors might contribute to the elevated permeability observed in core H3-5.

3.2. NMR Pore Size Distribution

Porous media exhibit a wide range of pore throat sizes. In MICP, external pressure is gradually increased on a rock sample to force mercury into its pores, thereby obtaining a distribution of pore sizes. In contrast, NMR detects the magnetic resonance signals from hydrogen nuclei within the rock, providing insight into its pore size distribution. Importantly, NMR is capable of effectively representing the entire volume of pores in the rock, including disconnected pores. However, the PSD from NMR requires assistance from MICP for calibration.
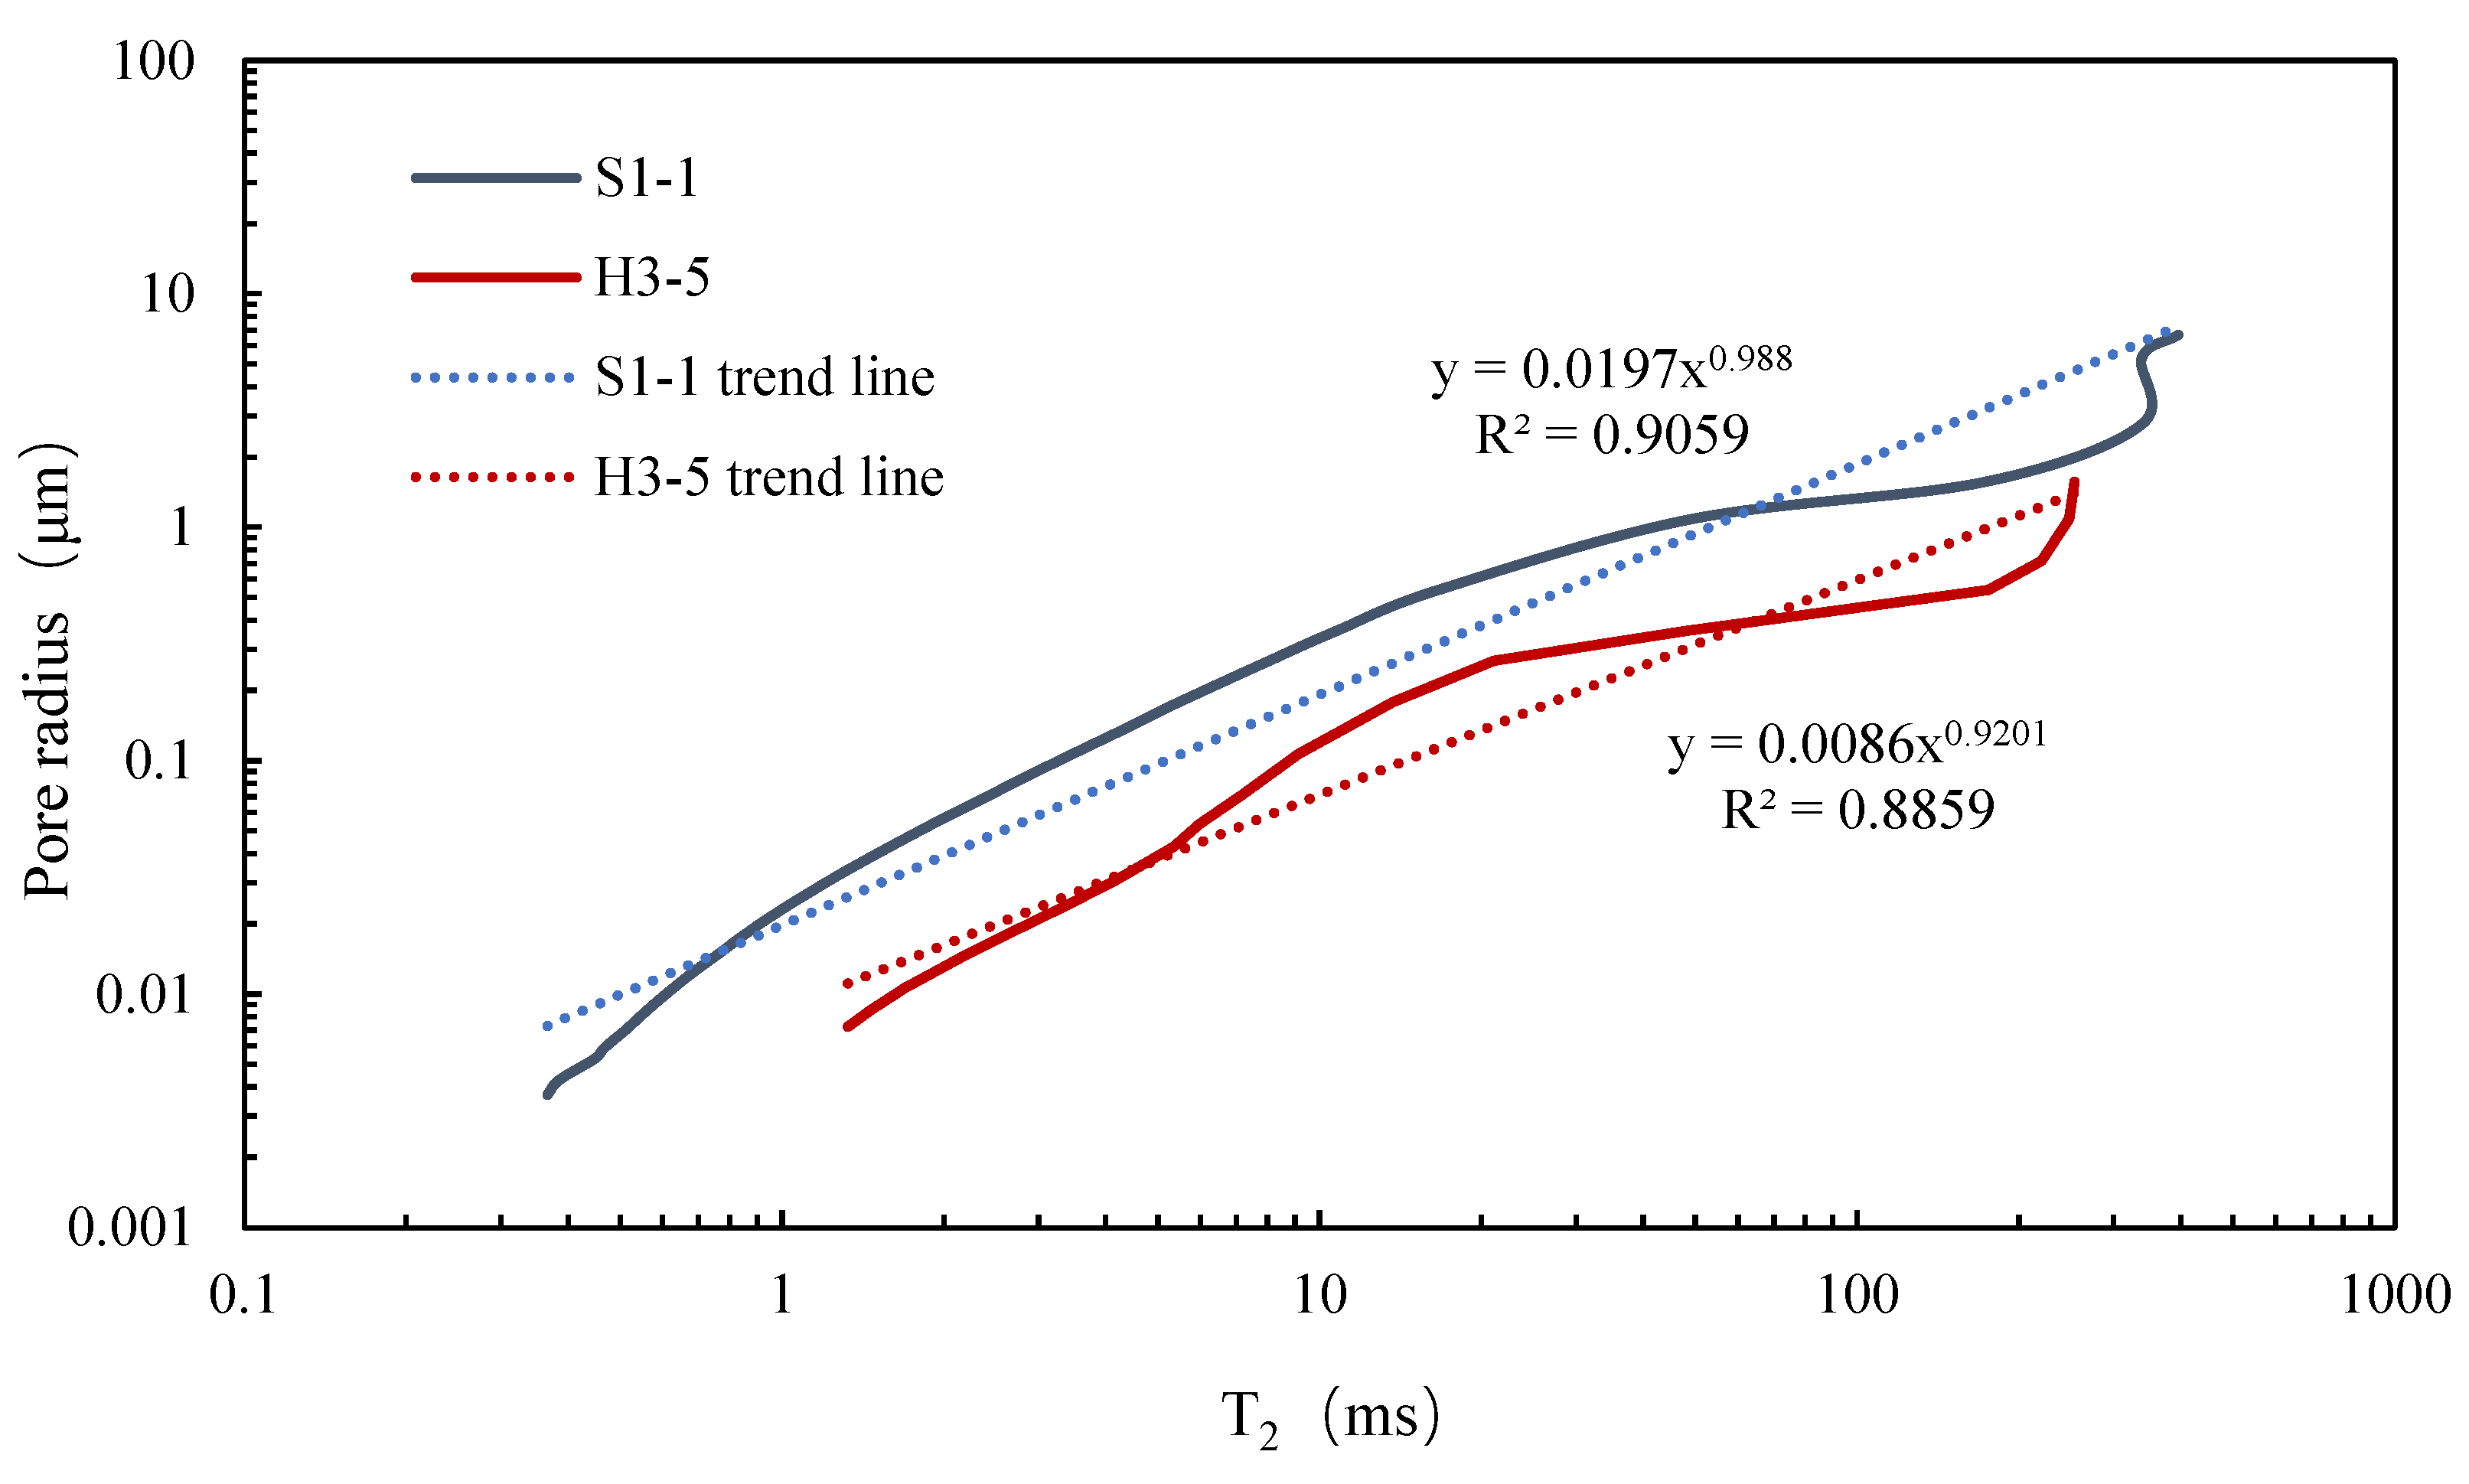
To ensure precision in the calculations, it is necessary to remove the influence of the pockmark effects from the MICP results. Hence, only portions of the T2 relaxation time distribution spectrum that match the MICP pore throat radius distribution are chosen for comparison. At points in the NMR T2 cumulative distribution curve that coincide with the cumulative distribution frequency of the MICP pore throat curve, multi-point sampling is executed [59]. Using sandstone S1-1 and shale H3-5 as examples, the cumulative distribution curves for NMR T2 relaxation time and MICP pore throat radius are illustrated in Figure 6. Subsequently, based on the cumulative distribution frequencies from both testing methodologies, the relationship between the rock’s T2 relaxation time and pore throat radius is determined, as presented in Figure 7.
Based on the fitting results from Figure 7, the conversion coefficients C and n values correlating the NMR T2 relaxation time and pore throat radius for the sandstone S1-1 and shale H3-5 samples were derived. This pore size matching method has received consensus among multiple researchers [34,60,61]. By method from Section 2.3.3, the C and n values for the 8 sandstone samples from Tuha and the 8 shale samples from Hechuan were determined. The specific conversion coefficients are listed in Table 3.

3.3. Comparative Analysis of Sandstone Pore Throat Distributions

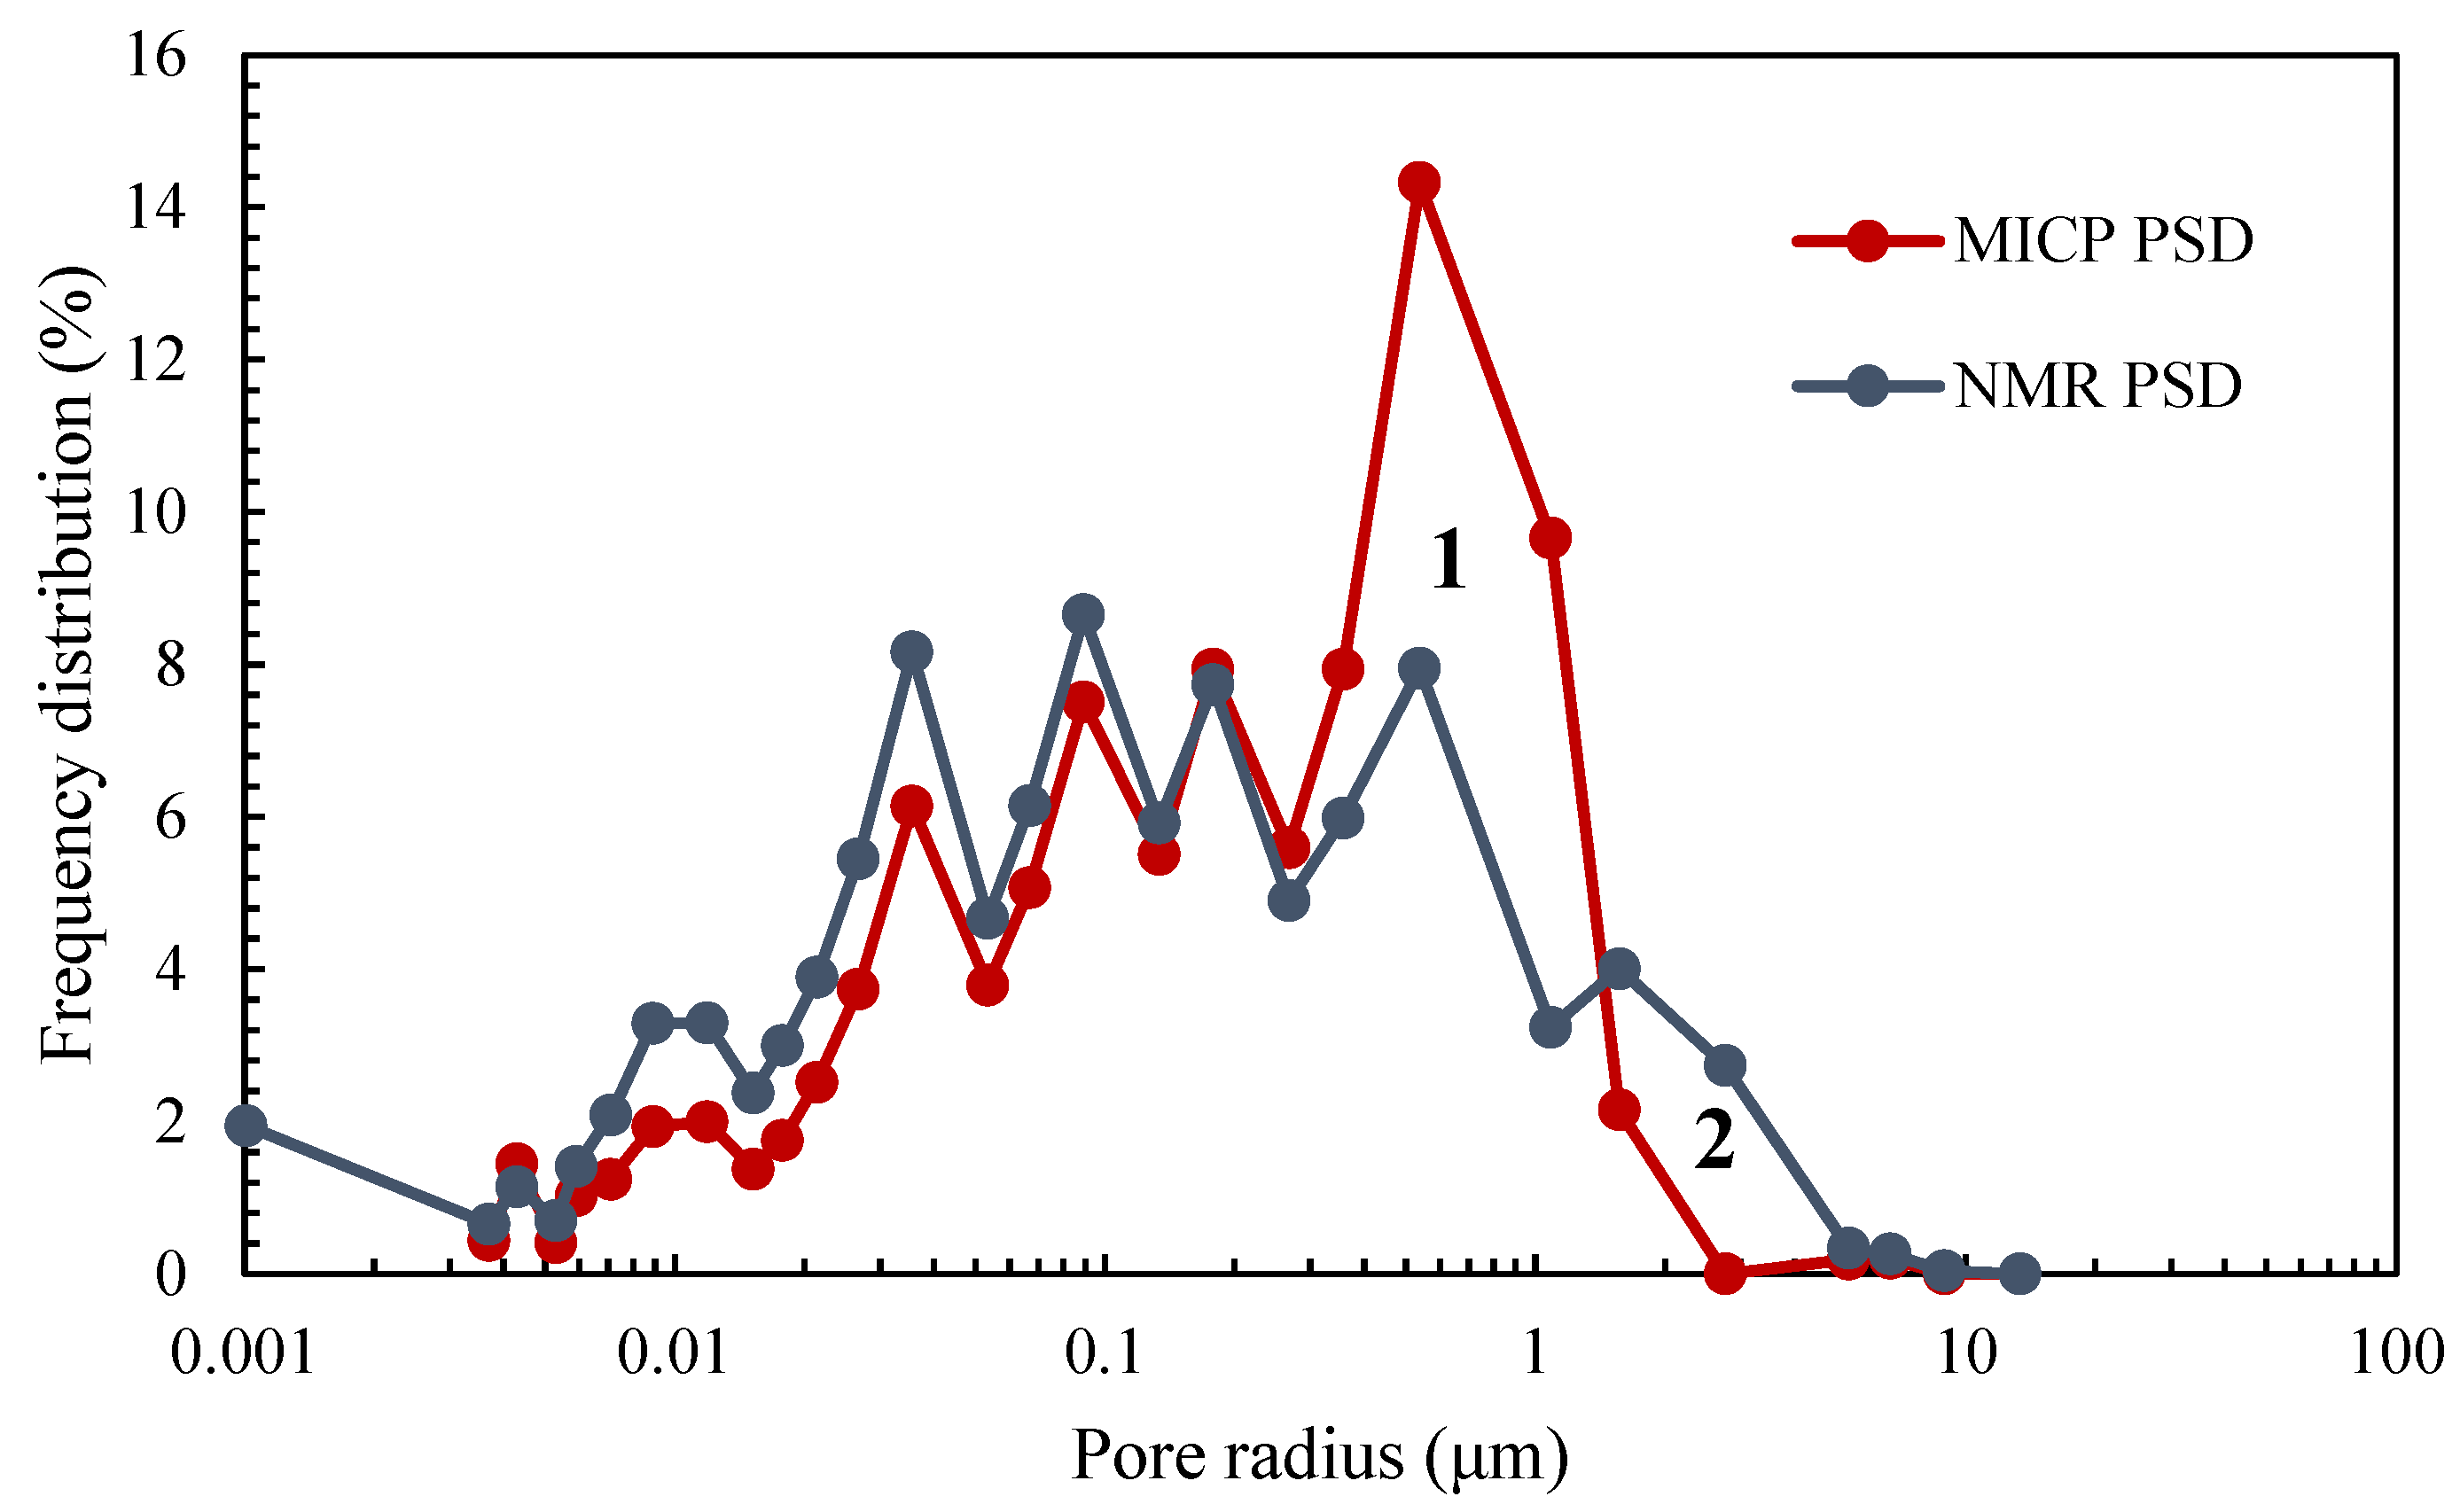
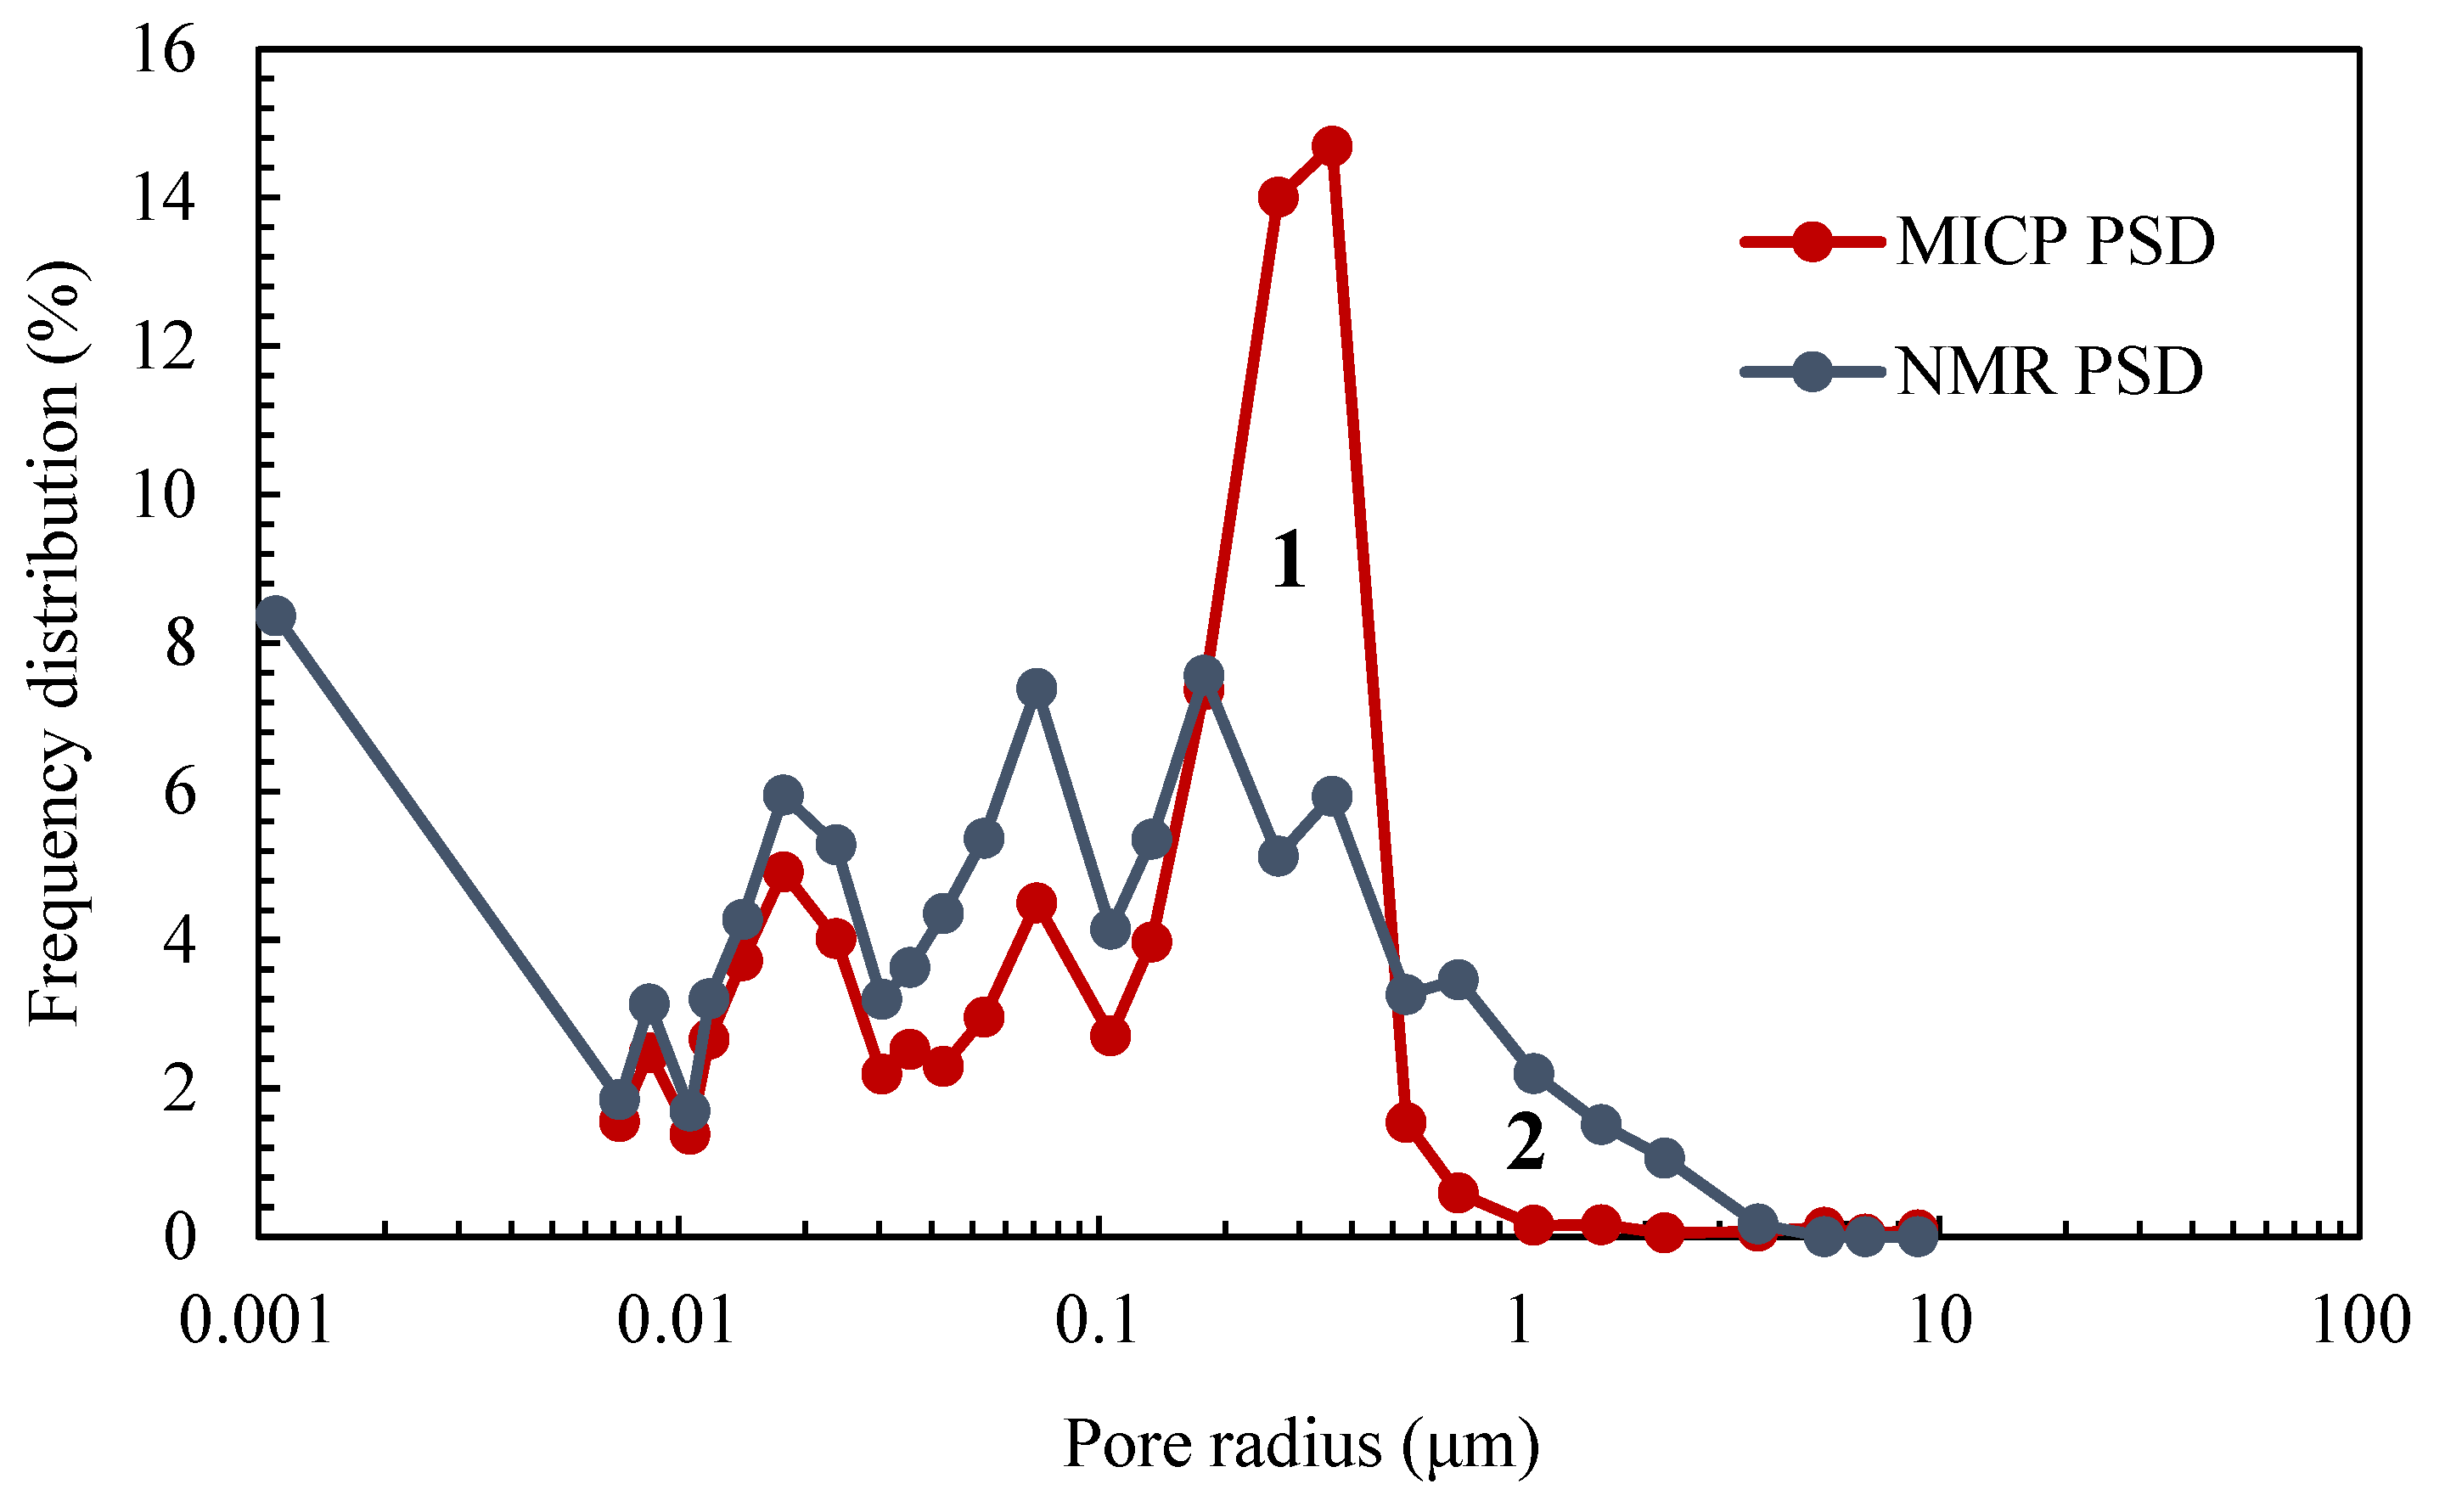
Using the conversion coefficients C and n and Equation (6), the transverse relaxation time T2 was converted into a pore size distribution. As illustrated, for core S1-1, a comparison chart of the pore throat distribution derived from the Tuha sandstone’s NMR T2 relaxation time distribution spectrum and the MICP pore throat distribution was constructed, as depicted in Figure 8.
From Figure 8, it can be observed that the signal frequency curves of pore size distribution converted from both MICP and NMR do not align perfectly. Comparing the two methods, it is noticeable that the NMR-detected signal frequency is higher than that of the MICP method for pores smaller than 0.0037 μm (micropores). This discrepancy is attributed to the sandstone mercury injection pressure set at 200 MPa, which is incapable of detecting pores smaller than 0.0037 μm. However, NMR can detect all hydrogen-containing fluid volumes in the rock sample; hence, for pores smaller than 0.0037 μm, the distribution frequency detected using NMR is higher than MICP.
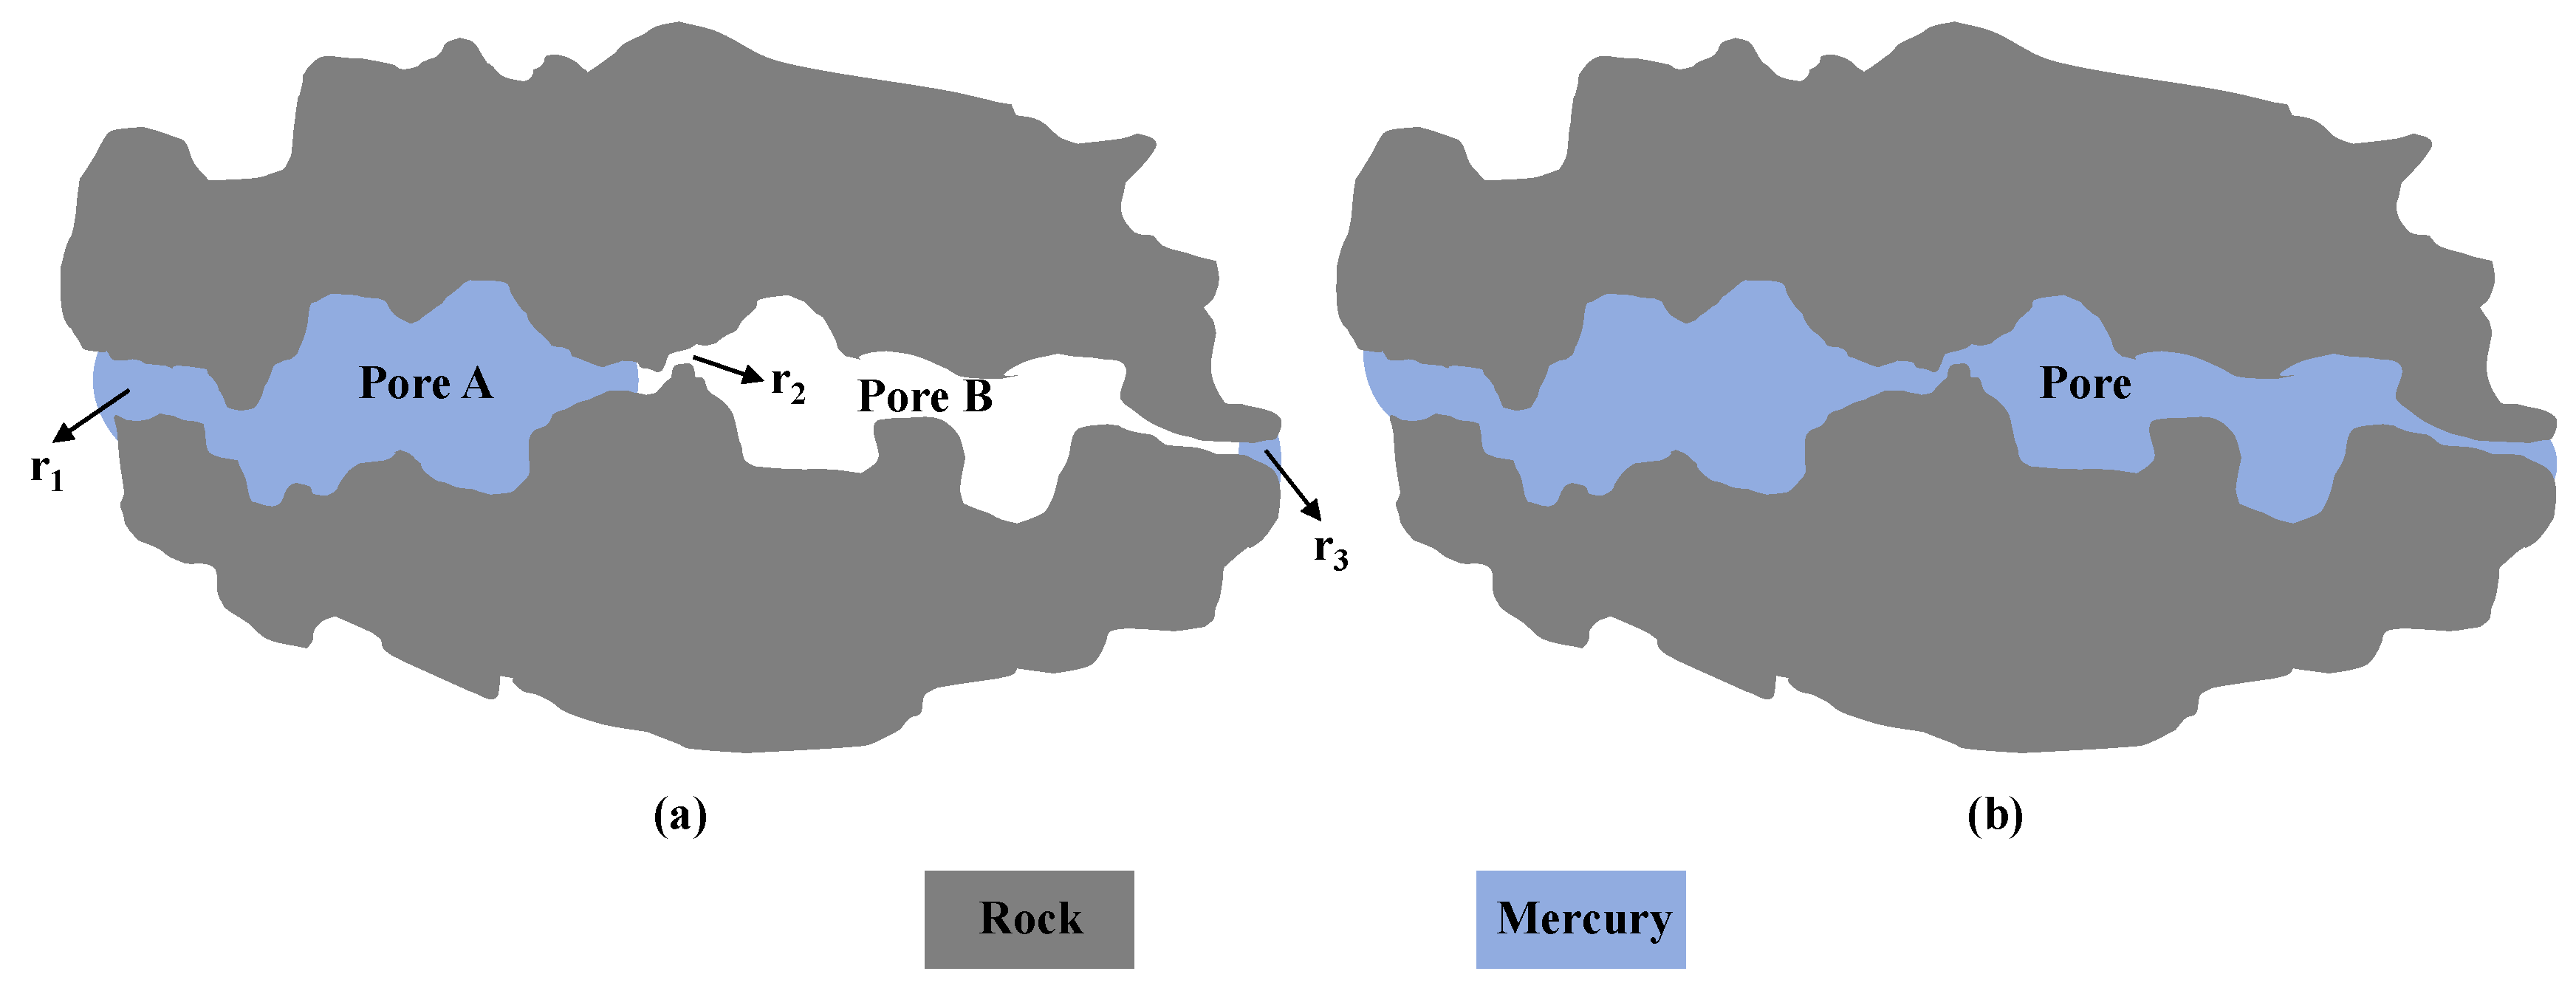
In the pore throat radius range of 0.0037~0.2 μm, while the distribution frequency of the NMR signal mostly agrees with that of MICP, the discrepancy between the two methods increases with decreasing pore throat radius. This is likely due to the inability of mercury intrusion to access some of the smaller and non-connected pores. In region 1 (0.2~1.8 μm), the distribution frequency from MICP is notably higher than NMR, whereas in region 2 (1.8~7 μm), it is lower than NMR. This divergence is due to the inherent differences in the two detection methods. When the core is fully saturated, the NMR T2 relaxation time distribution spectrum distribution only reflects the distribution of pore size and pore throats in the rock sample. The intensity of the NMR signal represents the proportions of differently sized pores, uninfluenced by the connectivity of pores and throats. In contrast, the MICP method calculates the frequency distribution based on the volume of mercury that enters the rock sample at a specific injection pressure. For homogeneous rock samples, the MICP method yields accurate pore throat results. During the formation of reservoirs, depositional environments, diagenesis, tectonic actions, fluid activities, formation temperature, and pressure all have significant impacts on rock pore structures [3]. Due to the complex nature of stratification, especially in heterogeneous reservoirs where large pores connect with small throats, discrepancies arise, as shown in Figure 9.
In Figure 9a, the pore throat radii are in the order r1 > r2 > r3. When the injection pressure of MICP is lower than the capillary force required to break through the smaller pore throat r2, mercury fluid cannot enter the large pore B. However, when the injection pressure surpasses the capillary force needed for pore throat r2, mercury fluid infiltrates into the large pore B, as depicted in Figure 9b. Although pore B gets filled up at the moment the capillary force needed to penetrate throat r2 is reached, the volume of mercury fluid infiltrated is measured in the MICP method as the mercury volume corresponding to pore throat r2; this could be attributed to ink bottle phenomenon [62]. Diamond also indicated in research on cement-based materials that MICP-generated PSD is not reliable [32]. Essentially, as nearly all pores are located internally within the sample, the mercury fluid can only make contact with the majority of these pores through narrow, elongated throats of varying sizes and shapes [32]. Hence, in the pore size and frequency distribution chart (Figure 8) derived from both MICP and NMR, the fluid volume in region 1 detected by NMR is lower than that by MICP, and in region 2, the volume of hydrogen-containing fluid detected by NMR surpasses the mercury volume measured by MICP.
Consequently, potential inaccuracies might exist in terms of mercury injection volume estimation when using the MICP method, especially in non-uniform reservoirs characterized by numerous large pores linked to smaller pore throats. This could result in the MICP method overestimating the proportion of smaller throats while underestimating the larger ones. Conversely, the NMR technique stands out when delineating the pore size distribution in core samples, with its merits of high precision, speediness in measurement, and an expansive detection scope.
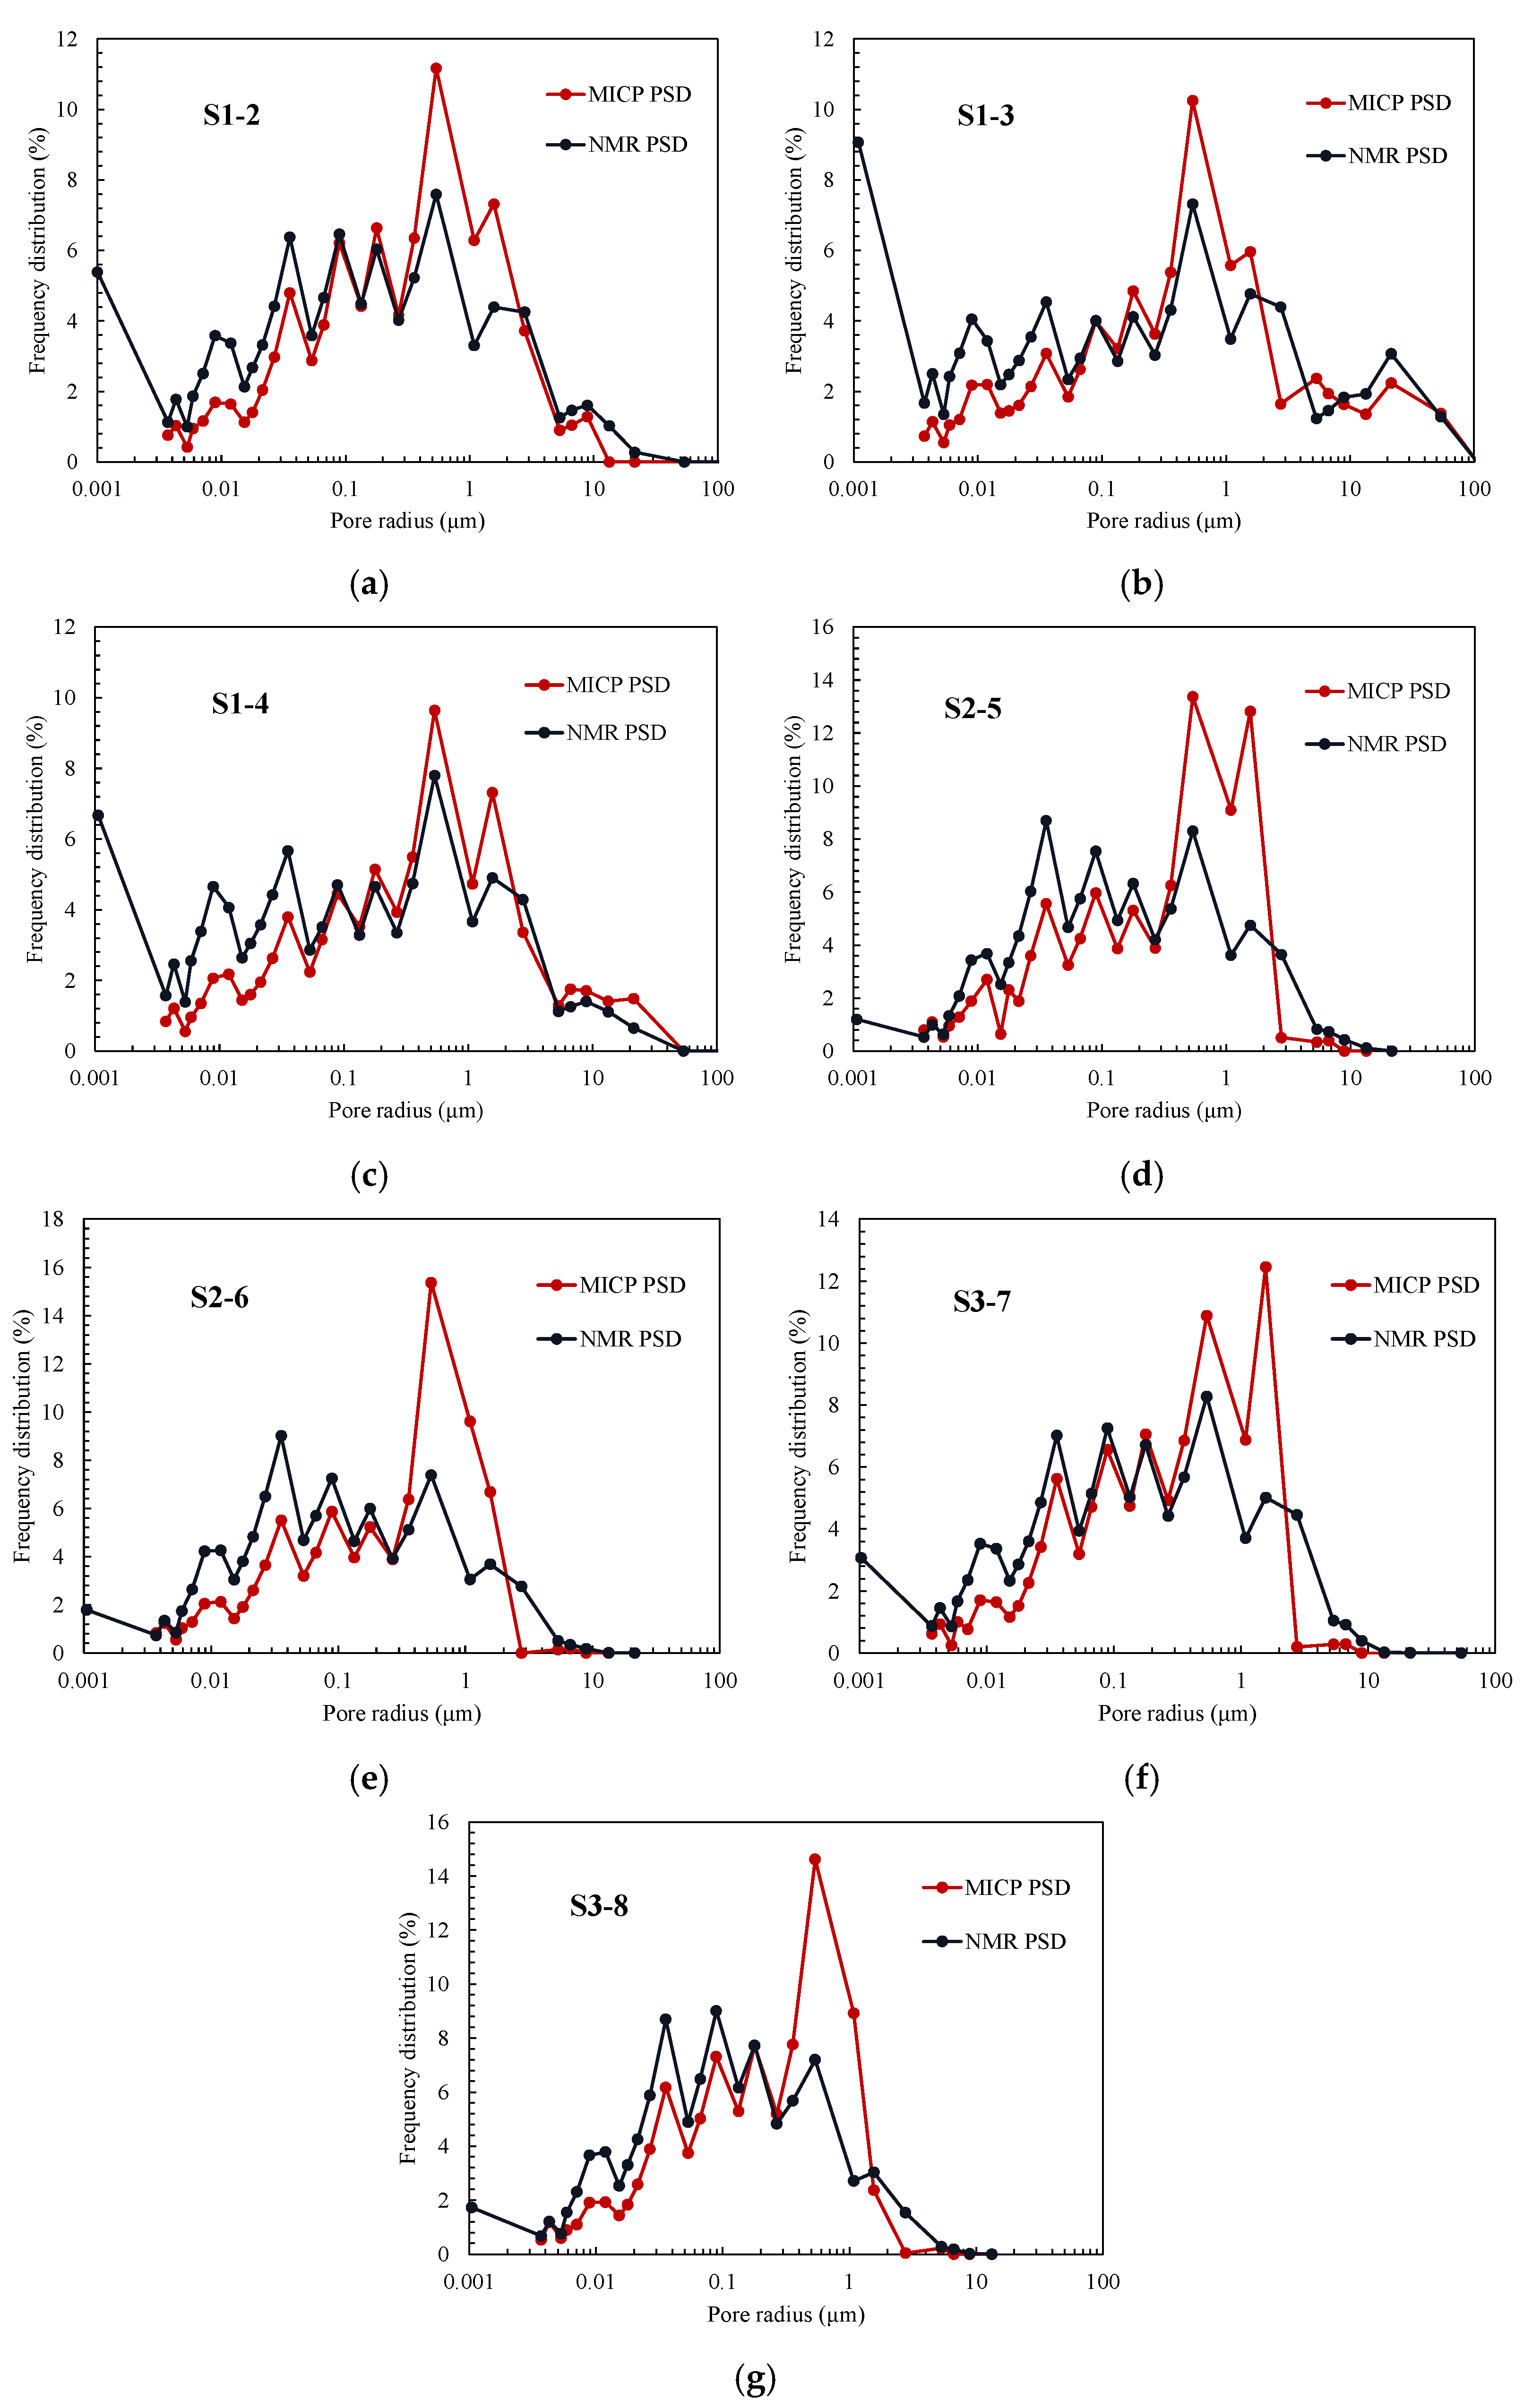
Figure 10 compares the pore throat distribution of the Tuha sandstone core samples measured by both NMR and MICP methods, with the distribution trend being largely similar to that of S1-1. The phenomena observed in these eight core samples are consistent with the mismatch between MICP and NMR reported in the literature [29,30,34]. The three core samples are noteworthy: S1-2, S1-3, and S1-4. In the pore size range of 0.001 to 0.0037 μm, the proportion of the NMR signal distributions reached 5.39%, 9.07%, and 6.67%, respectively, significantly higher than the proportions measured via mercury intrusion in this pore size range.
Interestingly, all three of these core samples are conglomerate sandstones. With the increase in permeability, the NMR signal frequency for the pores below 0.0037 μm also increased. This might suggest the presence of many non-flowing micropores in the gravel, which cannot be detected during high-pressure mercury injection. However, once saturated with formation brine, the micropores in the conglomerate might be filled and can be detected via the NMR method. Additionally, gravel particles in rocks are usually larger, resulting in larger inter-granular spaces. Hence, in most scenarios, the higher the gravel content in conglomerate sandstone, the higher the core permeability. This offers an explanation as to why the NMR signal in the microporous segment of the conglomerate sandstone intensifies with increasing permeability.

3.4. Comparative Analysis of Shale Pore Throat Distributions

Figure 11 displays the pore throat distribution for the Hechuan block H3-5 shale obtained through both NMR and MICP methods. Observations indicate that within the pore throat radius range of 0.001 to 0.075 μm, the distribution frequency measured by NMR is significantly higher than that measured via the mercury intrusion method. There are primarily two reasons for this phenomenon:
Limitations of the MICP Technique: Since shale has a lower compressive strength compared to sandstone [63], a lower pressure is used to ensure the authenticity of MICP results for shale. Consequently, with the application of a 100 MPa pressure, pore diameters smaller than 0.0075 μm remain undetectable when using the MICP method. Characteristically, shales are highly compacted and contain an abundance of micro-pores; these intricate pores, due to their diminutive size, are challenging for the MICP technique to detect accurately.
NMR Signatures from Specific Components in Shale: Shales contain a significant amount of non-flowing hydrogen-containing components, such as kerogen, asphaltene, and structural water. These components produce signals in NMR measurements, and these signals mainly represent the smaller pores. This means that these micro-pores can only be detectable when using the NMR method.
These two reasons are key to the notable differences in the micropore distributions obtained from the NMR and MICP methods. In research on core pore size distribution, it is essential to understand and consider these factors, as they directly influence the accuracy and reliability of the measurement results.
Within the pore size range from 0.0075 to 0.19 μm, the NMR method shows a slightly higher porosity distribution frequency than the MICP method. This phenomenon can be attributed to the high heterogeneity within the shale. Given the complex microstructure of the shale, which encompasses numerous micropores and nano-scale throats, it is challenging for the MICP method to achieve full saturation in this pore size range. Specifically, the capillary forces from the throats and the surface tension faced by the liquid mercury prevent it from fully entering or filling certain micro-pores. This disparity is especially pronounced in cores with low permeability. Taking the H2-3 core as an example, the extremely low permeability (0.0065 mD) and T2 relaxation time distribution spectrum distribution suggest a significant presence of micro-pores and nano-scale throat structures. The maximum saturation measured via the MICP method for this core is only 59.246%, further confirming that in cores with low permeability, mercury struggles to saturate the micro pores completely. In contrast, the NMR method primarily relies on nuclear magnetic resonance signals to determine the presence and distribution of fluids within the core. It can more accurately detect the distribution of water or other hydrogen-containing fluids within the micro-pores, offering more detailed porosity distribution information. Thus, when dealing with highly heterogeneous rock samples with intricate microstructures, the NMR method may offer more advantageous insights into pore size distribution analysis. When the pore size exceeds 0.19 μm, a phenomenon similar to that observed in sandstones occurs. Specifically, the cumulative frequency of MICP in region 1 is higher than that of NMR, while in region 2, it is lower than NMR.
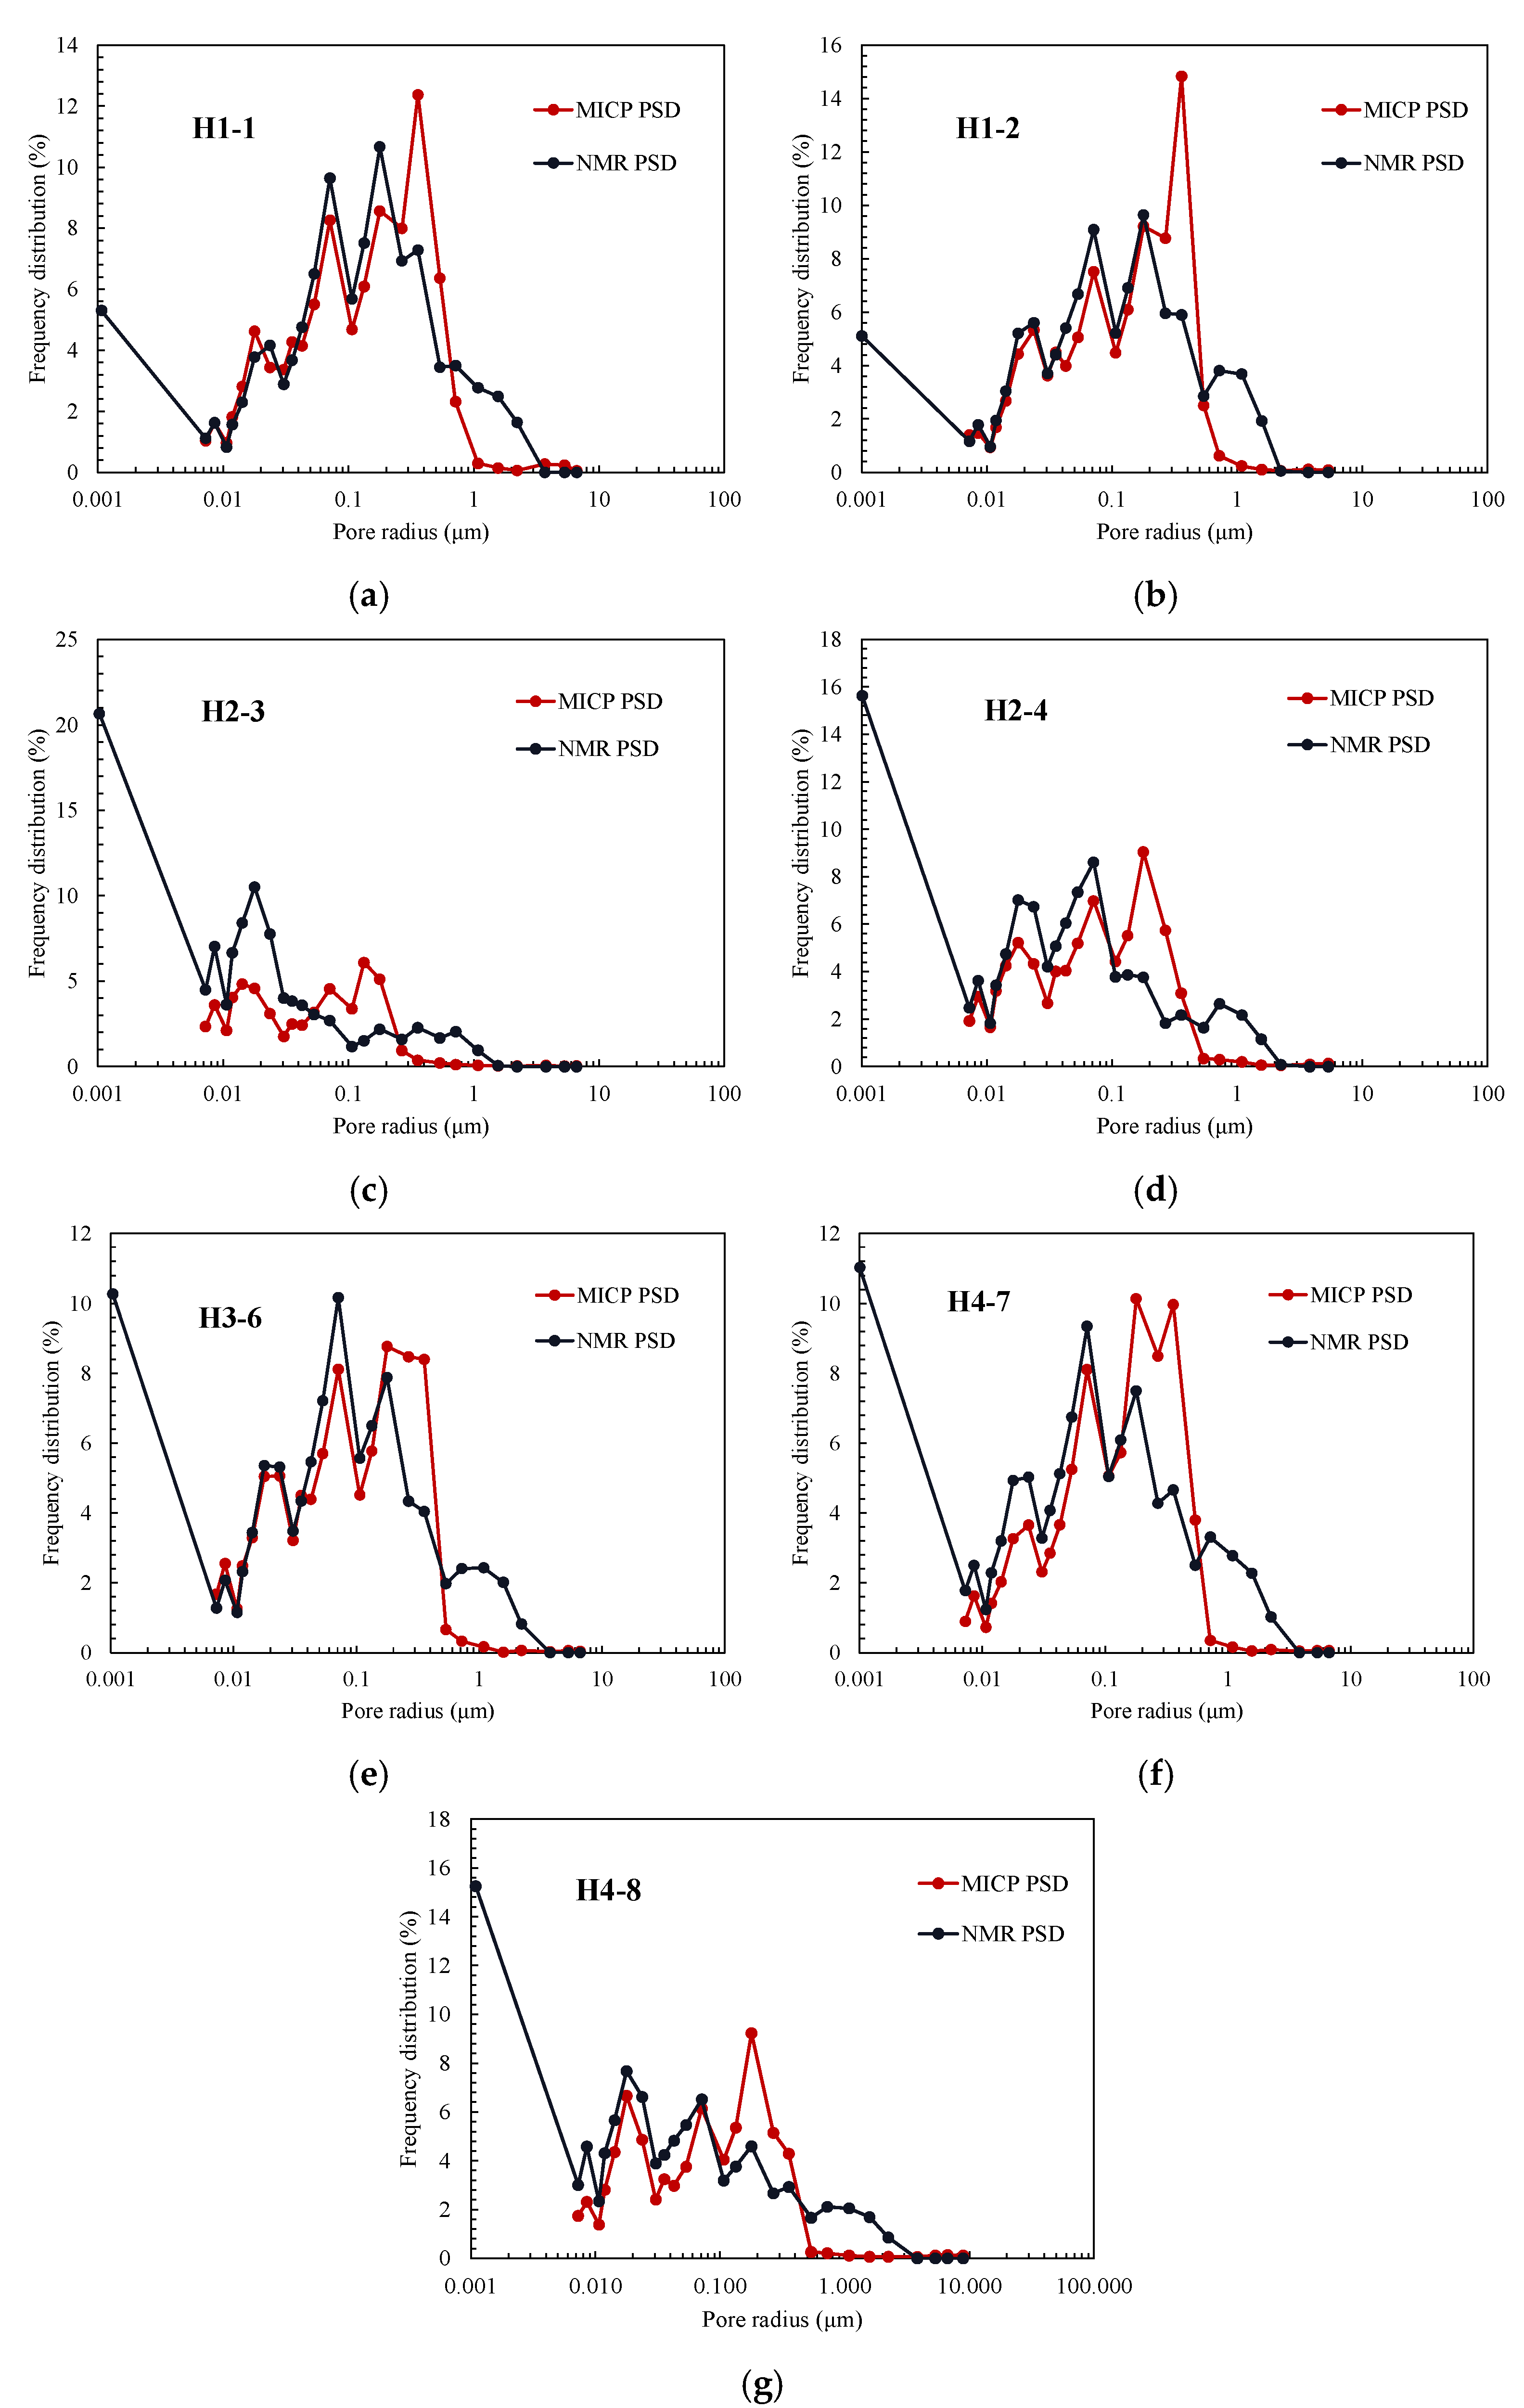
As shown in Figure 12, in the multi-sample pore throat characterization of the Hechuan shale core, a porosity distribution was observed that was similar to Figure 11 and the published data. Specifically, for the pore size range in region 1 (refer to Figure 11), the frequency distribution measured by the MICP method was generally higher than the results obtained via the NMR method. In contrast, within the pore size range of region 2, the porosity distribution frequency, as reflected by NMR, exceeded that characterized by the MICP method. This observation further confirmed the potential inaccuracies of the MICP method in porosity distribution characterization.

3.5. Correlation of Rock Core Physical Properties

The NMR method accurately reflects pore size distribution, whereas MICP measurements may underestimate the proportion of macro-pores and overestimate that of meso-pores. The discrepancies between the two methods are consistent with numerous studies conducted by other researchers. We suggest that the differences in information obtained from dynamic and static methods reflect meaningful physical characteristics that can serve as characteristic values for porous media.
Taking the sandstone core S1-1 as an example, the study investigates the volume overestimated in the MICP method and the pore throat radius controlling mercury intrusion into the large pores.
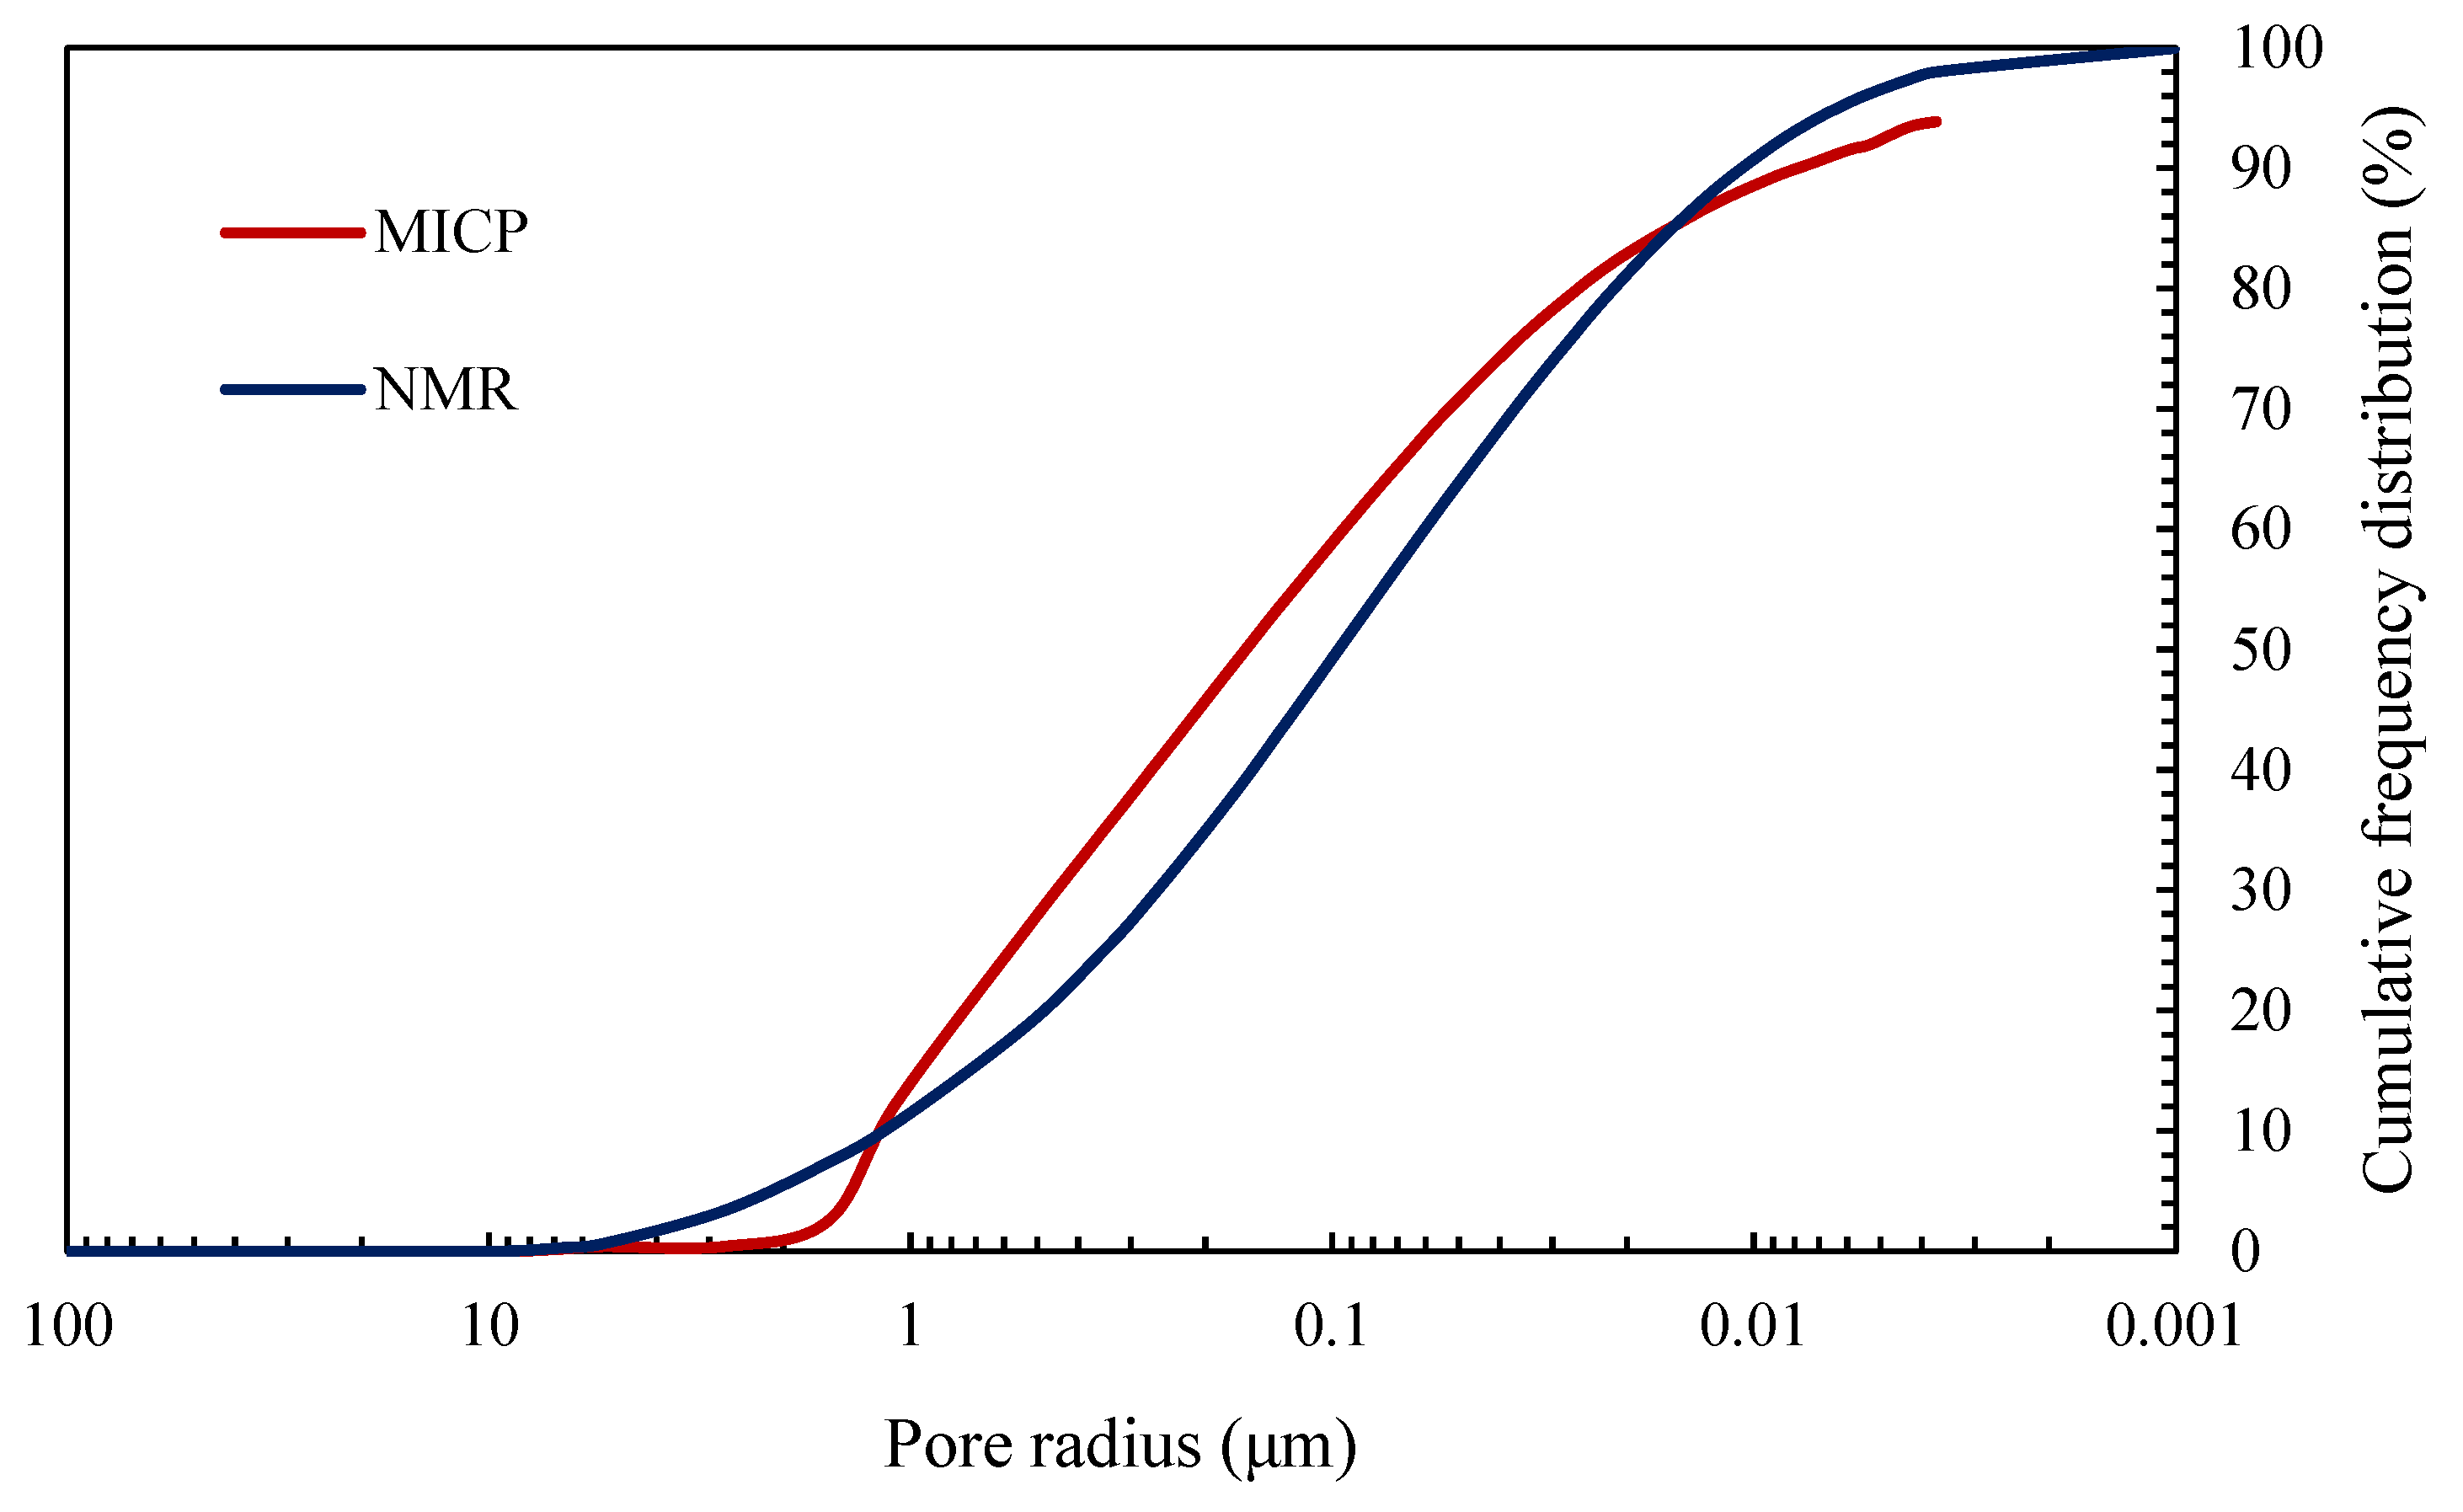
Figure 13 illustrates the relationship between cumulative frequency distribution and pore size in NMR and MICP experiments. It is observed that at larger pore sizes, particularly when mercury intrusion just begins, the cumulative frequency of NMR is higher than that of MICP. As the mercury intrusion pressure increases and mercury enters pores of 1.2 μm, the cumulative frequencies of both methods become equal. The pore radius corresponding to this equal cumulative frequency is defined as controlled throat radius rc. In MICP, rc represents the pore throat radius restricting mercury entry into larger pores. When the injection pressure increases to a point where mercury can enter large pores controlled by rc, the cumulative frequencies of MICP and NMR align. The cumulative frequency distribution corresponding to rc is then twice the volume of pores controlled by rc. Defining the volume controlled by pore throat rc as Frc, it is evident from Figure 13 that in core S1-1, 4.91% of the pore volume is influenced by rc. It is noteworthy that the primary differences between MICP and NMR are observed in the low capillary pressure range. There is a significant size disparity between the throats and pores in this range. However, in the high capillary pressure range, the diameters of the pore throats are similar, and no significant discrepancies between the two methods are observed. Therefore, it is considered that the controlled volume by throat size at rc contributes dominantly to the permeability. In the past, Dr. H.D Winland [64] found that r35 (the radius corresponding to the point at which mercury intrusion volume reaches 35% of the total pore volume of the core) controlled fluid volume is dominant in the flow though feature and used r35 to quantify the rock quality from a statistical point of view. Shohreh et al. [65] classified reservoir rock types based on micro-CT results and then evaluated rock quality for different rock types using the Winland method [65].
The empirical expression is as follows:
logr35 = 0.732 + 0.588logKa − 0.864logΦ
where r35 represents the radius corresponding to the point at which mercury intrusion volume reaches 35% of the total pore volume of the core, measured in μm. Ka is the absolute permeability of the core, expressed in mD, and Φ is the porosity of the core, denoted in %.
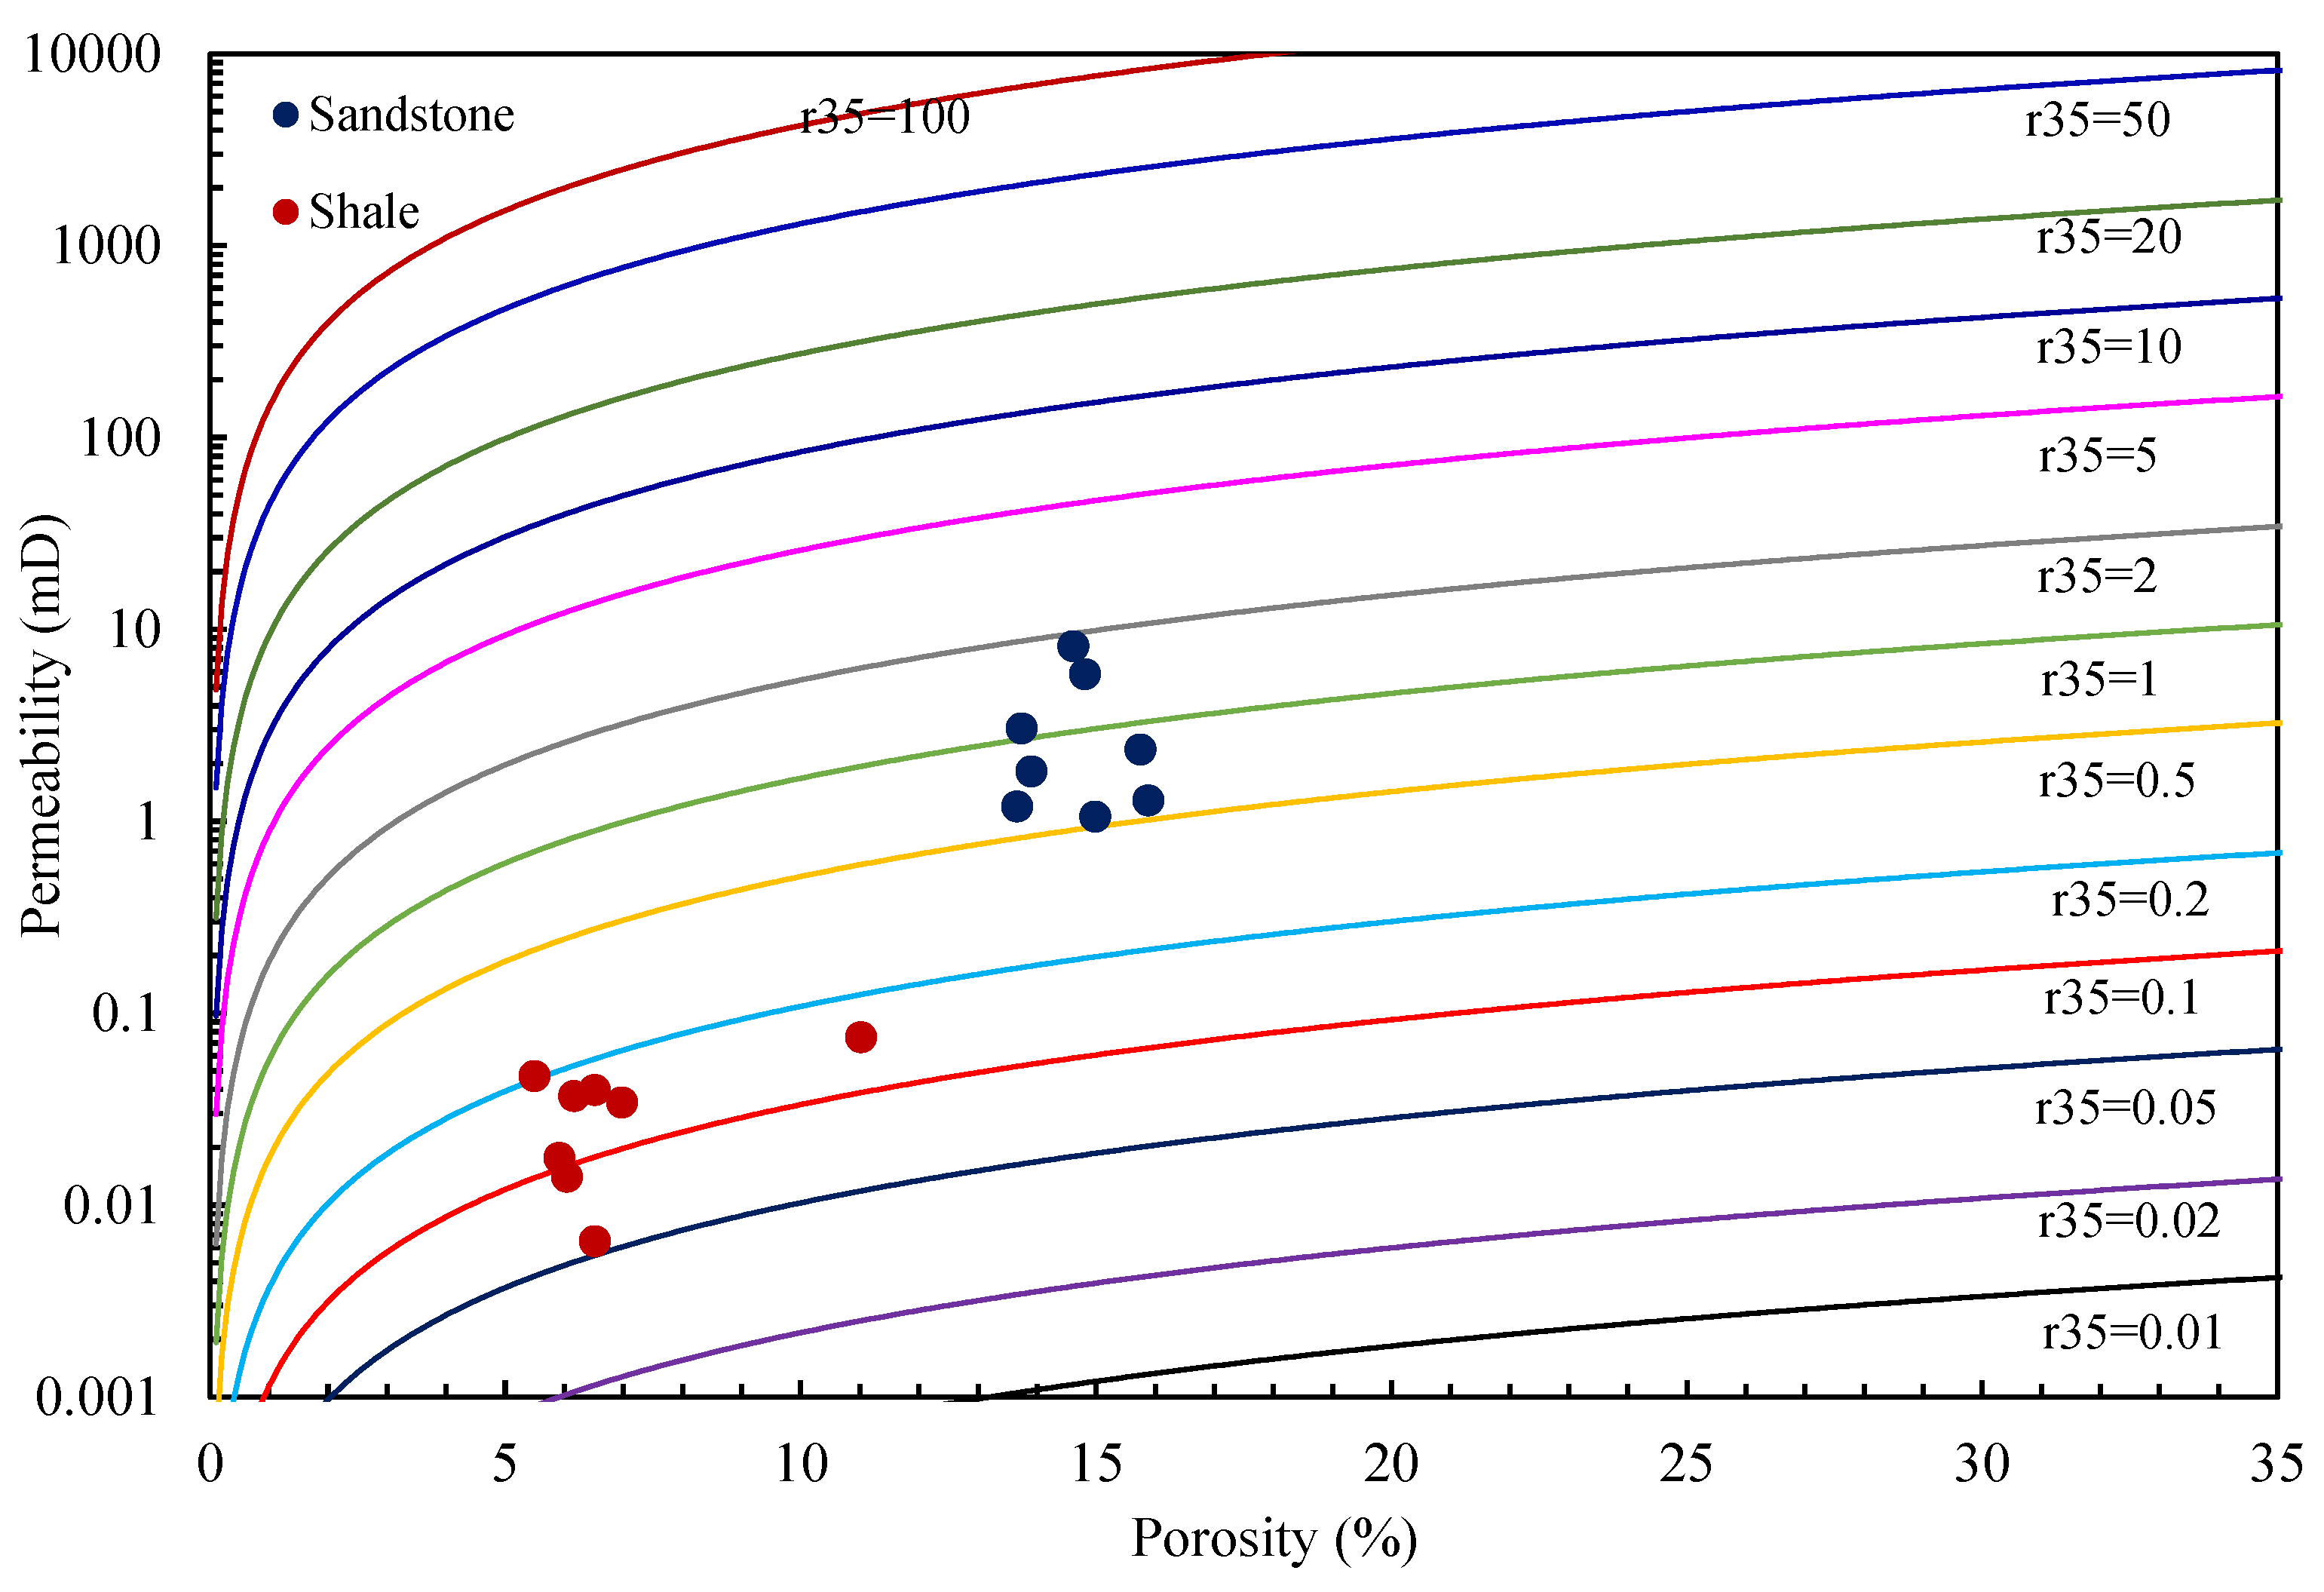
According to Equation (7), the porosity–permeability graph merged with the Winland r35 method (Figure 14) can be derived. It is observable from the figure that sandstone and shale predominantly occupy two distinct regions. Furthermore, the traditional Winland r35 method underperforms in characterizing the attributes of our samples. Numerous researchers have also conducted studies using Winland’s method, finding that the constants in the Winland equation vary for rock cores with different physical properties [8,9,40]. We performed a comparison between our findings and the Winland equation. The results are shown in Table 4.
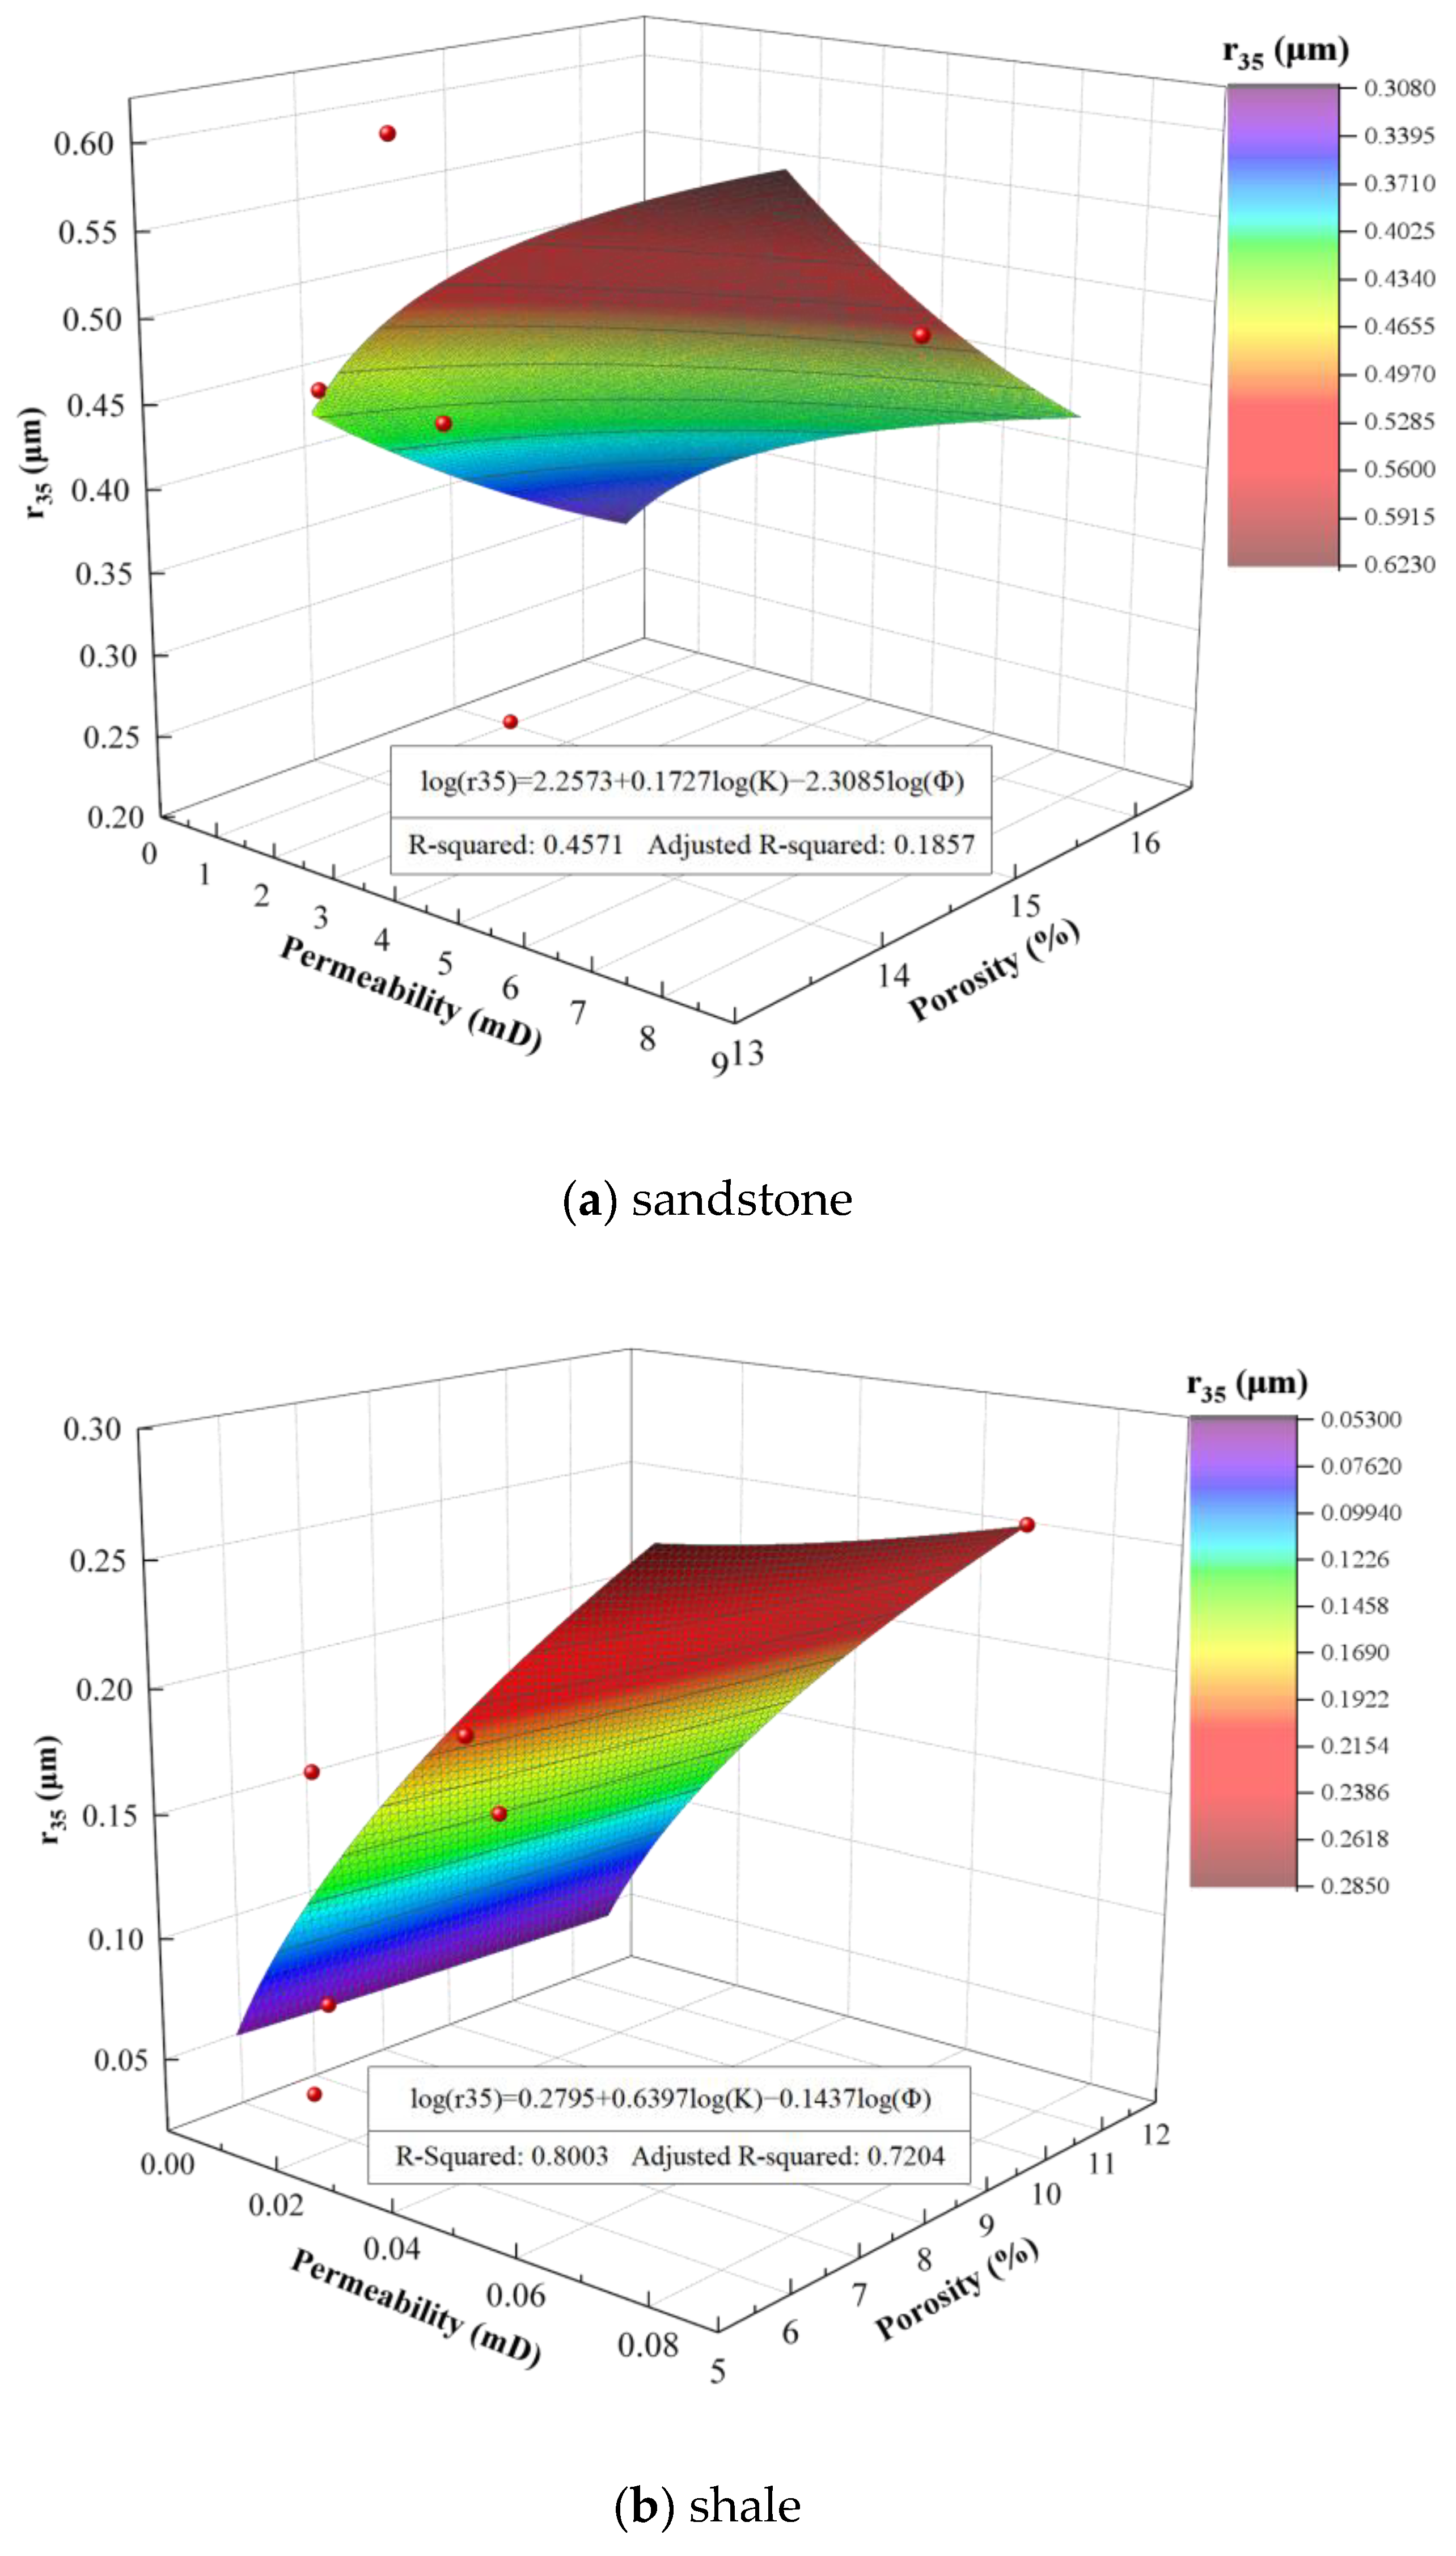
Based on Equation (8), fitting was conducted for r35, Ka, and Φ using both sandstone and shale samples in the style of the Winland equation. The results of this fitting are illustrated in Figure 15.
logr35 = A1 + B1logKa − C1logΦ
where A1, B1, and C1 are the constants in the style of the Winland equation.
From Figure 15, it is observable that the Winland formula fits well for shale samples; however, the matching degree for tight sandstone samples is less satisfactory. Lafage found that the Winland r35 method is not reliable when evaluating the quality of some carbonate reservoirs [66]. Winland r35 is a trial-and-error method. If r35 is not working, other r could be tried in the fitting, such as r40, r45, and r50. This is a common choice for researchers who use the Winland method [9,67]. In addition, different core samples with identical permeability and porosity may share the same r35 values according to the Winland r35 equation. However, there can be significant differences in pore size distribution and connectivity within actual reservoirs. Therefore, relying solely on r35 to assess the relationship between permeability and porosity in cores might not be suitable for all rock samples. Figure 16 reveals the saturation of large pores controlled by the smaller pore throat rc, known as Frc, which reflects the volume of large pores in the core influenced by pore throat rc. Based on Equation (9), fitting was conducted for Frc, Ka, and Φ in the style of the Winland equation.
logFrc = A2 + B2logKa − C2logΦ
where A2, B2, and C2 are constants. Frc is the volume controlled by pore throat rc, in %.
Figure 16 presents the nonlinear surface fitting analysis of Frc, Ka, and Φ for both sandstone and shale samples. It is evident from the figure that the R-Squared is quite high for both types of rock cores, with sandstone exhibiting an R2 value of 0.9267 and shale at 0.8711. Table 5 summarizes the nonlinear surface fitting formulas for various rock cores, revealing a significant correlation in both sandstone and shale between the permeability, porosity, and the volume of large pores controlled by the small pore radius rc.
Frc shows better fitting since it used all the information from MICP and NMR. Whereas the r35 method is a trial-and-error procedure, other metrics such as r45, r55, and r65 may also be used for a better fitting, depending on the requirements. This approach finds a special pore throat that controls fluid flow in a porous media. It provides a comprehensive method to cohesively use information from both MICP and NMR, thereby making rock quality analysis more physically meaningful and accurate. By thoroughly analyzing these relationships, a more accurate assessment and optimization of the development strategies for oil and gas reservoirs can be achieved.

4. Conclusions

In the field of rock pore structure characterization, MICP and NMR are two widely adopted key techniques. This study delves into a comprehensive comparison and analysis of the applicability of these two methods in depicting rock pore structures. By leveraging the discrepancies between NMR and MICP measurements, we have established the Winland Frc method. Sandstone samples from Tuha and shale samples from Hechuan were selected for the experimental analysis. After a series of experiments and data evaluations, the following primary conclusions were drawn:
(1)
In MICP experiments, excessive mercury injection pressures might damage the integrity of the rock’s pore structure, particularly affecting smaller pore sizes and thereby constraining its applicability in micro-pore analysis. Conversely, NMR offers a non-destructive approach to pore structure detection, presenting a distinct advantage in the identification and characterization of micro-pores;
(2)
The heterogeneity of shale and tight sandstone has a noticeable impact on the results obtained from the MICP method. In heterogeneous rocks where large pores are connected to small throats, MICP might overestimate the proportion of small throats and underestimate that of large throats. Due to NMR’s ability to detect all pores containing hydrogen-bearing fluids, it more accurately reflects the rock’s pore distribution;
(3)
In shale, specific signals in NMR are provided by kerogen, asphaltene, and bound water. These signals predominantly appear in the region of smaller pore sizes, potentially causing NMR to overestimate the proportion of these small pores;
(4)
Based on the Winland r35 method, by integrating information from both NMR and MICP measurements, we established the Winland Frc method. This approach surpasses the fitting accuracy of the traditional Winland method. It represents a potential high-precision, comprehensive tool for rock quality analysis, enhancing the precision of analysis and offering a novel perspective for an in-depth understanding of rock properties.

Author Contributions

Conceptualization, Z.G., S.W. and P.G.; methodology, Z.G., S.W. and W.Z.; software, Z.G. and S.W.; validation, Z.G. and S.W.; formal analysis, Z.G. and S.W.; investigation, Z.G. and W.Z.; resources, S.W.; data curation, Z.G.; writing—original draft preparation, Z.G.; writing—review and editing, S.W.; visualization, S.W. and P.G.; supervision, S.W. and P.G.; project administration, P.G.; funding acquisition, P.G. All authors have read and agreed to the published version of the manuscript.

Funding

This research work was partly supported by the Sichuan Natural Science Foundation, China [grant number 2022NSFSC1029].

Institutional Review Board Statement

Not applicable.

Informed Consent Statement

Not applicable.

Data Availability Statement

The data presented in this study are available in the article.

Conflicts of Interest

The authors declare no conflict of interest.

Nomenclature

T2SThe surface relaxation time, ms
T2DThe diffusion relaxation time, ms
T2BThe bulk relaxation time, ms
ρ2The transverse relaxation rate, μm/ms
S/VThe specific surface area of a single pore, μm2/μm3
FSThe pore shape factor, dimensionless
RThe pore radius, μm
CThe conversion coefficient, dimensionless
rcControlled throat radius, μm
FrcThe volume controlled by pore throat rc, %
r35The radius corresponding to the point at which mercury intrusion volume reaches 35% of the total pore volume, μm
KaThe absolute permeability, mD
ΦThe porosity of the core, %

References

  1. Caineng, Z.; Zhi, Y.; Shizhen, T.; Wei, L.; Songtao, W.; Lianhua, H.; Rukai, Z.; Xuanjun, Y.; Lan, W.; Xiaohui, G. Nano-hydrocarbon and the accumulation in coexisting source and reservoir. Pet. Explor. Dev. 2012, 39, 15–32. [Google Scholar]
  2. Deng, X.; Fu, J.; Yao, J.; Pang, J.; Sun, B. Sedimentary facies of the Middle-Upper Triassic Yanchang Formation in Ordos Basin and breakthrough in petroleum exploration. J. Palaeogeogr. 2011, 13, 443–455. [Google Scholar]
  3. Lai, J.; Wang, G.; Wang, Z.; Chen, J.; Pang, X.; Wang, S.; Zhou, Z.; He, Z.; Qin, Z.; Fan, X. A review on pore structure characterization in tight sandstones. Earth-Sci. Rev. 2018, 177, 436–457. [Google Scholar] [CrossRef]
  4. Kale, S.V.; Rai, C.S.; Sondergeld, C.H. Petrophysical characterization of Barnett shale. In Proceedings of the SPE Unconventional Resources Conference/Gas Technology Symposium, Pittsburgh, PA, USA, 23–25 February 2010; SPE, 2010; p. SPE-131770-MS. [Google Scholar]
  5. Katsube, T. Shale permeability and pore-structure evolution characteristics. In Natural Resources Canada; Geological Survey of Canada: Ottawa, ON, Canada, 2000. [Google Scholar]
  6. Yao, Y.; Liu, D. Comparison of low-field NMR and mercury intrusion porosimetry in characterizing pore size distributions of coals. Fuel 2012, 95, 152–158. [Google Scholar] [CrossRef]
  7. Nelson, P.H. Pore-throat sizes in sandstones, tight sandstones, and shales. AAPG Bull. 2009, 93, 329–340. [Google Scholar] [CrossRef]
  8. Tiab, D.; Donaldson, E.C. Petrophysics: Theory and Practice of Measuring Reservoir Rock and Fluid Transport Properties; Gulf Professional Publishing: Houston, TX, USA, 2015. [Google Scholar]
  9. Pittman, E.D. Relationship of porosity and permeability to various parameters derived from mercury injection-capillary pressure curves for sandstone. AAPG Bull. 1992, 76, 191–198. [Google Scholar]
  10. Iraji, S.; Soltanmohammadi, R.; Munoz, E.R.; Basso, M.; Vidal, A.C. Core scale investigation of fluid flow in the heterogeneous porous media based on X-ray computed tomography images: Upscaling and history matching approaches. Geoenergy Sci. Eng. 2023, 225, 211716. [Google Scholar] [CrossRef]
  11. Iraji, S.; De Almeida, T.R.; Munoz, E.R.; Basso, M.; Vidal, A.C. The impact of heterogeneity and pore network characteristics on single and multi-phase fluid propagation in complex porous media: An X-ray computed tomography study. Pet. Sci. 2024; in press. [Google Scholar]
  12. Soltanmohammadi, R.; Iraji, S.; de Almeida, T.R.; Basso, M.; Munoz, E.R.; Vidal, A.C. Investigation of pore geometry influence on fluid flow in heterogeneous porous media: A pore-scale study. Energy Geosci. 2024, 5, 100222. [Google Scholar] [CrossRef]
  13. Yu, Y.; Luo, X.; Wang, Z.; Cheng, M.; Lei, Y.; Zhang, L.; Yin, J. A new correction method for mercury injection capillary pressure (MICP) to characterize the pore structure of shale. J. Nat. Gas Sci. Eng. 2019, 68, 102896. [Google Scholar] [CrossRef]
  14. Mastalerz, M.; Drobniak, A.; Hower, J.C. Controls on reservoir properties in organic-matter-rich shales: Insights from MICP analysis. J. Pet. Sci. Eng. 2021, 196, 107775. [Google Scholar] [CrossRef]
  15. Olson, R.K.; Grigg, M.W. Mercury Injection Capillary Pressure (MICP) a Useful Tool for Improved Understanding of Porosity and Matrix Permeability Distributions in Shale Reservoirs; American Association of Petroleum Geologists: Tulsa, OK, USA, 2008. [Google Scholar]
  16. Gallegos, D.P.; Smith, D.M. A NMR technique for the analysis of pore structure: Determination of continuous pore size distributions. J. Colloid Interface Sci. 1988, 122, 143–153. [Google Scholar] [CrossRef]
  17. Benavides, F.; Leiderman, R.; Souza, A.; Carneiro, G.; de Vasconcellos Azeredo, R.B. Pore size distribution from NMR and image based methods: A comparative study. J. Pet. Sci. Eng. 2020, 184, 106321. [Google Scholar] [CrossRef]
  18. Liu, Z.; Liu, D.; Cai, Y.; Yao, Y.; Pan, Z.; Zhou, Y. Application of nuclear magnetic resonance (NMR) in coalbed methane and shale reservoirs: A review. Int. J. Coal Geol. 2020, 218, 103261. [Google Scholar] [CrossRef]
  19. Zhao, Y.; Lin, B.; Liu, T.; Zheng, Y.; Sun, Y.; Zhang, G.; Li, Q. Multifractal analysis of coal pore structure based on NMR experiment: A new method for predicting T2 cutoff value. Fuel 2021, 283, 119338. [Google Scholar] [CrossRef]
  20. Rashid, F.; Glover, P.; Lorinczi, P.; Hussein, D.; Collier, R.; Lawrence, J. Permeability prediction in tight carbonate rocks using capillary pressure measurements. Mar. Pet. Geol. 2015, 68, 536–550. [Google Scholar] [CrossRef]
  21. Yishan, L.; Xiaohu, D.; Lin, Y.; Fuli, C.; Yanling, G.; Zhangxing, C. Quantitative character—ization of pore structure of Lucaogou formation in Jimsar sag. Xinjiang Pet. Geol. 2019, 40, 284–289. [Google Scholar]
  22. Tangyan, L.; Zaitian, M.; Rongshan, F. Analysis of rock pore structure with NMR spectra. Prog. Geophys. 2003, 18, 737–742. [Google Scholar]
  23. Yao, Y.; Liu, D.; Cai, Y.; Li, J. Advanced characterization of pores and fractures in coals by nuclear magnetic resonance and X-ray computed tomography. Sci. China Earth Sci. 2010, 53, 854–862. [Google Scholar] [CrossRef]
  24. Yao, Y.; Liu, D.; Che, Y.; Tang, D.; Tang, S.; Huang, W. Petrophysical characterization of coals by low-field nuclear magnetic resonance (NMR). Fuel 2010, 89, 1371–1380. [Google Scholar] [CrossRef]
  25. Li, S.; Tang, D.; Xu, H.; Yang, Z. Advanced characterization of physical properties of coals with different coal structures by nuclear magnetic resonance and X-ray computed tomography. Comput. Geosci. 2012, 48, 220–227. [Google Scholar] [CrossRef]
  26. Wang, F.; Yang, K.; Cai, J. Fractal characterization of tight oil reservoir pore structure using nuclear magnetic resonance and mercury intrusion porosimetry. Fractals 2018, 26, 1840017. [Google Scholar] [CrossRef]
  27. Daigle, H.; Johnson, A. Combining mercury intrusion and nuclear magnetic resonance measurements using percolation theory. Transp. Porous Media 2016, 111, 669–679. [Google Scholar] [CrossRef]
  28. Lyu, C.; Ning, Z.; Wang, Q.; Chen, M. Application of NMR T 2 to pore size distribution and movable fluid distribution in tight sandstones. Energy Fuels 2018, 32, 1395–1405. [Google Scholar] [CrossRef]
  29. Marschall, D.; Gardner, J.; Mardon, D.; Coates, G. Method for Correlating NMR Relaxometry and Mercury Injection Data. In 1995 SCA Conference; 1995; p. 40. Available online: https://www.jgmaas.com/SCA/1995/SCA1995-11.pdf (accessed on 24 February 2024).
  30. Ausbrooks, R.; Hurley, N.F.; May, A.; Neese, D.G. Pore-Size Distributions in Vuggy Carbonates from Core Images, NMR, and Capillary Pressure. In Proceedings of the SPE Annual Technical Conference and Exhibition? Houston, TX, USA, 3–6 October 1999; SPE, 1999; p. SPE-56506-MS. [Google Scholar]
  31. Daigle, H.; Thomas, B.; Rowe, H.; Nieto, M. Nuclear magnetic resonance characterization of shallow marine sediments from the Nankai Trough, Integrated Ocean Drilling Program Expedition 333. J. Geophys. Res. Solid Earth 2014, 119, 2631–2650. [Google Scholar] [CrossRef]
  32. Diamond, S. Mercury porosimetry: An inappropriate method for the measurement of pore size distributions in cement-based materials. Cem. Concr. Res. 2000, 30, 1517–1525. [Google Scholar] [CrossRef]
  33. Xu, H.; Fan, Y.; Hu, F.; Li, C.; Yu, J.; Liu, Z.; Wang, F. Characterization of pore throat size distribution in tight sandstones with nuclear magnetic resonance and high-pressure mercury intrusion. Energies 2019, 12, 1528. [Google Scholar] [CrossRef]
  34. Li, C.; Liu, X.; You, F.; Wang, P.; Feng, X.; Hu, Z. Pore Size Distribution Characterization by Joint Interpretation of MICP and NMR: A Case Study of Chang 7 Tight Sandstone in the Ordos Basin. Processes 2022, 10, 1941. [Google Scholar] [CrossRef]
  35. Yuan, Y.; Rezaee, R. Impact of paramagnetic minerals on NMR-converted pore size distributions in Permian Carynginia shales. Energy Fuels 2019, 33, 2880–2887. [Google Scholar] [CrossRef]
  36. Yuan, Y.; Rezaee, R. Comparative porosity and pore structure assessment in shales: Measurement techniques, influencing factors and implications for reservoir characterization. Energies 2019, 12, 2094. [Google Scholar] [CrossRef]
  37. Moro, F.; Böhni, H. Ink-bottle effect in mercury intrusion porosimetry of cement-based materials. J. Colloid Interface Sci. 2002, 246, 135–149. [Google Scholar] [CrossRef]
  38. Zhang, Y.; Yang, B.; Yang, Z.; Ye, G. Ink-bottle effect and pore size distribution of cementitious materials identified by pressurization–depressurization cycling mercury intrusion porosimetry. Materials 2019, 12, 1454. [Google Scholar] [CrossRef]
  39. Zhang, P.; Lu, S.; Li, J.; Zhang, J.; Xue, H.; Chen, C. Comparisons of SEM, low-field NMR, and mercury intrusion capillary pressure in characterization of the pore size distribution of lacustrine shale: A case study on the Dongying Depression, Bohai Bay Basin, China. Energy Fuels 2017, 31, 9232–9239. [Google Scholar] [CrossRef]
  40. Gunter, G.; Spain, D.; Viro, E.; Thomas, J.; Potter, G.; Williams, J. Winland Pore Throat Prediction Method-A Proper Retrospect: New Examples from Carbonates and Complex Systems. In Proceedings of the SPWLA Annual Logging Symposium, Abu Dhabi, United Arab Emirates, 18–22 May 2014; SPWLA: Houston, TX, USA, 2014; p. SPWLA-2014-KKK. [Google Scholar]
  41. Youxin, Z.; Xinning, L.; Zhenshan, P.; Hao, Z.; Qiang, M.; Xueliang, S. The Qiketai tight oil reservoir characteristics of Jurassic in Tuha Basin. Xinjiang Pet. Geol. 2014, 35, 1. [Google Scholar]
  42. Gang, G.; Hua-ming, L.; Chuan, L.; Zhi-yong, W.; Qing-chun, J. The geologic feature and hydrocarbon accumulation of Niujuanhu oilfield in Santanghu Basin. Xinjiang Pet. Geol. 2006, 27, 535. [Google Scholar]
  43. Dong, Z.-L. Natural Gas Characteristics and Gas Sources of the Lower Permian in Hechuan-Tongnan Area, Sichuan Basin. In International Field Exploration and Development Conference, 2022; Springer: Berlin/Heidelberg, Germany, 2022; pp. 1074–1082. [Google Scholar]
  44. Guo, Q.; Li, J.; Chen, N.; Hu, J.; Xie, H.; Gao, X. Modeling of the tight sandstone gas accumulation for the Xujiahe Formation, Hechuan-Tongnan Area, Sichuan Basin. Pet. Explor. Dev. 2011, 38, 409–418. [Google Scholar] [CrossRef]
  45. GB/T34533-2023; Determination of Porosity, Permeability, and Saturation of Shale. Standard Press of China: Beijing, China, 2023. Available online: https://www.chinesestandard.net/PDF/English.aspx/GBT34533-2023 (accessed on 24 February 2024).
  46. SY/T6490-2023. Specifications for Laboratory Measurement of NMR Parameters of Rock Samples. Available online: https://www.chinesestandard.net/PDF/English.aspx/SYT6490-2023 (accessed on 24 February 2024).
  47. GB/T29171-2023; Rock capillary Pressure Measurement. Standard Press of China: Beijing, China, 2023. Available online: https://www.chinesestandard.net/PDF/BOOK.aspx/GBT29171-2023 (accessed on 24 February 2024).
  48. Al Ismail, M.I.; Hol, S.; Reece, J.S.; Zoback, M.D. In The Effect of CO2 Adsorption on Permeability Anisotropy in the Eagle Ford Shale. In Proceedings of the SPE/AAPG/SEG Unconventional Resources Technology Conference, Denver, CO, USA, 25–27 August 2014; URTEC, 2014; p. URTEC-1921520-MS. [Google Scholar]
  49. GB/T29172-2012; Practices for core analysis. National Petroleum Standardization. Standard press of China: Beijing China, 2012. Available online: https://www.chinesestandard.net/Default.aspx?StdID=GB/T29172-2012 (accessed on 24 February 2024).
  50. Dunn, K.-J.; Bergman, D.J.; LaTorraca, G.A. Nuclear Magnetic Resonance: Petrophysical and Logging Applications; Elsevier: Amsterdam, The Netherlands, 2002. [Google Scholar]
  51. Coates, G.R.; Xiao, L.; Prammer, M.G. NMR logging. In Principles and Interpretation; Halliburton Energy Service: Huston, TX, USA, 1999. [Google Scholar]
  52. Kleinberg, R.L.; Horsfield, M.A. Transverse relaxation processes in porous sedimentary rock. J. Magn. Reson. 1990, 88, 9–19. [Google Scholar] [CrossRef]
  53. Lowden, B.D.; Porter, M.J.; Powrie, L.S. T2 Relaxation Time Versus Mercury Injection Capillary Pressure: Implications for NMR Logging and Reservoir Characterisation. In Proceedings of the SPE Europec Featured at EAGE Conference and Exhibition? The Hague, The Netherlands, 20–22 October 1998; SPE, 1998; p. SPE-50607-MS. [Google Scholar]
  54. Rosenbrand, E.; Fabricius, I.L.; Fisher, Q.; Grattoni, C. Permeability in Rotliegend gas sandstones to gas and brine as predicted from NMR, mercury injection and image analysis. Mar. Pet. Geol. 2015, 64, 189–202. [Google Scholar] [CrossRef]
  55. Xiao, L.; Mao, Z.-q.; Zou, C.-c.; Jin, Y.; Zhu, J.-C. A new methodology of constructing pseudo capillary pressure (Pc) curves from nuclear magnetic resonance (NMR) logs. J. Pet. Sci. Eng. 2016, 147, 154–167. [Google Scholar] [CrossRef]
  56. Lei, Z.; Xiangyang, Q.; Liang, Z.; Keliu, W.; Wei, Z.; Huifang, B.; Cuiping, X.; Tao, W. Reservoir characteristics and development performance of Yanchang Formation in Xunyi exploration area, Ordos Basin. Acta Pet. Sin. 2020, 41, 88. [Google Scholar]
  57. Yadav, D.; Nair, S.B.; Awasthi, M.K.; Ragoju, R.; Bhattacharyya, K. Linear and nonlinear investigations of the impact of chemical reaction on the thermohaline convection in a permeable layer saturated with Casson fluid. Phys. Fluids 2024, 36, 014106. [Google Scholar] [CrossRef]
  58. Yadav, D.; Kim, M. Theoretical and numerical analyses on the onset and growth of convective instabilities in a horizontal anisotropic porous medium. J. Porous Media 2014, 17, 1061–1074. [Google Scholar] [CrossRef]
  59. Li, A.; Ren, X.; Wang, G.; Wang, Y.-Z.; Jiang, K.-L. Characterization of pore structure of low permeability reservoirs using a nuclear magnetic resonance method. J. China Univ. Pet. 2015, 39, 92–98. [Google Scholar]
  60. Wang, H.; Rezaee, R.; Saeedi, A. Evaporation process and pore size distribution in tight sandstones: A study using NMR and MICP. Procedia Earth Planet. Sci. 2015, 15, 767–773. [Google Scholar] [CrossRef]
  61. Wu, Y.; Tahmasebi, P.; Lin, C.; Zahid, M.A.; Dong, C.; Golab, A.N.; Ren, L. A comprehensive study on geometric, topological and fractal characterizations of pore systems in low-permeability reservoirs based on SEM, MICP, NMR, and X-ray CT experiments. Mar. Pet. Geol. 2019, 103, 12–28. [Google Scholar] [CrossRef]
  62. Willis, K.L.; Abell, A.B.; Lange, D.A. Image-based characterization of cement pore structure using wood’s metal intrusion. Cem. Concr. Res. 1998, 28, 1695–1705. [Google Scholar] [CrossRef]
  63. Crawford, B.; Gaillot, P.; Alramahi, B. Petrophysical Methodology for Predicting Compressive Strength in Siliciclastic “Sandstone-to-Shale” Rocks. In Proceedings of the ARMA US Rock Mechanics/Geomechanics Symposium, Salt Lake City, UT, USA, 27–30 June 2010; ARMA, 2010; p. ARMA-10-196. [Google Scholar]
  64. Kolodzie Jr, S. Analysis of Pore Throat Size and use of the Waxman-Smits Equation to Determine OOIP in Spindle Field, Colorado. In Proceedings of the SPE Annual Technical Conference and Exhibition? Dallas, TX, USA, 21–24 September 1980; SPE, 1980; p. SPE-9382-MS. [Google Scholar]
  65. Iraji, S.; Soltanmohammadi, R.; Matheus, G.F.; Basso, M.; Vidal, A.C. Application of unsupervised learning and deep learning for rock type prediction and petrophysical characterization using multi-scale data. Geoenergy Sci. Eng. 2023, 230, 212241. [Google Scholar] [CrossRef]
  66. Lafage, S.I. An Alternative to the Winland R35 Method for Determining Carbonate Reservoir Quality; Texas A&M University: College Station, TX, USA, 2008. [Google Scholar]
  67. Rivas, J.; Busnego, H.; Bejarano, C.; Meza, R. Modeling of Pore Throat Radio using Pittman Modified Equation for Carabobo Area in the Faja Petrolífera del Orinoco. 2014. Available online: https://www.researchgate.net/publication/272351788_Modeling_of_Pore_Throat_Radio_using_Pittman_Modified_Equation_for_Carabobo_Area_in_the_Faja_Petrolifera_del_Orinoco (accessed on 24 February 2024).
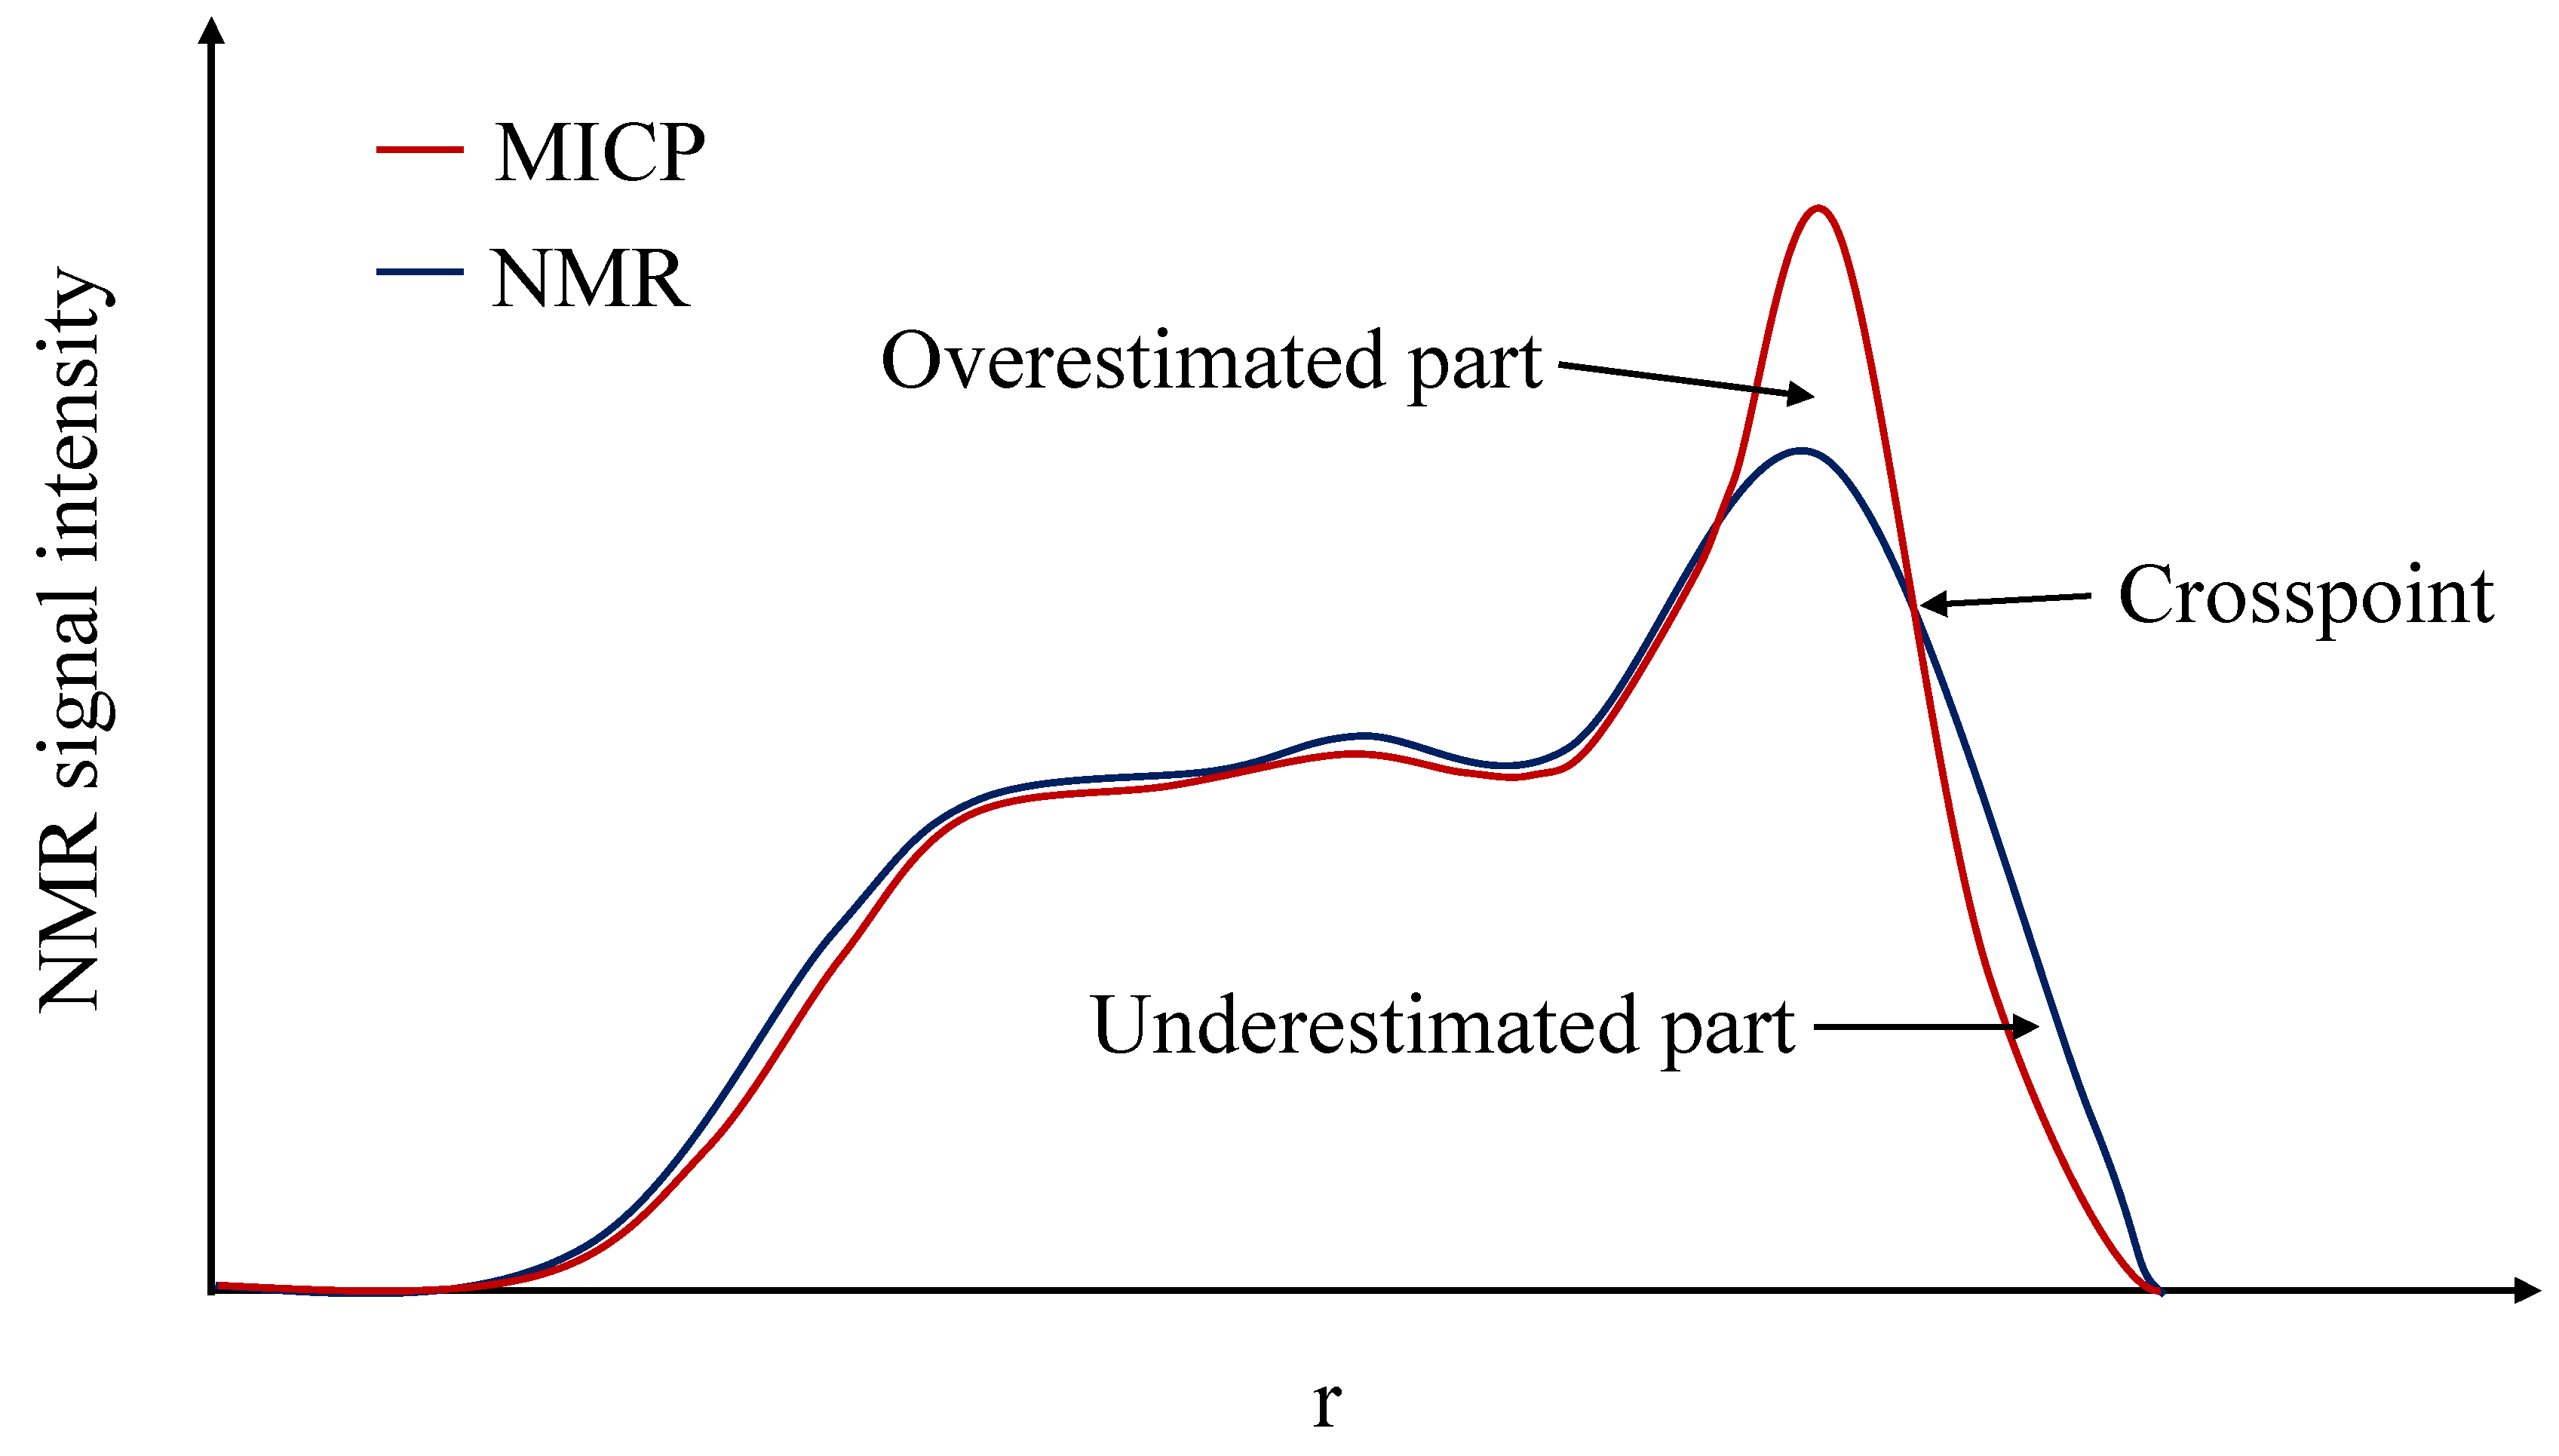
Figure 1. The discrepancy between MICP and NMR methods schematic diagram.
Applsci 14 01881 g001
Figure 2. Rock samples: (a) sandstone S1-1; (b) shale H3-5.
Applsci 14 01881 g002
Figure 3. The process of rock quality evaluation.
Applsci 14 01881 g003
Figure 4. The T2 relaxation time distribution spectrum of Tuha sandstone.
Applsci 14 01881 g004
Figure 5. The T2 relaxation time distribution spectrum of Hechuan shale.
Applsci 14 01881 g005
Figure 6. The cumulative frequency distribution of NMR and MICP (S1-1 and H3-5).
Applsci 14 01881 g006
Figure 7. Fitting-related parameters of conversion from NMR T2 to pore radius (S1-1 and H3-5).
Applsci 14 01881 g007
Figure 8. A comparison of pore throat size distributions in sandstone S1-1 as determined via NMR and MICP measurements.
Applsci 14 01881 g008
Figure 9. MICP schematic diagram: (a) MICP underestimates large pore porosity, (b) MICP overestimates small pore porosity.
Applsci 14 01881 g009
Figure 10. A comparison of pore-throat size distributions in sandstone as determined by NMR and MICP measurements: (a) S1-2, (b) S1-3, (c) S1-4, (d) S2-5, (e) S2-6, (f) S2-7, and (g) S2-8.
Applsci 14 01881 g010
Figure 11. A comparison of pore throat size distributions in shale H3-5 as determined via NMR and MICP measurements.
Applsci 14 01881 g011
Figure 12. A comparison of pore-throat size distributions in shale as determined by NMR and MICP methods: (a) H1-1, (b) H1-2, (c) H2-3, (d) H2-4, (e) H3-6, (f) H4-7, and (g) H4-8.
Applsci 14 01881 g012
Figure 13. The cumulative frequency distribution by NMR and MICP (S1-1).
Applsci 14 01881 g013
Figure 14. Porosity–permeability graph merged with the r35 technique of Winland.
Applsci 14 01881 g014
Figure 15. The relationship between r35, Ka, and Φ: (a) sandstone and (b) shale.
Applsci 14 01881 g015
Figure 16. The relationship between Frc, Ka, and Φ: (a) sandstone and (b) shale.
Applsci 14 01881 g016aApplsci 14 01881 g016b
Table 1. The discrepancy between MICP and NMR methods.
AuthorPorous Media TypeCrosspointOverestimated Part
Marschal et al. [29]Shaly sandstone170 ms100~170 ms
Robin et al. [30]Carbonate1300 ms700~1300 ms
Hugh and Andrew [31] Sandstone0.25 μm0.11~0.25 μm
Sidney [32]Wood’s metal9 μm0.05~9 μm
Hongjun et al. [33]Tight sandstone0.4 μm0.1~0.4 μm
Table 2. Basic physical properties of samples.
Well
Number
SamplesLength (mm)Diameter (mm)Volume (mL)Helium Porosity (%)Permeability (mD)Lithology
S1187.0124.4040.6914.981.06Sandstone
271.5224.5033.7213.743.06Conglomerate sandstones
357.7824.5527.3514.618.20
453.1424.4524.9514.815.86
S2572.1024.5534.1313.901.83Sandstone
672.1024.5033.9913.661.20
S3772.5324.5234.2515.752.37
867.1024.4531.5015.881.29
H1156.3025.1127.885.490.0471Shale
253.3125.1126.406.160.0371
H2340.4925.4020.526.510.0065
439.9425.4720.356.040.0141
H3540.4925.4320.5711.020.0753
641.8325.3721.156.970.0344
H4732.5025.4016.476.510.0399
832.8025.4016.625.910.0177
Table 3. Conversion factors between NMR T2 relaxation time distribution spectrum and pore throat radius and correlation index.
Well NumberSamplesSaturation of MICP (%)CnR2
S1193.1940.01971.01210.9059
285.5030.01120.87180.9951
378.6650.01290.79450.9950
481.1740.01790.89160.9878
S2592.5310.02611.04900.9475
688..8780.02311.06350.9498
S3789.9290.01790.95650.9157
892.1710.02131.06850.9447
H1194.8020.02811.32380.8993
293.5440.02451.44260.8858
H2359.2460.01921.33480.8872
479.0730.02041.34720.9088
H3583.4500.00861.08680.8859
689.4000.01731.23960.8662
H4783.6490.02271.34160.8995
875.7740.02071.28220.8448
Table 4. rc, r35, and Frc for 16 samples.
Well
Number
SamplesHelium Porosity (%)Permeability (mD)rc
(μm)
r35
(μm)
Frc
(%)
S1114.981.061.20480.20354.9107
213.743.061.57580.44647.1410
314.618.201.23400.516011.2015
414.815.86///
S2513.901.832.09650.60104.1977
613.661.201.53160.45253.8504
S3715.752.371.78450.43215.4742
815.881.291.37650.33883.0388
H115.490.04710.39380.20349.8615
26.160.03710.36620.18308.9962
H236.510.00650.14170.02266.0439
46.040.01410.23880.25816.4697
H3511.020.07530.35860.19708.8264
66.970.03440.27070.07588.9040
H476.510.03990.31610.16659.2728
85.910.01770.20280.15358.6696
Due to the improper removal of the pockmarks effect, the rc and Frc of S1-4 was not detected.
Table 5. The nonlinear surface fitting analysis.
LithologyTuha SandstoneHechuan Shale
A12.25730.2795
B10.17270.6397
C1−2.3085−0.1437
R2 (r35)0.45710.8003
R a d j 2 (r35)0.18570.7204
A21.25271.5502
B20.55480.2316
C2−0.6095−0.327
R2 (Frc)0.92670.8711
R a d j 2 (Frc)0.89000.8195
Disclaimer/Publisher’s Note: The statements, opinions and data contained in all publications are solely those of the individual author(s) and contributor(s) and not of MDPI and/or the editor(s). MDPI and/or the editor(s) disclaim responsibility for any injury to people or property resulting from any ideas, methods, instructions or products referred to in the content.