Article

Sensitivity Analysis of Influencing Factors of Karst Tunnel Construction Based on Orthogonal Tests and a Random Forest Algorithm

1
School of Civil Engineering and Architecture, Guangxi University, Nanning 530004, China
2
School of Civil & Architecture Engineering, East China University of Technology, Nanchang 330013, China
3
School of Architectural Engineering, Guangzhou City Construction College, Guangzhou 510925, China
4
State Key Laboratory of Featured Metal Materials and Life-Cycle Safety for Composite Structures, Guangxi University, Nanning 530004, China
*
Author to whom correspondence should be addressed.
Appl. Sci. 2024, 14(5), 2079; https://doi.org/10.3390/app14052079
Submission received: 10 January 2024 / Revised: 21 February 2024 / Accepted: 25 February 2024 / Published: 1 March 2024
(This article belongs to the Section Civil Engineering)

Abstract

:
To conduct a sensitivity analysis of the relevant parameters that impact the mechanics of tunnel construction in karst areas, firstly, the orthogonal design and range analysis method is applied to sort the 11 kinds of karst-tunnel-influencing factors from high to low according to the sensitivity degree. Secondly, the random forest algorithm based on an orthogonal experimental design is applied to the feature importance ranking of the influencing factors of karst tunnels. Thirdly, according to the results of the sensitivity analysis, the optimum combinations of influencing factors of tunnel construction in karst areas is obtained. The research based on these two methods shows that when taking the vertical displacement as the target variable, the parameters with the highest feature importance are A6 (tunnel diameter) and A10 (tunnel buried depth). When taking the first principal stress as the target variable, the most important influencing factors are A10 (tunnel buried depth) and A9 (location of karst cave). When taking the principal stress difference as the target variable, the most important influencing factors are A10 (tunnel buried depth) and A6 (tunnel diameter). The level combination of the 11 influencing factors obtained by taking the principal stress difference as the target variable was more balanced than the vertical displacement and the principal stress difference as the target variables. The results of this study will provide a theoretical basis to study key parameters in the response of mechanical characteristics to the safe construction of tunnels in karst areas.

1. Introduction

Karst geomorphology is widely distributed globally, and it is estimated that the global area of karst is about 20 million square kilometres [1]. Therefore, it is relatively typical to encounter karst caves or soil holes during the tunnel-construction process. For zones with strong karst development, the geological conditions are complicated, which could easily lead to geological disasters [2] such as water–mud inrush [3], karst collapse [4], perilous rock collapse [5], and other geological disasters [6]. In the procedure of studying the response of mechanical characteristics in tunnel construction in karst areas [7], it is fundamental to determine the sensitivity of the influencing factors involved.
As a result of the stochastic characteristics of the geotechnical parameters and the diversity of engineering geological conditions, the sensitivity of the influencing factors related to the stability of tunnel construction in karst areas [8] needs to be studied, and the primary and secondary influencing factors should be identified. The orthogonal experimental design method is one of the more frequently utilised methods.
To effectively identify the influencing factors that would result in damage to tunnels and to provide a foundation to optimise the design and maintenance of tunnels, Yu et al. [9] quantitatively analysed the deformation characteristics of the rock surrounding the tunnel through a numerical simulation and orthogonal test. Tian et al. [10] applied a sensitivity analysis method to select the parameters that have greater impacts on the measured values in the field. Tian et al. [11] designed the lining structure and karst cave model using the similarity theory and orthogonal test method. Su et al. [12] proposed a method for the construction of the displacement release coefficient formula based on the quadratic regression orthogonal combination test design method. Han et al. [13] explored the effects of various parameters on the structural stability of shield tunnels in karst areas using the orthogonal experimental design method. Li et al. [14] proposed a water inrush evaluation model by applying the Mohr–Coulomb intensity criterion and carried out a sensitivity analysis of 12 specific parameters in the assessment model.
In addition to applying the orthogonal experimental design method, scholars have also applied machine-learning algorithms to analyse the sensitivity of engineering parameters for the construction of tunnels and underground works. Cheng et al. [15] proposed a machine-learning model that could predict ground settlement for shield tunnel construction. Jang et al. [16] analysed the contribution of geological parameters to the measured value of over-excavation by applying five tunnel over-excavation prediction artificial neuron network models. It has been shown that the results obtained by applying machine-learning algorithms for the sensitivity analyses of tunnel construction engineering parameters are also of investigation value. In addition to these, variance-based global sensitivity analysis algorithms have been favoured by numerous scholars. Zhao et al. [17] investigated the settlement of buildings based on the structural system characteristics of earth tunnels by applying local and global sensitivity analyses [18]. Pandit et al. [19] determined the sensitivity of the engineering parameters of the circular tunnel by means of a global sensitivity analysis based on the Sobol index. Miro et al. [20] determined the key geotechnical parameters of the tunnel finite-element model by employing a global sensitivity analysis. Fellin et al. [21] utilised experimental and sensitivity analyses of uncertainty methods to assess the predictive power and robustness of a shallow tunnel construction model.
However, sensitivity analyses of the factors influencing the stability of karst tunnels [22,23] have rarely been conducted in the published literature, and the application of machine-learning algorithms to characterise the importance of factors [24] affecting karst tunnels is also relatively rare. In this paper, the orthogonal experimental design method and random forest algorithm [25] are combined to rank the influencing factors of karst tunnels according to sensitivity from high to low and to determine the optimal level of combination.

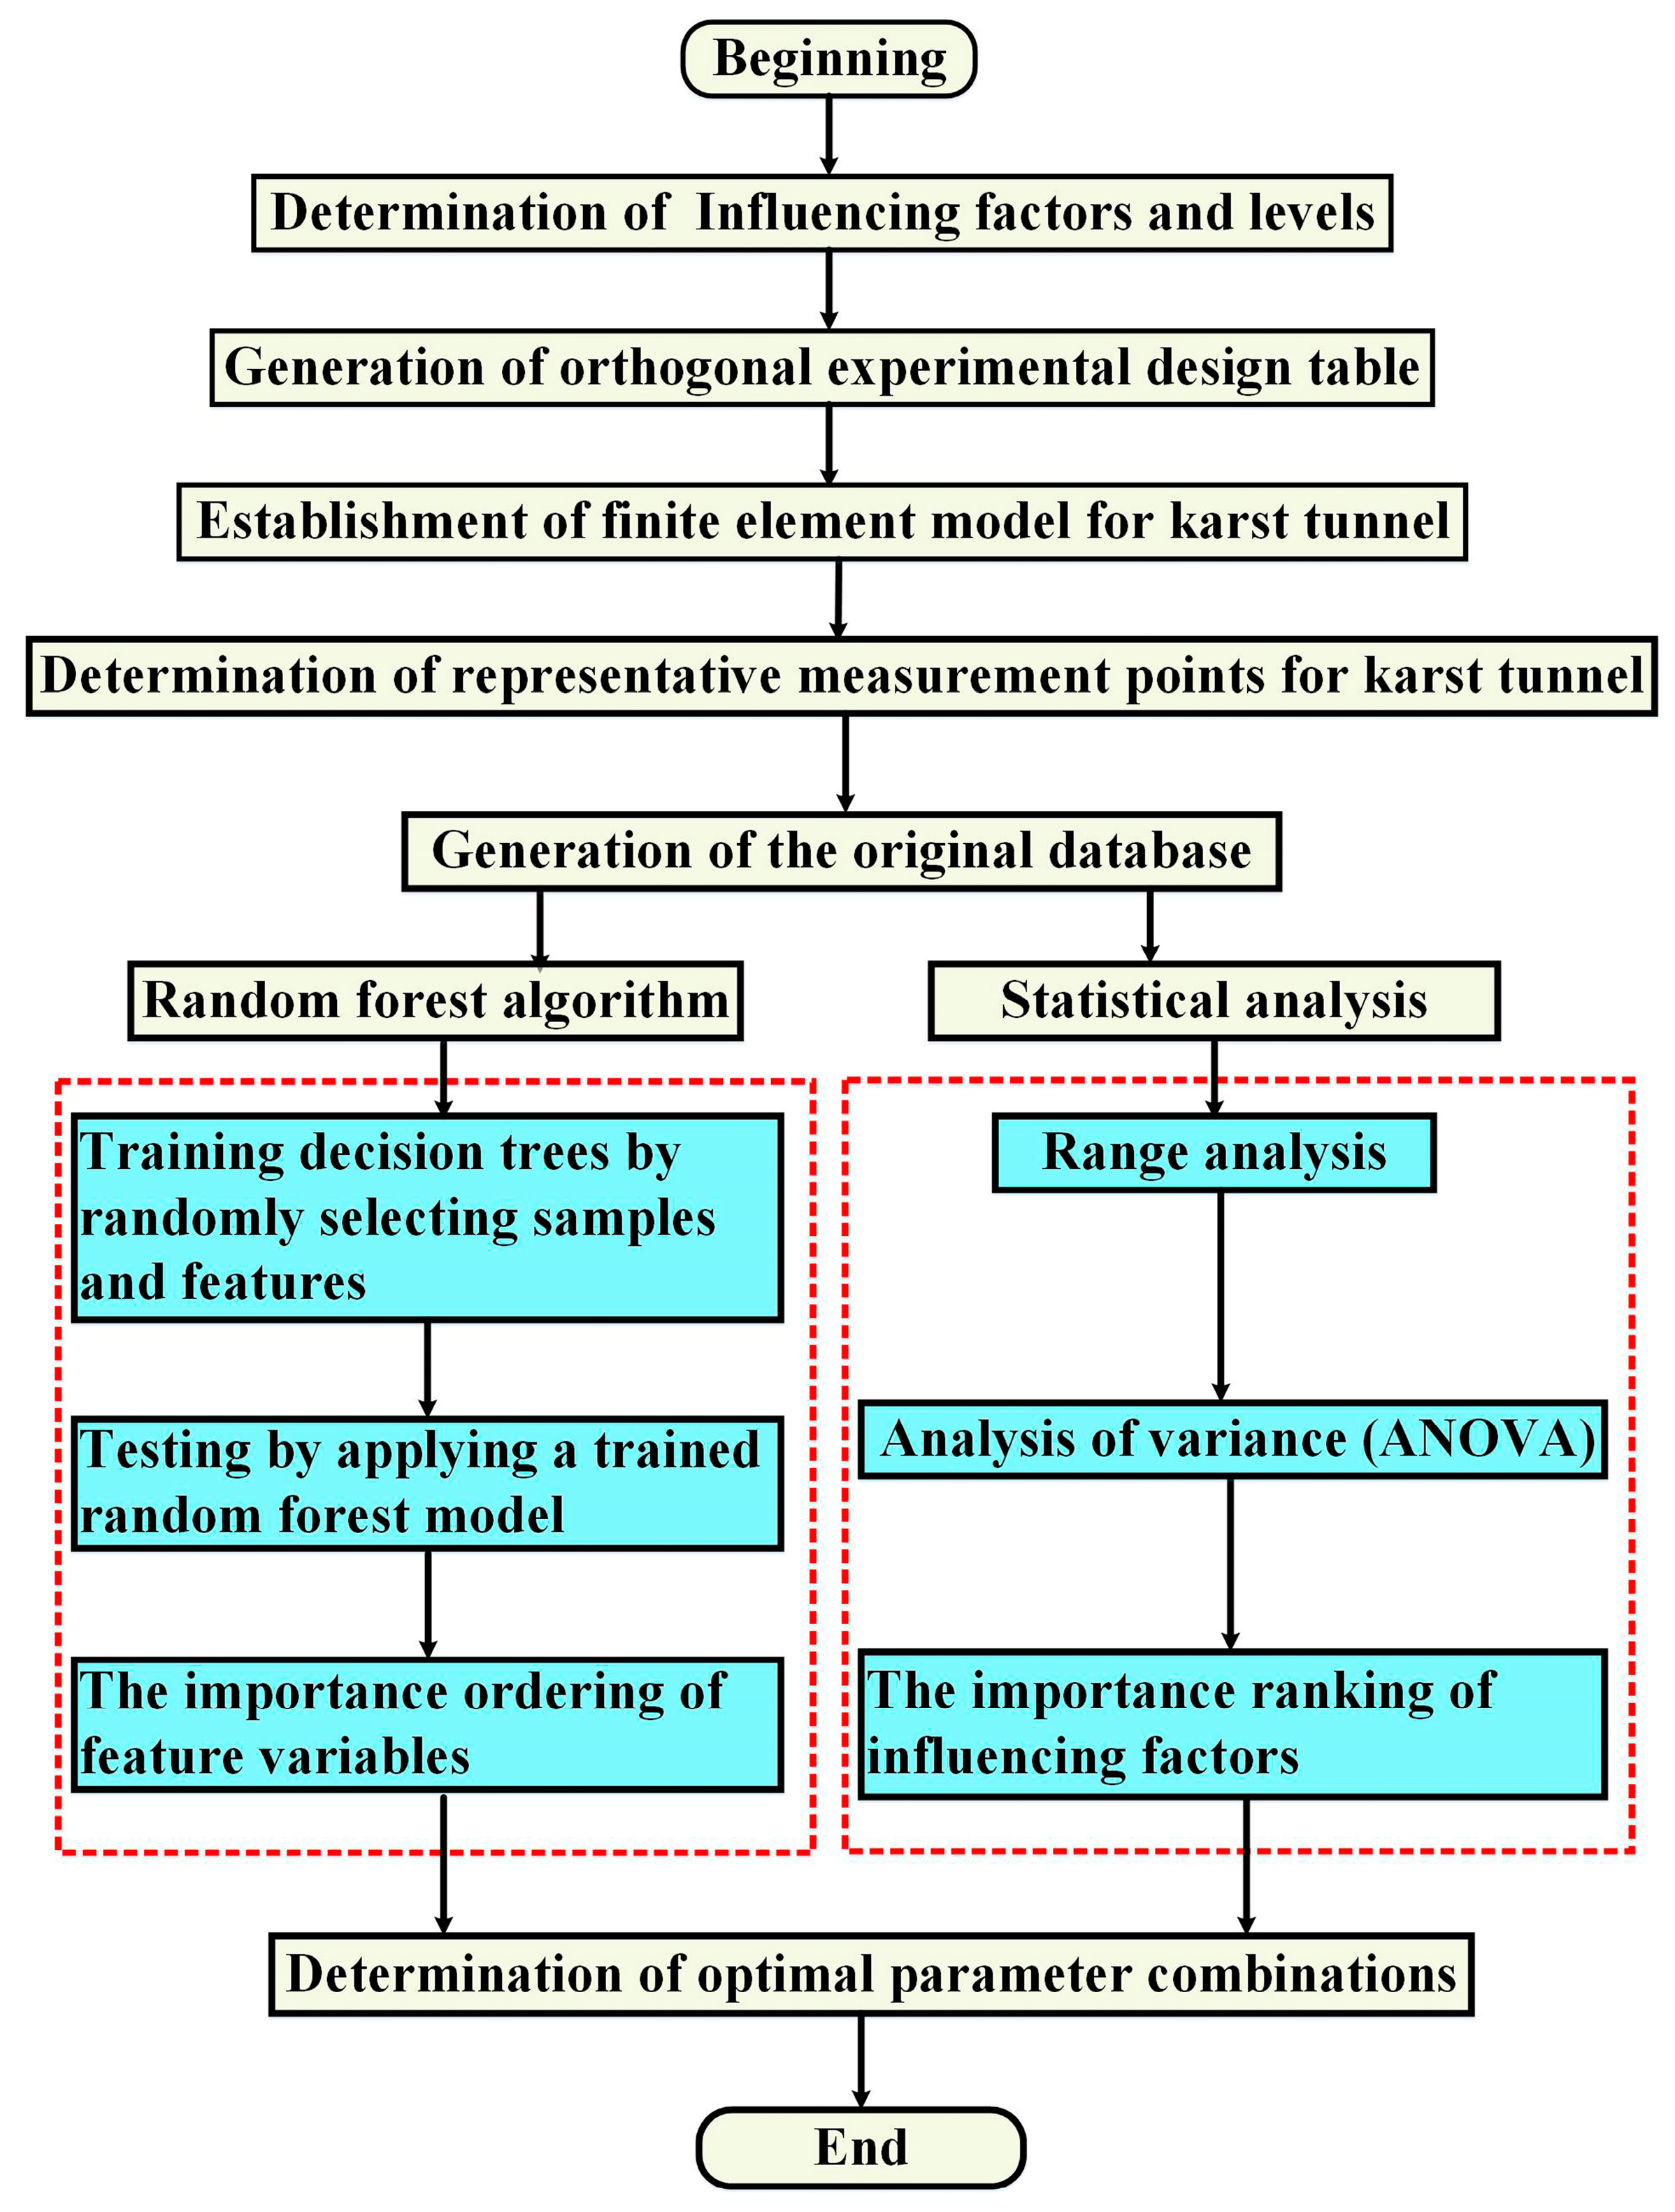
2. Acquisition of the Original Database

For the purpose of studying the magnitude of the contribution of different engineering parameters to the safe construction of tunnels in karst areas [26], eleven variables, including the elastic modulus, Poisson’s ratio, geotechnical weight, cohesion, internal friction angle, tunnel diameter, the diameter of the karst cave, the clear distance between the karst cave and tunnel, the location of the karst cave, tunnel burial depth, and excavation dimension, were considered. A table of 11-factor, 3-level orthogonal tests for karst tunnels was established. A three-dimensional finite-element model of 27 karst tunnels was established by taking into account the orthogonal test table. By adopting the vertical displacement, first principal stress, and principal stress difference as target variables, the most representative measurement points were determined to form the original database for a sensitivity analysis of the engineering parameters. The technology pathway is shown in Figure 1.

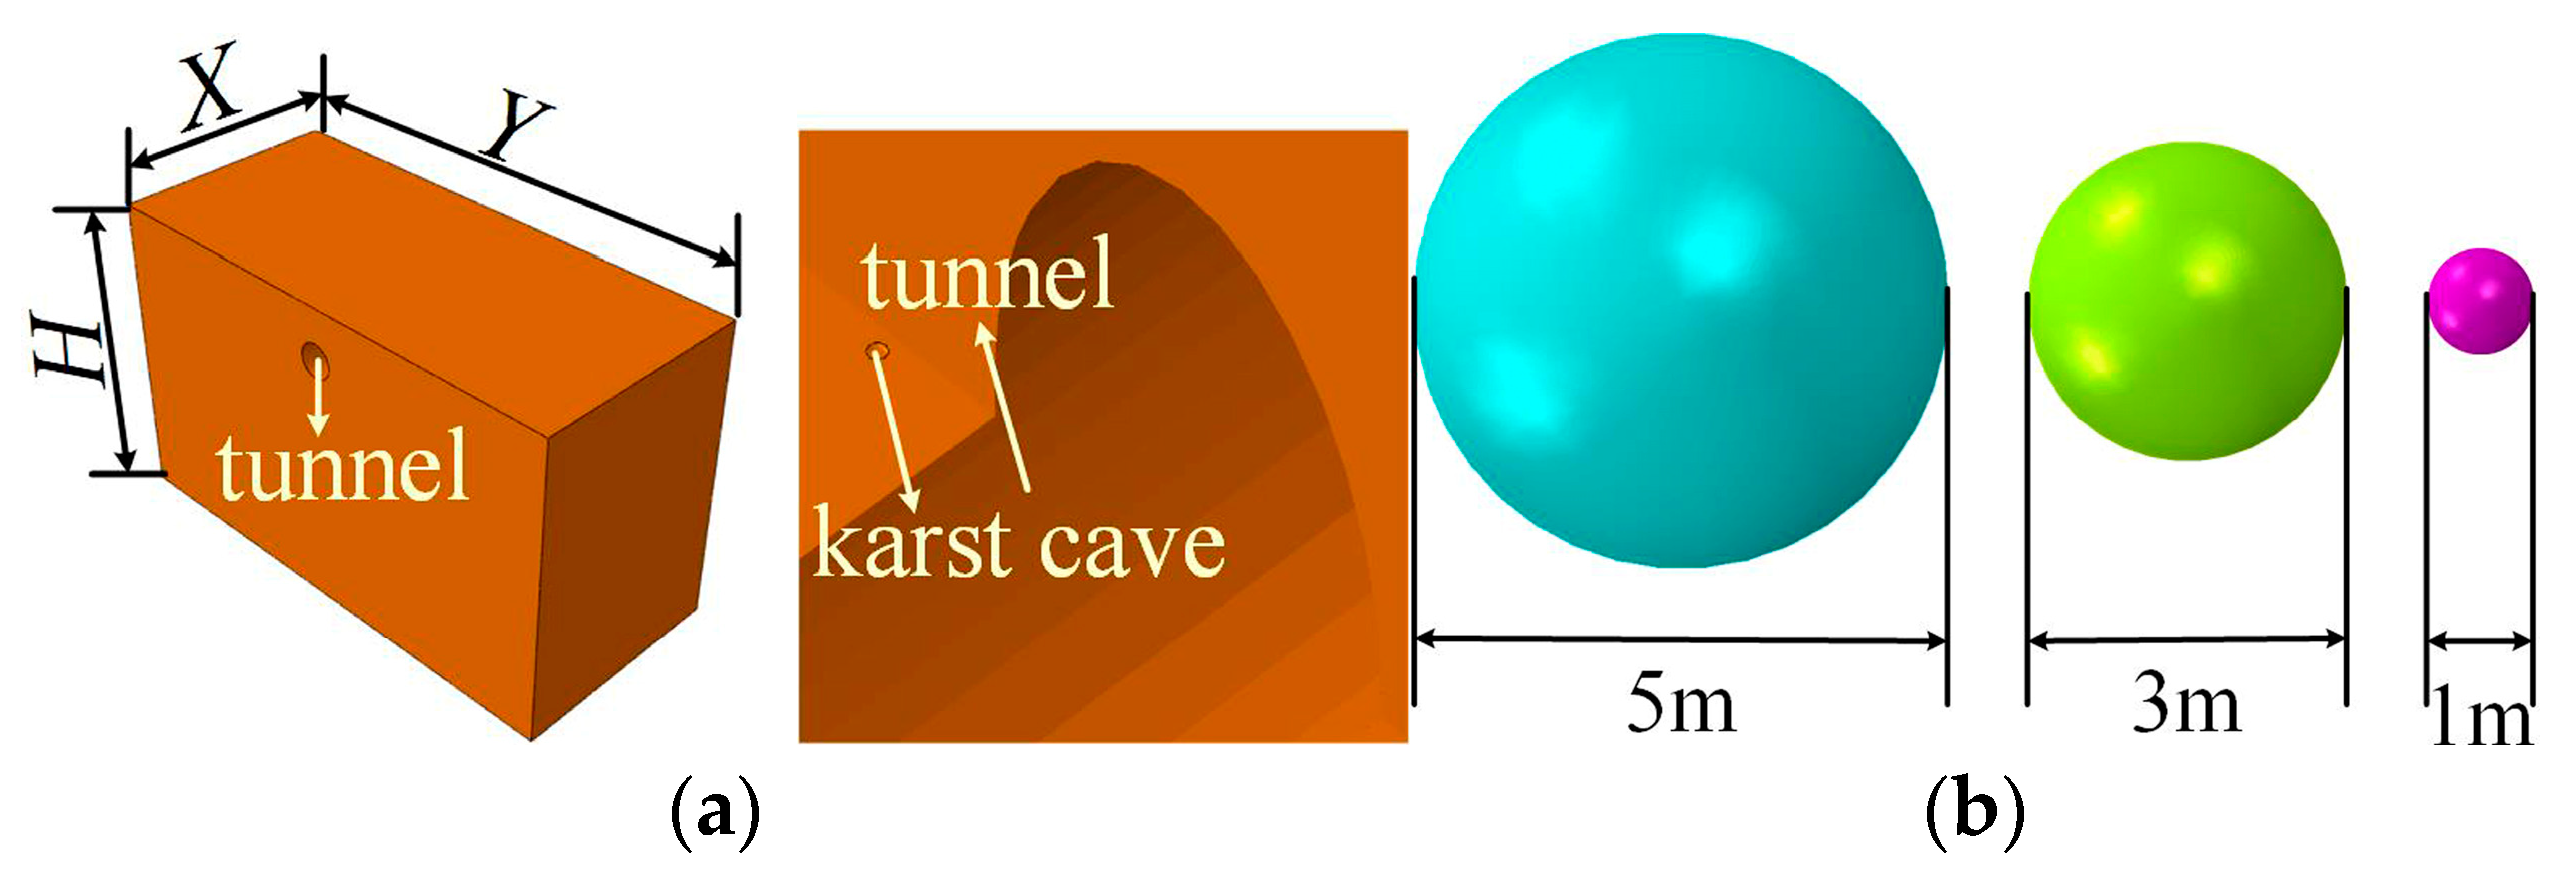
2.1. Influencing Factors and Levels

With regard to the 11-factor, 3-level test, if the effects of the different levels of each influencing factor on the safety of tunnelling in karst zones are taken into account, this would result in 311 sets of experiments based on the full factorial combination. Nevertheless, it would be extremely labour-intensive, material-intensive, and time-consuming. Therefore, the orthogonal experimental design method was employed to generate the L27(311) orthogonal table without taking into account the interactions between the variables. To facilitate the presentation, the eleven influencing variables are represented by a combination of letters and numbers, namely A1–A11, as shown in Table 1. The numbers of factors and corresponding levels adopted in this orthogonal test are shown in Table 2. The orthogonal test table is shown in Table 3.

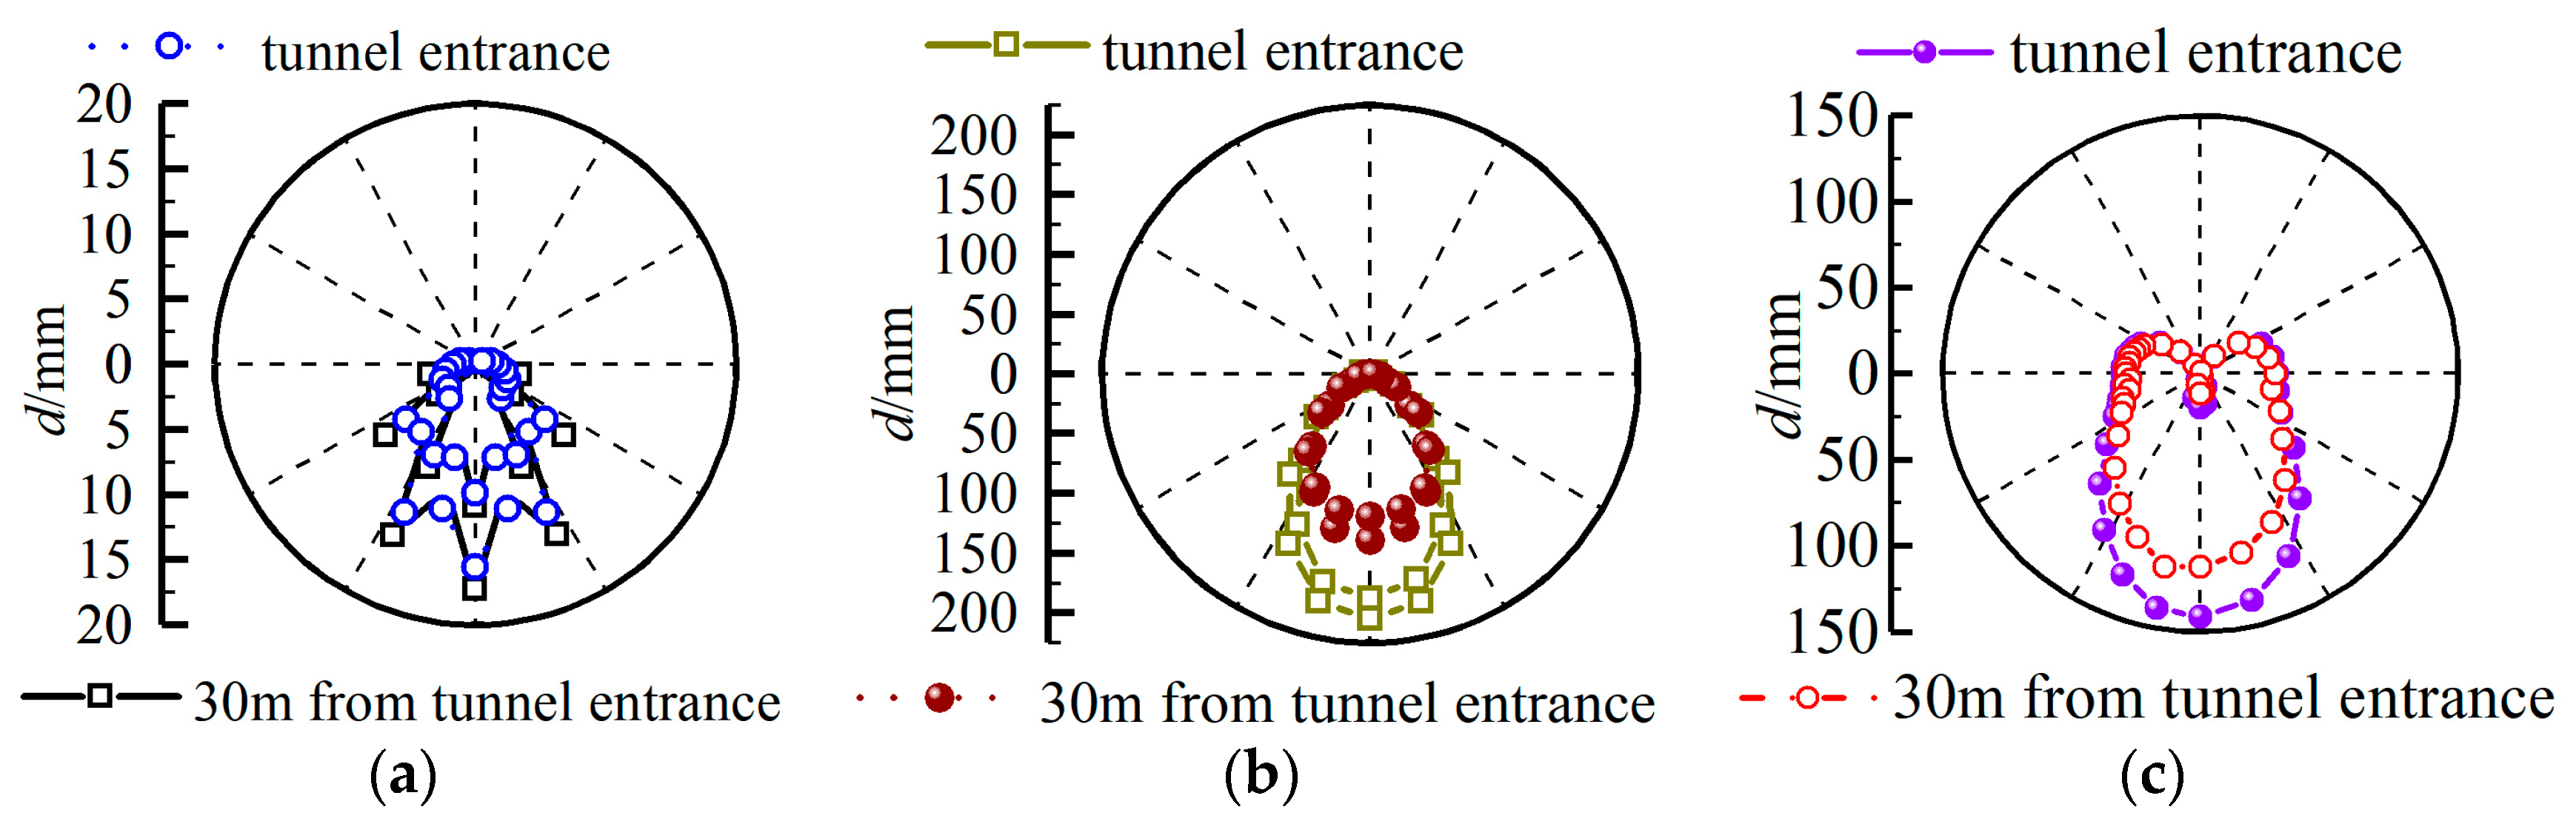
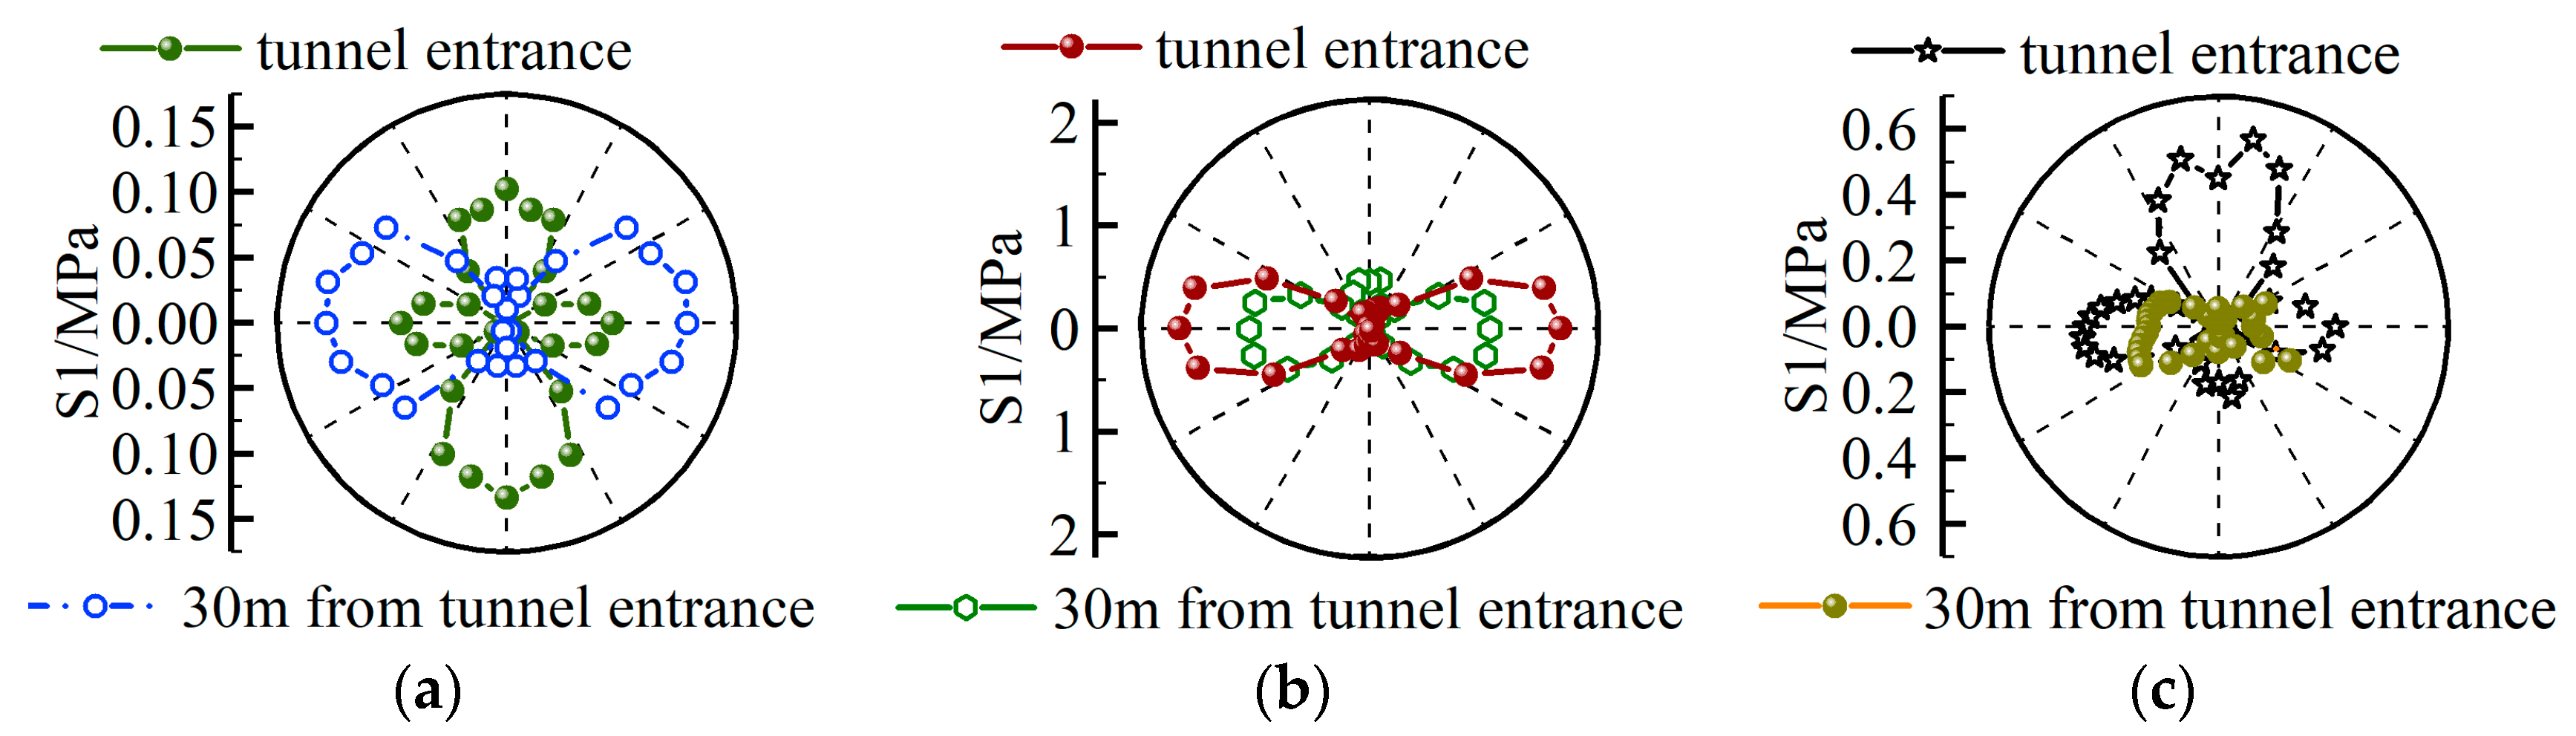
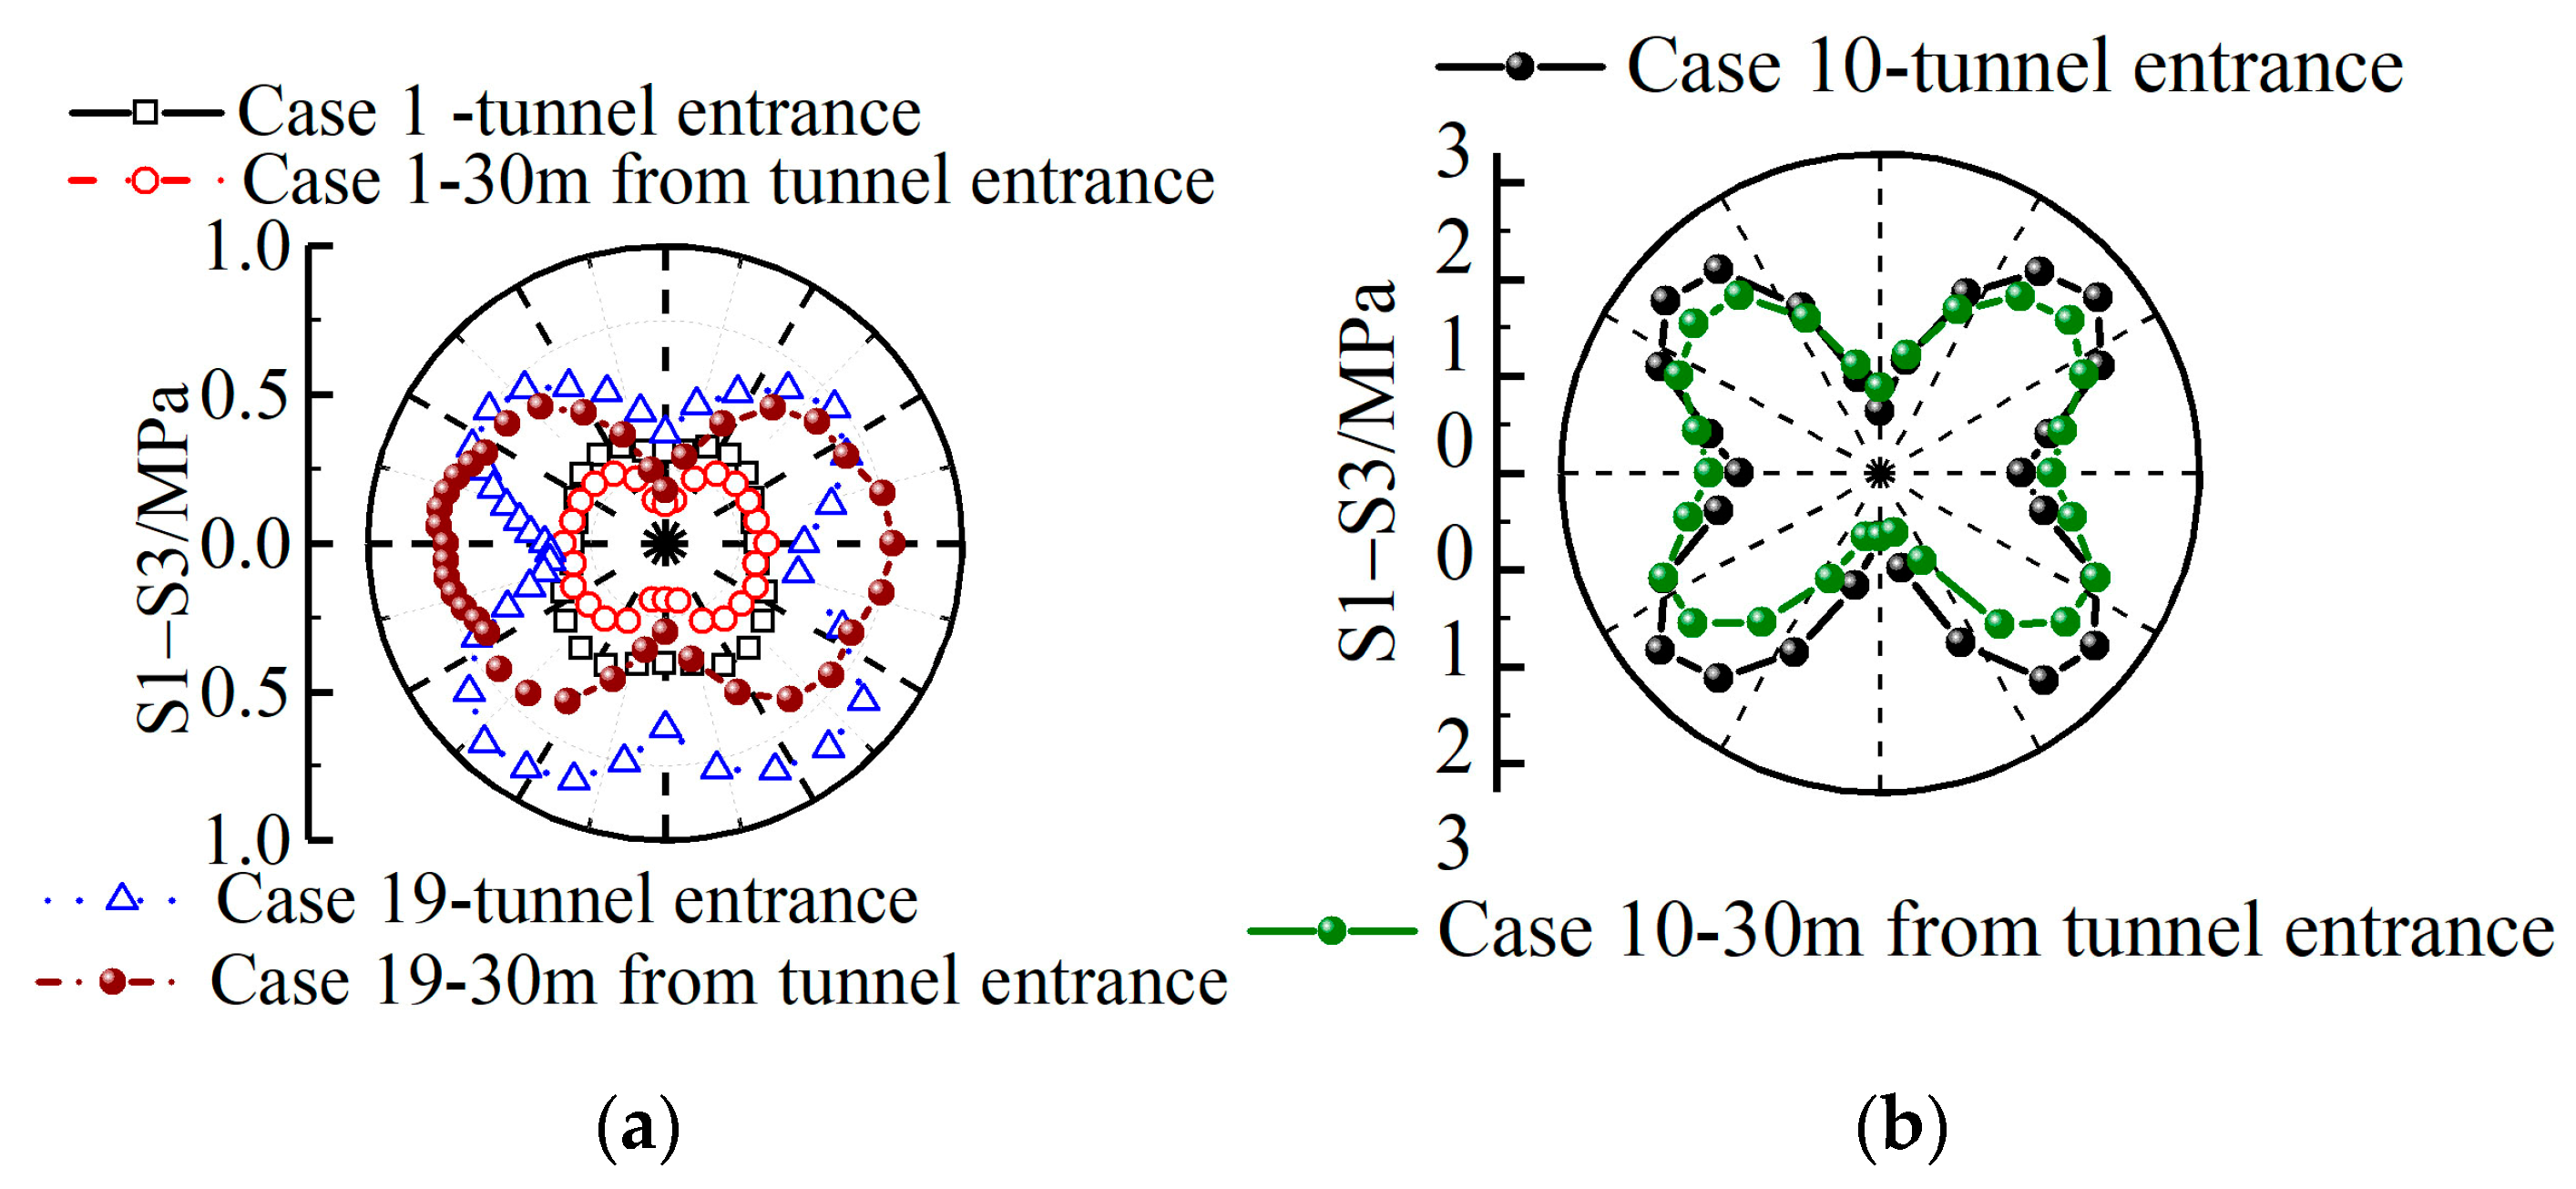
2.2. Designation of Representative Measurement Points

Figure 2a depicts the establishment of a three-dimensional finite element model of the tunnel in the karst areas, with the axial length of the tunnel model as X, the circumferential length of the tunnel model as Y, and the height of the tunnel model as H. In the numerical model established, the axial length of the tunnel is taken as 90 m and the vertical distance between the karst cave and the tunnel entrance is taken as 30 m. The upper boundary of the three-dimensional model of the numerical simulation of karst tunnel construction is the free surface. The three-dimensional displacement constraint should be imposed on the side boundary of the numerical simulation model of karst tunnel. The bottom boundary of the numerical simulation model of the karst tunnel should be subjected to the displacement constraints in three directions. The numerical simulation model of the karst tunnel could be established by ABAQUS general finite-element software, which is an engineering simulation software developed by Dassault Systèmes in France. The three-dimensional numerical simulation models of the karst tunnel were built by ABAQUS 2019 version of finite element software. In the process of karst tunnel excavation, whether the surrounding rock of the tunnel reaches the plastic state could be taken as the standard to determine the stability of the surrounding rock of the karst tunnel.
The three levels of karst cave size are 1 m, 3 m, and 5 m, as shown in Figure 2b.
For the selection of the most representative and general measuring points for tunnel construction in karst areas, the 1st working condition, the 10th working condition, and the 19th working condition in the orthogonal test design table are selected for the representative analysis of the measuring points.
As shown in Figure 3a–c, the vertical displacement at the tunnel entrance and at the vault and the arch bottom at 30 m from the tunnel entrance are more significant than in other parts of the tunnel under Case 1, Case 10, and Case 19. When taking the vertical displacement as a target variable, the measurement points could be chosen from the vault and the arch bottom at the tunnel entrance and the vault and the arch bottom at a distance of 30 m from the tunnel entrance.
According to the Mohr–Coulomb strength theory, the angle between the normal to the breaking surface and the first principal stress of a rock and soil mass is 45° + φ/2. At this slip surface, it could be considered that the first principal stress is the main cause of the slip of the rock and soil mass. According to the ultimate equilibrium condition, the first principal stress could be used to determine whether the rock and soil body has yielded or not. The consideration of the first principal stress as a target variable is of certain investigative worth.
On the basis of Figure 4a,c, the first principal stresses at the vault, arch bottom, and both sides of haunch of the tunnel entrance under Case 1 and Case 19 are significant. The first principal stresses in the both sides of haunch of the tunnel cross-section at 30 m from the tunnel entrance are more significant. In Figure 4b, the first principal stresses in both sides of the haunch of the tunnel are greater under Case 10. Stress concentration occurs in areas with higher values of the first principal stress, which enter the stress yielding phase earlier than other areas, and stress redistribution occurs. In summary, the location of the tunnel haunch at a distance of 30 m from the tunnel entrance was chosen as the measurement point.
According to Mohr–Coulomb strength theory, the Mohr–Coulomb criterion of rock failure is the maximum principal shear stress theory. The difference between the first principal stress and the third principal stress is twice the shear strength of that rock and soil mass. Consequently, the occurrence of the destruction of the tunnel surrounding rock could be determined by the difference in principal stresses in the complex stress state in which the tunnel is located. When the rock and soil body is in ultimate equilibrium, the relationship between the first principal stress and the third principal stress is
sin φ = ( S 1 S 3 ) / 2 c cot φ + ( S 1 + S 3 ) / 2 = ( S 1 S 3 ) S 1 + S 3 + 2 c cot φ
The meaning of each symbol in the expression is as follows: S1—the first principal stress, S3—the third principal stress, c—cohesion of rock and soil masses, φ —internal friction angle.
As illustrated in Figure 5, by comparing the magnitude of the principal stress difference at each measurement point of the tunnel cross-section at the tunnel entrance and 30 m from the tunnel entrance for Case 1, Case 10, and Case 19, the measurement point that best describes the stress state of the tunnel was selected. In Figure 5a, the principal stress difference curves in the cross-section at the tunnel entrance and 30 m from the tunnel entrance for Case 1 and the cross-section at 30 m from the tunnel entrance for Case 19 were shown as “fan-shaped” closed curves. The principal stress difference at the tunnel haunch is larger than at the other measurement points, which is more susceptible to shear damage, and is therefore more appropriately adopted as a representative measurement point for evaluating the stability of the tunnel surrounding rocks. The principal stress difference in the cross-section at the tunnel entrance in Case 1 and Case 19 and in the cross-section at 30 m from the tunnel entrance in Case 10 reveal a “butterfly shaped” closed curve, as shown in Figure 5. At that moment, the principal stress difference on both sides of the tunnel shoulder and both sides of the tunnel arch footing is greater than the measured value of other measurement points. Therefore, it is more appropriate to designate one of the four points as the measurement point for both sides of the tunnel shoulder and both sides of the tunnel arch footing.
To sum up, different measurement points should be selected for different target variables in order to effectively reflect the degree of stability of the tunnel surrounding rock and the support of the tunnel. For more effective exploration of the degree of sensitivity of the above 11 influencing factors on the stability of tunnel construction in karst areas, the measurement points in the area closer to the location of the karst cave could better represent the influence of the parameters related to the karst cave on the stability of the tunnel surrounding rock, and also represent the influence of the engineering physical parameters and the engineering structural parameters on the construction damage mechanism of the tunnel surrounding rock. As a result, the measurement point with the larger value of the target variable in the cross-section of 30 m from the tunnel entrance was selected as the representative measurement point. The extracted measurement point values of the target variables are shown in Table 3.

3. Sensitivity Analysis of Influencing Factors
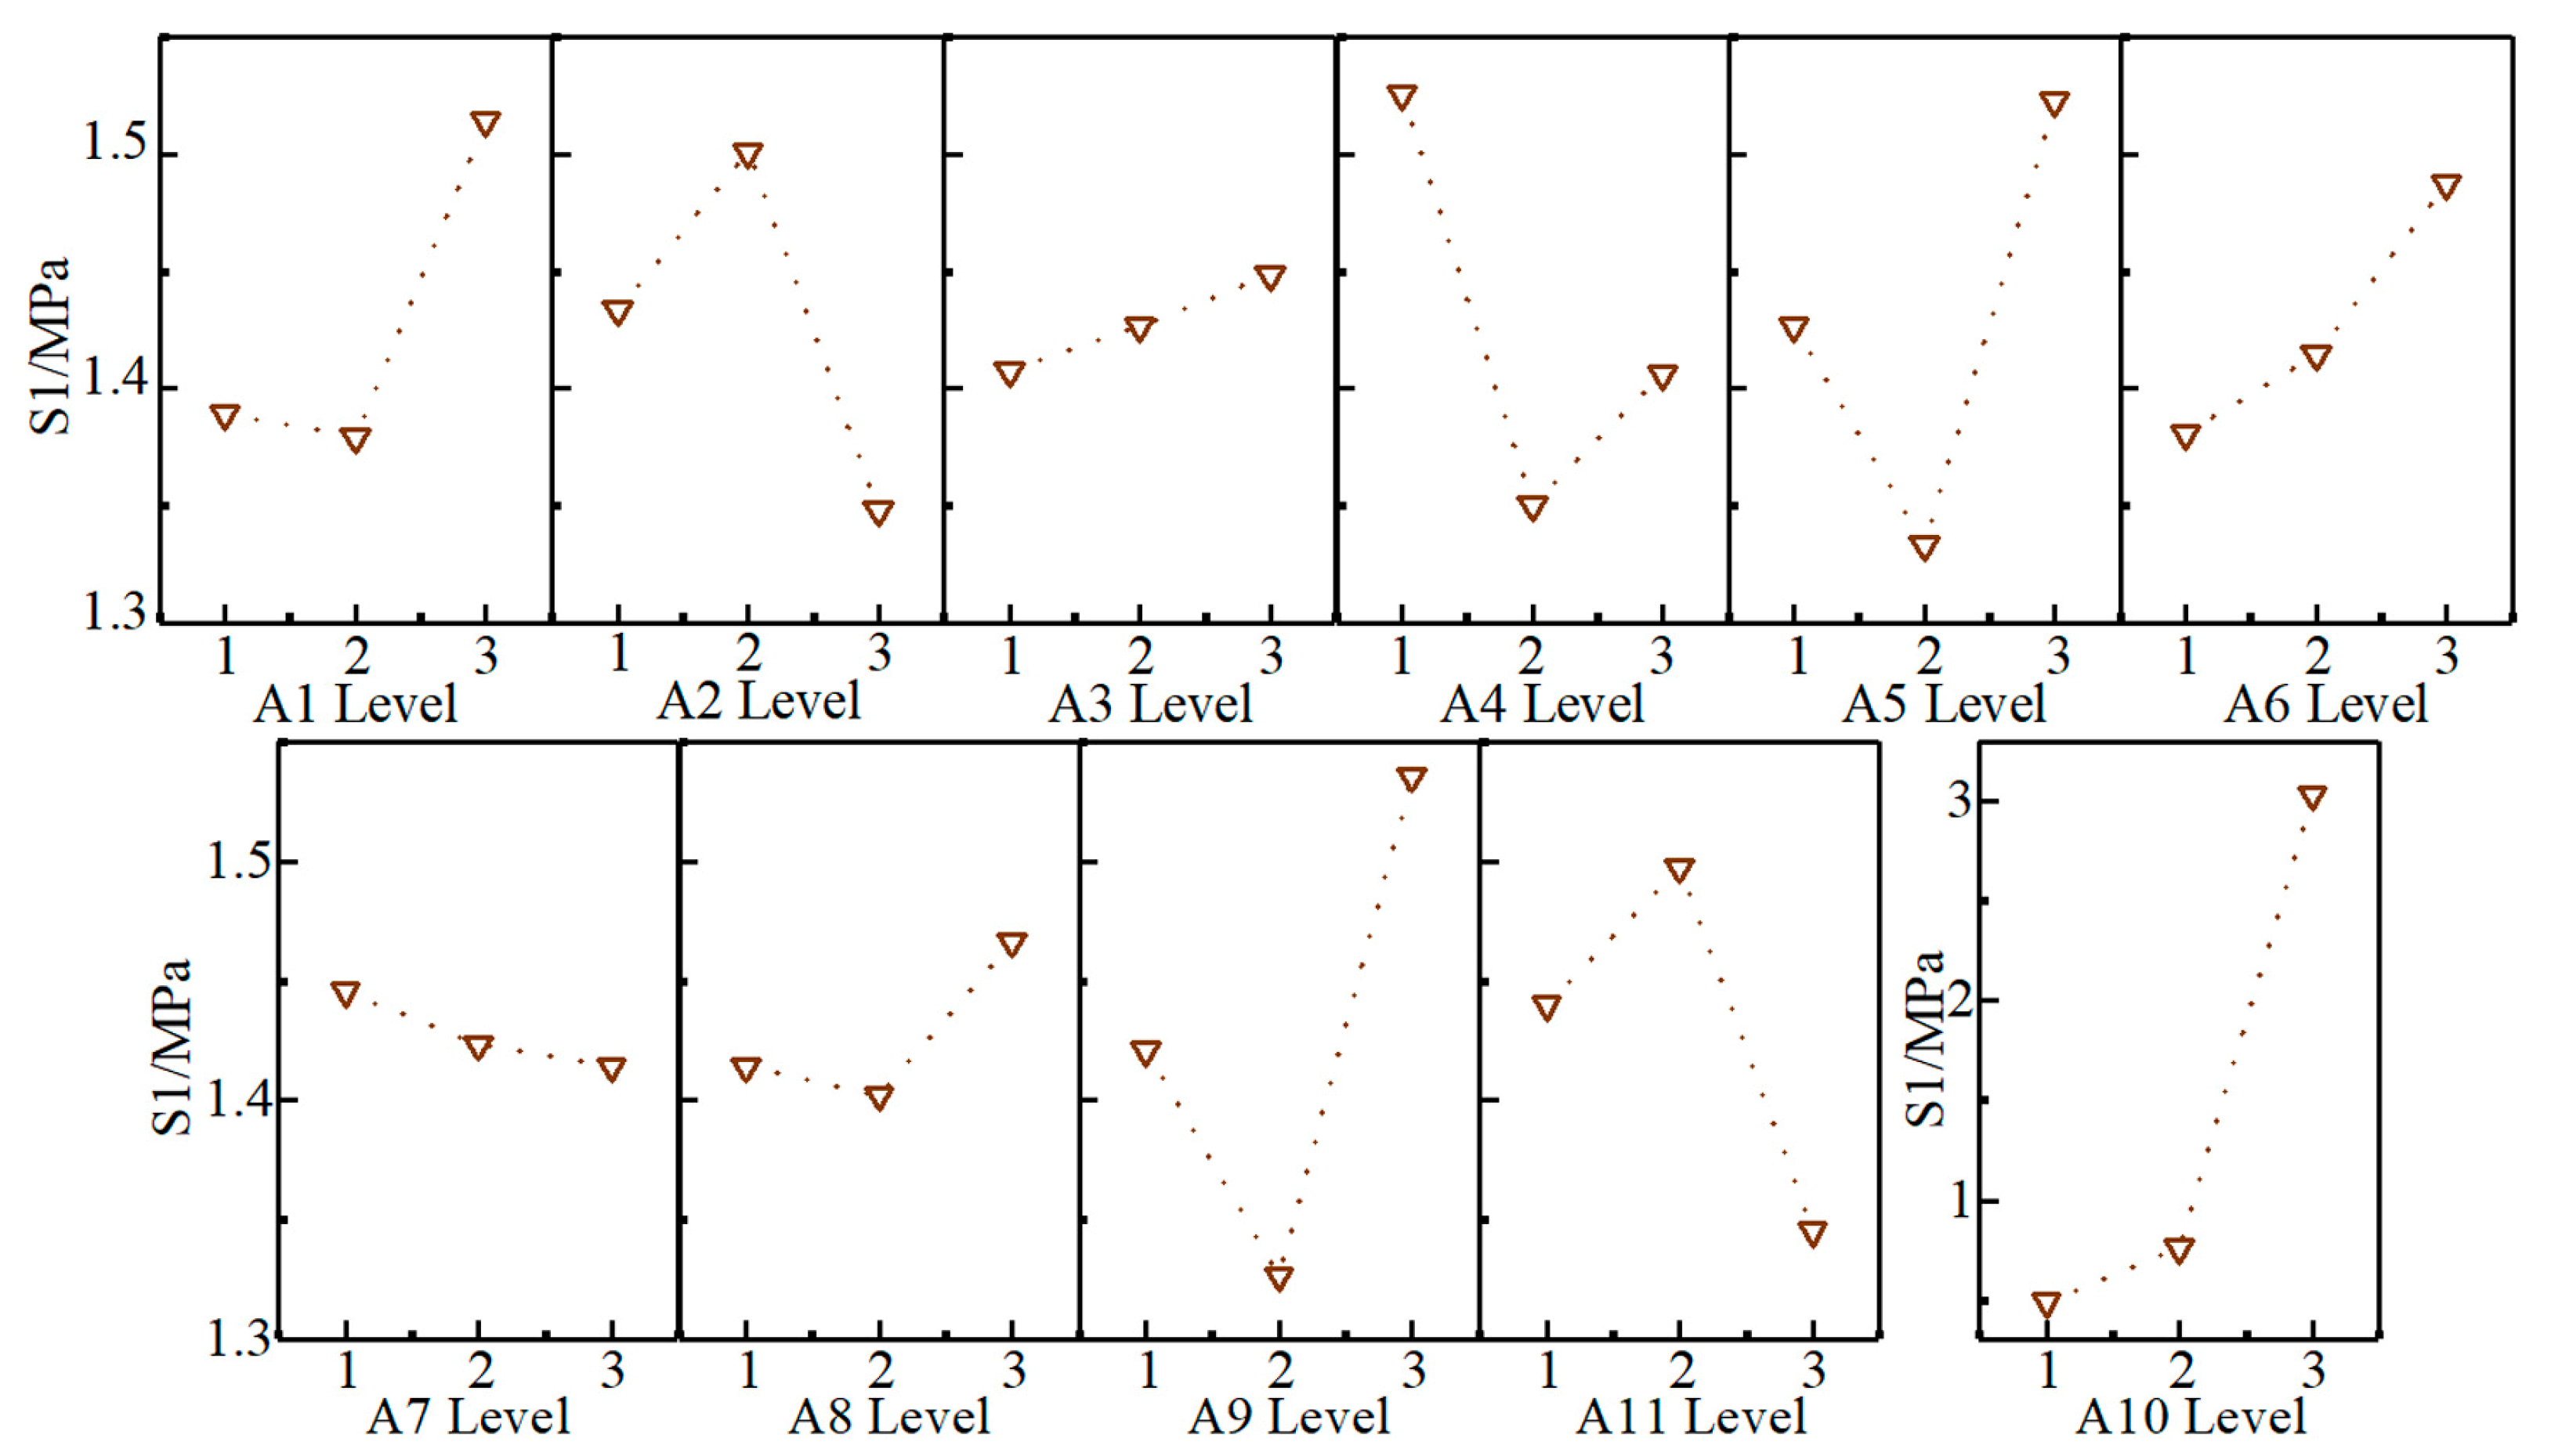
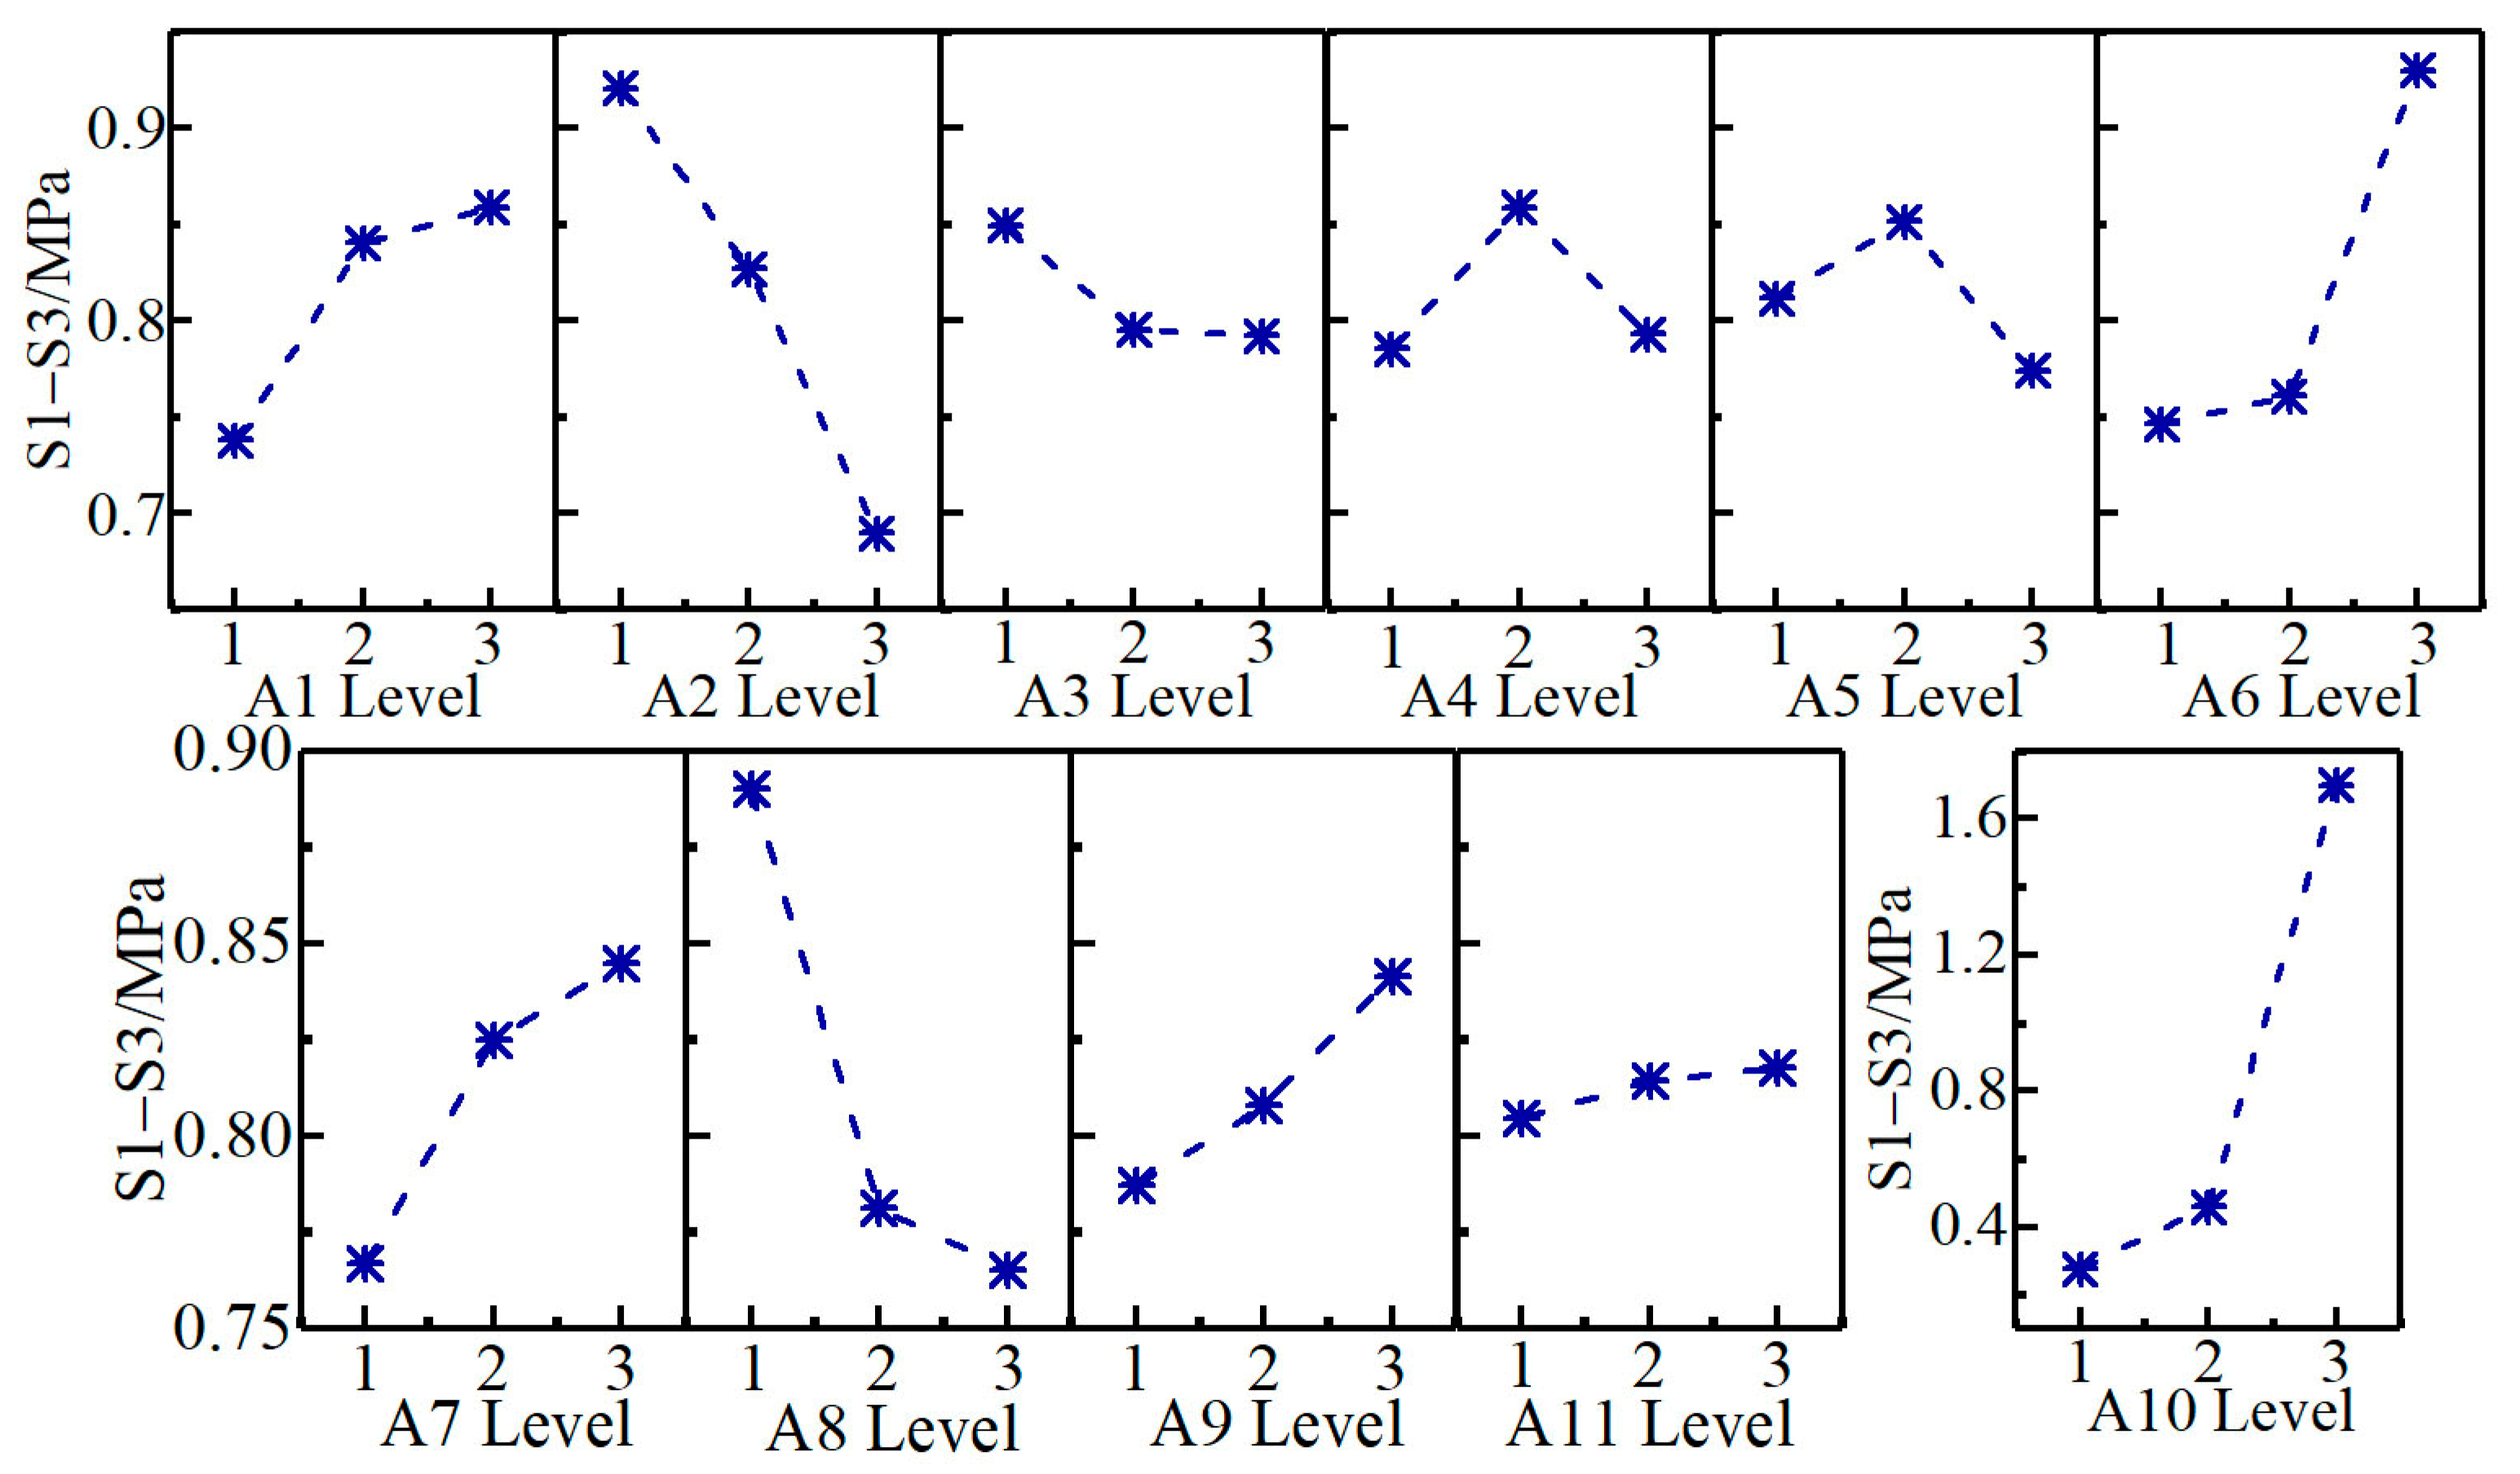
3.1. Range Analysis

Firstly, the sensitivity analysis of the influencing factors of karst tunnel construction should be carried out by applying the traditional sensitivity analysis method of influencing parameters. One of the traditional sensitivity analysis methods of influencing factors is the orthogonal test design-range analysis method. The range analysis method is an intuitive method of analysis, which could be carried out to determine the main factors affecting the index through the range value of the factors, and could also be screened to determine the optimal level of a certain influencing factor, and eventually ultimately achieve the optimal combination. The greater the range value of each influencing factor, the greater the effect of the assignment between the levels of that independent variable on the dependent variable of the orthogonal test. According to the numerical simulation operation of each working condition in the orthogonal test design table, the mean value trend graph of the factor level of the vertical displacement is shown in Figure 6. On the basis of the range analysis, the sensitivity degree of each engineering parameter of the construction safety of tunnels in karst areas with respect to the results of the test collected with the vertical displacement as the target variable is ranked from high to low as shown in Expression (2).
A 6 > A 10 > A 1 > A 2 > A 9 > A 7 > A 8 > A 5 > A 3 > A 4 > A 11
The sensitivity degree of each engineering parameter towards the test results collected with the first principal stress as the target variable in descending order is shown in Expression (3). The mean value trend plot of the factor level of the first principal stress is shown in Figure 7.
A 10 > A 9 > A 5 > A 4 > A 2 > A 11 > A 1 > A 6 > A 8 > A 3 > A 7
According to Mohr–Coulomb strength theory, the difference between the first principal stress and the third principal stress is twice the shear strength of that rock and soil mass.
The degree of sensitivity of each engineering parameter with respect to the test results collected with the principal stress difference as the target variable, in descending order, is shown in Expression (4). The mean value trend figure for the factor level of the principal stress difference is shown in Figure 8. The sensitivity degree of each influencing factor is illustrated in Table 4.
A 10 > A 2 > A 6 > A 8 > A 1 > A 7 > A 5 > A 4 > A 3 > A 9 > A 11
The meaning of each symbol in the figures is as follows: d—vertical displacement, S1—the first principal stress, S3—the third principal stress.

3.2. Analysis of Variance (ANOVA)

The analysis of variance (ANOVA) method involves analysing the sources of error in the data and thereby determining whether the means of the different aggregates are equal or not, and ultimately analysing whether or not the respective variables have a significant effect on the response variable. The p-value method of hypothesis testing is adopted to measure the statistical significance of the results observed through range analysis method, and the F-test method is applied to determine whether the difference between two or more sample variances is significant, thus measuring the difference between the sample data and inferring the significance of the overall parameter.
When F > F α ( r 1 , n r ) , it is considered that there is a significant difference in the calculation of this impact factor. The significance level is usually taken as 0.05. With reference to the F-test table, it can be concluded that:
F α ( r 1 , n r ) = F 0.05 ( 2 , 24 ) = 3.40
The meaning of each symbol in the expression is as follows: α —significance level, r—factor level, n—total number of samples achieved in independent trials.
As illustrated in Table 5, significance tests were carried out for each of the influencing factors through an analysis of variance (ANOVA). After statistical analysis of the collected original data with vertical displacement as the target variable, among the calculated F-value and p-value of each influencing factor, the F-value of the influencing factor A6 (tunnel diameter) is 9.53 with a p-value of 0.001, and the F-value of A10 (tunnel buried depth) is 3.50 with a p-value of 0.046. This indicates that the results observed by the influencing factors A6 (tunnel diameter) and A10 (tunnel buried depth) may be statistically significant due to accidental factors. The F-values of the other nine influences were less than the corresponding critical values at a significance level of 0.05, and the p-values were greater than the significance level of 0.05. The F-values of the other nine influencing factors were less than the corresponding critical values at a significance level of 0.05, and the p-values were greater than the significance level of 0.05. Considering the first principal stress S1 as the target variable, among the calculated F-values and p-values of the influencing factors, only the influencing factor A10 (tunnel buried depth) has an F-value of 452.50 and a p-value of 0.00. The F-values and p-values of the other 10 influencing factors were smaller than the corresponding critical values at a significance level of 0.05. It illustrates that the results resulting from the influence factor A10 (tunnel buried depth) are statistically significant. Adopting the principal stress difference S1–S3 as the target variable, from the calculated F-value and p-value of each influencing factor, the F-value of influencing factor A10 (tunnel buried depth) is 161.58 and the p-value is 0.00. The F-values and p-values of the remaining 10 influencing factors were less than the corresponding critical values at a significance level of 0.05. The results observed for the influencing factor A10 (tunnel buried depth) are also statistically significant in this situation.

3.3. Random Forest Model

The random forest is essentially an ensemble-learning based on decision trees, consisting of multiple decision trees formed by random sampling and the random selection of attributes, without any pruning action in the project of constructing decision trees. The algorithm solves quite adequately the overfitting problem that emerges from a single decision tree, and additionally tackles large-scale datasets with excellent fault tolerance for noisy and missing data. The random forest algorithm has a high prediction accuracy and robustness. The random forest model is employed to classify the importance of the variables related to karst tunnels in the following steps. The operational flow chart of the random forest model based on orthogonal experimental design is shown in Figure 9.
(1)
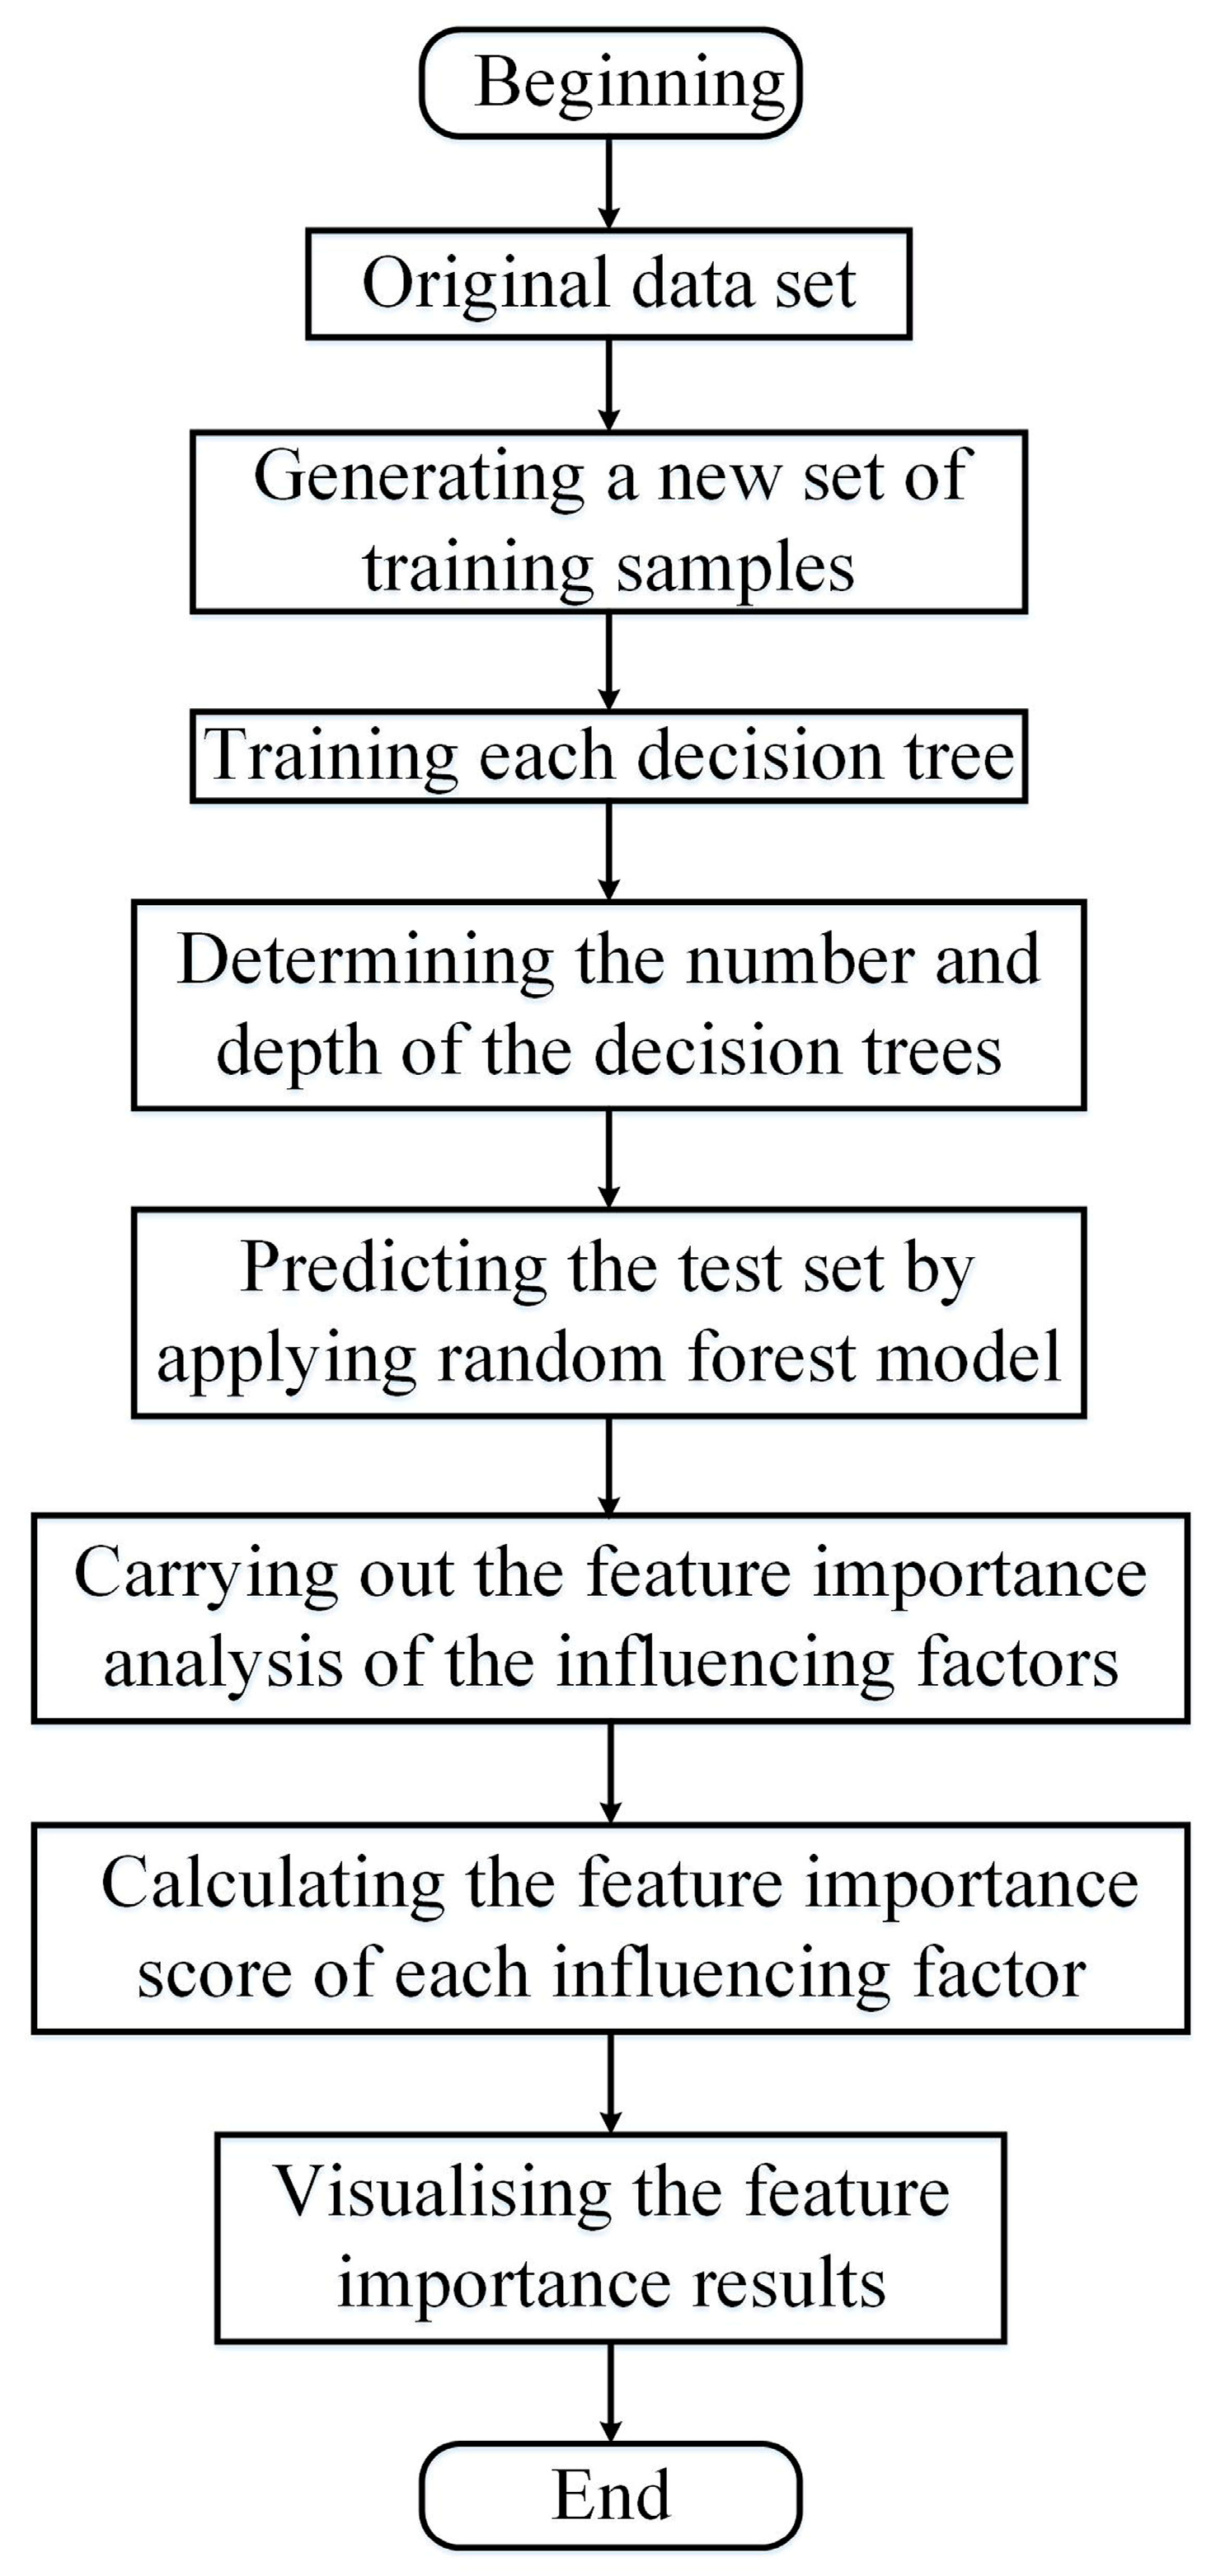
The original training set should be obtained. Initially, a bootstrap resampling technique is applied to generate a new set of training samples by randomly sampling various samples from the original training sample set in a relaxed manner;
(2)
The training sets and test sets should be divided from the original sample set following the appropriate ratio, and the root nodes and leaf nodes should be trained to determine the number of decision trees, the depth of decision trees, and the number of features to be applied to train the leaf nodes of each decision tree;
(3)
The trained random forest model should be adopted to predict the test set. The prediction accuracy should be adjusted until it fulfils the requirements of prediction accuracy. The variables of the trained random forest model should be subjected to feature importance analysis, the feature importance score of each influencing factor should be calculated, and the feature importance results should be visualised.

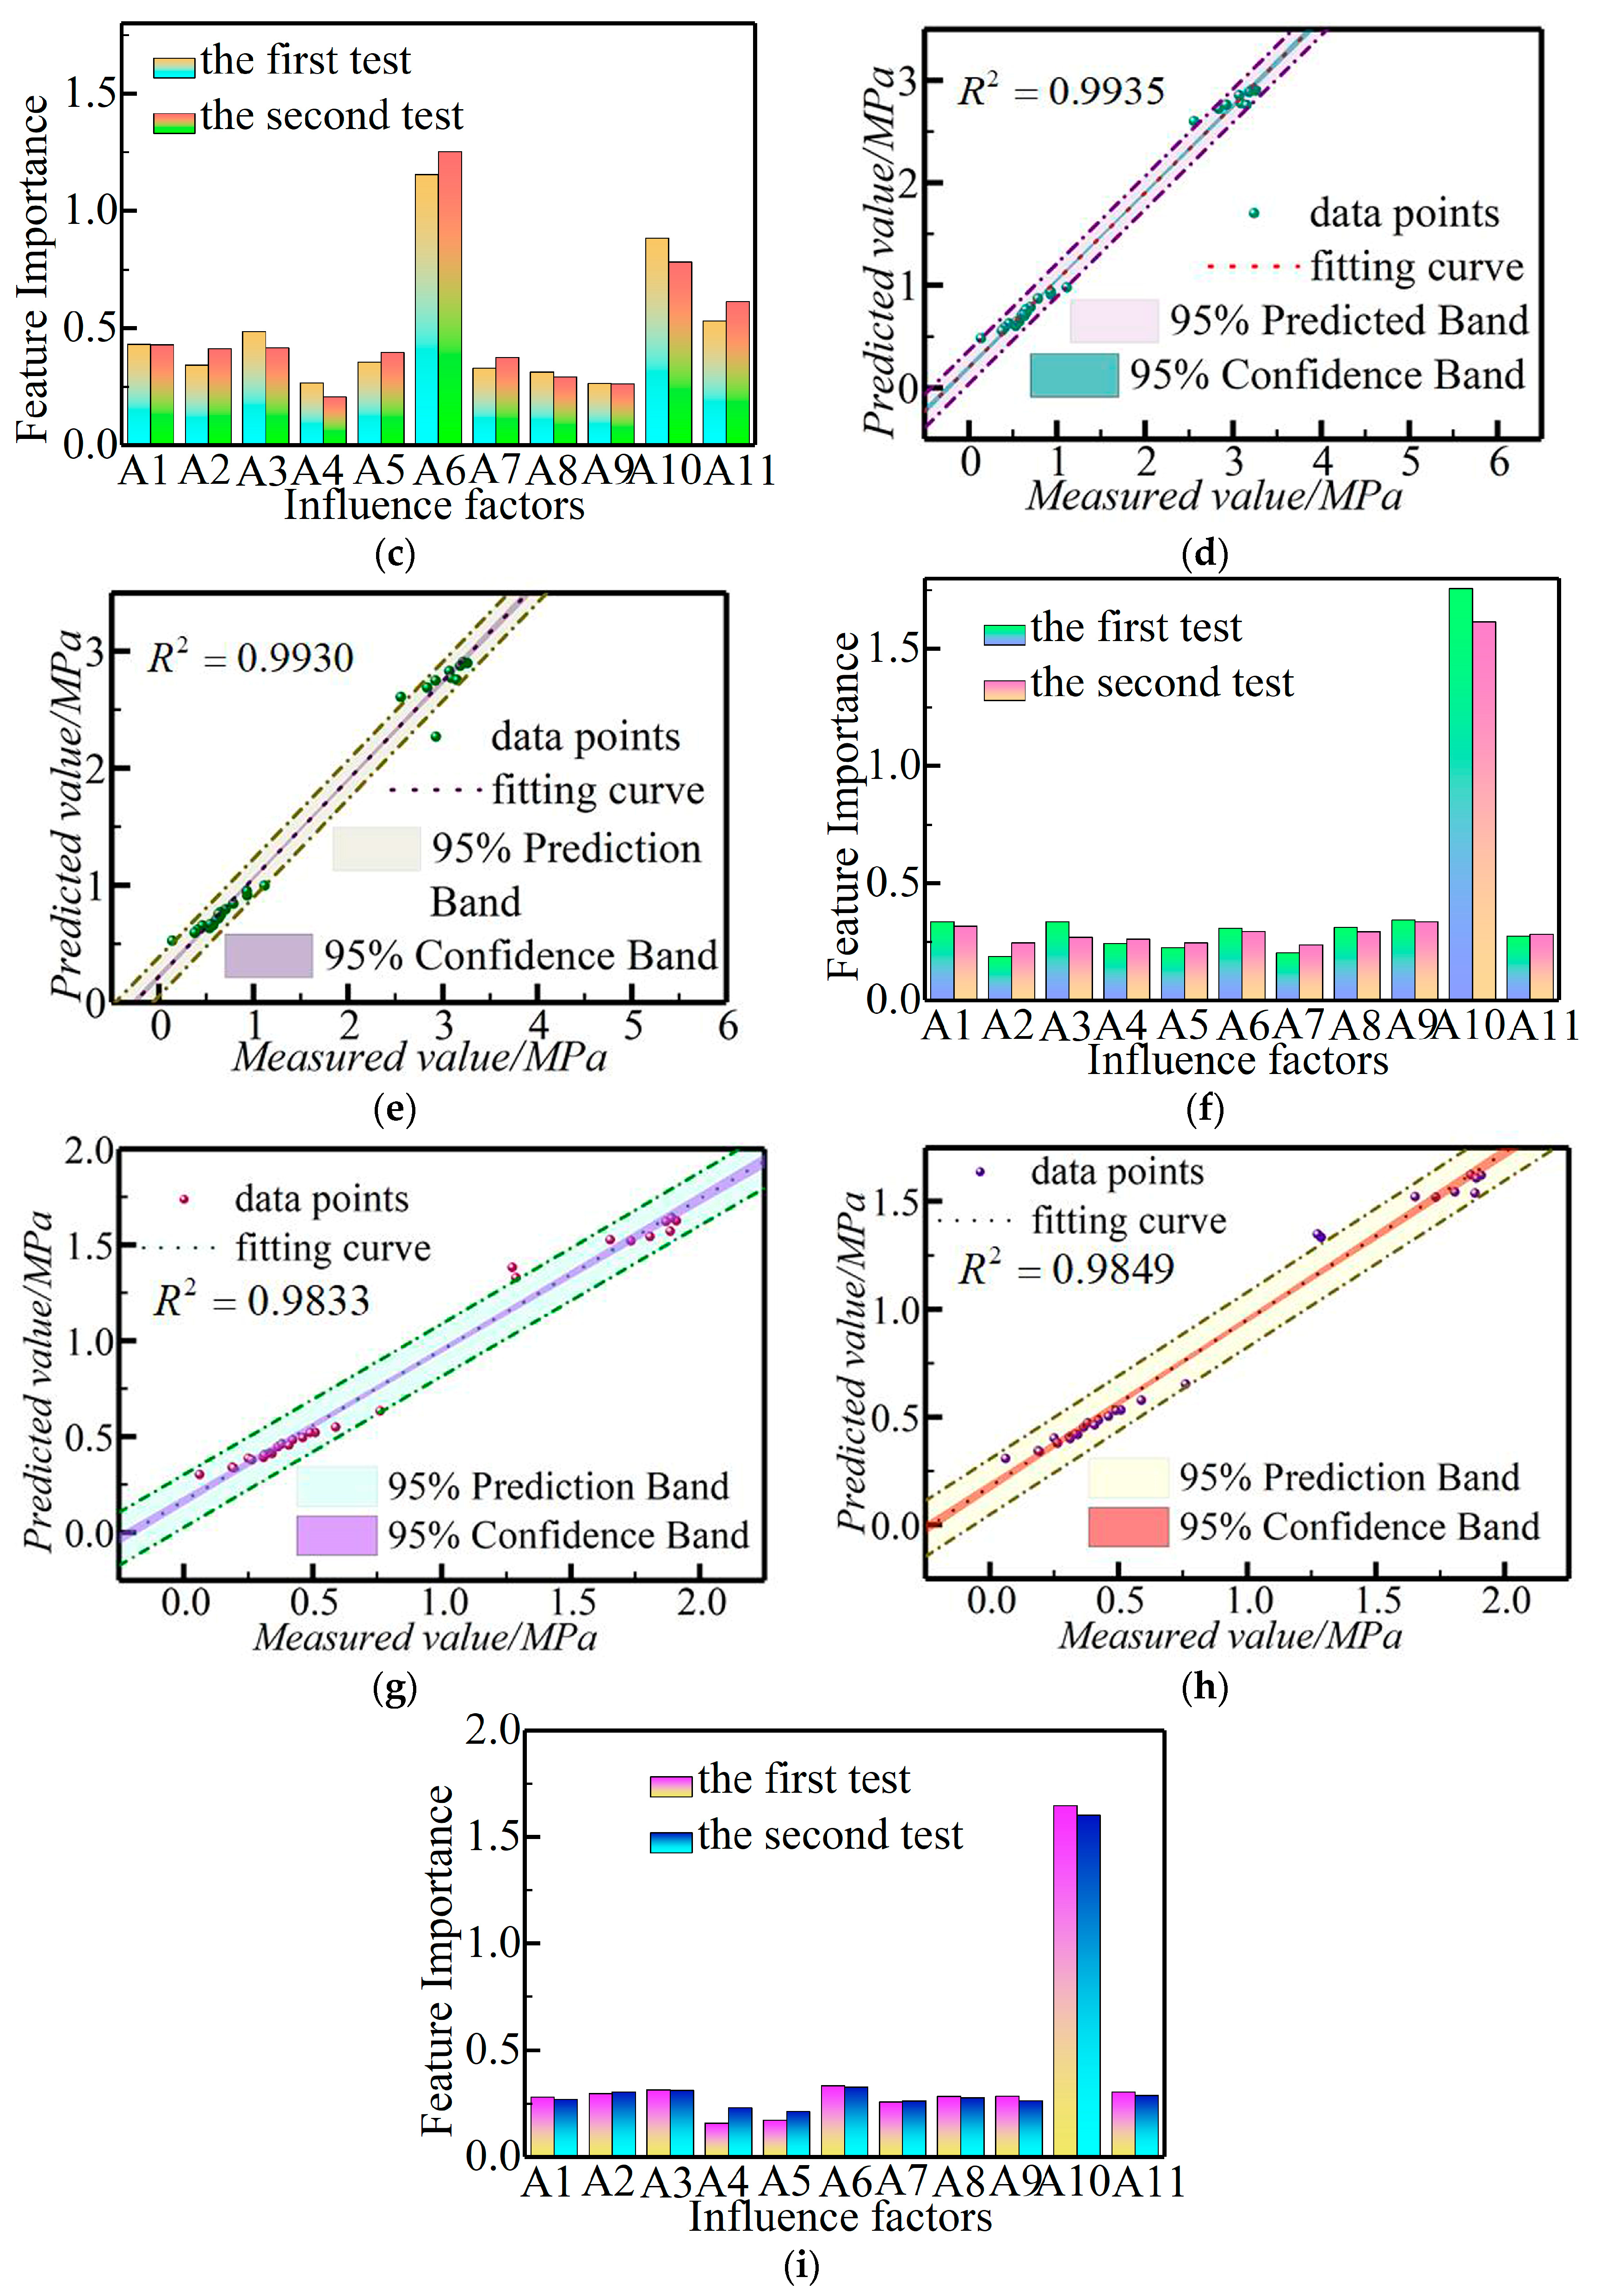
3.4. Feature Importance Ranking

To measure the contribution of each input variable to the training and testing results of the random forest model, the random forest algorithm was applied to rank the characteristic importance of factors affecting the stability of the rock and soil masses around the tunnel and the karst cave. However, by applying the orthogonal experimental design and random forest algorithm, variable significance analyses were performed by calculating the reduction in prediction error for out-of-bag samples. The feature importance measurement is the average of the difference between the original prediction error and the prediction error on out-of-bag samples by randomly upsetting a certain eigenvalue. The data collected with vertical displacement as the target variable could be the original dataset, and the accuracy results of the random forest model test set are shown in Figure 10a,b. In the first test of the trained random forest model, the scatters are 93.75% within the 95% prediction interval. In the second test result, 94.90% of the scatter points are located within the 95% prediction interval, which demonstrates that the combination of the orthogonal experimental design method and the random forest model has a high prediction accuracy, and the fitting effect of the model could achieve the arithmetic requirements.
Nevertheless, owing to the randomness of sampling and the randomness of selecting attributes of the random forest algorithm, there are a certain amount of differences in the feature importance results and the sensitivity ranking of each influencing factor obtained from each calculation. Upon this basis, the most representative calculations were selected for sensitivity analyses employing a multiple-operation approach. It is shown in Figure 10c that these 11 influences are classified into three categories of importance parameters in terms of the degree of characteristic importance, with the first category having the highest sensitivity, the second the secondary, and the third the lowest. With vertical displacement as the response variable, the results of the two tests indicated that the first type of parameters included A6 (tunnel diameter), A10 (tunnel buried depth), and A11 (excavation dimension); and the third type of parameters included A8 (clear distance between the tunnel and the karst cave), A4 (cohesion), and A9 (location of the karst cave).
As shown in Figure 10d,e, the scatters in the first test of the random forest model are located in 99.35% of the 95% prediction intervals, considering the first principal stress as the target variable. The scatters in the second test are located within the 95% prediction interval 99.30% of the time. The method also maintains a high prediction accuracy at this time. As shown in Figure 10f, in the results of the first test, the parameters of the first category were A10 (tunnel buried depth), A9 (location of the karst cave), and A3 (geotechnical weight); the parameters of the third category were A5 (internal friction angle), A7 (diameter of the karst cave), and A2 (Poisson’s ratio). In the results of the second test, the first type of parameters included A10 (tunnel depth), A9 (location of the karst cave), and A1 (elastic modulus), and the third type of parameters included A5 (internal friction angle), A2 (Poisson’s ratio), and A7 (diameter of the karst cave).
In Figure 10g,h, with the principal stress difference as the response variable, the scatters of the random forest model are located in 98.33% of the 95% prediction intervals in the first test, and the percentage of the scatters in the second test that are located within the 95% prediction interval is 98.49%. It shows that the model has a high prediction accuracy and a high fitting effect of the model. As shown in Figure 10i, in the results obtained from the two tests, the first type of parameters included A10 (tunnel buried depth), A6 (tunnel diameter), and A3 (geotechnical weight); and the third type of parameters included A7 (diameter of the karst cave), A4 (cohesion), and A5 (internal friction angle).
The traditional method for the sensitivity analysis of influencing factors of karst tunnel construction is the range analysis method based on the orthogonal test design. The range analysis method has the advantages of simple calculation and intuitive expression. However, there is also a disadvantage of misjudging the true dispersion degree of data due to sensitivity to outliers. And the random forest algorithm has the advantages of high accuracy and reducing the risk of overfitting by introducing randomness. Furthermore, it could clearly select the features with the greatest importance after training the random forest model. Compared with the range analysis method based on the orthogonal experimental design, the random forest algorithm could avoid the misjudgement of the true dispersion degree of the dataset caused by the abnormal value of the dataset.
Table 6 is the ranking table of the importance of the construction characteristics of karst tunnels based on the orthogonal test design and random forest algorithm. Table 5 is the ranking table of influencing factors of karst tunnel construction based on the orthogonal test design and range analysis method.
Due to the randomness of the random forest algorithm, it has been reflected in two aspects: sample randomization and feature randomization. Therefore, the feature importance ranking of karst tunnel construction obtained by running the random forest algorithm each time is not exactly the same.
Two representative calculation results which could fully reflect the feature importance of karst tunnel construction would be selected. As shown in Table 4 and Table 5, among the two test results obtained by applying the orthogonal test design and random forest algorithm with vertical displacement as the target variable, the three influencing factors with the greatest feature importance were A6 (tunnel diameter), A10 (tunnel buried depth), and A11 (excavation dimension). In the calculation results obtained by the orthogonal experimental design and range analysis method, the three influencing factors with the highest sensitivity were A6 (tunnel diameter), A10 (excavation dimension), and A1 (elastic modulus).
However, in the analysis of variance (ANOVA), the results observed in A6 (tunnel diameter) and A10 (tunnel buried depth) were statistically significant. In other words, whether A6 (tunnel diameter) and A10 (tunnel buried depth) are the two most sensitive factors remains to be further determined. The random forest algorithm of orthogonal experimental design can solve this problem well, and it also verified that A6 (tunnel diameter) and A10 (tunnel buried depth) were indeed the two most sensitive factors.
When taking the first principal stress as the target variable, the two test results obtained by the orthogonal test design and random forest algorithm show that the two most important influencing factors were A10 (tunnel buried depth) and A9 (location of karst cave). In the calculation results achieved by the orthogonal experimental design–range analysis method, the two most sensitive influencing factors were also A10 (tunnel buried depth) and A9 (location of karst cave).
However, in the analysis of variance (ANOVA), the F-value observed by A10 (tunnel buried depth) was 452.50, and the P-value was 0.00, which was statistically significant. The two influencing factors with the largest feature importance obtained by the orthogonal experimental design and random forest algorithm are the same as the calculation results obtained by the orthogonal experimental design and range analysis method. The three least important influencing factors in the feature importance ranking obtained by the orthogonal experimental design and random forest algorithm were A5 (internal friction angle), A7 (the diameter of the karst cave), and A2 (Poisson’s ratio). The three least sensitive influencing factors in the calculation results obtained by the orthogonal test design and range analysis method were A8 (the clear distance between tunnel and karst cave), A3 (geotechnical weight), and A7 (the diameter of the karst cave). In the calculation results of the most insensitive influencing factors, the calculation results of the two methods were not exactly the same.
When taking the main stress difference as the target variable, the three influencing factors with the greatest feature importance were A10 (tunnel buried depth), A6 (tunnel diameter), and A3 (geotechnical weight) in the two test results obtained by applying the orthogonal test design and random forest algorithm. In the calculation results obtained by the orthogonal experimental design and range analysis method, the three most sensitive influencing factors were A10 (tunnel buried depth), A2 (Poisson’s ratio), and A6 (tunnel diameter). And the results calculated by these two methods were basically the same.
However, in the analysis of variance (ANOVA), the F-value observed by A10 (tunnel buried depth) was 161.58, and the P-value was 0.00, which was statistically significant. In the order of sensitivity obtained by the two methods, it is shown that the two influencing factors A10 (tunnel buried depth) and A6 (tunnel diameter) had the greatest impact on the construction safety of karst tunnels with the main stress field as the target variable.

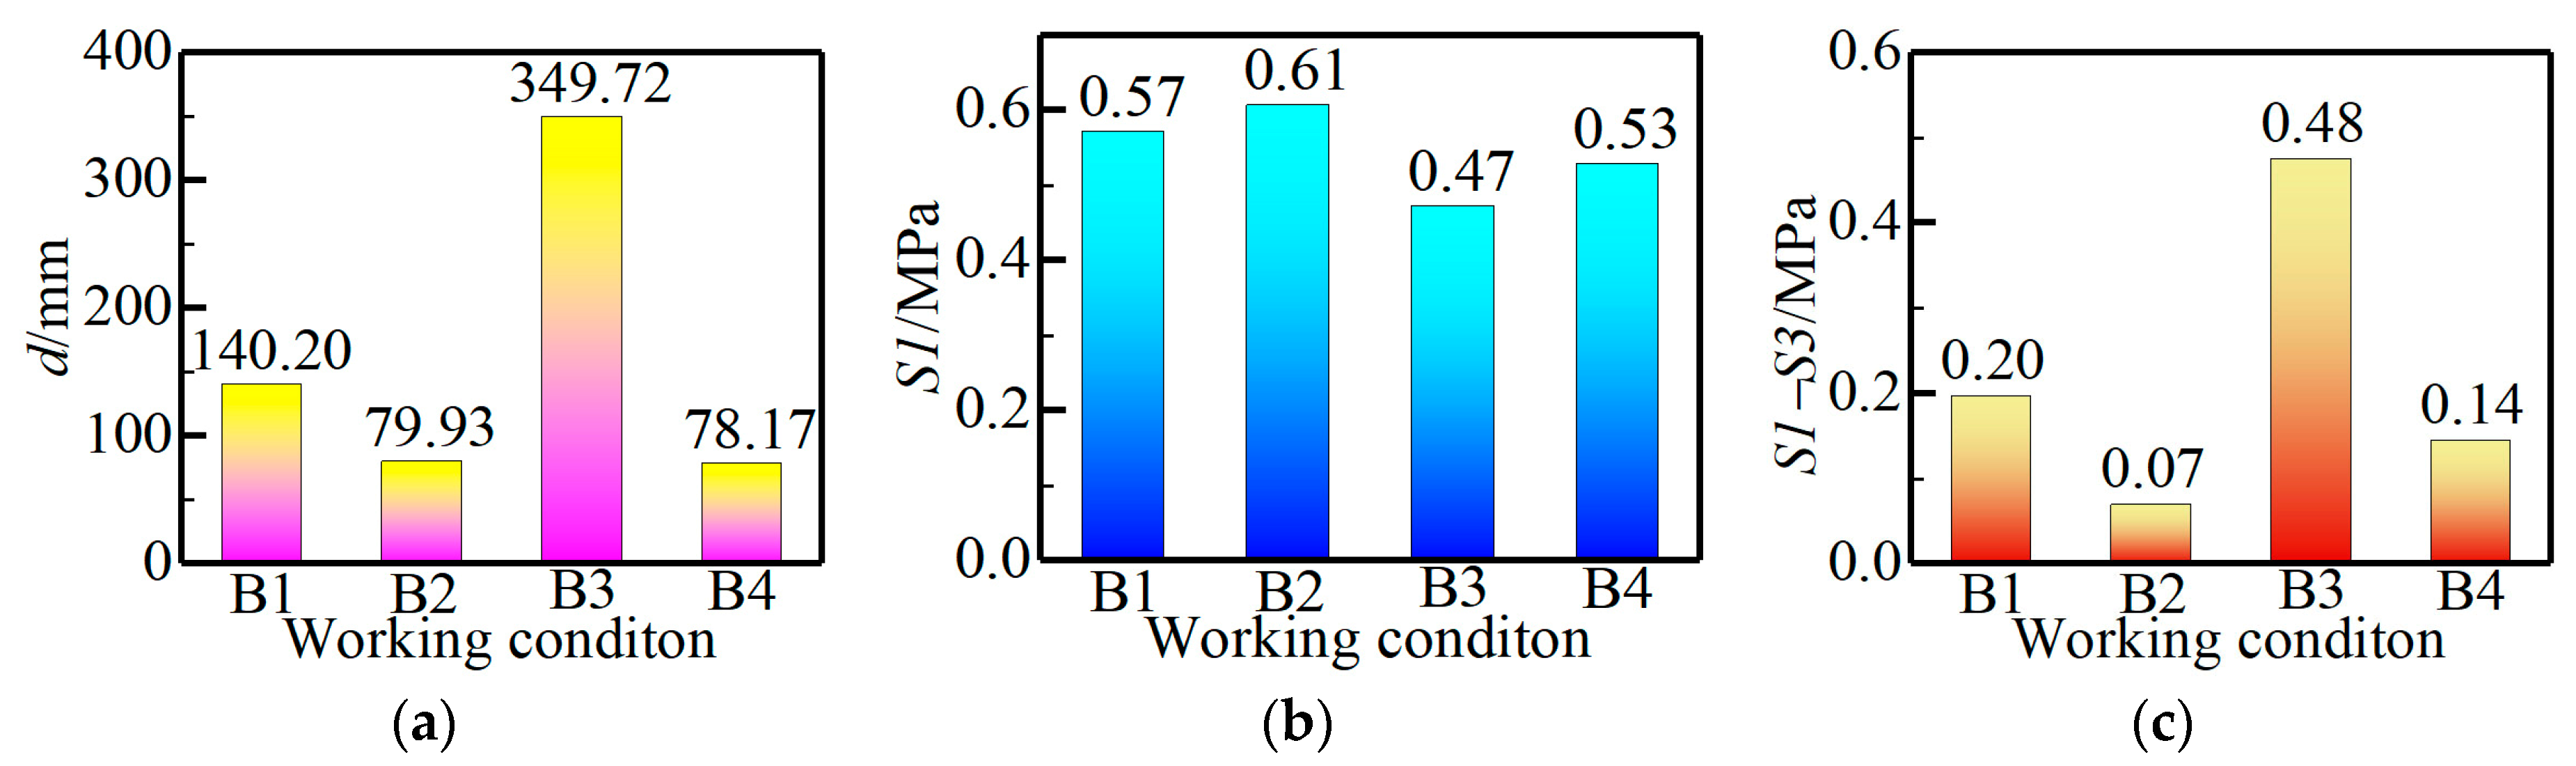
3.5. Optimal Combination of Results

Applying the orthogonal experimental design method, the original data of the target variables of vertical displacement, first principal stress, and principal stress difference with 11 influencing factors operating together were statistically analysed. And according to the degree of sensitivity, the 11 influencing factors were ranked in ascending order by applying the range analysis method, and the optimal levels were selected on the basis of the factor level-target variable trend diagrams 7, 8, 9. In the procedure of tunnel construction in karst areas, the smaller the value of the target variable is, the more favourable it is to the stability of the tunnel surrounding rock and the rock and soil masses around the karst cave. Consequently, the optimised combination of influencing factors is shown in Table 7, considering the vertical displacement, the first principal stress, and the principal stress difference as response variables, respectively.
As illustrated in Figure 11a, in terms of vertical displacement as the output variable, the quantity of vertical displacement derived from Case B2 was 42.99% smaller than that derived from Case B1, the quantity of vertical displacement derived from Case B3 was 1.49 times larger than that derived from Case B1, and the quantity of vertical displacement derived from Case B4 was 44.24% larger than that derived from Case B1. As depicted in Figure 11b, considering the first principal stress as the output variable, the value of the first principal stress derived from Case B2 was 7.02% larger than that derived from Case B1, the value of the first principal stress derived from Case B3 was 17.54% smaller than that derived from Case B1, and the value of the first principal stress derived from Case B4 was 7.02% smaller than that derived from Case B1. As demonstrated in Figure 11c, considering the principal stress difference as the output variable, the principal stress difference output from Case B2 was 65% smaller than that output from Case B1, the principal stress difference output from Case B3 was 1.4 times larger than that output from Case B1, and the principal stress difference output from Case B4 was 30% smaller than that output from Case B1. To summarise, the vertical displacement, the first principal stress, and the principal stress difference output from Case B4 were all smaller than those outputs from Case B1, considering the principal stress difference as the target variable.
Therefore, it emerges that the parameter combination consisting of the 11 influencing factors is more balanced with the principal stress difference as the target variable. The combination of the two methods of a random forest model and the range analysis method could be determined: taking vertical displacement as the target variable, the two influencing factors that have the greatest impact on the construction safety of karst tunnels are A6 (tunnel diameter) and A10 (tunnel buried depth), and one of the factors that has the least impact is A4 (cohesion). Regarding the first principal stress as the target variable, the two influencing factors that have the greatest impact on the safety of karst tunnel construction are A10 (tunnel buried depth) and A9 (location of the karst cave), and one of the influencing factors that has the least impact is A7 (diameter of the karst cave). In terms of the principal stress difference as the target variable, the two influencing factors that have the greatest impact on the karst tunnel construction safety are A10 (tunnel buried depth) and A6 (tunnel diameter). However, there are no similarities in the third category of influencing factors identified by both the random forest model and the range analysis method.
The meaning of each symbol in the figure is as follows: d—vertical displacement, S1—the first principal stress, S1–S3—principal stress difference, B1—original value combination, B2—optimised combination with vertical displacement as the target variable, B3—optimised combination with the first principal stress S1 as the target variable, B4—optimised combinations with the principal stress difference S1–S3 as the target variable.

4. Conclusions

For the purpose of the sensitivity analysis of many parameters for the response of the mechanical characteristics of tunnel construction in karst areas, 11 kinds of influencing factors related to the mechanical characteristics of tunnel construction in karst areas as well as the levels were confirmed, and the orthogonal test design method was applied to scientifically establish the orthogonal test table of 11 factors and 3 levels for karst tunnels, and 27 three-dimensional finite-element numerical models of karst tunnels were established. Three original databases for sensitivity analyses of engineering parameters should be formed with the vertical displacement, the first principal stress, and the principal stress difference as target variables, respectively. Comprehensively adopting the two methods of orthogonal experimental design method and a random forest algorithm, these 11 influencing factors were ranked hierarchically according to the degree of sensitivity from the highest to the lowest, and the optimal level of each influencing factor was selected. The research conclusions have been shown below:
(1) To ensure the representativeness and generality of the tunnel measurement points, the arch vault and the arch bottom 30 m away from the tunnel entrance were selected as the tunnel measurement points, with vertical displacement as the target variable. With the first principal stress as the target variable, the location of the tunnel haunch at a distance of 30 m away from the tunnel entrance was chosen as the measurement point. Taking the principal stress difference as the target variable, one of the four points on both sides of the tunnel, such as the spandrel and the skewback of the tunnels, 30 m away from the tunnel entrance, was selected as the tunnel measurement point;
(2) Taking vertical displacement as the target variable, the parameters with the highest feature importance were A6 (tunnel diameter) and A10 (tunnel buried depth). The random forest algorithm could satisfactorily avoid the misjudgement of the true dispersion degree of data caused by data outliers. Taking the first principal stress as the target variable, the most important influencing factors were A10 (tunnel buried depth) and A9 (location of the karst cave). In the analysis of variance (ANOVA), the results observed in A10 (tunnel buried depth) were statistically significant. Taking the principal stress difference as the target variable, the most important influencing factors were A10 (tunnel buried depth) and A6 (tunnel diameter). In the analysis of variance (ANOVA), the results observed in A10 (tunnel buried depth) were statistically significant;
(3) On the basis of the random forest algorithm and the range analysis method, the optimal combination of each influencing factor for tunnel construction in karst area was derived. Taking vertical displacement as the output variable, the amount of vertical displacement output from Case B2 was 42.99% smaller than that output from Case B1. With the first principal stress as the output variable, the value of the first principal stress output for Case B3 was 17.54% smaller than that output for Case B1. Taking the principal stress difference as the output variable, the principal stress difference output for Case B4 was 30% smaller than that output for Case B1. Nevertheless, after comparing the calculation results of the three output variables: the vertical displacement, first principal stress, and principal stress difference, the optimal level combination of 11 factors influencing the safe construction of tunnels in karst areas with the principal stress difference as the target variable is more balanced. The research results have selected the key parameters for the construction of karst tunnel engineering and laid a theoretical foundation for the optimization of the construction parameters of karst tunnel engineering.

Author Contributions

Conceptualization, B.W. and W.S.; methodology, B.W. and W.S.; writing—original draft, W.S.; writing—review and editing, B.W. and G.M.; supervision, B.W. All authors have read and agreed to the published version of the manuscript.

Funding

This work was supported by the National Natural Science Foundation of China (Nos. 52278397, 52168055); and the Jiangxi Natural Science Foundation Program (No. 20212ACB204001). These financial supports are gratefully acknowledged.

Institutional Review Board Statement

Not applicable.

Informed Consent Statement

Not applicable.

Data Availability Statement

The authors confirm that the data supporting the findings of this study are available within the article.

Acknowledgments

The authors thank the reviewers for their great help on the article during its review progress.

Conflicts of Interest

The authors declare no conflicts of interest.

References

  1. Mahmoudi, M.; Rajabi, A.M. A numerical simulation using FLAC3D to analyze the impact of concealed karstic caves on the behavior of adjacent tunnels. Nat. Hazards 2023, 117, 555–577. [Google Scholar] [CrossRef]
  2. Wu, W.; Liu, X.; Guo, J.; Sun, F.; Huang, X.; Zhu, Z. Upper limit analysis of stability of the water-resistant rock mass of a Karst tunnel face considering the seepage force. Bull. Eng. Geol. Environ. 2021, 80, 5813–5830. [Google Scholar] [CrossRef]
  3. Liu, N.; Pei, J.; Cao, C.; Liu, X.; Huang, Y.; Mei, G. Geological investigation and treatment measures against water inrush hazard in karst tunnels: A case study in Guiyang, southwest China. Tunn. Undergr. Space Technol. 2022, 124, 104491. [Google Scholar] [CrossRef]
  4. Wu, B.; Sun, W.; Cai, G.; Meng, G. Reliability analysis of shallow-buried tunnel construction adjacent to karst cave. Comput. Geotech. 2022, 145, 104673. [Google Scholar] [CrossRef]
  5. Cheng, W.; Cui, Q.; Shen, J.S.; Arulrajah, A.; Yuan, D. Fractal Prediction of Grouting Volume for Treating Karst Caverns along a Shield Tunneling Alignment. Appl. Sci. 2017, 7, 652. [Google Scholar] [CrossRef]
  6. Shi, Z.; Wang, Q.; Pang, C.; Yuan, Y.; Wang, F.; Song, H.; Liu, J.; Zhang, Z.; Sun, R.; Liu, Y. Establishment and Application of the Spatial Decomposition Method (SDM) for Tunnels Passing Through Large Karst Caves. Appl. Sci. 2020, 10, 7204. [Google Scholar] [CrossRef]
  7. Wang, X.; Lai, J.; He, S.; Garnes, R.S.; Zhang, Y. Karst geology and mitigation measures for hazards during metro system construction in Wuhan, China. Nat. Hazards 2020, 103, 2905–2927. [Google Scholar] [CrossRef]
  8. Liu, Y.; Feng, Y.; Xu, M.; Zhang, Y.; Long, H.; Zhu, H. Effect of an incremental change in external water pressure on tunnel lining: A case study from the Tongxi karst tunnel. Nat. Hazards 2019, 98, 343–377. [Google Scholar] [CrossRef]
  9. Yu, K.; Ren, F.; Puscasu, R.; Lin, P.; Meng, Q. Optimization of combined support in soft-rock roadway. Tunn. Undergr. Space Technol. 2020, 103, 103502. [Google Scholar] [CrossRef]
  10. Tian, H.; Chen, W.; Yang, D.; Dai, Y.; Yang, J. Application of the orthogonal design method in geotechnical parameter back analysis for underground structures. Bull. Eng. Geol. Environ. 2016, 75, 239–249. [Google Scholar] [CrossRef]
  11. Tian, Q.; Zhang, J.; Zhang, Y. Similar simulation experiment of expressway tunnel in karst area. Constr. Build. Mater. 2018, 176, 1–13. [Google Scholar] [CrossRef]
  12. Su, Y.; Sun, W.; Fang, Y. Analysis on displacement release of tunnel face based on orthogonal tests. J. Hunan Univ. (Nat. Sci.) 2017, 44, 156–163. (In Chinese) [Google Scholar]
  13. Han, G.; Xue, P.; Wang, Y.; Li, X.; Bian, H.; Wang, Y.; Guo, P. Mechanical response law and parameter influence analysis of karst tunnel dynamic excavation. Appl. Sci. 2023, 13, 9351. [Google Scholar] [CrossRef]
  14. Li, Q.; Meng, X.; Liu, Y. Sensitivity analysis of water inrush evaluation model based on the theory of water resistant key strata: A case study in a coal mine, China. Earth Sci. Inform. 2022, 15, 2481–2494. [Google Scholar] [CrossRef]
  15. Cheng, Y.; Zhou, W.; Xu, T. Tunneling-induced settlement prediction using the hybrid feature selection method for feature optimization. Transp. Geotech. 2022, 36, 100808. [Google Scholar] [CrossRef]
  16. Jang, H.; Kawamura, Y.; Shinji, U. An empirical approach of overbreak resistance factor for tunnel blasting. Tunn. Undergr. Space Technol. 2019, 92, 103060. [Google Scholar] [CrossRef]
  17. Zhao, C.; Lavasan, A.A.; Hölter, R.; Schanz, T. Mechanized tunneling induced building settlements and design of optimal monitoring strategies based on sensitivity field. Comput. Geotech. 2018, 97, 246–260. [Google Scholar] [CrossRef]
  18. Zhang, L.; Wu, X.; Zhu, H.; AbouRizk, S.M. Performing global uncertainty and sensitivity analysis from given data in tunnel construction. J. Comput. Civil Eng. 2017, 31, 04017065. [Google Scholar] [CrossRef]
  19. Pandit, B.; Babu, G.L.S. Global Sensitivity Analysis for a Tunnel-Support System in Weak Rock Mass for Both—Uncorrelated and Correlated Input Parameters. Rock Mech. Rock Eng. 2022, 55, 2787–2804. [Google Scholar] [CrossRef]
  20. Miro, S.; Hartmann, D.; Schanz, T. Global sensitivity analysis for subsoil parameter estimation in mechanized tunneling. Comput. Geotech. 2014, 56, 80–88. [Google Scholar] [CrossRef]
  21. Fellin, W.; King, J.; Kirsch, A.; Oberguggenberger, M. Uncertainty modelling and sensitivity analysis of tunnel face stability. Struct. Saf. 2010, 32, 402–410. [Google Scholar] [CrossRef]
  22. Chen, L.; Wang, Z.; Zhang, W.; Wang, Y. Characteristics, numerical analysis and countermeasures of mud inrush geohazards of Mountain tunnel in karst region. Geomat. Nat. Hazards Risk 2023, 14, 2242691. [Google Scholar] [CrossRef]
  23. Zhang, Z.; Li, G.; Zhang, G.; Niu, M. Influence of liquid accelerators on shotcrete in karst area tunnels. Case Stud. Constr. Mat. 2022, 16, e01002. [Google Scholar] [CrossRef]
  24. Li, S.; Gao, C.; Zhou, Z.; Li, L.; Wang, M.; Yuan, Y.; Wang, J. Analysis on the Precursor Information of Water Inrush in Karst Tunnels: A True Triaxial Model Test Study. Rock Mech. Rock Eng. 2019, 52, 373–384. [Google Scholar] [CrossRef]
  25. Feng, T.; Wang, C.; Zhang, J.P.; Wang, B.; Jin, Y. An improved artificial bee colony-random forest (IABC-RF) model for predicting the tunnel deformation due to an adjacent foundation pit excavation. Undergr. Space 2022, 7, 514–527. [Google Scholar] [CrossRef]
  26. Hao, Y.; Rong, X.; Lu, H.; Xiong, Z.; Dong, X. Quantification of margins and uncertainties for the risk of water inrush in a karst tunnel: Representations of epistemic uncertainty with probability. Arab. J. Sci. Eng. 2018, 43, 1627–1640. [Google Scholar] [CrossRef]
Figure 1. Technology roadmap. The contents of the red box on the left side of the figure represent the key steps based on the orthogonal experimental design and the random forest algorithm. The contents of the red box on the right side of the figure represent the key operational steps based on the orthogonal experimental design and the range analysis method.
Applsci 14 02079 g001
Figure 2. Finite-element modelling of karst tunnel: (a) tunnel model; (b) karst cave model.
Applsci 14 02079 g002
Figure 3. Vertical displacement curve: (a) Case 1; (b) Case 10; (c) Case 19.
Applsci 14 02079 g003
Figure 4. First principal stress curve: (a) Case 1; (b) Case 10; (c) Case 19.
Applsci 14 02079 g004
Figure 5. Principal stress difference curve: (a) Case 1 and Case 19; (b) Case 10.
Applsci 14 02079 g005
Figure 6. Range analysis of vertical displacement.
Applsci 14 02079 g006
Figure 7. Range analysis of first principal stress.
Applsci 14 02079 g007
Figure 8. Range analysis of the principal stress difference.
Applsci 14 02079 g008
Figure 9. The operational flow chart.
Applsci 14 02079 g009
Figure 10. The ranking of feature importance: (a) the first test on vertical displacement; (b) the second test on vertical displacement; (c) vertical displacement; (d) the first test on first principal stress; (e) the second test on first principal stress; (f) first principal stress; (g) the first test on principal stress difference; (h) the second test on principal stress difference; (i) principal stress difference.
Applsci 14 02079 g010aApplsci 14 02079 g010b
Figure 11. Comparative bar chart of best combinations: (a) vertical displacement; (b) S1; (c) S1–S3.
Applsci 14 02079 g011
Table 1. Correspondence between influencing factors and code names.
Influencing factorsElastic modulusPoisson’s ratioGeotechnical weightCohesionInternal friction angleTunnel diameter
Label symbolA1A2A3A4A5A6
Influencing factorsThe diameter of the karst caveClear distance between the tunnel and karst caveLocation of the karst caveTunnel buried depthExcavation dimension
Label symbolA7A8A9A10A11
Table 2. Influencing factors and their levels.
Levels A1A2A3A4A5A6A7A8A9A10A11
1400.2525800363.3511up13.41
2530.3271000456.733down20.11.5
3700.352812005413.455left1002
Table 3. Orthogonal test table of L27(311).
CaseA1A2A3A4A5A6A7A8A9A10A11d
/mm
S1
/MPa
S1–S3
/MPa
11111111111117.2640.5320.342
21111222222256.5840.6290.422
311113333333435.2823.2601.806
41222111222316.1830.4560.250
512222223331158.9293.0691.732
612223331112160.7500.6290.365
71333111333276.0423.0911.287
8133322211139.0250.1370.061
913333332221135.4490.7010.380
1021231231231119.4842.8361.868
1121232312312121.7920.6020.461
122123312312315.4860.6520.407
132231123231330.5810.5710.263
1422312313121135.7500.9310.509
152231312123250.5173.2141.652
162312123312233.1350.6490.332
1723122311233100.3672.5571.885
18231231223118.9760.4050.187
1931321321321114.6150.9260.761
203132213213253.7622.9221.909
213132321321327.7210.5440.309
2232131322133231.2043.1511.890
23321321332116.2840.3760.193
243213321132229.8471.1130.589
253321132321276.6150.6280.312
263321213132311.0460.7830.49
273321321213186.9503.1851.273
The meaning of each symbol in the table is as follows: S1—the first principal stress, S3—the third principal stress, d—vertical displacement.
Table 4. Order of influencing factors.
Ranking of Influencing FactorsThe First CategoryThe Secondary CategoryThe Third Category
1234567891011
dA6A10A1A2A9A7A8A5A3A4A11
S1A10A9A5A4A2A11A1A6A8A3A7
S1–S3A10A2A6A8A1A7A5A4A3A9A11
The meaning of each symbol in the table is as follows: d—vertical displacement, S1—the first principal stress, S3—the third principal stress. The influencing factors in the red area are the first category of the influencing factors, which means that this type of the influencing factor is the most sensitive. The influencing factors in the orange region are the secondary category of influencing factors. This indicates that such influencing factors are of secondary sensitivity. The influencing factors in the yellow area are the third category of influencing factors, which means that such influencing factors are the least sensitive.
Table 5. Analysis of variance (ANOVA).
Target VariableA1A2A3A4A5A6A7A8A9A10A11
dF value0.440.600.260.170.319.530.470.400.523.500.15
p value0.850.560.780.850.740.0010.630.670.600.0460.86
S1F value0.030.040.000.050.050.020.000.010.07452.500.04
p value0.970.971.000.950.950.981.000.990.940.000.97
S1–S3F value0.080.260.020.030.030.200.030.090.01161.580.00
p value0.930.780.980.970.970.820.970.920.990.001.00
The meaning of each symbol in the table is as follows: S1—the first principal stress, S3—the third principal stress, d—vertical displacement. When taking vertical displacement as the target variable, it indicates that the results observed by the two influencing factors on annotation highlighting A6 (tunnel diameter) and A10 (tunnel buried depth) may be statistically significant. When taking the first principal stress as the target variable, it indicates that the results observed by the influencing factor on annotation highlighting A10 (tunnel buried depth) may be statistically significant. When taking the principal stress difference as the target variable, it indicates that the results observed by the influencing factor on annotation highlighting A10 (tunnel buried depth) may be statistically significant.
Table 6. The ranking of feature importance.
Ranking of
Influencing Factors
The First CategoryThe Secondary CategoryThe Third Category
1234567891011
dfirst testA6A10A11A3A1A5A2A7A8A4A9
second testA6A10A11A1A3A2A5A7A8A9A4
S1first testA10A9A3A1A8A6A11A4A5A7A2
second testA10A9A1A6A8A11A3A4A5A2A7
S1–S3first testA10A6A3A11A2A9A8A1A7A5A4
second testA10A6A3A2A11A8A1A9A7A4A5
The meaning of each symbol in the table is as follows: d—vertical displacement, S1—the first principal stress, S3—the third principal stress. The influencing factors in the red area are the first category of influencing factors, which means that the feature importance of such influencing factors is the greatest. The influencing factors in the orange region are the secondary category of influencing factors. This indicates that the feature importance of such influencing factors is of secondary importance. The influencing factors in the yellow area are the third category of influencing factors, which means that the feature importance of such influencing factors is minimal.
Table 7. Optimal combination table of influencing factors.
CaseA1A2A3A4A5A6A7A8A9A10A11d
/mm
S1
/MPa
S1–S3
/MPa
B1530.3271000456.733down20.11140.200.5720.197
B2530.35281000453.3511down13.41.579.930.6070.069
B3530.35251000453.3553down1001349.720.4720.475
B4400.3527800543.3511up13.4178.170.5290.144
The meaning of each symbol in the table is as follows: d—vertical displacement, S1—the first principal stress, S1–S3—principal stress difference. B1—original value combination, B2—optimised combination with vertical displacement as the target variable, B3—optimised combination with the first principal stress S1 as the target variable, B4—optimised combinations with the principal stress difference S1–S3 as the target variable.
Disclaimer/Publisher’s Note: The statements, opinions and data contained in all publications are solely those of the individual author(s) and contributor(s) and not of MDPI and/or the editor(s). MDPI and/or the editor(s) disclaim responsibility for any injury to people or property resulting from any ideas, methods, instructions or products referred to in the content.

