Article

NSGA–III–XGBoost-Based Stochastic Reliability Analysis of Deep Soft Rock Tunnel

1
Department of Geotechnical Engineering, Tongji University, Shanghai 200092, China
2
POWERCHINA Chengdu Engineering Co., Ltd., Chengdu 610072, China
3
China Railway 20th Bureau Group Co., Ltd., Xi’an 710016, China
*
Author to whom correspondence should be addressed.
Appl. Sci. 2024, 14(5), 2127; https://doi.org/10.3390/app14052127
Submission received: 16 January 2024 / Revised: 15 February 2024 / Accepted: 1 March 2024 / Published: 4 March 2024

Abstract

:
How to evaluate the reliability of deep soft rock tunnels under high stress is a very important problem to be solved. In this paper, we proposed a practical stochastic reliability method based on the third-generation non-dominated sorting genetic algorithm (NSGA–III) and eXtreme Gradient Boosting (XGBoost). The proposed method used the Latin hypercube sampling method to generate the dataset samples of geo-mechanical parameters and adopted XGBoost to establish the model of the nonlinear relationship between displacements and surrounding rock mechanical parameters. And NSGA–III was used to optimize the surrogate model hyper-parameters. Finally, the failure probability was computed by the optimized surrogate model. The proposed approach was firstly implemented in the analysis of a horseshoe-shaped highway tunnel to illustrate the efficiency of the approach. Then, in comparison to the support vector regression method and the back propagation neural network method, the feasibility, validity and advantages of XGBoost were demonstrated for practical problems. Using XGBoost to achieve Monte Carlo simulation, a surrogate solution can be provided for numerical simulation analysis to overcome the time-consuming reliability evaluation of initial support structures in soft rock tunnels. The proposed method can evaluate quickly the large deformation disaster risks of non-circular deep soft rock tunnels.

1. Introduction

After the excavation of deep-buried soft rock tunnels under high stress, the risk of large deformation of soft rock often occurs. Therefore, it is very necessary to quantitatively evaluate the large deformation risk using reliability theory. The reliability-based analysis is more rational to deal with parametric uncertainties and their randomness. Therefore, it has attracted extensive research interest in recent years [1,2,3,4].
Evaluating the reliability of tunnel structures is a key tool for assessing the safety level and their most probable failure state under possible uncertainties during their service life. According to the theory of structural reliability, the safety level of engineering structures can be denoted as a probabilistic model, and its mathematical formula is as follows [5,6]:
P f = P r o b g X 0 = g X 0 f X x 1 , x 2 , , x n d x 1 d x 2 d x n
where P f denotes the probability of structure failure; P r o b represents the probability operator; g X stands for the limit state function of tunnel structure; X denotes the vector of random variables; g X < 0 indicates tunnel structural failure; f X x 1 , x 2 , , x n denotes the joint probability density function (PDF) of X .
The traditional reliability analysis methods include the first-order method, the second-order method and the response surface method. The system reliability of rock tunnel was assessed using an iterative procedure based on the convergence–confinement method, the first-order reliability method and the response surface method [7]. The reliability of the tunnel face was assessed using adaptive RBF and first-order reliability method [8]. The reliability of tunnel face and the tunnel reliability were analyzed by the response surface methods based on least squares support vector machines [9] and high-dimension model representation [10].
In addition, there are other innovative methods [11,12,13,14,15,16,17,18,19,20] used in reliability research of tunnel engineering. The surrogate models based on augmented radial basis functions [11] and a hybrid particle swarm optimization neural network [12] were used to assess the reliability analysis of tunnels and the probability distribution of the limit support pressure for the tunnel excavation face. The reliability of the tunnel face was assessed using the active learning Kriging model [13], the hybrid evolution Markov chain Monte Carlo (MCMC) algorithm [15] and the simplified inverse first-order reliability method (FORM) [20].
The system reliability of the tunnel reinforced by rock bolts was analyzed using the improved hybrid method of the linear response surface method and artificial neural network (ANN) [16]. The reliability of the tunnel was analyzed using mixed polynomial correlation function expansion, adaptive sequential experimental design and an adaptive algorithm [17]. The performance of the tunnel composite lining was analyzed using the improved Roenblueth point estimation method, FORM, Monte Carlo sampling method and finite element method (FEM) [18]. The stability reliability of the tunnel lining structure was analyzed using the optimization method for the Kriging interpolation in collaboration with the genetic algorithm (GA) [19].
With further study of the uncertainty in geotechnical engineering, the reliability method has been gradually developed and applied in geotechnical engineering. However, there are still few studies on tunnel reliability, only relatively concentrated on the above aspects [20]. It is significant to note that the subject of structural reliability analysis in civil engineering has recently been further developed [21,22,23]. To incorporate extra information into the Gaussian process as constraints, a Bayesian-entropy Gaussian process methodology for regression and surrogate modeling was proposed [21]. The reliability method in the framework of the Bayesian model update of the structural dynamic models using measured responses was implemented for high-dimensional model parameter spaces [22].
From the above analysis, we note that the reliability research in tunnel engineering of deep soft rock is still in its infancy, and most of the existing tunnel reliability calculation methods are proposed for circular tunnels. It is difficult to evaluate the large deformation risks of deep buried non-circular soft rock tunnels using these reliability methods. Using machine learning methods to establish the surrogate models of the nonlinear mapping relationship between geotechnical parameters and their responses can significantly reduce the time cost of numerical simulation calculations. However, there are still few application studies on machine learning algorithms in the reliability analyses of deep soft rock tunnels. Therefore, the reliability theories of deep soft rock tunnels urgently need to be further studied on the basis of machine learning algorithms such as the eXtreme Gradient Boosting (XGBoost) algorithm.
XGBoost does not require high-performance hardware resources such as memory, and has strong robustness. Compared to deep learning models, XGBoost can achieve similar results without fine-tuning of parameters [23]. The surrogate modeling technology based on the XGBoost algorithm has recently been applied to the real-time design of tunnel alignment [24].
Hyper-parameter tuning is crucial for surrogate models based on machine learning algorithms. There are main methods for optimizing hyper-parameters in machine learning models such as Bayesian optimization, genetic algorithm, gradient-based optimization, grid search, Keras Tuner, population-based optimization, ParamILS, and random search. The third-generation non-dominated genetic algorithm (NSGA–III) can solve optimization problems with at least four or more objectives [25]. The XGBoost-based surrogate model has at least nine hyper-parameters. Therefore, NSGA–III is very suitable for hyper-parameter tuning of XGBoost-based surrogate models.
In this study, we propose a stochastic reliability method (SRM) based on XGBoost and NSGA–III. First, the Latin hypercube sampling (LHS) method is used to generate the sample dataset of geo-mechanical parameters of surrounding rock, and the corresponding finite difference numerical calculations based on this dataset are conducted. Second, the surrogate model is constructed using XGBoost, and the surrogate model hyper-parameters are optimized using NSGA–III. Finally, the tunnel reliability index is calculated using the Monte Carlo simulation reliability method (MCSRM) through the NSGA–III–XGBoost-based optimal surrogate model.
The purpose of this paper is to provide a surrogate solution for numerical analysis to overcome the time-consuming reliability evaluation of initial support structures of soft rock tunnels under high stress. The main contribution of this paper is that it provides a novel calculation and analysis framework of system reliability to evaluate quickly the large deformation disaster risks of non-circular, deep-buried soft rock tunnels with low computational costs, high precision and high efficiency.

2. EXtreme Gradient Boosting (XGBoost)

XGBoost is a scalable end-to-end tree boosting system, and data scientists have widely used it in many machine learning challenges and achieved state-of-the-art results [26,27]. XGBoost is an improved version of the gradient-boosting decision tree (GBDT). The basic component of XGboost is the decision tree. These decision trees are referred to as “weak learners”, which together make up XGboost. There is a sequential order between the decision trees that make up XGBoost. The generation of the latter decision tree will consider the prediction results of the previous decision tree, taking into account the deviation of the previous decision tree (as reflected in the objective function). Each decision tree is generated using the entire dataset. So the generation of each decision tree can be seen as a complete process of decision tree generation.
XGBoost is excellent in parallel computing efficiency, missing value processing, control overfitting, and prediction generalization ability. The specific algorithm process of XGBoost and its calculation steps are detailed in reference [28]. The steps and key technologies of XGBoost algorithm are as follows [26]:
(1)
Construct the objective function: additive model, forward step-by-step algorithm, objective function derivation and optimal solution.
Define q as the mapping from the input vector x to the leaf node number of the decision tree. Let the sample set on each leaf p be I p = i q x i = p . Set the objective function as O b j Θ , and Θ represents the region division of the tree and the constants on each region.
Given the training sample dataset M = x 1 , y 1 , x 2 , y 2 , , x N , y N , x i χ R N , χ is the input space of the training sample, y i y R , y is the output space, and N is the dimension of input space. The objective function O b j Θ can be denoted by Equation (2).
O b j Θ = L Θ + Ω Θ
where L Θ represents the training loss function, indicating how well the model fits the training data; Ω Θ is the regularization term, which measures the complexity of the model.
Simplify the objective function O b j Θ as
O b j Θ p = 1 M G p w p + 1 2 H t + λ w p 2 + γ M
where M is the decision tree; γ and λ are two artificially set coefficients; ω p is the weight of leaf p .
g p i = L ( y i , y i ) y i | y i = y i , p 1 , h p i = 2 L ( y i , y i y i ) y i 2 | y i = y i , p 1   G p = i I p g p i , H p = i I p h p i
where y = f x , f x is the prediction value obtained using the fitting model.
(2)
The methods for constructing trees (splitting nodes) include precise greedy algorithms, approximate search algorithms, automatic processing of missing values, and setting learning rates.
In XGBoost, using the greedy algorithm to generate a tree will greatly improve computational efficiency. The greedy algorithm, in simple terms, is a method that ensures that each step is the optimal solution, thereby achieving the global optimal solution. In the generation of decision trees, the greedy algorithm can ensure that the new tree generated by each node split is the one with the minimum objective function value.
The pseudocode for the exact greedy algorithm for split finding (see Algorithm 1) is as follows [26].
Algorithm 1. The exact greedy algorithm for split finding
Input: I, instance set of current node
Input: d, feature dimension
gain  0
G i I p g p i , H i I p h p i
for k = 1 to m do
       G L   0 , H L   0
      for p  in sorted ( I , by x p k ) do
          G L   G L + g p , H L   H L + h p
          G R   G G L , H R   H H L
          s c o r e max s c o r e , G L 2 H L + λ + G R 2 H R + λ G 2 H + λ
      end
end
Output: Split with max score
Based on performance considerations, XGBoost has also made an approximate version of the greedy criterion, using feature quantiles as partition candidate points and reducing the set of partition candidate points, from traversing across the entire sample to traversing between a few quantiles. The pseudocode for the approximate search algorithm for split finding (see Algorithm 2) is as follows [26].
Algorithm 2. The approximate search algorithm for split finding
for k = 1 to m do
      Propose S k = s k 1 , s k 2 , , s k l by percentiles on feature k
      Proposal can be done per tree (global), or per split (local).
end
for k = 1 to m do
        G k v = p p s k , v x p k > s k , v 1 g p
              H k v = p p s k , v x p k > s k , v 1 h p
end
Follow the same step as in the previous section to find the max score only among the proposed splits.

3. NSGA-III Algorithm

To solve the nine hyper-parameter optimization problem of XGBoost model, NSGA–III proposed by Deb and Jain (2014) was adopted in this paper. The NSGA–III algorithm is proposed based on the NSGA–II algorithm. Compared with NSGA–II, NSGA-III has the less computation time and higher quality of Pareto solutions [29]. NSGA–III is the most widely used multi-objective optimization algorithm in the field of multi-objective optimization. NSGA–III adopts a reference point-based sorting mechanism, while NSGA–II adopts a congestion distance-based sorting mechanism.
The basic idea of GA is as follows: population initialization entering the main loop selection operation crossover operation mutation operation population update operation outputting the global optimal solution.
Here, H is the number of target axis partitions for the reference point; Z s is the reference point, and the parent population for the t -th iteration is P t ; f n is objective function. The main process of the NSGA-III algorithm is as follows.
(1)
Obtain the offspring population Q t from the mutation of the parent population P t , and then obtain the total population R t = P t Q t , assuming an empty population S t = .
(2)
Perform non-dominated sort of R t to obtain the non-dominated layer F 1 , F 2 , , F k .
(3)
Fill individuals in S t according to the order of non-dominated layers until they reach Layer l . If F l + S t > N and S t < N , proceed to Step (4); otherwise, if S t = N , P t + 1 = S t .
(4)
Adaptive normalization is performed on the individuals in F l , calculating the distance d ( s ) between each individual and the reference line, and corresponding each individual to the reference point corresponding to the closest reference line, completing the reference point correspondence.
(5)
According to the corresponding results, the reference points are arranged in ascending order based on the number of individuals corresponding to each reference point. Individuals are selected from the reference points and added to S t with the priority given to the corresponding number of individuals. The iteration is repeated until the filling is completed.
(6)
Output P t + 1 .
The pseudocode for the NSGA-III algorithm (see Algorithm 3) is as follows [29].
Generation t of NSGA-III procedure:
Algorithm 3. The NSGA-III algorithm
Input:  H structured reference points Z s or provided aspiration points Z a , parent population P t
Output: P t + 1 .
1. S t = , i = 1
2. Q t = Recombination + Mutation ( P t )
3. R t = P t Q t
4. F 1 , F 2 , , F k = Non-dominated-sort ( R t )
5. repeat
6. S t = S t F i and i = i + 1
7. until S t N
8. Last front to be included: F l = F i
9. if  S t = N  then
10.    P t + 1 = S t , break
11. else
12. P t + 1 = j = 1 l 1 F j
13. Points to be selected from F l : K = N P t + 1
14. Normalize objectives and create reference set Z r :
     N o r m a l i z e = f n , S t , Z r , Z s , Z a
15. Associate each member s of S t with a reference point:
       π s , d s = A s s o c i a t e S t , Z r % π s : closest reference point,
       d : distance between s and π s
16. Compute the niche count of reference point j Z r :
       ρ j = s S t / F l π s = j ? 1 : 0
17. Choose K members one at a time from F l to construct
                 P t + 1 : Niching K , ρ j , π , d , Z r , F l , P t + 1
18. end if

4. NSGA–III–XGBoost-Based Reliability Calculation Program Framework

4.1. Performance Function of Tunnel Initial Support Structure

According to the design requirements of the perimeter deformation of a deep-buried tunnel, the performance function (limit state function) of tunnel initial support structure G Tunnel ( X ) is given by Equation (5).
G Tunnel ( X ) = U max U ( X )
where U max is the deformation design value of the tunnel initial support structure; U ( X ) is the value of the perimeter deformation corresponding to X ; X is the vector of random variables, that is, surrounding rock geo-mechanical parameters.
When designing the excavation section of tunnel, in addition to meeting its clearance and structural dimensions, an appropriate amount of tunnel deformation should be reserved after initial support. The size of the reserved deformation can be determined by the surrounding rock classification, section size, embedded depth, construction method and support conditions, etc., and adjusted sometimes according to the results of on-site monitoring. According to the Chinese Highway Tunnel Design Code, the reserved deformation of the tunnel is generally 5~20 cm.
When designing according to the bearing capacity, the allowable relative convergence and the allowable vault settlement for the tunnel initial support structure should be determined by the surrounding rock geological conditions, surrounding rock classification and tunnel buried depth. According to the Chinese Highway Tunnel Design Code, it is generally 0.1~3.0% of the maximum clearance size of tunnel.

4.2. XGBoost-Based Relationship between Geo-Mechanic Parameters and Displacement

In this paper, the XGBoost model was used to surrogate the numerical model and to map the nonlinear relationship between geo-mechanic parameters (elastic modulus, internal friction angle, cohesion and Poisson’s ratio, etc.) and monitored displacements, which can significantly reduce the calculation time.
The mathematical model X G B o o s t X , is defined by Equation (6).
X G B o o s t X :   R K R N Y = X G B o o s t X
where X = x 1 , x 2 , , x K ; x i   i = 1 , 2 , , K is a vector of mechanical parameters of surrounding rock such as internal friction angle, elastic modulus, cohesion and Poisson’s ratio, etc.; K is the dimension of geo-mechanical parameters; Y = y 1 , y 2 , , y N is an N dimensional vector of the displacement. In this paper, the observable output is the displacement; correspondingly, N denotes the dimension of displacement.
To obtain X G B o o s t X , a training process based on a dataset is very necessary. The training samples are obtained for this study by combining test design and finite difference numerical simulation, which is used to obtain tunnel displacements according to a given set of surrounding rock mechanical parameters. Compared with other sampling design methods, the Latin hypercube sampling (LHS) method is always comprehensive in considering the marginal small-probability events in the test. Therefore, LHS is more suitable for large-scale numerical test sampling. For this study, the sampling by the LHS sampling method is used to construct a sample set for the geo-mechanical parameters of surrounding rock, and these geo-mechanical parameters are defined as the input of XGBoost. The displacement is defined as the output of XGBoost.

4.3. NSGA–III–XGBoost-Based MCS Reliability Analysis

The whole calculation process of the NSGA–III–XGBoost-based MCS reliability analysis method is depicted in the flowchart in Figure 1. The detailed calculation steps of the proposed method are as follows.
Step 1 The dataset of geo-mechanical parameters is generated using the LHS method.
Step 2 Use the finite difference method (FDM) such as FLAC3D to calculate the displacement of each monitoring point.
Step 3 Establish the surrogate model by XGBoost training on the dataset:
First, the data of displacements and geo-mechanical parameters are standardized to form the sample dataset.
Second, establish the model to map the nonlinear relationship between displacements and their corresponding geo-mechanical parameters.
Finally, the nine hyper-parameters (max_depth, learning_rate, n_estimators, gamma, min_child_weight, subsample, colsample_bytree, reg_alpha, and reg_lambda) of the XGBoost-based surrogate model are tuned by the NSGA–III algorithm, and then the optimized surrogate model is obtained. NSGA–III is a fast nondominated objective optimization algorithm based on the Pareto optimal solution with an elite retention strategy [29,30,31]. Therefore, it is selected as the method used for tuning the hyperparameter of the XGBoost-based surrogate model. The specific hyperparameter tuning process for of XGBoost-based surrogate model was depicted in reference [28].
Step 4 The geo-mechanical parameters sample data are obtained using the Monte Carlo method (MCM). Then, the displacements of the tunnel are calculated by the optimized NSGA–III–XGBoost-based surrogate model established in Step 3.
Step 5 According to the tunnel displacement allowable design value, the failure probability of the tunnel primary support structure is calculated by Equation (7).
P f N f N
where P f is the failure probability of tunnel primary support structure; N f is the number of G Tunnel j ( X ) = U max U j ( X ) < 0 in all G Tunnel j ( X ) j = 1 , 2 , , N ; N is the total number of random samples.

5. Case Study

5.1. Problem Description

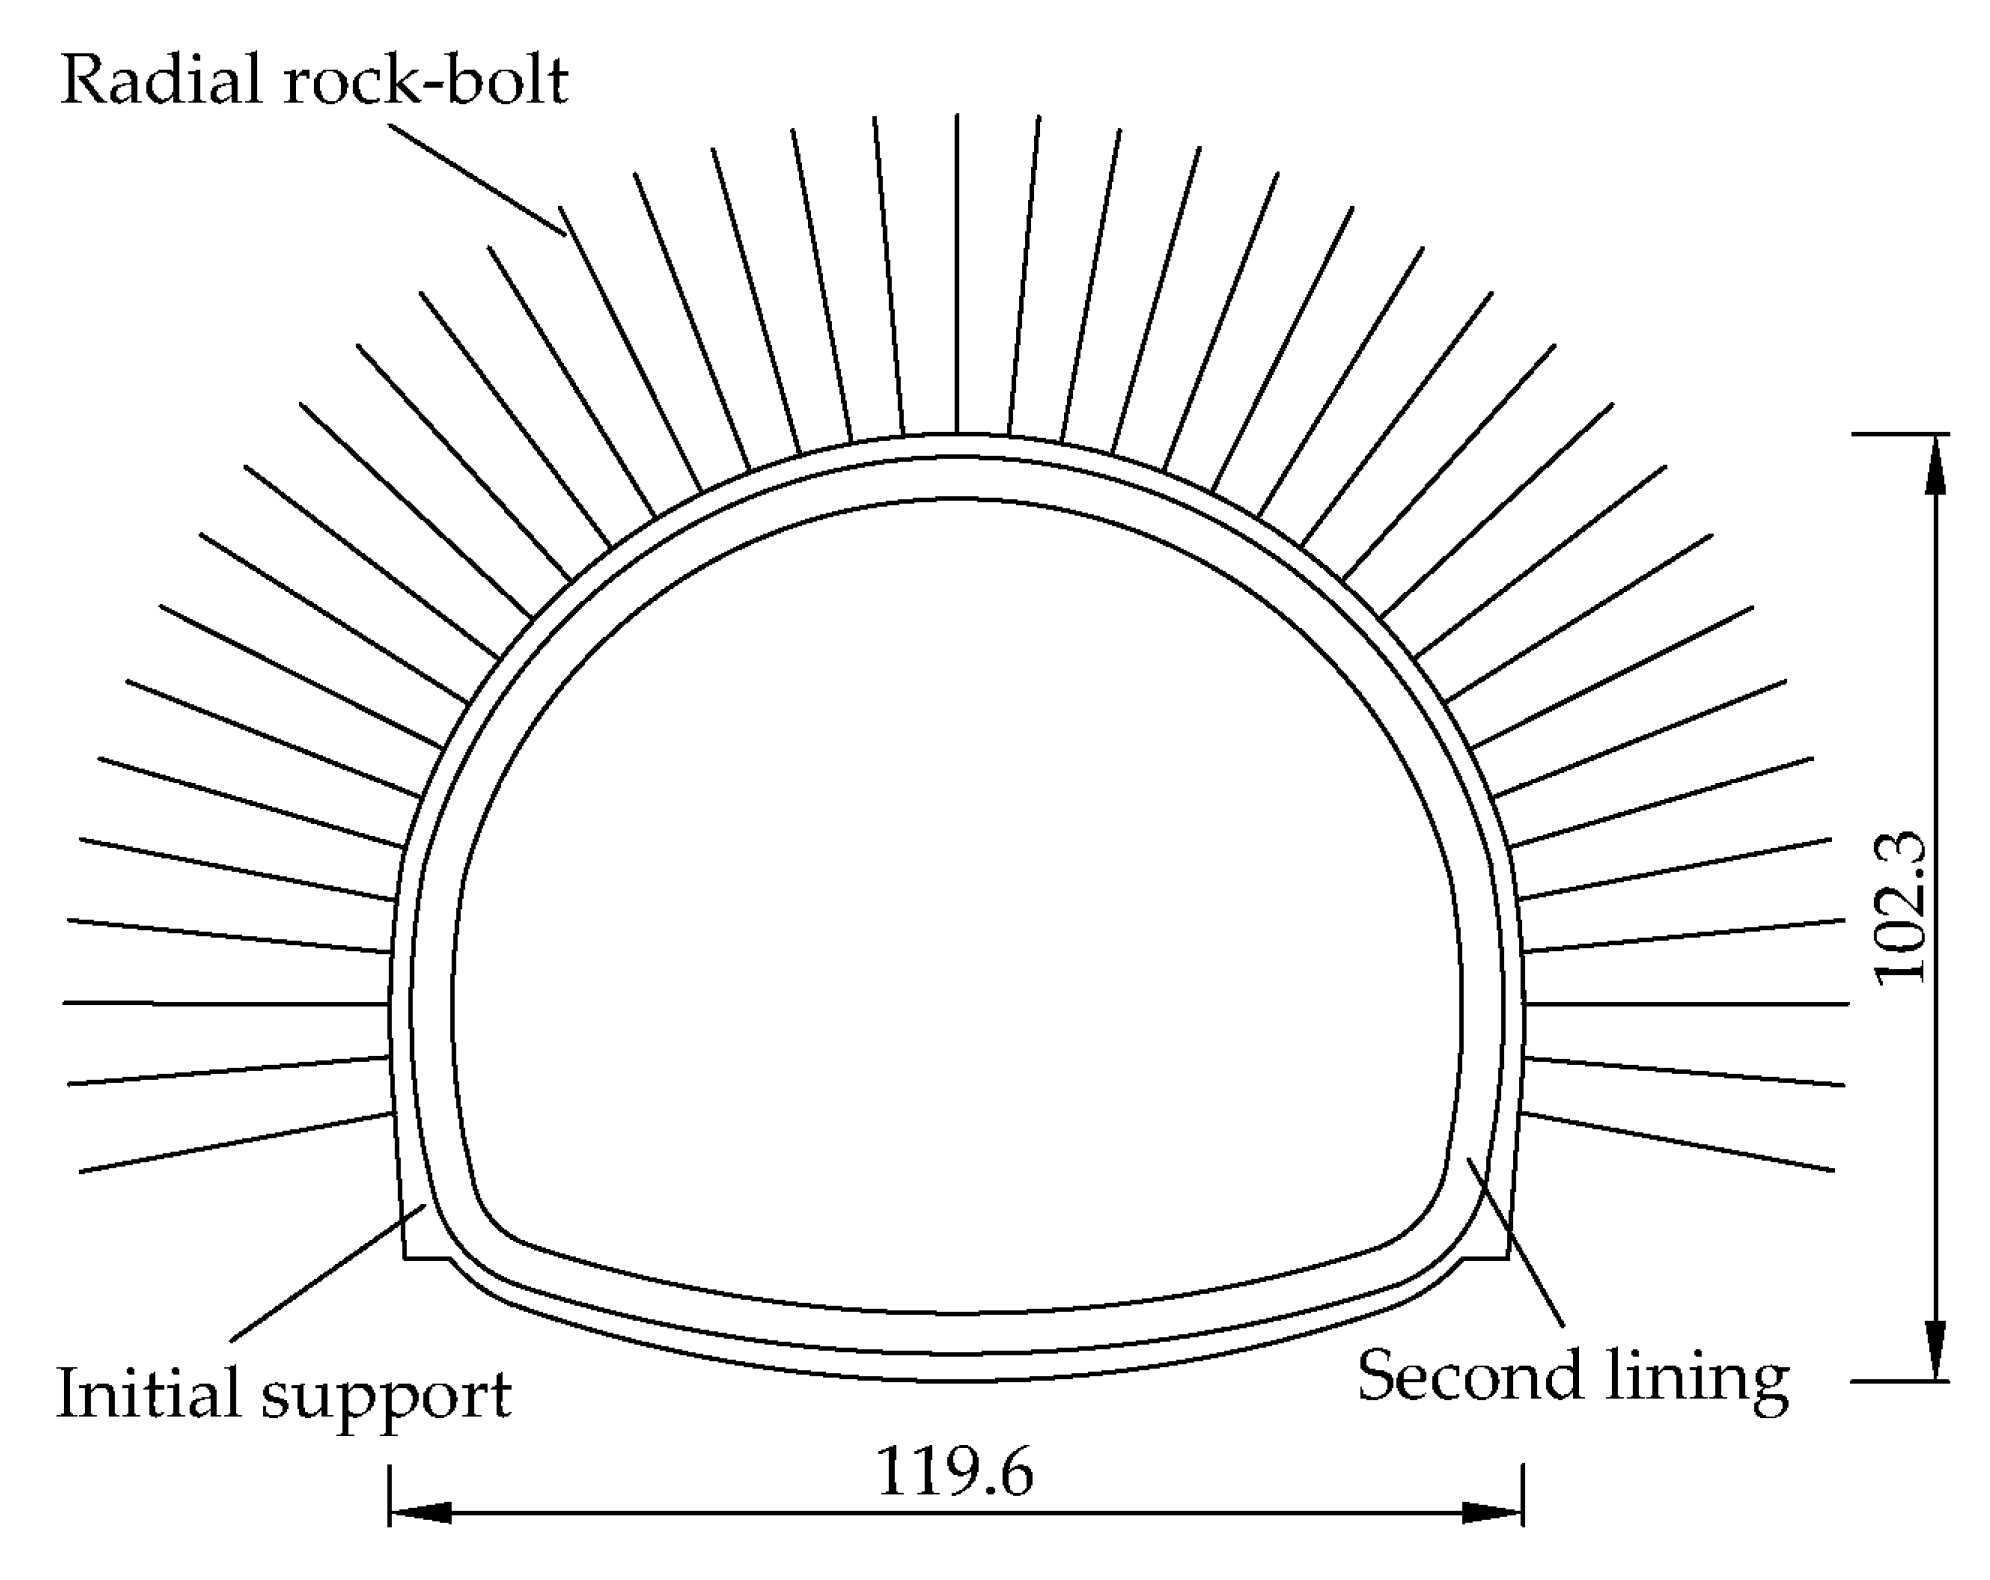
In this paper, the reliability of a horseshoe-shaped soft rock tunnel is analyzed using the proposed procedure of NSGA–III–XGBoost–MCS reliability. As shown in Figure 2, the tunnel, with a height of 10.23 m and a span of 12.46 m, is located in Gansu Province, People’s Republic of China. Surrounding rock of the tunnel is fully strongly weathered granite gneiss. The design parameters of the initial support of the tunnel: length of rock bolt 25-5 = 3.5 m; spacing of grille steel frame 25 = 0.6 m; thickness of sprayed concrete = 25 cm; mesh spacing of φ8 steel = 20 × 20 cm. Design parameters of second lining of the tunnel: thickness of reinforcement = 33–45 cm.
Three-dimensional numerical simulation is performed using FLAC3D. The top of the model is considered as a free surface. The bottom boundary, the horizontal direction (X direction) boundaries and the Y direction (longitudinal direction of the tunnel) boundaries are constrained using displacement. The FDM model is 100.0 m in the horizontal direction, 20.0 m in the longitudinal direction of the tunnel and 149.2 m in the vertical direction. The lateral pressure coefficient λ = 1.2; the bulk density of surrounding rock = 24.0 kN/m3. The self-weight stress field is applied in the vertical direction of the model.
The elastic–plastic constitutive model and the Mohr–Coulomb failure criterion are used to simulate surrounding rock. The concrete lining combined with rock bolts is installed as support. The design parameters of the initial support, second lining and rock–bolt are as follows: Young’s modulus of shotcrete with grillage steel frame E IS = 26.311 GPa; Poisson’s ratio of shotcrete with grillage steel frame ν IS = 0.22; Young’s modulus of concrete lining E CL = 28.0 GPa; Poisson’s ratio of concrete lining ν CL = 0.27; Young’s modulus of rock bolt E bolt = 210.0 GPa; Poisson’s ratio of rock bolt ν bolt = 0.3.
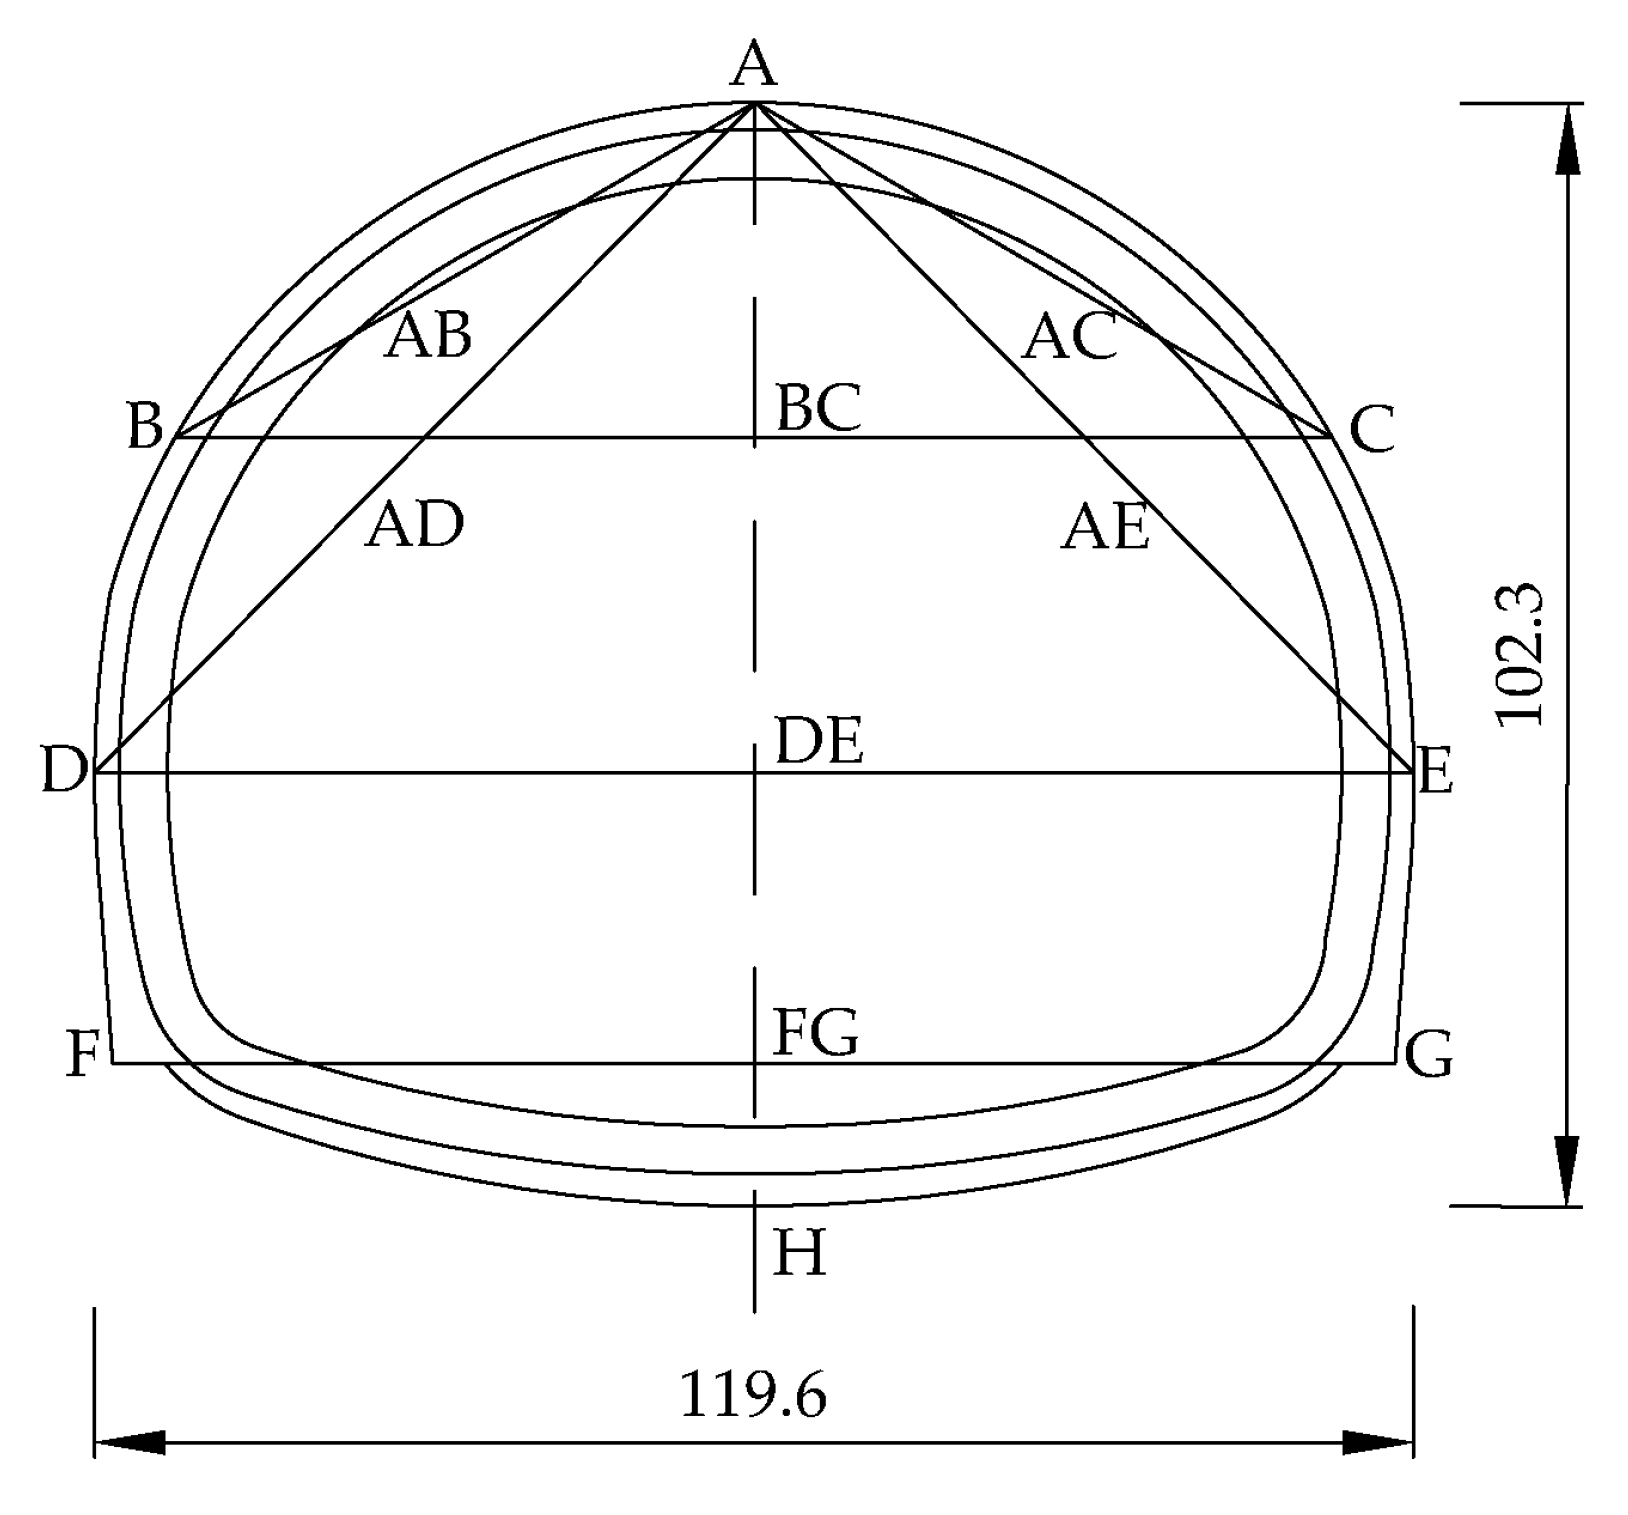
In this paper, the displacement changes of each measuring point or line under different parameters are taken as the dataset of the proposed method. The layout of measuring points or lines is shown in Figure 3.
In this paper, the properties of the initial support structure, second lining structure and rock bolt are assumed to be deterministic; E , ν , φ and c are regarded as basic random variables with statistical properties, as shown in Table 1. Firstly, the LHS method is used to generate the 1000-sample dataset of geo-mechanical parameters of surrounding rock, and then the corresponding finite difference numerical calculations based on this dataset are conducted using FLAC3D.

5.2. Performance Function and Random Variables

For simplicity, only the inward displacement of the tunnel initial concrete lining is considered to be the criterion of stability for this example. The performance function G Tunnel ( X ) is given by Equation (8). According to the Chinese Highway Tunnel Design Code, the vault settlement limit value U max in Equation (8) is set as u vmax = 0.1 m, and the displacement convergence limit values U max of Monitoring Line BC, AB, AC, AD and AE in Equation (8) are set as U BCcmax = 0.072 m, U ABcmax = U ACcmax = 0.075 m and U ADcmax = U AEcmax = 0.087 m, respectively.
G Tunnel ( X ) = U max U ( E , c , φ , ν )
where E is the Young’s modulus of rock; ν is the Poisson’s ratio of rock; φ is the friction angle of rock; c is the cohesion of rock.
The determination coefficient (R2_score) is selected as the prediction evaluation index to measure the algorithms in this paper. R2_score is denoted by Equation (9).
R 2 _ score = 1 i ( y ^ i y i ) 2 i ( y ¯ i y i ) 2
where y i is the actual value; y ^ i is the prediction value; y ¯ i is the mean of the data.

5.3. Results and Discussion

5.3.1. Comparison of Tunnel Reliability Based on NSGA–III–XGBoost, SVR and BP

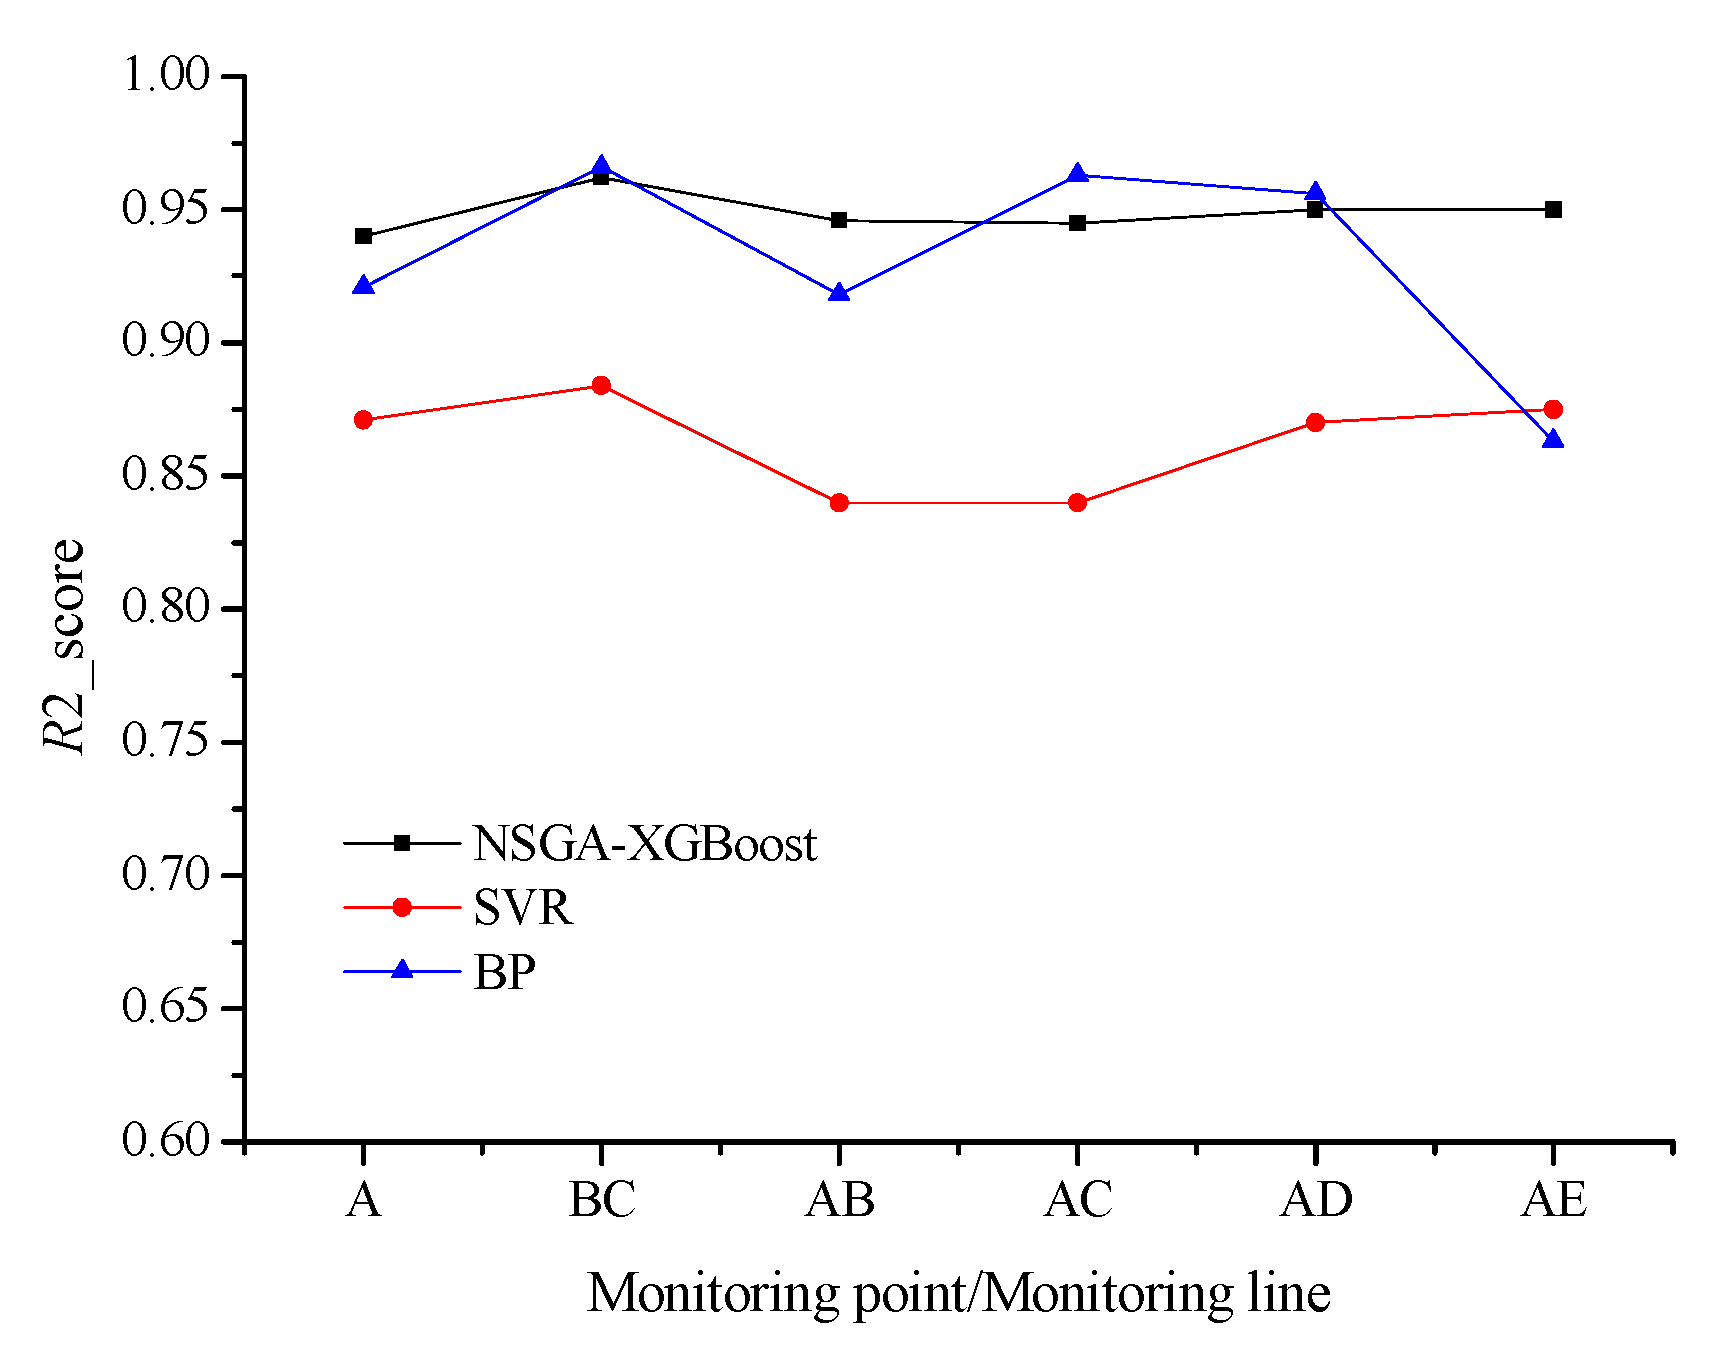
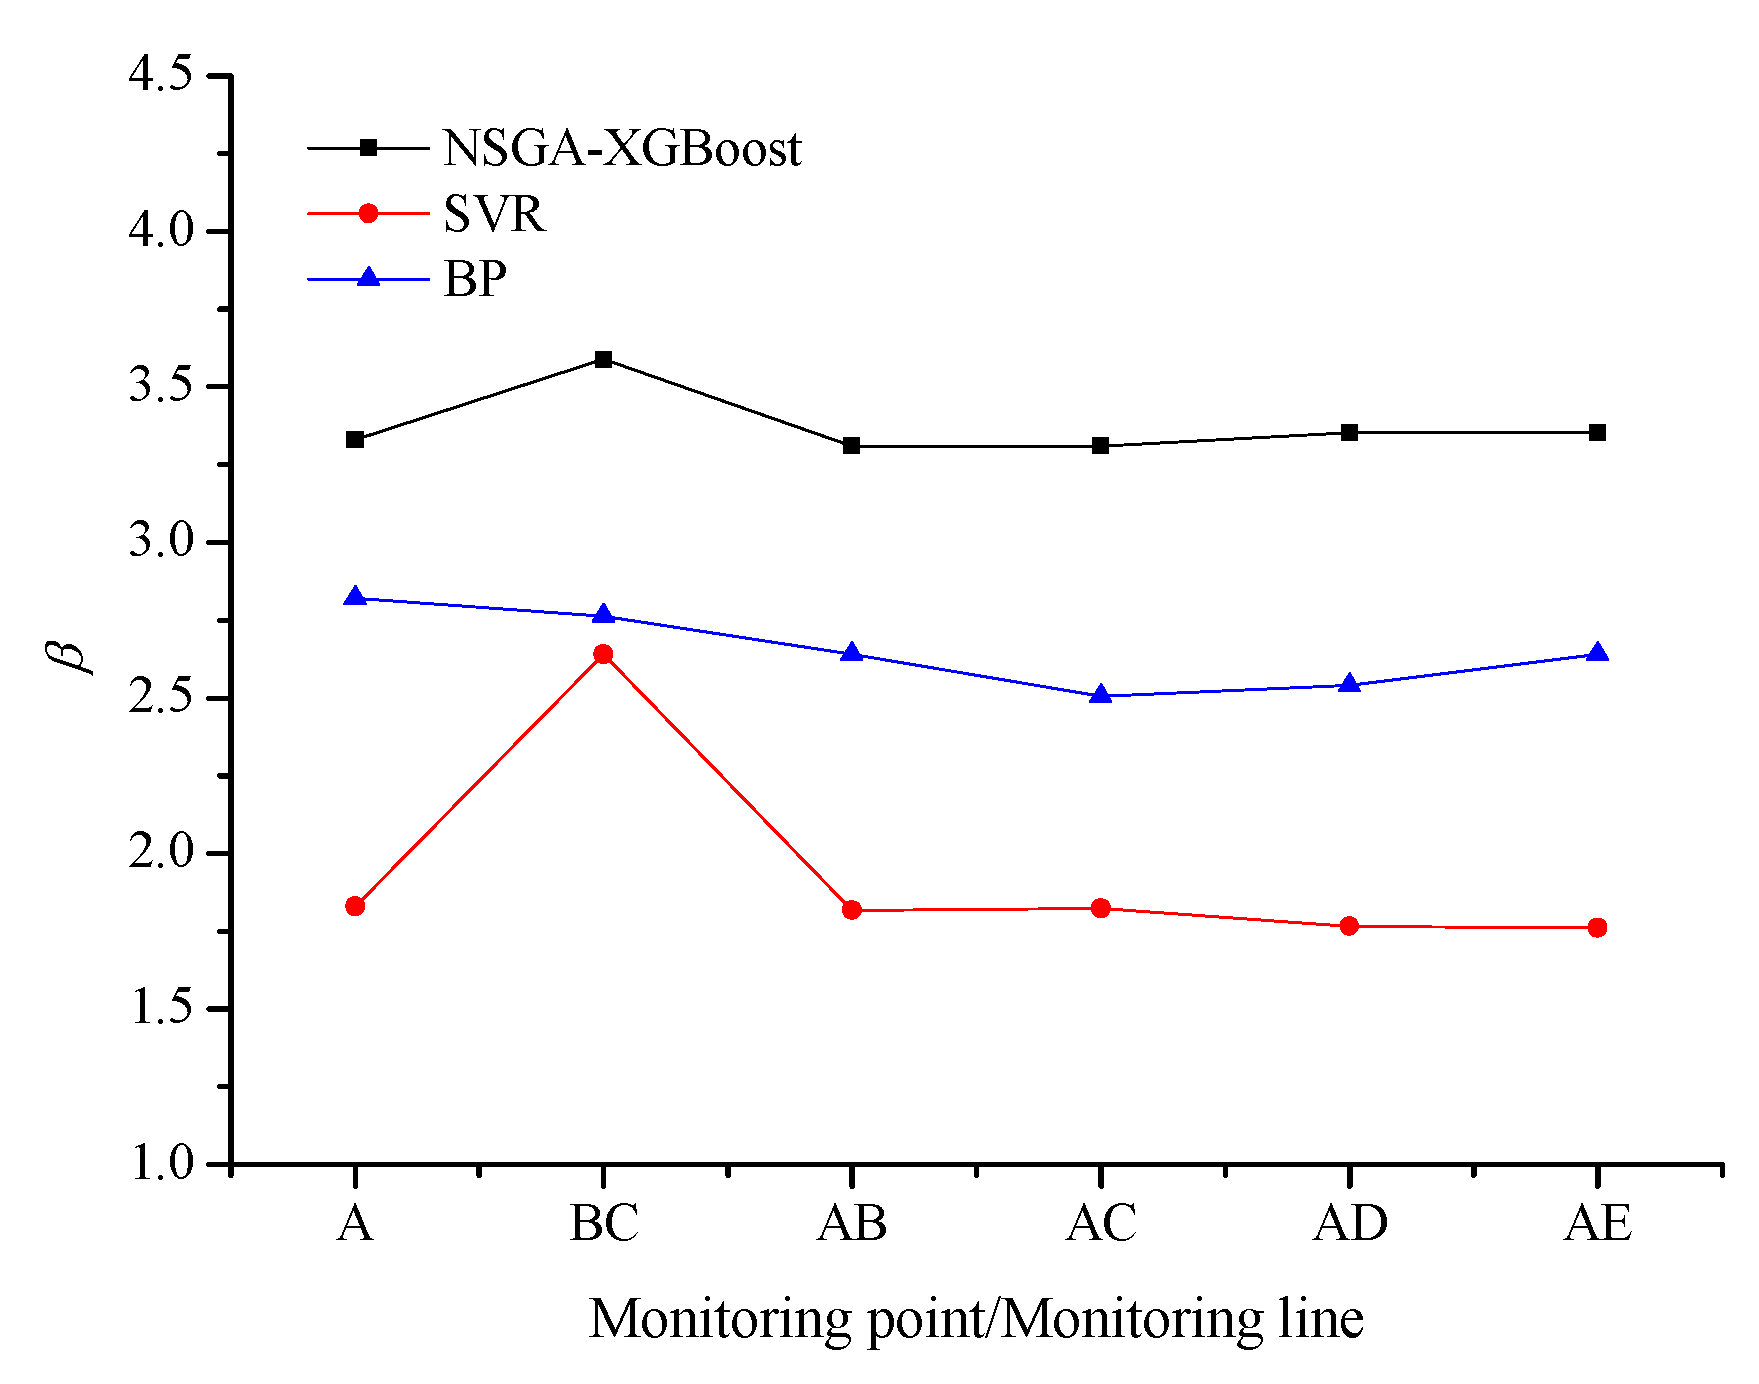
Using the same sample dataset, the nonlinear mapping surrogate model between the geo-mechanical parameters of the surrounding rock and convergence or displacement are established using NSGA–III–XGBoost, SVR (support vector regression) and BP (back propagation neural network) algorithms, respectively. Using these established surrogate models, the corresponding convergence or displacement values of Monitoring Point A, Monitoring lines BC, AB, AC, AD and AE are obtained for 30,000 samples of surrounding rock mechanical parameters generated by the LHS method. For Monitoring point A and Monitoring lines BC, AB, AC, AD and AE, the R2_score indices of the surrogate models based on NSGA–III–XGBoost, SVR and BP are shown in Figure 4. The corresponding reliability of Monitoring point A and Monitoring lines BC, AB, AC, AD and AE are calculated according to Equations (7) and (8), shown in Figure 5.
From Figure 4, we can note that the R2_score indices of NSGA–III–XGBoost-based surrogate models of Monitoring point A and Monitoring lines BC, AB, AC, AD and AE are all greater than 0.945; the R2_score indices of SVR-based surrogate models are all less than 0.89, and those of the BP-based surrogate models fluctuate between 0.863 and 0.966. Furthermore, the R2_score index of each measuring point/line based on NSGA–III–XGBoost is not less than that based on SVR or BP, and among them, the NSGA–III–XGBoost-based R2_score index values have the least fluctuation.
From Figure 5, we can note that the reliability index results of NSGA–XGBoost are relatively close to those of BP, and differ significantly from those of SVR. The NSGA–XGBoost-based reliability index results of monitoring lines AB and AC or AD and AE show very little change. Due to the symmetry of monitoring lines AB and AC or AD and AE, the reliability index of monitoring lines AB and AC or AD and AE should be the same, but there is a big difference in their BP-based results.

5.3.2. Comprehensive Reliability Index of Tunnel Initial Support Structure System

The system reliability theory is often used to estimate the failure probability range of a structural system with fewer failure elements. If it is considered that the failure of each part of tunnel initial support structure is completely related, the displacement failure probability of the section can be expressed as Equation (10).
P f _ lower = max ( P f 1 , P f 2 , P fn )
From Equation (10), we obtain the failure probability of the tunnel initial support structure as P f _ lower = 0.0467%. If the failure of each element is considered to be completely independent, the corresponding failure probability can be denoted as Equation (11).
P f _ upper = 1 i = 1 n ( 1 P f i )
From Equation (11), we obtain the failure probability of the tunnel structure as P f _ upper = 0.233 % .
Therefore, the final failure probability of the tunnel structure system in this paper is between P f _ lower and P f _ upper , and can be denoted as Equation (12).
0 . 0467 % P f 0.233 %
As the range of P f _ lower and P f _ upper is narrow, 0.14%, the average value of P f _ lower and P f _ upper of Equation (12) is taken as the point estimate value, and the corresponding comprehensive reliability index is 2.989.

6. Conclusions

A practical stochastic reliability method based on XGBoost and NSGA–III was proposed in this paper. LHS was used to prepare the sampling points for determining the geo-mechanical parameters dataset of XGBoost. The following conclusions were obtained in this paper.
  • For the tunnel initial support structure system with fewer failure elements, using the proposed NSGA–III–XGBoost–MCS method and the system reliability theory can estimate its failure probability range and determine its comprehensive reliability index.
  • The calculation time of each forward construction finite difference simulation (FDS) (three-step construction method, excavation length 12 m, and each excavation length is 1 m) is about one hour, while the calculation time of the surrogate model is generally only 30~40 s. Using NSGA–III–XGBoost to establish the surrogate model of the nonlinear mapping relationship between geo-mechanical parameters and their responses can significantly reduce the time cost of numerical simulation calculations.
  • A nonlinear mapping model with the interaction between rock mechanics parameters and displacement has been established. Then, by training the relevant XGBoost-based model to represent the displacement response model of the surrounding rock mechanical parameters, it has a lower computational cost and higher efficiency.
  • There are the obvious advantages of the calculation stability and accuracy of the proposed method (NSGA–III–XGBoost–MCS) compared with SVR and BP.
The XGBoost algorithm is suitable for use with a small number of samples. The number of samples used in this paper is only 1000, and further research will need to compare engineering cases with over 1000 samples. In further research, the proposed method also will be compared with the Bayesian updating method and deep learning algorithms, such as the deep Gaussian process and Bayesian optimization of hyperparameters, so as to find out the advantages and disadvantages of the proposed method and promote its engineering applications.
Due to the fact that one and a half months are required to complete more than 1000 3D numerical simulation calculations, this study only conducted one engineering verification. In further research, we will add more engineering cases for verification of the proposed method.

Author Contributions

J.X.: conceptualization, funding acquisition, software, supervision, writing—original draft preparation, and writing—review and editing; C.S.: software; numerical simulations, formal analysis; G.R.: investigation, resources. All authors have read and agreed to the published version of the manuscript.

Funding

This research was funded by National Natural Science Foundation of China—Yalong River Joint Fund, grant number U1765110, and China Postdoctoral Science Foundation, grant number 20060390165.

Institutional Review Board Statement

Not applicable.

Informed Consent Statement

Not applicable.

Data Availability Statement

Data are contained within this article.

Conflicts of Interest

Author Chen Sun was employed by the company POWERCHINA Chengdu Engineering Co., Ltd. Author Guorong Rui was employed by the company China Railway 20th Bureau Group Co., Ltd. The remaining authors declare that the research was conducted in the absence of any commercial or financial relationships that could be construed as a potential conflict of interest.

References

  1. Zio, E. Reliability engineering: Old problems and new challenges. Reliab. Eng. Syst. Saf. 2009, 94, 125–141. [Google Scholar] [CrossRef]
  2. Liu, X.T.; Yu, X.G.; Tong, J.C.; Wang, X.; Wang, X.L. Mixed uncertainty analysis for dynamic reliability of mechanical structures considering residual strength. Reliab. Eng. Syst. Saf. 2021, 209, 107472. [Google Scholar] [CrossRef]
  3. Xu, Z.Y.; Saleh, J.H. Machine learning for reliability engineering and safety applications: Review of current status and future opportunities. Reliab. Eng. Syst. Saf. 2021, 211, 107530. [Google Scholar] [CrossRef]
  4. Low, B.K.; Einstein, H.H. Reliability analysis of roof wedges and rockbolt forces in tunnels. Tunn. Undergr. Space Technol. 2013, 38, 1–10. [Google Scholar] [CrossRef]
  5. Jafari-Asl, J.; Ben Seghier, M.E.; Ohadi, S.; Correia, J.; Barroso, J. Reliability analysis based improved directional simulation using Harris Hawks optimization algorithm for engineering systems. Eng. Fail. Anal. 2022, 135, 106148. [Google Scholar] [CrossRef]
  6. Ben Seghier, M.E.; Mustaffa, Z.; Zayed, T. Reliability assessment of subsea pipelines under the effect of spanning load and corrosion degradation. J. Nat. Gas Sci. Eng. 2022, 102, 104569. [Google Scholar] [CrossRef]
  7. Lü, Q.; Chan, C.L.; Low, B.K. System reliability assessment for a rock tunnel with multiple failure modes. Rock Mech. Rock Eng. 2013, 46, 821–833. [Google Scholar] [CrossRef]
  8. Wang, Q.; Fang, H.B. Reliability analysis of tunnels using an adaptive RBF and a first–order reliability method. Comput. Geotech. 2018, 98, 144–152. [Google Scholar] [CrossRef]
  9. Zhao, H.B.; Ru, Z.L.; Chang, X.; Yin, S.D.; Li, S.J. Reliability analysis of tunnel using least square support vector machine. Tunn. Undergr. Space Technol. 2014, 41, 14–23. [Google Scholar] [CrossRef]
  10. Zhao, H.B. High dimension model representation-based response surface for reliability analysis of tunnel. Math. Probl. Eng. 2018, 2018, 8049139. [Google Scholar] [CrossRef]
  11. Wang, Q.; Fang, H.B.; Shen, L. Reliability analysis of tunnels using a metamodeling technique based on augmented radial basis functions. Tunn. Undergr. Space Technol. 2016, 56, 45–53. [Google Scholar] [CrossRef]
  12. Feng, L.Y.; Zhang, L.M. Assessment of tunnel face stability subjected to an adjacent tunnel. Reliab. Eng. Syst. Saf. 2021, 205, 107228. [Google Scholar] [CrossRef]
  13. Li, T.Z.; Dias, D. Tunnel face reliability analysis using active learning Kriging model–Case of a two-layer soils. J. Cent. South Univ. 2019, 26, 1735–1746. [Google Scholar] [CrossRef]
  14. Do, D.P.; Tran, N.T.; Mai, V.T.; Hoxha, D.; Vu, M.N. Time–dependent reliability analysis of deep tunnel in the viscoelastic Burger rock with sequential installation of liners. Rock Mech. Rock Eng. 2020, 53, 1259–1285. [Google Scholar] [CrossRef]
  15. Liu, W.; Chen, E.; Yao, E.; Wang, Y.; Chen, Y. Reliability analysis of face stability for tunnel excavation in a dependent system. Reliab. Eng. Syst. Saf. 2021, 206, 107306. [Google Scholar] [CrossRef]
  16. Liu, H.; Low, B.K. System reliability analysis of tunnels reinforced by rockbolts. Tunn. Undergr. Space Technol. 2017, 65, 155–166. [Google Scholar] [CrossRef]
  17. Chakraborty, S.; Majumder, D. Hybrid reliability analysis framework for reliability analysis of tunnels. J. Comput. Civil Eng. 2018, 32, 04018018. [Google Scholar] [CrossRef]
  18. Langford, J.C.; Diederichs, M.S. Reliability based approach to tunnel lining design using a modified point estimate method. Int. J. Rock Mech. Min. 2013, 60, 263–276. [Google Scholar] [CrossRef]
  19. Su, Y.; Yang, M.H.; Su, Y.H.; Liang, B. Calculation for reliability of deep tunnel lining through optimization method of Kriging interpolation in collaboration with genetic algorithm. Rock Soil Mech. 2013, 34, 2661–2666. [Google Scholar]
  20. Ji, J.; Zhang, Z.; Wu, Z. An efficient probabilistic design approach for tunnel face stability by inverse reliability analysis. Geosci. Front. 2021, 12, 380–389. [Google Scholar] [CrossRef]
  21. Wang, Y.; Gao, Y.; Liu, Y. Bayesian–entropy gaussian process for constrained metamodeling. Reliab. Eng. Syst. Saf. 2021, 214, 107762. [Google Scholar] [CrossRef]
  22. Jerez, D.J.; Jensen, H.A.; Beer, M. An effective implementation of reliability methods for Bayesian model updating of structural dynamic models with multiple uncertain parameters. Reliab. Eng. Syst. Saf. 2022, 225, 108634. [Google Scholar] [CrossRef]
  23. Xu, J.C.; Jiang, Y.; Yang, C.B. Landslide displacement prediction during the sliding process using XGBoost, SVR and RNNs. Appl. Sci. 2022, 12, 6056. [Google Scholar] [CrossRef]
  24. Bui, H.G.; Cao, B.T.; Freitag, S.; Hackl, K.; Meschke, G.S. Surrogate modeling for interactive tunnel track design using the cut finite element method. Eng. Comput.–Germany 2023, 39, 4025–4043. [Google Scholar] [CrossRef]
  25. Jain, H.; Deb, K. An evolutionary many-objective optimization algorithm using reference-point based nondominated sorting approach, Part II: Handling constraints and extending to an adaptive approach. IEEE Trans. Evolut. Comput. 2014, 18, 602–622. [Google Scholar] [CrossRef]
  26. Chen, T.; Guestrin, C. XGBoost: A scalable tree boosting system. In Proceedings of the 22nd ACM SIGKDD International Conference on Knowledge Discovery and Data Mining, San Francisco, CA, USA, 13–17 August 2016; pp. 785–794. [Google Scholar]
  27. Zhou, J.; Qiu, Y.G.; Zhu, S.L.; Armaghani, D.J.; Khandelwal, M.; Mohamad, E.T. Estimation of the TBM advance rate under hard rock conditions using XGBoost and Bayesian optimization. Undergr. Space 2021, 6, 506–515. [Google Scholar] [CrossRef]
  28. Xu, J.C.; Wen, H.Y.; Sun, C.; Yang, C.B.; Rui, G.R. Numerical simulation of non-stationary parameter creep large deformation mechanism of deep soft rock tunnel. Appl. Sci. 2022, 12, 5311. [Google Scholar] [CrossRef]
  29. Deb, K.; Jain, H. An evolutionary many-objective optimization algorithm using reference-point-based nondominated sorting approach, Part I: Solving problems with box constraints. IEEE Trans. Evolut. Comput. 2014, 18, 577–601. [Google Scholar] [CrossRef]
  30. Jiang, P.; Wang, C.C.; Zhou, Q.; Shao, X.Y.; Shu, L.S.; Li, X.B. Optimization of laser welding process parameters of stainless steel 316L using FEM, Kriging and NSGA-II. Adv. Eng. Softw. 2016, 99, 147–160. [Google Scholar] [CrossRef]
  31. Ardakan, M.A.; Rezvan, M.T. Multi-objective optimization of reliability-redundancy allocation problem with cold-standby strategy using NSGA-II. Reliab. Eng. Syst. Saf. 2018, 172, 225–238. [Google Scholar] [CrossRef]
Figure 1. Calculation procedure of NSGA–III–XGBoost–MCS reliability analysis.
Applsci 14 02127 g001
Figure 2. Initial support and second lining of tunnel (unit: dm).
Applsci 14 02127 g002
Figure 3. Schematic diagram of tunnel monitoring point layout (unit: dm).
Applsci 14 02127 g003
Figure 4. Comparison of R2_score index based on NSGA–XGBoost, SVR and BP.
Applsci 14 02127 g004
Figure 5. Comparison of tunnel reliability indexes calculated using NSGA–XGBoost, SVR and BP.
Applsci 14 02127 g005
Table 1. Statistical properties of rock mechanical parameters.
Random VariablesDistribution μ X i σ X i COV
ν Normal0.330.0330.1
φ Normal334.950.15
E /MPaNormal35050.50.144
c /kPaNormal210230.11
Disclaimer/Publisher’s Note: The statements, opinions and data contained in all publications are solely those of the individual author(s) and contributor(s) and not of MDPI and/or the editor(s). MDPI and/or the editor(s) disclaim responsibility for any injury to people or property resulting from any ideas, methods, instructions or products referred to in the content.