Article

Virtual Power Plant’s Optimal Scheduling Strategy in Day-Ahead and Balancing Markets Considering Reserve Provision Model of Energy Storage System

School of Electrical and Electronics Engineering, Hanoi University of Science and Technology, Hanoi 100000, Vietnam
*
Author to whom correspondence should be addressed.
Appl. Sci. 2024, 14(5), 2175; https://doi.org/10.3390/app14052175
Submission received: 27 January 2024 / Revised: 26 February 2024 / Accepted: 1 March 2024 / Published: 5 March 2024

Abstract

:
In recent years, with the rapid increase in renewable energy sources (RESs), a Virtual Power Plant (VPP) concept has been developed to integrate many small-scale RESs, energy storage systems (ESSs), and customers into a unified agent in the electricity market. Optimal coordination among resources within the VPP will overcome their disadvantages and enable them to participate in both energy and balancing markets. This study considers a VPP as an active agent in reserve provision with an upward reserve capacity contract pre-signed in the balancing capacity (BC) market. Based on the BC contract’s requirements and the forecasted data of RESs and demand, a two-stage stochastic optimization model is presented to determine the VPP’s optimal scheduling in the day-ahead (DA) and balancing energy (BE) markets. The probability of reserve activation in the BE market is considered in this model. The ESS’s reserve provision model is proposed so as not to affect its schedule in the DA market. The proposed optimal scheduling model is applied to a test VPP system; then, the effects of the BC contract and the probability of reserve activation on the VPP’s trading schedule are analyzed. The results show that the proposed model has practical significance.

1. Introduction

In recent years, governments have provided many incentives to increase the proportion of renewable energy sources (RES) in the power system, such as wind or solar power. As a result, not only is the ever-increasing electricity demand satisfied but also the consumption of fossil fuel sources and greenhouse gas emissions, which are the main causes of climate change, are reduced. However, due to the inherent uncertainty in wind speed and solar radiation, it is impossible to predict the RES’ maximum available power output accurately. Therefore, preparing the operating plan and maintaining the power balance become more challenging. In addition, RESs often have a typically small rated capacity, especially rooftop PV systems whose sizing can be less than 10 kW. From the system operator’s viewpoint, it is almost impossible to control such small-scale distributed RESs; consequently, small-scale distributed RESs are not allowed to participate directly in the electricity market [1,2,3,4].
The virtual power plant (VPP) concept seems to be an appropriate solution to these issues. According to this concept, VPP can integrate many dispersed small-scale RESs and consumers and then participate in the electricity market on their behalf. From the system operator’s viewpoint, these RESs and consumers can be treated as a unified market agent acting as a supplier or a consumer (named “prosumer”) depending on the difference between RES’ available power output and actual local demand each hour. A significant advantage of this model is the ability to manage and control many resources without being limited by geographical location [5,6,7,8]. In addition, VPP can integrate flexible load and energy storage systems (ESS) and coordinate them with the operation of RES; as a result, the surplus or lack of power due to the uncertainty in RES can be eliminated. Depending on whether the technical constraints of the network connecting internal sources are considered, a VPP can be a commercial VPP (CVPP) or a technical VPP (TVPP) [8]. So far, the VPP model has been developed in several countries, such as Australia, Germany, and Canada, and the potential of this model can be shown in [9,10,11,12]. The report [9] also indicates that VPP can participate in both energy and ancillary services markets, such as providing frequency regulation or reserve power.
In the literature, many studies focus on the VPP’s optimal trading strategy in different markets, aiming to maximize the VPP’s profit [13]. Depending on the type of market the VPP participates in, different optimal scheduling models have been launched to optimally coordinate the VPP’s components and maximize the VPP’s profits. For instance, studies [14,15,16] only consider the role of VPP in the day-ahead (DA) market, while in studies [17,18], the authors assume that their VPPs participate in the joint DA and intraday (ID) markets. Some more recent studies [19,20,21,22,23,24] consider the VPP’s trading strategy in both DA and balancing markets. Note that the balancing market includes the balancing capacity (BC) market and the balancing energy (BE) market and plays an essential role in maintaining the system frequency and stabilizing power system operation. The BC market is cleared at least one day before the operating day. In this market, the reserve providers, called active agents, trade their reserve capacity. The BE market operates closer to real-time, in which the active providers’ reserve capacity is activated. Some power plants/customers can sell/buy their surplus/shortage of energy at that time in the BE market, and they are called passive agents. To participate in the BC market, the reserve providers must satisfy several requirements, such as response time or minimum bid volume [25,26,27]. Therefore, small and uncertain sources often do not participate in the BC market but only act as passive agents in the BE market. For example, VPPs in [19,20,21,22,23,24] use the BE market to correct energy deviations to their day-ahead schedule due to the inherent uncertainties in RES and loads. In this case, VPP only expects to profit from the DA market while trying to minimize the penalty cost in the BE market.
However, based on advanced information, communication technology, and control systems, VPP can now integrate many RES, ESS, and loads, so its size becomes large. In addition, due to the advantages of ESS, such as a fast response time, a high ramp rate, and the ability to adjust power output up or down flexibly [28,29,30], VPP can easily meet the BC market’s requirements and become an active reserve provider. Thus, in VPP operations, ESS plays a considerable role. In coordinating resources and customers within VPP, ESS compensates for the difference between the predicted and actual power of RES and demand. In the DA market, ESS will store electricity during low-priced hours and discharge during high-priced hours; consequently, VPP can profit from energy arbitrage. In the balancing market, ESS is also an effective source, providing a part of VPP’s upward/downward reserve. A proper optimal scheduling model can ensure that ESS performs well in the above roles. Unfortunately, in recent studies, the role of ESS has not been emphasized. In [31,32,33,34,35], VPP acts as a reserve provider (RP) that always holds a part of its capacity available to make adjustments if needed. In [36], the authors propose a trading strategy in which VPP can be both passive and active agents to get more profit based on the dual-price formation of the balancing market. However, in these studies, the VPP’s upward/downward reserve provision ability is almost based on the capacity adjustment of RESs and flexible demand. As in [37,38], VPPs provide peak shaving and valley filling services for a distribution system, where providing peak regulation service is the ESS’s sole role.
Few studies consider the role of an ESS in both energy and reserve markets [39,40,41,42]. It is easy to see that an ESS can provide upward reserve in several ways: increasing discharging power, reducing charging power, or even changing ESS status from charging to discharging. Similarly, a downward reserve can be provided by increasing charging power, reducing discharging power, or changing ESS status from discharging to charging. To the best of our knowledge, very few studies pay attention to all of these ways. In [39,40,41], ESSs only provide upward reserve by increasing discharging power and downward reserve by increasing charging power. Ref. [42] considers the reserve provision by switching the ESS state from charging to discharging and vice versa. However, the authors are only interested in the ability to adjust the ESS’s power output without considering that providing reserves will cause the ESS’s energy to change; consequently, the ESS’s operating plan in the energy market will differ from the original one. In other words, this study only considers the provision of the reserve at an opportunity level without considering its realization.
This paper proposes a two-stage optimal scheduling model of a VPP, including RESs, ESSs, and flexible demand. The VPP not only participates in the DA market but also plays an active role in the BE market. Assuming that VPP has a pre-signed upward reserve capacity contract in the BC market, the VPP’s optimal trading strategy in the DA and BE markets is determined to maximize the VPP’s profit while satisfying the BC contract’s requirements. Besides the reserve energy RESs provide, the ESSs’ ability to provide upward/downward reserve provision is also determined. The VPP’s optimal scheduling model is formulated as a two-stage stochastic optimization problem to account for the uncertainty in RESs’ available power output and demand. In addition, note that VPPs must submit a trading plan to the market operator at least one day before the actual operation date in the DA market and from one to several hours before the operating hour in the BE market. However, unlike the DA market, the probability of VPP being called in the BE market is much lower. Therefore, the optimization model in this work considers the probability of reserve activation from VPP to assess the opportunity to profit from the BE market.
The salient features of this study include the following:
  • This research presents a two-stage stochastic optimization model to determine the VPP’s optimal trading strategy in the DA and BE markets. This scheduling model considers the requirements of the pre-signed BC contract, the probability of reserve activation in the BE market, and the uncertainty in RESs and demand.
  • ESS’s reserve provisioning model is proposed to fully exploit ESS’s capacity in the BE market without affecting the operating schemes of ESS and VPP in the DA market.
  • The impacts of the BC contract and the reserve activation probability on the VPP’s optimal trading strategy are analyzed.
The rest of the paper is organized as follows: Section 2 demonstrates the operating model of VPP in the DA and balancing market, as well as the assumptions used in this paper, thereby presenting the ESS’s reserve provisioning model. Section 3 presents the mathematical formulation of the VPP’s optimal scheduling model in the DA and BE markets. Then, the proposed model is implemented on a test VPP system in Section 4. This section also collects and analyzes the computation results. Finally, Section 5 concludes the paper.

2. Problem Description

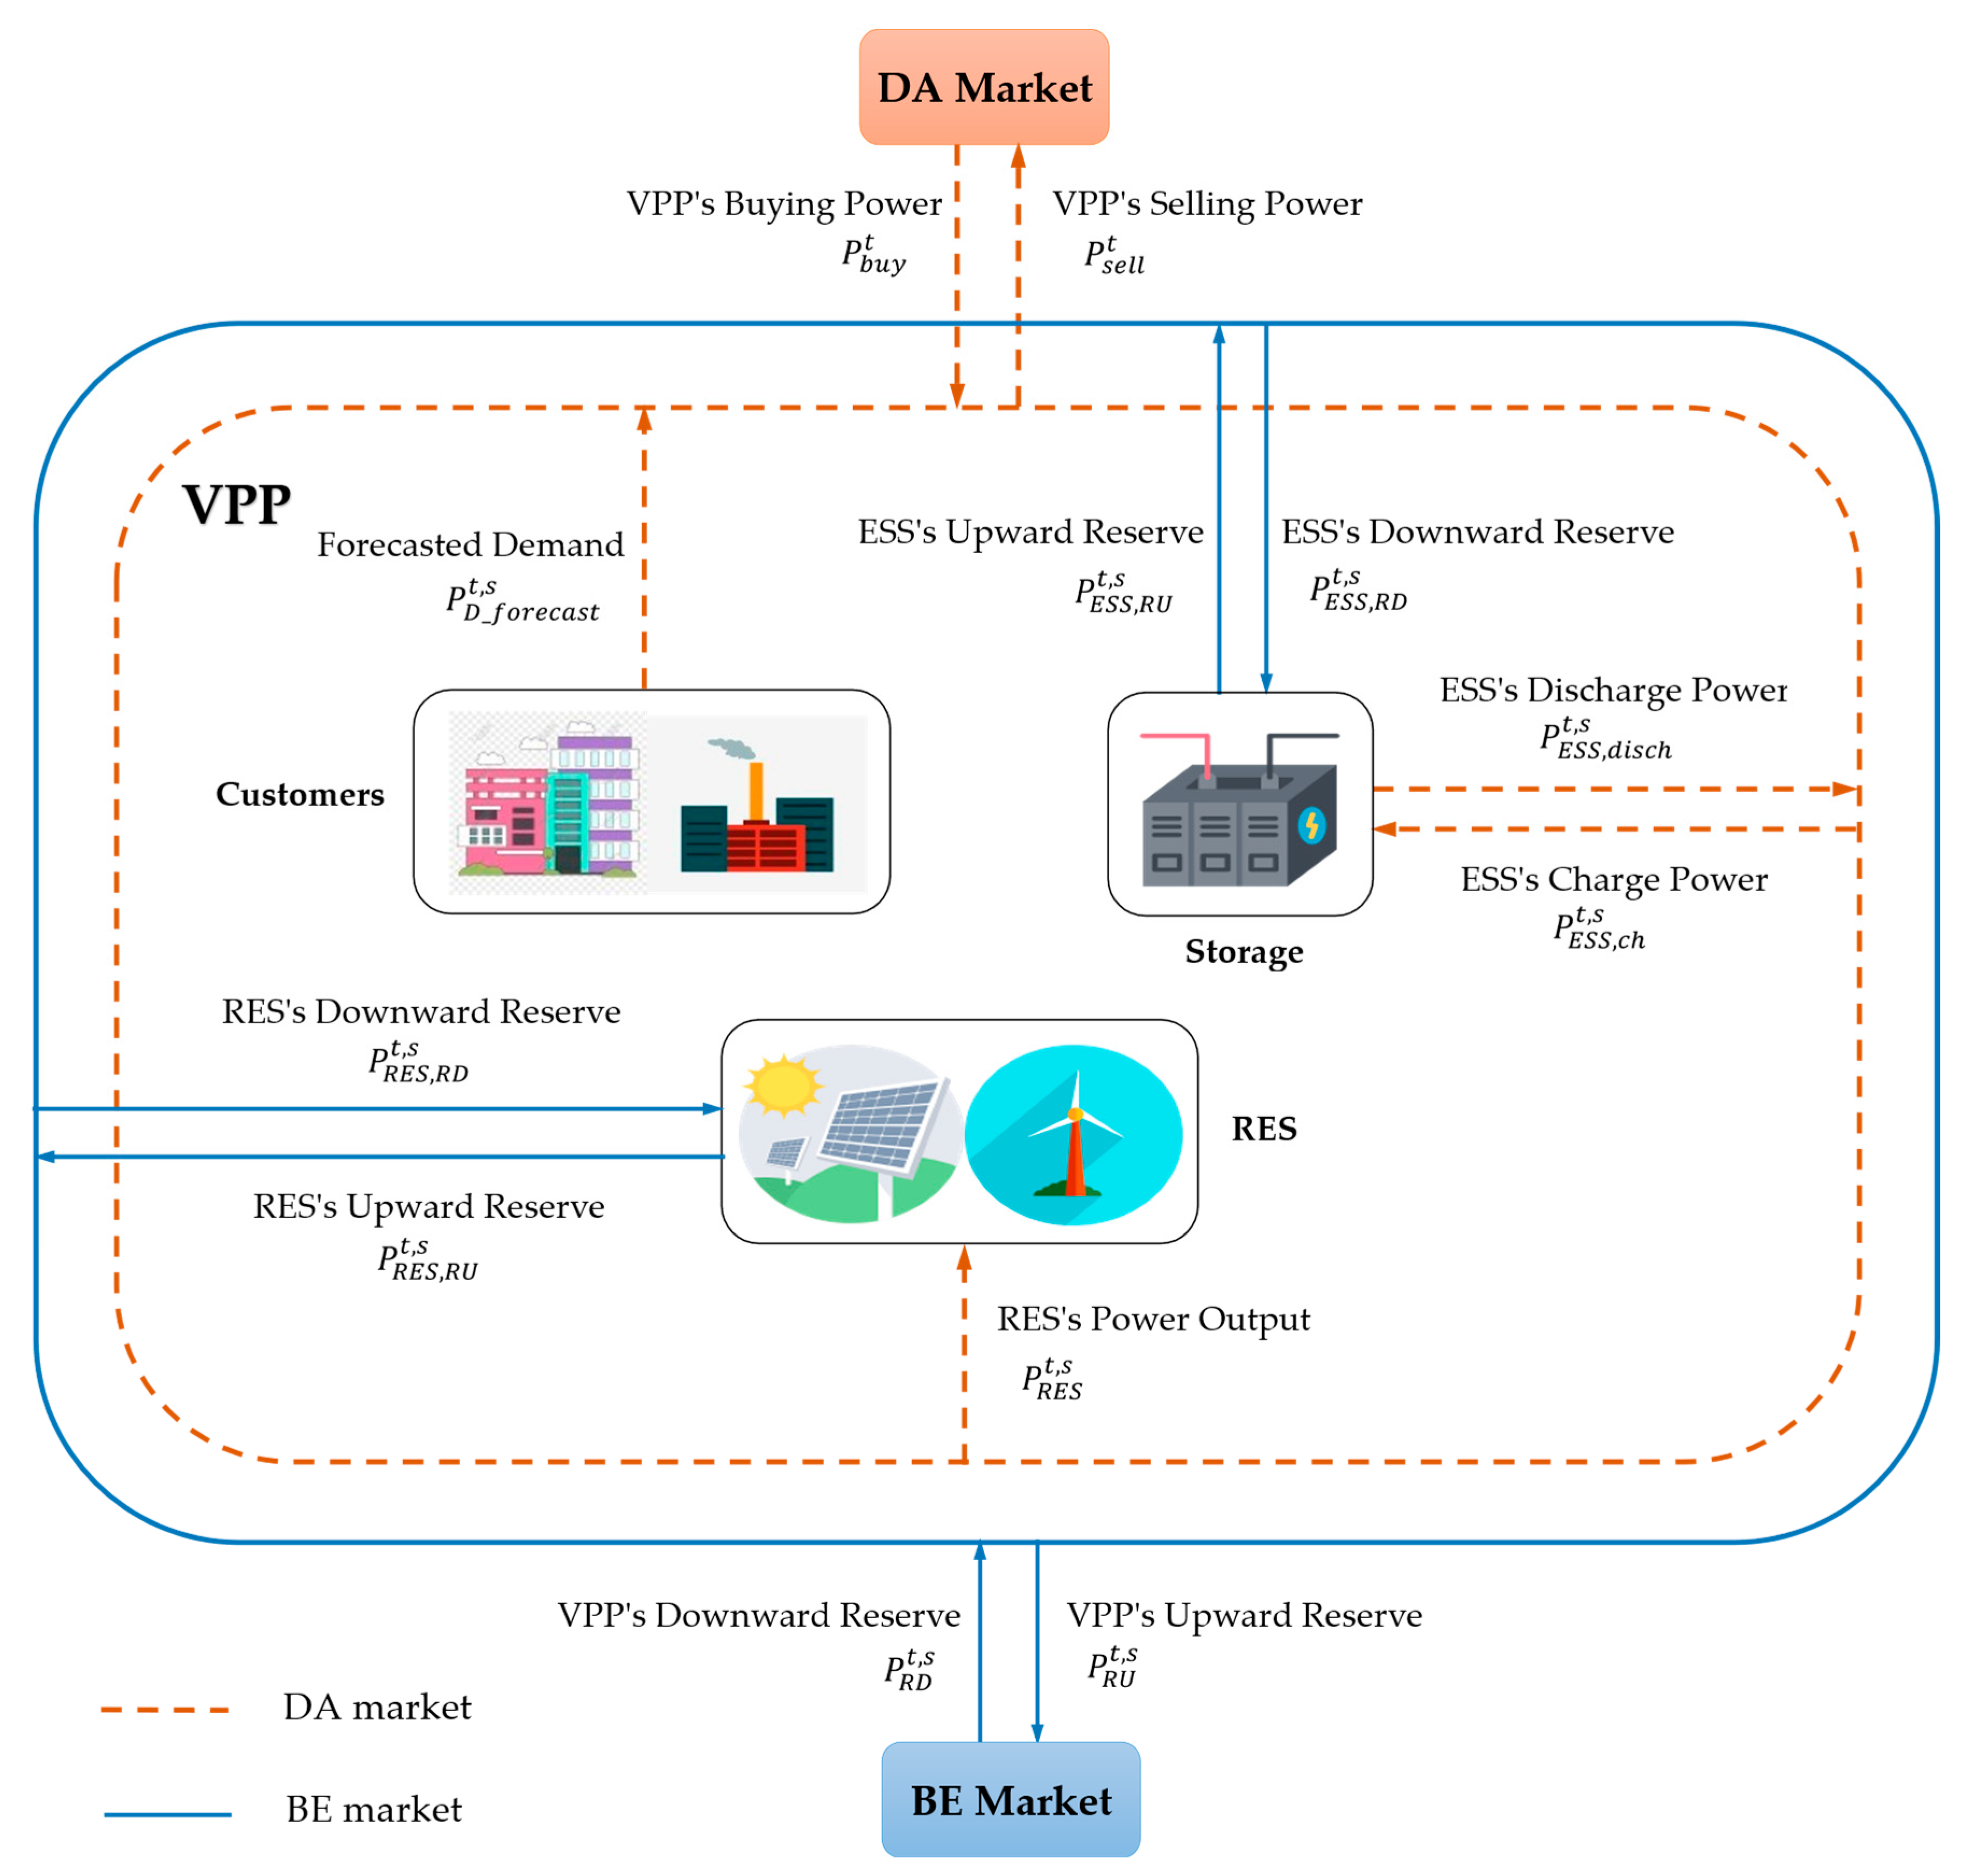
2.1. The VPP’s Trading Strategy in the Day-Ahead and Balancing Market

In power systems worldwide, balance management plays an essential role. Accordingly, the transmission system operator (TSO) must maintain the real-time balance between total production and consumption to maintain frequency and stabilize power system operation. Therefore, the customers’ consumption, as well as the available power output of traditional power plants and RESs, need to be forecasted and planned in advance via the DA market. Unfortunately, imbalances still occur due to unexpected events such as unplanned generator outages or load and RES forecasting inaccuracies. Then, TSO is responsible for correcting the imbalances via the balancing market, which includes two phases: BC market and BE market [43,44,45]. Normally, RPs should predetermine and submit their reserve capacity bids to TSO, and then the BC market is cleared several months to at least one day before the operating day. Closer to real-time, TSO activates balancing energy automatically or manually in the BE market if an imbalance occurs. Interestingly, reports [25,43,44,45,46,47] show that the BC markets in most countries only consider upward reserve capacity. By contrast, in the BE markets, the RPs can not only be called to provide upward reserve but also offer their downward reserve energy. This allows the RPs to obtain more profit from the balancing market.
This paper focuses on the optimal scheduling of a CVPP consisting of RESs, ESSs, and demand in the DA and BE markets, as shown in Figure 1. According to [9,28,48,49], a large-scale CVPP integrating multiple RES, ESSs, and flexible loads can afford to participate in the balancing market, especially when ESS has a high share in the CVPP’s power structure. Due to ESS’s ability to quickly change power, CVPP can flexibly provide both upward and downward reserves. Our previous study focused on the CVPP’s optimal upward reserve trading in the BC market [50]. Based on the BC market’s requirements and the RES and demand’s long-term forecasting data, the CVPP operator determined the reserve provisioning periods and the corresponding reserve capacity. Following the previous study, this paper pays attention to the CVPP’s trading strategy in the DA market while ensuring sufficient upward reserve capacity during the contract periods signed in the BC market.
Assuming that the CVPP has a contract to provide upward reserve over some time intervals, as shown in Figure 2, the CVPP must maintain the contracted upward volume in each quarter of an hour over contract periods. However, suppose the CVPP’s power output is redundant or the upward reserve energy price is forecast to be high. In that case, the CVPP may add another upward reserve energy trading called a non-contracted reserve. This can be implemented anytime, regardless of whether a contract exists for upward capacity. Similarly, CVPP can offer a downward reserve energy bid as a non-contracted reserve. As a result, CVPP can expect to increase its total profit by actively trading in the BE market, even though the probability of being selected for activation is very small.
The CVPP’s upward/downward reserve energy can be provided by RESs and ESSs (Figure 1). Among these sources, ESS is an effective reserve provision source because it can flexibly increase or decrease charging/discharging level, switch from charging to discharging status, and vice versa. However, unlike other resources, activating the ESS’s reserve provisioning ability not only increases/decreases its charging/discharging power but also changes its stored energy level. Note that in the CVPP’s structure, ESS is also involved in taking advantage of RES’s available power output and leveraging energy arbitrage opportunities in the DA market. For this reason, the ESS reserve provision may be limited to not affecting the operating plan submitted in advance in the DA market.
On the other hand, the CVPP’s optimal schedule in the DA and BE markets is determined based on the day-ahead hourly forecast value of RESs’ available power output and demand. However, these forecast data always contain errors regardless of the prediction method, so the CVPP’s operator should consider these errors in the optimal scheduling problem.

2.2. The CVPP’s Optimal Scheduling Problem and Assumptions

This article proposes a two-stage scheduling model to maximize the CVPP’s profit in the DA market and take full advantage of profit opportunities in the BE market while still ensuring the upward reserve capacity S R t in the BC market (Figure 3). The uncertainty in RES and demand will be considered in this model.
This model is outlined as follows:
  • In the first stage, the CVPP defines its selling/buying power P s e l l t / P b u y t on the operating day based on the day-head hourly forecasted RES power output and demand data. This trading strategy is submitted to the DA market, and changes are not allowed in real-time operations; otherwise, penalties will apply.
  • Closer to real-time, the CVPP receives the newest short-term forecast data of RES and demand. Normally, the very short-term forecasted results are quite accurate, so the CVPP can consider these values as the actual data. Hence, considering the BC contract’s requirements, the CVPP decides its upward/downward reserve energy trading strategy in the BE market each quarter hour. Also, the operating parameters of each internal resource, especially the ESS, are determined to ensure compliance with trading strategy in the energy and reserve markets.
It can be seen that the two-stage optimization model should be implemented before the DA market’s gate closure time. At that time, RESs’ available power output and customers’ consumption are uncertain and unknown. In addition, the CVPP’s operator cannot know whether the reserve capacity contracted in the BC market and upward/downward reserve energy expected to be submitted in the BE market are activated. As a result, the CVPP’s operator should allow the following assumptions:
  • All contracted upward reserve capacity and non-contracted upward/downward reserve energy bids are selected and fully activated with the probability p a c t assumed to be known in all quarter hours. To simplify the model, this article does not consider the inactivated or partially activated reserve scenarios.
  • The very short-term forecasting results of RES and demand in the second stage are handled as the sum of the day-ahead hourly forecasting values and forecasting errors.

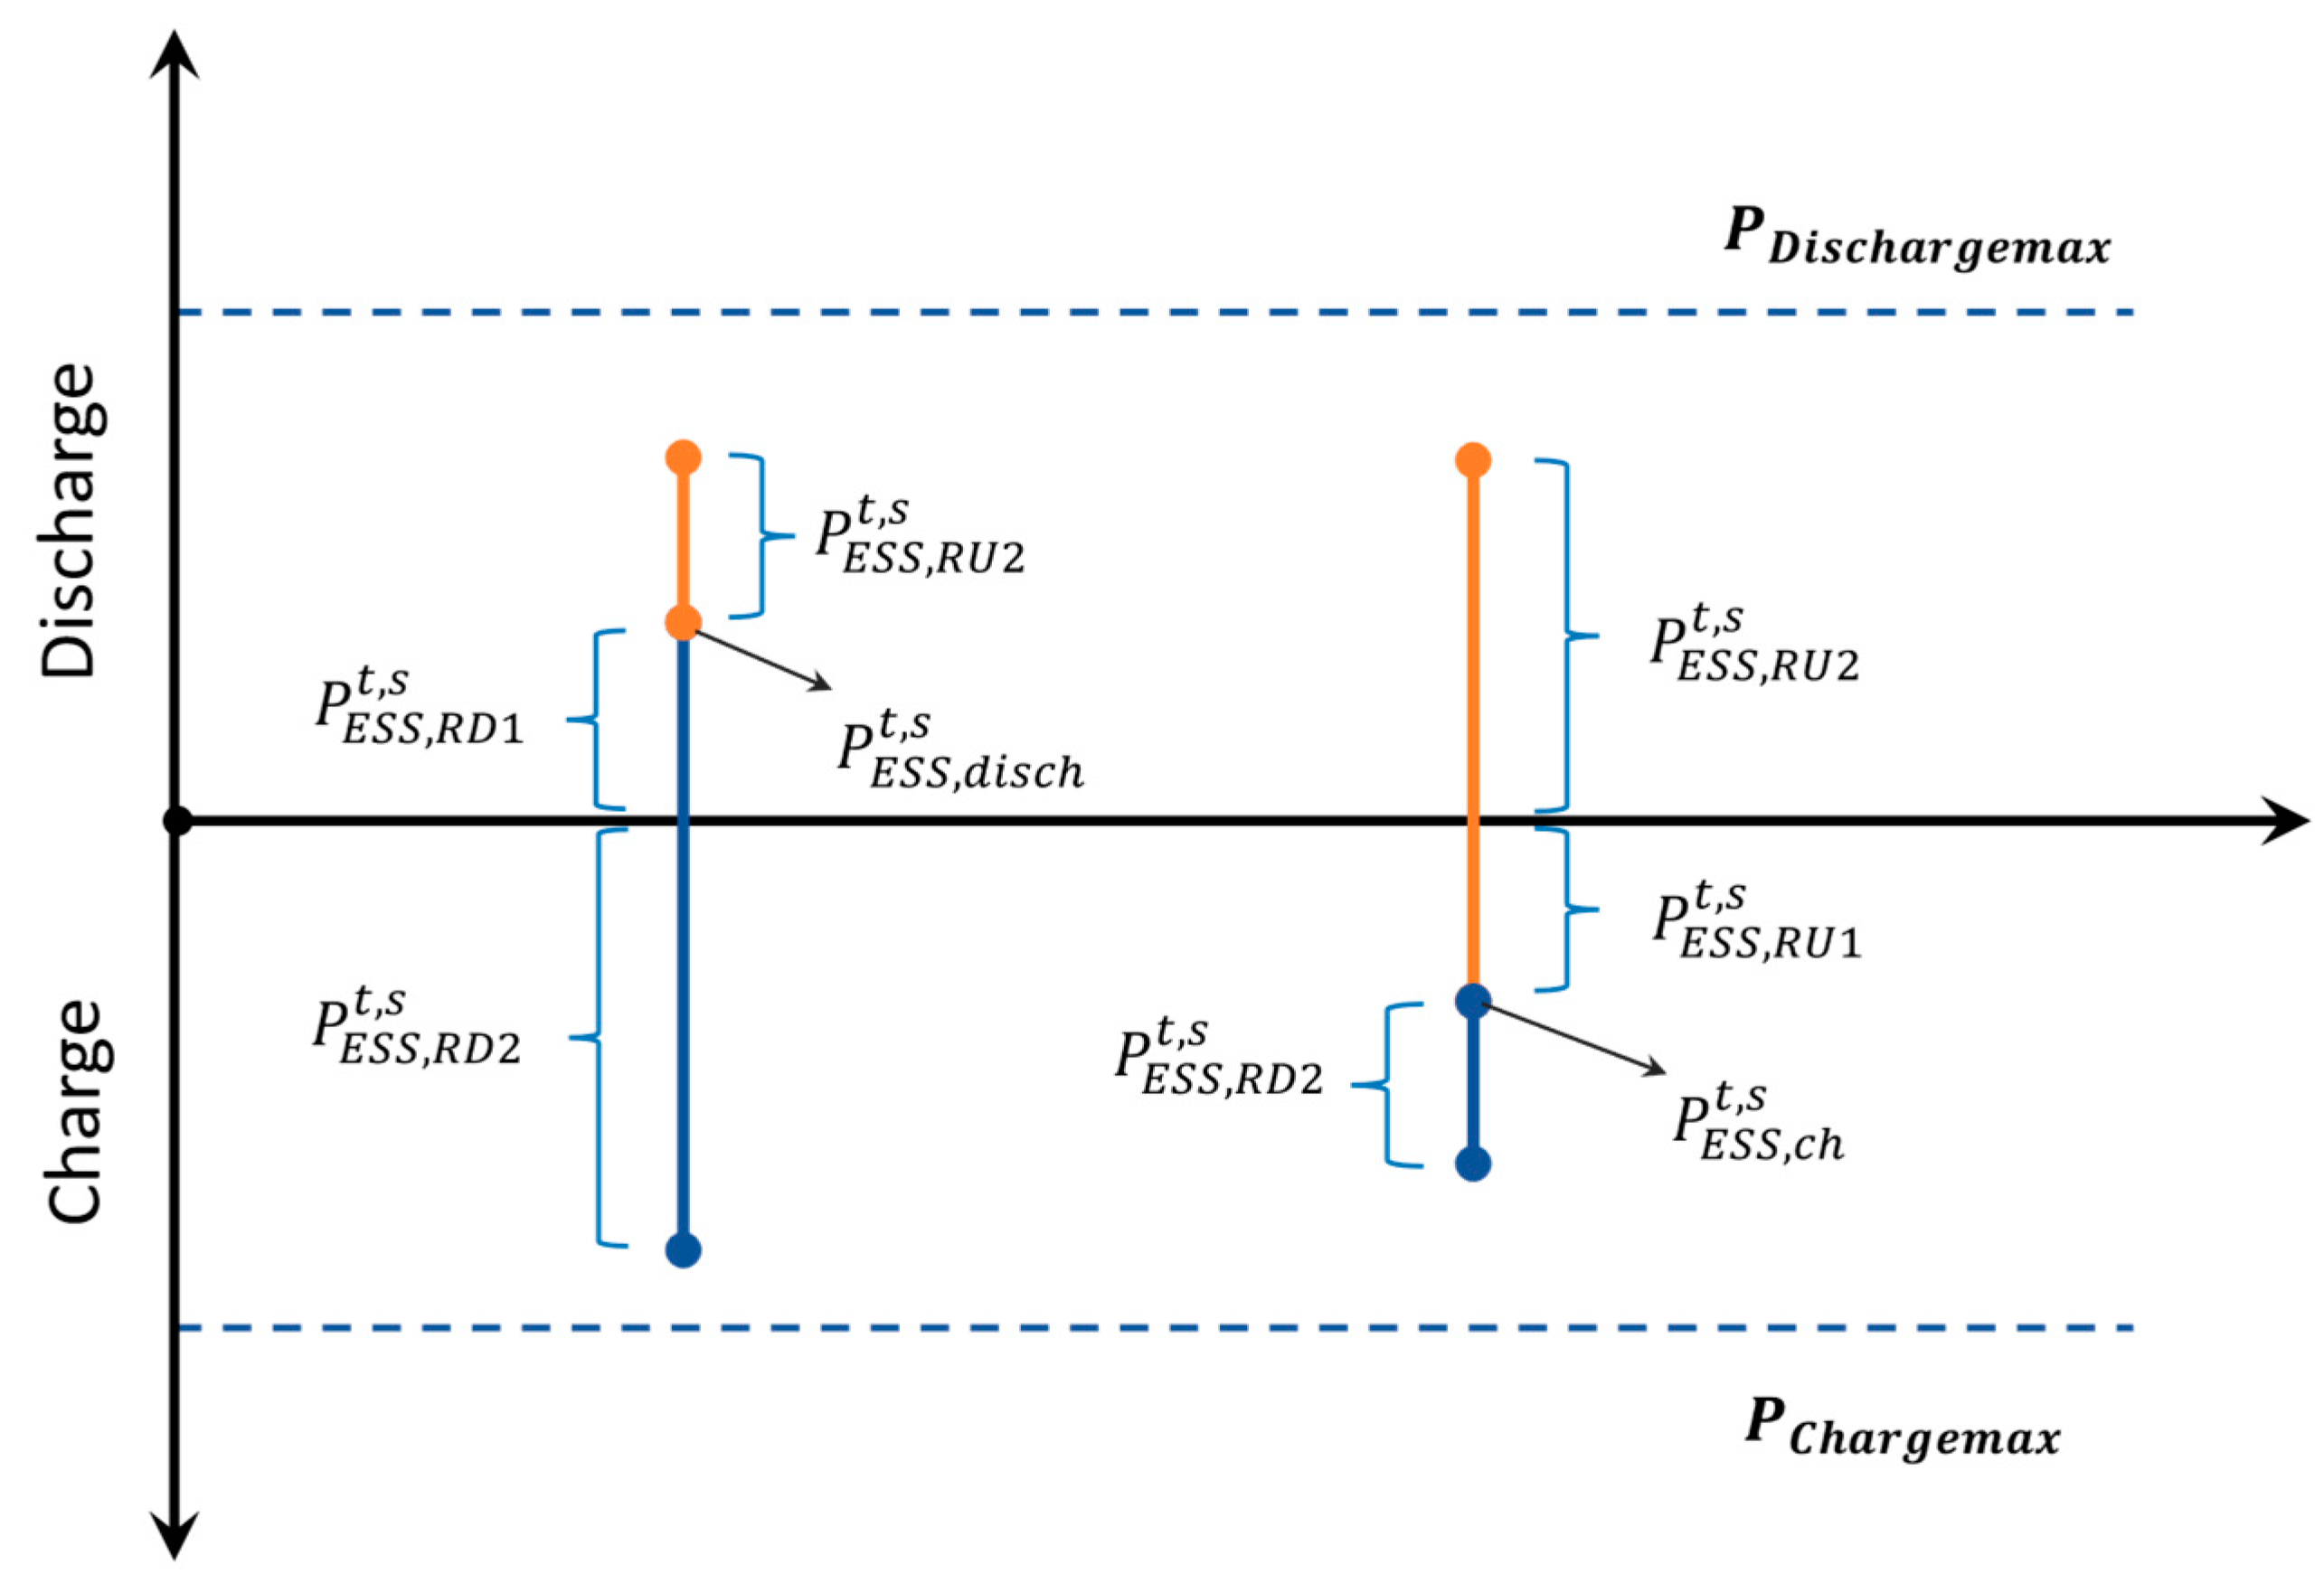
2.3. The Reserve Provision Model of ESS

As mentioned previously, ESS plays essential roles in the CVPP’s operation in the energy and reserve markets: compensating for the fluctuation of RESs’ power output and customers’ consumption, providing energy arbitrage in the energy market, and providing reserve service in the balancing market. However, ESS needs to be planned to be able to perform these roles well at the same time.
This section proposes constraints describing ESS’s status switching when providing upward/downward reserve and the association between its scheduling in the DA market and reserve provision ability. Figure 4 depicts the ESS’s ability in reserve provision depending on the type of reserve and the ESS’s state before reserve activation.
  • If TSO requests an upward reserve while the ESS is charging, the ESS’s maximum upward reserve power is P E S S , c h t , s + P E S S m a x .
  • If TSO requests an upward reserve while the ESS is discharging, the ESS’s maximum upward reserve power is P E S S m a x P E S S , d i s c h t , s .
  • If TSO requests a downward reserve while the ESS is charging, the ESS’s maximum downward reserve power is P E S S m a x P E S S , c h t , s .
  • If TSO requests a downward reserve while the ESS is discharging, the ESS’s maximum downward reserve power is P E S S m a x + P E S S , d i s c h t , s .
However, these above values are the maximum reserve volume ESS can provide to the balancing market. Actually, the ESS’s available upward/downward reserve depends on its energy level and DA operating schedule.
Assuming that at time interval t , the CVPP provides reserve energy, and the ESS contributes to this trading. Whether CVPP provides upward or downward reserve is described by binary variables u R U t , s and u R D t , s . The binary variable u R U t , s equals one if the CVPP provides upward reserve and zero otherwise. Similarly, the binary variable u R D t , s equals one if the CVPP provides a downward reserve and zero otherwise. Constraint (1) shows that CVPP cannot provide upward and downward reserve energy at the same time.
u R U t , s + u R D t , s 1
Before providing reserve energy, the ESS is scheduled in the energy market with the charging level P E S S , c h t , s or discharging level P E S S , d i s c h t , s . Binary variable u E S S t , s shows the ESS status: 1 if ESS is discharging and otherwise. After reserve activation, the ESS switches to a new status described by a binary variable u E S S a f t e r S R t , s . The type of reserve energy sold to the TSO and the ESS status before and after reserve activation lead to four situations, as shown in Figure 5 and Table 1.
Based on the set of feasible situations shown in Table 1, Equations (2)–(15) are proposed to model the ESS operation in reserve provision. Equation (2) ensures that if the ESS is requested to provide upward reserve while discharging, its new status should be the discharging state. This means that if u R U t , s = 1 then situation 2 with u E S S t , s = 1   and u E S S a f t e r S R t , s = 0 is infeasible. Similarly, if the ESS is requested to provide a downward reserve while charging, its new status should be charging state. With b i g M as a sufficiently large constant, Equations (3) and (4) ensure that at any time, the ESS can only provide one type of reserve energy: upward or downward, corresponding to the CVPP’s reserve energy trading.
u R D t , s u E S S a f t e r S R t , s u E S S t , s u R U t , s
P E S S , R D 1 t , s + P E S S , R D 2 t , s u R D t , s b i g M
P E S S , R U 1 t , s + P E S S , R U 2 t , s u R U t , s b i g M
Table 1 shows that depending on the ESS status before and after reserve activation, the amount of upward reserve provided by the ESS can be P E S S , R U 1 t , s , P E S S , R U 2 t , s or both. The limitations of these upward reserve portions are represented by Equations (5)–(8). In detail, we have the following:
  • Situation 1: In this situation, u E S S t , s and u E S S a f t e r S R t , s are equal to 1 (Table 1). Consequently, Equation (7) is non-binding while Equation (8) forces P E S S , R U 2 t , s   not to exceed P E S S m a x P E S S , d i s c h t , s . Besides, u E S S t , s = 1 means that P E S S , c h t , s = 0 , so that Equation (6) forces P E S S , R U 1 t , s to be equal to zero.
  • Situation 3: With u E S S t , s = 0   and u E S S a f t e r S R t , s = 1 , Equation (6) forces P E S S , R U 1 t , s to be equal to P E S S , c h t , s while Equation (8) ensures P E S S , R U 2 t , s   is limitted by P E S S m a x . Additionally, it can be seen that Equations (5) and (7) do not affect Equations (6) and (8).
  • Situation 4: With u E S S t , s and u E S S a f t e r S R t , s are equal to 0, Equations (6) and (8) become to be non-binding. Equation (5) limits P E S S , R U 1 t , s by P E S S , c h t , s while Equation (7) forces P E S S , R U 2 t , s to be equal to zero.
    0 P E S S , R U 1 t , s P E S S , c h t , s
    P E S S , c h t , s 1 u E S S a f t e r S R t , s u E S S t , s b i g M P E S S , R U 1 t , s P E S S , c h t , s + 1 u E S S a f t e r S R t , s u E S S t , s b i g M
    u E S S a f t e r S R t , s b i g M P E S S , R U 2 t , s u E S S a f t e r S R t , s b i g M
    1 u E S S a f t e r S R t , s b i g M P E S S , R U 2 t , s P E S S m a x P E S S , d i s c h t , s + 1 u E S S a f t e r S R t , s b i g M
Similarly, depending on each situation in Table 1, the amount of downward reserve provided by ESS can be P E S S , R D 1 t , s , P E S S , R D 2 t , s or both, and limited by Equations (9)–(12).
0 P E S S , R D 1 t , s P E S S , d i s c h t , s
P E S S , d i s c h t , s 1 u E S S t , s u E S S a f t e r S R t , s b i g M P E S S , R D 1 t , s P E S S , d i s c h t , s + 1 u E S S t , s u E S S a f t e r S R t , s b i g M
1 u E S S a f t e r S R t , s b i g M P E S S , R D 2 t , s 1 u E S S a f t e r S R t , s b i g M
u E S S a f t e r S R t , s b i g M P E S S , R D 2 t , s P E S S m a x P E S S , c h t , s + u E S S a f t e r S R t , s b i g M
Assuming that with the pre-determined operating schedule in the energy market, the ESS energy level after time interval t is E E S S , D A t , s . After providing upward/downward reserve, the ESS energy level will be changed by an amount of E E S S , S R t , s . It can be seen that E E S S , S R t , s is positive in the case of downward reserve and vice versa, negative in the case of upward reserve. Equation (13) determines the adjustment E E S S , S R t , s with η is the ESS charge/discharge efficiency and Δ t is the time interval duration. Equation (14) ensures that the ESS reserve energy provision does not affect its scheduling in the energy market. Besides, Equation (15) shows that the ESS energy level should be limited by its rated capacity at any time.
E E S S , S R t , s = E E S S , S R t 1 , s + Δ t η P E S S , R D 2 t , s + P E S S , R D 1 t , s / η Δ t η P E S S , R U 1 t , s + P E S S , R U 2 t , s / η
E E S S , S R t = 0 , s = E E S S , S R t = 96 , s = 0
0 E E S S , D A t , s + E E S S , S R t , s E E S S m a x

3. Optimization Formulation

This section proposes an optimal scheduling model of a CVPP, including RES, ESS, and flexible demand, in the DA and BE markets. This model aims to determine the CVPP’s selling/buying strategy in the DA market when information on the RESs’ available power output and customers’ consumption is only forecast data. Also, the CVPP’s reserve energy provision ability in the BE market is estimated considering the probability of the CVPP being selected to provide reserve energy. In addition, the reserve capacity contract of the CVPP in the BC market needs to be guaranteed. The operating schedule of RESs and the charging/discharging state of ESS are coordinated to maximize the total revenue of the CVPP in both the DA and BE markets.
To address the uncertainty in RES and demand, the CVPP’s optimization model is formulated as a two-stage stochastic optimization problem. The CVPP’s trading strategy in the DA market is the first-stage variable that should be determined for each hour over a 24-hour time horizon and maintained even if the actual data of RES and demand differ from the forecast results. By contrast, the CVPP’s upward/downward reserve energy in the BE market, as well as the operational parameters of RESs and ESS, can be treated as the second-stage variables. Because the BE market time unit is typically 15 min, the second-stage variables are determined with a quarter-hourly granularity. Unlike the first-stage variable, the operational parameters in the second stage will be adjusted to correspond to the actual value of the uncertain parameters. Thus, RES and demand data should be presented as a set of scenarios ( P R E S _ f o r e c a s t t , s and P D _ f o r e c a s t t , s ), considering the probability of each scenario occurring. This ensures that optimal results are reliable in real time. In this paper, the day-ahead forecast errors of RES and demand are assumed to follow a normal distribution with zeros mean. Thus, each scenario can be represented by the sum of the forecast value and a random value generated from the distribution function of the forecast error.

3.1. Objective Function

The objective function, which is to maximize the CVPP’s profit in the DA and BE markets during one day, can be expressed as follows:
M a x i m i z e   F = t T λ D A t P s e l l , D A t Δ t P b u y , D A t Δ t + p a c t s ϵ S π s λ R U t P R U t , s Δ t λ R D t P R D t , s Δ t
This objective function consists of two terms: (i) the first term is the profit obtained from the DA market; (ii) the second term is the expected profit from selling reserve services in the BE market. The probability of reserve activation p a c t is used as a weight factor in the objective function. Besides, the calculating horizon consists of 96 time blocks of 15 min.

3.2. Constraints

3.2.1. The First-Stage Constraints

In this model, the CVPP’s trading strategy in the DA market is accomplished under first-stage constraints. Equation (17) describes that RES and ESS participate in selling electricity to the system in the DA market, so their rating power should limit the CVPP’s selling power. Similarly, Equation (18) shows that the CVPP purchases power from the system to supply the customers and accumulates in the ESS; consequently, the CVPP’s buying power is limited by the sum of customers’ demand and the ESS’s maximum charging power. The binary variable u s e l l , D A t ensures that the CVPP cannot sell and buy electricity simultaneously in the DA market. Besides, the DA trading contract is determined for each 1-h interval, while each time block in the optimization model is 15 min. Hence, Equations (19) and (20) ensure that the CVPP’s trading power should be similar for four 15-min blocks of a 1-h interval.
0 P s e l l , D A t = P R E S g r i d ,   D A t , s + P E S S g r i d , D A t , s u s e l l , D A t P E S S m a x + P R E S r a t e d
0 P b u y , D A t = P g r i d l o a d , D A t , s + P g r i d E S S , D A t , s 1 u s e l l , D A t P E S S m a x + L o a d m a x
P s e l l , D A t = P s e l l , D A t τ         t 4 ;   τ = 1 ,   2 ,   3  
P b u y , D A t = P b u y , D A t τ         t 4 ;   τ = 1 ,   2 ,   3

3.2.2. The Second-Stage Constraints

In this section, the operating parameters of each component in the CVPP, as well as the CVPP’s ability in the BE market, considering uncertainties in RES and demand, are described in the second-stage constraints as follows:
  • Active power balance constraint in the DA market: Equation (21) shows that at any time t , the CVPP’s net production/consumption should equal the selling/buying power in the DA contract. Equation (22) shows that customers can be supplied by RES, ESS, or from the market.
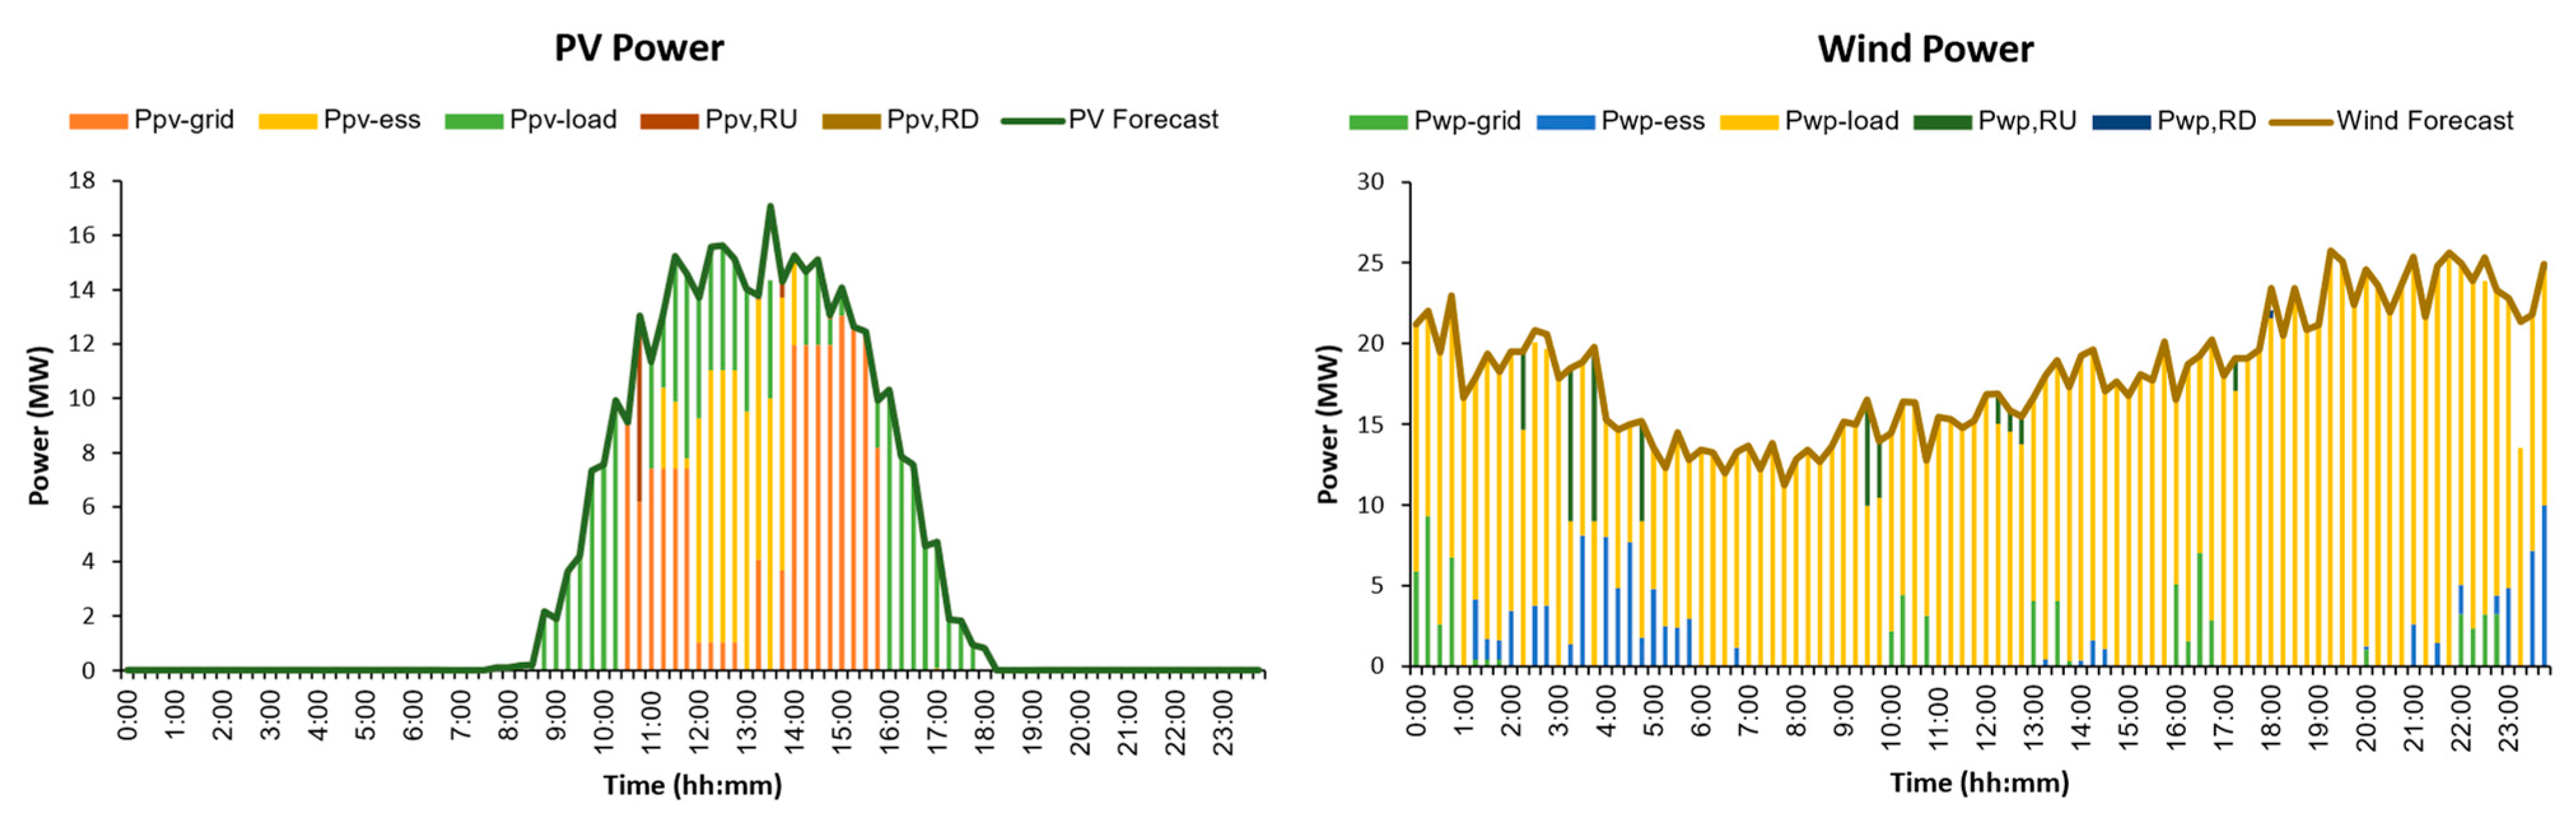
    P s e l l , D A t P b u y , D A t = P R E S t , s + P E S S , d i s c h t , s P E S S , c h t , s P D _ f o r e c a s t t , s
    P D _ f o r e c a s t t , s = P g r i d l o a d , D A t , s + P R E S l o a d t , s + P E S S l o a d t , s
  • RES operation: At time t , the RES’ actual power output corresponding to scenario s of uncertain parameters is P R E S t , s . Equation (23) shows that the upward reserve supply capacity of RES is limited by the difference between the predicted available power output P R E S f o r e c a s t t , s and the actual power output P R E S t , s . Similarly, Equation (24) shows that RES’ limitation of downward reserve capacity is the difference between the actual power output P R E S t , s and the minimum power threshold P R E S m i n . Equation (25) shows that RES provides a part of CVPP’s contract in the DA market while meeting customers’ electricity consumption in CVPP. Additionally, the excess energy from the RES can be accumulated in the ESS to utilize the RES’ available power output.
    u R E S t , s P R E S m i n P R E S t , s + P R E S , R U t , s u R E S t , s P R E S _ f o r e c a s t t , s
    u R E S t , s P R E S m i n P R E S t , s P R E S , R D t , s u R E S t , s P R E S _ f o r e c a s t t , s
    P R E S t , s = P R E S g r i d , D A t , s + P R E S l o a d t , s + P R E S E S S t , s
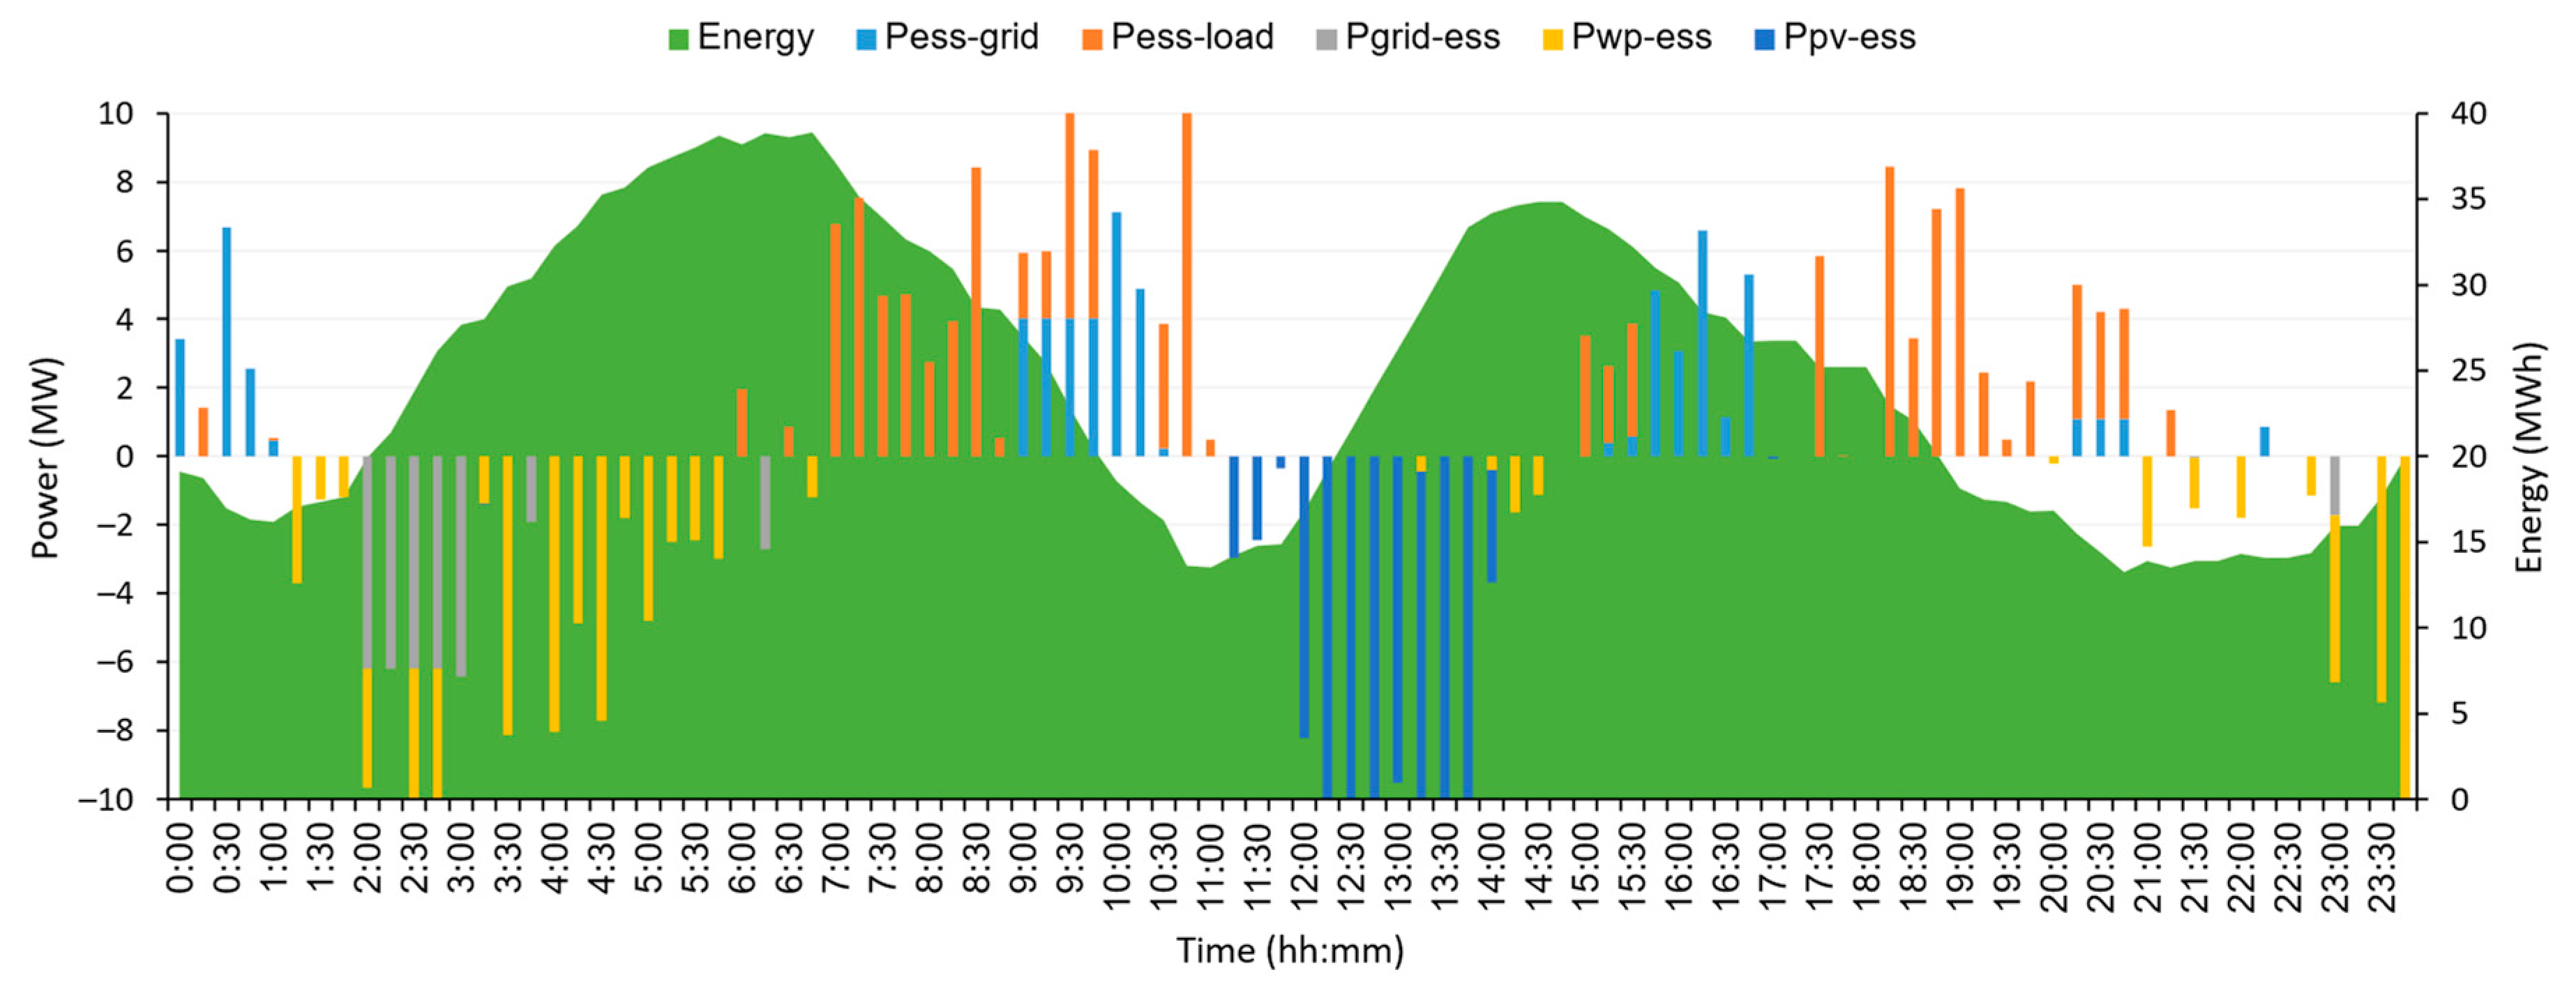
  • ESS operation: The operating model of ESS in the energy and reserve markets is described by two sets of constraints as follows:
    • The ESS operating parameters in the DA market are described in Equations (26)–(29). Equations (26) and (27) limit the ESS charging/discharging power, while Equation (28) describes the change in the ESS energy level after each time block Δ t . Equation (29) shows that the ESS energy level should be set to an initial level at the end of each day to ensure its operation the next day. This paper assumes that the initial energy level is 50% of the ESS rating capacity.
      0 P E S S , d i s c h t , s = P E S S g r i d , D A t , s + P E S S l o a d t , s u E S S t , s P E S S m a x
      0 P E S S , c h t , s = P g r i d E S S , D A t , s + P R E S E S S t , s 1 u E S S t , s P E S S m a x
      E E S S m i n E E S S , D A t , s = E E S S , D A t 1 , s + Δ t × η × P E S S , c h t , s Δ t × P E S S , d i s c h t , s / η E E S S m a x
      E E S S , D A t = 0 , s = E E S S , D A t = 96 , s = 0.5 E E S S m a x
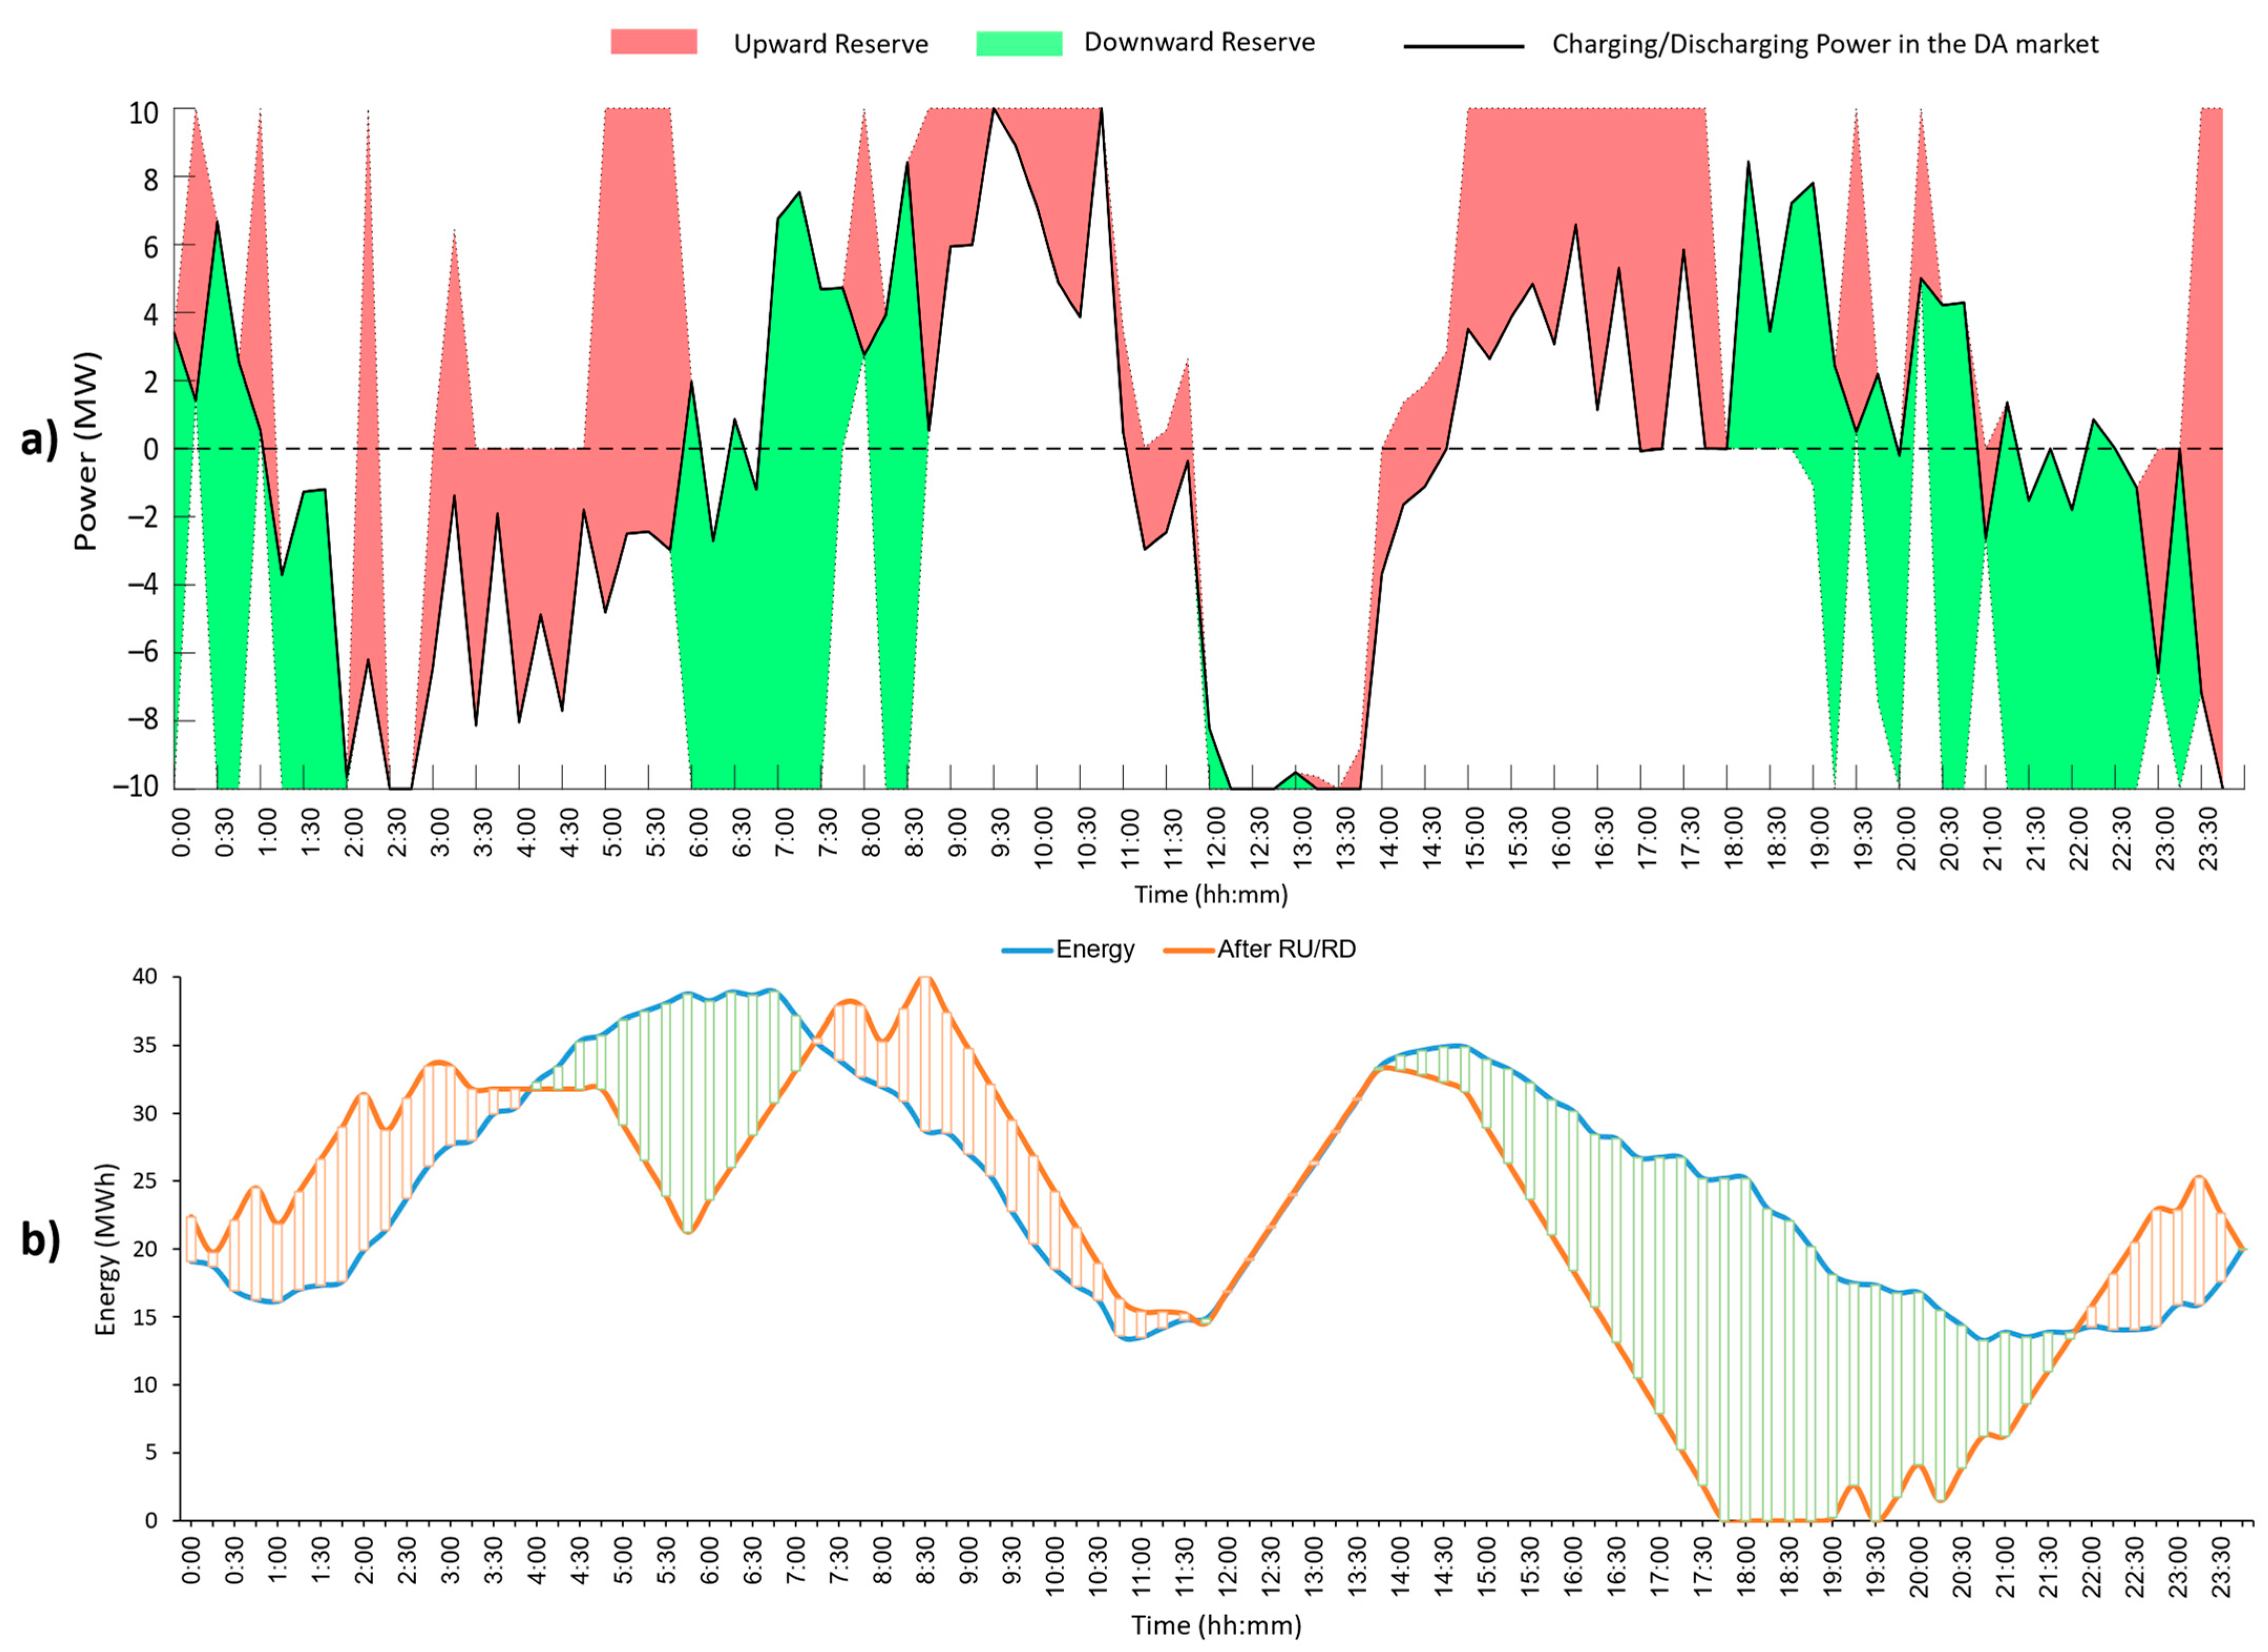
    • The association between the ESS’s upward/downward reserve provision ability in the BE market and its scheduling in the DA market, as well as its status switching, is described by Equations (2)–(15).
    • Besides, this study only focuses on the CVPP’s operating schedule within one day, so the degradation and self-discharging levels of ESS are considered negligible and can be ignored.
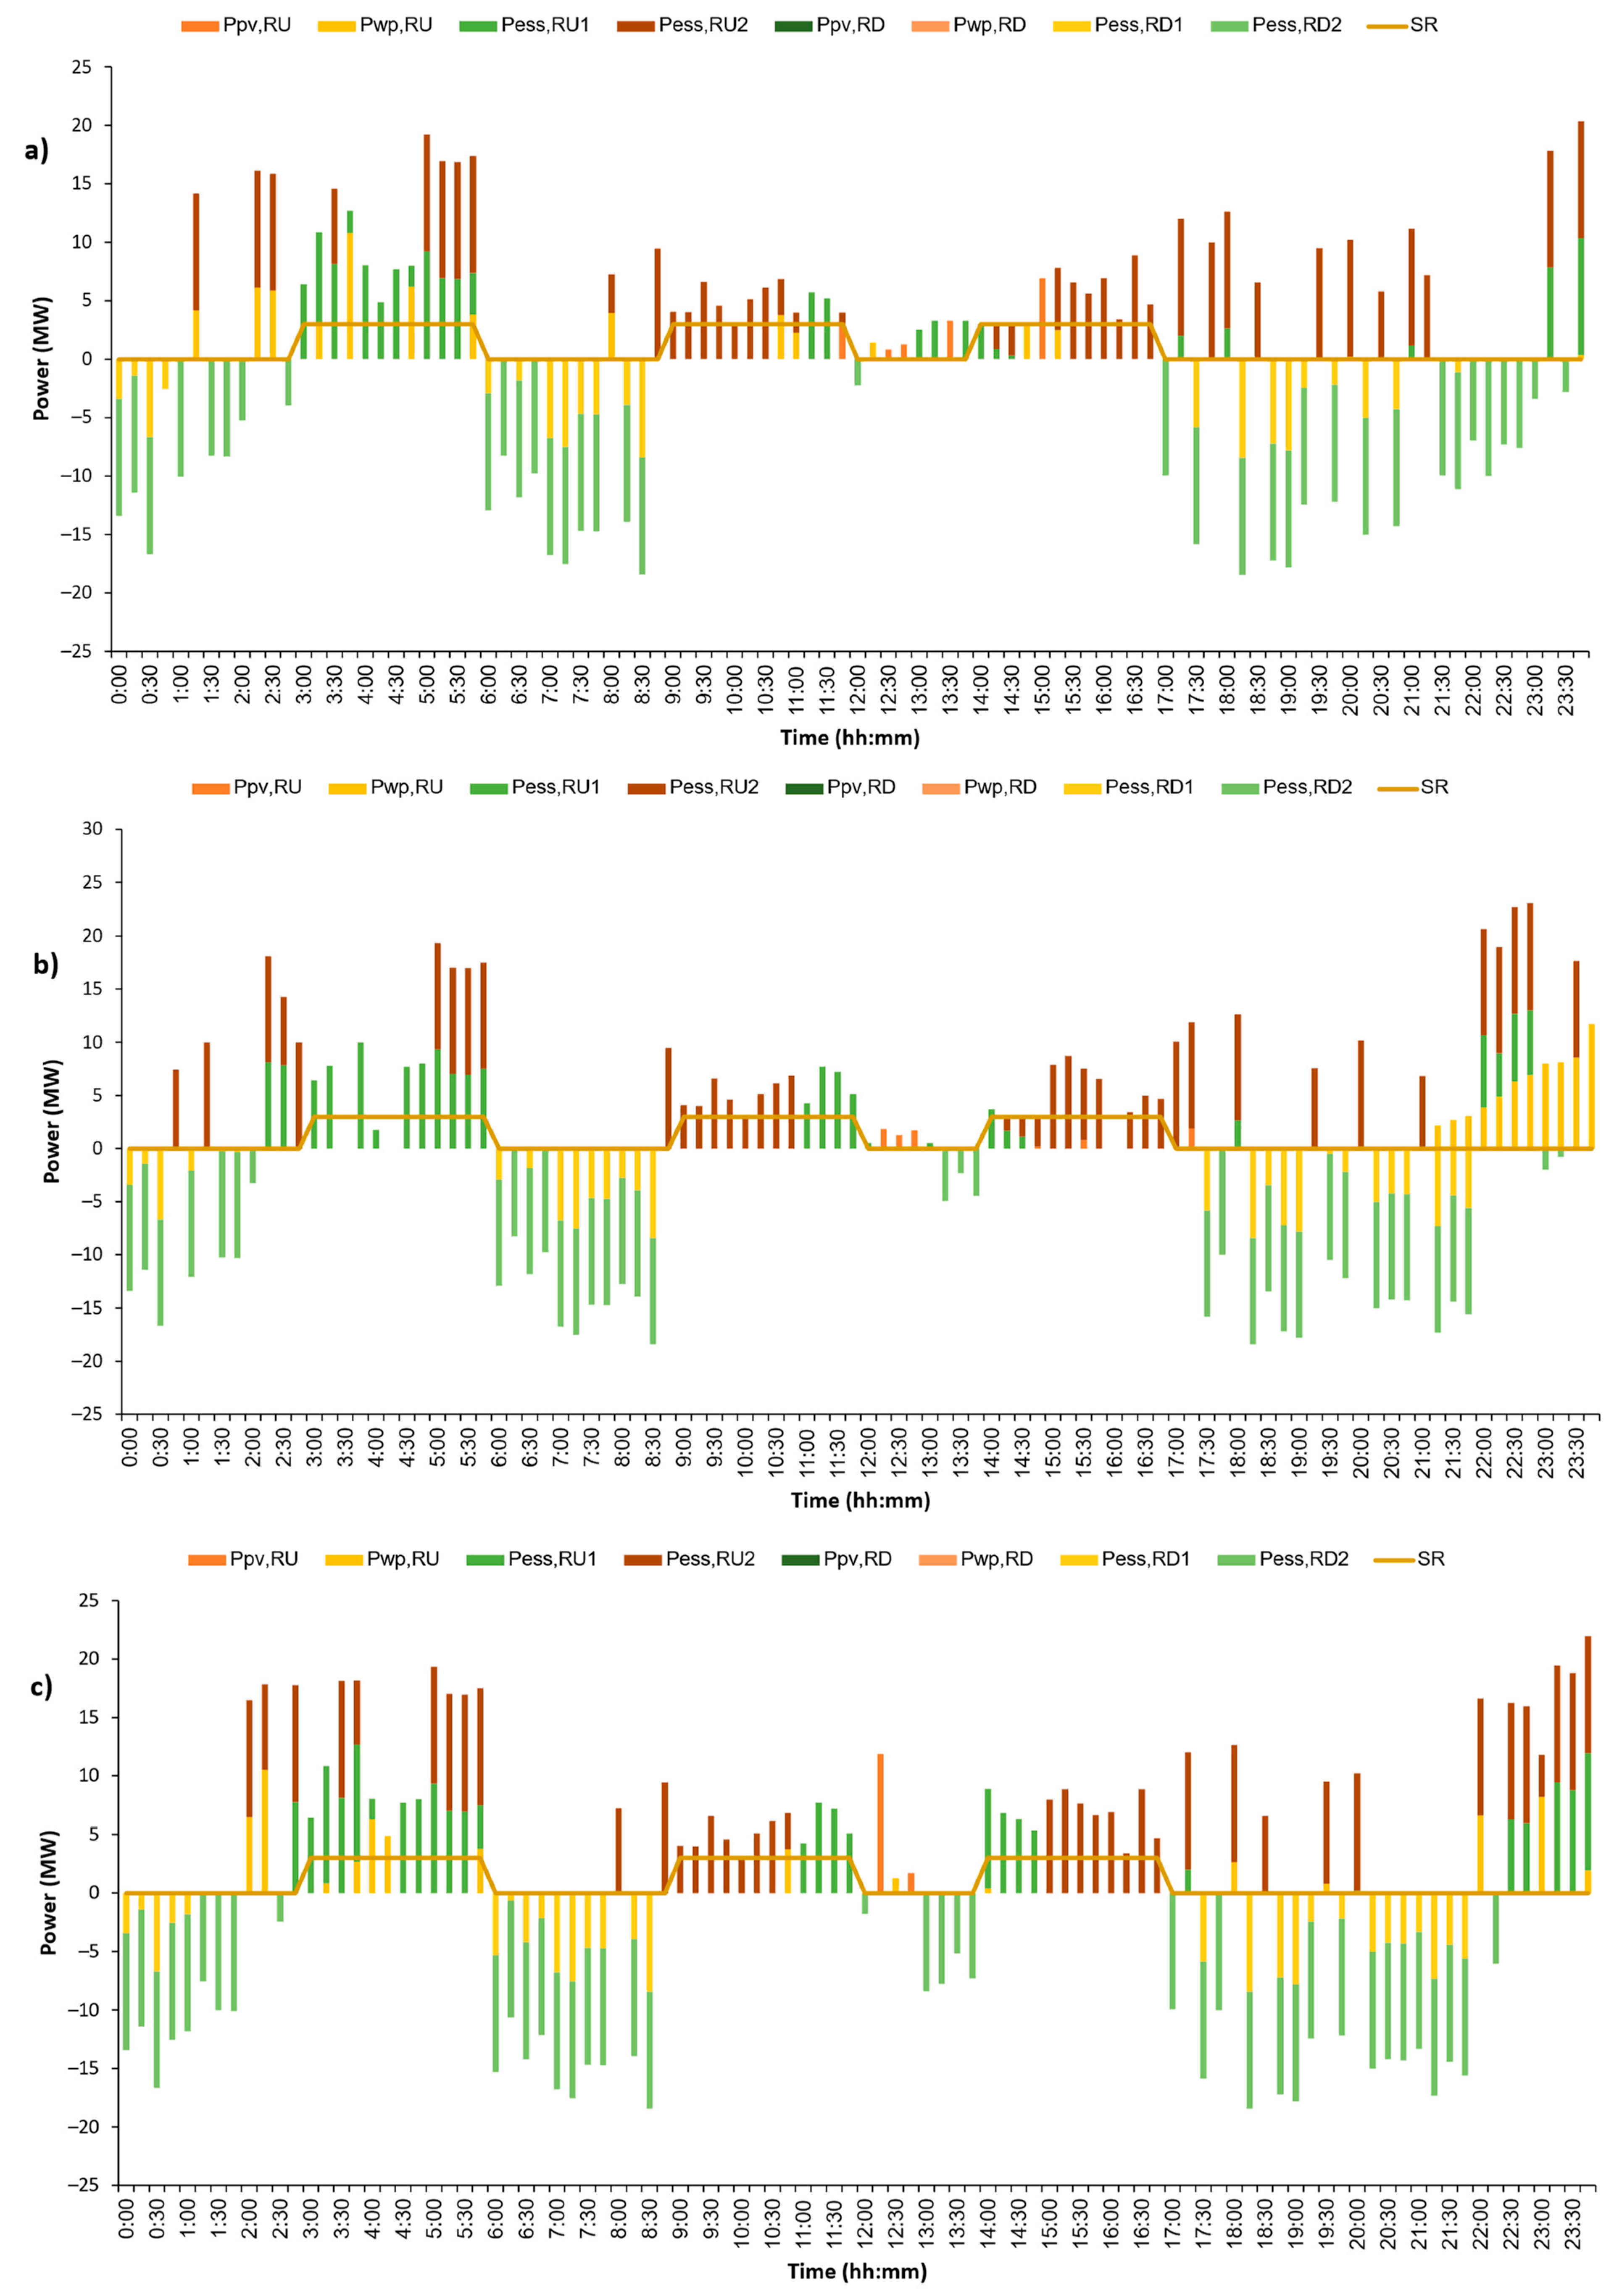
  • The CVPP’s reserve energy provision in the BE market: The following equations describe the CVPP’s ability in the BE market. Equations (30) and (31) show that reserve energy can be provided by RES, ESS, and customers. The binary parameter u B C t , s in (30) represents whether CVPP has a BC contract to provide upward reserve capacity at time t. During the periods with an upward reserve capacity contract, u B C t , s equals 1, and the CVPP needs to provide reserve energy at least equal to the signed reserve capacity S R t . By contrast, during the rest of the day, CVPP can take full advantage of its capabilities in providing both upward and downward reserve energy (32). However, Equation (1) ensures that CVPP can provide only one of the above reserve types at any time block.
    u B C t , s   S R t P R U t , s = P R E S , R U t , s + P E S S , R U 1 t , s + P E S S , R U 2 t , s + P D R , R U t , s u R U t , s   b i g M
    0 P R D t , s = P R E S , R D t , s + P E S S , R D 1 t , s + P E S S , R D 2 t , s + P D R , R D t , s u R D t , s   b i g M
    u R U t , s u B C t , s
    Equation   ( 1 )

4. Numerical Results

4.1. Study System

This section numerically illustrates the performance of the proposed model on a CVPP test system, which has two RES units: one PV power station and one wind farm with installed capacities of 25 MW and 30 MW, respectively. The CVPP also comprises one ESS with a rated inverter power/energy capacity of 10 MW/40 MWh and a charge/discharge efficiency of 0.95. At the start of the 24-h scheduling horizon, the ESS energy level is assumed to be always 50% of its rated capacity. The customers within CVPP have an aggregated peak capacity of up to 35 MW. Overall, the CVPP can fully satisfy its customers based on the internal RES and ESS.
In Figure 6, the red lines illustrate the typical daily profile curves of PV, WP, and demand, treated as the day-ahead forecast data. The light gray areas describe 99.7% confidence intervals of forecast data, assuming that the forecast errors of all resources and customers follow the normal distribution with means of 0 and standard deviations of 5%. With these forecast data, ten scenarios are generated as follows:
  • The Monte Carlo simulation is applied to generate 1000 samples from the distribution functions of uncertain parameters.
  • Use the K-means method to divide these samples into ten clusters. The centroid of each cluster is treated as a scenario with a probability equal to the total probability of all samples in the corresponding cluster.
The dark gray lines in Figure 6 describe the scenarios of each resource and demand; for easy observation, this figure shows only five scenarios out of the ten created.
Figure 7 depicts the DA price forecast used for the CVPP test case. In the BE market, the CVPP can provide upward reserve energy with a price equal to 1.5 times the DA price, while the downward reserve energy price is 0.6 times the DA price.
On the other hand, the proposed model considers that CVPP must satisfy the pre-existing BC contract. It is assumed that CVPP needs to ensure an upward reserve capacity of at least 3 MW, while the probability of reserve activation can vary from 1% to 10%. To evaluate the effectiveness of the proposed model, this study considers two plans for the BC contract, as shown in Table 2. In this table, the light orange cell with 1 is when CVPP has a pre-signed BC contract, while the white cell with 0 is the period without a BC contract. The simulations are conducted on a 64-bit core i5 1.9 GHz personal computer with 16 GB RAM using GAMS 40.3.0 software [51] and the CPLEX 12.10.0 solver [52].

4.2. Case Studies and Discussions

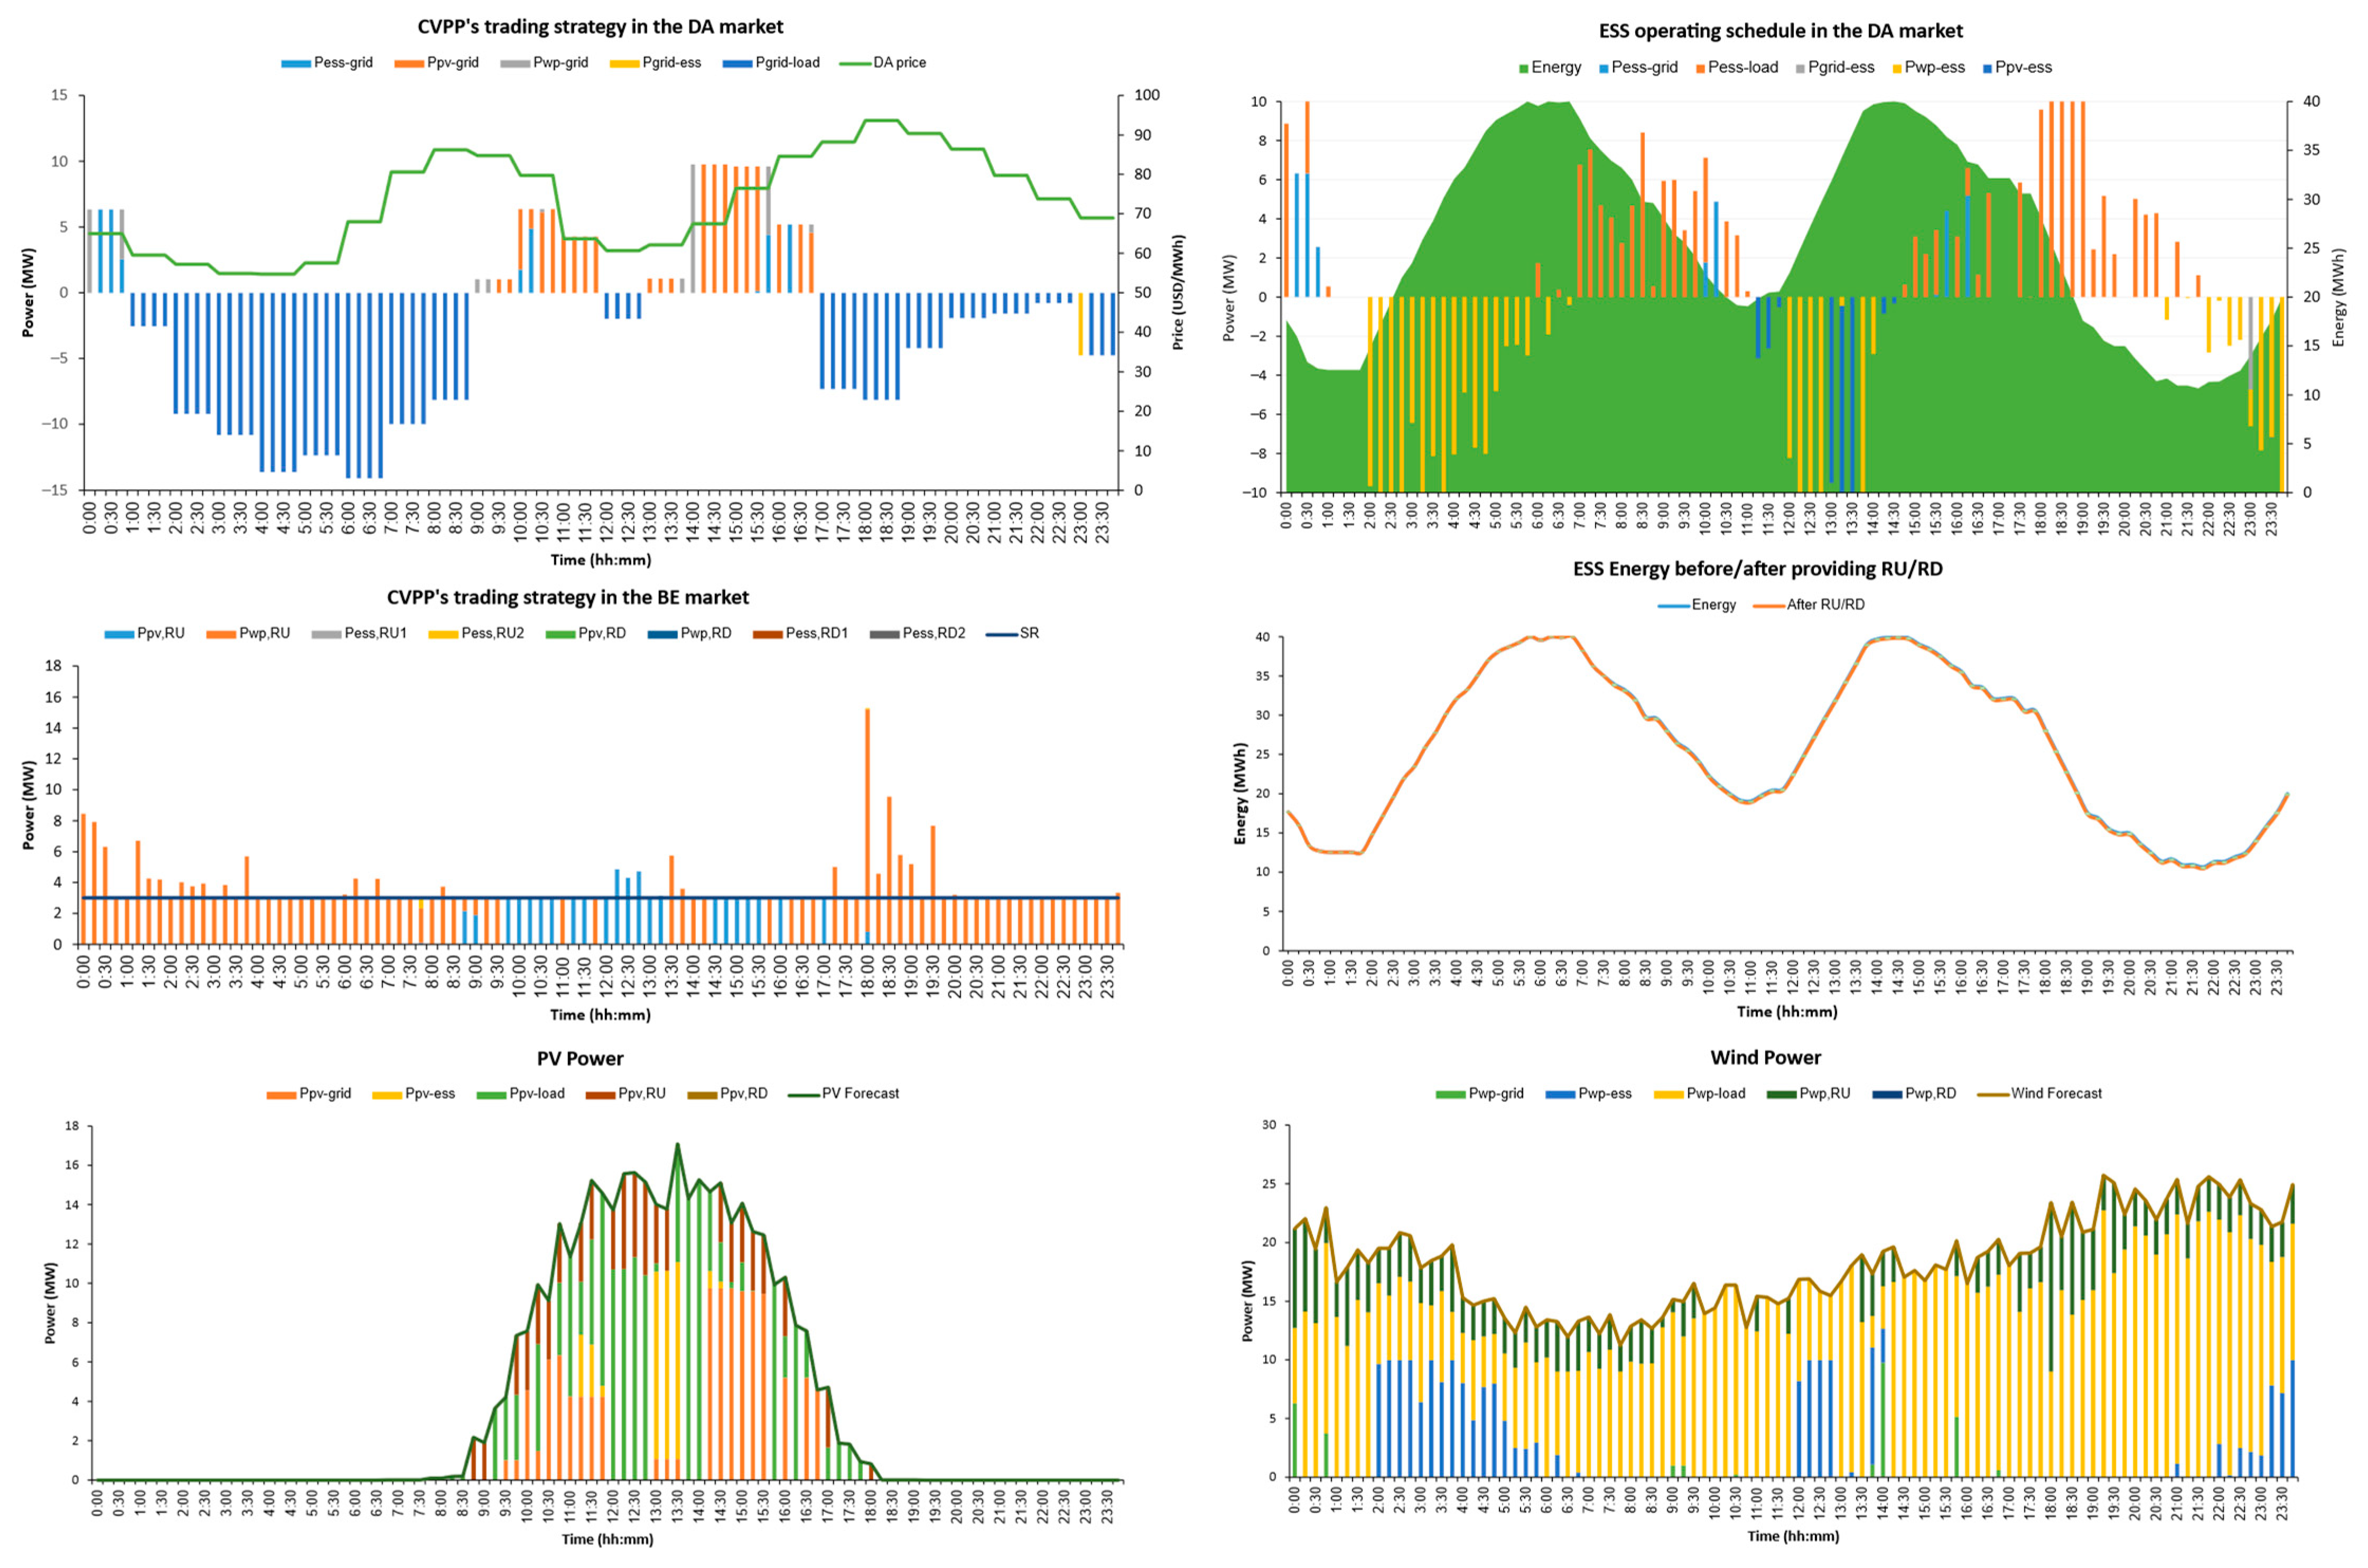
4.2.1. Optimal Solution Results in the Base Case

In this section, the CVPP’s optimal schedule is determined with Plan 1 of the BC contract in Table 2, the probability of activating reserve energy of 1%, and other input data given in Section 4.1. Figure 8 presents daily PV, WP, and demand curves in the highest probability scenario. The results are presented in Figure 9, Figure 10, Figure 11, Figure 12 and Figure 13. Note that in the proposed model, the first-stage variables are fixed, while the second-stage variables will change according to the scenarios of uncertain parameters. For simplicity, these figures only represent the second-stage optimal results corresponding to the highest probability scenario with the PV, WP, and load curves depicted in Figure 8.
Figure 8 shows that during 0:00–4:00, 10:00–16:30, and 22:00–24:00, the available power output of RESs in CVPP is relatively high compared to electricity demand. Even from 12:30 to 14:00, PV power alone can provide most customers’ electricity needs, and the CVPP’s total production during this period can be surplus to nearly 20 MW. So, in the DA contract, the CVPP decides to sell electricity to the grid during these periods (Figure 9). However, the results in Figure 9 and Figure 12 show that CVPP only sells some of the excess power of RESs to the market. In detail, from 11:30 to 14:30, not all excess electricity outputs of PV and WP are sold to the market, but a part will be accumulated in the ESS (Figure 11 and Figure 12). Especially from 12:00 to 13:00, the total available power output of PV and WP is about 12 MW more than the demand, but the CVPP’s selling power in the DA market is only approximately 1 MW. This is because the DA price during this period is relatively low, only about 60 USD/MWh (Figure 9). The energy accumulated in the ESS will be released to sell to the market between 16:00 and 17:00 at a much higher price, around 85 USD/MWh. Also, the ESS will discharge to supply customers from 17:00 to 20:00 when the total available power output of PV and WP is not enough to satisfy customers, and the DA price is very high, even more than 90 USD/MWh (Figure 12).
On the other hand, the total production of PV and WP from 4:00 to 9:00 is insufficient to satisfy customers, so the CVPP should buy electricity from the market to compensate for this shortage. However, Figure 9 and Figure 12 show that before this power shortage period, specifically from 2:00, CVPP started buying electricity from the market to accumulate in the ESS. As a result, from 7:00 to 9:00, with electricity prices up to 86 USD/MWh, CVPP’s buying power is only approximately 7 MW, much lower than the power shortage of about 15 MW. Also, CVPP can sell electricity to the market at high prices between 9:00 and 10:30, thereby increasing its profits.
Then, the CVPP’s trading strategy in the BE market is analyzed to evaluate the effectiveness of the proposed model. Note that the proposed model determines the maximum ability of the CVPP to provide reserve energy without affecting the entire trading strategy in the DA market. In this model, all CVPP’s trading strategies in the BE market, including contracted upward reserve capacity and non-contracted reserve energy, are assumed to be fully activated. Based on these assumptions, the CVPP’s trading strategy in the BE market is obtained and presented in Figure 10.
Table 2 shows that in Case 1 of the BC contract, the CVPP needs to ensure that it can always provide upward reserve energy of at least 3 MW from 3:00 to 6:00, from 9:00 to 12:00, and from 14:00 to 17:00. Figure 10a presents the CVPP’s upward/downward reserve energy in all scenarios of RESs and demand. It can be seen that the upward/downward reserve energy varies significantly from one scenario to another due to the significant difference between the RESs and load data in the scenarios. However, the minimum requirement of upward reserve energy during the BC contract periods is always guaranteed.
The CVPP’s trading strategy in the BE market and the participation of its internal sources in supplying reserve energy in the highest probability scenario are illustrated in Figure 10b. Figure 8 shows that the total power output of RESs in CVPP at 4:00–6:00 is smaller than the local demand, so theoretically, CVPP can hardly provide upward reserve energy in this period. However, the results in Figure 10b show that the CVPP’s upward reserve energy from 4:00 to 6:00 can be around 10 MW, with most of the upward reserve provided by ESS. Similarly, during the other periods, from 9:00 to 12:00 and from 14:00 to 17:00, ESS also provides the majority of upward reserve energy.
In addition, during the period without the upward reserve contract of the BC market, the CVPP mainly provides downward reserve energy, in which ESS also plays a major role. In some time blocks, for example, from 7:00 to 7:30, the downward reserve power can even be higher than 15 MW because the ESS changes its state from discharging to charging. By contrast, at 2:15 or 23:30, the ESS situation changes from charging to discharging, so that the CVPP’s upward reserve at these time blocks can reach 20 MW. Figure 13a describes the maximum ability of the ESS in reserve provision, with red areas and green areas depicting the ESS’s upward and downward reserve capacity, respectively. The blue line in Figure 13b shows the variation of the ESS energy in the DA market, while the red line represents the ESS’s remaining energy level, providing reserve energy. The difference between these two lines is the amount of energy the ESS must discharge to supply upward reserve or recharge when supplying downward reserve. These results show the role of ESS in providing reserves. Also, CVPP’s reserve provisioning capacity has been fully utilized in the proposed model without affecting the DA operating schedule.

4.2.2. Evaluating the Impact of Reserve Activation Probability

To evaluate the impact of reserve activation probability on the CVPP’s schedule, this section considers Case 1, Case 2, and Case 3 with reserve activation probabilities of 2%, 5%, and 10%, respectively. The other input data in these two cases is kept the same as in the base case.
In the base case, RESs’ power output at 11:00–15:00 is much higher than the local demand, which means it is very favorable for CVPP to provide an upward reserve (Figure 8). However, the amount of reserve energy, including both upward and downward reserve, in this period is much smaller than in the rest of the day. In detail, at 11:00–12:00 and 14:00–15:00 with the BC contract, CVPP only provides the minimum upward reserve required by the BC contract, and from 12:00–14:00 without the BC contract, the upward/downward reserve is even less than 2 MW (Figure 10b). This can be explained by the fact that the reserve activation probability is only 1%, so low that even though the BE price is more attractive than the DA price, CVPP still does not have much expectation of profiting from the BE market. Meanwhile, the DA price in this period is quite high, more than 60 USD/MWh, so CVPP focuses on earning profits from selling the RESs redundant production to the DA market. On the contrary, during the remaining time of the day, when CVPP has to buy electricity from the system or the DA price is very low, CVPP increases the reserve energy level and expects profits from arbitrage opportunities in the BE market.
Figure 14 presents the CVPP’s trading strategies in the BE market in these above cases of reserve activation probability. Compared with the base case in Figure 10b, it can be seen that as the reserve activation probability increases, the reserve energy of CVPP also tends to increase, especially during noon. In detail, the CVPP’s reserve power at 11:00–15:00 is not higher than 3 MW in the base case. During the same period, the CVPP can provide an upward reserve of up to 5 MW and 7 MW in Case 1 and Case 2, respectively. In Case 3, when the reserve activation probability is 10%, the upward/downward reserve power provided by the CVPP can reach about 10 MW. The data compiled in Table 3 also clearly shows the impact of reserve activation probability on the operating plan and the profit of CVPP. In the base case, the CVPP provides 109.54 MWh of upward reserve energy and 96.57 MWh of downward reserve energy. Then, the CVPP can obtain 612.69 USD from the DA market and 6374 USD from the BE market. However, it should be noted that the profit of 6374 USD is only CVPP’s expectation if its trading strategy in the BE market is accepted and fully activated. As the probability of activating the reserve increases, CVPP’s expectation of profit from the BE market also increases, causing CVPP’s capacity distribution to shift gradually from the DA market to the BE market. Consequently, when moving from the base case to Cases 1, 2, and 3, the total upward/downward reserve energy and the expected profit in the BE market increase, whereas the DA profit decreases significantly.

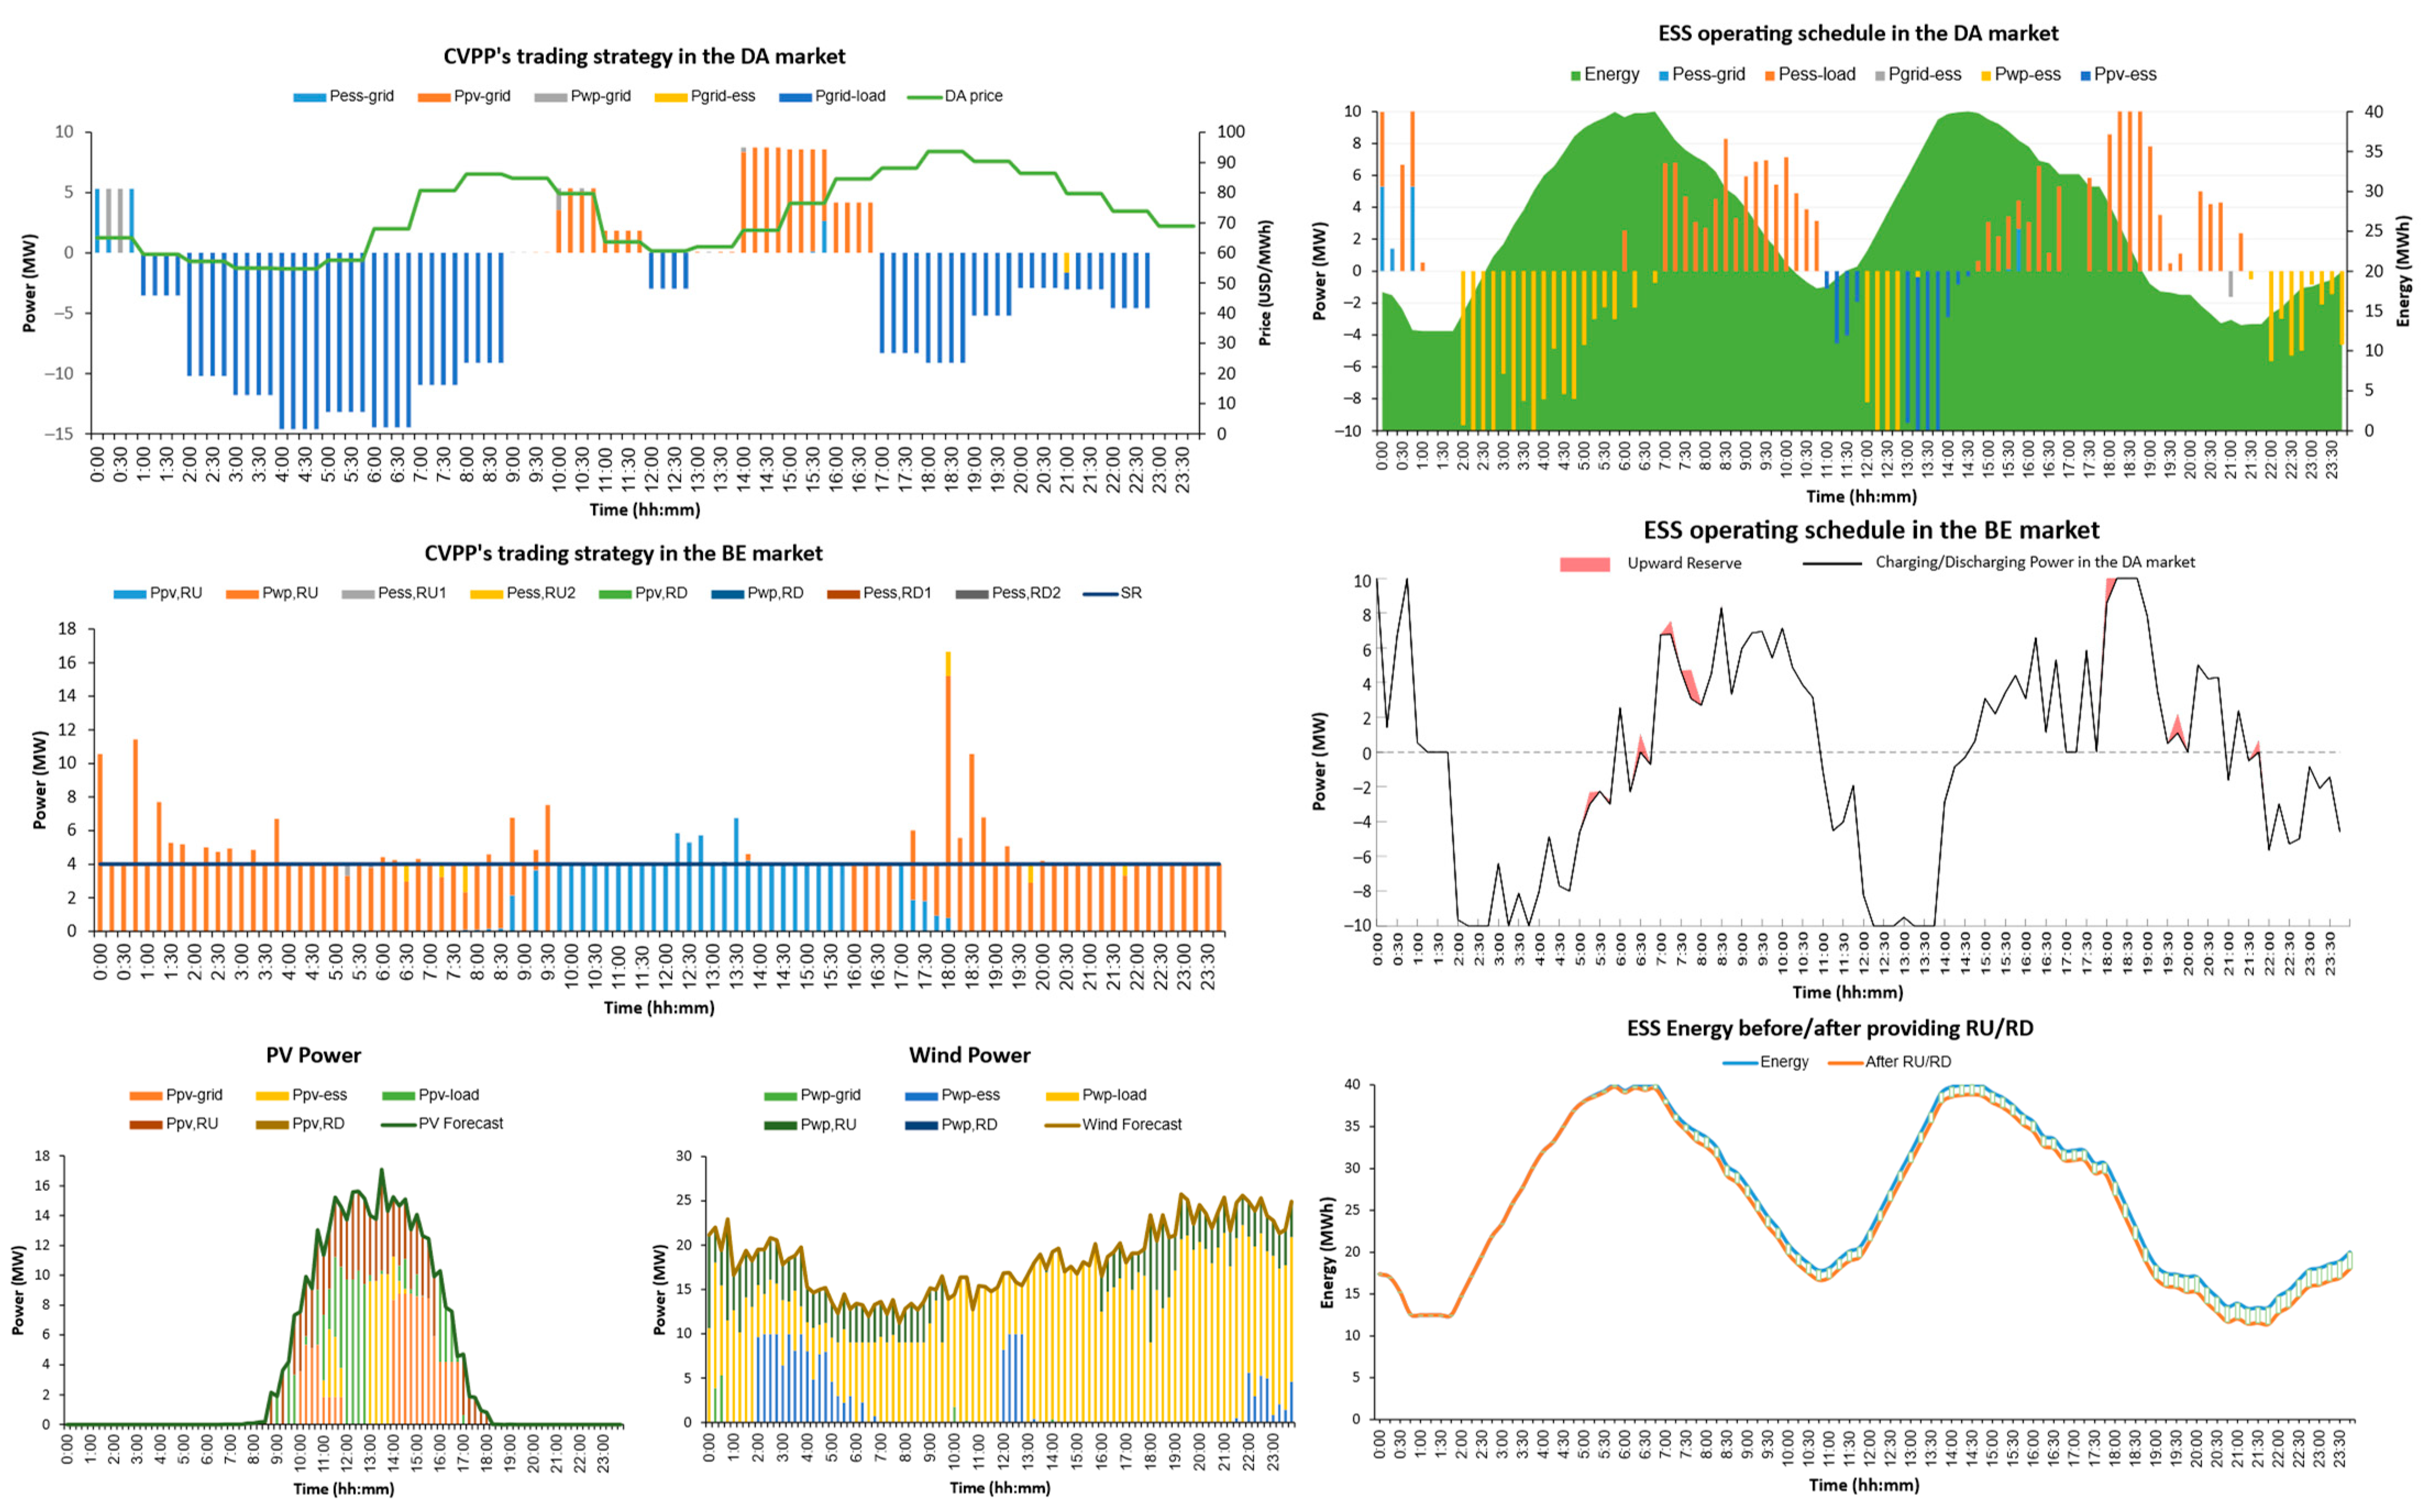
4.2.3. The CVPP’s Optimal Schedule in an Extreme Operating Scenario: Plan 2 of the BC Contract

This section evaluates the proposed model’s effectiveness in an extreme scenario. It is easy to see that if there is no BC contract all day or the total power output of RESs within CVPP is much higher than the local demand, deciding CVPP’s operating schedule in the DA and BE markets is not a complicated problem. In these situations, dividing the CVPP’s capacity into the DA and BE markets seems to depend only on how high the reserve activation probability is. On the contrary, if the CVPP’s BC contracts last over the day and the total power output of RESs is not higher than the local demand, operational planning for CVPP becomes much more difficult. Note that the BC contract should be signed at least a few days before the DA market; at that time, the CVPP may have over-forecasted the power output of RESs or underestimated the customers’ consumption. Another possible case is that a RES unit has a sudden problem and must be shut down. However, CVPP must ensure compliance with the signed BC contract; otherwise, they will be penalized.
Figure 15 depicts the CVPP’s optimal trading strategy, as well as the operating schedule of ESS and RESs in the DA and BE markets with Plan 2 of the BC contract (Table 2). The upward reserve capacity in the BC contract is 3 MW. This means the CVPP must maintain the upward reserve capacity of at least 3 MW throughout the day. Besides, the reserve activation probability is 1%, and other input data is the same as in the base case. Results in Figure 15 show that ESS does not participate in maintaining the BC contract; only PV and WP are responsible. To guarantee the BC contract, a part of the available power output of PV and WP is always kept for reserve provision. Therefore, the selling power of CVPP in the DA market is reduced while its purchasing power is more than in the base case. For example, the CVPP must buy nearly 15 MW at 4:00–7:00, while the buying power in the base case is only around 10 MW during the same period (Figure 9). Consequently, in this section, CVPP suffered a loss of 4,602,625 USD in the DA market. Although a profit of 9,024,775 USD could be obtained from the BE market when the reserve was called, it is still difficult for CVPP to profit due to the probability of reserve activation of only 1%.
Then, still, with Plan 2 of the BC contract, we increase the upward reserve capacity to 4 MW, and the other input data is the same as in the base case. With such an extreme scenario, the proposed model is infeasible, meaning the CVPP cannot meet this BC contract. However, as argued above, this can be considered a rare situation in which the temporary solution of abandoning the cyclical nature of the model is acceptable. So, Equation (14), which guarantees that the ESS reserve energy provision does not affect its DA scheduling, can be relaxed by allowing the ESS’s end-of-day energy level to differ from its beginning-of-day energy level. Assuming that the difference between the two energy levels can be up to 5% of the ESS’s rated capacity, the results are obtained in Figure 16. It can be seen that CVPP has secured the required upward reserve power for the entire day. Besides, the ESS provided a very small amount of upward reserve energy, concentrated when the RESs’ power output is low, such as at 5:30–8:30 or 18:00.
It is easy to see that as the level of relaxation increases, ESS will also participate more in providing upward reserve. Consequently, CVPP can allocate more capacity to the DA market, thereby reducing losses in this market (Table 4). By contrast, the profits that CVPP expects to obtain from the BE market have mostly stayed the same. This can be explained by the fact that the capacity of RESs is not inherently redundant. Therefore, the participation of ESS in reserve provision only causes the capacity allocation of RESs to the BE market to shift to the DA market partially but does not mean increasing the CVPP’s upward reserve capacity.

5. Conclusions

This paper focuses on the optimal scheduling model of a CVPP consisting of RESs, ESS, and customers in the DA and BE markets. The VPP is assumed to be an active agent in the balancing market with a pre-signed upward reserve capacity contract in the BC market. Therefore, before the DA market gate closure, the CVPP’s operators should perform the following tasks simultaneously: determining the VPP’s optimal trading strategies in the DA market, evaluating the CVPP’s profit opportunities in the BE market, and then calculating the operating plan for each CVPP’s component. The challenge here is that the ESS operation is limited by its energy level while activating reserve energy from ESS in the BE market changes this energy level. As a result, the operating plan of ESS and CVPP in the DA market will be affected. To solve this problem, this paper built a two-stage stochastic optimization model to determine the VPP’s optimal scheduling in both the DA and BE markets. The ESS operation is described by an energy model in the DA market and a reserve provision model in the BE market. These two ESS models are associated to ensure that the reserve activation does not affect the DA scheduling. The uncertainty in demand, RESs’ available power output, and the probability of reserve activation are considered. The influence of the BC contract and reserve activation probability on the CVPP’s optimal scheduling are also studied and analyzed.
In this paper, the proposed model is verified by an example. The following conclusions are drawn:
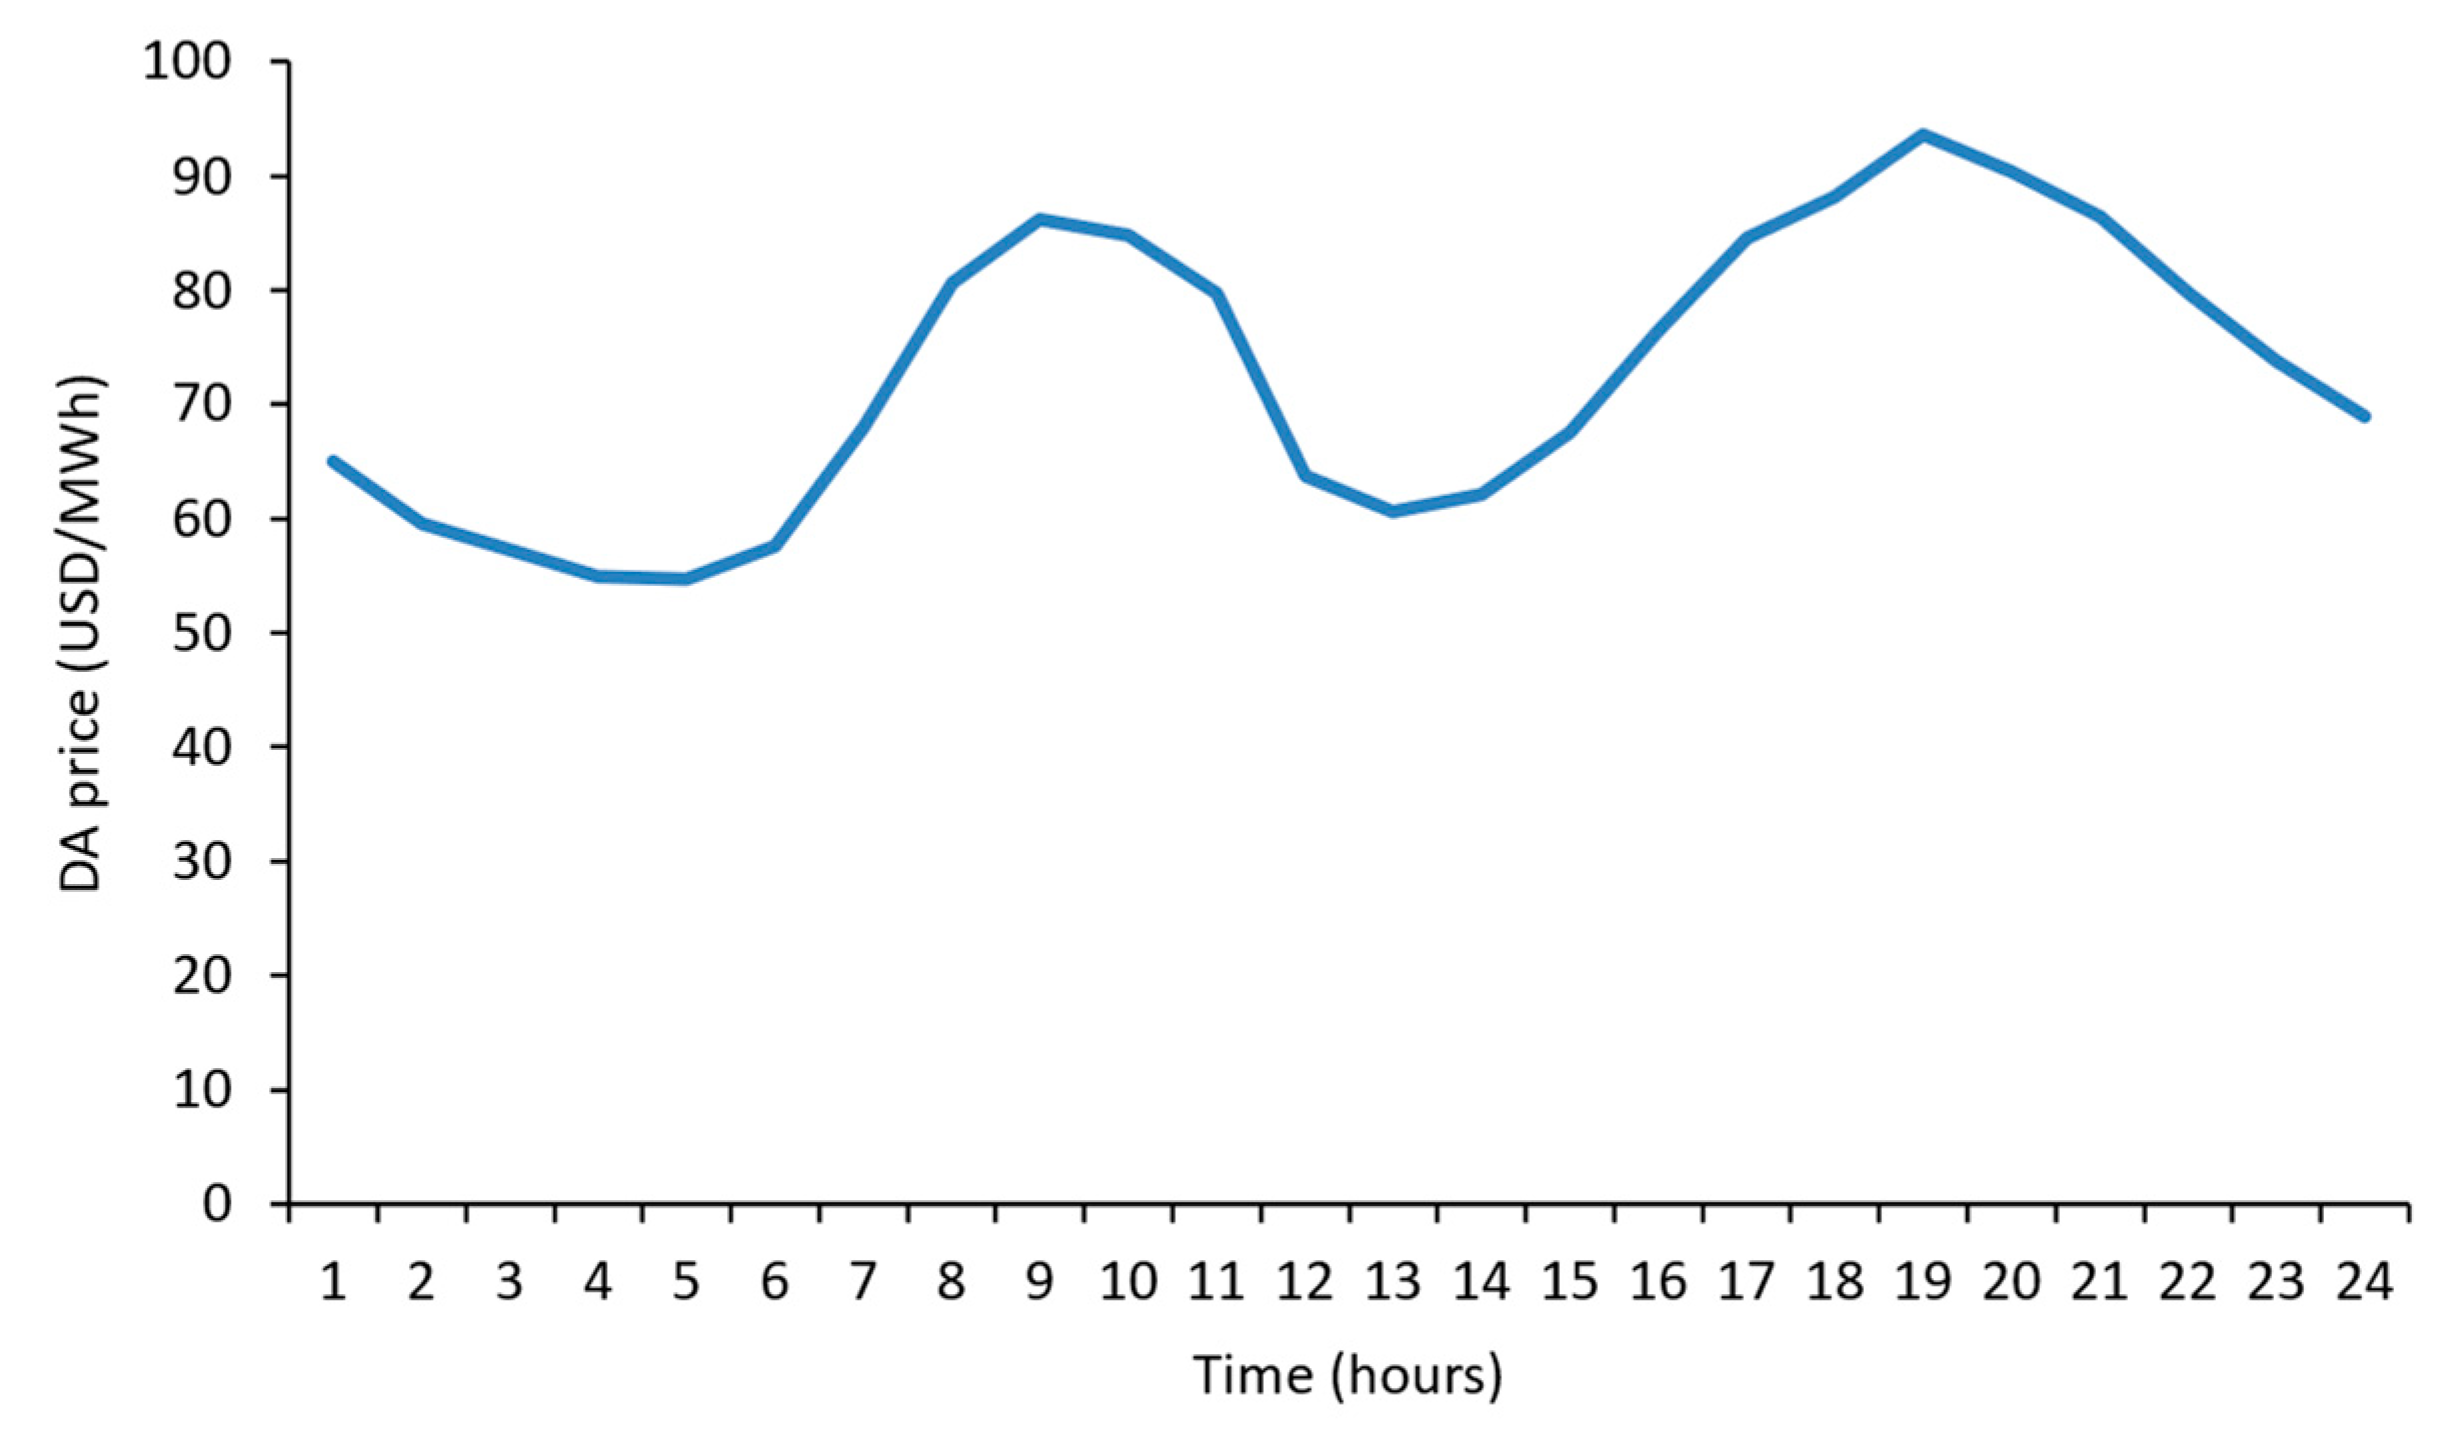
  • The effectiveness of the proposed model is shown by analyzing the results. The proposed model determined the CVPP’s optimal scheduling in the DA and BE markets. The RESs and ESS in the CVPP were coordinated to ensure that the CVPP can buy electricity during low-priced hours and sell electricity during high-priced hours in the DA market. The pre-signed BC contract was satisfied, even in an extreme scenario. Based on the probability of reserve activation, the type and amount of reserve energy CVPP should provide in the BE market were determined. This helps increase profit opportunities for CVPP.
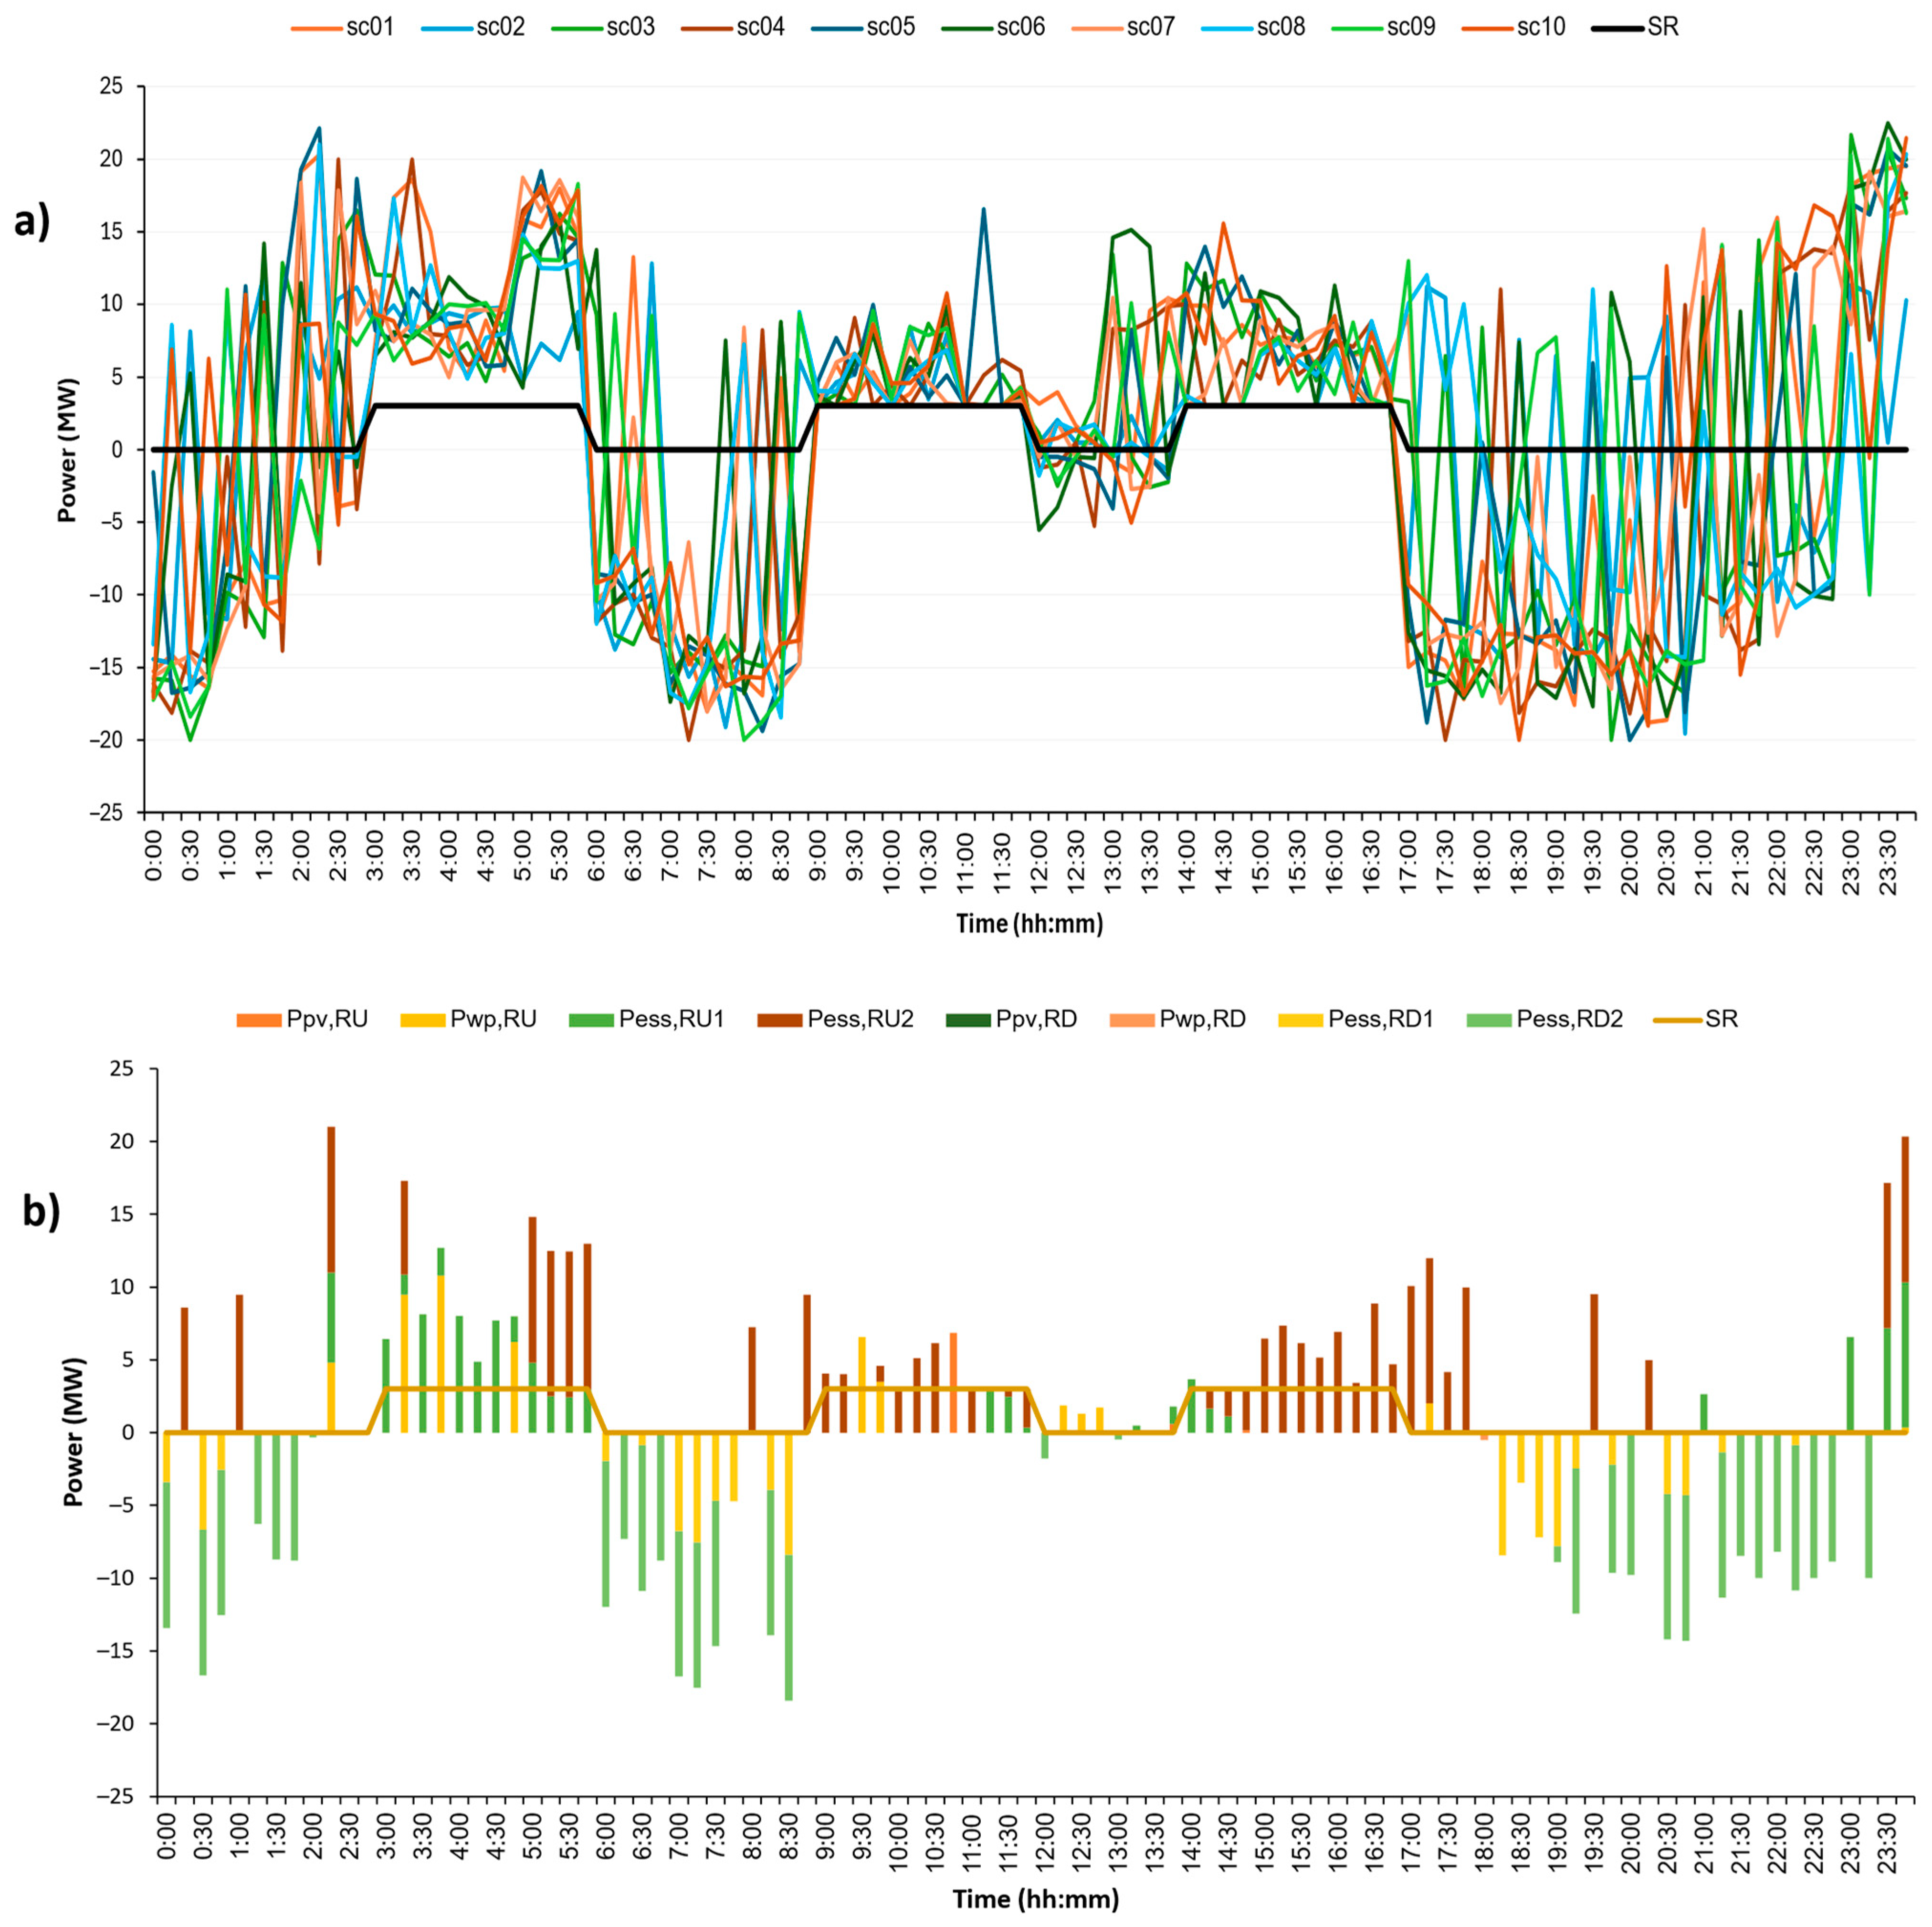
  • The results also show the effectiveness of the ESS’s reserve provision model. The ESS operating states before and after provisioning reserve energy were determined in detail. The CVPP’s trading schedule in the DA market did not change after activating reserve energy from ESS. This is a remarkable advantage of the proposed model. As discussed in Section 1, only a few studies currently focus on the role of ESS in both the energy and reserve markets. Besides, these studies only focus on the ability to adjust the ESS’s power output to provide reserve service but do not consider maintaining the ESS’s predetermined operating plan in the DA market.
  • The ESS plays a vital role in the CVPP’s operation. In the DA market, the ESS is fully utilized to profit from energy arbitrage. In the BE market, the ESS’s reserve provision ability helps CVPP provide upward reserve energy even if the total available power output of RESs within CVPP is less than the local consumption or the BC contract lasts all day.
  • The reserve activation probability is low, so CVPP focuses on making profits from the DA market rather than the BE market. Consequently, although RES’s power output is surplus in some time blocks, the upward capacity is relatively low, just enough for the requirements of the BC contract.
  • The relaxation of the proposed model allows the CVPP to determine an appropriate operating scenario in extreme situations due to over-forecasting the RESs’ available power output or underestimating the local demand when signing the BC contract.
The results show that the proposed approach allows the CVPP to not only participate in the energy market but also provide reserve services flexibly. However, this paper still has some limitations. Using ESS to provide reserve can increase its degradation rate, but the model has not considered this. Some other efficient reserve resources, such as demand response or RES curtailment, are also not considered in this paper. Besides, this paper only considers the DA and the balancing markets. However, in addition to these two markets, CVPP can participate in other types of electricity markets, such as the intraday market, thereby increasing their profit opportunities for CVPP. The CVPP model can also integrate different sources, such as hydrogen storage systems or electric vehicle charging stations, and the possibility of applying these sources to provide balancing energy is also an exciting and promising direction. In addition, this study considers the VPP a price taker, but if the VPP sizing is large enough to influence the market’s clearing price, the VPP should be formulated as a price maker. These topics are left for future work.

Author Contributions

Conceptualization, N.N.H. and H.N.D.; methodology, N.N.H.; software, N.N.H.; formal analysis, H.N.D.; data curation, H.N.D.; writing—original draft preparation, N.N.H.; writing—review and editing, H.N.D. All authors have read and agreed to the published version of the manuscript.

Funding

This research is funded by the Ministry of Education and Training, Vietnam under the grant number CT2022.07.BKA.05.

Institutional Review Board Statement

Not applicable.

Informed Consent Statement

Not applicable.

Data Availability Statement

Data are contained within the article.

Conflicts of Interest

The authors declare no conflict of interest.

Nomenclature

Indices and Sets
t T Time intervals.
s S Scenarios of uncertain parameters.
Constants
λ D A t The DA market’s price at time t ($/MWh).
λ R U t Upward reserve energy price at time t ($/MWh).
λ R D t Downward reserve energy price at time t ($/MWh).
Δ t Time block (equals 15 min).
π s Probability of scenario s of uncertain parameters.
p a c t Probability of reserve activation in the BE market.
P R E S r a t e d RES power rating (MW).
P R E S m i n The minimum level of RES power output (MW).
P E S S m a x ESS power rating (MW).
E E S S m a x ESS capacity rating (MWh).
E E S S m i n ESS minimum energy level (MWh).
η ESS charging/discharging efficiency.
L o a d m a x The highest possible value of demand (MW).
b i g M A sufficiently large constant
Semi-Constants
P R E S _ f o r e c a s t t , s Forecasted power output of RES at time t in scenario s (MW).
P D _ f o r e c a s t t , s   Forecasted demand at time t in scenario S (MW).
S R t The requirement of upward reserve capacity in the BC contract at time t (MW).
u B C t , s Binary parameter represents whether CVPP has a BC contract at time t.
E E S S , D A t = 0 , s ESS initial energy in the DA market at t = 0, and in scenario s (MWh).
Variables
u s e l l , D A t Binary variable shows CVPP’s sell/buy situation in the DA market at time t, 1 for selling and 1 for buying.
P s e l l , D A t The CVPP’s selling power in the DA market at time t (MW).
P b u y , D A t The CVPP’s buying power in the DA market at time t (MW).
P R U t , s The CVPP’s upward reserve power in the BE market at time t in scenario s (MW).
P R D t , s The CVPP’s downward reserve power in the BE market at time t in scenario s (MW).
u R U t , s Binary variable equals 1 if CVPP provides upward reserve energy at time t in scenario s.
u R D t , s Binary variable, equals 1 if CVPP provides downward reserve energy at time t in scenario s.
u R E S t , s RES on/off state at time t in scenario s (Binary).
P R E S t , s RES actual power output at time t in scenario s (MW).
P R E S g r i d , D A t , s RES power output is provided to the main grid at time t in scenario s (MW).
P R E S l o a d t , s RES power output provides to demand at time t in scenario s (MW).
P R E S E S S t , s RES power output is provided to ESS at time t in scenario s (MW).
P R E S , R U t , s RES upward reserve power at time t in scenario s (MW).
P R E S , R D t , s RES downward reserve power at time t in scenario s (MW).
u E S S t , s ESS charging/discharging state at time t in scenario s (Binary).
P E S S , c h t , s ESS charging power at time t in scenario s (MW)
P E S S , d i s c h t , s ESS discharging power at time t in scenario s (MW)
P g r i d E S S , D A t , s ESS charging power buy from the DA market at time t in scenario s (MW).
P R E S E S S t , s ESS charging power from RES at time t in scenario s (MW).
P E S S g r i d , D A t , s ESS discharging power sell to the DA market at time t in scenario s (MW).
P E S S l o a d t , s ESS discharging power supply to demand at time t in scenario s (MW).
P E S S , R U 1 t , s ,   P E S S , R U 2 t , s ESS upward reserve power at time t in scenario s (MW).
P E S S , R D 1 t , s ,   P E S S , R D 2 t , s ESS downward reserve power at time t in scenario s (MW).
E E S S , D A t , s ESS energy in the DA market at time t in scenario S (MWh).
E E S S , D A t = 96 , s ESS energy at the end of the day (t = 96) in scenario S (MWh).
E E S S , S R t , s Changes in ESS energy after providing upward/downward reserve at time t in scenario s (MW).
u E S S a f t e r S R t , s ESS state after providing upward/downward reserve at time t in scenario s (binary).

References

  1. Neme, C.; Energy Futures Group; Cowart, R.; Regulator Assistance Project. Energy Efficiency Participation in Electricity Capacity Markets—The US Experience; The Regulatory Assistance Project (RAP): Montpelier, VT, USA, 2014. [Google Scholar]
  2. Oureilidis, K.; Malamaki, K.N.; Gallos, K.; Tsitsimelis, A.; Dikaiakos, C.; Gkavanoudis, S.; Cvetkovic, M.; Mauricio, J.M.; Ortega, J.M.M.; Ramos, J.L.M.; et al. Ancillary Services Market Design in Distribution Networks: Review and Identification of Barriers. Energies 2020, 13, 917. [Google Scholar] [CrossRef]
  3. Helman, U. Distributed Energy Resources in the US Wholesale Markets: Recent Trends, New Models, and Forecasts. In Consumer, Prosumer, Prosumager: How Service Innovations will Disrupt the Utility Business Model; Academic Press: Cambridge, MA, USA; Elsevier: San Diego, CA, USA, 2019; pp. 431–469. ISBN 9780128168356. [Google Scholar]
  4. IRENA Redesigning Capacity Markets: Innovation Landscape Brief; International Renewable Energy Agency: Abu Dhabi, United Arab Emirates, 2019; ISBN 978-92-9260-130-0.
  5. Pudjianto, D.; Ramsay, C.; Strbac, G. Microgrids and Virtual Power Plants: Concepts to Support the Integration of Distributed Energy Resources. Proc. Inst. Mech. Eng. Part A J. Power Energy 2008, 222, 731–741. [Google Scholar] [CrossRef]
  6. Arias, J. Solar Energy, Energy Storage and Virtual Power Plants in Japan. Available online: https://www.eu-japan.eu/sites/default/files/publications/docs/min18_1_arias_solarenergy-energystorageandvirtualpowerplantsinjapan.pdf (accessed on 18 September 2021).
  7. Thavlov, A.; Bindner, H.W. Utilization of Flexible Demand in a Virtual Power Plant Set-Up. IEEE Trans. Smart Grid 2015, 6, 640–647. [Google Scholar] [CrossRef]
  8. Pudjianto, D.; Ramsay, C.; Strbac, G. Virtual Power Plant and System Integration of Distributed Energy Resources. IET Renew. Power Gener. 2007, 1, 10–16. [Google Scholar] [CrossRef]
  9. Kuiper, G. What Is the State of Virtual Power Plants in Australia? From Thin Margins to a Future of VPP-Tailers. 2022. Available online: https://ieefa.org/wp-content/uploads/2022/03/What-Is-the-State-of-Virtual-Power-Plants-in-Australia_March-2022_2.pdf (accessed on 26 January 2024).
  10. Sarmiento-Vintimilla, J.C.; Torres, E.; Larruskain, D.M.; Pérez-Molina, M.J. Applications, Operational Architectures and Development of Virtual Power Plants as a Strategy to Facilitate the Integration of Distributed Energy Resources. Energies 2022, 15, 775. [Google Scholar] [CrossRef]
  11. Paavilainen, E. Aggregated Demand Response in a Virtual Power Plant: A Finnish Case Study; Aalto University: Espoo, Finland, 2020. [Google Scholar]
  12. Virtual Power Plant Reaches 1000 MW in Poland—Modern Power Systems. Available online: https://www.modernpowersystems.com/news/newsvirtual-power-plant-reaches-1000-mw-in-poland-9097170 (accessed on 13 October 2021).
  13. Naval, N.; Yusta, J.M. Virtual Power Plant Models and Electricity Markets—A Review. Renew. Sustain. Energy Rev. 2021, 149, 111393. [Google Scholar] [CrossRef]
  14. Yazdaninejad, M.; Amjady, N.; Dehghan, S. VPP Self-Scheduling Strategy Using Multi-Horizon IGDT, Enhanced Normalized Normal Constraint, and Bi-Directional Decision-Making Approach. IEEE Trans. Smart Grid 2020, 11, 3632–3645. [Google Scholar] [CrossRef]
  15. Hu, J.; Jiang, C.; Liu, Y. Short-Term Bidding Strategy for a Price-Maker Virtual Power Plant Based on Interval Optimization. Energies 2019, 12, 3662. [Google Scholar] [CrossRef]
  16. Kuang, Y.; Wang, X.; Zhao, H.; Qian, T.; Li, N.; Wang, J.; Wang, X. Model-Free Demand Response Scheduling Strategy for Virtual Power Plants Considering Risk Attitude of Consumers. CSEE J. Power Energy Syst. 2023, 9, 516–528. [Google Scholar] [CrossRef]
  17. Khaloie, H.; Mollahassani-Pour, M.; Anvari-Moghaddam, A. Optimal Behavior of a Hybrid Power Producer in Day-Ahead and Intraday Markets: A Bi-Objective CVaR-Based Approach. IEEE Trans. Sustain. Energy 2021, 12, 931–943. [Google Scholar] [CrossRef]
  18. Guo, W.; Liu, P.; Shu, X. Optimal Dispatching of Electric-Thermal Interconnected Virtual Power Plant Considering Market Trading Mechanism. J. Clean. Prod. 2021, 279, 123446. [Google Scholar] [CrossRef]
  19. Rahmani-Dabbagh, S.; Sheikh-El-Eslami, M.K. A Profit Sharing Scheme for Distributed Energy Resources Integrated into a Virtual Power Plant. Appl. Energy 2016, 184, 313–328. [Google Scholar] [CrossRef]
  20. Tang, W.; Yang, H.T. Optimal Operation and Bidding Strategy of a Virtual Power Plant Integrated with Energy Storage Systems and Elasticity Demand Response. IEEE Access 2019, 7, 79798–79809. [Google Scholar] [CrossRef]
  21. PandŽić, H.; Morales, J.M.; Conejo, A.J.; Kuzle, I. Offering Model for a Virtual Power Plant Based on Stochastic Programming. Appl. Energy 2013, 105, 282–292. [Google Scholar] [CrossRef]
  22. Dabbagh, S.R.; Sheikh-El-Eslami, M.K. Risk-Based Profit Allocation to DERs Integrated with a Virtual Power Plant Using Cooperative Game Theory. Electr. Power Syst. Res. 2015, 121, 368–378. [Google Scholar] [CrossRef]
  23. Rahimiyan, M.; Baringo, L. Strategic Bidding for a Virtual Power Plant in the Day-Ahead and Real-Time Markets: A Price-Taker Robust Optimization Approach. IEEE Trans. Power Syst. 2016, 31, 2676–2687. [Google Scholar] [CrossRef]
  24. Gazijahani, F.S.; Salehi, J. IGDT-Based Complementarity Approach for Dealing with Strategic Decision Making of Price-Maker VPP Considering Demand Flexibility. IEEE Trans. Ind. Inform. 2020, 16, 2212–2220. [Google Scholar] [CrossRef]
  25. Poplavskaya, K.; Lago, J.; de Vries, L. Effect of Market Design on Strategic Bidding Behavior: Model-Based Analysis of European Electricity Balancing Markets. Appl. Energy 2020, 270, 115130. [Google Scholar] [CrossRef]
  26. FINGRID. Reserve Products and Reserve Market Places. Available online: https://www.fingrid.fi/globalassets/dokumentit/en/electricity-market/reserves/reserve-products-and-reserve-market-places.pdf (accessed on 18 September 2021).
  27. Hayashi, K.; Mikami, Y.; Hirano, K.; Terayama, H. Development of Large-Scale Hybrid Power Storage System: System Demonstration Project in Lower Saxony, Germany: Hitachi Review. Available online: http://www.hitachi.com/rev/archive/2020/r2020_04/04c02/index.html (accessed on 18 September 2021).
  28. IRENA Electricity Storage Valuation Framework: Assessing System Value and Ensuring Project Viability; International Renewable Energy Agency: Abu Dhabi, United Arab Emirates, 2020; ISBN 978-92-9260-161-4.
  29. Liu, J.; Hu, C.; Kimber, A.; Wang, Z. Uses, Cost-Benefit Analysis, and Markets of Energy Storage Systems for Electric Grid Applications. J. Energy Storage 2020, 32, 101731. [Google Scholar] [CrossRef]
  30. Georgious, R.; Refaat, R.; Garcia, J.; Daoud, A.A. Review on Energy Storage Systems in Microgrids. Electronics 2021, 10, 2134. [Google Scholar] [CrossRef]
  31. Dabbagh, S.R.; Sheikh-El-Eslami, M.K. Risk Assessment of Virtual Power Plants Offering in Energy and Reserve Markets. IEEE Trans. Power Syst. 2016, 31, 3572–3582. [Google Scholar] [CrossRef]
  32. Vahedipour-Dahraie, M.; Rashidizade-Kermani, H.; Shafie-khah, M.; Catalao, J.P.S. Risk-Averse Optimal Energy and Reserve Scheduling for Virtual Power Plants Incorporating Demand Response Programs. IEEE Trans. Smart Grid 2020, 12, 1405–1415. [Google Scholar] [CrossRef]
  33. Zhou, Y.; Wei, Z.; Sun, G.; Cheung, K.W.; Zang, H.; Chen, S. Four-Level Robust Model for a Virtual Power Plant in Energy and Reserve Markets. IET Gener. Transm. Distrib. 2019, 13, 2006–2014. [Google Scholar] [CrossRef]
  34. Baringo, A.; Baringo, L.; Arroyo, J.M. Day-Ahead Self-Scheduling of a Virtual Power Plant in Energy and Reserve Electricity Markets under Uncertainty. IEEE Trans. Power Syst. 2019, 34, 1881–1894. [Google Scholar] [CrossRef]
  35. Zhang, M.; Xu, Y.; Sun, H. Optimal Coordinated Operation for a Distribution Network with Virtual Power Plants Considering Load Shaping. IEEE Trans. Sustain. Energy 2023, 14, 550–562. [Google Scholar] [CrossRef]
  36. Mazzi, N.N.; Trivella, A.; Morales, J.M. Enabling Active/Passive Electricity Trading in Dual-Price Balancing Markets. arXiv 2018, 34, 1980–1990. [Google Scholar] [CrossRef]
  37. Ning, L.; Liu, Y.; Chen, Y.; Zhao, Y.; Li, G.; Wang, Y. Research on the Optimal Scheduling Method of Virtual Power Plant with Industrial Loads Participating the Peak Regulation Ancillary Service. In Proceedings of the 2023 5th Asia Energy and Electrical Engineering Symposium (AEEES), Chengdu, China, 23–26 March 2023; pp. 1080–1087. [Google Scholar] [CrossRef]
  38. Ma, Y.; Chen, Y.; Tang, J.; Qiu, W.; Chen, X.; Li, J.; Lin, Z. Optimal Operational Strategy of Virtual Power Plant Considering the Participation in the Joint Markets of the Electricity Spot and Auxiliary Service Market. In Proceedings of the 2023 6th International Conference on Energy, Electrical and Power Engineering (CEEPE), Guangzhou, China, 12–14 May 2023; pp. 1586–1590. [Google Scholar] [CrossRef]
  39. Toubeau, J.F.; Nguyen, T.H.; Khaloie, H.; Wang, Y.; Vallee, F. Forecast-Driven Stochastic Scheduling of a Virtual Power Plant in Energy and Reserve Markets. IEEE Syst. J. 2022, 16, 5212–5223. [Google Scholar] [CrossRef]
  40. Padmanabhan, N.; Ahmed, M.; Bhattacharya, K. Battery Energy Storage Systems in Energy and Reserve Markets. IEEE Trans. Power Syst. 2020, 35, 215–226. [Google Scholar] [CrossRef]
  41. Mimica, M.; Sinovčić, Z.; Jokić, A.; Krajačić, G. The Role of the Energy Storage and the Demand Response in the Robust Reserve and Network-Constrained Joint Electricity and Reserve Market. Electr. Power Syst. Res. 2022, 204, 107716. [Google Scholar] [CrossRef]
  42. Sigrist, L.; Lobato, E.; Rouco, L. Energy Storage Systems Providing Primary Reserve and Peak Shaving in Small Isolated Power Systems: An Economic Assessment. Int. J. Electr. Power Energy Syst. 2013, 53, 675–683. [Google Scholar] [CrossRef]
  43. van der Veen, R.A.C.; Hakvoort, R.A. The Electricity Balancing Market: Exploring the Design Challenge. Util. Policy 2016, 43, 186–194. [Google Scholar] [CrossRef]
  44. Poplavskaya, K.; de Vries, L. Distributed Energy Resources and the Organized Balancing Market: A Symbiosis yet? Case of Three European Balancing Markets. Energy Policy 2019, 126, 264–276. [Google Scholar] [CrossRef]
  45. Elia Group Design Note—Balancing Services: MFRR; Elia Group: Brussels, Belgium, 2022.
  46. Sakuma, Y. Japanese Energy Market-Optimum Use of Distributed Energy Resources for Demand-Side Response; Japanese Energy Market: Tokyo, Japan, 2021. [Google Scholar]
  47. Forouli, A.; Bakirtzis, E.A.; Papazoglou, G.; Oureilidis, K.; Gkountis, V.; Candido, L.; Ferrer, E.D.; Biskas, P. Assessment of Demand Side Flexibility in European Electricity Markets: A Country Level Review. Energies 2021, 14, 2324. [Google Scholar] [CrossRef]
  48. AEMO Emerging Generation and Energy Storage in the NEM. Available online: https://aemo.com.au/-/media/files/electricity/nem/initiatives/emerging-generation/eges_stakeholder_paper_final.pdf?la=en&hash=5E82D40582C56B34327D120A366EF044 (accessed on 12 October 2021).
  49. ARENA South Australia Virtual Power Plant Phase 3A. 2021. Available online: https://arena.gov.au/assets/2022/09/south-australia-virtual-power-plant-lessons-learnt-2.pdf (accessed on 26 January 2024).
  50. Huy, N.D.; Nhung, N.H. Optimal Reserve and Energy Scheduling for a Virtual Power Plant Considering Reserve Activation Probability. Appl. Sci. 2021, 11, 9717. [Google Scholar] [CrossRef]
  51. Bussieck, M.R.; Meeraus, A. General Algebraic Modeling System (GAMS). In Modeling Languages in Mathematical Optimization; Josef Kallrath, Ed.; Springer: Berlin/Heidelberg, Germany, 2004; pp. 137–157. [Google Scholar]
  52. IBM ILOG CPLEX Optimization Studio|IBM. Available online: https://www.ibm.com/products/ilog-cplex-optimization-studio (accessed on 31 March 2022).
Figure 1. The CVPP’s operation in the DA and BE markets.
Applsci 14 02175 g001
Figure 2. The CVPP’s reserve provisioning scheme in the BC and BE markets.
Applsci 14 02175 g002
Figure 3. The CVPP’s optimal scheduling model in the DA and BE markets, considering the BC contract.
Applsci 14 02175 g003
Figure 4. The ESS’s ability in reserve provision corresponds to the type of reserve and the ESS’s state before reserve activation.
Applsci 14 02175 g004
Figure 5. The ESS status before and after reserve activation.
Applsci 14 02175 g005
Figure 6. The forecast data of PV, WP, and demand for the CVPP test case.
Applsci 14 02175 g006
Figure 7. The DA price forecast for the CVPP test case.
Applsci 14 02175 g007
Figure 8. Base case: The daily curves of PV, WP, and demand in the highest probability scenario of uncertain parameters.
Applsci 14 02175 g008
Figure 9. Base case: The CVPP’s trading strategy in the DA market.
Applsci 14 02175 g009
Figure 10. Base case: The CVPP’s trading strategy in the BE market: (a) All scenarios of uncertain parameters; (b) The scenario with the highest probability.
Applsci 14 02175 g010
Figure 11. Base case: The operating strategy of PV and WP in the highest probability scenario of uncertain parameters.
Applsci 14 02175 g011
Figure 12. Base case: The ESS operation in the DA market in the highest probability scenario of uncertain parameters.
Applsci 14 02175 g012
Figure 13. Base case: The ESS operation in the BE market in the highest probability scenario of uncertain parameters: (a) The ESS charging/discharging power; (b) The ESS energy before/after activating reserve.
Applsci 14 02175 g013
Figure 14. The CVPP’s trading strategy in the BE market is in (a) Case 1, (b) Case 2, and (c) Case 3.
Applsci 14 02175 g014
Figure 15. The CVPP’s optimal schedule is if the BC contract has Plan 2 and an upward reserve capacity of 3 MW.
Applsci 14 02175 g015
Figure 16. The CVPP’s optimal schedule if the BC contract has Plan 2 and an upward reserve capacity of 4 MW.
Applsci 14 02175 g016
Table 1. Four reserve provisioning situations of the ESS.
SituationESS StatusUpward ReserveDownward Reserve
Before Reserve Activation After Reserve Activation
111 P E S S , R U 2 t , s P E S S , R D 1 t , s
210infeasible P E S S , R D 1 t , s + P E S S , R D 2 t , s
301 P E S S , R U 1 t , s + P E S S , R U 2 t , s infeasible
400 P E S S , R U 1 t , s P E S S , R D 2 t , s
Table 2. Two plans of the BC contract.
Time0:00–1:001:00–2:002:00–3:003:00–4:004:00–5:005:00–6:006:00–7:007:00–8:008:00–9:009:00–10:0010:00–11:0011:00–12:00
Plan 1000111000111
Plan 2111111111111
Time12:00–13:0013:00–14:0014:00–15:0015:00–16:0016:00–17:0017:00–18:0018:00–19:0019:00–20:0020:00–21:0021:00–22:0022:00–23:0023:00–24:00
Plan 1001110000000
Plan 2111111111111
Table 3. Impact of reserve activation probability on CVPP’s profit.
Case StudyBase CaseCase 1Case 2Case 3
Upward Reserve Energy (MWh)109.54116.89126.69138.88
Downward Reserve Energy (MWh)96.59103.37112.49124.71
DA Profit (USD)612.69608.78592.3566.11
BE Profit if Reserve Activated (USD)63746911.237672.937956.05
Total Profit Considering Reserve Activation
Probability (USD)
676.43747.01975.951361.71
Table 4. The CVPP’s profit with different relaxation levels in case the BC contract has Plan 2 and an upward reserve capacity of 4 MW.
Relaxation Level5%10%15%20%
DA profit (USD)−6231.38−6087.32−5916−5758.29
BE Profit if Reserve Activated (USD)11,656.2511,685.0911,660.6311,642.81
Total Profit Considering Reserve Activation Probability (USD)−6114.81−5970.47−5799.39−5641.86
Disclaimer/Publisher’s Note: The statements, opinions and data contained in all publications are solely those of the individual author(s) and contributor(s) and not of MDPI and/or the editor(s). MDPI and/or the editor(s) disclaim responsibility for any injury to people or property resulting from any ideas, methods, instructions or products referred to in the content.

