Article

Correlation between Spring Wheat Physiological Indicators and UAV Digital Image Index in Hetao Irrigation Area

1
College of Agriculture, Inner Mongolia Agricultural University, Hohhot 010010, China
2
Inner Mongolia Technology Extension Center of Agriculture and Animal Husbandry, Hohhot 011799, China
3
Inner Mongolia Academy of Agriculture and Animal Husbandry, Hohhot 010031, China
*
Author to whom correspondence should be addressed.
Appl. Sci. 2024, 14(6), 2294; https://doi.org/10.3390/app14062294
Submission received: 29 January 2024 / Revised: 6 March 2024 / Accepted: 7 March 2024 / Published: 8 March 2024
(This article belongs to the Special Issue Plant Management and Soil Improvement in Specialty Crop Production)

Abstract

:
To accurately and non-destructively monitor the growth of spring wheat in the Hetao irrigation area, UAV remote sensing was employed during various fertility stages. Digital image indices from diverse fertilization treatments were calculated and compared with physiological indices to identify the most sensitive digital image indices corresponding to these indices. The study underscored the critical importance of the flowering stage in the growth of spring wheat, thus highlighting the necessity of focusing on this stage. This finding reiterated that the flowering stage was pivotal for spring wheat development in the Hetao Irrigation Area. Several digital image indices, such as GLA, R, G, INT, g, GRVI, MGRVI, RGBVI, EXG, and GRRI, exhibited a high frequency of significant correlations with physiological indices during the four primary reproductive stages of wheat. Consequently, these sensitive digital image indices during the flowering stage can more effectively characterize the physiological indices of spring wheat.

1. Introduction

Remote sensing technology has advanced agricultural quantitative remote sensing, making it the predominant and precise method for assessing global plant growth. A mathematical model established relationships between image information derived from remote sensing sensors and specific plant parameters. Analyzing image characteristics facilitated the monitoring, diagnosis, and comprehension of plant growth status, enabling the accurate regulation and management of plant growth [1]. Several studies showed that crop quantitative remote sensing was effective in reflecting actual nitrogen levels and monitoring nitrogen across various cereal crops [2,3,4]. Mullan [5] used a digital image analysis tool for high-throughput screening of four large wheat populations to validate the relationship between digital image analysis and measures of the normalized difference vegetation index (NDVI), leaf area index, and light penetration through the crop canopy. Image processing techniques have immense potential to use characteristics like size, shape, color, and texture attributes from digital images to characterize agricultural produce [6]. Due to the ability of crop stems, leaves, and other aboveground organs to absorb, reflect, and refract visible light, with advantages of mobility, timeliness, ease of operation, and high resolution, light parameters such as color, hue, brightness, and saturation could enable a comprehensive characterization of plants, and digital image index made it possible to standardize spectral information from visible light bands, specifically red (R), green (G), and blue (B) [7,8].
Unmanned aerial vehicles (UAVs) for remote sensing, with their advantages of mobility, timeliness, ease of operation, and high resolution, have recently shown significant advantages in extracting crop information and monitoring nutrient levels across small to medium spatial scales [9,10,11]. The traditional determination of crop physiological indicators and nutrient diagnosis required a large number of field samples and laboratory analysis, which was cumbersome and time-consuming. With the development of digital image technology, some researchers began to apply digital image processing technology for nutrient diagnosis [12]. Xia et al. [13] used a cell phone camera to obtain the canopy images of maize in different periods, extracted digital image indexes from the images, and analyzed the correlation between the digital image indexes and maize nitrogen nutrient indexes. Their experimental results showed that, in the six-leaf period of maize, the color parameter of the canopy image was significantly correlated with the maize SPAD value, indicating it could be used as a nitrogen diagnostic period. Moreover, B/(R + G + B) and G/(R + G + B) were significantly correlated with the leaf SPAD value, a traditional indicator of nitrogen diagnosis, and B/(R + G + B) was more sensitive, so it could be used as a color parameter indicator for the diagnosis of nitrogen nutrition in maize. This result suggested that it was feasible to use digital image technology for nitrogen nutrition diagnosis. In addition, Wang et al. [14] used a digital camera to obtain the image data of rice canopy, extracted the image index and the actual nutrient index of rice for correlation analysis, and found that the two had a good correlation relationship, in which the correlation coefficient between NRI and leaf nitrogen content reached −0.65, indicating that the application of image technology could be fast and simple to realize the rapid monitoring of crop nutrient indexes.
The Hetao region of Inner Mongolia is a significant center for spring wheat production in China. Research into the rapid, non-destructive, and cost-effective monitoring of spring wheat production using unmanned aerial vehicles (UAVs) is indispensable for this region’s agricultural sector. This study conducted field trials on spring wheat with varying nitrogen levels and captured digital images using UAVs at different reproductive stages. Plant morphological and physiological yield indicators were also collected and analyzed. Eighteen digital image indices were selected for analysis, and correlation analyses were used to determine the most effective diagnostic digital image indices across various stages.

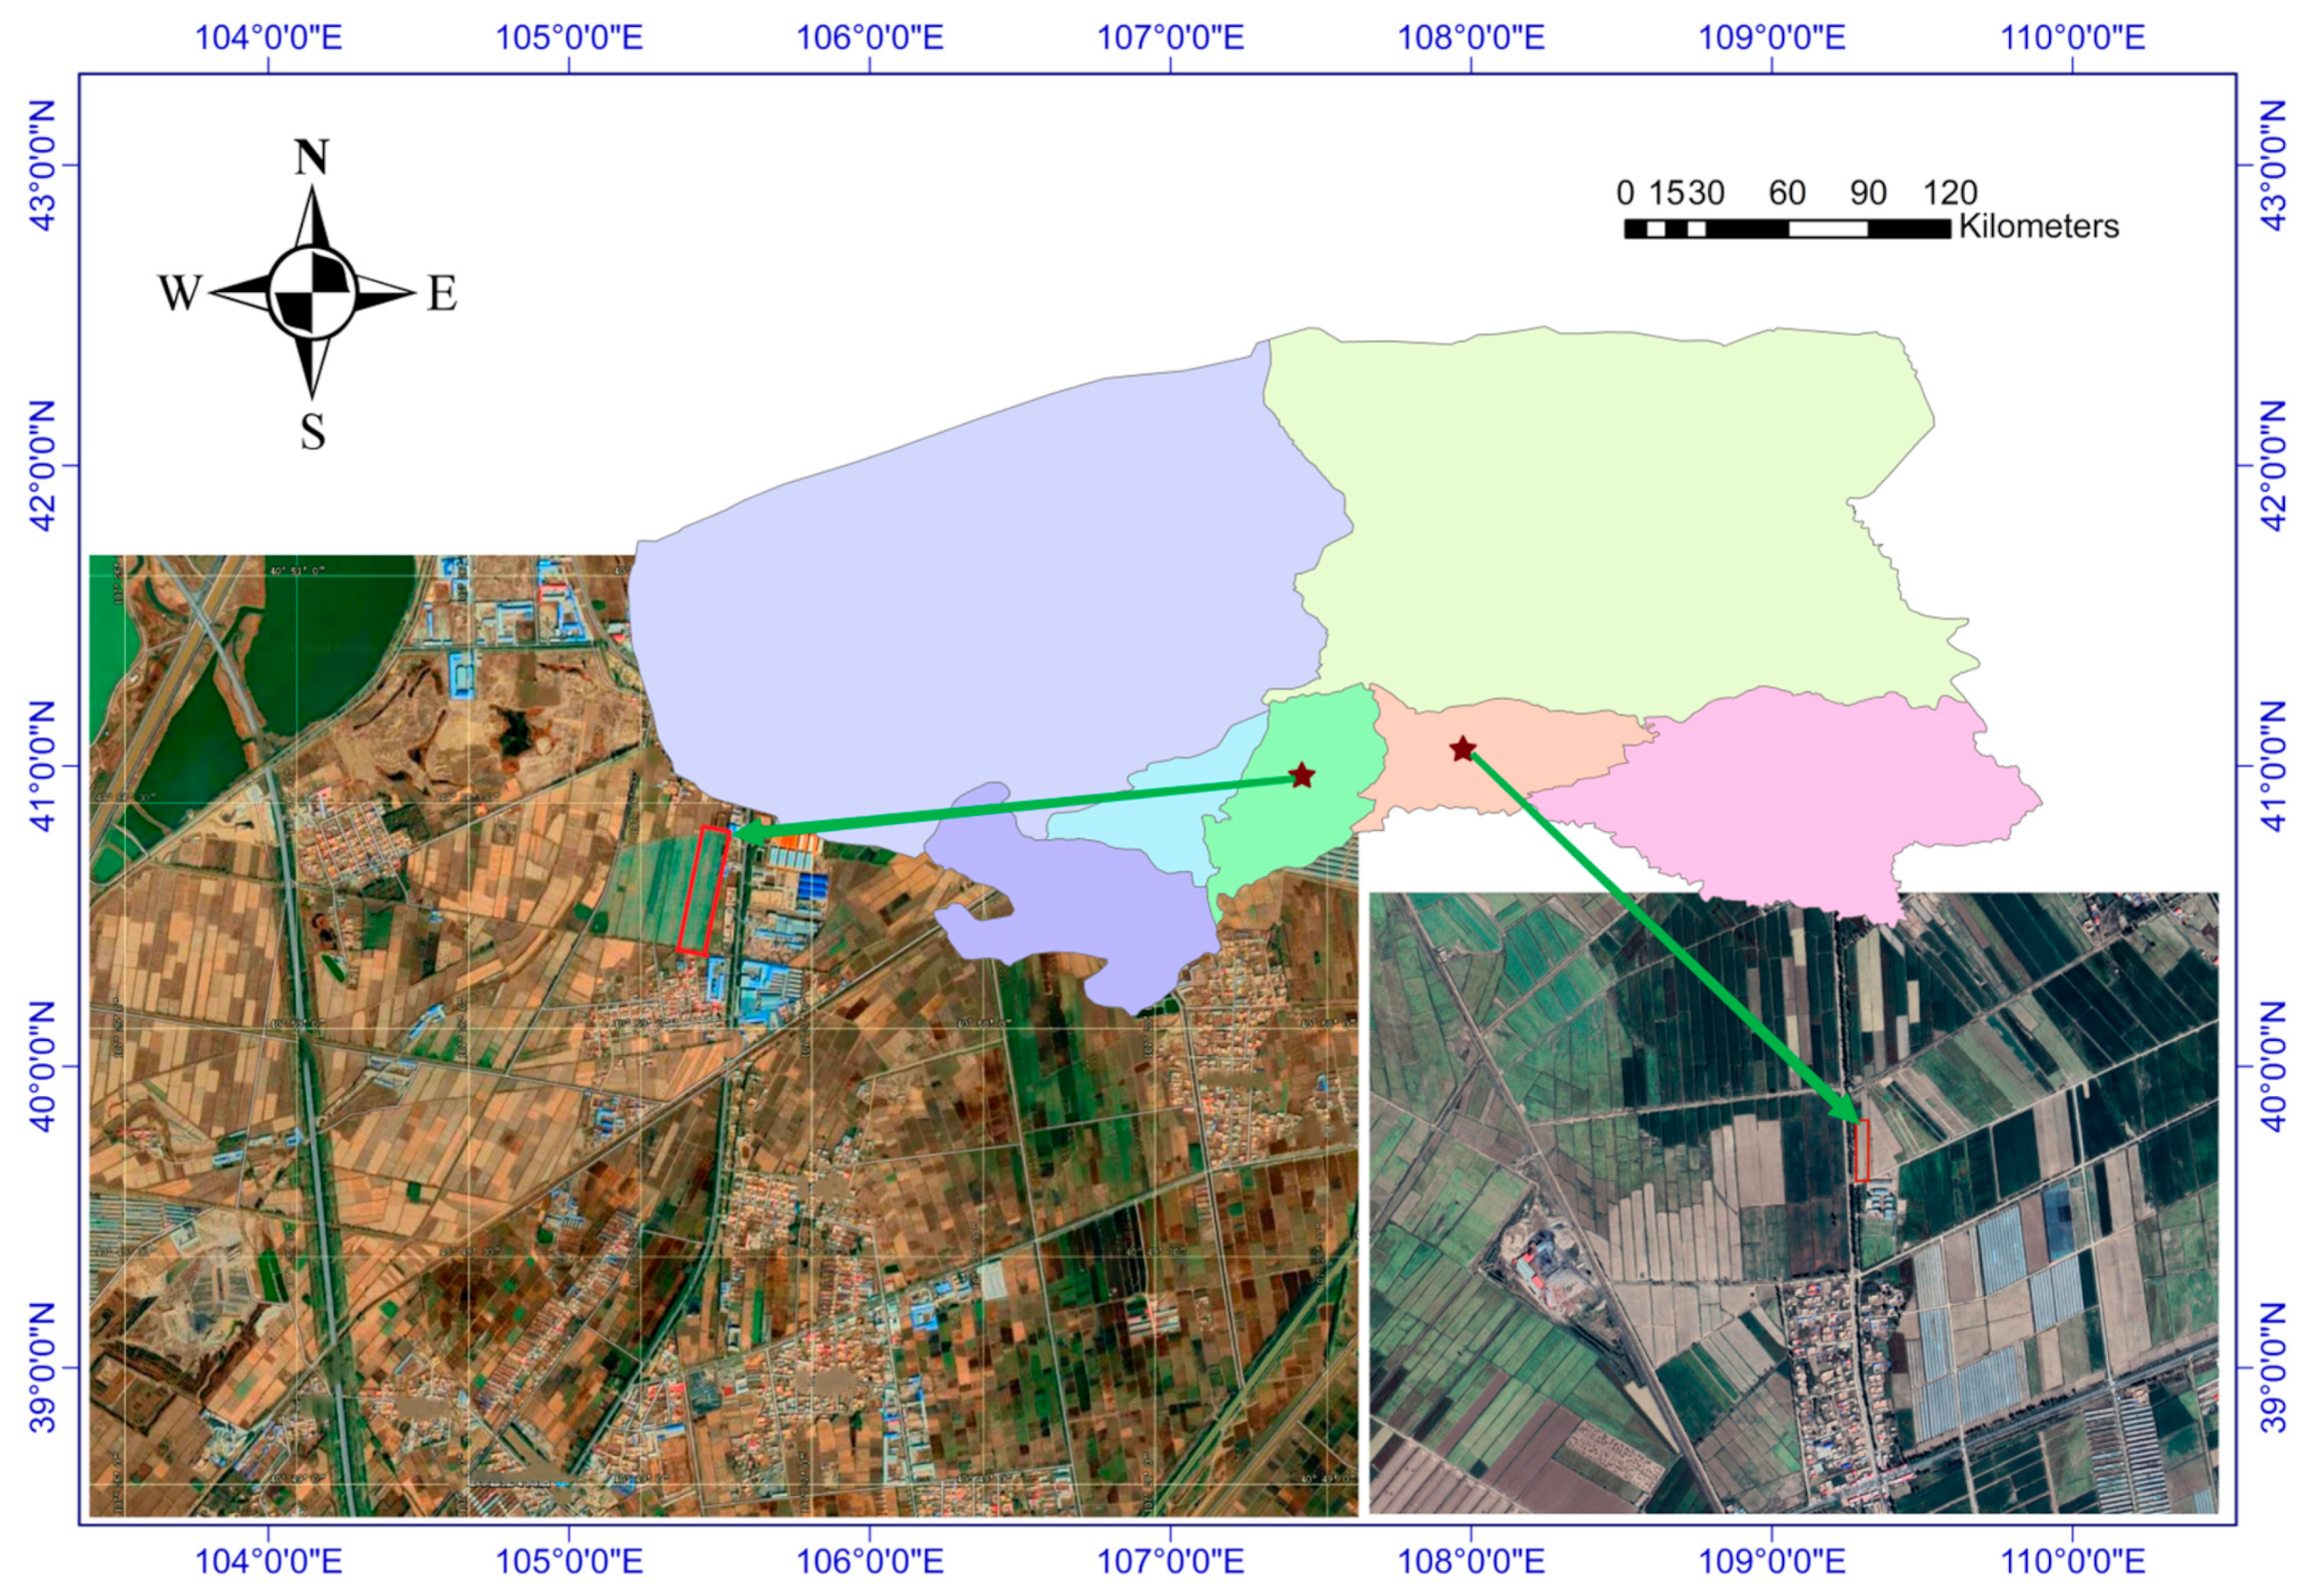
2. Materials and Methods

This study conducted simultaneous field wheat fertilizer control trials at two locations: Xinhua Agricultural Cooperative Farm, Linhe district, and Yonglian village, Xinguangzhong town, Wuyuan county Bayannur city, Inner Mongolia Autonomous Region in 2019 and 2020. The locations of the experimental plots are shown in Figure 1.
The test variety was the locally dominant wheat variety, Yongliang 4. Sowing took place in early March 2019 and 2020, and harvesting took place in late July 2019 and 2020. The seeding rate was 375 kg/hm2, using a wheat planter for seed fertilizer layer seeding with a row spacing of 15 cm. Nitrogen, phosphorus, and potash fertilizers were applied together as the seed fertilizer at the time of sowing, followed by an additional treatment during the jointing stage (3) of the wheat. Irrigation was carried out in a water-saving mode, twice during the whole lifecycle (jointing (3) + flowering (6), each irrigation 900 m3/hm2). Other management measures were in line with conventional wheat cultivation practices. The fertilization experiment included six different modes: CK, farmer model (FM), control of fertilization patterns (CF), control of fertilization-N (CF-N0), control of fertilization-P (CF-P0), and control of fertilization-K (CF-K0). Details of the specific fertilization rates and methods are shown in Table 1.
Digital image data were collected in late May (tasseling stage (5)), mid-June (filling stage (7)), and early July (maturity stage (8)) in 2019. A DJI Royal MAVIC 2 Professional Edition (Manufactured by DJI Innovations (Shenzhen, China) Co., Ltd., DJI unmanned aerial vehicles (UAVs) are produced at the DJI UAV production base in Chengdu, China. All lenses were purchased from the same company.) equipped with a Hasselblad L1D-20c camera was used for high-definition digital photography. The camera features a new 1-inch 20-megapixel CMOS sensor, a built-in wide-angle lens with a 28 mm equivalent focal length, an adjustable aperture value ranging from f/2.8 to f/11, and a maximum sensitivity of 12,800. The study collected and stored digital images in the TIF format. The drone’s flight lasted approximately 30 min. To minimize the impact of external factors on image acquisition, the study was conducted between 10:00 and 14:00 under clear and cloudless sky conditions. Radiometric correction was carried out using a black-and-white board to minimize errors, and the UAV was flown at an altitude of 50 m.
Digital image indices have been effectively used to estimate plant physiological and biochemical parameters, such as leaf area index, biomass, and nitrogen content. This effectiveness was due to their ability to enhance vegetation information, reduce the impact of non-vegetation elements on plant mapping features, and improve the accuracy of remote sensing inversion. This study screened digital image indices for monitoring wheat growth research, integrating insights from previous studies with a pre-analysis of experimental data. The name of each digital image index and the formula used to calculate it are shown in Table 2 below:
The study examined plant parameters, including leaf area (PLA), leaf area index (LAI), chlorophyll SPAD, dry matter accumulation (DMA), fluorescence parameters (Fv/Fm), intercellular CO2, concentration (Ci), stomatal conductance (Gs), net photosynthetic rate (NPR), transpiration rate (Tr/E), water use efficiency (WUE), spike number (PN), grain number (GN), thousand grain weight (TKW), yield (Y), and plant nitrogen content (NC).
The study also measured the stem and leaf nitrogen content (SLNC), stem and leaf phosphorus content (SLPC), stem and leaf potassium content (SLKC), seed nitrogen content (KNC), seed phosphorus content (KPC), kernel potassium content (KKC), glume nitrogen content (GNC), phosphorus content of glumes (GPC), potassium content of glumes (GKC), number of spikes (PN), number of grains in spikes (GN), thousand kernel weight (TKW), and yield (Y), with corresponding vegetation indices.
The study utilized the correlation coefficient (r) to measure the degree of correlation between wheat digital image indices and physiological growth characterization parameters. The coefficient was calculated using the following formula:
r = ( x x ¯ ) ( y y ¯ ) ( x x ¯ ) 2 ( y y ¯ ) 2
The correlation coefficient (r) indicates the degree of linear relationship between two variables. A correlation between two variables can be positive, negative, or non-existent, indicated by 1 ≥ r > 0, −1 ≤ r < 0, and r = 0, respectively. The absolute value of r indicates the strength of the correlation. To determine the significance of the correlation coefficient, refer to the critical value table for correlation coefficients. Significance levels are denoted by * and ** at the 0.05 and 0.01 levels, respectively.
As indicated in Table 3, the analysis of variance (ANOVA) demonstrated significant differential effects of fertilization treatments on the digital image indices G, B, and INT. No significant effects were observed on the remaining indices.
The data of wheat physiological indexes in this experiment were determined by a portable photosynthesis meter (Manufacturer: Hansatech Instruments Ltd.—China Headquarters of PP Systems (Affiliated with Hansatech Instruments Ltd.), Amesbury, MA, USA), chlorophyll fluorometer (The SPAD-502PLUS chlorophyll meter is manufactured by Konica Minolta Sensing, Inc. in Osaka, Japan), Kjeldahl nitrogen meter (The fully automatic Kjeldahl nitrogen analyzer (K9860) is manufactured by Shanghai Licheng Scientific Instrument Co., Ltd., Shanghai, China), and FOSS grain analyzer (The FOSS Infratec TM 1241 near-infrared grain quality analyzer is manufactured by Foss (Beijing, China) Science and Trade Co., Ltd.). Adobe Photoshop CC 2018 software was used for digital image processing. Non-wheat leaf information was excluded from the experimental plots after segmenting the images based on different fertilization treatments. The red (R), green (G), and blue (B) values from each treatment plot and the two-year trial plots were extracted and used to compute the average of each digital image index. The R programming language was used for calculating, correlating, analyzing, and graphing each variable.

3. Results

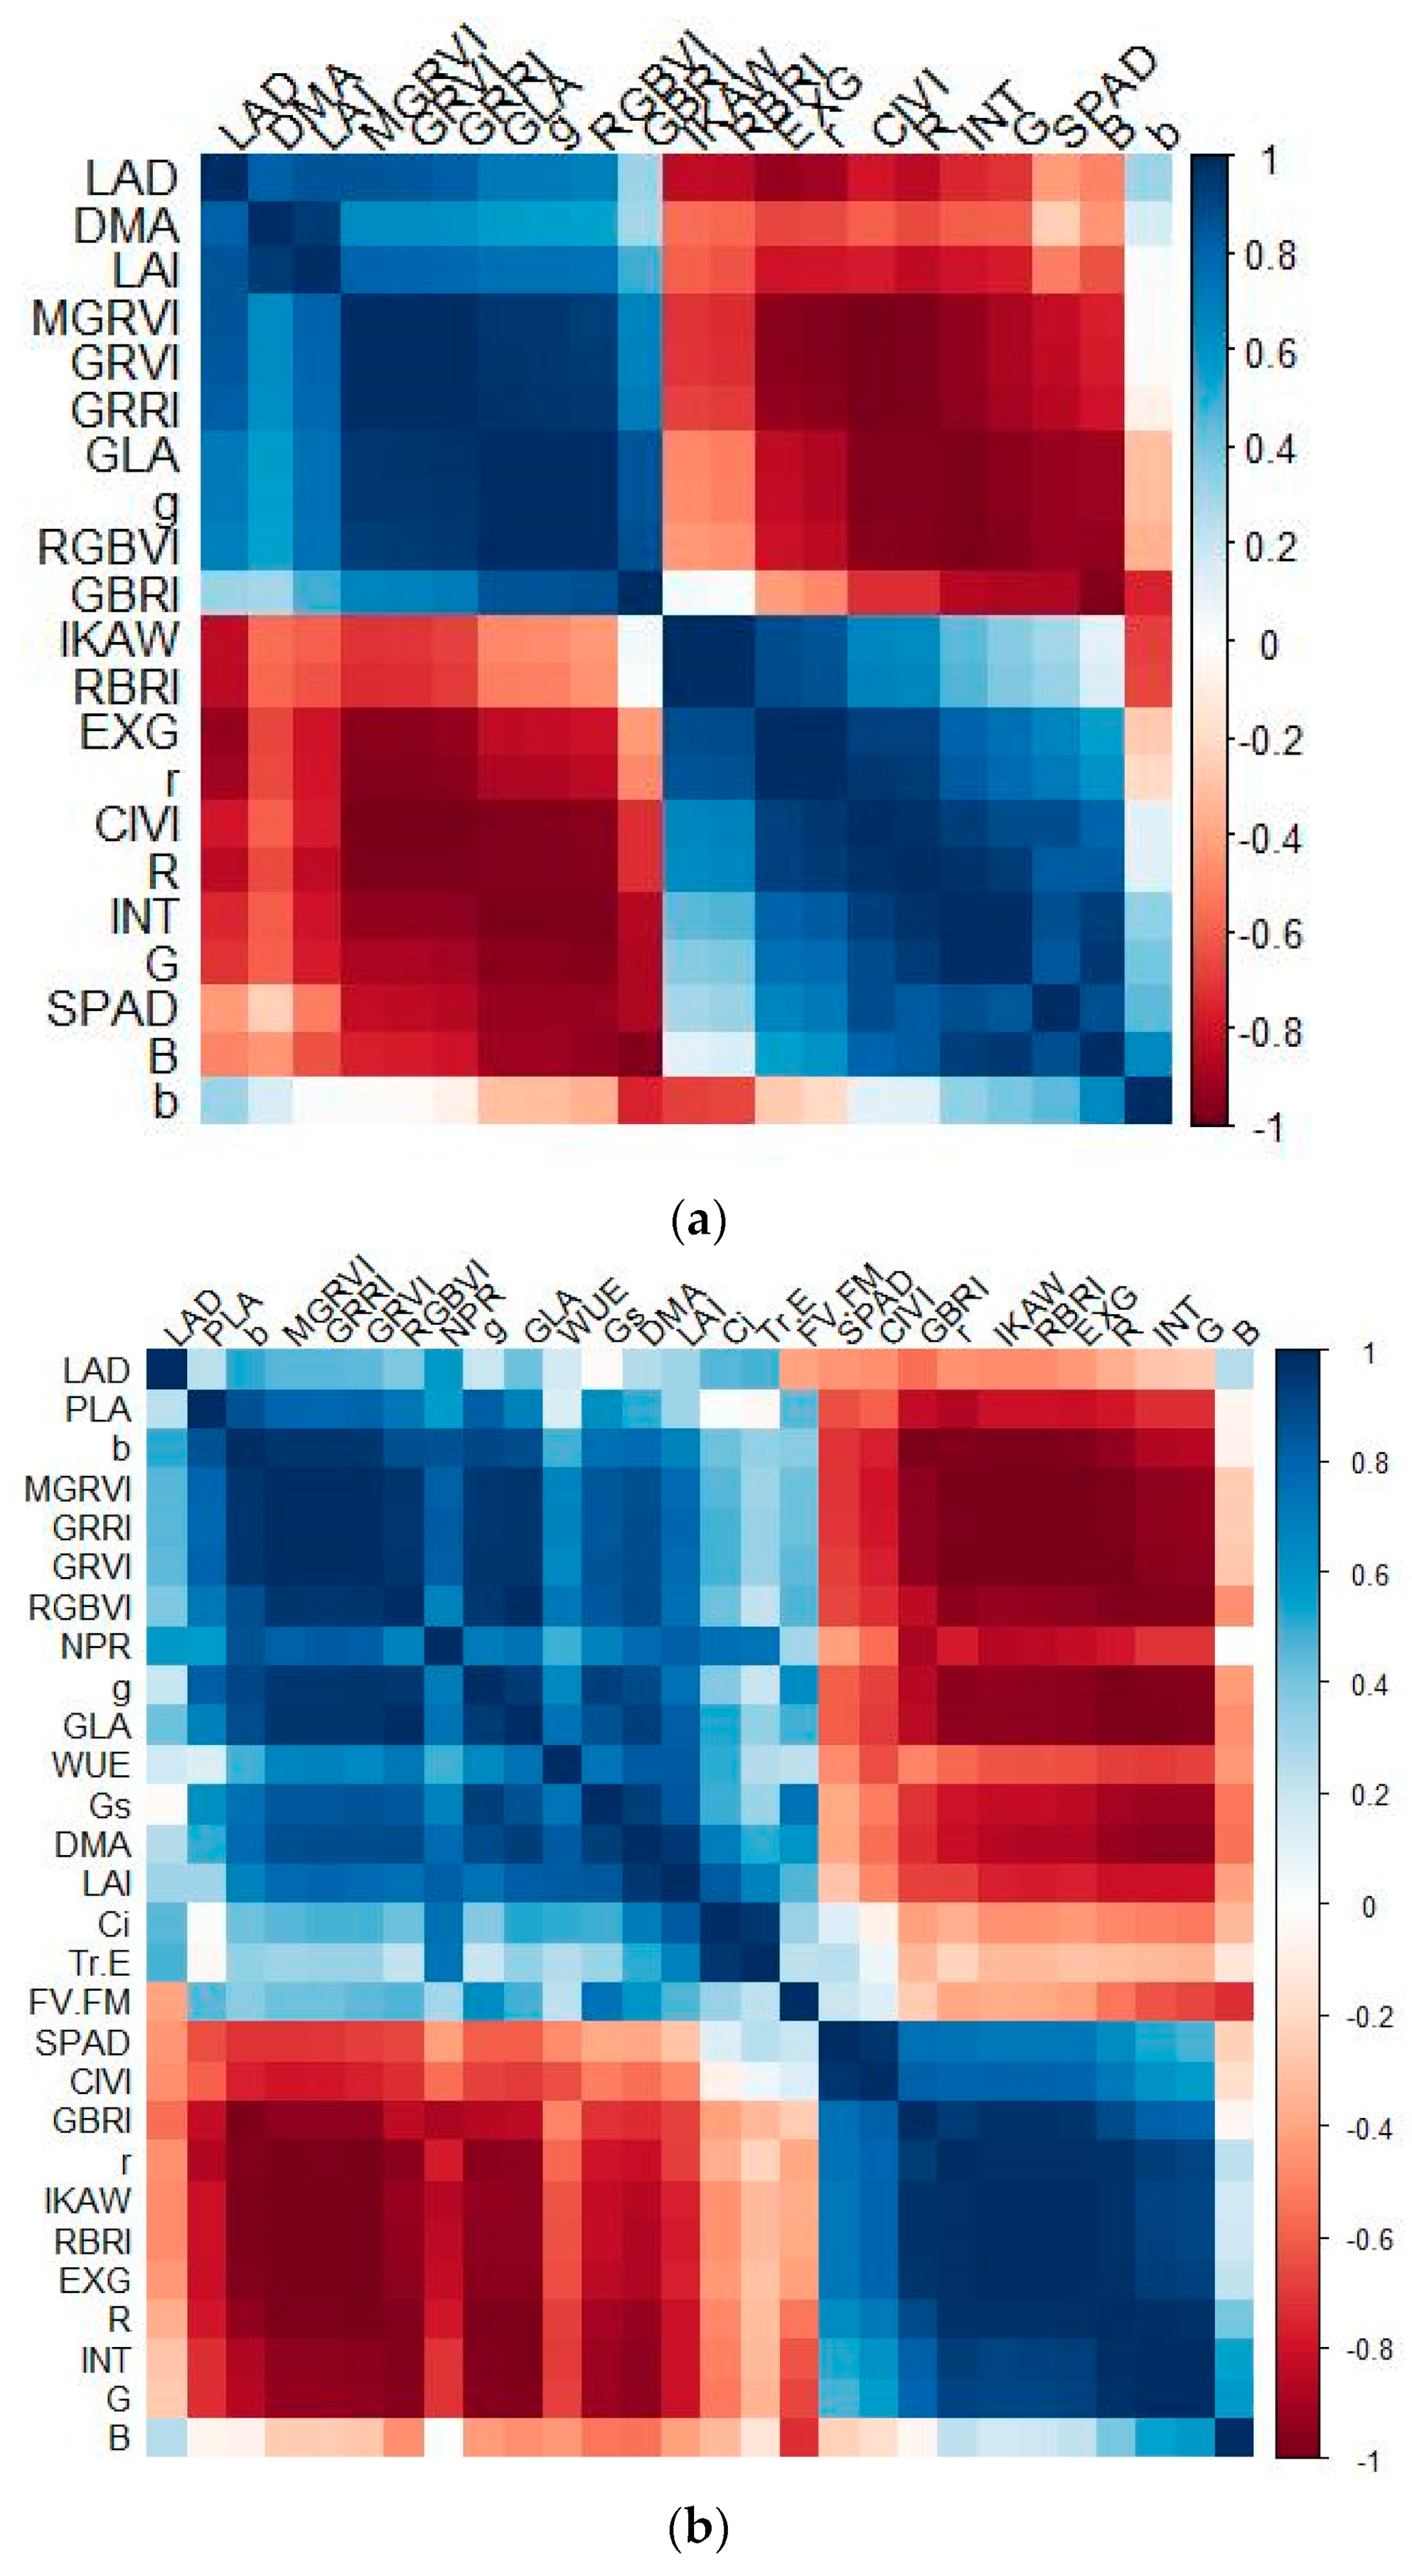
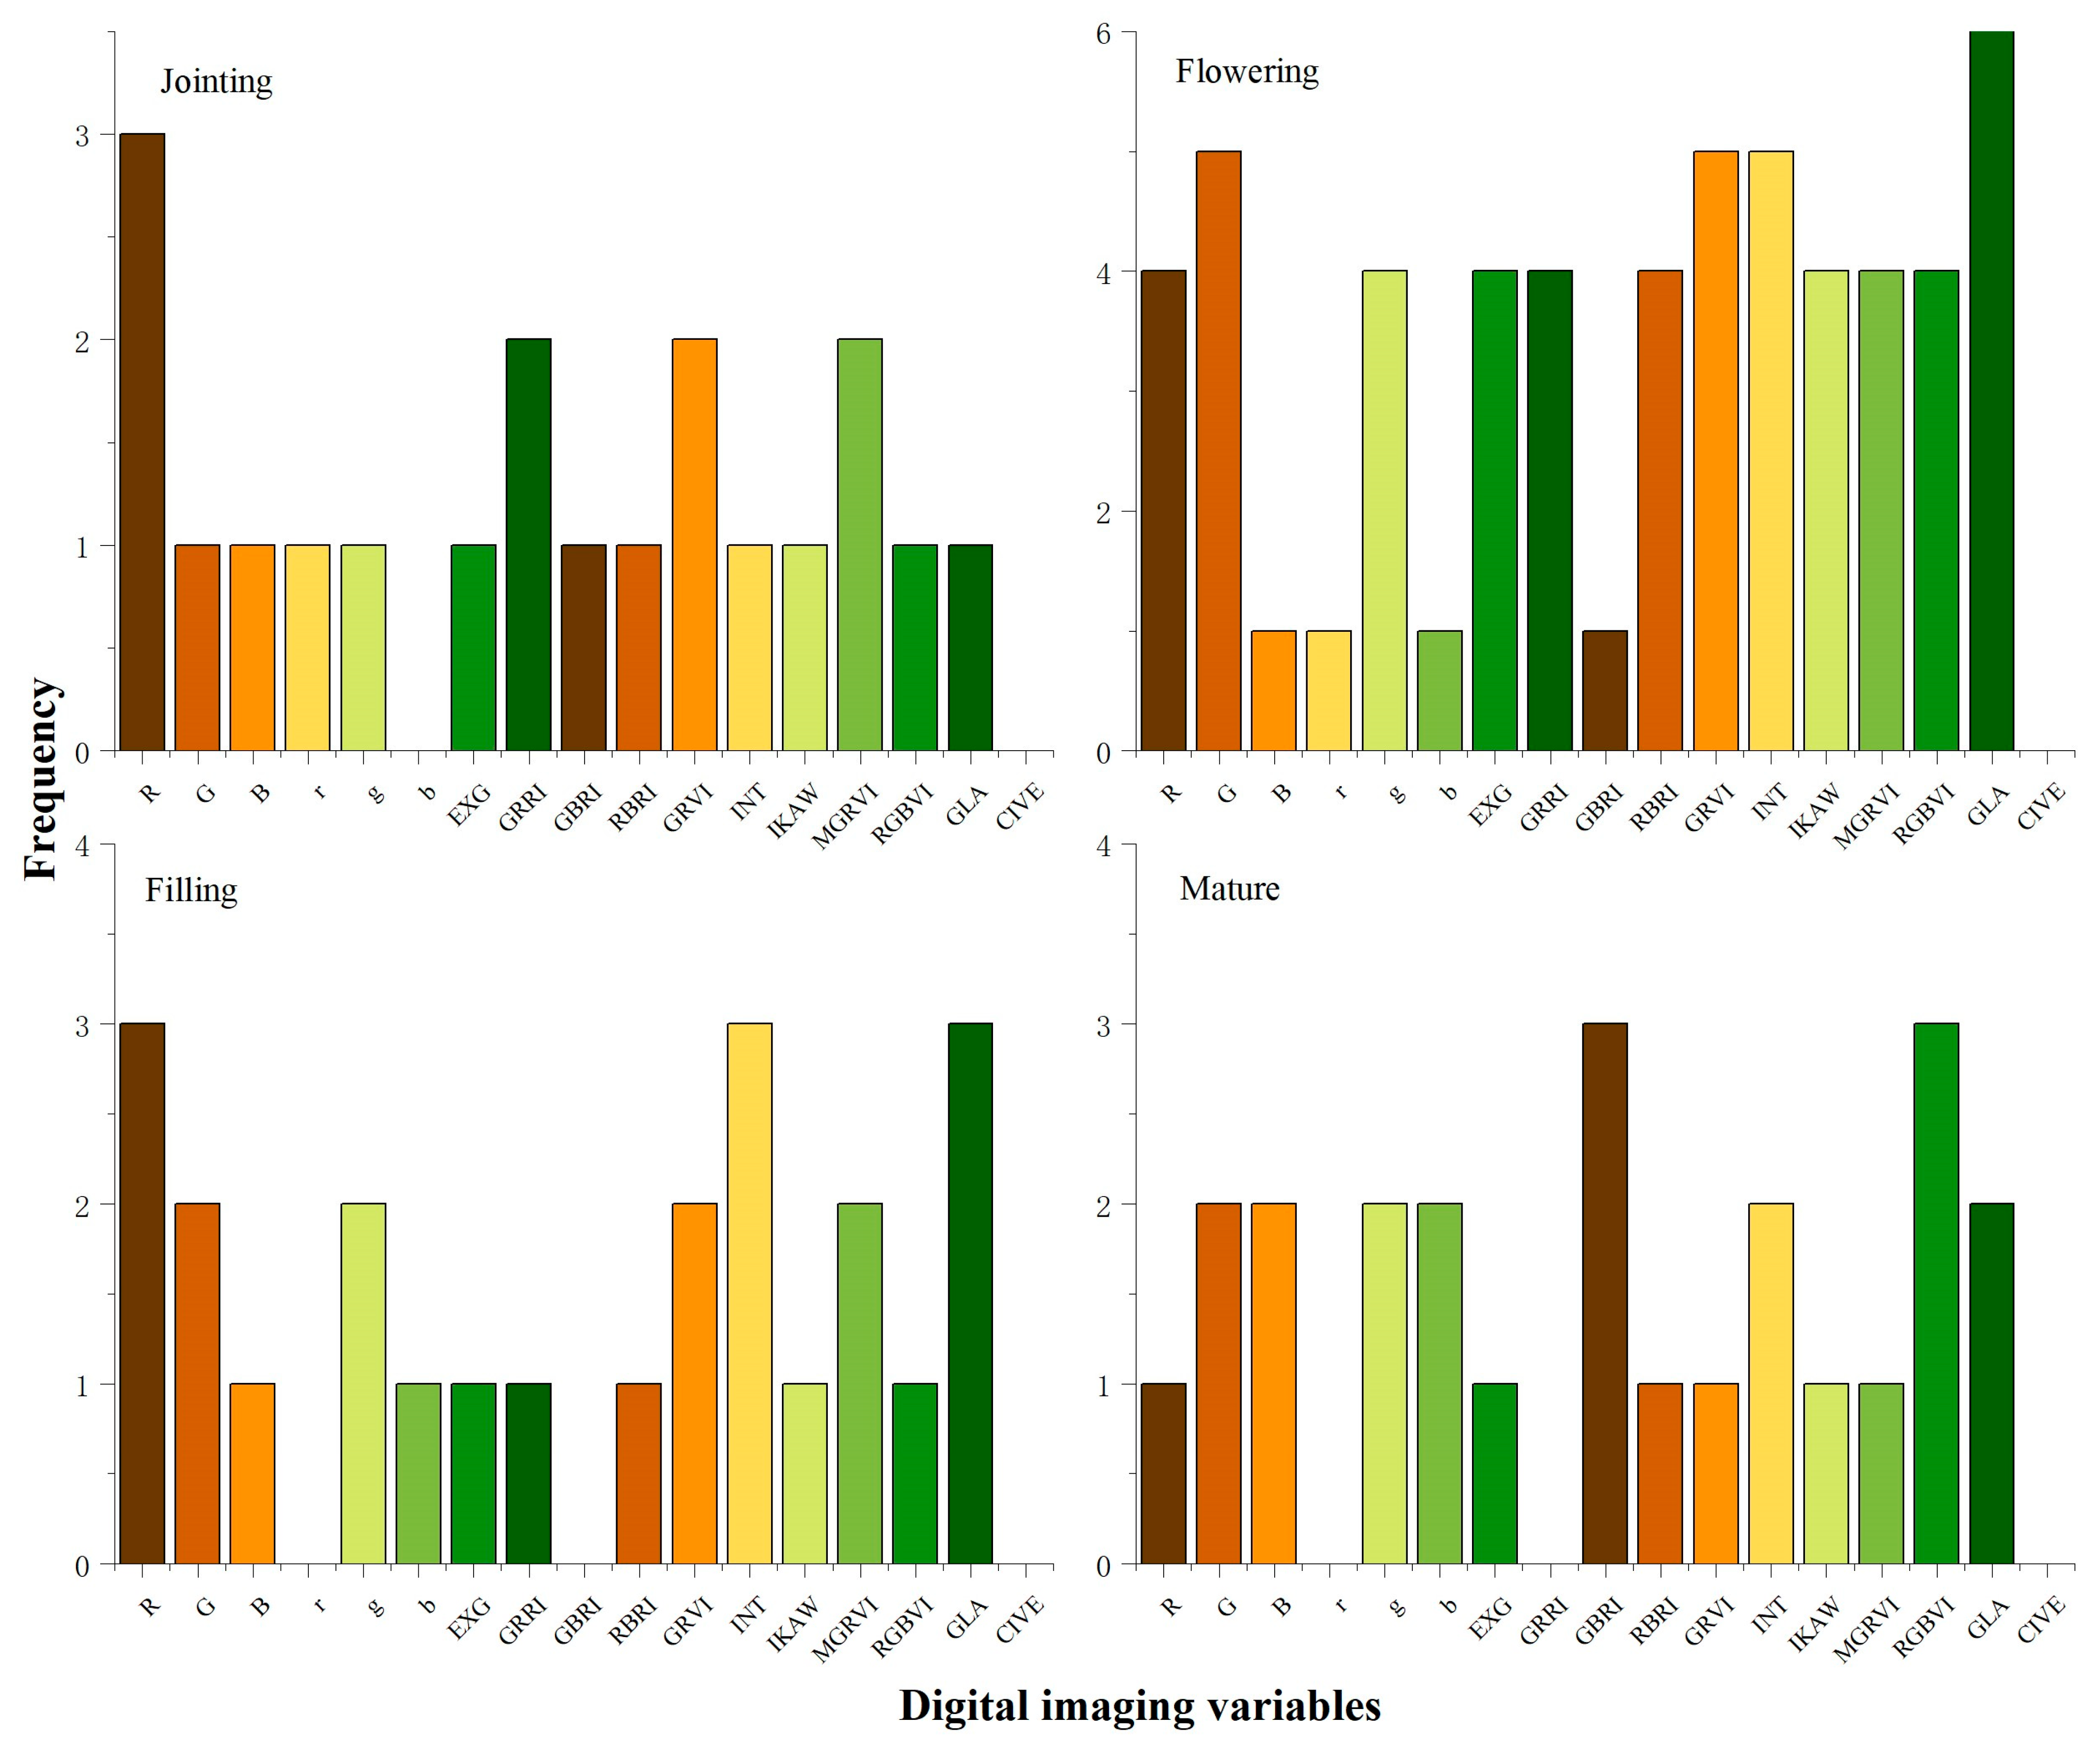
3.1. Relationships between Digital Image Indices and Wheat Physiological Indicators at the Time of Jointing and Flowering

The analysis involved correlating wheat physiological indices SPAD, LAI, LAD, and DMA with each digital image index. During the wheat jointing stage (3), the SPAD value showed a highly significant negative correlation with the g, RGBVI, and GLA indices. Additionally, it showed a significant correlation with the GRRI, GBRI, GRVI, and MGRVI indices and a significant positive correlation with the R, G, B, INT, and CIVE indices. The LAI values showed a significant negative correlation only with R. The LAD had a highly significant negative correlation with the EXG index, a significant negative correlation with the R, r, RBRI, and IKAW indices, and a significant positive correlation with GRRI, GRVI, and MGRVI. On the other hand, DMA, PN, GN, TKW, and Y did not show any significant correlation with any of the digital image indices (Figure 2a).
A highly significant positive correlation was observed between the SPAD of wheat during the flowering stage (6) and the CIVE index (Figure 2b). The single plant leaf area (PLA) showed a significant positive correlation with the g and b indices and a significant negative correlation with the r, EXG, and GBRI indices. The correlation analysis revealed that the leaf area index (LAI) was positively correlated with the green leaf area index (GLA). On the other hand, the dry matter content (DMA) showed a highly significant positive correlation with the red (R), green (G), and near-infrared (INT) indices and a highly significant negative correlation with the GLA index. Furthermore, DMA exhibited significant negative correlations with the red edge (r), excess green (EXG), red–blue ratio index (RBRI), and inverse difference vegetation index (IKAW) and significant positive correlations with the green (g), green–red ratio index (GRRI), modified green–red index (MGRVI), and red–green–blue index (RGBVI). Stomatal conductance had a negative correlation with the G and INT indices, and a positive correlation with the g index. Additionally, stomatal conductance had negative correlations with the R, EXG, RBRI, and IKAW indices, and positive correlations with GRRI, GRVI, MGRVI, RGBVI, and GLA, all of which showed high or significant levels of correlation. In contrast, the net photosynthetic rate showed positive correlations with the b, GRRI, GRVI, and MGRVI indices and negative correlations with the EXG, GBRI, RBRI, and IKAW indices. However, the fluorescence parameters, intercellular CO2 concentration, transpiration rate, and water use efficiency did not show significant correlations with any of the digital image indices.

3.2. Relationships between Digital Image Indices and Wheat Physiological Indicators at the Time of Filling and Maturing

During the wheat filling stage (7), the correlations between the wheat physiological indicators SPAD, LAI, LAD, and DMA and each digital image index were analyzed. SPAD had a highly significant negative correlation with the EXG and CIVE indices and a highly significant positive correlation with the GRRI, GRVI, and MGRVI indices. SPAD had significant positive correlations with the g, RGBVI, and GLA indices and significant negative correlations with the R, G, and INT indices (see Figure 3a). In addition, LAI had significant negative correlations with the R, G, INT, and CIVE indices and significant positive correlations with the g and GLA indices. Conversely, the LAD showed significant negative correlations with the RBRI and IKAW indices and a significant positive correlation with the b index. Similarly, the DMA had significant negative correlations with the EXG and CIVE indices and significant positive correlations with the GRRI, GRVI, and MGRVI indices.
At the wheat maturity stage (8), physiological indices, such as DMA and plant nitrogen content, were correlated with each digital image index in Figure 3b. The analysis revealed significant positive correlations between DMA and the g, GBRI, RBRI, IKAW, RGBVI, and GLA indices and significant negative correlations with the R, G, B, b, INT, and CIVE indices. No significant correlations were found between the plant nitrogen content (NC), stem and leaf nitrogen content (SLNC), stem and leaf phosphorus content (SLPC), kernel nitrogen content (KNC), kernel phosphorus content (KPC), glume nitrogen content (GNC), glume phosphorus content (GPC), number of spikes (PN), number of grains in a spike (GN), thousand kernel weight (TKW), and yield (Y) and any of the digital image indices. The stem and leaf potassium content (SLKC) had significant negative correlations with the R, G, B, and INT indices. Additionally, the seed potassium content (KKC) showed significant negative correlations with the g, GBRI, RGBVI, and GLA indices but significant positive correlations with the b and CIVE indices. Furthermore, the glumes’ potassium content (GKC) showed significant positive correlations with the g, GBRI, GRVI, MGRVI, RGBVI, and GLA indices but significant negative correlations with the EXG and CIVE indices.

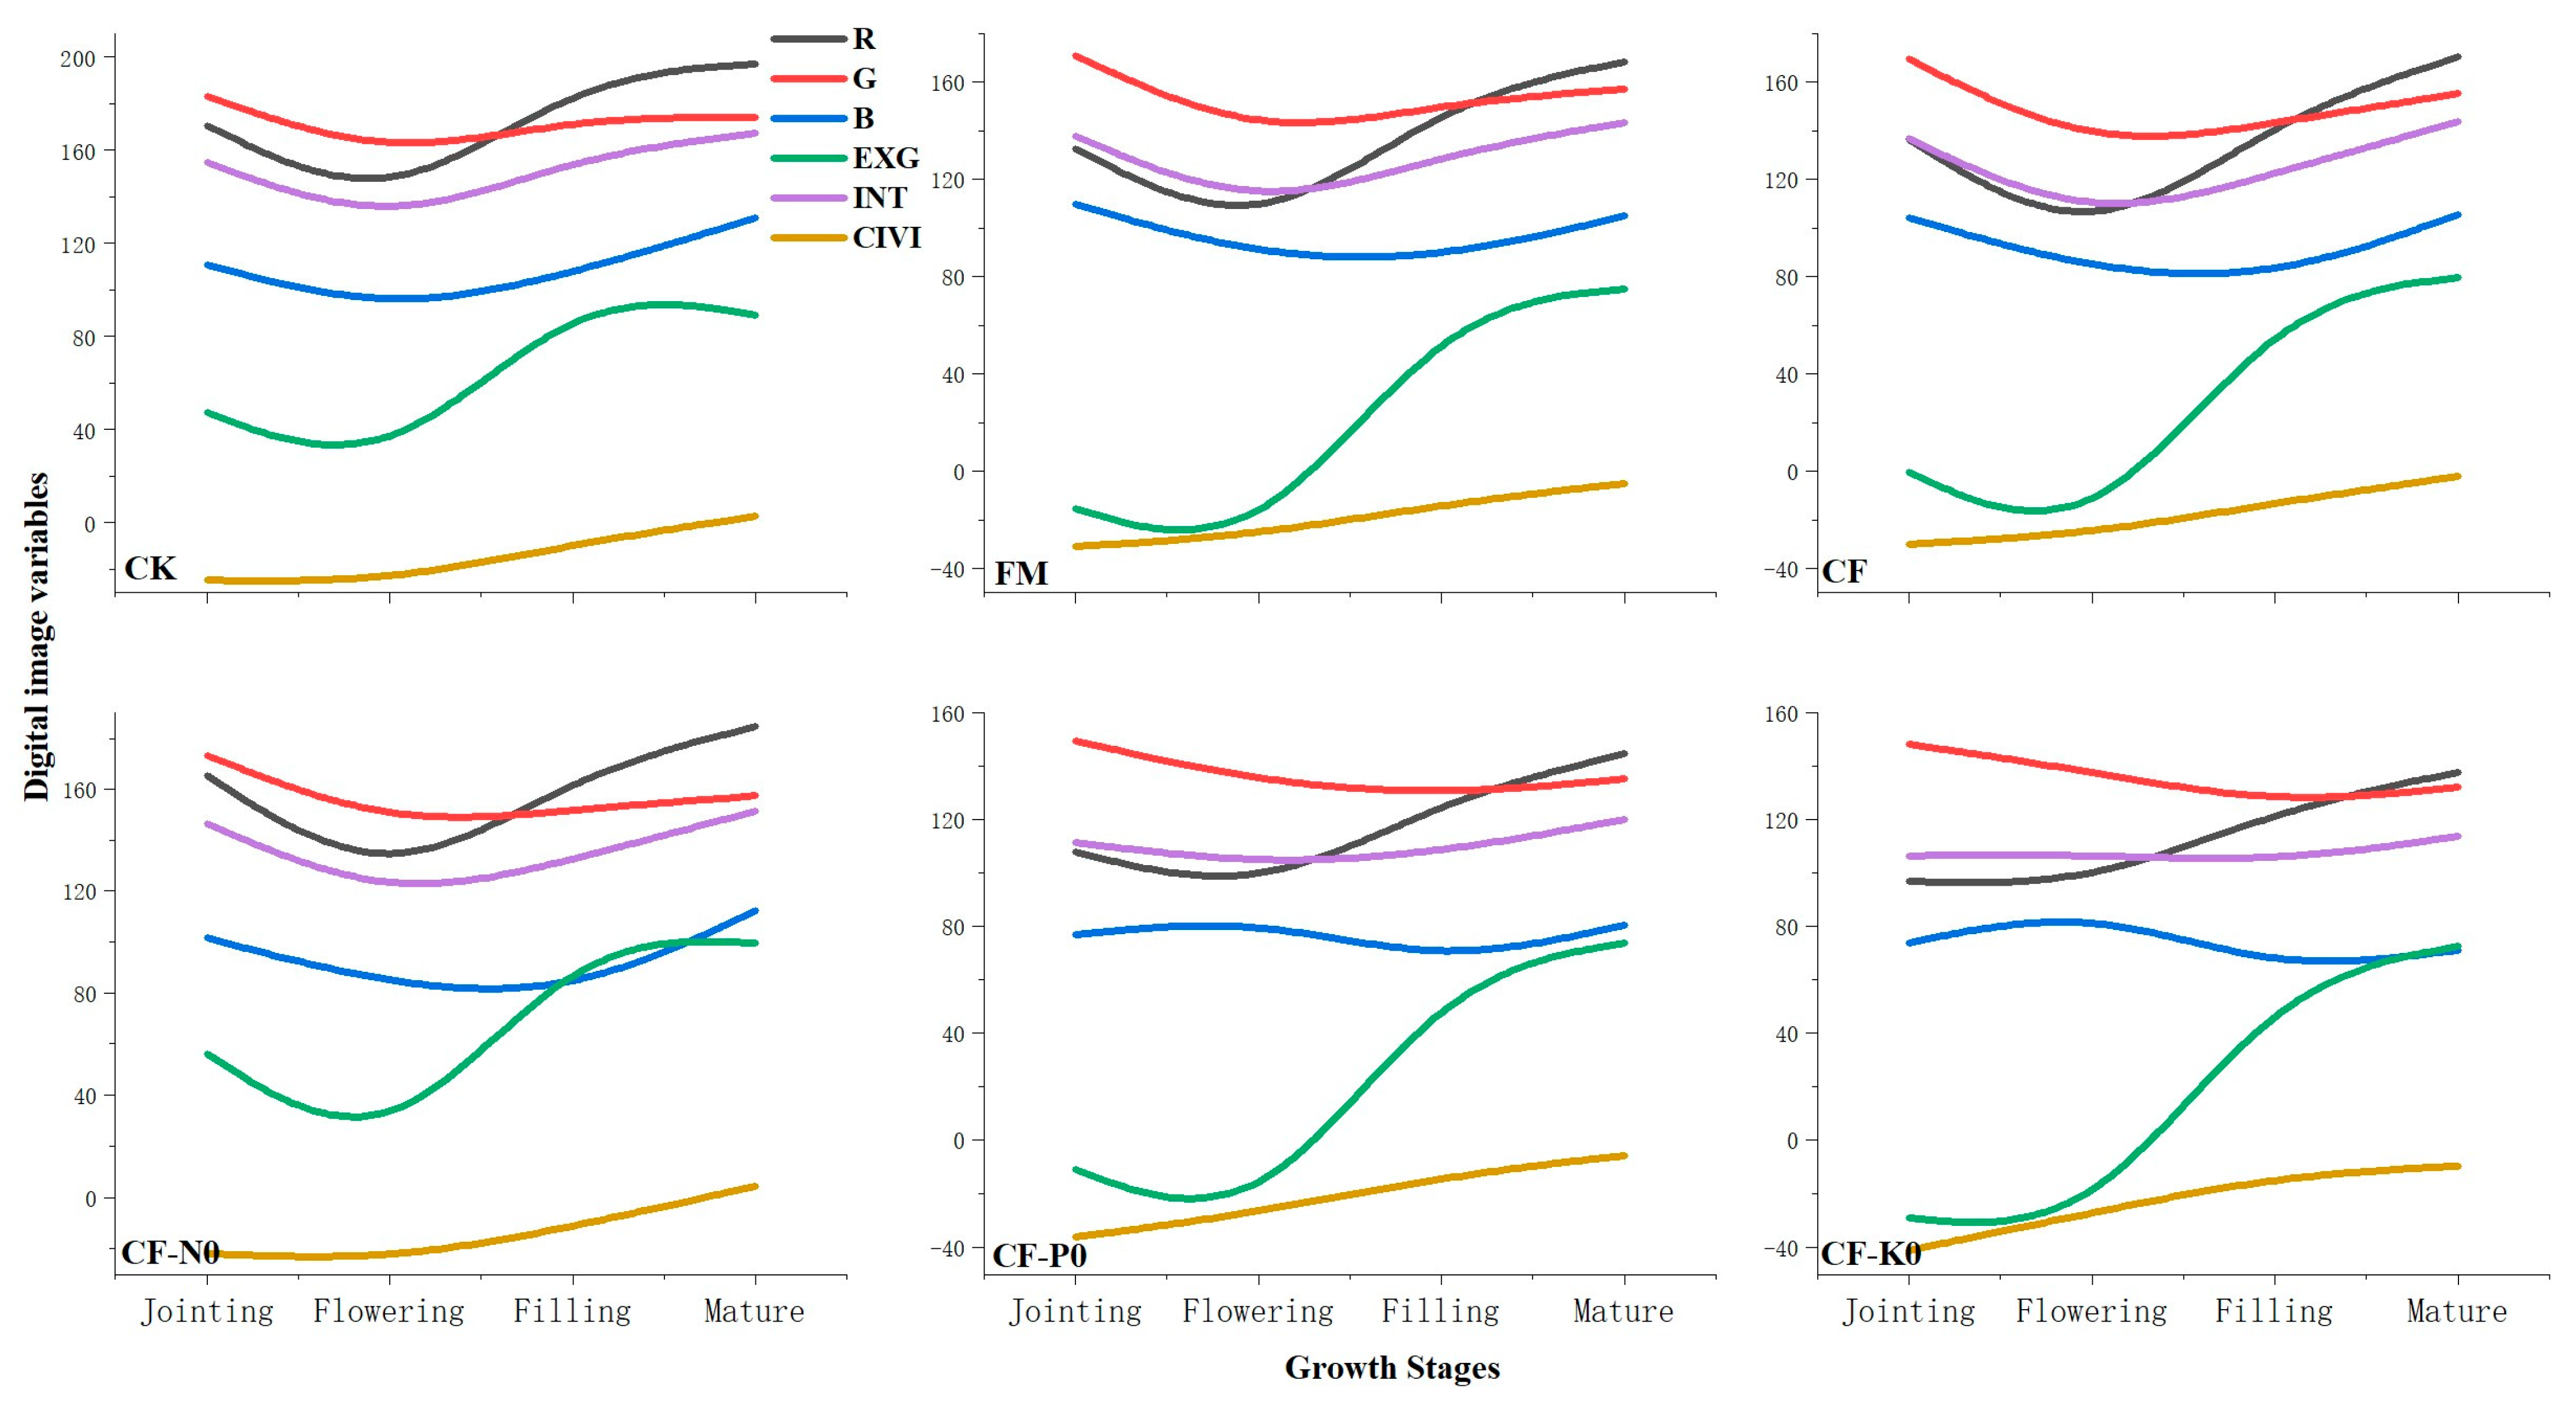
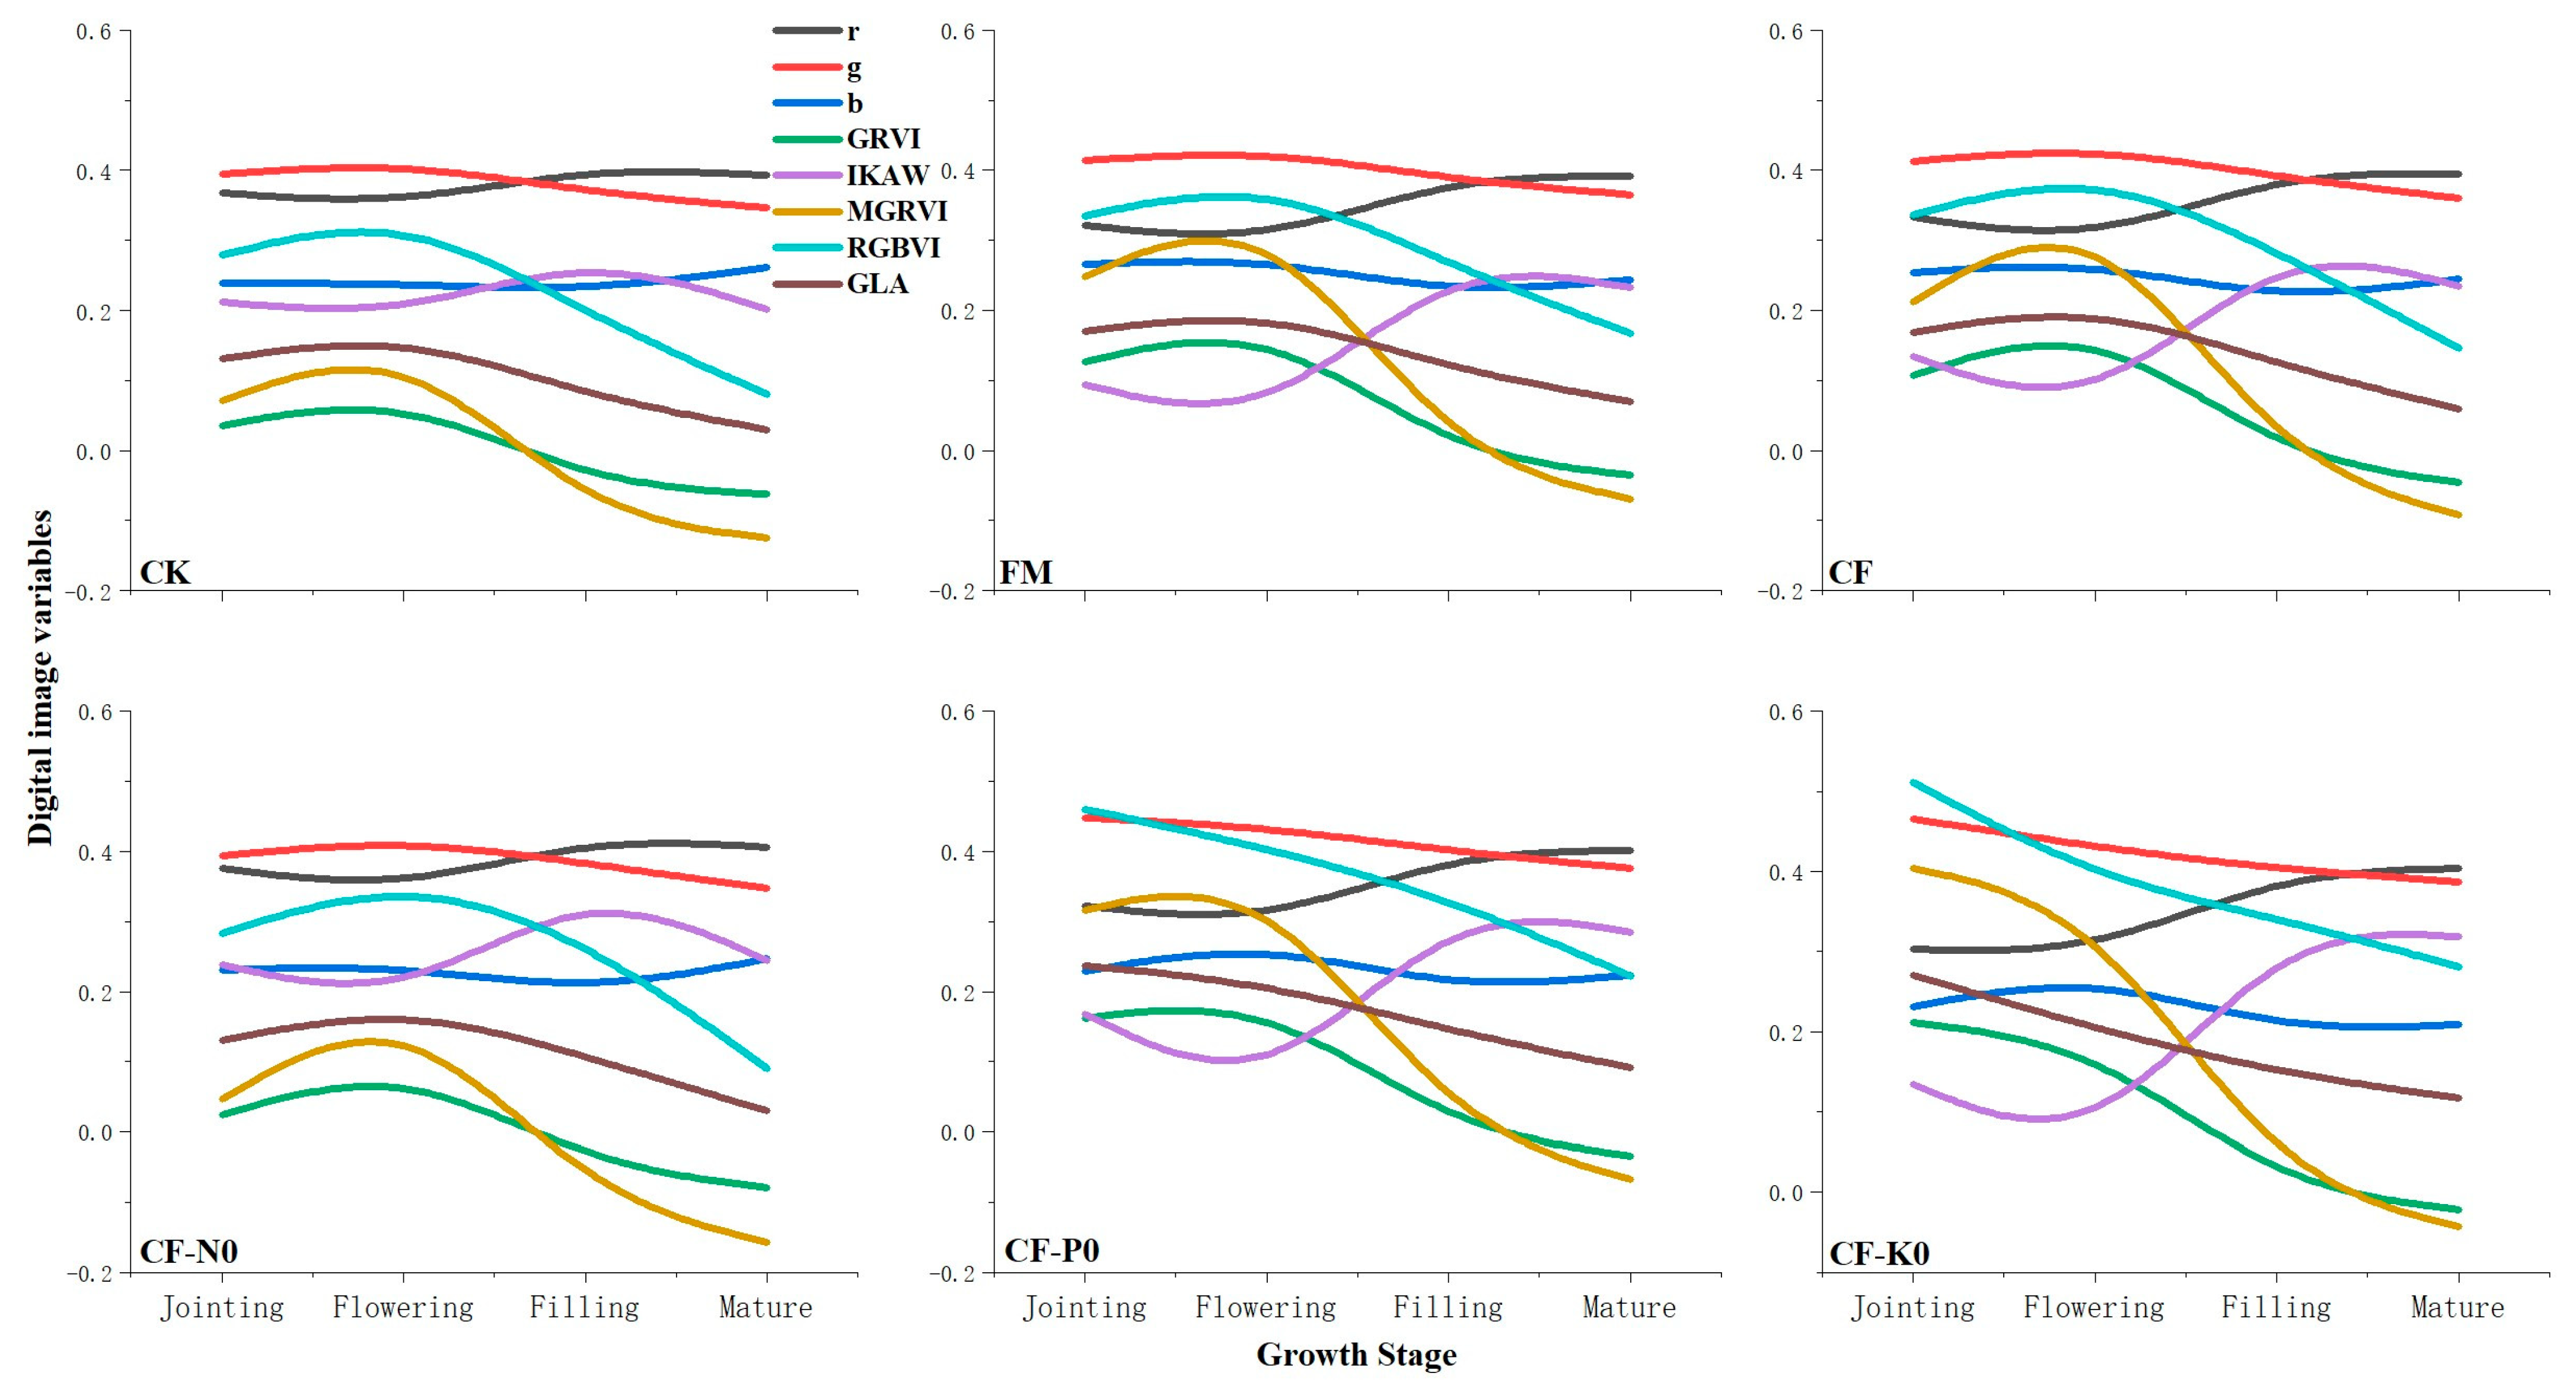
3.3. Changes in Digital Image Indices during Various Fertile Stages of Wheat under Fertilizer Treatments

Figure 4 shows the differences and variations over time in wheat digital image indices across different fertilization treatments. The values of each digital image index were higher in the CK and CF of fertilization treatments compared to the other fertilization treatments. The index B of the digital image showed an increasing trend followed by a decreasing trend in the CF-P0 and CF-K0 fertilization treatments, while it displayed a decreasing trend followed by an increasing trend in other fertilization treatments. On the other hand, the digital image index INT showed a more gradual change in the CF-P0 and CF-K0 fertilization treatments, while it displayed a distinct trend of decreasing followed by increasing in other fertilization treatments. Additionally, the index of INT, which represents the digital image, changed at a slower rate in the CF-P0 and CF of fertilization treatments. In contrast, it exhibited a relatively stable trend in the CF-P0 and CF-K0 fertilization treatments. However, in other fertilization treatments, it displayed a trend of initially decreasing followed by an increase.
The digital image index GRRI showed a low value in the CK of the fertilization treatment and a relatively higher value in treatments with nitrogen application. The digital image indices GBRI and RBRI displayed an increasing trend with fertility in the CK of the fertilization treatment while showing a decreasing–increasing–decreasing trend in treatments with nitrogen application. The RBRI digital image index underwent a slight change in the CK of the fertilization treatment and a relatively significant change in treatments with nitrogen application (Figure 5). Figure 6 shows that the digital image indices GRVI and MGRVI had lower values in the CK of the fertilization treatment but relatively higher values in treatments with nitrogen application. Both indices exhibited a trend of increasing and then decreasing in correlation with the fertility process. The digital image index IKAW underwent a minor change in the CK of the fertilization treatment but a relatively significant change in treatments with nitrogen application. The other digital image indices did not show sensitivity to the nitrogen application treatments.

4. Discussion

Hyperspectral and multispectral remote sensing bands provide abundant and uninterrupted information, enabling precise feature recognition and mapping. However, their use in field production has been limited due to the high cost of equipment, their complex operation, and high technological requirements. Since the early 21st century, coinciding with the widespread use of digital cameras, research into crop growth monitoring using digital images has significantly increased. However, the use of handheld or stationary digital cameras has been limited by low image resolution and restricted indices in digital images, preventing this research from evolving into a self-contained system. On the other hand, UAV digital images have become increasingly popular for small-to-medium-scale crop monitoring in farmlands due to their straightforward operation, relatively low cost, and minimal technical requirements. The DJI MAVIC 2 Professional UAV was chosen for this study because of its widespread use in contemporary applications and its technical parameters and application effects that are ideally suited to meet the requirements of crop production monitoring in research areas.
This study used UAV remote sensing to capture digital images of spring wheat during four crucial fertility stages. The commonly used digital image indices of the crop were analyzed to establish quantitative relationships between these indices and the physiological indicators of wheat during each fertility period. The study aimed to investigate the potential of UAV digital images for monitoring the growth of spring wheat under various fertilization treatments. Based on the correlation analysis results presented in Figure 7, the digital image indices GLA, R, G, INT, g, GRVI, MGRVI, RGBVI, EXG, and GRRI were found to have a higher frequency of significant correlation with physiological indices during the four key reproductive periods of wheat. Therefore, they are considered more suitable for characterizing the physiological indices of wheat. The indices of r and CIVE have a low correlation with physiological indicators across wheat reproductive periods and are not recommended for use in monitoring wheat physiological indicators. The same results have been found in other studies as well [16,17]. EXG, MGRVI, and RGBVI consistently showed strong correlations with biomass and yield across all fertility stages of winter wheat [7]. The present study showed that these indices also exhibited significant correlations with biomass during the flowering period of spring wheat. However, their performance was not exceptional in other fertility periods.
Xiao [18] found a significant correlation between the aboveground biomass of winter wheat during the pulling stage and several digital image indices, including R, G, B, GRRI, GBRI, RBRI, r, g, and b. However, in the present study, no significant correlation was found between the aboveground biomass at the jointing stage of spring wheat and any of the digital image indices. Both studies found a significant correlation between the digital image indices R, G, and GBRI and changes in SPAD. The results of this study indicate that digital image indices R, G, and B exhibit significant negative correlations with biomass at all fertility periods in spring wheat. Similar findings were observed in studies on rice, maize, and spring wheat [18,19,20]. Umut [21] concluded that the digital image indices RGBVI and GLA were significantly correlated with the leaf area index (LAI) in spring wheat. Similarly, the present study found a significant positive correlation between the digital image index GLA and LAI in spring wheat at filling and mature stages. However, RGBVI did not exhibit a significant correlation with LAI. The study found a strong correlation between digital image indices and physiological indices of wheat during the flowering stage. The mean correlation coefficients were flowering (6) (0.638) > filling (7) (0.626) > maturity (8) (0.548) > jointing (3) (0.523). In contrast, Yang [7] found that the correlation coefficients for winter wheat digital image indices with biomass and yield at different fertility periods followed the order of jointing, flowering, tasseling, and pre-overwintering. The difference in the above results may be due to variations in wheat planting times. The ANOVA results indicate that the various fertilization treatments had significant differential effects only on the digital image indices G, B, and INT. The colors in the UAV images appeared more saturated during the wheat flowering stage compared to the jointing stage; this is mainly due to the fact that the indices lose sensitivity at this stage [22,23,24]. During the later stages of wheat fertility, the digital image index showed a significant correlation with potassium content in all parts of the plant. However, there was no significant correlation with nitrogen and phosphorus. These findings are consistent with a study conducted by Shi and Wang [25,26]. While several representative and complementary imaging indices and indicators were screened in this study, the current study has certain limitations in its selection of digital image indices and physiological indicators. Future research will seek to expand and enrich the relevant aspects examined in this study.

5. Conclusions

UAV digital images have become increasingly popular for small-to-medium-scale crop monitoring in farmlands due to their straightforward operation, relatively low cost, and minimal technical requirements. This advancement in unmanned aerial vehicle (UAV) digital image monitoring technology and methods will enable its application to other crops and further promote the development of UAV remote sensing monitoring. The DJI MAVIC 2 Professional UAV was chosen for this study because of its widespread use in contemporary applications and its technical parameters and application effects that were ideally suited to meet the requirements of crop production monitoring in the research areas. On the other hand, several digital image indices, such as GLA, R, G, INT, g, GRVI, MGRVI, RGBVI, EXG, and GRRI, showed significant correlations with physiological indices during the four primary reproductive stages of wheat. Specifically, these digital image indices could effectively characterize the physiological indices of spring wheat during the flowering stage (6). The results of this experiment showed that UAV digital images could effectively carry out nondestructive inspections of crops and provide a new way to monitor the growth status of wheat in the river-loop area.

Author Contributions

M.X.: writing—original draft. Y.Z.: supervision. J.L.: investigation. L.L.: investigation. P.Z.: formal analysis. Q.W.: visualization. M.L.: resources. H.W.: investigation. All authors have read and agreed to the published version of the manuscript.

Funding

This research was funded by the Inner Mongolia Natural Science Foundation Program, grant number “2021MS03089”, the Inner Mongolia Basic Research Operating Expenses Colleges and Universities Program, grant number “BR231509”, and the Inner Mongolia Autonomous Region Higher Education Institutions Carbon Peak Carbon Neutral Research Special Project, grant number “STZX202214”.

Institutional Review Board Statement

Not applicable.

Informed Consent Statement

Not applicable.

Data Availability Statement

The data provided in this study are available upon request from the corresponding author. The data are not publicly available due to privacy.

Acknowledgments

This research was supported by the Inner Mongolia’s innovative extension system for promoting and innovating the wheat industry.

Conflicts of Interest

The authors declare no conflicts of interest.

References

  1. Omia, E.; Bae, H.; Park, E.; Kim, M.S.; Baek, I.; Kabenge, I.; Cho, B.-K. Remote Sensing in Field Crop Monitoring: A Comprehensive Review of Sensor Systems, Data Analyses and Recent Advances. Remote Sens. 2023, 15, 354. [Google Scholar] [CrossRef]
  2. Li, W.; Wang, K.; Han, G.; Wang, H.; Tan, N.; Yan, Z. Integrated diagnosis and time-series sensitivity evaluation of nutrient deficiencies in medicinal plant (Ligusticum chuanxiong Hort.) based on UAV multispectral sensors. Front. Plant Sci. 2023, 13, 1092610. [Google Scholar] [CrossRef] [PubMed]
  3. Benincasa, P.; Antognelli, S.; Brunetti, L.; Fabbri, C.A.; Natale, A.; Sartoretti, V.; Modeo, G.; Guiducci, M.; Tei, F.; Vizzari, M. Reliability of NDVI derived by high resolution satellite and UAV compared to in-field methods for the evaluation of early crop N status and grain yield in wheat. Exp. Agric. 2018, 54, 604–622. [Google Scholar] [CrossRef]
  4. Corti, M.; Cavalli, D.; Cabassi, G.; Vigoni, A.; Degano, L.; Gallina, P. Application of a low-cost camera on a UAV to estimate maize nitrogen-related variables. Precis. Agric. 2019, 20, 675–696. [Google Scholar] [CrossRef]
  5. Mullan, D.J.; Reynolds, M. Quantifying genetic effects of ground cover on soil water evaporation using digital imaging. Funct. Plant Biol. 2010, 37, 703–712. [Google Scholar] [CrossRef]
  6. Sharma, R.; Kumar, M.; Alam, M.S. Image processing techniques to estimate weight and morphological parameters for selected wheat refractions. Sci. Rep. 2021, 11, 20953. [Google Scholar] [CrossRef] [PubMed]
  7. Yang, J.; Ding, F.; Chen, C.; Liu, T.; Sun, C.; Ding, D.; Huo, Z. Correlation of wheat biomass and yield with UAV image characteristic parameters. Trans. Chin. Soc. Agric. Eng. 2019, 35, 104–110. [Google Scholar]
  8. Poley, L.G.; Mcdermid, G.J. A Systematic Review of the Factors Influencing the Estimation of Vegetation Aboveground Biomass Using Unmanned Aerial Systems. Remote Sens. 2020, 12, 1052. [Google Scholar] [CrossRef]
  9. Wang, X.; Wang, M.; Wang, S.; Wu, Y. Extraction of vegetation information from visible unmanned aerial vehicle images. Trans. Chin. Soc. Agric. Eng. 2015, 31, 152–159. [Google Scholar]
  10. Costa, L.; Kunwar, S.; Ampatzidis, Y.; Albrecht, U. Determining leaf nutrient concentrations in citrus trees using UAV imagery and machine learning. Precis. Agric. 2022, 23, 854–875. [Google Scholar] [CrossRef]
  11. Milas, A.S.; Romanko, M.; Reil, P.; Abeysinghe, T.; Marambe, A. The importance of leaf area index in mapping chlorophyll content of corn under different agricultural treatments using UAV images. Int. J. Remote Sens. 2018, 39, 5415–5431. [Google Scholar] [CrossRef]
  12. Feng, D.; Xu, W.; He, Z.; Zhao, W.; Yang, M. Advances in plant nutrition diagnosis based on remote sensing and computer application. Neural Comput. Appl. 2020, 32, 16833–16842. [Google Scholar] [CrossRef]
  13. Xia, S.S.; Zhang, C.; Li, J.Z.; Li, H.J.; Zhang, Y.M.; Hu, C.S. Diagnosis of nitrogen nutrient and recommended fertilization in summer corn using leaf digital images of cellphone camera. Chin. J. Eco-Agric. 2018, 26, 703–709. [Google Scholar]
  14. Wang, Y.; Wang, D.J.; Zhang, G.; Wang, C. Digital camera based image segmentation of rice canopy and diagnosis of nitrogen nutrition. Trans. Chin. Soc. Agric. Eng. 2012, 28, 131–136. [Google Scholar]
  15. Mao, W.; Wang, Y.; Wang, Y.R. Real-Time Detection of Between-Row Weeds Using Machine Vision; ASABE: St. Joseph, MI, USA, 2003. [Google Scholar]
  16. Niu, Y.; Zhang, L.; Zhang, H.; Han, W.; Peng, X. Estimating Above-Ground Biomass of Maize Using Features Derived from UAV-Based RGB Imagery. Remote Sens. 2019, 11, 1261. [Google Scholar] [CrossRef]
  17. Guo, T.; Yan, A.; Geng, H. Prediction of Wheat Plant Height and Leaf Area Index Based on UAV Image. J. Triticeae Crops 2020, 40, 1129–1140. [Google Scholar]
  18. Xiao, Y.B.; Jia, L.L.; Chen, X.P.; Zhang, F. N status diagnosis of winter wheat by using digital image analysis technology. Chin. Agric. Sci. Bull. 2008, 24, 448–453. [Google Scholar]
  19. Zhou, H.-J.; Liu, Y.-D.; Fu, J.; Sui, F.-G.; Cui, R. Analysis of Maize Growth and Nitrogen Nutrition Status Based on Digital Camera Image. J. Qingdao Agric. Univ. (Nat. Sci.) 2015, 32, 1–7. [Google Scholar]
  20. Jia, L.-L.; Fan, M.-S.; Zhang, F.-S.; Chen, X.-P.; Lü, S.-H.; Sun, Y. Nitrogen Status Diagnosis of Rice by Using a Digital Camera. Spectrosc. Spectr. Anal. 2009, 29, 2176–2179. [Google Scholar]
  21. Umut, H. Wheat Leaf Area Index (LAI) Inversion by Using “Satellite-UAV-Ground” Multi-Source Remote Sensing Data. Ph.D. Thesis, Xinjiang University, Urumqi, China, 2019. [Google Scholar]
  22. Li, W.; Jiang, J.; Weiss, M.; Madec, S.; Tison, F.; Philippe, B.; Comar, A.; Baret, F. Impact of the reproductive organs on crop BRDF as observed from a UAV. Remote Sens. Environ. 2021, 259, 112433. [Google Scholar] [CrossRef]
  23. Xu, L.; Zhou, L.; Meng, R.; Zhao, F.; Lv, Z.; Xu, B.; Zeng, L.; Yu, X.; Peng, S. An improved approach to estimate ratoon rice aboveground biomass by integrating UAV-based spectral, textural and structural features. Precis. Agric. 2022, 23, 1276–1301. [Google Scholar] [CrossRef]
  24. Zhang, Z.; Flores, P.; Igathinathane, C.; Igathinathane, C.; Naik, D.; Kiran, R.; Ransom, J.K. Wheat lodging detection from UAS imagery using machine learning algorithms. Remote Sens. 2020, 12, 1838. [Google Scholar] [CrossRef]
  25. Shi, X.-Y. Evaluation of Some Physiological Parameters of Winter Wheat Leaves Using Digital Image Processing. Ph.D. Thesis, Heibei Agriculture University, Baoding, China, 2005. [Google Scholar]
  26. Wang, Y.; Wang, D.; Shi, P.; Omasa, K. Estimating rice chlorophyll content and leaf nitrogen concentration with a digital still color camera under natural light. Plant Methods 2014, 10, 36. [Google Scholar] [CrossRef]
Figure 1. Map of test site locations.
Applsci 14 02294 g001
Figure 2. Correlation coefficients of different digital image indices with wheat physiological indicators at jointing and flowering stages. (a) Jointing stage. (b) Flowering stage.
Applsci 14 02294 g002
Figure 3. Correlation coefficients of different digital image indices with wheat physiological indicators at filling and mature stages. (a) Filling stage. (b) Mature stage.
Applsci 14 02294 g003
Figure 4. Variation in wheat digital image indices with fertility period under different fertilization treatments.
Applsci 14 02294 g004
Figure 5. Variation in wheat digital image indices with fertility period under different fertilization treatments.
Applsci 14 02294 g005
Figure 6. Variation in wheat digital image indices with fertility period under different fertilization treatments.
Applsci 14 02294 g006
Figure 7. Frequency of significant correlation between each digital image index and physiological indicators at different wheat reproductive periods.
Applsci 14 02294 g007
Table 1. This table displays the fertilization rates of treatments.
TreatmentsFertilizer Rate (kg/hm2)
NitrogenPhosphate Fertilizer
(P2O5)
Potash Fertilizer
(K2O)
Sowing NTop-Dressing N
CK0000
FM94.5207241.50
CF52.5124.561.560
CF-N00.00.061.560
CF-P052.5124.50.060
CF-K052.5124.561.50.0
Table 2. Calculation of digital image indices and cited literature sources. R, G, B, and near infrared (NIR) indicate the measured reflectance (digital numbers) in red, green, blue, and near-infrared wavelength ranges, respectively.
Digital Image IndexDescriptionCalculating FormulaSource Literature Reference
RRedR-
GGreenG-
BBlueB-
rNormalized Red IndexR/(R + G + B)[15]
gNormalized Green IndexG/(R + G + B)[15]
bNormalized Blue IndexB/(R + G + B)[15]
ExGExcess Green2 × G − R − B[8]
GRRIGreen–Red Ratio IndexG/R[8]
GBRIGreen–Blue Ratio IndexG/B[8]
RBRIRed–Blue Ratio IndexR/B[8]
GRVIGreen–Red Vegetation Index(G − R)/(G + R)[8]
INTIntensity(R + G + B)/3[15]
IKAWNormalized Red–Blue Index(R − B)/(R + B)[8]
MGRVIModified Green–Red Vegetation Index(G2 − R2)/(G2 + R2)[8]
RGBVIRed–Green–Blue Vegetation Index(G2 − B × R)/(G2 + B × R)[8]
GLAGreen Leaf Area(2 × G − R − B)/(2 × G + R + B)[8]
CIVEColor Index of Vegetation Extraction0.441R − 0.881G + 0.385B + 18.7875[8]
Table 3. Analysis of variance (ANOVA) of digital image indices under different fertilization treatments. (Bolded markers are parameters that were significant or highly significant under different treatments. Then, after ANOVA analysis, ‘a’ represents the value with the highest mean at a significant level, ‘b’ represents values significantly different from it, and so forth).
Digital Image Indicesp-ValueCKFMCFCF-N0CF-P0CF-K0
R0.058172.68136.87135.57158.85117.82113.33
G0.007171.64 a153.92 abc149.85 bc156.93 ab136.97 c136.00 c
B0.011109.60 a97.31 ab92.59 abc93.67 abc76.49 bc73.69 c
EXG0.58064.1122.5228.7167.0922.1816.96
INT0.005151.30 a129.37 abc126.00 bc136.48 ab110.42 c107.67 c
CIVE0.906−14.08−18.99−17.80−13.36−20.49−22.68
r0.7910.380.350.360.390.350.35
g0.4140.380.400.400.390.410.42
b0.6740.240.250.250.230.230.23
GRRI0.6341.011.171.151.001.201.24
GBRI0.1811.591.591.631.701.801.86
RBRI0.8591.581.411.471.711.561.58
GRVI0.6560.000.070.060.000.080.10
IKAW0.8440.220.160.180.260.210.21
MGRVI0.6660.000.130.11−0.000.160.18
RGBVI0.3180.220.290.290.250.360.38
GLA0.4190.100.140.140.110.170.18
Disclaimer/Publisher’s Note: The statements, opinions and data contained in all publications are solely those of the individual author(s) and contributor(s) and not of MDPI and/or the editor(s). MDPI and/or the editor(s) disclaim responsibility for any injury to people or property resulting from any ideas, methods, instructions or products referred to in the content.

