Abstract
This study explores the complete production chain of designing, optimizing, and Additive Manufacturing (AM) of a helmet incorporating a functionally graded lattice structure (FGLS). The potential of FGLSs in impact energy absorption tasks is investigated, along with the demonstration of a novel lattice optimization approach. Fifteen conformal, strut-based lattices are implemented in a realistic mountain bike helmet geometry and simulated in a standardized impact scenario in accordance with EN 1078. One model is subjected to the optimization procedure, produced, and physically tested. The study addresses limitations in prior research, emphasizing manufacturability in an AM context, lattice type exploration, the comparability of different unit cell types, and numerical modeling choices. The findings provide insights into the performance of lattice structures during impact, emphasizing practical engineering aspects such as design choices, optimization approaches, and manufacturing constraints.
1. Introduction
1.1. Lattice Structures
Additive Manufacturing (AM) has allowed the effective production of complex geometries such as lattice structures which are increasingly present in various fields [1,2,3]. They are composed of unit cells, the smallest repeating entity consisting of surfaces or struts. Examples of regular, strut-based lattices are shown in Figure 1. Graph lattice structures are subcategorized into bending-dominated and stretching-dominated types depending on their strut connectivity state. When considering the cells shown in Figure 2 as struts with freely rotating joints under vertical loads, the bending-dominated cell would simply collapse, whereas the stretching-dominated one would be able to resist the loads. Like a truss, its struts would carry a tensile or compressive axial force, while the bending-dominated cell would carry none. Transferring this load scenario to cells with rigid joints, the bending-dominated cell’s struts would be deformed through bending while the stretching-dominated one would be deformed by compressive and tensile forces [4]. It is thus significantly stiffer and stronger than a bending-dominated cell, a behavior which also transfers over to entire lattice structures under compressive loads [5].
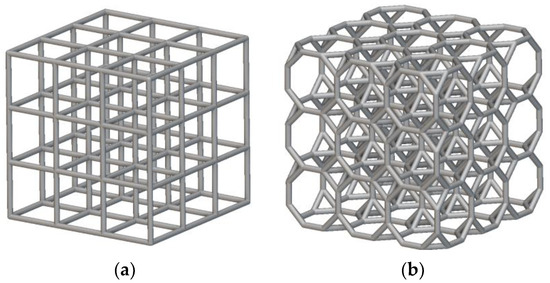
Figure 1.
Example of regular lattice structures with Simple Cubic (a) and Truncated Cube (b) unit cells.
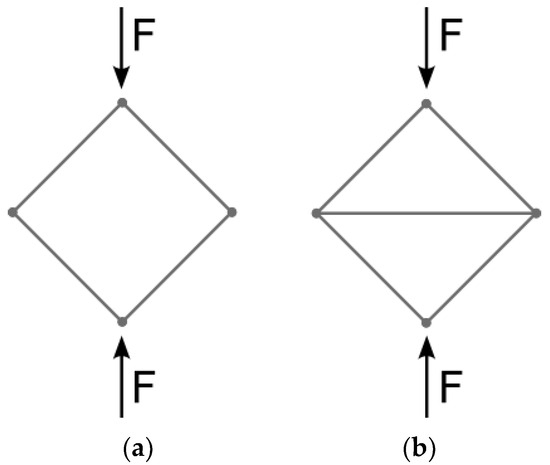
Figure 2.
Bending-dominated (a) and stretching-dominated (b) unit cell types (recreated from [4]).
Due to their comparable cellular composition, lattice structures behave similarly to foams [6] and can be described by the model established by Gibson and Ashby [7] and corroborated in [8,9,10]. Thus, numerous lattice properties can be directly related to relative density (RD). This is defined as the structure’s apparent density divided by the density of its constituent material :
It is essentially the percentage of the structure’s total volume that is occupied by material. It strongly influences a lattice structure’s properties such as its apparent Young’s modulus, elastic strength, yield strength, and densification strain at which a lattice is entirely compacted. The apparent properties always refer to measurements based on the total lattice extents, not the actual cross-sectional area. Other characteristics such as cell size, type, and orientation also influence structural response, but do not take on the same importance as the relative density. It is therefore one of the most important characteristics pertaining to a lattice’s composition, along with its base material. For instance, an open-celled lattice’s apparent Young’s modulus is defined as:
where denotes the Young’s modulus of the constituent material, and the parameter denotes the influence of the specific cell type. The apparent buckling strength of a compressed lattice composed of elastic material denotes the point at which it starts collapsing. For an open-celled lattice, it relates to the relative density with
The apparent yield strength of an open-celled lattice composed of an elastic–plastic material is
The parameters and again depend on the unit cell properties. Once a lattice has completely collapsed, the response is dominated by the base material’s properties. The densification strain linearly relates to the relative density with
While not every aspect and every unit cell type can be discussed here, this short overview demonstrates the importance of relative density and how it influences the mechanical response of lattice structures.
1.2. Functionally Graded Lattice Structures
Regular lattice structures possess a uniform composition, i.e., their cell size, type, orientation, and thickness do not change throughout the geometry. Due to their similarities with expanded foam materials, they also excel in compressive energy absorption tasks [11,12,13,14], enabling their potential use as protective structures in sports equipment [15] or bumpers in automotive applications [16]. In these use cases, ungraded lattice structures demonstrate excellent energy absorption performance at very low weight and material usage. Auxetic unit cell types such as the Re-entrant cell possess a negative Poisson ratio and contract upon compression [15,16,17,18]; however, they tend to have a low stiffness [19].
When a lattice structure exhibits local composition changes, it is categorized as a functionally graded lattice structure (FGLS). Redistributing the structure’s material to where it is needed can greatly improve its performance. The property gradient may be defined manually during the design stage, as shown in Figure 3, in which the structure’s strut thickness changes linearly with its height. Other composition changes can involve the lattice type, the unit cell size, or its orientation [20,21,22]. Most notably, for lattices in compressive load cases, manual beam or wall thickness alterations are a common grading method due to their easy implementation [23,24,25,26,27,28,29].
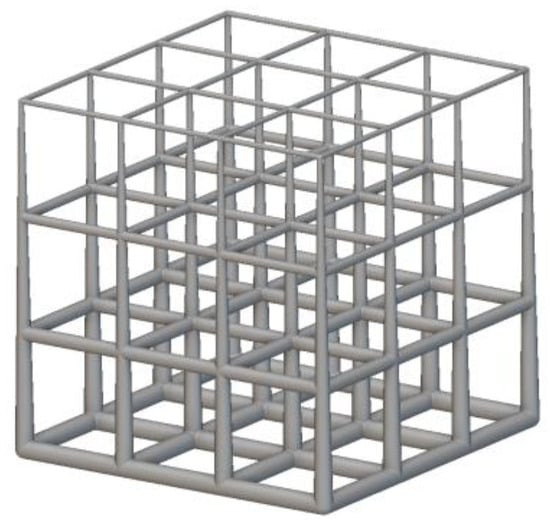
Figure 3.
Functionally graded lattice structure with linearly changing strut thickness.
Advanced approaches permit the creation of gradients based on optimization routines as functions of external factors like structural load, fluid flow, or heat flow, and are at the center of many research studies. Numerous methods have emerged, such as topology optimizations of the unit cell itself [30,31,32,33], topology optimization mixed with hierarchical alterations of the lattice [34], and the optimization of unit cell position and orientation as functions of isostatic stress lines [35,36], amongst others. Such property changes can yield performance improvements like reducing a part’s weight at a given stiffness [37], enhancing thermal conductivity [38,39,40], or enhancing sound absorption [41].
Since lattice structures are well suited for impact absorption tasks at low weight, several research groups have investigated the potential use of lattice structures as a replacement for protective foam liners in helmets. Leng et al., summarized current related trends in bicycle helmet development [42], among which are commercially available helmets incorporating honeycomb lattice structures, Bontrager [43] helmets with WaveCel technology [44], Koroyd structures [45] being licensed to several bicycle manufacturers, and HEXR helmets [46] using an additively manufactured hexagonal structure. Bliven et al., tested the WaveCel technology in an oblique impact scenario [47] and compared it with a control helmet model with a standard foam liner, as well as one helmet variant with Multi-directional Impact Protection System (MIPS) technology allowing for a relative shearing motion between the helmet’s shell and liner, reducing rotational accelerations of the head. The helmet variant with the WaveCel honeycomb structure surpassed the others regarding protection against both translational and rotational acceleration.
Soe et al., performed simulative comparisons of a simplified helmet geometry with foam liners versus thermoplastic elastomeric lattice liners of differing relative densities composed of Simple Cubic unit cells [48]. The investigation concluded that the studied TPE lattice structures all greatly reduced peak linear accelerations and increased the impact time, overall lowering the potential for injury significantly.
Khosroshahi et al., performed simulative comparisons between helmet models with an expanded polystyrene (EPS) liner and versions incorporating two lattice types made of polyamide, each with a uniform and graded cell size distribution [49]. Their findings indicated that the lattices with lower relative densities possessed greater specific energy absorption capacity and that they better succeeded in dissipating impact energy. The investigated lattice configurations with size grading performed better than the EPS liner and non-graded lattice variants. It is stated in the publication that the main advantage of lattice structures lies in a greater area contributing to impact energy absorption compared to EPS foam.
Naderi et al., studied simulative models of helicopter helmet geometry combining expanded polyurethane foam and an arrowhead auxetic lattice in the same liner [50]. Several foam and lattice material options were investigated, revealing that each combination of the hybrid liner provided greater protection than a unibody foam liner.
Nasim et al., explored the performance of three different uniform lattice types which were additively manufactured with polyamide 12 and incorporated into a protective liner for a motorcycle helmet [51]. Simulative and physical testing showed greatly increased protection by some lattice types compared to EPS liners, while others fell short. They also demonstrated that a lattice’s energy absorption capability during a quasi-static compression test is not necessarily an adequate predictor for its performance during an impact test.
1.3. Scope
As demonstrated by the publications assembled in the previous section, lattices can indeed provide sufficient protection when used in helmets. The authors of this paper therefore aim to further investigate this topic by expanding on certain aspects. Fourteen strut-based types of lattices that closely conform to a realistic mountain bike helmet geometry are simulated in a standardized impact test scenario and compared to commercially available foam helmets. In addition, a lattice optimization method proposed in a previous study by the authors (see [52]) is applied to improve the performance of one lattice type. It is subjected to physical testing and compared to the simulation results.
This study aims to address the issues of the aforementioned studies regarding feasibility in an AM context, weight, the limited exploration of lattice types, comparability between lattices of differing relative densities, and numerical modelling choices. More specifically, Khosroshahi et al. [49] studied only two lattice types with two configurations in a simulative approach without physical testing. While the study by Soe et al. [48] investigated different lattice densities, only one unit cell type was used. Additionally, the head and helmet geometries were simplified to a sphere impacting a small lattice section, potentially missing effects observed in more realistic geometries. No physical tests of the lattice structures were performed by them, only material testing and simulative studies of the impact scenario. Similarly, Nasim et al. [51] investigated only part of the helmet geometry, albeit with a realistic dummy head model both in simulations and in physical testing. Their choice was due to the meshing of the lattice with tetrahedral elements, causing a considerable simulation duration and potential numerical instabilities stemming from severe element distortion. Choosing to create a lattice structure using traditional Computer Aided Design (CAD) software drastically limits the potential for easily iterating various lattice designs and types. This is overcome by utilizing nTop [53], a specialized software designed specifically for the creation of lattice structures. Another issue seen in the aforementioned papers is the comparability of the investigated lattices, as they possess differing relative density values which cause vastly different behavior. The authors of this paper therefore intend to mitigate these issues in the presented work.
This study is a continuation of previous work by the authors where a generalized workflow for the optimization of FGLSs was established (c.f. [52,54,55]). These studies focused on two different approaches to demonstrate the method’s versatility: two studies investigated the stiffness maximization of a bicycle crank with weight and manufacturability constraints, whereas one study explored the optimal thickness distribution of lattices in compression at identical weights, maximizing their specific energy absorption capability. The current study continues this work by developing and enhancing a bicycle helmet by introducing a FGLS instead of the conventional protective foam liner. The design approaches are assessed through structural simulations and physical testing to evaluate their relative performance. Additionally, to gain insights into the market landscape, tests are conducted on a range of commercially available helmets in accordance with current standards. One helmet design is simulated using a foam liner and fifteen types of lattice structures to compare their relative performance. The design is further improved by optimizing the thickness of the lattice liner at a local level governed by a mathematical equation to reduce computational demands. Further, the simulations are complemented by physical tests.
2. Materials and Methods
2.1. Performance Metric and Test Standard
The crash event utilized in this study adheres to the EN 1078 standard for bicycle helmet testing [56]. The test consists of a straight drop from a height of 1.5 m (impact velocity of 5.4 m/s) onto a flat steel anvil with a diameter of 130 mm, as shown in Figure 4.
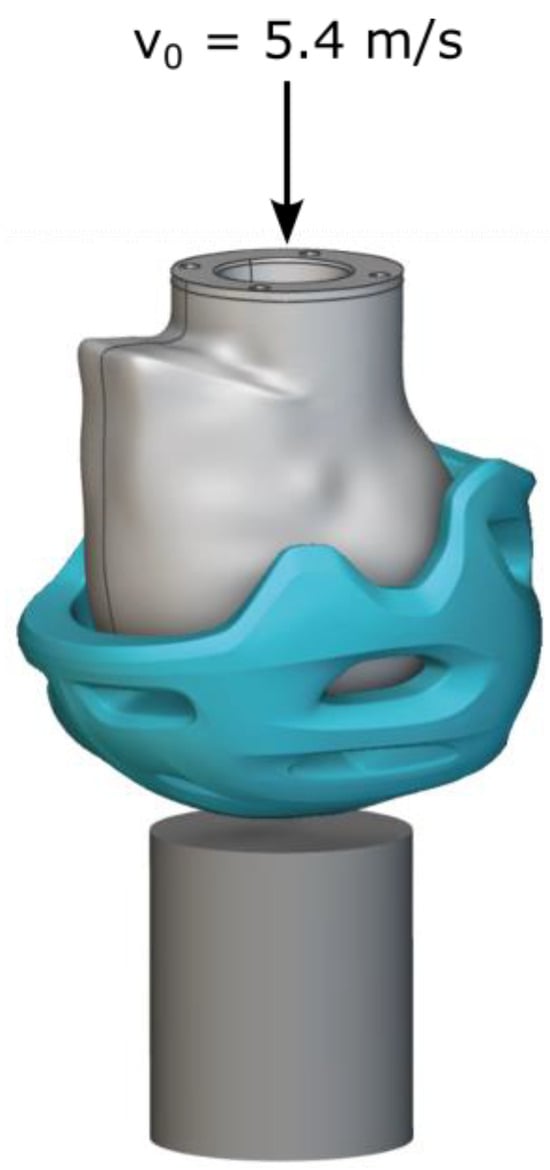
Figure 4.
Drop test scenario.
The EN 1078 standard requires the peak acceleration magnitude not to exceed 250 G; however, it does not take into account the acceleration duration or its progression. Therefore, the modified head injury criterion HIC(d) [57] is used here to assess each helmet’s performance, as it considers characteristics of the complete acceleration history. The standard HIC is defined as follows:
where a(t) is the head’s acceleration magnitude measured in multiples of Earth’s acceleration constant G (9.81 m/s2), and the start and end times and are the optimization variables to be modified such that the function reaches its maximum value. The HIC was initially designed for assessing dummy head accelerations attached to dummy bodies in automotive test environments. To account for the behavior of unconnected dummy heads, the modified head injury criterion HIC(d) was introduced to allow for equal comparisons between both [57]. It is defined as follows:
HIC(d) values can be correlated to the Abbreviated Injury Scale (AIS), indicating the probability of suffering six different levels of traumatic injury [58]. For example, an HIC value of 1000 relates to a 50% probability of experiencing a moderate head injury (AIS-3) and a 15% probability of a severe injury (AIS-4).
2.2. Test Stand and Data Acquisition Setup
A test stand was designed and built for the purpose of conducting impact tests in accordance with EN 1078, as shown in Figure A1 (see Appendix A). It includes a steel base weighing 500 kg as well as a sled guided on linear rails, allowing the head to fall freely from varying heights. The helmeted dummy head can be positioned at different angles on the sled. The anvil face is interchangeable and can accept different impact surfaces; however, only a flat surface is used in this study. An electromagnet holds the sled in position and releases it upon a button trigger. A TE Connectivity 633 inertial measurement unit [52] with six degrees of freedom is mounted on the head’s cone to log the occurring accelerations. The sensor has the capacity to measure translational accelerations up to ±500 G and rotational velocities up to ±12,000 deg/s. The signals are registered with two National Instruments modules: a 9238 card for the accelerometers and a 9234 card for the gyroscope sensors. A logging frequency of 51.2 kHz is used in conjunction with an SAE J211/1 filter (CFC 1000) (SAE, Warrendale, PA, USA).
2.3. Tests of Commercially Available Mountain Bike Helmets
To determine a performance reference, five commercially available foam helmet models (see Table 1) were tested following EN 1078. The tests were performed externally by SQLab GmbH [59] and provided to the authors for this study.

Table 1.
List of commercially available foam helmet models used for comparison.
2.4. Software
The study relies on a multitude of software suites for the lattice design, geometry preparation for simulation purposes, the simulation itself, and preparation of the results for Additive Manufacturing. The lattice design was created in nTop 4.6 [53], a software specifically designed for the creation of complex lattice structures. It does not rely on the boundary representation method usually employed by CAD software. It is based on connected surfaces, vertices, vectors, splines, etc., to characterize bodies [60]. nTop makes use of Signed Distance Functions, defining geometries by a set of mathematical functions that are easily controllable by parameter variation [61]. This allows for versatile and quick design iterations of highly complex geometries such as these lattices. nTop enables exporting these structures to data formats usable for engineering purposes such as surface meshes (STL, OBJ formats) or meshes for Finite Element Analysis (FEA) solvers containing 1D beam, 2D shell, or 3D solid elements.
The workflow was continued in the Altair HyperWorks software suite (version 2012.2). The models were prepared in Altair HyperMesh [62] and calculated with the explicit FEA solver Altair RADIOSS [63]. This is controlled by Altair HyperStudy [64], a general optimization suite able to evaluate a model’s output responses and to vary its parameters accordingly. Afterwards, a custom MATLAB [65] script extracted the individual lattice regions from the solver input file and translated them into the LTXC data format, which is native to nTop. The lattice was reassembled into a single geometry and an STL file was extracted for Additive Manufacturing.
2.5. Helmet and Dummy Head Geometry
The helmet geometry shown in Figure 5 used in this study was supplied by SQLab GmbH (Taufkirchen, Germany) [59]. It exhibits typical features of commercially available bicycle helmets such as a polymer shell and a single foam liner with ventilation holes. The foam liner’s thickness varies locally, transitioning from 30 mm at the front to 32 mm at the top, 30 mm towards the rear, and 20 mm on its sides. The design is simplified for the purpose of simulation and does not include common features such as a head harness or pads to enhance comfort.
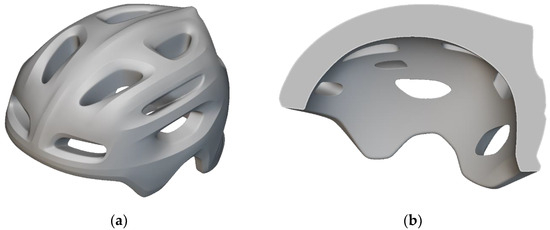
Figure 5.
Foam helmet geometry (a) and its cross-section view (b).
In accordance with EN 1078 regulations for bicycle helmet testing, the dummy head (c.f. Figure 6) chosen for the study is in compliance with the EN 960 standard [66]. It is composed of AZ91 cast magnesium and weighs 4.7 kg (size J, 575 mm circumference). It represents approximately the 50th centile head size of a sample of British male adults with a height of 180 cm [67]. The head features a magnesium dome which allows for the placement of an acceleration sensor at the center of mass. A modal analysis was conducted to verify that the lowest eigenfrequency of the head assembly is above 2000 Hz, and therefore meets the EN 1078 requirement.
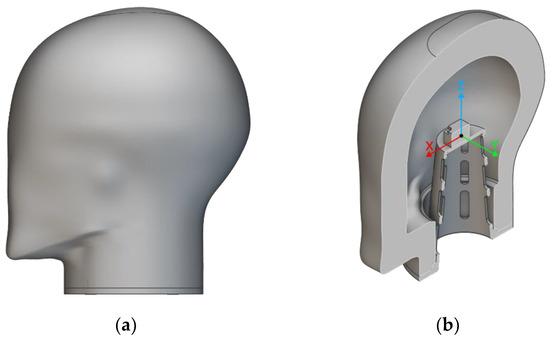
Figure 6.
Side view (a) and cross-section view (b) of the cast magnesium dummy head in compliance with EN 960, with its inner cone for sensor mounting and the local coordinate system.
2.6. Lattice Design Procedure and Lattice Types
To prepare the helmet geometry for utilization in nTop and to introduce a lattice structure, the first step is to separate the helmet’s outer and inner surfaces. Faces on their borders are removed to create an open lattice that facilitates the removal of excess powder after manufacturing. A conformal unit cell map is created by generating quadrilateral elements on the helmet’s inner surface, which are extended towards the outer surface. The resulting conformal map can be filled with unit cells to create a congruent lattice structure, as shown in Figure 7. The lattice’s size is controlled by altering the dimensions of the quadrilateral mesh and by the amount of cell layers extruded outwards. A symmetry constraint is applied to ensure an identical lattice composition of the left and right model halves. To fill the ridge near the back of the helmet, the lattice map needs to extend beyond the actual helmet geometry. The lattice is then trimmed to be contained entirely within the helmet’s volume. While the lattice structure resulting from this approach closely follows the helmet’s shape and possesses an approximately constant number of cell layers in the radial direction between both surfaces, it also shows that the unit cell height varies with the helmet’s thickness Finally, for manufacturing purposes, a detailed mesh of the merged shell and lattice components is generated, resulting in a unibody design.
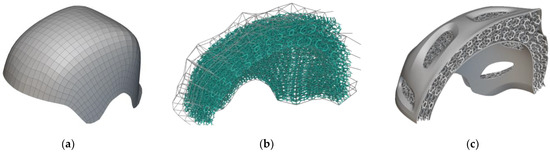
Figure 7.
Lattice creation process: (a) quadrilateral mesh formed on the inner helmet surface from which a cell map is extruded towards the outer surface; (b) cross-section view of conformal unit cell map extruded from the inner to the outer helmet surface; (c) cross-section view of the unified shell and lattice helmet geometry.
Twelve regular graph unit cell types available in nTop (shown in Figure A2, see Appendix A) are explored, as well as two pseudo-stochastic lattice varieties (tetrahedral and dual lattices) to assess each type’s performance. The regular graph unit cells are composed identically in all three planes except for the Re-entrant unit cell, which is therefore investigated in two different orientations. Surface-based lattices such as honeycombs and Triply Periodic Minimal Surfaces (TPMSs) are not considered in this study as they do not adequately allow the removal of excess powder after manufacturing without adding numerous evacuation holes to the structure.
2.7. Manufacturing
The lattice helmet’s structure is entirely made from polyamide 12 (PA12) produced on an HP Multi-Jet Fusion (MJF) machine [68]. It was chosen since powder-bed-based AM methods lend themselves well to the production of complex structures such as lattices, and the material possesses adequate physical properties. The unibody design eliminates potential issues stemming from gluing or otherwise attaching separately produced parts. The default layer height of 0.08 mm is applied, and the geometry is oriented as shown in Figure 8 for production.
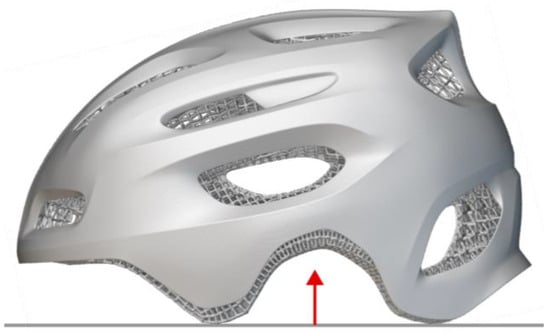
Figure 8.
Helmet orientation during manufacturing with the build direction marked by the red arrow.
Measurements taken of several lattice structures produced during the investigation indicated that their diameters deviated from the expected values. A test geometry was therefore manufactured to investigate the occurring differences as a function of the beam diameter and orientation. This consisted of a cuboid geometry with an Isotruss lattice and a linearly varying thickness ranging from 0.7 mm to 2 mm. The geometry and its build direction during manufacturing are shown in Figure 9. It has external dimensions of 80 mm × 80 mm × 160 mm and a 45° twist along its longitudinal axis.
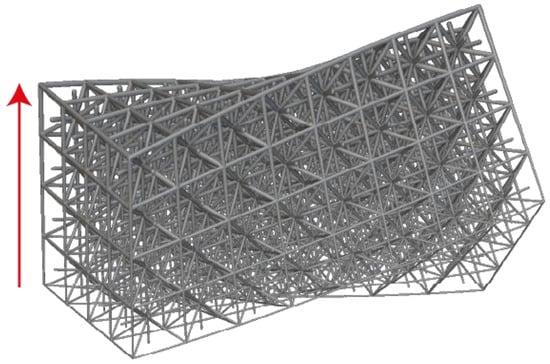
Figure 9.
Test lattice for measuring thickness deviations at different orientations and positions—build direction marked with red arrow.
2.8. Materials
Two sets of materials were required for the simulative models, one for the foam helmet model and one for the helmet models including lattices. The foam helmet was assumed to be composed of materials commonly used for mountain bike helmets: a 0.5 mm polycarbonate (PC) shell and an expanded polystyrene foam liner with a density of approximately 60 kg/m3 (EPS60). Four stress–strain curves of EPS60 at various strain rates were obtained from Ouellet et al., (c.f. [69]). The material data for PC used here were obtained by Cao et al., (c.f. [70]). The Young’s modulus and offset yield strength were estimated from the stress–strain data provided in their publication. The stress–strain curves of EPS60 and PC are depicted in Figure 10 and assembled in Table 2. To secure the helmet to the dummy head, a chin strap intended to resemble woven high-density polyethylene (HDPE) fibers was added to the FEA model. Its material properties are of lesser importance for this study and were estimated from commonly found values. The dummy head is composed of cast Mg AZ91, for which the properties available on MatWeb were used [71].
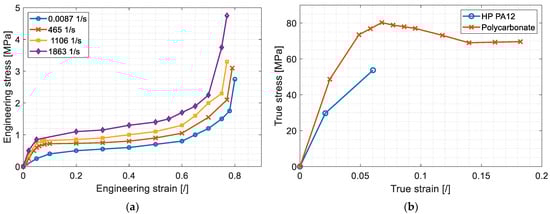
Figure 10.
Curves utilized for material modelling: (a) modified engineering stress–strain data of EPS60 in compression at varying strain rates, data adapted from [69]; (b) true tensile stress–strain plots of polycarbonate (data from [70]) and polyamide 12 (data from [72]).
Table 2.
Material properties used in the simulations.
The physical characteristics of the HP PA12 material were determined through experimental assessments in a previous study by the authors (c.f. [72]). Tensile test specimens were subjected to loads perpendicular to their build direction in order to stress the components in their weakest plane, simulating the most critical loading scenario. The resulting properties are given in Table 2 and Figure 10. They are used as reference data for the Johnson–Cook material law parameter approximation discussed in Section 2.11.
Friction assumes a significant role in this study due to the multitude of contact interactions that take place during the impact simulations. These interactions involve lattice beams contacting one another and the helmet’s shells, the outer shell colliding with the steel anvil, and the magnesium head impacting the inner shell or the foam liner. The friction coefficients used in this study are listed in Table 3. For values lacking a source indication, estimations were required as the data were not available in the existing literature.
Table 3.
Dry friction coefficients of contact pairs.
2.9. FEA Model Setup
During the drop test simulation, the steel anvil was modelled by a circular rigid shell surface, as shown in Figure 11. The assembly was assigned an initial velocity of 5.4 m/s in accordance with the standard, as well as a gravitational acceleration load of 9.81 m/s2. The dummy head assembly, consisting of the head itself and the sensor cone, was modelled as a rigid part. The sensor was modelled by a concentrated mass of 50 g at its center of mass and rigidly connected to the cone. The time histories of values such as the head’s acceleration were probed at this node.
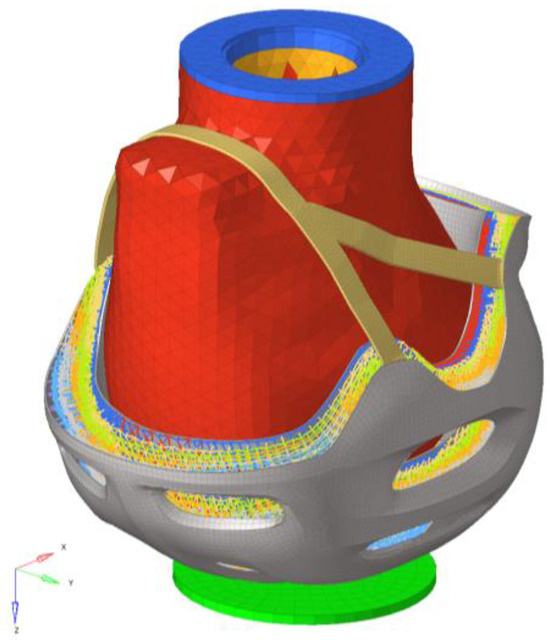
Figure 11.
FE model of the helmet with lattice liner and anvil.
The foam liner of the conventional helmet was modelled via second-order tetrahedral elements with 6 mm edge length, and self-contact of the foam elements was enabled to prevent sudden element collapse at large compressive strains. A hyper-viscoelastic tabulated foam material model (LAW70 [76]) was used with the stress–strain curves shown in Figure 10a. The polycarbonate shell was discretized with fully integrated four-node shell elements. An isotropic tabulated elastic–plastic material law (LAW36 [77]) was used to model the stress–strain curve depicted in Figure 10b.
As for the lattice helmet model, the inner and outer shells of the lattice helmet were discretized with a fully integrated quad-dominant shell mesh with an edge length of 3 mm. The PA12 parts were modelled by the isotropic elastic–plastic Johnson–Cook material model (LAW2 [78]) with consideration of strain rate effects. Material failure of the PA12 parts was modelled via element deletion when the principal stress reached the maximum allowable plastic strain in an element’s integration point. The lattice consisted of first-order integrated beam elements with a circular cross-section and four integration points. A tie contact interface connected the shell and beam elements within a search distance of 2 mm between nodes. The lattice’s struts were subdivided in nTop based on the total length between lattice nodes before being exported. Nodes within a distance of less than 1 mm were merged, eliminating the connecting strut. Struts with a length of up to 3 mm were not subdivided and were modelled by a single beam element. Struts with a length between 3 mm and 6 mm were split once, modelled by two beam elements, and any strut longer than 6 mm was modelled by three beam elements. This way, a minimum beam element length of 1 mm was ensured, and longer struts could capture buckling thanks to the subdivision.
The contact interactions in the assembly were modelled by TYPE7 penalty interfaces [79]. Contact between beam elements of the lattice helmet models was handled via a TYPE11 edge-to-edge penalty interface [80].
A total run time of 15 ms was applied to entirely capture the entire impact event with a duration of approximately 10 ms. The minimum time step was defined to be 0.5 µs for the foam model and 0.25 µs for the lattice models with a scaling factor of 0.9 to limit mass scaling to a minimum. Time history files were updated at 200 kHz for a total of 3000 data points per run.
2.10. Johnson–Cook Material Parameter Optimization
As discussed in Section 2.9, the material data of PA12 given in Table 2 were obtained from quasi-static tensile tests. The impact scenario considered in this study is highly dynamic and strain rate effects on the material properties become relevant; hence, the data cannot be used as is. Since no physical properties of PA12 produced with MJF over a wide range of strain rates could be found in the literature, an approximation based on the available data was performed. The Johnson–Cook material model was therefore chosen since it considers the strain rate effect on stress level based on parameters obtained at a reference strain rate, i.e., the tensile test data. It calculates the stress σ as
with the yield stress A, the plastic hardening parameter B, the true plastic strain , the hardening exponent n, the strain rate coefficient c, the current strain rate , and the reference strain rate at which the base parameters were determined. RADIOSS offers a simplified input method which is used in this study. Then, the parameters A, B and n are calculated based on the yield stress , the ultimate tensile strength , and the engineering strain at the ultimate tensile strength obtained from the tensile tests. The material law’s implementation in RADIOSS supports the option of considering the influence of strain rate on the maximum stress , which is also applied here. It is calculated as
With the available material data and the Johnson–Cook law, a preliminary investigation was performed to find adequate variable values. A helmet incorporating a Truncated Cube lattice liner with a uniform thickness of 1.5 mm was manufactured and physically tested to correlate it with the simulation results using the Johnson–Cook material law. To find approximate material parameter values, an optimization study was set up with HyperStudy to minimize the difference between the acceleration curves obtained from the simulation and the physical test. The optimization variables were chosen to be Young’s modulus E, the strain rate parameter c, the maximum plastic strain , and the maximum stress , defining the plateau of the stress–strain curve at the reference strain rate . The latter is 2.8 · 10−4/s, the standard strain rate of an ISO 527-2 tensile test using a 1BA specimen [81]. Young’s modulus was defined as an optimization variable because it is significantly influenced by the strain rate in the case of polymeric materials such as PA12. A Design of Experiment (DOE) study with 50 runs using the Modified Extensible Lattice Sequence method (MELS [82]) was performed first. The MELS method allows the inclusion of constraints and is well suited to explore the entire design space. The results of the DOE study were then relayed into an optimization study to provide an initial sampling of the model’s response surface, aiding the optimization algorithm in finding an optimum. The Global Response Search Method algorithm (GRSM) was used, which is a gradient-based global optimization method proprietary to Altair [52,83]. The optimization study aimed to minimize the difference between the acceleration curves of the simulation model and the physical results, yielding approximated material parameters. A maximum limit of 150 iterations was applied.
2.11. Simulations of Helmet Models with Uniform Lattice Thickness
Preliminary simulations using the parameters obtained from the material parameter optimization study indicated that a relative density of 7% is a suitable starting point for this impact scenario. With an identical beam thickness, different unit cell types occupy varying volume fractions. The relative density target is therefore met by altering the number of unit cell layers between the two surfaces, along with the number of quadratic elements on the inner surface that are extruded outwards. These settings were chosen such that the unit cells were approximately equally sized in all three dimensions.
A uniform diameter of 1 mm was used for the lattice types shown in Figure A2; however, an exception was made for the tetrahedral lattice. It required a 0.95 mm beam diameter to meet the relative density target. This adjustment was necessary because nTop offers limited control over the 3D mesh generation, leaving only the option of modifying the diameter. The relative density target was satisfied with a ±0.2% deviation for all lattices, which corresponded to an average lattice weight of 132 g. The inner and outer shells were assigned a thickness of 1 mm and weighed a combined 146 g. The average total helmet weight therefore amounted to 278 g, which is comparable to conventional bicycle foam helmets.
2.12. Lattice Splitting and Thickness Optimization Procedure
In conventional FEA programs, each component containing 1D beam or 2D shell elements requires a separate thickness property assignment. Therefore, to assign different thickness values to each of the lattice components, the structure first has to be split into discrete regions. To achieve a separation conforming to the helmet’s shape, an ellipsoidal surface function was established that approximated the inner surface of the helmet:
A TCL/TK script [84] was devised and executed in HyperMesh to segregate the beam elements in equidistant steps based on their distance to this surface. It bins the elements into a user-defined number of separate components based on each element’s averaged nodal position. Element groups containing only few elements are manually merged with their larger neighbors afterwards. Figure 12 shows the separate, color-coded lattice groups after the separating process into eight bins. Six components are present at the top of the helmet to allow sufficient control over the thickness changes, where each layer has an approximate height of 5 mm. The number of groups was chosen such that the thickness gradient along the radial axis could be sufficiently controlled while keeping the preprocessing efforts reasonably low.
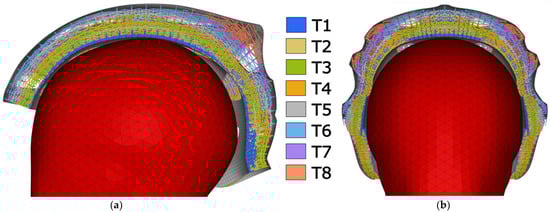
Figure 12.
Side-section view (a) and front-section view (b) of the eight color-coded lattice components, denoted T1–T8 from innermost to outermost region.
The model was then imported into HyperStudy where the thickness value of each lattice component was parameterized. Each component’s numerical thickness value T in the solver input file was defined as a variable. Their values were then linked by a quadratic function of the following form:
where r is the radial distance magnitude from the helmet’s origin to the innermost edge of each respective layer. The parameters a, b, and c are defined as optimization variables, thus omitting the need to optimize every thickness property value separately. This effectively decreases the amount of optimization variables from eight to three and reduces the calculation efforts greatly. The choice of the function is inspired by the pomelo fruit. It can endure falls from heights of 10 m unharmed thanks to its shell having a similar distribution with greater cell density near its edges and lower density in the center [85]. This approach was also part of a previous investigation of the authors, where the optimal material distribution of a cuboid lattice in compression following various functions was investigated [38]. The function and its independent variable can generally take any arbitrary form.
The variables were subject to a uniform distribution and their ranges are listed in Table 4. Additionally, the diameters were only allowed to be changed in a continuous range from 1 mm to 2.5 mm. A DOE study with 50 runs was performed first to explore the design space using the MELS method to distribute data points across the design space. It was fed into the subsequent optimization run to provide an initial solution surface to the GRSM optimization method, which was permitted a maximum of 250 runs. The HIC(d) value was minimized with no other constraints being imposed on the optimizer, apart from the ones mentioned. The worst-performing helmet model was subjected to the optimization procedure. Further reasoning for this choice is given in Section 3.2.3.
Table 4.
Optimization variable bounds and their initial values.
3. Results
3.1. Results of Helmets with Foam Liner
Among the five assessed models, three (6D, IXS, and Smith) exhibited peak acceleration levels exceeding 200 G and HIC(d) values surpassing 1000, as outlined in Figure 13. These helmet models showed impact durations ranging from 6 ms to 8 ms. In contrast, the Sweet Protection model demonstrated a notably lower peak acceleration of 149.3 G and an HIC(d) value of 782.4, with a slightly prolonged impact duration of 10 ms. The Specialized Ambush helmet model lies in-between, with a peak acceleration of 181.6 G and an HIC(d) value of 943.3. As for the simulated helmet geometry, it registered the highest HIC(d) value at 1445.0, accompanied by a peak acceleration of 188.0 G. The elevated HIC(d) value stemmed from consistently high acceleration levels combined with an extended impact duration of around 10 ms. Assessing the results from the physical drop tests and the simulated model, it can be concluded that the chosen material assumptions are adequate, and a comparison with models containing a lattice liner can be established. Figure 14 depicts the stress contour plots of the foam liner at the 5 ms time mark when the peak acceleration occurs. The foam liner is compressed from its original thickness of 32 mm at the uppermost point of the dummy head to 13.6 mm during the impact, with a compressive strain of 57.5%.
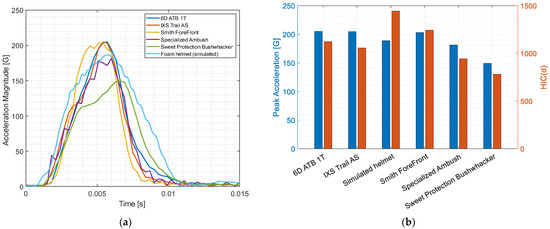
Figure 13.
(a) Acceleration magnitude progression of foam helmets during drop test; (b) peak acceleration and HIC(d) values of the foam helmets during drop test.
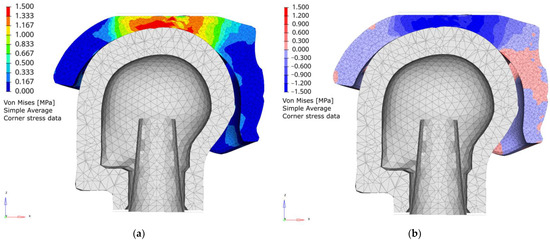
Figure 14.
Foam helmet geometry with stress contour plots at the 5 ms time mark: von Mises stress (a) and signed von Mises stress (b) showing equivalent tensile and compressive stresses.
3.2. Results of Helmets with Lattice Liner
3.2.1. Results of Material Parameter Approximation
The helmet geometry incorporating a Truncated Cube lattice with a 1.5 mm beam diameter was analyzed in the material parameter optimization study. It resulted in a Young’s modulus value E of 2003 MPa, a maximum plastic strain value of 7.64%, a strain rate coefficient c of 0.048, and a maximum stress of 78.6 MPa. These properties translate to the more commonly used Johnson–Cook parameters of A = 29.7 MPa, B = 35.2 MPa, and n = 0.129. While the strain at break commonly decreases with increased strain rate, the optimization procedure predicts that it is larger than determined by the tensile tests. It is still within a plausible range as the manufacturer’s data sheet states maximum strains of 15–20% [86]. A part’s property deviations may be caused by differing manufacturing or post-processing conditions, as well as loading conditions and manufacturing orientations.
The simulated acceleration curve closely resembles the test results, as shown in Figure 15. The curve’s slope and peak acceleration levels exhibit strong similarity. The physical test curve has a fluctuating and slowly declining acceleration magnitude after the impact (8 ms time mark), which is not visible in the simulation’s acceleration curve. This is likely caused by vibrations of the magnesium cone onto which the acceleration sensor is fastened (visible in Figure 6). Since this part is assumed to be a rigid body in the FEA model, the same behavior cannot occur here. Peak strain rates of over 4000/s are observed in the elements of the outer shell, with large-scale levels around 1000/s shortly before and after the peak acceleration time stamp.
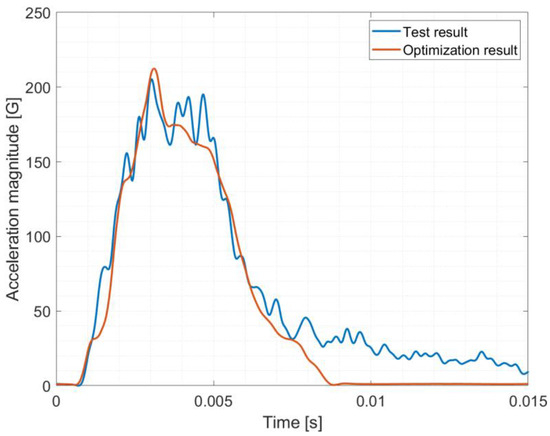
Figure 15.
Acceleration magnitude of the lattice helmet model with optimized material curve (orange) versus the physical test (blue).
3.2.2. Results of Helmet Model Simulations with Uniform Beam Diameter
The helmets incorporating a lattice liner with uniform thickness were simulated with the Johnson–Cook material parameters determined from the preceding optimization run. Their peak acceleration magnitudes and HIC(d) results are depicted in Figure 16, along with the foam helmet FEA model results. The findings range from 95 G and an HIC(d) level of 493.8 achieved by the Octet lattice model to 293.5 G and an HIC(d) level of 1325.3 reached by the Re-entrant model. On average, the peak acceleration reached 134.5 G and the HIC(d) value was 662.6. At the chosen configuration and with the assumed material properties, every helmet variant with a lattice liner outperformed the previously tested helmets with a foam liner with the exception of the model with the Re-entrant unit cell in orientation A. It entirely compressed and failed to sufficiently support the head during impact. Other helmet models were approaching the maximum liner compression capacity and achieved very low acceleration and HIC(d) values.
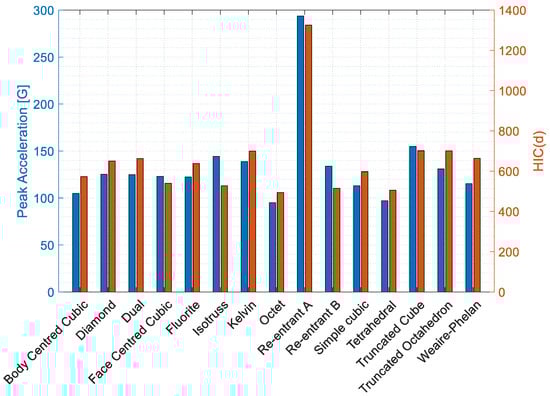
Figure 16.
Peak acceleration magnitudes and HIC(d) values of the investigated lattice types.
3.2.3. Results of Lattice Optimization Procedure
The Re-entrant lattice type in orientation A was chosen for the subsequent optimization study as a demonstration for the presented method for two reasons. Firstly, beams with diameters significantly below 1 mm are difficult to produce reliably with the chosen manufacturing method. It was noted during preliminary investigations that thin beams showed negative diameter deviations of up to 0.2 mm depending on their orientation and their target thickness, which impacts their load bearing capacity significantly. The feature size is at the lower end of the feasibility of this manufacturing process, and the sandblasting step for evacuating loose powder after printing can remove further material, causing reduced structural integrity. Choosing any of the other lattice types for optimization would only result in diameter reductions since their impact absorption capacity was not yet completely exhausted, reducing beam diameters to regions in which producibility becomes an issue. Since the Re-entrant lattice helmet model completely failed in the simulation, its lattice diameter could only be increased by the optimizer for acceptable performance, avoiding geometrical accuracy issues stemming from production and post-processing. Secondly, choosing a lattice type with good or even the best performance such as the Octet lattice could only yield small or no improvements, since it may already operate close to its optimum level. Therefore, choosing the worst-performing type was considered to be a better option for demonstrating the method’s capabilities. Since a strut diameter of 1 mm was insufficient for the Re-entrant lattice, it was increased to 1.5 mm to establish a suitable starting point for the optimization.
The reference model attained a maximum acceleration of 165.7 G and an HIC(d) value of 913 with a uniform diameter of 1.5 mm. After the optimization procedure, the HIC(d) value was improved to 716.0 and the peak acceleration decreased to 136.6 G. The acceleration curves of both FEA models with uniform and optimized lattice thicknesses are shown in Figure 17. The optimized model’s liner experienced a compression of 66%, reducing the distance between the inner and outer shell from 32 mm to 10.8 mm. Since its capacity was not entirely exhausted, a larger number of optimization iterations could possibly improve the helmet’s performance further. The resulting optimized lattice structure is shown in Figure 18a. The optimization variables’ final values are a = 9.63 × 10⁻⁴, b = 0.61, and c = −128.8; the resulting thickness distribution is displayed in Figure 18b. The diameter changes from approximately 1.9 mm in the innermost lattice group (T1) to 1.2 mm in the middle group (T5) and 1.7 mm in the outermost group (T8).
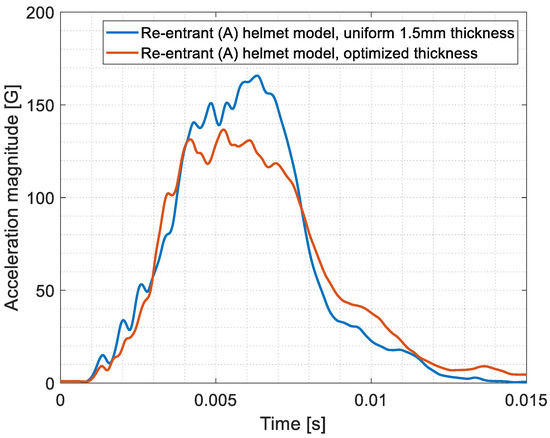
Figure 17.
Acceleration curves of unoptimized Re-entrant (orientation A) lattice helmet model with 1.5 mm uniform thickness (blue) and model with optimized thickness (red).
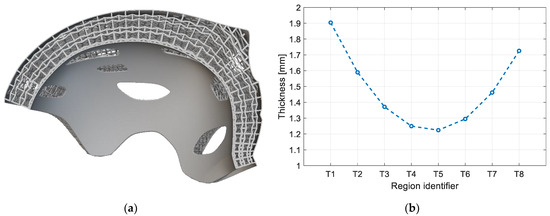
Figure 18.
(a) Section cut of the Re-entrant helmet geometry with optimized lattice thickness; (b) thickness distribution of optimized lattice liner (T1: innermost group; T8: outermost group).
3.2.4. Lattice Thickness Measurements
The beam diameters of the test structure shown in Figure 9 were assessed with calipers at regular intervals; the measurements are depicted in Figure 19. “Flat” beams were oriented along the piece’s longitudinal axis, while “upright” beams were oriented in parallel to the thickness gradient and build direction. Both the beam orientation and target thickness impacted the actual thickness, and the deviations were primarily negative. Based on these findings, the deviations were averaged and an offset of +0.04 mm was applied to beam diameters with a nominal value between 1.3 and 1.6 mm, while diameters below 1.3 mm had an offset of +0.08 mm applied to them before manufacturing the helmet samples.
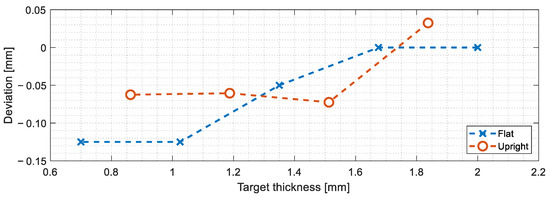
Figure 19.
Diameter deviations as measured at different orientations and thicknesses in the test lattice geometry.
3.2.5. Test Results of Helmet Model with Optimized Lattice Structure
Two helmet specimens with the optimized lattice were manufactured and tested. The drop test results displayed in Figure 20 show that the first helmet sample was immediately fully compressed and provided no gradual cushioning, as a large amount of powder was present in the lattice structure. The acceleration magnitude reached 591 G, with the HIC(d) reaching a fatal level of 2933. Afterwards, a second helmet with several orifices with a 10 mm diameter for better powder removal was manufactured and tested. While its acceleration curve showed a gradual increase at first, the lattice was completely compacted at the 7 ms mark due to its insufficient stiffness, and the curve subsequently increased to 224 G at the 8 ms mark. Contrasting it to the curve obtained from the optimized FEA model, it is evident that the test model’s lattice was not able to absorb the impact in the expected manner. Its HIC(d) value reached 778, which is comparable to the best-performing foam helmet model (Sweet Protection Bushwhacker) tested in Section 3.1, despite a higher peak acceleration. It performed noticeably better than its counterpart with a foam liner, which achieved an HIC(d) value of 1445.
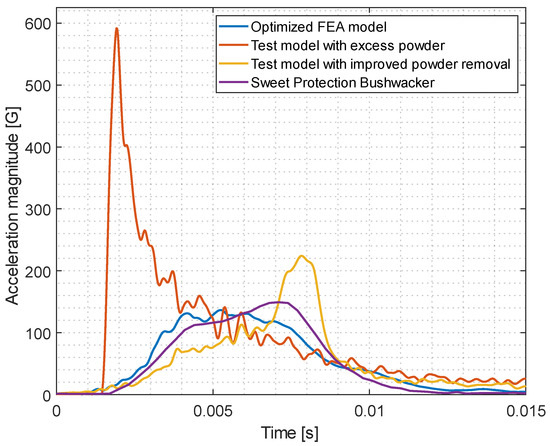
Figure 20.
Acceleration curves of the FEA model with optimized Re-entrant lattice (orientation A), the curves of the two physical tests, and the curve of the best-performing foam helmet (Sweet Protection Bushwhacker).
3.2.6. Helmet Sample Examination after Testing
The first helmet sample weighed 661.8 g; however, it was expected to weigh 400 g based on the nTop model geometry and the density determined during the material investigation by the authors (c.f. [72]). The second sample weighed 482.3 g, which was a significant improvement over the previous attempt, but still 20% heavier than anticipated. As can be deducted by the first test sample’s weight, a large amount of excess powder was trapped in the lattice despite great efforts to remove it during post-processing using sandblasting and ultrasound baths. Figure 21 depicts the compacted powder at the impact site after testing, as well as the helmet geometry after it was cut in half for closer examination. A large amount adhered to the lattice structure all throughout the helmet. The affected areas were difficult to target during sandblasting from the outside without additional access holes. The powder-removal orifices added to the second helmet sample were distributed over the inner helmet surface, as shown in Figure 22, and yielded better results.
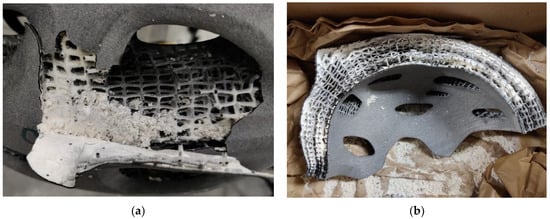
Figure 21.
First helmet model after testing: (a) helmet test sample containing excess powder directly after impact test; (b) helmet test sample containing excess powder cut open for examination after impact test.
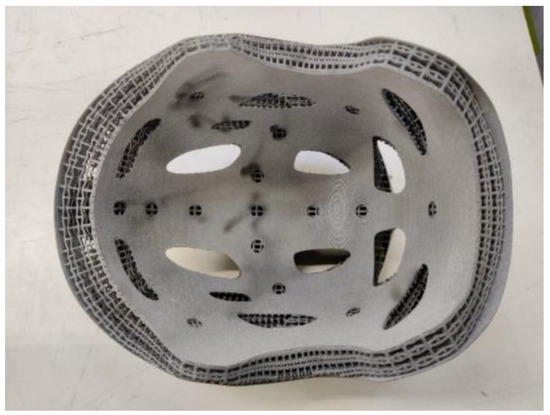
Figure 22.
Second helmet test sample with added powder-removal orifices.
The large amount of remaining powder in the first helmet sample prevented taking accurate thickness measurements, and additional sand blasting would have inadvertently reduced the lattice’s thickness further and influenced the results. Therefore, the resulting lattice thickness was measured using the second helmet sample after testing. With the application of a corrective measure, the beams assessed along the helmet ridge (see Figure 23) were found to be 0.05 mm thinner on average. The differences were more pronounced at the helmet’s front area, with deviations of up to −0.11 mm. Near the impact site, their diameters were closer to the target values. Measurements across the helmet ridge (see Figure 24) were found to have greater deviations of up to −0.17 mm at the left and right measurement points. Yet, the average difference amounted to only +0.01 mm since more than half of the measurements showed positive deviations.
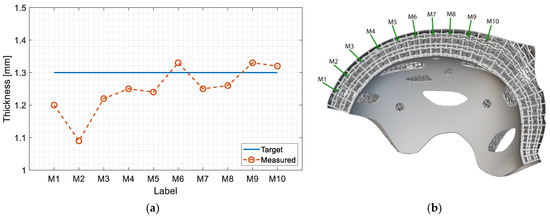
Figure 23.
Thickness measurements along helmet ridge (a) and their measurement points (b).
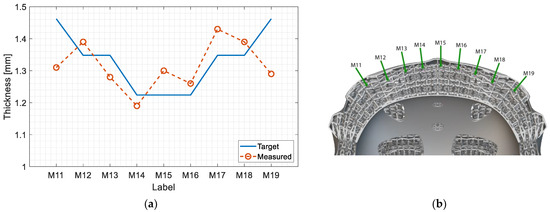
Figure 24.
Thickness measurements perpendicular to helmet ridge (a) and their measurement points (b).
4. Summary
The research presented here demonstrates the implementation of a conformal lattice structure into a realistic bicycle helmet design, adhering to engineering requirements such as adequate simulative modelling and manufacturing constraints. Fourteen suitable lattice types were investigated, and their performance was evaluated using appropriate FEA modelling methods. This work represents an advancement over previous studies which commonly focus on a small number of lattice types and the use of simplified helmet geometries. The lattices were analyzed at consistent relative densities, enabling better comparability of the different lattice types’ effectiveness. They were assessed together with the same helmet geometry possessing a foam lattice liner via simulation, in addition to five commercially available helmets for a direct comparison. Further, the study demonstrates the use of an optimization approach able to alter the thickness of discrete lattice regions. The use of a unibody helmet design simplifies the production process by reducing time, steps, and materials. The workflow aligns with real-world engineering constraints such as lattice design, optimization, appropriate FEA model representation, reassembly of the final geometry for manufacturing, and production limitations. However, the numerous software packages and file conversions required for this workflow highlight the lack of a unifying tool combining or at least reducing the engineering steps.
The FEA results suggest that lattice liners may offer better protection compared to foam alternatives based on the assumed material parameters. The lattice helmets demonstrated average peak acceleration values of 134.5 G and HIC(d) levels of 662.6. The best model achieved a peak acceleration of only 95 G and an HIC(d) level of 493.8. In contrast, the foam models exhibited an average peak acceleration of 188.9 G and an HIC(d) value of 1099.2, while the most effective model achieved a peak acceleration of 149.3 G and an HIC(d) value of 782.4. The worst-performing lattice variant was chosen to be optimized. While its test results did not align with the simulations, its performance was on par with the best-performing foam helmet model. It reached a peak acceleration of 224 G and an HIC(d) value of 778, meeting the EN 1078 standard’s criteria.
5. Discussion
The manufacturing and material modelling issues encountered during the physical assessments rendered the correlation of the simulation results with the tests challenging. The measurements taken from the helmets and the test lattice revealed that the manufactured diameters were inconsistent, depended on beam thickness and printing orientation, and tended to be smaller than predicted. Since the production was outsourced to a supplier, the authors had no direct control over manufacturing parameters, post-processing, or the possibility to adequately investigate the process outcomes with faster testing cycles. Additionally, the sand-blasting step required to remove excess powder after manufacturing is prone to produce deviations in the final geometry since it is a manual and difficult-to-control procedure. In-depth studies, such as those carried out by Gong [87], Vera-Rodriguez et al. [88], and Mele et al. [89], analyzing the actual defect structure and geometrical deviations of the as-printed parts produced with Powder Bed Fusion could aid in further reducing the differences seen between the simulation and test behaviors.
The material parameters from tensile testing or those determined from correlating the Johnson–Cook parameters based on the single drop test may not be transferrable to samples from different production batches or machines. Tensile testing at higher strain rates would have been preferrable but could not be performed within the scope of this study due to time and budget limitations.
The success of the test runs depends on the successful removal of excess powder in the lattice structure. Two additional test series with helmets incorporating a tetrahedral lattice and a truncated octahedron lattice were carried out during the investigation. They did not exhibit the same tendency to retain such a large amount of loose powder as these lattice types were much less intricate. Additional design iterations would likely aid in mitigating the production issues, but budget and time limits prevented the authors from further pursuing this avenue.
Improvements to the study could be made in several manners, for example by choosing a different FEA solver with more failure and material models compatible with beam elements. RADIOSS’ implementation of simple element deletion does not discern between compressive and tensile stresses and cannot account for partial strut failure. Additionally, the investigated helmet model did not include any padding or a head harness, which could further lower peak acceleration values. To avoid the accumulation of excess powder in certain areas, the helmet geometry could be produced without the inner shell, such that the lattice is more easily reachable and cleanable. Opting for a multi-part approach instead of a unibody design would also offer more flexibility in terms of material choice and production methods. Further insights could be gained by exploring more ductile materials such as polypropylene or thermoplastic elastomers. Alternatively, manufacturing the sections with stereolithography (SLA) printers would circumvent the issues regarding powder removal entirely. They could potentially mitigate the thickness deviation issues, as SLA printers provide very high manufacturing resolutions.
Author Contributions
Conceptualization, T.D. and S.K.; methodology, T.D.; software, T.D.; validation, T.D.; formal analysis, T.D.; investigation, T.D.; resources, S.K.; data curation, T.D.; writing—original draft preparation, T.D.; writing—review and editing, T.D.; visualization, T.D.; supervision, S.K.; project administration, S.K.; funding acquisition, S.K. All authors have read and agreed to the published version of the manuscript.
Funding
This research received no external funding.
Institutional Review Board Statement
Not applicable.
Informed Consent Statement
Not applicable.
Data Availability Statement
The data are contained within the article.
Acknowledgments
The authors thank SQLab GmbH for providing the helmet’s CAD file as well as for the drop test data of the commercially available mountain bike helmets.
Conflicts of Interest
The authors declare no conflicts of interest.
Appendix A

Figure A1.
Helmet drop test stand.
Figure A1.
Helmet drop test stand.


Figure A2.
Graph lattice types utilized in this study. (a) Simple Cubic, (b) Body-Centered Cubic, (c) Face-Centered Cubic, (d) Diamond, (e) Fluorite, (f) Octet, (g) Truncated Cube, (h) Truncated Octahedron, (i) Kelvin cell, (j) Isotruss, (k) Re-entrant in orientation A, (l) Re-entrant in orientation B, (m) Weaire–Phelan, (n) tetrahedral lattice, (o) dual lattice.

References
- Uribe-Lam, E.; Treviño-Quintanilla, C.D.; Cuan-Urquizo, E.; Olvera-Silva, O. Use of additive manufacturing for the fabrication of cellular and lattice materials: A review. Mater. Manuf. Process. 2020, 36, 257–280. [Google Scholar] [CrossRef]
- Seharing, A.; Azman, A.H.; Abdullah, S. A review on integration of lightweight gradient lattice structures in additive manufacturing parts. Adv. Mech. Eng. 2020, 12, 1687814020916951. [Google Scholar] [CrossRef]
- Aghajani, S.; Wu, C.; Li, Q.; Fang, J. Additively manufactured composite lattices: A state-of-the-art review on fabrications, architectures, constituent materials, mechanical properties, and future directions. Thin-Walled Struct. 2024, 197, 111539. [Google Scholar] [CrossRef]
- Deshpande, V.S.; Ashby, M.F.; Fleck, N.A. Foam topology: Bending versus stretching dominated architectures. Acta Mater. 2001, 49, 1035–1040. [Google Scholar] [CrossRef]
- Tamburrino, F.; Graziosi, S.; Bordegoni, M. The Design Process of Additively Manufactured Mesoscale Lattice Structures: A Review. J. Comput. Inf. Sci. Eng. 2018, 18, 040801. [Google Scholar] [CrossRef]
- Ashby, M.F. The properties of foams and lattices. Philos. Trans. R. Soc. A Math. Phys. Eng. Sci. 2006, 364, 15–30. [Google Scholar] [CrossRef] [PubMed]
- Gibson, L.J.; Ashby, M.F. Cellular Solids: Structure & Properties; Cambridge University Press: Oxford, UK, 1997. [Google Scholar] [CrossRef]
- Maconachie, T.; Leary, M.; Lozanovski, B.; Zhang, X.; Qian, M.; Faruque, O.; Brandt, M. SLM lattice structures: Properties, performance, applications and challenges. Mater. Des. 2019, 183, 108137. [Google Scholar] [CrossRef]
- Song, B.; Zhang, L.; Shi, Y. Microlattice metamaterials. In Metamaterial Design and Additive Manufacturing; Elsevier: Amsterdam, The Netherlands, 2023; pp. 223–266. [Google Scholar] [CrossRef]
- Yan, C.; Hao, L.; Yang, L.; Hussein, A.Y.; Young, P.G.; Li, Z.; Li, Y. Metal alloys uniform TPMS structures. In Triply Periodic Minimal Surface Lattices Additively Manufactured by Selective Laser Melting; Elsevier: Amsterdam, The Netherlands, 2021; pp. 39–130. [Google Scholar] [CrossRef]
- Tancogne-Dejean, T.; Spierings, A.B.; Mohr, D. Additively-manufactured metallic micro-lattice materials for high specific energy absorption under static and dynamic loading. Acta Mater. 2016, 116, 14–28. [Google Scholar] [CrossRef]
- Gümrük, R.; Mines, R.A.W.; Karadeniz, S. Static mechanical behaviours of stainless steel micro-lattice structures under different loading conditions. Mater. Sci. Eng. A 2013, 586, 392–406. [Google Scholar] [CrossRef]
- Mahshid, R.; Hansen, H.N.; Højbjerre, K.L. Strength analysis and modeling of cellular lattice structures manufactured using selective laser melting for tooling applications. Mater. Des. 2016, 104, 276–283. [Google Scholar] [CrossRef]
- Della Ripa, M.; Paolino, D.; Amorese, A.; Tridello, A. Numerical modelling of the mechanical response of lattice structures produced through AM. Procedia Struct. Integr. 2021, 33, 714–723. [Google Scholar] [CrossRef]
- Sanami, M.; Ravirala, N.; Alderson, K.; Alderson, A. Auxetic Materials for Sports Applications. Procedia Eng. 2014, 72, 453–458. [Google Scholar] [CrossRef]
- Hou, W.; Yang, X.; Zhang, W.; Xia, Y. Design of energy-dissipating structure with functionally graded auxetic cellular material. Int. J. Crashworthiness 2018, 23, 366–376. [Google Scholar] [CrossRef]
- Xue, Y.; Gao, P.; Zhou, L.; Han, F. An Enhanced Three-Dimensional Auxetic Lattice. Materials 2020, 13, 1008. [Google Scholar] [CrossRef] [PubMed]
- Chen, Z.; Wu, X.; Xie, Y.M.; Wang, Z.; Zhou, S. Re-entrant auxetic lattices with enhanced stiffness: A numerical study. Int. J. Mech. Sci. 2020, 178, 105619. [Google Scholar] [CrossRef]
- Cheng, X.; Zhang, Y.; Ren, X.; Han, D.; Jiang, W.; Zhang, X.G.; Luo, H.C.; Xie, Y.M. Design and mechanical characteristics of auxetic metamaterial with tunable stiffness. Int. J. Mech. Sci. 2022, 223, 107286. [Google Scholar] [CrossRef]
- Pham, M.-S.; Liu, C.; Todd, I.; Lertthanasarn, J. Damage-tolerant architected materials inspired by crystal microstructure. Nature 2019, 565, 305–311. [Google Scholar] [CrossRef]
- Al-Ketan, O.; Lee, D.-W.; Rowshan, R.; Abu Al-Rub, R.K. Functionally graded and multi-morphology sheet TPMS lattices: Design, manufacturing, and mechanical properties. J. Mech. Behav. Biomed. Mater. 2020, 102, 103520. [Google Scholar] [CrossRef] [PubMed]
- Maskery, I.; Aremu, A.; Parry, L.; Wildman, R.; Tuck, C.; Ashcroft, I. Effective design and simulation of surface-based lattice structures featuring volume fraction and cell type grading. Mater. Des. 2018, 155, 220–232. [Google Scholar] [CrossRef]
- Bai, L.; Gong, C.; Chen, X.; Sun, Y.; Xin, L.; Pu, H.; Peng, Y.; Luo, J. Mechanical properties and energy absorption capabilities of functionally graded lattice structures: Experiments and simulations. Int. J. Mech. Sci. 2020, 182, 105735. [Google Scholar] [CrossRef]
- Niknam, H.; Akbarzadeh, A. Graded lattice structures: Simultaneous enhancement in stiffness and energy absorption. Mater. Des. 2020, 196, 109129. [Google Scholar] [CrossRef]
- Maskery, I.; Hussey, A.; Panesar, A.; Aremu, A.; Tuck, C.; Ashcroft, I.; Hague, R. An investigation into reinforced and functionally graded lattice structures. J. Cell. Plast. 2017, 53, 151–165. [Google Scholar] [CrossRef]
- Choy, S.Y.; Sun, C.-N.; Leong, K.F.; Wei, J. Compressive properties of functionally graded lattice structures manufactured by selective laser melting. Mater. Des. 2017, 131, 112–120. [Google Scholar] [CrossRef]
- Ajdari, A.; Nayeb-Hashemi, H.; Vaziri, A. Dynamic crushing and energy absorption of regular, irregular and functionally graded cellular structures. Int. J. Solids Struct. 2011, 48, 506–516. [Google Scholar] [CrossRef]
- Tao, W.; Sutton, A.; Kolan, K.; Leu, M.C. Design of Lattice Structures with Graded Density Fabricated by Additive Manufacturing. In Proceedings of the International Symposium on Flexible Automation 2018 International Symposium on Flexible Automation, Kanazawa, Japan, 15–19 July 2018. [Google Scholar] [CrossRef]
- Yang, J.; Chen, X.; Sun, Y.; Zhang, J.; Feng, C.; Wang, Y.; Wang, K.; Bai, L. Compressive properties of bidirectionally graded lattice structures. Mater. Des. 2022, 218, 110683. [Google Scholar] [CrossRef]
- Xu, Y.; Li, T.; Cao, X.; Tan, Y.; Luo, P. Compressive Properties of 316L Stainless Steel Topology-Optimized Lattice Structures Fabricated by Selective Laser Melting. Adv. Eng. Mater. 2021, 23, 2000957. [Google Scholar] [CrossRef]
- Xiao, Z.; Yang, Y.; Xiao, R.; Bai, Y.; Song, C.; Wang, D. Evaluation of topology-optimized lattice structures manufactured via selective laser melting. Mater. Des. 2018, 143, 27–37. [Google Scholar] [CrossRef]
- Song, J.; Wang, Y.; Zhou, W.; Fan, R.; Yu, B.; Lu, Y.; Li, L. Topology optimization-guided lattice composites and their mechanical characterizations. Compos. Part B Eng. 2019, 160, 402–411. [Google Scholar] [CrossRef]
- Du, Y.; Li, H.; Luo, Z.; Tian, Q. Topological design optimization of lattice structures to maximize shear stiffness. Adv. Eng. Softw. 2017, 112, 211–221. [Google Scholar] [CrossRef]
- Han, Y.; Lu, W.F. A Novel Design Method for Nonuniform Lattice Structures Based on Topology Optimization. J. Mech. Des. 2018, 140, 091403. [Google Scholar] [CrossRef]
- Daynes, S.; Feih, S.; Lu, W.F.; Wei, J. Optimisation of functionally graded lattice structures using isostatic lines. Mater. Des. 2017, 127, 215–223. [Google Scholar] [CrossRef]
- Wu, J.; Wang, W.; Gao, X. Design and Optimization of Conforming Lattice Structures. IEEE Trans. Vis. Comput. Graph. 2021, 27, 43–56. [Google Scholar] [CrossRef] [PubMed]
- Wang, X.; Zhu, L.; Sun, L.; Li, N. A study of functionally graded lattice structural design and optimisation. In Proceedings of the 2020 6th International Conference on Mechanical Engineering and Automation Science (ICMEAS), Moscow, Russia, 29–31 October 2020; pp. 50–55. [Google Scholar]
- Takezawa, A.; Zhang, X.; Kato, M.; Kitamura, M. Method to optimize an additively-manufactured functionally-graded lattice structure for effective liquid cooling. Addit. Manuf. 2019, 28, 285–298. [Google Scholar] [CrossRef]
- Maloney, K.J.; Fink, K.D.; Schaedler, T.A.; Kolodziejska, J.A.; Jacobsen, A.J.; Roper, C.S. Multifunctional heat exchangers derived from three-dimensional micro-lattice structures. Int. J. Heat Mass Transf. 2012, 55, 2486–2493. [Google Scholar] [CrossRef]
- Cheng, L.; Liu, J.; Liang, X.; To, A.C. Coupling lattice structure topology optimization with design-dependent feature evolution for additive manufactured heat conduction design. Comput. Methods Appl. Mech. Eng. 2018, 332, 408–439. [Google Scholar] [CrossRef]
- Guild, M.D.; Rothko, M.; Sieck, C.F.; Rohde, C.; Orris, G. 3D printed sound absorbers using functionally-graded sonic crystals. J. Acoust. Soc. Am. 2018, 143, 1714. [Google Scholar] [CrossRef]
- Leng, B.; Ruan, D.; Tse, K.M. Recent bicycle helmet designs and directions for future research: A comprehensive review from material and structural mechanics aspects. Int. J. Impact Eng. 2022, 168, 104317. [Google Scholar] [CrossRef]
- Bontrager. Available online: https://www.trekbikes.com/international/en_IN_TL/bontrager?clear=true (accessed on 27 November 2023).
- WaveCel Helmets|Trek Bikes. Available online: https://www.trekbikes.com/us/en_US/wavecel/ (accessed on 19 November 2021).
- Koroyd. Available online: https://koroyd.com/ (accessed on 24 November 2023).
- Hexr. Available online: https://hexr.com (accessed on 27 November 2023).
- Bliven, E.; Rouhier, A.; Tsai, S.; Willinger, R.; Bourdet, N.; Deck, C.; Madey, S.M.; Bottlang, M. Evaluation of a novel bicycle helmet concept in oblique impact testing. Accid. Anal. Prev. 2019, 124, 58–65. [Google Scholar] [CrossRef]
- Soe, S.P.; Martin, P.; Jones, M.; Robinson, M.; Theobald, P. Feasibility of optimising bicycle helmet design safety through the use of additive manufactured TPE cellular structures. Int. J. Adv. Manuf. Technol. 2015, 79, 1975–1982. [Google Scholar] [CrossRef]
- Khosroshahi, S.F.; Duckworth, H.; Galvanetto, U.; Ghajari, M. The effects of topology and relative density of lattice liners on traumatic brain injury mitigation. J. Biomech. 2019, 97, 109376. [Google Scholar] [CrossRef]
- Naderi, A.A.; Imani, K.; Ahmadi, H. Crashworthiness Study of an Innovative Helmet Liner Composed of an Auxetic Lattice Structure and PU Foam. Mech. Adv. Compos. Struct. 2022, 9, 25–35. [Google Scholar] [CrossRef]
- Nasim, M.; Hasan, J.; Galvanetto, U. Impact behavior of energy absorbing helmet liners with PA12 lattice structures: A computational study. Int. J. Mech. Sci. 2022, 233, 107673. [Google Scholar] [CrossRef]
- Decker, T.; Kedziora, S. Local Thickness Optimization of Functionally Graded Lattice Structures in Compression. Appl. Sci. 2023, 13, 12969. [Google Scholar] [CrossRef]
- nTop. Available online: https://www.ntop.com (accessed on 10 December 2023).
- Decker, T.; Kedziora, S.; Wolf, C. Practical Implementation of Functionally Graded Lattice Structures in a Bicycle Crank Arm. In Proceedings of the 885th International Conference on Science, Technology, Engineering and Management (ICSTEM), Vienna, Austria, 25–25 November 2020; pp. 58–66. [Google Scholar]
- Kedziora, S.; Decker, T.; Museyibov, E. Application of Functionally Graded Shell Lattice as Infill in Additive Manufacturing. Materials 2023, 16, 4401. [Google Scholar] [CrossRef] [PubMed]
- EN 1078:2012; Helmets for Pedal Cyclists and for Users of Skateboards and Roller Skates. European Committee for Standardization—Technical Committee CEN/TC 158 “Head Protection”: Brussels, Belgium. Available online: https://standards.cencenelec.eu/dyn/www/f?p=205:110:0::::FSP_ORG_ID,FSP_LANG_ID:6139,25&cs=111AFC3A202BD0C5CF21D58F9A377B263 (accessed on 16 January 2024).
- U.S. Department of Transportation—National Highway Traffic Safety Administration. Occupant Protection in Interior Impact—Upper Interior Impact Protection. Available online: https://www.nhtsa.gov/sites/nhtsa.gov/files/documents/tp-201u-02_tag.pdf (accessed on 16 January 2024).
- Chybowski, L.; Przetakiewicz, W. Estimation of the Probability of Head Injury at a Given Abbreviated Injury Scale Level by Means of a Fuction of Head Injury Criterion. Syst. Saf. Hum. Tech. Facil. Environ. 2020, 2, 91–99. [Google Scholar] [CrossRef]
- SQLab GmbH. Available online: https://www.sq-lab.com/en/ (accessed on 24 November 2023).
- Stroud, I. Boundary Representation Modelling Techniques; Springer Science and Business Media LLC: Dordrecht, The Netherlands, 2006; ISBN 9781846283123. [Google Scholar]
- Allen, G. nTopology Modeling Technology. nTopology, 26 November 2019. Available online: https://www.ntop.com/resources/guides/whitepaper-implicit-modeling-technology/ (accessed on 20 April 2020).
- Altair HyperMesh. Available online: https://altair.com/hypermesh/ (accessed on 24 November 2023).
- Altair RADIOSS. Available online: https://altair.com/radioss (accessed on 24 November 2023).
- Altair HyperStudy. Available online: https://altair.com/hyperstudy/ (accessed on 24 November 2023).
- MATLAB. Available online: https://www.mathworks.com/products/matlab.html (accessed on 24 November 2023).
- EN 960:2006; Headforms for Use in the Testing of Protective Helmets. European Committee for Standardization—Technical Committee CEN/TC 158 “Head Protection”: Brussels, Belgium. Available online: https://standards.cencenelec.eu/dyn/www/f?p=205:110:0::::FSP_PROJECT:6481&cs=1D4762919EDD7581CBAB25E02CD719CA9 (accessed on 16 January 2024).
- Bushby, K.M.; Cole, T.; Matthews, J.N.; Goodship, J.A. Centiles for adult head circumference. Arch. Dis. Child. 1992, 67, 1286–1287. [Google Scholar] [CrossRef] [PubMed]
- HP Multi Jet Fusion 3D Printing Technology. Available online: https://www.hp.com/us-en/printers/3d-printers/learning-center/3d-printing-process.html#section=hp-multi-jet-fusion (accessed on 31 October 2023).
- Ouellet, S.; Cronin, D.; Worswick, M. Compressive response of polymeric foams under quasi-static, medium and high strain rate conditions. Polym. Test. 2006, 25, 731–743. [Google Scholar] [CrossRef]
- Cao, K.; Ma, X.; Zhang, B.; Wang, Y.; Wang, Y. Tensile behavior of polycarbonate over a wide range of strain rates. Mater. Sci. Eng. A 2010, 527, 4056–4061. [Google Scholar] [CrossRef]
- Mg AZ91. Available online: https://www.matweb.com/search/datasheet.aspx?MatGUID=07baafbb9c364fb18fd413bceced867f (accessed on 16 January 2024).
- Decker, T.; Kedziora, S.; Museyibov, E. Comparison of Strength Properties of Common Powder Bed Fusion and Stereolithography Materials. Key Eng. Mater. 2023, 969, 11–20. [Google Scholar] [CrossRef]
- Roppenecker, D.B.; Grazek, R.; Coy, J.A.; Irlinger, F.; Lueth, T.C. Friction Coefficients and Surface Properties for Laser Sintered Parts. In Proceedings of the ASME 2013 International Mechanical Engineering Congress and Exposition, San Diego, CA, USA, 15–21 November 2013; American Society of Mechanical Engineer: New York, NY, USA, 2013; Volume 2, pp. 1–10. [Google Scholar] [CrossRef]
- Aldahash, S.A. Friction and wear properties of oriented Polaymide 12 objects manufactured by SLS Technology. J. Eng. Appl. Sci. 2019, 15, 9–25. [Google Scholar]
- Lee, J.; Xu, G.; Liang, H. Experimental and numerical analysis of friction and wear behavior of polycarbonate. Wear 2001, 251, 1541–1556. [Google Scholar] [CrossRef]
- Altair RADIOSS LAW70 Tabulated Viscoelastic Foam Material Law. Available online: https://2021.help.altair.com/2021/hwsolvers/rad/topics/solvers/rad/mat_law70_foam_tab_starter_r.htm (accessed on 1 December 2023).
- Altair RADIOSS LAW36 Elastic Plastic Piecewise Linear Material. Available online: https://2021.help.altair.com/2021/hwsolvers/rad/topics/solvers/rad/explicit_structural_fea_elasto_plastic_c.htm#elastic_plastic_piecewise_linear_material_r (accessed on 1 December 2023).
- Altair RADIOSS LAW2 Johnson-Cook Elastic-Plastic Material Model. Available online: https://2021.help.altair.com/2021/hwsolvers/rad/topics/solvers/rad/mat_law2_plas_johns_starter_r.htm (accessed on 1 December 2023).
- Altair RADIOSS TYPE7 General Contact Interface. Available online: https://2021.help.altair.com/2021/hwsolvers/rad/topics/solvers/rad/default_inter_type7_starter_r.htm?zoom_highlight=type7 (accessed on 1 December 2023).
- Altair RADIOSS TYPE11 Edge-to-Edge Contact Interface. Available online: https://2021.help.altair.com/2021/hwsolvers/rad/topics/solvers/rad/default_inter_type11_starter_r.htm?zoom_highlight=type11 (accessed on 1 December 2023).
- ISO 527-2:2012; Plastics-Determination of Tensile Properties-Part 2: Test Conditions for Moulding and Extrusion Plastics. International Organization for Standardization: Geneva, Switzerland, 2012. Available online: https://www.iso.org/standard/56046.html (accessed on 5 October 2021).
- Modifiable Extensible Lattice Sequence (MELS). Available online: https://2021.help.altair.com/2021.2/hwdesktop/hst/topics/design_exploration/method_modified_extensible_lattice_sequence_doe_r.htm (accessed on 24 November 2023).
- Global Response Search Method (GRSM). Available online: https://2021.help.altair.com/2021.2/hwdesktop/hst/topics/design_exploration/method_global_response_surface_method_r.htm (accessed on 24 November 2023).
- TCL/TK Homepage. Available online: https://www.tcl.tk (accessed on 27 November 2023).
- Fischer, S.F.; Thielen, M.; Loprang, R.R.; Seidel, R.; Fleck, C.; Speck, T.; Bührig-Polaczek, A. Pummelos as Concept Generators for Biomimetically Inspired Low Weight Structures with Excellent Damping Properties. Adv. Eng. Mater. 2010, 12, B658–B663. [Google Scholar] [CrossRef]
- HP Development Company. HP 3D High Reusability PA 12. pp. 5–6. 2019. Available online: http://www8.hp.com/h20195/v2/getpdf.aspx/4AA7-0716ENE.pdf (accessed on 5 October 2021).
- Gong, H. Generation and Detection of Defects in Metallic Parts Fabricated by Selective Laser Melting and Electron Beam Melting and Their Effects on Mechanical Properties. Ph.D. Thesis, University of Louisville, Louisville, KY, USA, 2013. [Google Scholar] [CrossRef]
- Vera-Rodríguez, G.; Moreno-Corrales, L.; Marín-González, I.; Barba, D.; Montáns, F.J.; Sanz-Gómez, M. Incorporation of Defects in Finite Elements to Model Effective Mechanical Properties of Metamaterial Cells Printed by Selective Laser Melting. Sustainability 2024, 16, 1167. [Google Scholar] [CrossRef]
- Mele, M.; Campana, G.; Monti, G.L. Intelligent orientation of parts based on defect prediction in Multi Jet Fusion process. Prog. Addit. Manuf. 2021, 6, 841–858. [Google Scholar] [CrossRef]


Disclaimer/Publisher’s Note: The statements, opinions and data contained in all publications are solely those of the individual author(s) and contributor(s) and not of MDPI and/or the editor(s). MDPI and/or the editor(s) disclaim responsibility for any injury to people or property resulting from any ideas, methods, instructions or products referred to in the content. |
© 2024 by the authors. Licensee MDPI, Basel, Switzerland. This article is an open access article distributed under the terms and conditions of the Creative Commons Attribution (CC BY) license (https://creativecommons.org/licenses/by/4.0/).