Abstract
This paper addresses the intricate challenges of coastal management, particularly in rapidly forming tidal flats, emphasizing the need for innovative monitoring strategies. The dynamic coastal topography, exemplified by a newly formed tidal flat in Shanghai, underscores the urgency of advancements in coastal risk recognition. By utilizing a digital twin framework integrated with state-of-the-art unmanned aerial vehicles (UAVs), we systematically evaluate three configurations and identify the optimal setup incorporating real-time kinematics (RTK) and light detection and ranging (LiDAR). This UAV configuration excels in efficiently mapping the 3D coastal terrain. It has an error of less than 0.1 m when mapping mudflats at an altitude of 100 m. The integration of UAV data with a precise numerical ocean model forms the foundation of our dynamic risk assessment framework. The results showcase the transformative potential of the digital twin framework, providing unparalleled accuracy and efficiency in coastal risk recognition. Visualization through Unity Engine or Unreal Engine enhances accessibility, fostering community engagement and awareness. By predicting and simulating potential risks in real-time, this study offers a forward-thinking strategy for mitigating coastal dangers. This research not only contributes a comprehensive strategy for coastal risk management but also sets a precedent for the integration of cutting-edge technologies in safeguarding coastal ecosystems. The findings are significant in paving the way for a more resilient and sustainable approach to coastal management, addressing the evolving environmental pressures on our coastlines.
1. Introduction
Coastal areas, characterized by their dynamic interplay between land and sea, are important ecosystems that host varied biodiversity, support economies through fisheries and tourism, and serve as critical buffers against natural hazards [1,2,3,4]. Numerous studies substantiate the dynamic nature of global coasts. For instance, about 24% of the world’s sandy beaches were continuously losing ground at a rate of more than 0.5 m per year from 1984 to 2016 [5], which is attributed to exposure to various environmental factors such as hydrodynamics (e.g., tides, waves, and alongshore currents), extreme events (e.g., tropical cyclones, floods, and drought), and the rising sea levels associated with climate change [6,7].
A tidal flat (also known as the intertidal zone) is a coastal landscape with expanses of flat, muddy, or sandy areas exposed during low tide and submerged during high tide, observable along the coastlines with strong tidal dynamics [8]. It is characterized by the rise and fall of tides, creating a dynamic environment and continuous transformations influenced mainly by tidal processes [9]. Typically, the regional low-lying topography within the tidal flat is referred to as a tidal creek or tidal channel [10,11]. Should the tide elevate swiftly, leading to a considerable depth in the tidal creek, this poses a potential risk to individuals [12]. In this context, the tidal flat formed swiftly and changing rapidly in the southeast corner of Shanghai stands as a testament to the complexity of coastal topography, particularly marked by the characteristics of complex spatial features and frequent temporal evolution that are not yet comprehensively understood. The variations in the tidal flat area with time and the relationship between the tidal level and the tidal flat area revealed that the tidal flat was in a rapid accretion phase before 2018, which then changed to erosion [13].
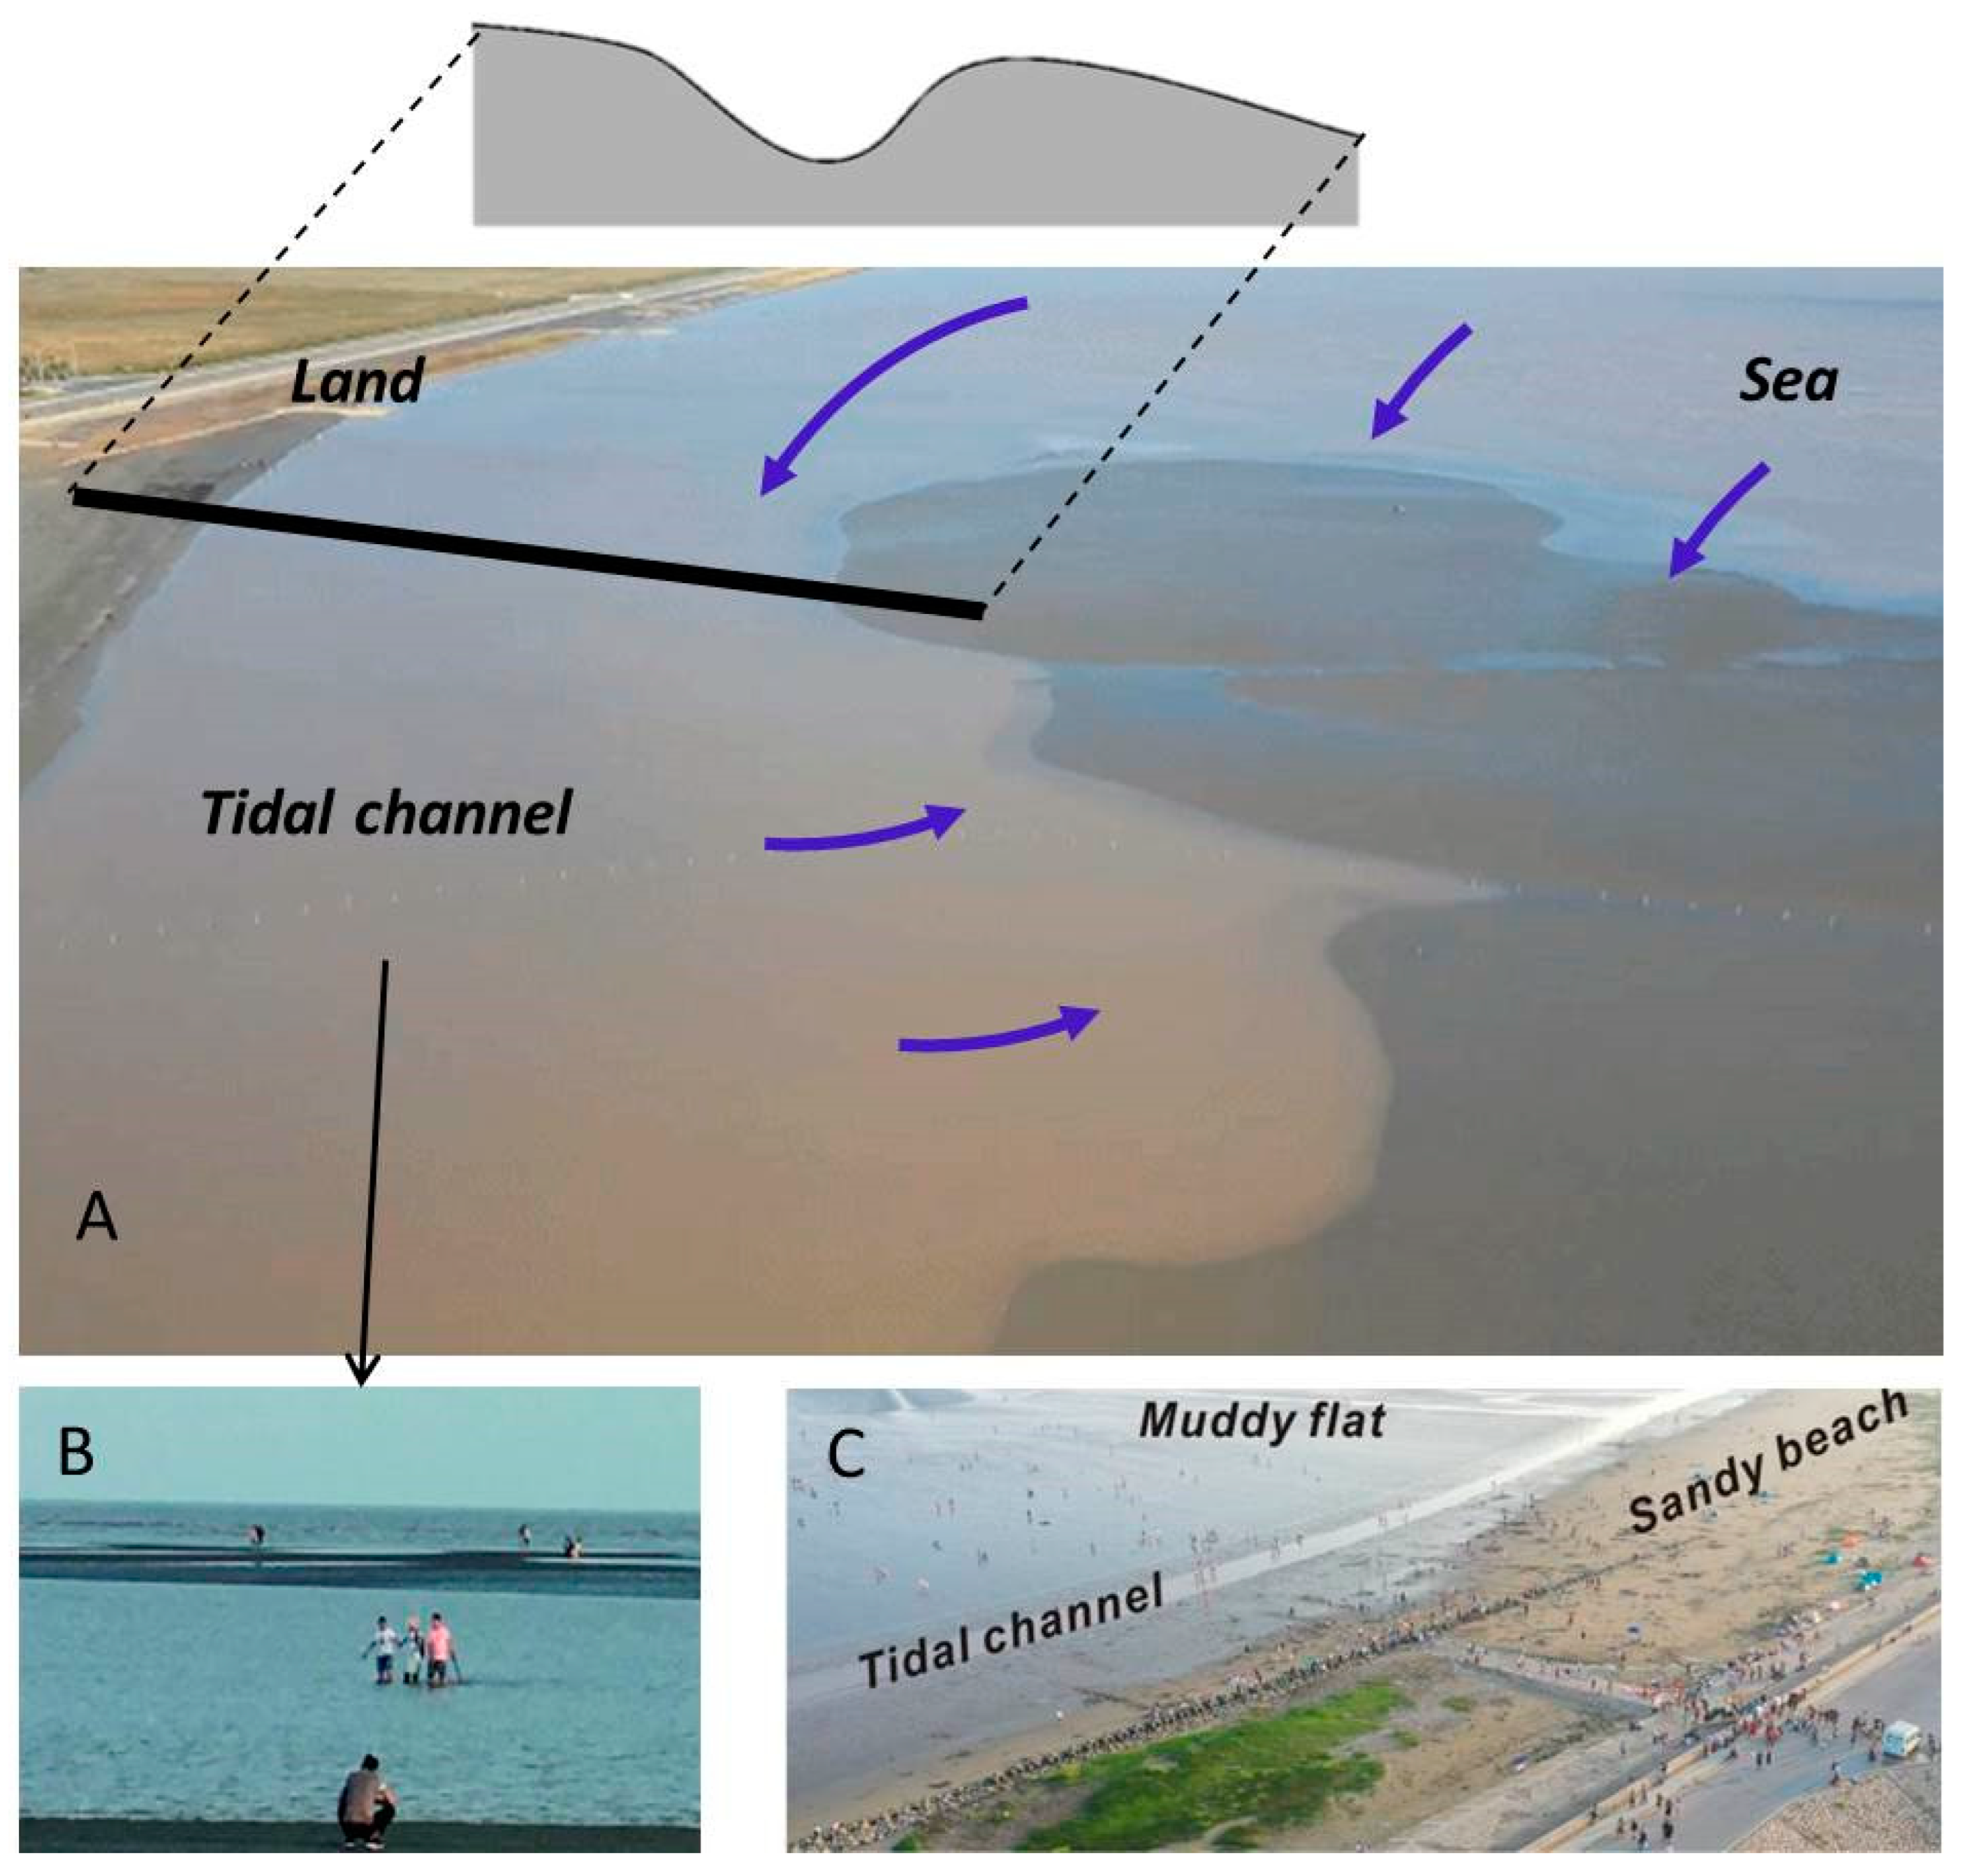
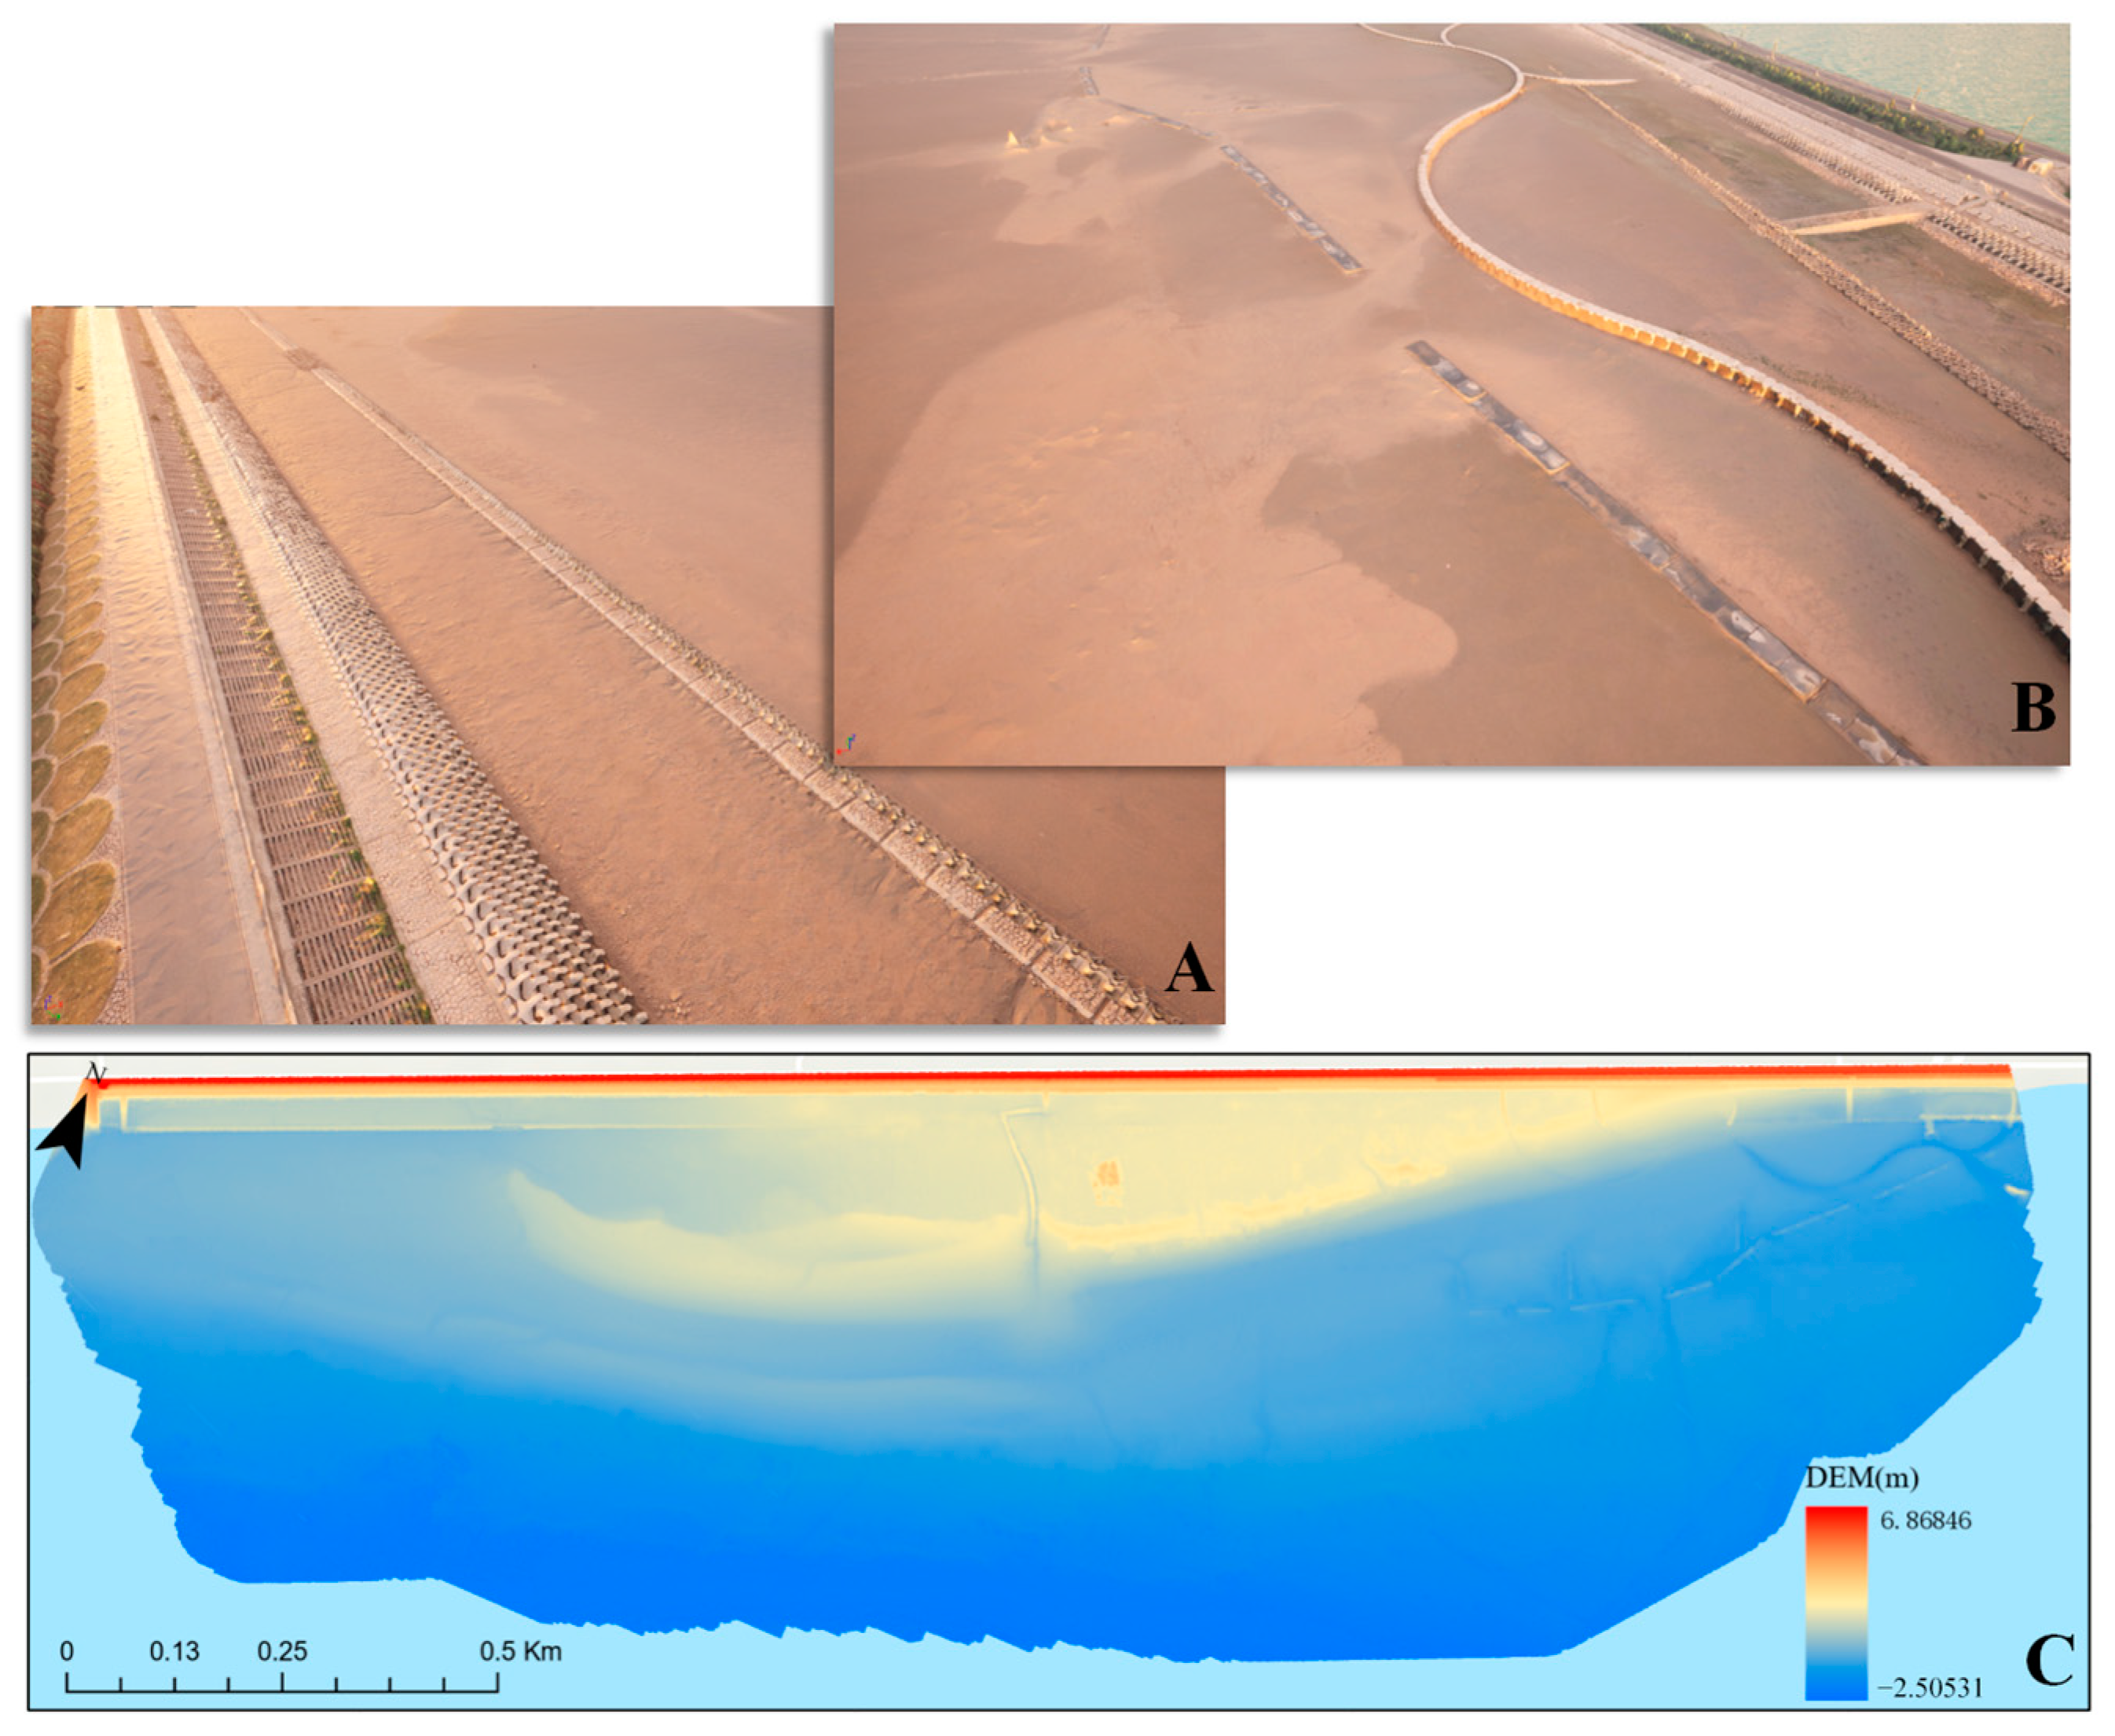
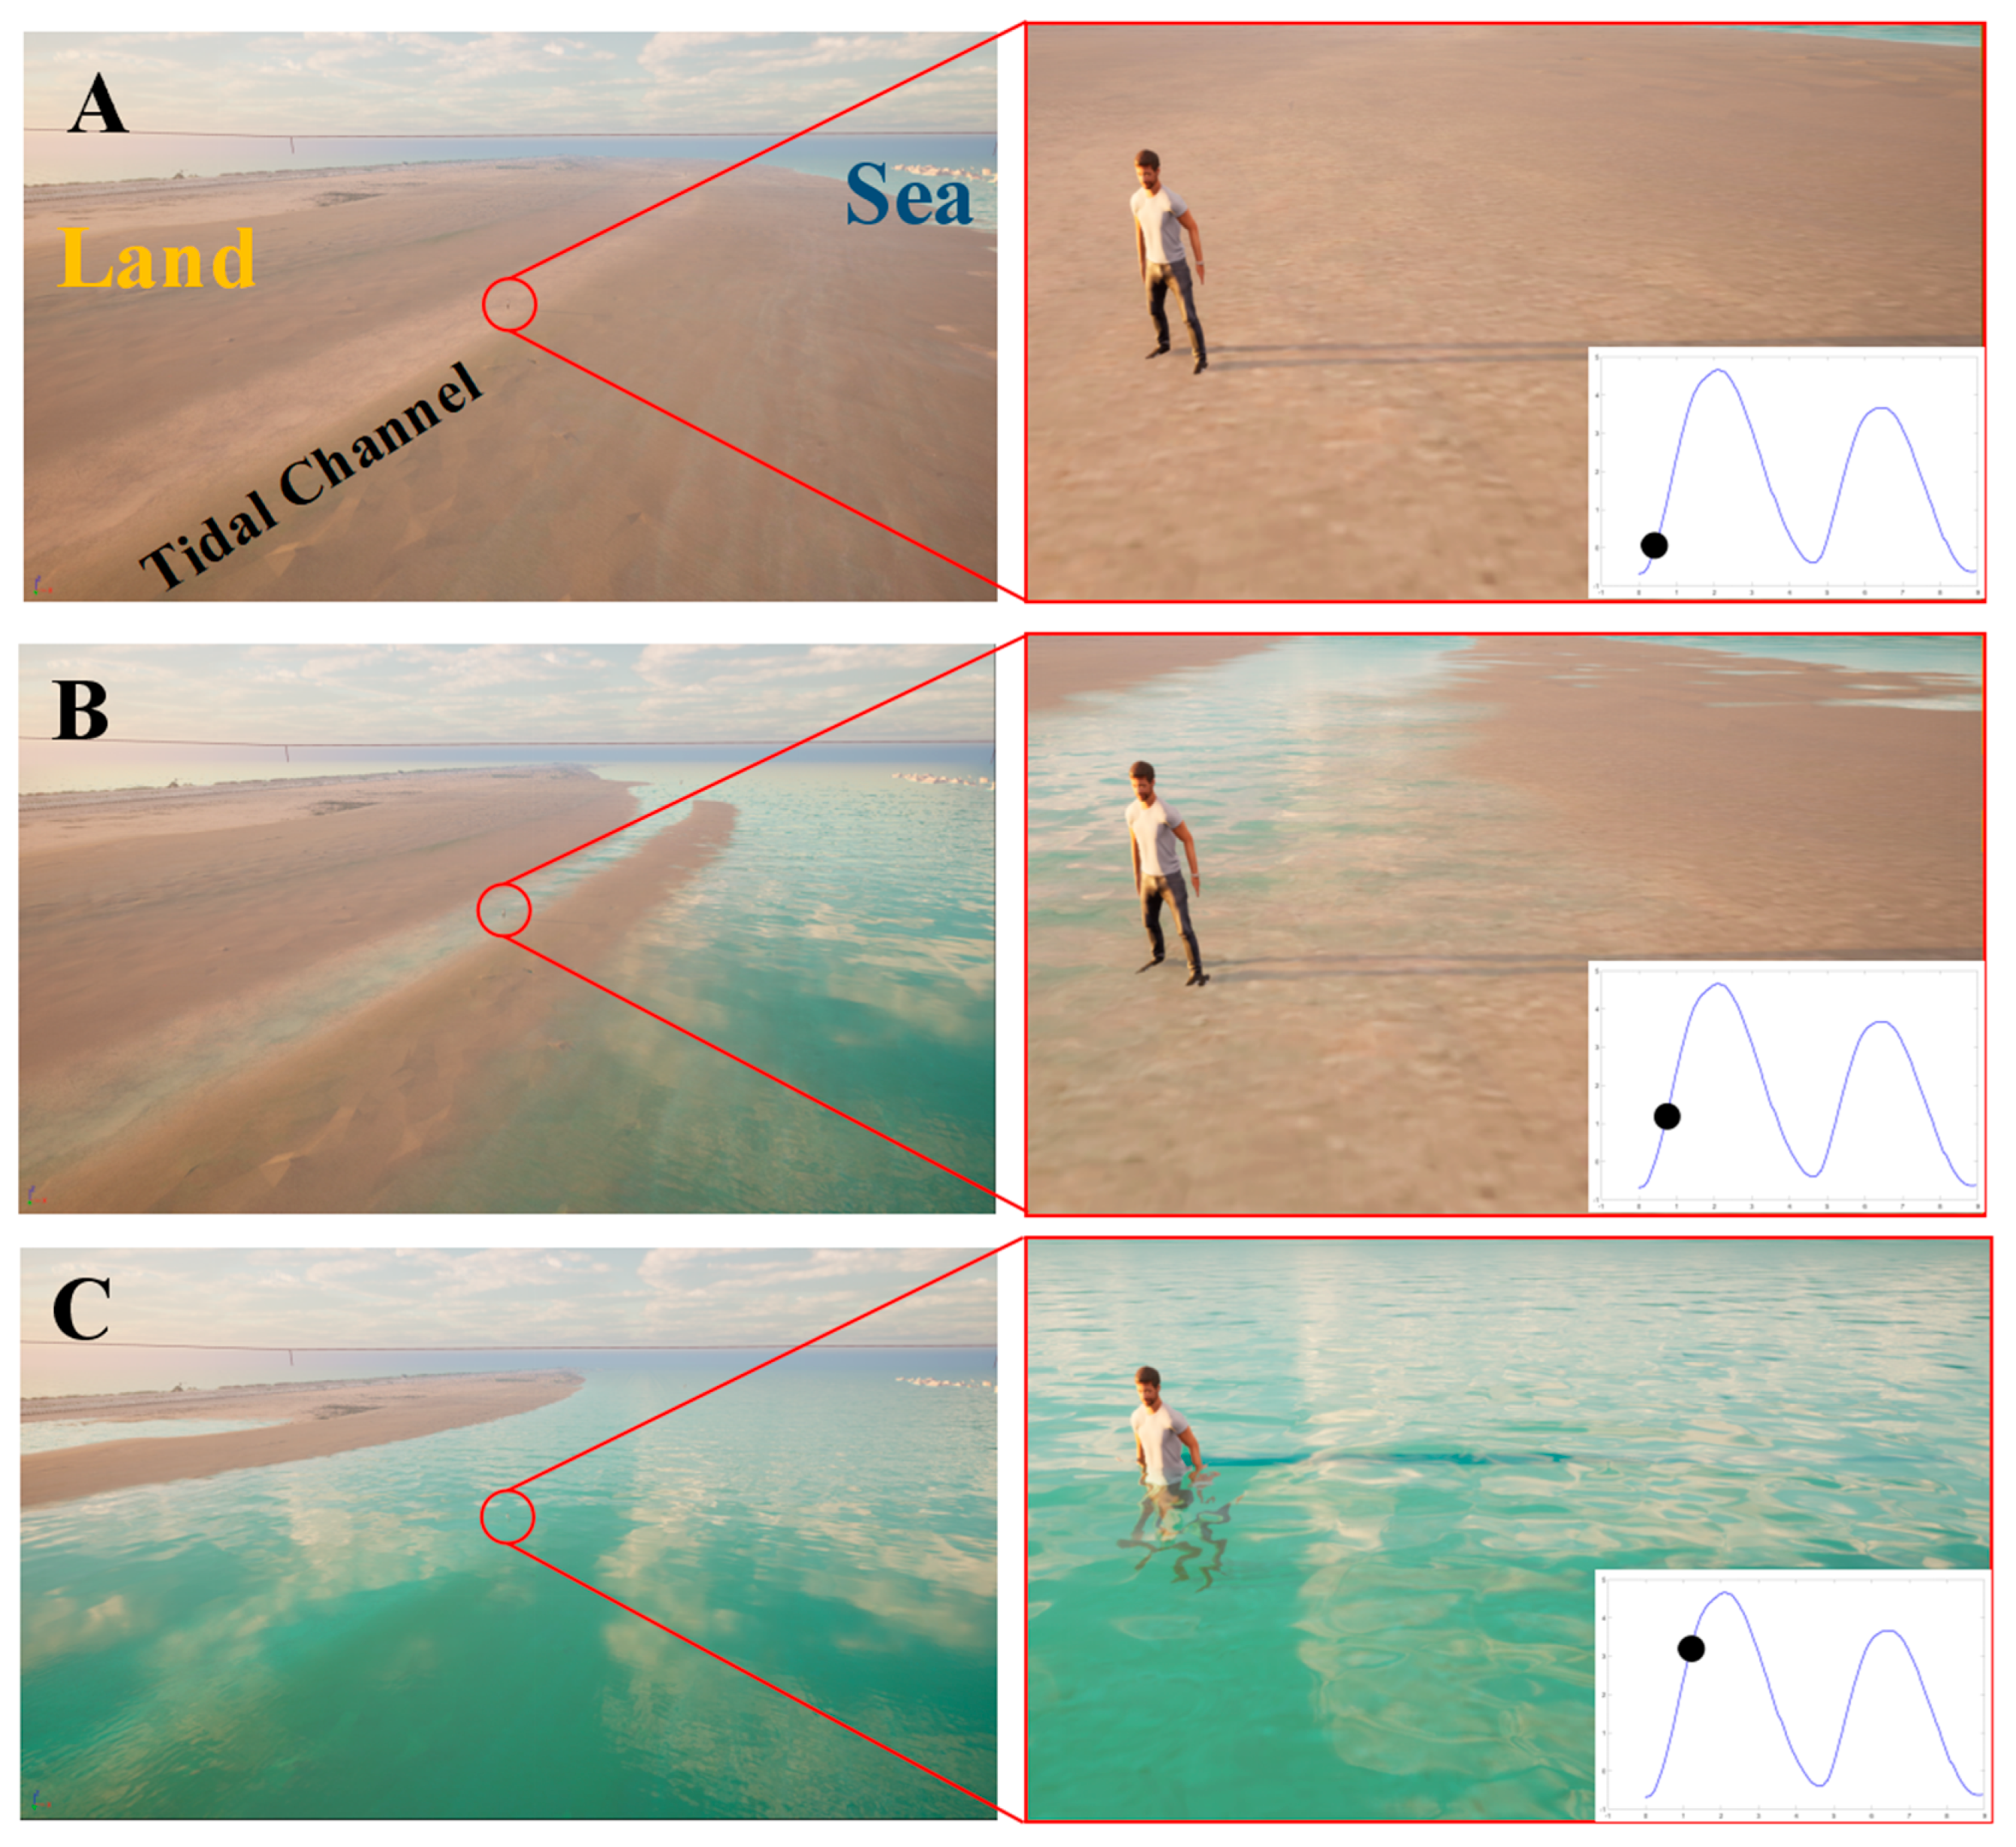
While this tidal flat attracts numerous individuals during low tidal levels for recreational pursuits, there exists a significant gap in recognizing and comprehending the associated risks when seawater levels rise. The actual situation is that individuals who visit the lower tidal flat during the low-tide period often instinctively return to the land when seawater approaches their position. However, owing to the non-linear changes in topography, the seawater might rise from the onshore direction (see Figure 1). This risk may not be readily apparent, particularly to individuals who are not familiar with the local natural conditions or possess limited oceanic knowledge.
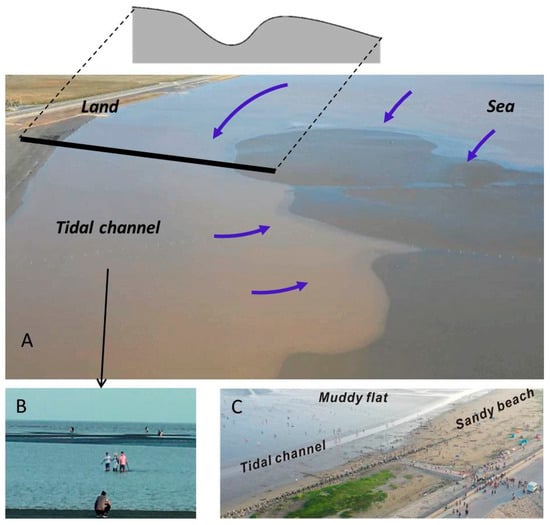
Figure 1.
(A) Aerial photograph captured during the rising tidal level, with the black solid line indicating the section position and the blue arrows illustrating seawater submerging the tidal channel initially and subsequently surrounding the lower tidal flat; (B) the scenario where individuals recognize the need to return to land, but the seawater has already reached a considerable depth in the tidal channel; and (C) aerial photograph taken during the low tidal level, depicting numerous tourists on the lower tidal flat.
Indeed, the specified region has had numerous reports in recent years of tourists coming across dangers or having accidents, as documented in various instances [14,15,16]. In general, a lack of awareness of the potential dangers poses a pressing issue that demands effective monitoring and assessment strategies.
From a coastal management perspective, recognizing the hazards linked to recreational activities on tidal flats is crucial. While installing warning signs along the coast offers a basic level of risk communication, this method may not be specific or engaging enough to effectively convey the dangers. Moreover, it fails to incorporate real-time updates reflecting the dynamic nature of beach environments. To address this, we propose an immersive solution designed to intuitively educate the public about these risks. This approach is grounded in the development of a digital twin framework, which not only facilitates a detailed understanding of tidal flat hazards but also enhances the experience through interactive and immersive technology. This framework leverages precise coastal measurements and advanced numerical models to simulate the surrounding ocean’s hydrodynamic processes, offering a more comprehensive and accessible way for the public to comprehend and navigate the complexities of coastal risks.
1.1. Coastal Monitoring
Manual in situ measurements (e.g., via real-time kinematics, RTK) have been considered the most common way to obtain tidal flat topography. However, manual on-site measurements are not the optimal choice. On the one hand, the seasonal variations or responses to extreme weather conditions necessitate the timely acquisition of the latest topography (e.g., within a weekly time frame); on the other hand, when confronting risks in the tidal flat, manual measurements inherently pose potential safety risks. Therefore, unmanned aerial vehicle (UAV) surveys may currently be a more feasible approach, capable of both obtaining topographical data and capturing high-resolution photographs. For industrial or mapping UAVs, the RTK module is an essential component for georeferencing UAV images. To meet a range of research needs, these UAVs might integrate different sensor modules, including super high-resolution cameras, multispectral cameras, LiDAR, thermal imaging cameras, and aerial sensors [17,18,19,20].
UAV systems have gained increasing acceptance in coastal monitoring. The authors of [21] employed a six-axis UAV equipped with a network-based RTK system and a Canon EOS 550D DSLR camera for beach surveys in northeastern Italy. The UAV utilized a structure from motion (SFM) technique, and digital elevation models (DEMs) derived from terrestrial laser scanning were assessed using 15 ground control points (GCPs). The results demonstrated the UAV-acquired data’s superior reliability compared to global navigation satellite system (GNSS) data. In a study monitoring long-term changes at Narrabeen Beach, northern Sydney, the authors of [22] utilized a commercial off-the-shelf RTK-global positioning system (GPS) fixed-wing UAV. They exclusively relied on the high-precision RTK positioning system, eliminating the need for ground surveys and GCPs. The study confirmed the reliability of using professional-grade UAVs integrated with the RTK module, even without image control points. By equipping the UAV with a LiDAR module [19], the generated point cloud data exhibited high uniformity (±5–10 cm difference) compared to results obtained through image-based methods. Additionally, they emphasized that, for flat terrains like intertidal zones with extensive UAV coverage, the LiDAR module excelled in penetrating vegetation and capturing original surface points, surpassing the capabilities of other image-based technologies.
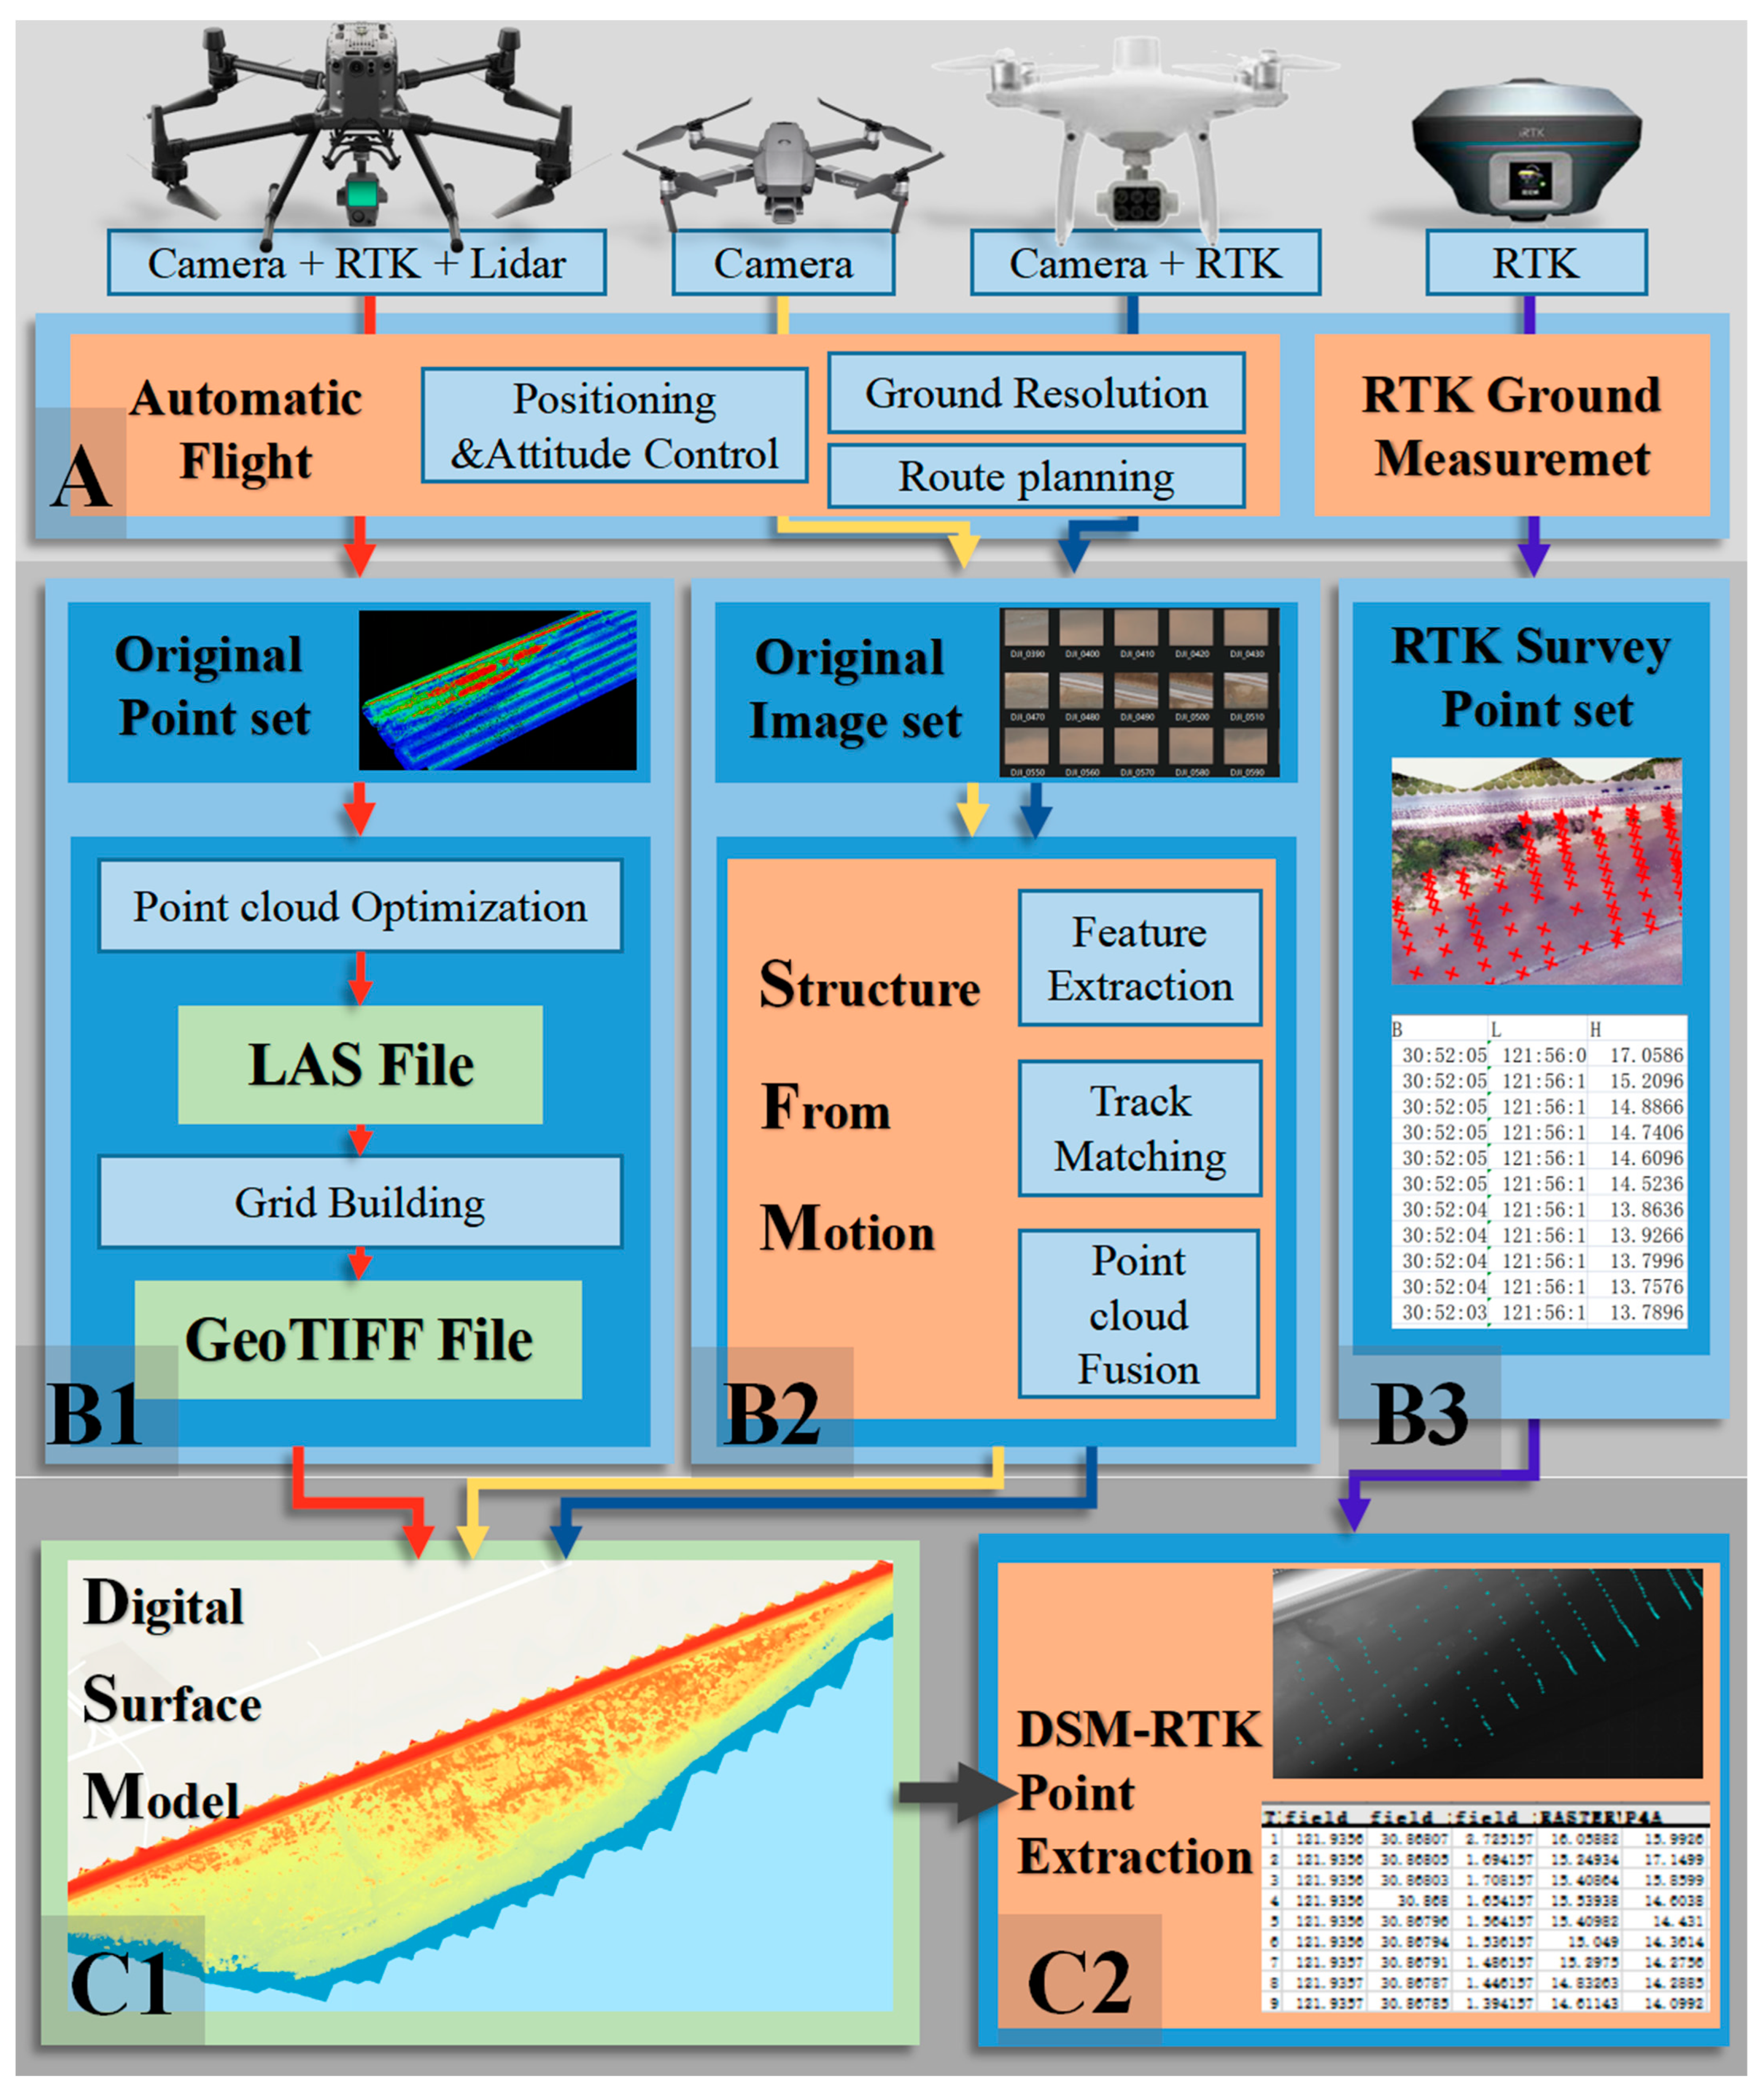
Researchers have successfully integrated UAVs into their respective fields of study and evaluated the effectiveness of employing small UAVs equipped with various sensors for coastal mapping and study [23]. The existing methods, widely adopted across various industries and supported by comprehensive industry standards, can be categorized into three distinct groups:
- (1)
- UAVs equipped with an RTK-GPS and visible light cameras are employed for oblique photography to capture .jpg images. Subsequently, 2D-to-3D techniques such as SFM are utilized to generate digital surface models (DSMs) and DEMs [22,24,25].
- (2)
- UAVs equipped with multispectral cameras are used to capture .tif or other bitmap format images. Various normalized difference indices are then constructed to enable specialized hyperspectral processing [26].
- (3)
- RTK-enabled UAVs with LiDAR are employed for aerial scans to acquire point cloud files in LDR format, which are subsequently used to construct high-precision DEMs [19].
Figure 2 provides a flowchart of the technical approaches employed in these methods.
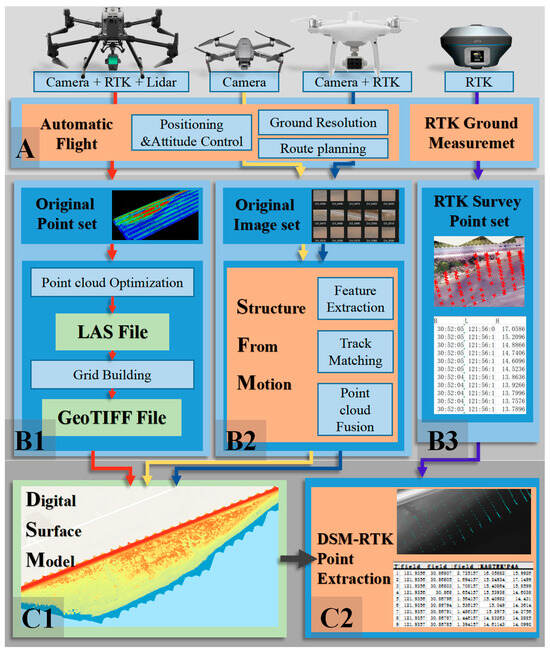
Figure 2.
DSM’s accuracy verification methods for UAV systems. (A) Equipment utilized in coastal monitoring; (B1–B3) demonstrate the operational procedures for UAV-LiDAR, UAV-camera, and ground-based RTK monitoring, respectively; (C1,C2) display the monitoring outcomes derived from these varied methodologies.
When utilizing diverse parameters from these modules or employing data acquired through different principles in scientific investigations, the reliability of the findings may be impacted by the inherent characteristics of these modules. The efficiency, safety, and precision of data acquisition in coastal mapping endeavors are significantly influenced by various UAVs and sensors, particularly when ground control points are lacking. When examining tidal flats, not using ground control points is crucial because there is a need to deploy measurements rapidly during the lowest tide. At the same time, due to the unique characteristics of the intertidal zone, placing image control points and finding ground features with distinct markers pose certain challenges.
1.2. The Digital Twin
The concept of the digital twin was envisioned by [27] and was first documented in 2002 [28]; it refers to a virtual model that accurately reflects a physical system or object. A digital twin can be used for various purposes, including design optimization, quality control, monitoring, decision-making, and policy formulation [29]. Its utilization has been reported in the realm of ocean and coastal fields [30,31,32,33], where the digital twin is regarded as a potent tool for a further understanding of problems that may not be easily discovered in reality. However, there are currently few digital twin applications for coastal research. Some of these applications use deep learning methods for classification, reconstruction, and other functions [24,34,35,36,37,38]. Therefore, there is a need for more integrated research in the traditionally interdisciplinary field of coastal studies.
Consequently, to the best of our knowledge, there is still a need for an accurate, intelligent, and intuitive tool to assess the risk in a specific tidal flat at the highest possible spatial and temporal resolution. This study aims to address this gap through the following steps: (1) evaluating the performance of different UAVs for coastal monitoring, with specific emphases on UAVs equipped with different sensors or modules; (2) building a high-resolution 3D coastal terrain efficiently from the most suitable UAV; (3) employing a highly accurate ocean model to generate the time series of tidal level; and (4) developing a digital twin of the actual coast to visualize and assess coastal risks by integrating rapidly monitored terrain data with the numerical ocean model based on a 3D engine. This innovative framework promises to offer accurate tidal level predictions, providing valuable insights for mitigating the risks associated with rising seawater levels. It can not only showcase the current state of the tidal flat but also review conditions over a period, including reproducing the past and predicting the future. Ultimately, this paper contributes to the broader discourse on effective coastal management and the integration of cutting-edge technologies in addressing emerging environmental challenges.
2. Study Area
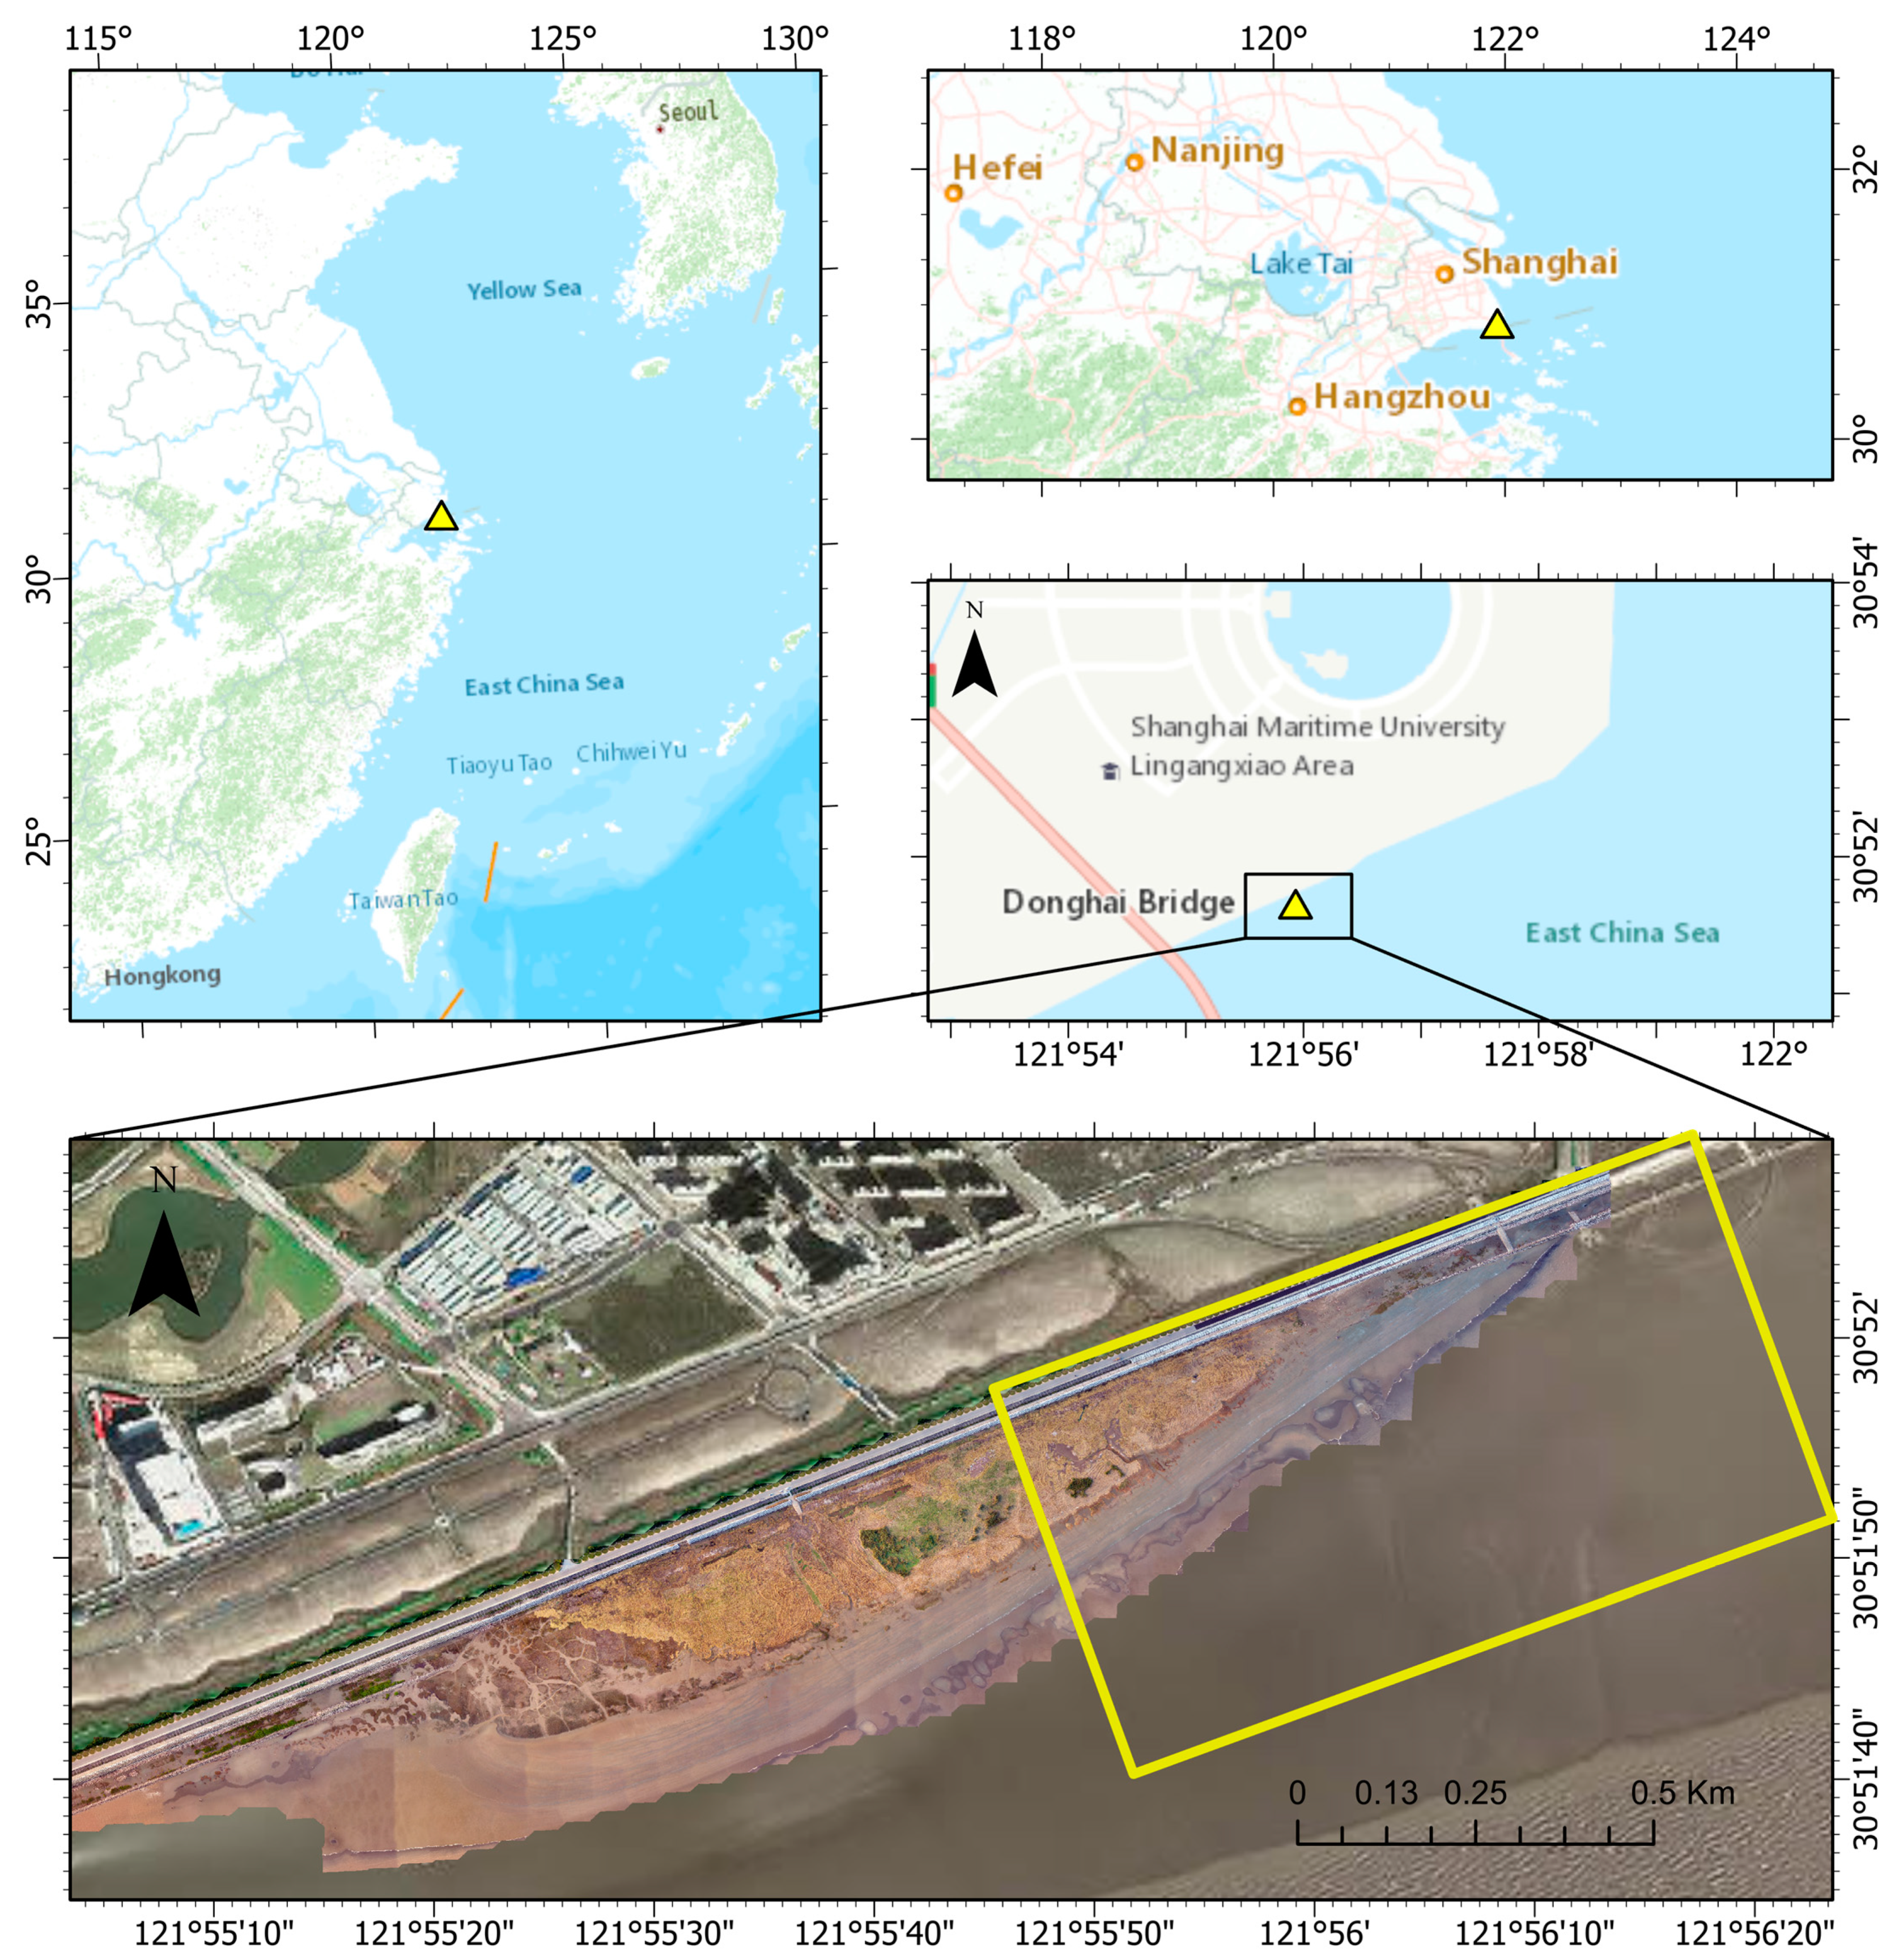
The study area, Lingang tidal flat (LGTF), is located on the south coast of the Shanghai Lingang New Area, which is situated at the intersection of the Changjiang River Estuary and Hangzhou Bay. Its exact location is shown in Figure 3. As of 21 November 2023, the tidal flat area measures approximately 2.54 km2, with an alongshore extent of around 4 km and a maximum offshore extent of approximately 1 km. The maximum extent of the tidal flat area was ~4 km2 based on the satellite image from 2018 [13]. The tide pattern follows a regular semi-diurnal cycle, featuring a tidal range of ~4.5 m during spring tide and ~2.8 m during neap tide. The Changjiang River’s maximum flood discharge is 92,600 m3/s, and the minimum low-flow discharge is 4620 m3/s. The multi-year average discharge is approximately 29,000 m3/s, with an annual runoff volume of 9 × 10¹¹ m3 [39]. The river runoff exhibits significant seasonal variations, with May to October considered the flood season, accounting for 71.7% of the annual runoff, and November to April of the following year being the dry season, contributing 28.3% of the annual runoff. The annual suspended sediment concentration averages 0.468 kg/m3, with a maximum sediment transport of 678 million tons (in 1964) and a minimum of 239 million tons (in 1994), averaging 433 million tons annually. Due to the large amount of suspended sediment from the Yangtze River and strong variable hydrodynamic conditions, a dynamic tidal flat and a supratidal zone with dense vegetation have been formed. The LGTF consists of a small portion of sandy beach (which might be submerged under extremely high tidal levels) and a large area of mudflats, with noticeable tidal channels between them. Both the intertidal topography and the positions of the tidal channel have been dynamically changing in recent years [13]. The existence and depth of tidal channels, along with the topographical distribution of the LGTF, have a substantial impact on the risk assessment.
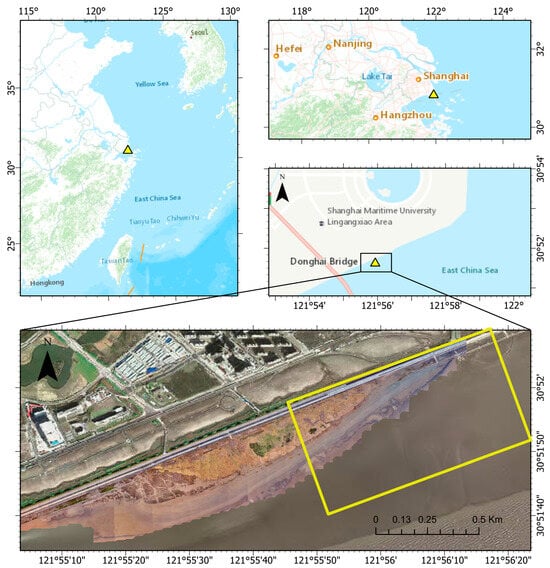
Figure 3.
Location of the study area. The yellow box in the bottom panel marks the main area in which the UAVs were used and the in situ topographies were monitored.
Shanghai is not typically renowned for coastal tourism [40]. However, with the reclamation of nearshore areas and the development of new zones along the adjacent coast, the mud-dominated LGTF has attracted numerous visitors in recent years. During the holiday period, there can be tens of thousands of people on the tidal flat. At the same time, safety assessment indicators and public service systems are severely lacking and lagging behind. Therefore, convenient, frequent, accurate, and secure monitoring of the LGFT’s topography is needed.
3. Methodology
3.1. UAVs for the Monitoring Coast
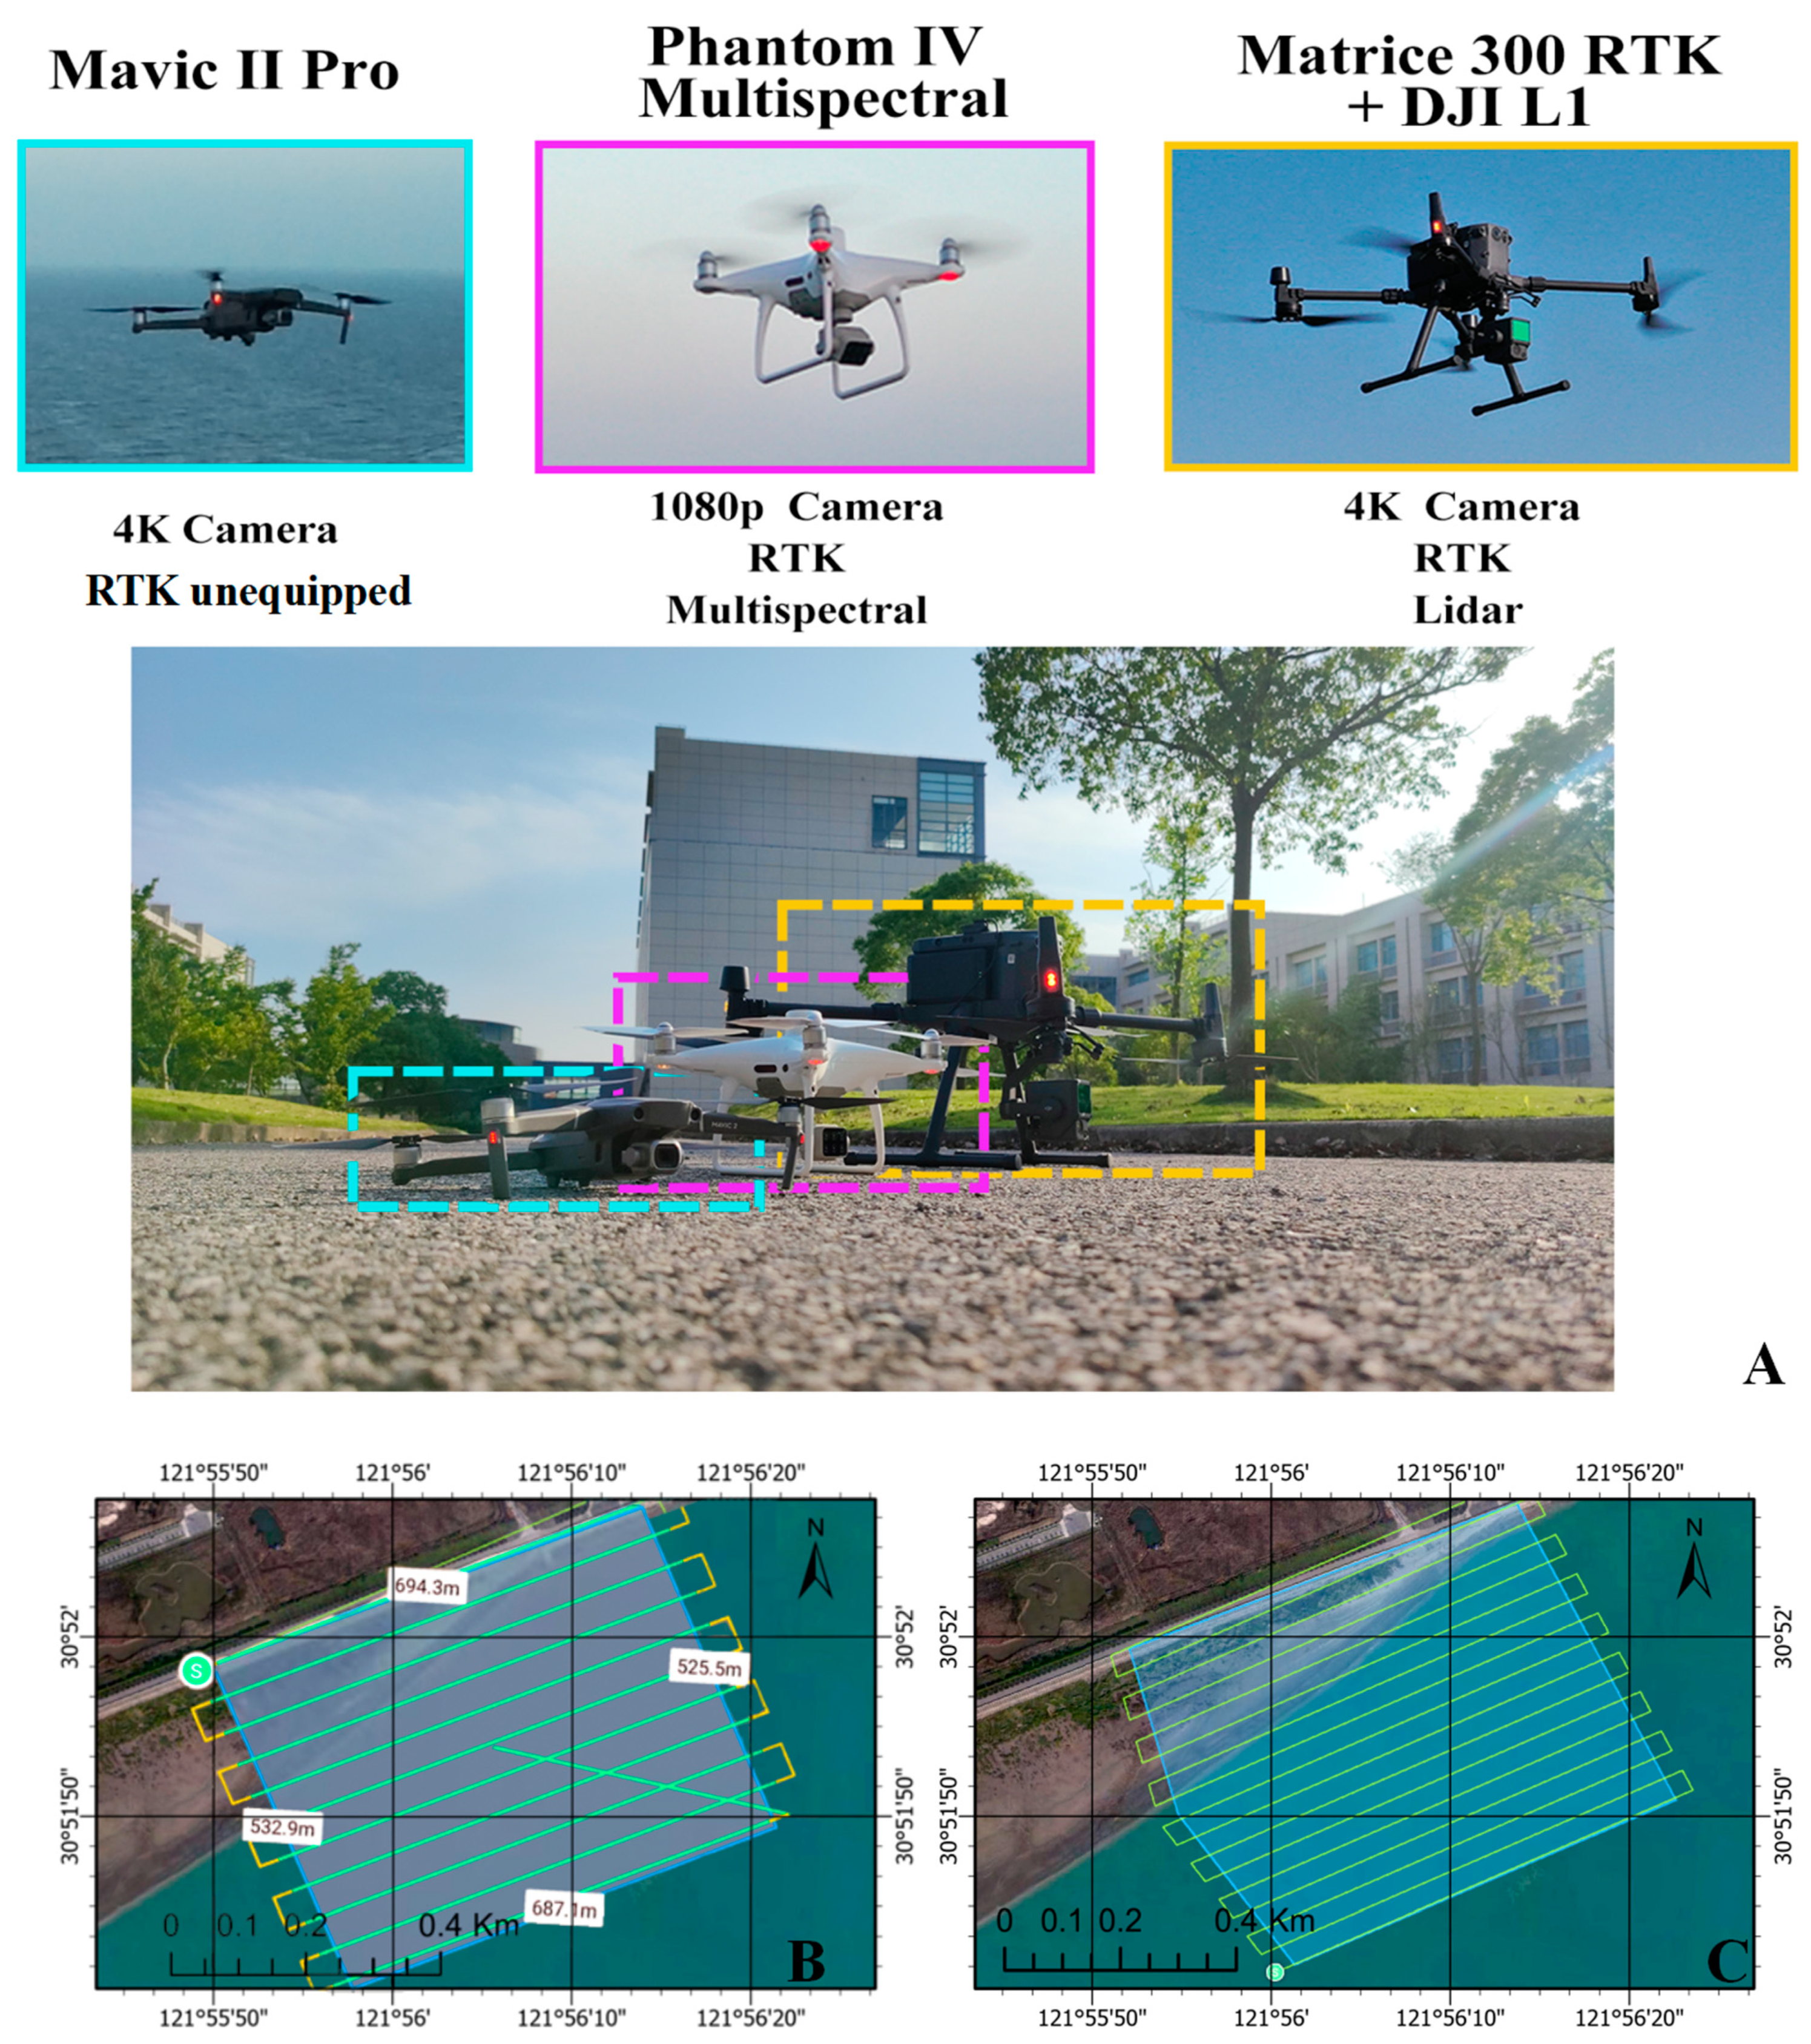
Considering the challenges associated with employing fixed-wing or self-assembled UAVs, such as their complexity and user-friendliness issues, we opted for quadcopter commercial integrated UAVs due to their widespread availability and ease of use in the market. We selected three UAVs, namely the DJI Phantom IV Multispectral, the DJI Mavic II Pro, and the DJI Matrice 300 RTK + DJI L1 LiDAR (DJI, Shenzhen, China). Utilizing the imagery captured by these three UAV platforms over the LGTF, we generated DSMs through point cloud data inversion. These DSMs were then compared to detailed ground measurements to assess their accuracy. After that, we performed an entire monitoring of the LGTF using M300-LiDAR, which has the highest scanning efficiency.
On 9 June 2022, data acquisition was conducted using the three UAVs. Due to the absence of image control points and the variations in flight parameters caused by manual control, DJI GS Pro software (https://www.dji.com/cn/ground-station-pro, accessed on 21 March 2024) was employed for flight path planning. Prior to the study, extensive test flights were performed for each system. Considering factors such as flight duration and image quality, a uniform flight altitude of 100 m was set for all UAVs, with both longitudinal and lateral overlap set at 60%. The flight route is depicted in Figure 4B,C.
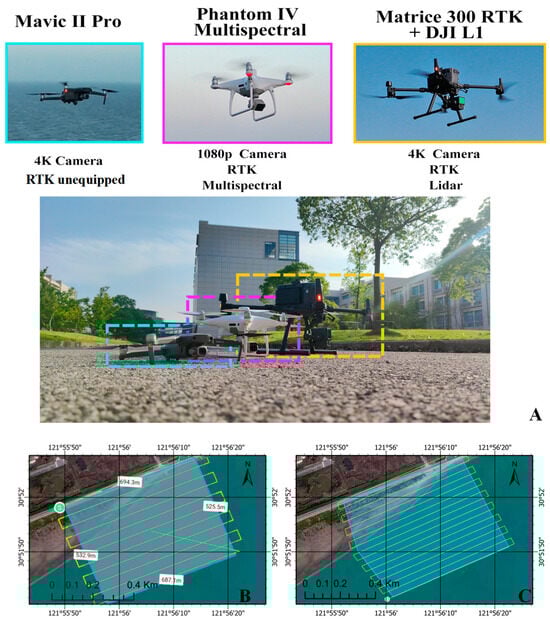
Figure 4.
(A) UAVs employed in this study; (B) the planned route of Matrice 300; (C) the planned routes of Phantom IV and Mavic II.
It is worth noting that, in light of potential edge errors in the DSM reconstructions caused by insufficient data collection, the flight path’s outer regions extended beyond the study area. Furthermore, in conjunction with the subsequent detailed survey area, the flight paths for both groups were optimized and adjusted to ensure that they overlapped more in areas with a higher density of images, thereby enhancing validation accuracy.
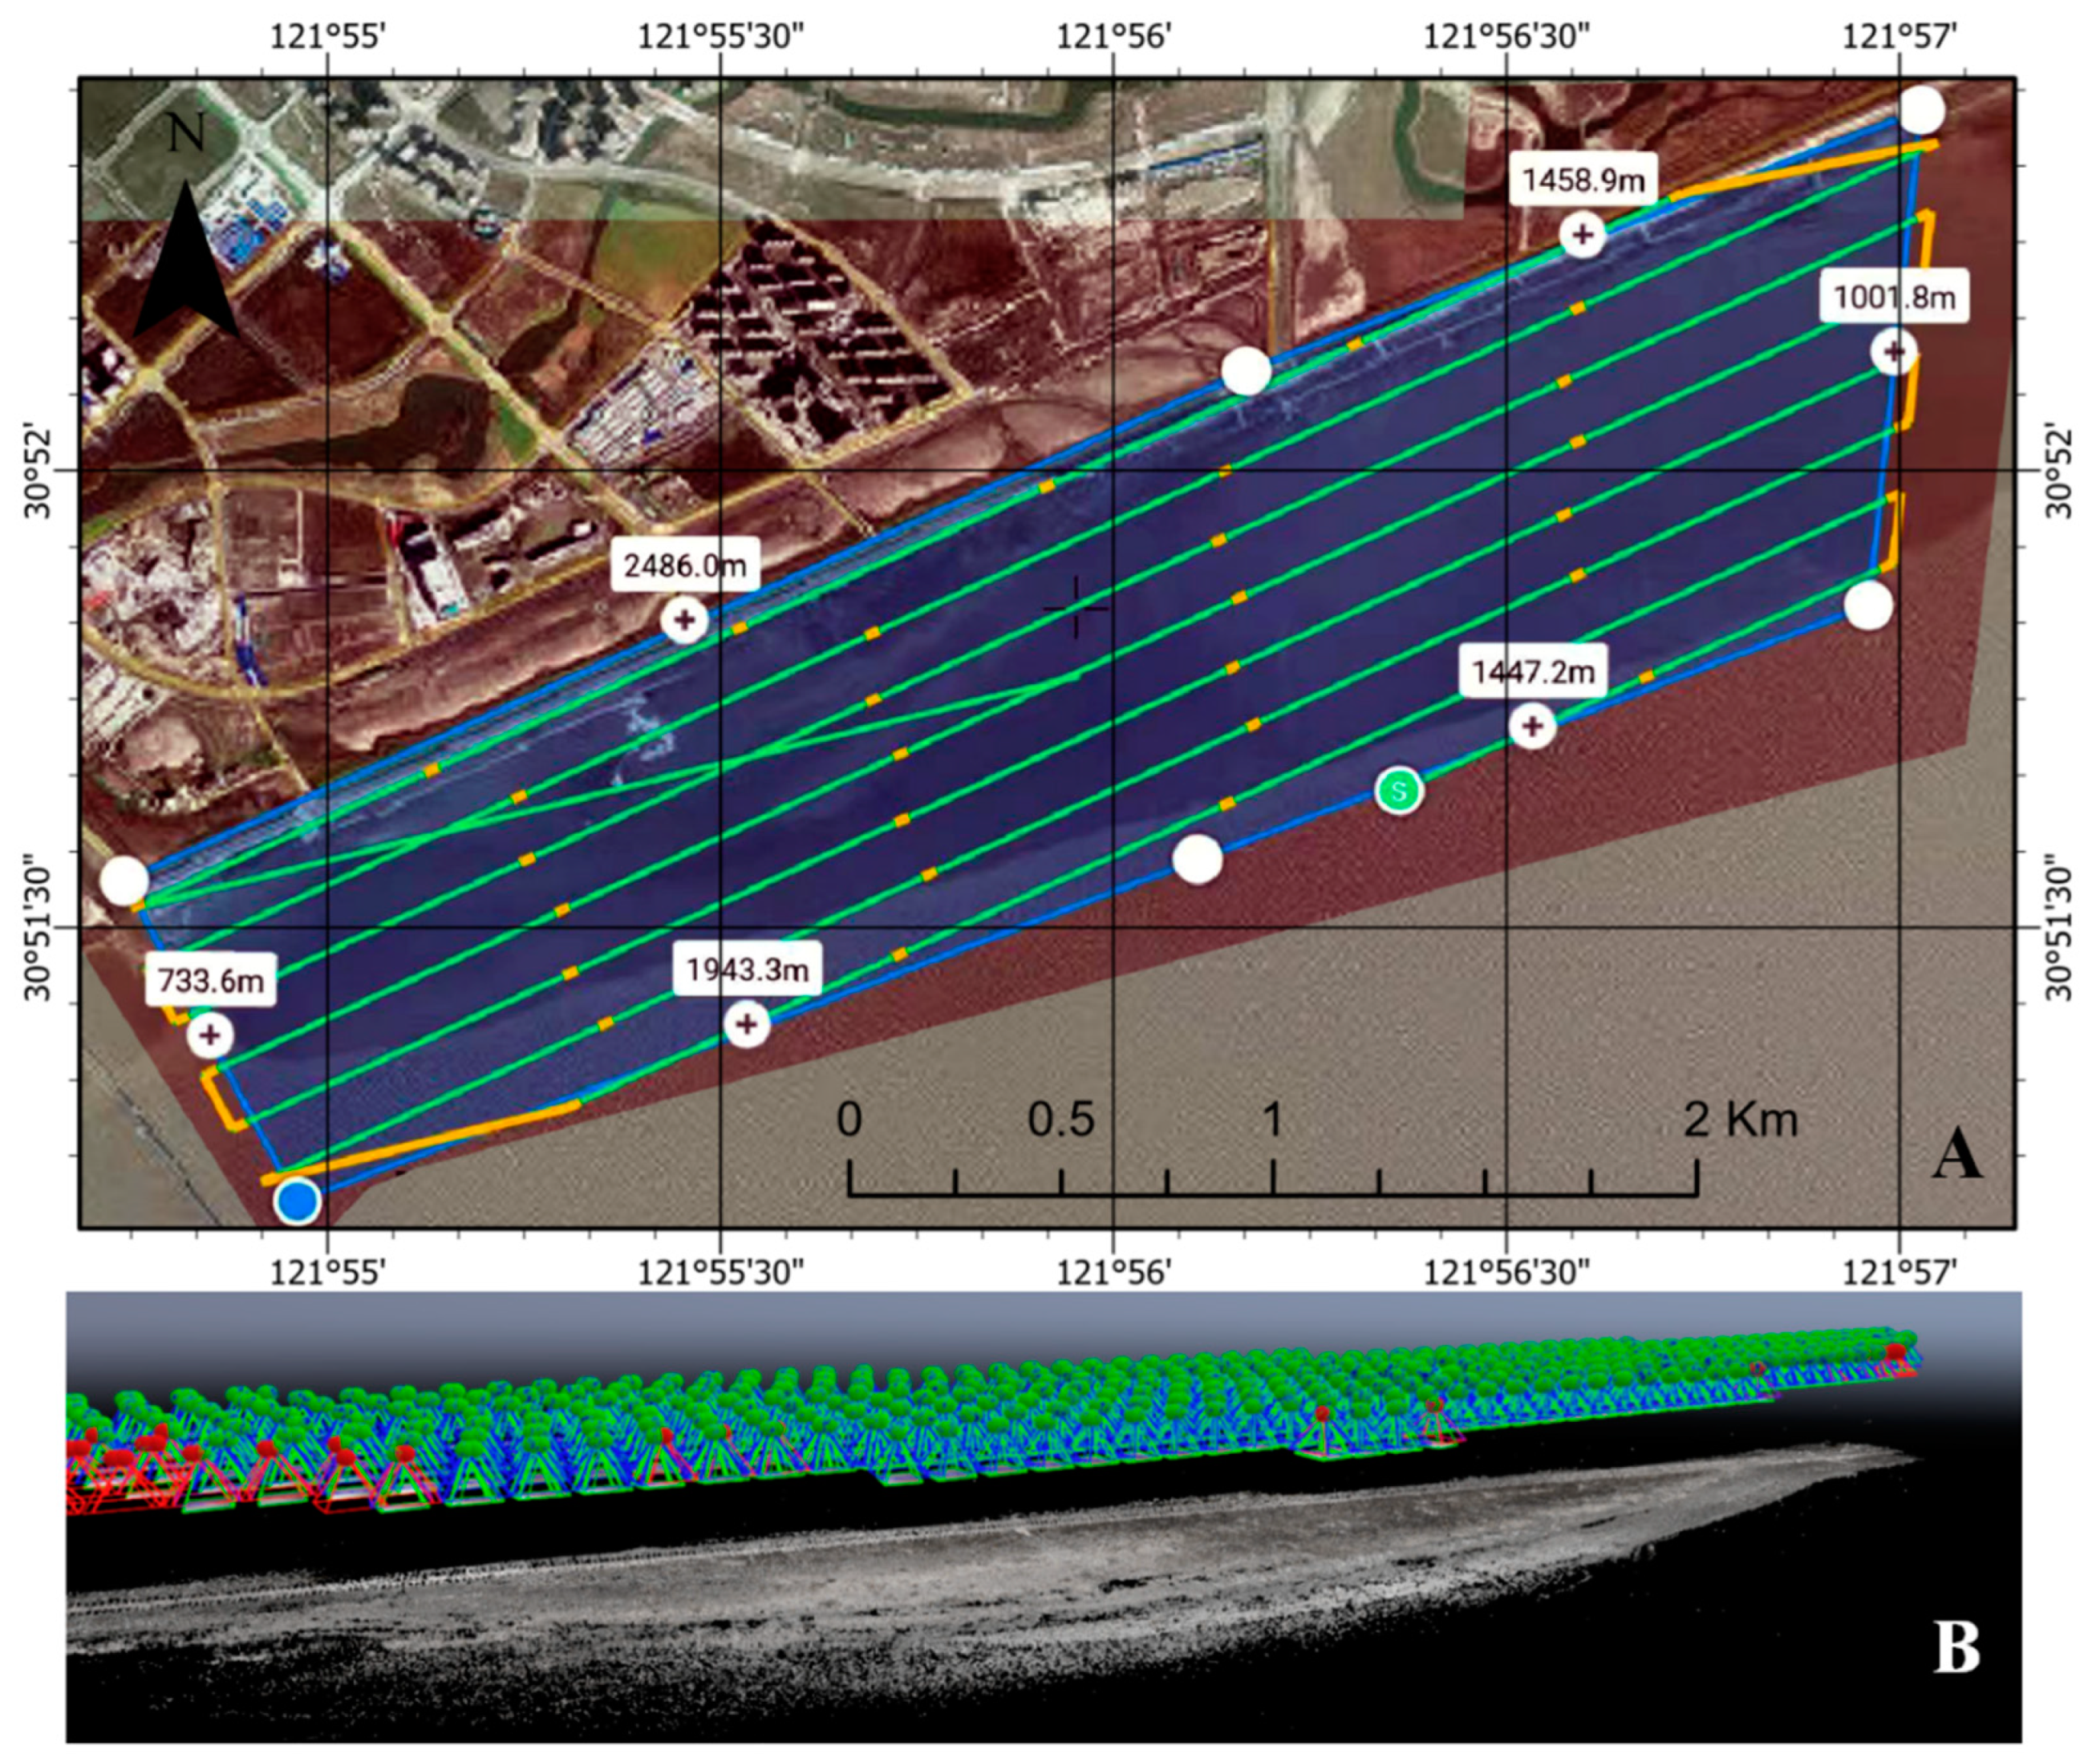
The entire tidal flat monitoring using M300-LiDAR was undertaken on 19 July 2023 (Figure 5) when the spring tide was at its lowest level. In this UAV-based survey, the UAV was configured with specific parameters to ensure optimal data collection. The flight was conducted at an altitude of 100 m above the study area, allowing for a comprehensive aerial perspective. The UAV maintained a consistent speed of 5 km/h, ensuring a controlled and efficient survey process. To capture detailed information, data sampling occurred at regular intervals of 20 m along the flight path. This sampling strategy was implemented to enhance spatial resolution and provide a thorough representation of the targeted area. The entire survey mission had a duration of 40 min, during which the UAV systematically covered the designated region, facilitating a comprehensive and timely data acquisition process. These carefully defined settings were instrumental in achieving accurate, reliable, and timely results for the study. The observed data underwent processing using DJI Terra, an official software (https://enterprise.dji.com/cn/dji-terra, accessed on 21 March 2024) that employs photogrammetry and LiDAR technologies to generate 2D and 3D maps of diverse environments.
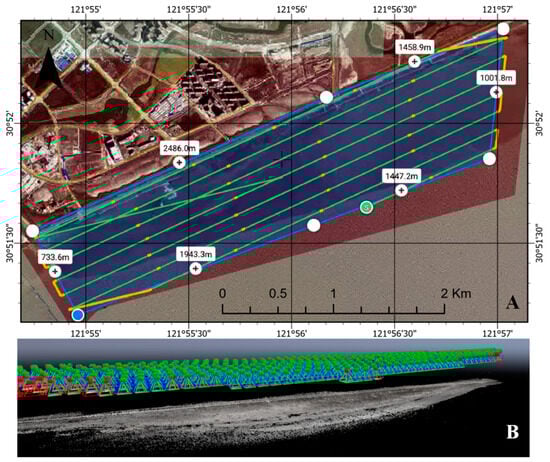
Figure 5.
(A) the planned route of Matrice 300 in full scanning of the LGTF (B)the camera points and point clouds of the LGTF.
3.2. In Situ Topography Survey
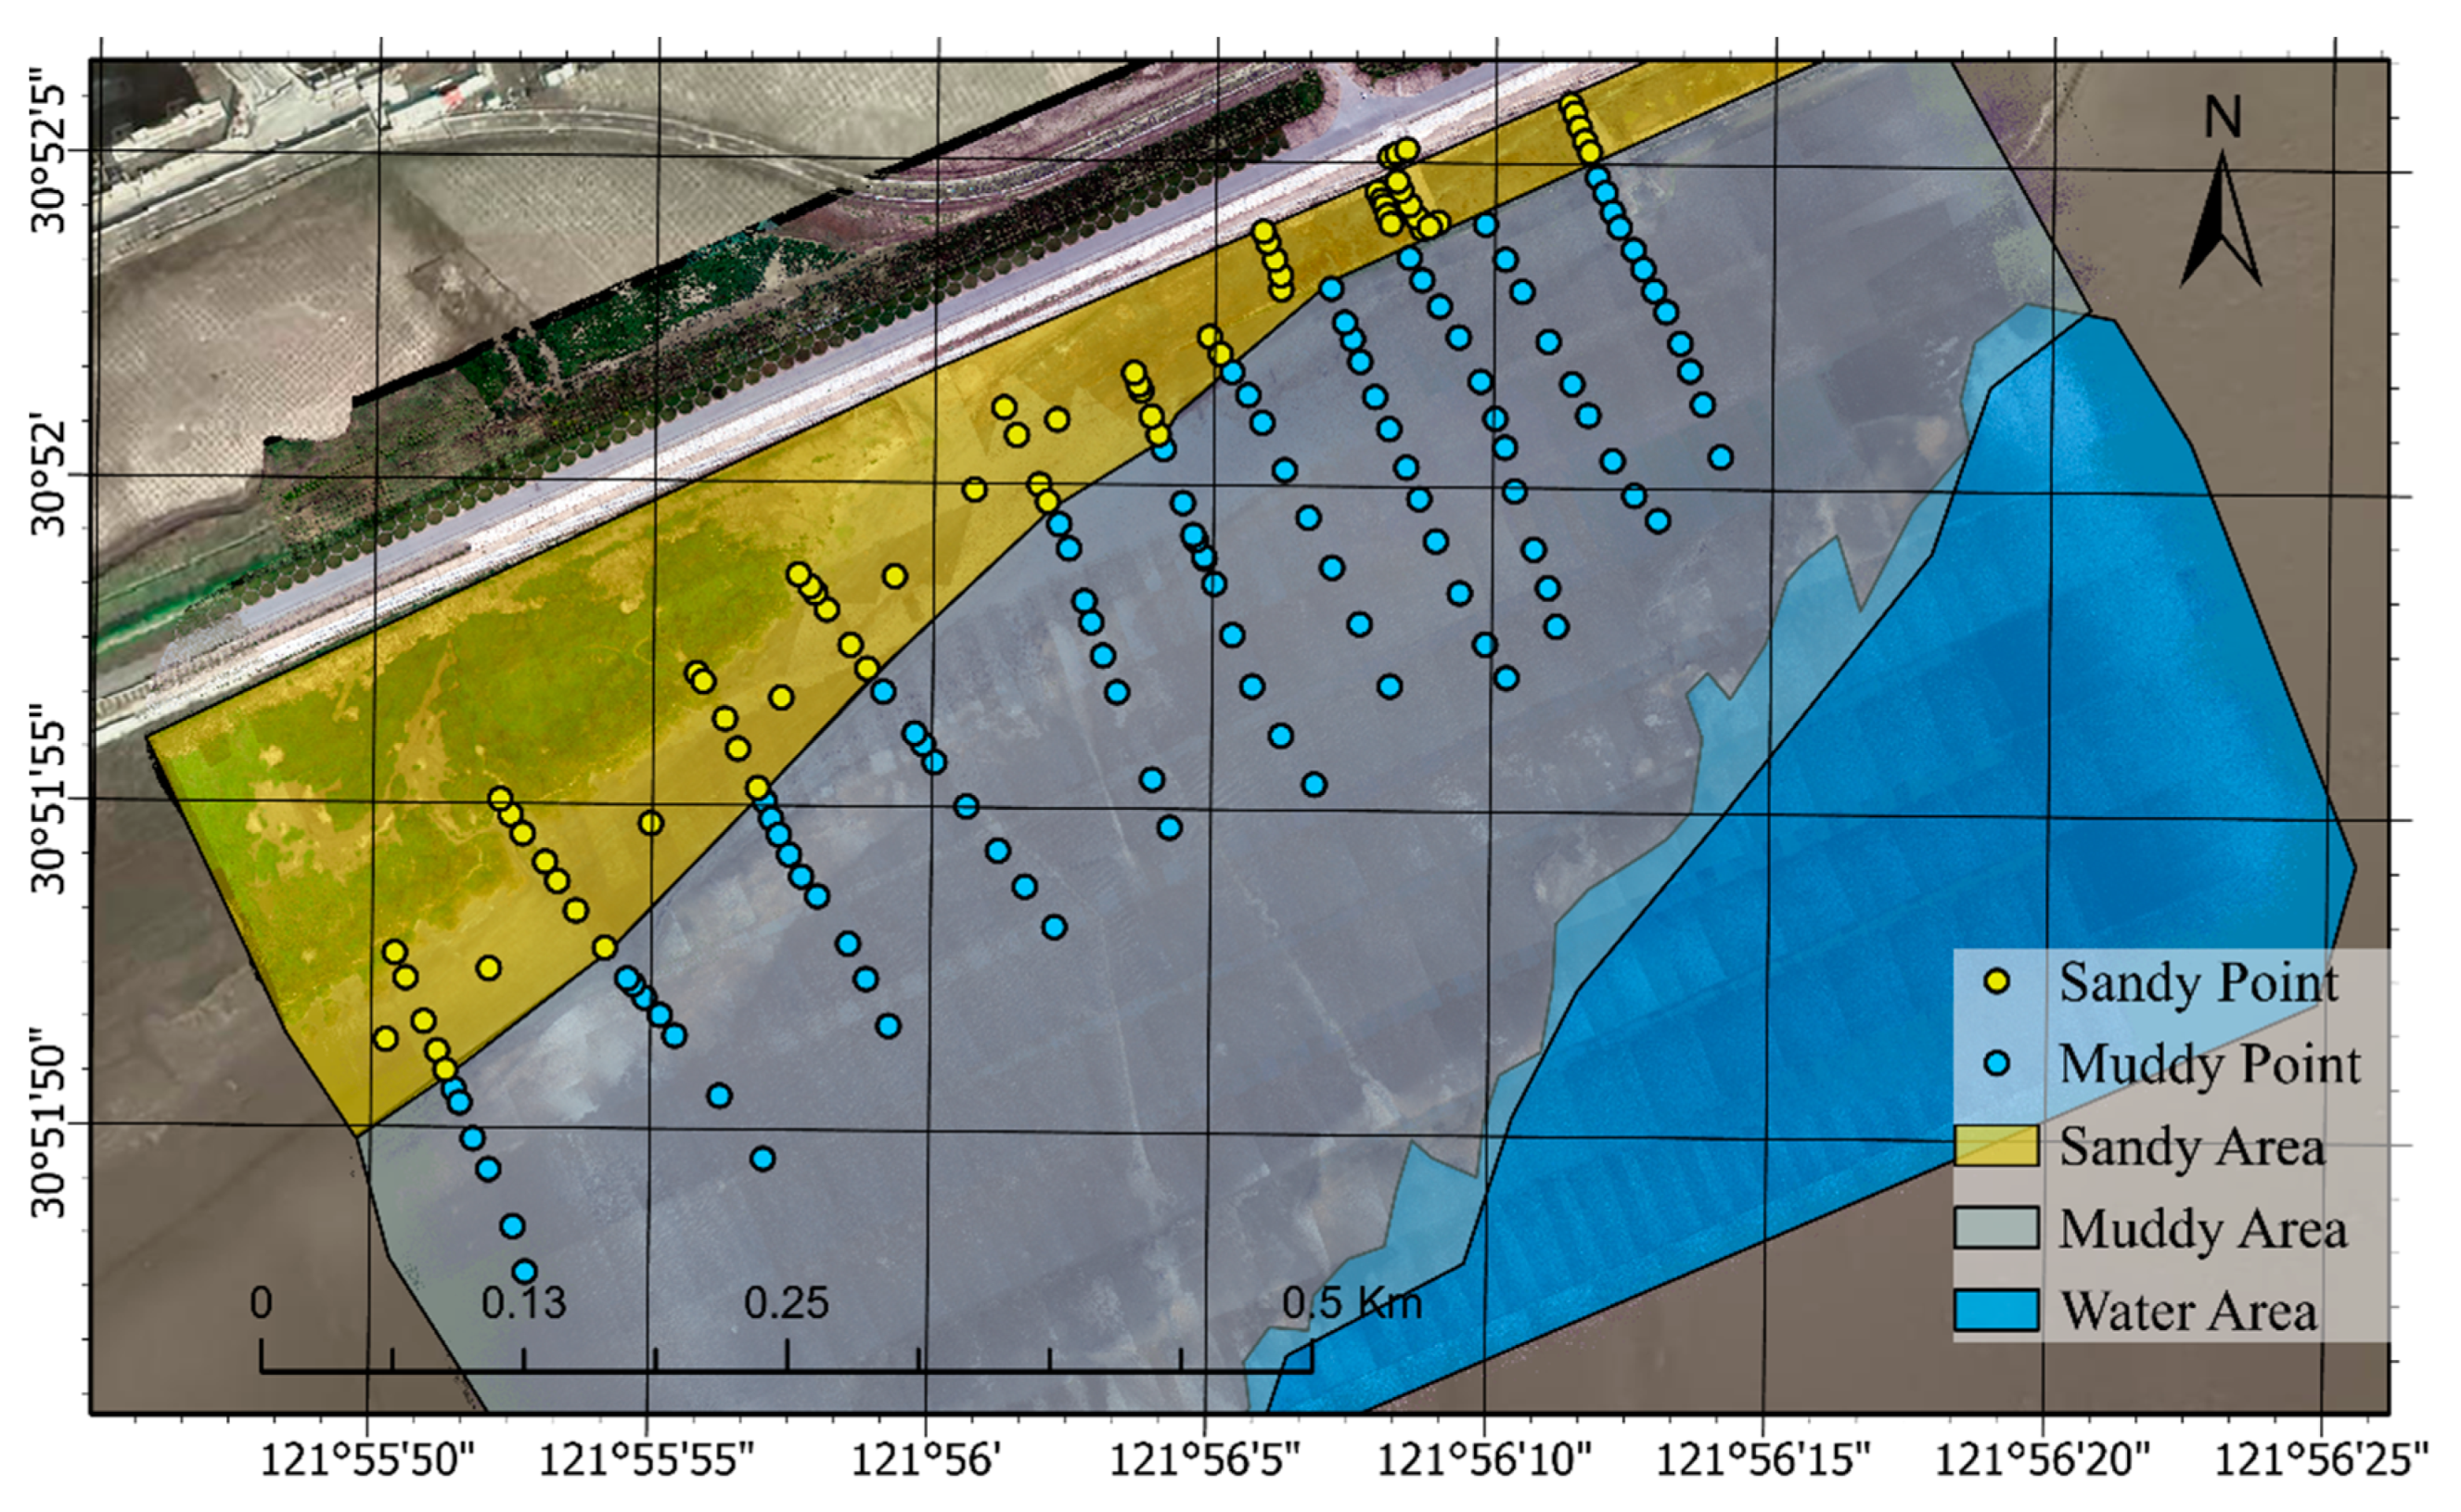
To compare the accuracy of various UAV monitoring systems, ground-based RTK measurements were conducted simultaneously with UAV monitoring. During manual measurements, there can be variations in measurement points between different tasks. To mitigate this, feature points were carefully selected based on the embankment’s design. A total of 11 measurement sections perpendicular to the shoreline were established, resulting in 166 measurement points. This arrangement was designed to minimize deviations in measurement points between tasks. The positions of these measurement points are illustrated in Figure 6.
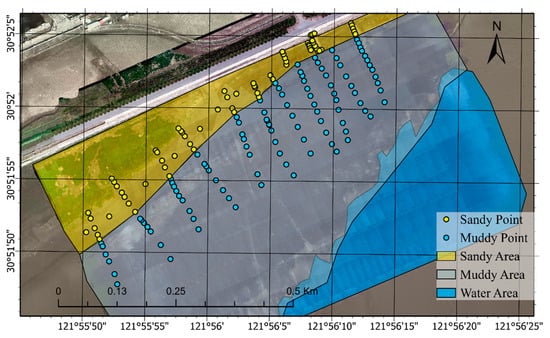
Figure 6.
Measurement points of the detailed survey and classification of the measurement areas.
A specific location on the embankment’s cement surface was selected as the reference point, which was utilized to calibrate the DSM data gathered by the UAVs. In the same coordinate system, assuming that the longitude, latitude, and altitude of each actual measurement point are x, y, and z, respectively. Using the x and y values of the actual measurement points as marker points on the DSM of the UAV reconstruction, and after obtaining the z’ value of the corresponding position, analyzing the statistical law of z’ and z, we are able to analyze the terrain reconstruction capability of the UAVs of different systems. Root mean square error, mean absolute error, and correlation (COR) were employed to evaluate the performance of each UAV.
RMSE (Root Mean Square Error): The square root of the average of the squared differences between the two; the smaller the RMSE, the more the reconstructed DSM matches the real data.
MAE (Mean Absolute Error): The average of the absolute error between the reconstructed and measured values; the smaller the MAE, the more stable the reconstruction error of the DSM.
COR: A statistical indicator of the degree of linear correlation between reconstructed and measured values; the smaller the COR, the higher the overall accuracy of the DSM.
The formulas are as follows:
as noted above, is the altitude of each constructed data point, is the altitude of each measured data point, and is the number of data points. cov means covariance, and σ represents the standard deviation.
The study area was further divided into sandy, muddy, and water areas based on the images obtained by the UAVs. Points collected within these zones were classified into two groups: sandy and muddy. This classification aimed to evaluate how coastal geological characteristics impact the precision of the DSMs. By analyzing data from these distinct geological contexts, we can better understand the variability in DSM accuracy, attributing discrepancies to the specific geophysical properties of each area.
3.3. Ocean Models for Calculating Tidal Level
The ocean model used in this study is Ecom-si [41,42], which has undergone extensive calibrations in prior studies [42,43,44]. The mesh domain encompasses the Changjiang River Estuary and Hangzhou Bay, with a resolution of 150 m in the vicinity of the study area. In this study, our primary dynamic factor from ocean focus lies on the tidal level, which is predominantly influenced by the propagation of tides from the ocean, river runoff from upstream, and wind-induced coastal circulation. The open sea boundary consisted of the tidal harmonic constants of 15 constituents (M2, S2, N2, K2, K1, O1, P1, Q1, MF, MM, MN4, M4, MS4, S1, and 2N2) obtained from the TPXO9 database (https://www.tpxo.net/global/tpxo9-atlas, accessed on 21 March 2024). The wind condition is sourced from the European Centre for Medium-Range Weather Forecasts (ECMWF), a widely used dataset. The river boundary condition was defined as volume flux based on data measured at the Datong hydrological station in the upstream area of Changjiang River. The model mesh is shown in Figure 7.
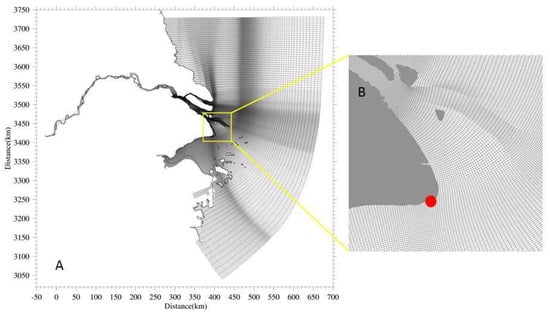
Figure 7.
(A) The mesh employed in Ecom-si; (B) an enlarged view of the mesh in proximity to the LGTF; the red dot marks the position of the LGTF.
Due to the limited size of the LGTF, we only used the tidal level data from the model at the lower edge of the LGTF to propel the driving of the coastal digital twin.
3.4. 3D Engines for Driving the Digital Twin
Unity 3D (U3D) (https://unity.com/, accessed on 21 March 2024) and Unreal Engine (UE) (https://www.unrealengine.com/, accessed on 21 March 2024) are the two most popular game engines, serving as software platforms that allow developers to create and simulate 2D and 3D games and applications. U3D is known for its user-friendly design, moderate learning curve, and support for indie developers, whereas UE is renowned for its cutting-edge graphics and suitability for high-fidelity projects [45,46]. In this study, we used UE, for example, to create the digital twin of the LGTF.
The illustration of how to build the digital twin model of the LGTF is depicted in Figure 8. The UAV-based 3D maps and tidal levels derived from the ocean model are the inputs. Based on the previous understanding of this dynamically changing area [13], the topography could be monitored once every half a month during the lowest tide of spring tide. The tidal levels could cover the past and future periods around the current timestamp. Regarding historical tidal data, the model can be driven by the reanalyzed wind data from the ECMWF and river discharge information from the Datong hydrological station. For future tidal data, the model can obtain forecasted wind data from the ECMWF and predict river discharge through linear interpolation. This digital twin primarily serves to analyze past risks, visualize real-time conditions, and forecast potential risks within a specific timeframe.
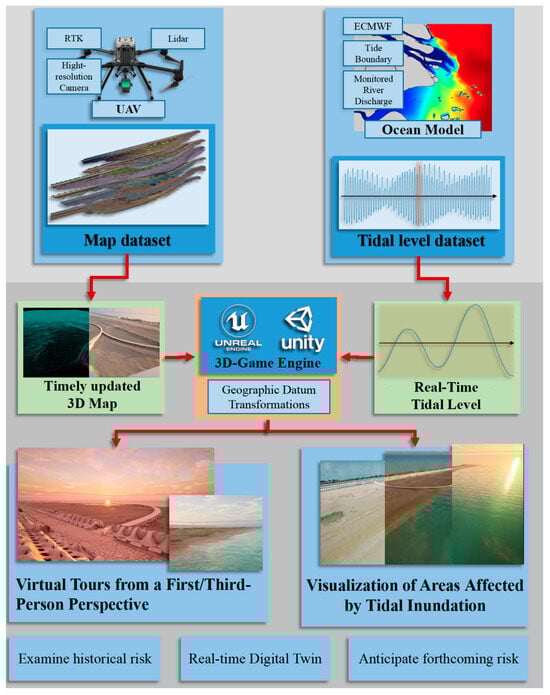
Figure 8.
The framework of the LGTF digital twin.
4. Results
4.1. UAVs’ Performance for Monitoring the Coast
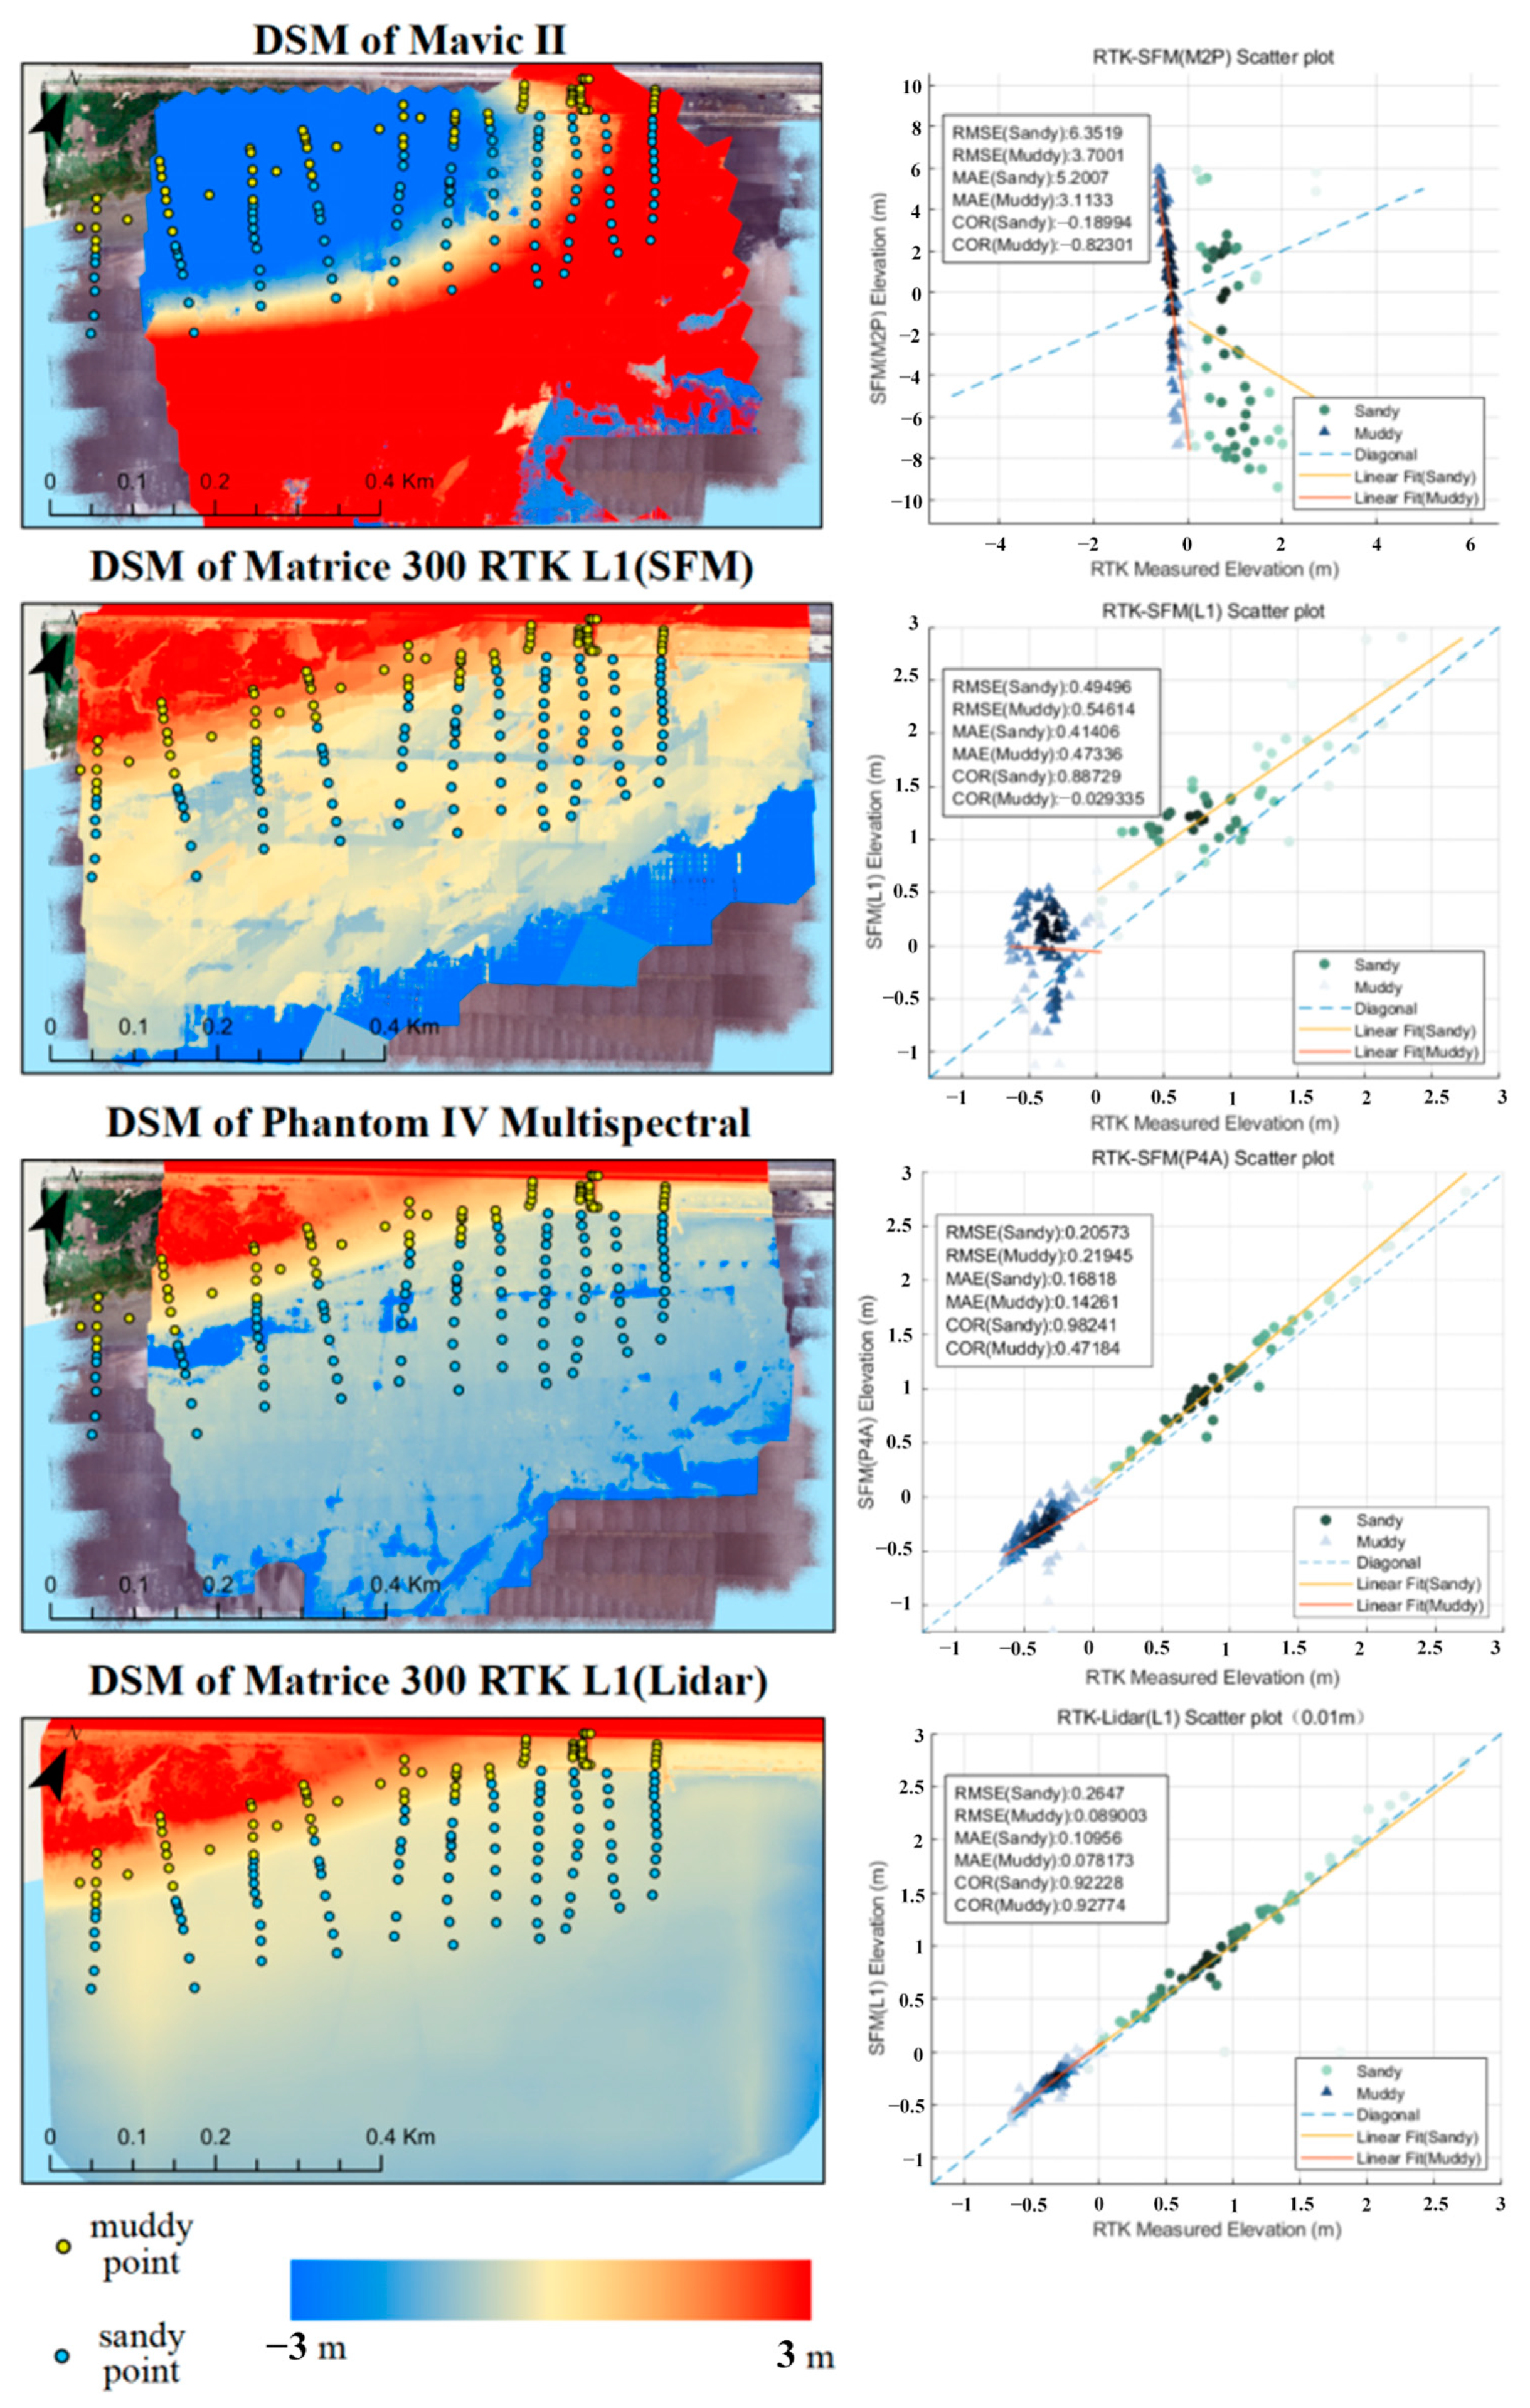
Figure 9 and Table 1 illustrates the digital surface models (DSMs) of the Matrice 300 RTK LiDAR, Matrice 300 RTK Camera, Phantom IV Advanced Multispectral, and Mavic II Pro. The data were corrected relative to the reference point, and a scatter plot was included. It is crucial to note that, given the Mavic II Pro’s lack of an RTK positioning function, the DSM was manually adjusted to align the feature point in the image with the reference point.
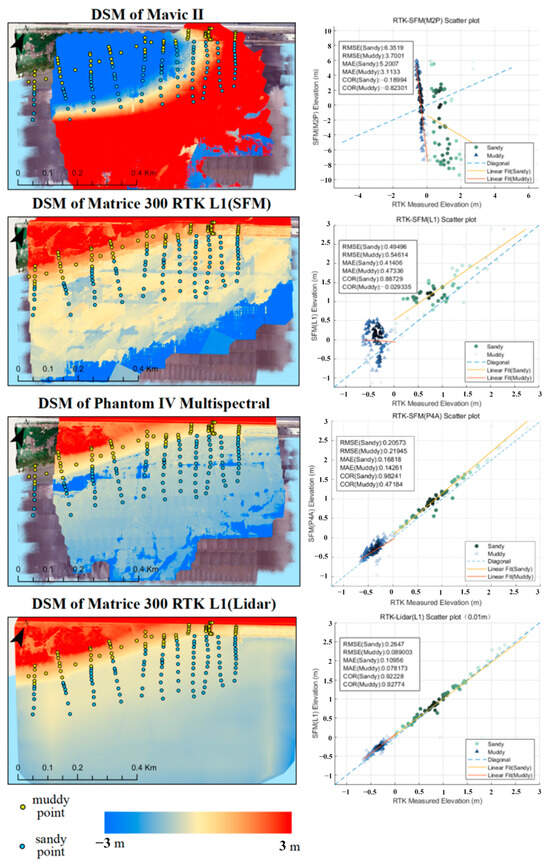
Figure 9.
DSMs derived from each UAV monitoring stage (left panels) and comparisons of the extracted and measured topography data (right panels). The unit of RMSE and MAE is m. The dashed line represents the 1:1 line.

Table 1.
The effectiveness of each UAV in monitoring coastal topography, assessed through RMSE, MAE, and COR.
As indicated by the results, the accuracy of the DSM generated by LiDAR was the highest, exhibiting the best fit and lowest errors for both sandy and muddy areas. Under the same conditions, the accuracy of the DSM generated using the SFM method was slightly lower in muddy areas compared to sandy areas. This discrepancy may be attributed to sunlight reflections on the water puddles covering the surface of the muddy beach, whereas SFM depends on ambient light and is weak in water reconstruction. Additionally, the lack of prominent ground objects in the intertidal zone’s muddy beach for feature point extraction with the SFM method further contributed to speckle errors in the DSMs generated by the Matrice 300 RTK and Phantom IV Multispectral. The performance of the Mavic II Pro without an RTK system raised concerns, especially in scenes with high precision requirements. Our observations indicate that the DSM boundaries exhibited higher errors.
Figure 10 shows the terrain model reconstructed by M300RTK after acquiring the point cloud by LiDAR and assigning colors by the visible photos. Compared to SFM, LiDAR’s active detection feature allows the model to have more accurate feature points, which is more advantageous in scenarios with high model accuracy requirements.

Figure 10.
(A,B): different perspectives showcasing the detailed 3D model of the LGTF; (C) the topography of the LGTF generated through LiDAR data. The elevation is based on the mean sea level.
4.2. Accuracy of Tide Levels
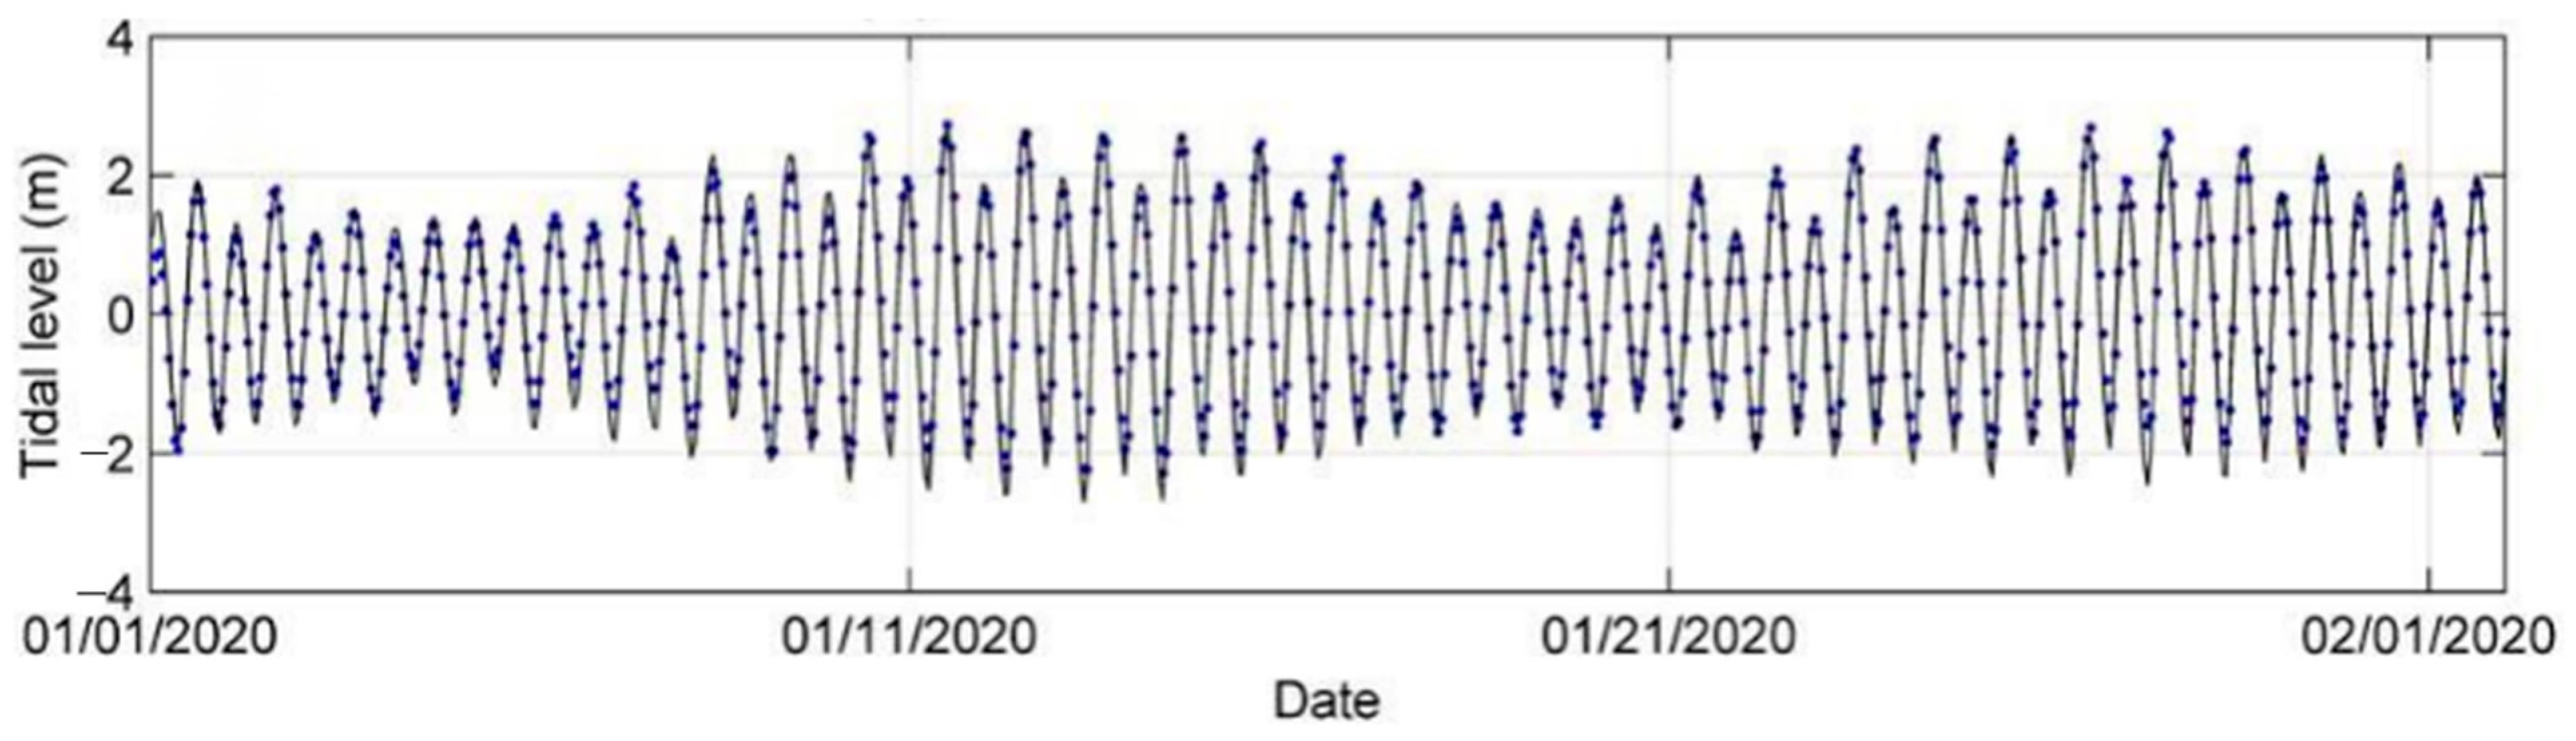
Figure 11 illustrates the outcomes of elevation validation, where the observed elevation at the hydrological station exhibited a noticeable semi-diurnal tide type with significant variations between spring and neap tides. The comparison demonstrates the model’s success in accurately simulating the elevation variation processes.
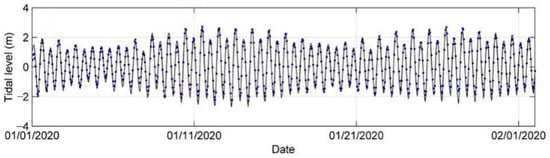
Figure 11.
Validation of tidal levels in January 2020, with tidal data sourced from the nearest tidal gauge. The solid line and blue dot represent modeled results and measured data, respectively.
4.3. Framework of the LGTF Digital Twin
After validating the accuracy of UAV-based topographic measurements of tidal flat and tidal water levels, we created a high-resolution 3D topography and a novel application for reconstructing realistic tidal flat using UAVs and ocean models.
The simulation developed for this study offers a sophisticated representation of real-time inundation, providing an immersive and highly detailed exploration of the tidal flat with advanced multi-degree-of-freedom and multi-perspective features. This cutting-edge simulation goes beyond conventional visualizations, offering an exceptionally realistic display that can be dynamically experienced by users.
Figure 12 presents a series of stages depicting a scenario where an individual is positioned within the tidal channel. The simulation illustrates the rising tidal level, reaching the height of an adult’s waist during high tide. This process takes approximately 70 min and is extremely dangerous in the real world. However, it can be quickly simulated in the above framework with guaranteed realism and reliability. This simulation’s precision level serves as a valuable tool for tourists and coastal managers, facilitating a comprehensive understanding of potential risks within the LGTF.
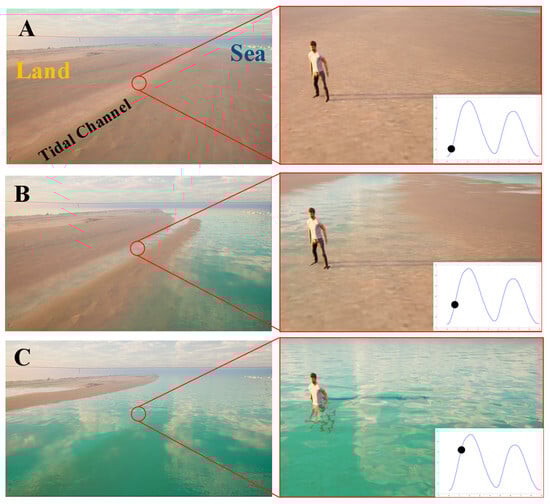
Figure 12.
The simulated progression depicts the tidal level rising while an individual stands in the tidal channel. (A–C) represent moments ranging from the low tidal level to the high tidal level.
The real-time inundation feature enables users to witness and interact with the dynamic changes in water levels, offering a multi-dimensional perspective that enhances situational awareness. This immersive experience aids in the recognition of potential hazards, allowing tourists to make informed decisions about their activities on the tidal flat. Simultaneously, coastal managers can utilize the simulation to develop effective risk mitigation strategies, ensuring the safety of individuals within the LGTF environment.
5. Discussions
The exploration of the rapidly evolving tidal flat in Shanghai serves as a poignant illustration of the multifaceted nature of coastal topography, bringing to light the intricate dynamics and the urgent need for innovative monitoring and assessment strategies. This case study underscores the significance of employing advanced technological solutions to understand and manage the complexities inherent in such environments effectively.
The tidal flat’s rapid formation and constant change challenge traditional monitoring methods, necessitating a shift towards more agile, precise, and comprehensive approaches. UAV technology, especially when augmented with RTK and LiDAR sensors, emerges as a pivotal tool in this context. It enables the detailed mapping of coastal areas with good accuracy, allowing for a nuanced understanding of the morphological changes occurring over short periods. Such detailed data collection is instrumental in developing models that can predict future changes and identify potential risk areas before they pose a significant threat to ecosystems and human activities. Comparing the findings with previous studies, it is evident that while UAVs have been increasingly applied in coastal studies, the combined use of RTK and LiDAR for enhanced accuracy and detailed 3D terrain mapping represents a notable advancement. Previous works have demonstrated the utility of drones for monitoring beaches or tidal flats, yet often focused either on the UAV technology alone or the application of digital twins without deeply integrating UAV-derived data with ocean models for a comprehensive risk assessment. This study’s approach of leveraging a digital twin framework enriched with precise UAV data and well-performing ocean modeling techniques provides a more dynamic and interactive tool for understanding and managing coastal risks.
Moreover, the Shanghai case study highlights the broader implications for coastal management strategies worldwide. As coastal environments continue to face pressures from natural phenomena and human-induced changes, the demand for adaptive and forward-thinking management approaches becomes increasingly critical. The integration of UAV-derived data into digital twin frameworks exemplifies how technological innovation can enhance our capacity to visualize, understand, and interact with complex coastal systems. This integration not only supports the immediate needs of risk assessment and mitigation but also contributes to the long-term sustainability of coastal zones by providing a basis for informed decision-making and proactive management. In order to further illustrate the universality of the digital twin framework introduced in this paper, we will discuss the following aspects.
5.1. Implications of UAV Selection
The key prerequisite for conducting this work is to find efficient, accurate, and rapidly deployable UAV measurement technology. Professional-level UAV systems have undergone significant advancements, particularly with the integration of the RTK positioning system. This development has allowed for the production of a DSM with considerable accuracy, even without the use of GCPs. In the case of UAVs equipped with cameras, the DSM error obtained through traditional SFM methods ranged from 0.3–0.54 m. However, with the incorporation of the LiDAR module, the DSM error decreased to the 0.1 m level. The reconstruction of the DSM using the SFM method was affected by light spots formed in the original image due to sunlight reflecting off water puddles on the beach. This reflection had little impact on the DSM reconstruction using LiDAR data from the UAV. Through an evaluation of three different UAVs, we identified the optimal configuration featuring RTK and LiDAR technology, achieving a correlation coefficient of >90% when compared with in situ data, superior to UAVs carrying only RTK based on SFM technology.
Due to the relatively narrow scope covered in this research, a multirotor UAV equipped with RTK and LiDAR sensors and capable of flying for 45 min is an appropriate choice because of its less expensive cost and high resolution and accuracy. However, it is essential to note that if the study area expands significantly, for instance, reaching dimensions on the order of magnitude larger than the LGTF, the utilization of fixed-wing UAVs may become a necessity to effectively carry out monitoring operations over the extended geographical expanse. There is another limitation when utilizing drones for tidal flat monitoring and integrating them with digital twin applications. A UAV is capable of monitoring the tidal channel as the water in the tidal channels completely recedes after low tide, exposing the bottom of the channel. However, if the bottom of the channel is not exposed at the end of the ebb tide period, this method has certain limitations. Light-based LiDAR, as opposed to bathymetric LiDAR, lacks the capability to penetrate the existing water layers to reach the seabed, requiring further manual measurements to be taken at the tidal channel.
5.2. Potential for Expanding the Digital Twin Framework
Tidal flooding risk is the most typical type of risk in the LGTF. Since the ocean model can provide other hydrodynamic and environmental factors, such as wave parameters and water quality, in the future, the digital twin system could incorporate variables such as tidal flat substrates, weather conditions, swashing waves, rip currents, seawater salinity, temperature, and quality. The digital twin framework offers versatile deployment options and can be extended to various platforms, including mobile phones and virtual reality (VR) glasses [47]. This adaptability allows users to experience the digital twin environment seamlessly on handheld devices such as smartphones or immerse themselves in a more immersive setting using VR glasses. Accessibility across different platforms enhances the flexibility and reach of the digital twin, catering to a diverse range of users and preferences.
5.3. Contribution to Coastal Management
The digital twin allows for the creation of dynamic simulations, enabling coastal managers to explore various scenarios. Decision makers can assess the potential impact of different factors, such as extreme weather events, sea-level rise, or human activities, on the coastal environment. The digital twin framework also significantly enhances data-driven decision-making in coastal management by harnessing comprehensive information, thus ensuring that management decisions are not only grounded but also optimized through accurate and current data. Leveraging advanced Artificial Intelligence (AI) techniques, the digital twin goes beyond static data representation, introducing predictive capabilities. For instance, AI algorithms can simulate scenarios on the tidal flat by virtually placing numerous individuals, allowing for the prediction of potential risks. This dynamic approach provides decision makers with foresight into various situations, enabling them to proactively address emerging challenges and implement adaptive strategies for enhanced coastal safety and resilience. Through the integration of AI, the digital twin becomes a proactive tool that not only analyzes historical and real-time data but also anticipates and models future scenarios, contributing to a more forward-thinking and responsive approach to coastal risk management. This concept is our ongoing work to quantify the risk coefficient rapidly.
6. Conclusions
In this study, we have highlighted the critical role of integrating digital twin frameworks with UAVs and ocean modeling techniques to revolutionize coastal risk management and recognition. Focused on a rapidly evolving tidal flat in Shanghai, our research underscores the necessity for innovative monitoring and assessment methods due to the complex coastal topography.
Our investigation emphasizes the importance of selecting effective, accurate, and swiftly deployable UAV measurement technologies for coastal management. Professional UAV systems, particularly those equipped with RTK and LiDAR sensors, have demonstrated significant advancements, enabling the creation of highly accurate DSMs even in the absence of ground control points. Our comparative analysis of three different UAV configurations revealed that the combination of RTK and LiDAR not only provides the highest DSM accuracy but also integrates seamlessly into the digital twin framework for efficient 3D mapping of coastal terrain.
The digital twin framework, enhanced by UAV-derived data and a precise numerical ocean model, proves to be a dynamic tool for real-time risk recognition. It facilitates immersive and interactive visualizations of complex coastal data, thus promoting community awareness and engagement.
Our research contributes to advancing coastal monitoring, risk assessment, and management strategies. It lays the groundwork for employing cutting-edge technologies to ensure the sustainability and resilience of coastal communities against evolving environmental pressures. This work not only paves the way for future technological advancements in coastal management but also underscores the importance of predictive and proactive strategies in safeguarding coastal ecosystems.
Author Contributions
Conceptualization, R.Y.; investigation, H.Z.; data curation, R.X.; methodology, R.X. and H.Z.; validation, R.X. and L.Z.; writing—original draft preparation, R.X. and H.Z.; writing—review and editing, R.X. and L.Z. All authors have read and agreed to the published version of the manuscript.
Funding
This research was funded by the National Natural Science Foundation of China (42306190), the Shanghai Municipal Oceanic Bureau (hhk202004), the Science and Technology Commission of Shanghai Municipality (Grant No. 22692193900), and the Shanghai Frontiers Science Center of ‘Full Penetration’ Far-Reaching Offshore Ocean Energy and Power (founded by the Shanghai Municipal Commission of Education).
Data Availability Statement
The data used in this paper can be provided by Rui Yuan (yuanrui@shmtu.edu.cn) upon request.
Conflicts of Interest
The authors declare no conflicts of interest.
References
- Gormsen, E. The impact of tourism on coastal areas. GeoJournal 1997, 42, 39–54. [Google Scholar] [CrossRef]
- Kron, W. Coasts: The high-risk areas of the world. Nat. Hazards 2013, 66, 1363–1382. [Google Scholar] [CrossRef]
- Loizou, E.; Chatzitheodoridis, F.; Polymeros, K.; Michailidis, A.; Mattas, K. Sustainable development of rural coastal areas: Impacts of a new fisheries policy. Land Use Policy 2014, 38, 41–47. [Google Scholar] [CrossRef]
- Riera, R.; Menci, C.; Sanabria-Fernández, J.A.; Becerro, M.A. Do recreational activities affect coastal biodiversity? Estuar. Coast. Shelf Sci. 2016, 178, 129–136. [Google Scholar] [CrossRef]
- Luijendijk, A.; Hagenaars, G.; Ranasinghe, R.; Baart, F.; Donchyts, G.; Aarninkhof, S. The state of the world’s beaches. Sci. Rep. 2018, 8, 6641. [Google Scholar] [CrossRef] [PubMed]
- Dean, R.G.; Houston, J.R. Determining shoreline response to sea level rise. Coast. Eng. 2016, 114, 1–8. [Google Scholar] [CrossRef]
- Toimil, A.; Losada, I.J.; Nicholls, R.J.; Dalrymple, R.A.; Stive, M.J. Addressing the challenges of climate change risks and adaptation in coastal areas: A review. Coast. Eng. 2020, 156, 103611. [Google Scholar] [CrossRef]
- Murray, N.J.; Phinn, S.R.; DeWitt, M.; Ferrari, R.; Johnston, R.; Lyons, M.B.; Clinton, N.; Thau, D.; Fuller, R.A. The global distribution and trajectory of tidal flats. Nature 2019, 565, 222–225. [Google Scholar] [CrossRef]
- Le Hir, P.; Roberts, W.; Cazaillet, O.; Christie, M.; Bassoullet, P.; Bacher, C. Characterization of intertidal flat hydrodynamics. Cont. Shelf Res. 2000, 20, 1433–1459. [Google Scholar] [CrossRef]
- Kearney, W.S.; Fagherazzi, S. Salt marsh vegetation promotes efficient tidal channel networks. Nat. Commun. 2016, 7, 12287. [Google Scholar] [CrossRef]
- Fan, X.; Zhang, L.; Yuan, L.; Guo, B.; Zhang, Q.; Wang, Y.; Wu, Q. Loss of tidal creek ecosystem vitality caused by tidal flat narrowing on the central Jiangsu coast, China. Sci. Total Environ. 2023, 864, 161216. [Google Scholar] [CrossRef]
- Kim, D.J. Measurement of tidal flat topography using long-baseline InSAR. In Proceedings of the 2019 6th Asia-Pacific Conference on Synthetic Aperture Radar (APSAR), Xiamen, China, 26–29 November 2019; IEEE: Piscataway, NJ, USA, 2019; pp. 1–4. [Google Scholar]
- Yuan, R.; Zhang, H.; Qiu, C.; Wang, Y.; Guo, X.; Wang, Y.; Chen, S. Mapping Morphodynamic Variabilities of a Meso-Tidal Flat in Shanghai Based on Satellite-Derived Data. Remote Sens. 2022, 14, 4123. [Google Scholar] [CrossRef]
- Cai, W. 4-Year-Old Girl Reported Missing on Beach. Available online: https://www.shine.cn/news/metro/2310068491/ (accessed on 15 January 2024).
- Zhu, Y. Body of Shanghai’s Missing 4-Year-Old Girl Found in Ningbo. Available online: https://www.shine.cn/news/metro/2310195799/ (accessed on 28 February 2024).
- Xinmin Evening News, Four People Trapped in the Rising Tide of Lingang Seawater! The Firefighter Swam Back with One Hand Holding the Baby. Available online: https://baijiahao.baidu.com/s?id=1640535837958387417&wfr=spider&for=pc (accessed on 28 February 2024).
- Chiang, K.W.; Tsai, G.J.; Li, Y.H.; El-Sheimy, N. Development of LiDAR-based UAV system for environment reconstruction. IEEE Geosci. Remote Sens. Lett. 2017, 14, 1790–1794. [Google Scholar] [CrossRef]
- Deng, L.; Mao, Z.; Li, X.; Hu, Z.; Duan, F.; Yan, Y. UAV-based multispectral remote sensing for precision agriculture: A comparison between different cameras. ISPRS J. Photogramm. Remote Sens. 2018, 146, 124–136. [Google Scholar] [CrossRef]
- Lin, Y.C.; Cheng, Y.T.; Zhou, T.; Ravi, R.; Hasheminasab, S.M.; Flatt, J.E.; Habib, A. Evaluation of UAV LiDAR for mapping coastal environments. Remote Sens. 2019, 11, 2893. [Google Scholar] [CrossRef]
- Lu, H.; Fan, T.; Ghimire, P.; Deng, L. Experimental evaluation and consistency comparison of UAV multispectral minisensors. Remote Sens. 2020, 12, 2542. [Google Scholar] [CrossRef]
- Mancini, F.; Dubbini, M.; Gattelli, M.; Stecchi, F.; Fabbri, S.; Gabbianelli, G. Using Unmanned Aerial Vehicles (UAV) for High-Resolution Reconstruction of Topography: The Structure from Motion Approach on Coastal Environments. Remote Sens. 2013, 5, 6880–6898. [Google Scholar] [CrossRef]
- Turner, I.L.; Harley, M.D.; Drummond, C.D. UAVs for coastal surveying. Coast. Eng. 2013, 114, 19–24. [Google Scholar] [CrossRef]
- Kelaher, B.P.; Pappagallo, T.; Litchfield, S.; Fellowes, T.E. Drone-Based Monitoring to Remotely Assess a Beach Nourishment Program on Lord Howe Island. Drones 2023, 7, 600. [Google Scholar] [CrossRef]
- Najar, M.A.; Benshila, R.; Bennioui, Y.E.; Thoumyre, G.; Almar, R.; Bergsma, E.W.J.; Delvit, J.-M.; Wilson, D.G. Coastal Bathymetry Estimation from Sentinel-2 Satellite Imagery: Comparing Deep Learning and Physics-Based Approaches. Remote Sens. 2022, 14, 1196. [Google Scholar] [CrossRef]
- Rotnicka, J.; Dłużewski, M.; Dąbski, M.; Rodzewicz, M.; Włodarski, W.; Zmarz, A. Accuracy of the UAV-Based DEM of Beach–Foredune Topography in Relation to Selected Morphometric Variables, Land Cover, and Multitemporal Sediment Budget. Estuaries Coasts 2020, 43, 1939–1955. [Google Scholar] [CrossRef]
- Zhao, Y.; Zheng, W.; Xiao, W.; Zhang, S.; Lv, X.; Zhang, J. Rapid monitoring of reclaimed farmland effects in coal mining subsidence area using a multi-spectral UAV platform. Environ. Monit. Assess. 2020, 192, 1–19. [Google Scholar] [CrossRef]
- Gelernter, D.H. Mirror Worlds: Or the Day Software Puts the Universe in a Shoebox—How It Will Happen and What It Will Mean; Oxford University Press: Oxford, UK; New York, NY, USA, 1991. [Google Scholar]
- Grieves, M. Virtually Intelligent Product Systems: Digital and Physical Twins. In Complex Systems Engineering: Theory and Practice; Flumerfelt, S., Schwartz, K.G., Mavris, D., Briceno, S., Eds.; American Institute of Aeronautics and Astronautics: Reston, VA, USA, 2019; pp. 175–200. [Google Scholar]
- Eom, J.O.; Yoon, J.H.; Yeon, J.H.; Kim, S.W. Port digital twin development for decarbonization: A case study using the Pusan Newport International Terminal. J. Mar. Sci. Eng. 2023, 11, 1777. [Google Scholar] [CrossRef]
- Jiang, P.; Meinert, N.; Jordão, H.; Weisser, C.; Holgate, S.; Lavin, A.; Barnard, P. Digital Twin Earth-Coasts: Developing a fast and physics-informed surrogate model for coastal floods via neural operators. arXiv 2021, arXiv:2110.07100. [Google Scholar]
- Chen, G.; Yang, J.; Huang, B.; Ma, C.; Tian, F.; Ge, L.; Xia, L.; Li, J. Toward digital twin of the ocean: From digitalization to cloning. Intell. Mar. Technol. Syst. 2023, 1, 3. [Google Scholar] [CrossRef]
- Lv, Z.; Lv, H.; Fridenfalk, M. Digital Twins in the Marine Industry. Electronics 2023, 12, 2025. [Google Scholar] [CrossRef]
- Pillai UP, A.; Pinardi, N.; Alessandri, J.; Federico, I.; Causio, S.; Unguendoli, S.; Valentini, A.; Staneva, J. A Digital Twin modelling framework for the assessment of seagrass Nature Based Solutions against storm surges. Sci. Total Environ. 2022, 847, 157603. [Google Scholar] [CrossRef]
- Scardino, G.; Scicchitano, G.; Chirivì, M.; Costa, P.J.M.; Luparelli, A.; Mastronuzzi, G. Convolutional Neural Network and Optical Flow for the Assessment of Wave and Tide Parameters from Video Analysis (LEUCOTEA): An Innovative Tool for Coastal Monitoring. Remote Sens. 2022, 14, 2994. [Google Scholar] [CrossRef]
- Agrillo, E.; Filipponi, F.; Salvati, R.; Pezzarossa, A.; Casella, L. Modeling Approach for Coastal Dune Habitat Detection on Coastal Ecosystems Combining Very High-resolution UAV Imagery and Field Survey. Remote Sens. Ecol. Conserv. 2023, 9, 251–267. [Google Scholar] [CrossRef]
- Hobley, B.; Arosio, R.; French, G.; Bremner, J.; Dolphin, T.; Mackiewicz, M. Semi-Supervised Segmentation for Coastal Monitoring Seagrass Using RPA Imagery. Remote Sens. 2021, 13, 1741. [Google Scholar] [CrossRef]
- Bertocco, M.; Bertoni, D.; Peruzzi, G.; Sarti, G. Machine Learning Techniques Applied to RFID-based Marine Sediment Tracking. In Proceedings of the 2023 IEEE International Workshop on Metrology for the Sea; Learning to Measure Sea Health Parameters (MetroSea), La Valletta, Malta, 4–6 October 2023; IEEE: Piscataway, NJ, USA, 2023; pp. 427–432. [Google Scholar]
- Tsiakos, C.-A.D.; Chalkias, C. Use of Machine Learning and Remote Sensing Techniques for Shoreline Monitoring: A Review of Recent Literature. Appl. Sci. 2023, 13, 3268. [Google Scholar] [CrossRef]
- Liu, J.P.; Xu, K.H.; Li AE, A.; Milliman, J.D.; Velozzi, D.M.; Xiao, S.B.; Yang, Z.S. Flux and fate of Yangtze River sediment delivered to the East China Sea. Geomorphology 2007, 85, 208–224. [Google Scholar] [CrossRef]
- Zheng, Y.; Chen, X. Research on the optimization and upgrading of marine tourism products in shanghai. J. Econ. Sci. Res. 2021, 4. [Google Scholar] [CrossRef]
- Blumberg, A.F. A primer for ECOM-si. In Technical Report of HydroQual; HydroQual: Mahwah, NJ, USA, 1994; Volume 66. [Google Scholar]
- Wu, H.; Zhu, J. Advection scheme with 3rd high-order spatial interpolation at the middle temporal level and its application to saltwater intrusion in the Changjiang Estuary. Ocean Model. 2010, 33, 33–51. [Google Scholar] [CrossRef]
- Yuan, R.; Wu, H.; Zhu, J.; Li, L. The response time of the Changjiang plume to river discharge in summer. J. Mar. Syst. 2016, 154, 82–92. [Google Scholar] [CrossRef]
- Wu, T.; Zhu, J.; Ma, R.; Qiu, W.; Yuan, R. Freshwater resources around the reclaimed new land on the Eastern Hengsha Shoal in the Changjiang estuary. Front. Mar. Sci. 2023, 10, 1302091. [Google Scholar] [CrossRef]
- Calisi, D.; Botta, S.; Cannata, A. Integrated Surveying, from Laser Scanning to UAV Systems, for Detailed Documentation of Architectural and Archeological Heritage. Drones 2023, 7, 568. [Google Scholar] [CrossRef]
- Sang, F.; Wu, H.; Liu, Z.; Fang, S. Digital twin platform design for Zhejiang rural cultural tourism based on Unreal Engine. In Proceedings of the 2022 International Conference on Culture-Oriented Science and Technology (CoST), Lanzhou, China, 18–21 August 2022; IEEE: Piscataway, NJ, USA, 2022; pp. 274–278. [Google Scholar]
- Parrinello, S.; Picchio, F. Digital Strategies to Enhance Cultural Heritage Routes: From Integrated Survey to Digital Twins of Different European Architectural Scenarios. Drones 2023, 7, 576. [Google Scholar] [CrossRef]


Disclaimer/Publisher’s Note: The statements, opinions and data contained in all publications are solely those of the individual author(s) and contributor(s) and not of MDPI and/or the editor(s). MDPI and/or the editor(s) disclaim responsibility for any injury to people or property resulting from any ideas, methods, instructions or products referred to in the content. |
© 2024 by the authors. Licensee MDPI, Basel, Switzerland. This article is an open access article distributed under the terms and conditions of the Creative Commons Attribution (CC BY) license (https://creativecommons.org/licenses/by/4.0/).