Abstract
The evolution of the liquid–vapour interface plays a crucial role in multiphase flow, heat and mass transfer, and fluid phase change in porous media. A thorough investigation of the interface under varying degrees of saturation is necessary and crucial to fully understanding the key mechanism of soil water evaporation. The pore voids and fluids are characterized using X-ray microtomography and image processing. Salt solutions usually replace pure water for better contrast and image development. Machine learning algorithms were employed to identify and extract the different phase and their interface accurately. Then, variations in the geometrical and topological features of the interface at varying saturation during evaporation were analysed to quantitatively describe the connectivity of the liquid phase and the morphological change in the liquid–vapour interface. Topological analysis reveals that normalized Euler characteristic numbers quantify the complementary connectivity of liquid and vapour phase. The curvatures of the liquid–vapour interface of the samples under various saturations classify the liquid–air interface curvature of samples under various saturations for quantitatively describing the migration progress and quantity distribution of typical interface along with drying.
1. Introduction
Under varying conditions of saturation, the liquid–vapour (l–v) interface ubiquitously manifests within porous media, inevitably engaging a multitude of natural and industrial systems, such as evaporation and transport in microporous membranes [1,2], geological sequestration of carbon dioxide [3,4], and playing pivotal roles in natural phenomena like plant transpiration and industrial processes such as desalination of seawater [5,6]. Previous research has extensively investigated interface characteristics such as surface area, curvature, phase morphology, and phase connectivity during processes like CO2 injection or oil/gas displacement in oil/water or CO2/salt interface [7,8,9]. Dong et al. [10] utilized interface characteristics to describe the evaporation process of pore water in glass beads. Lin et al. [11] employed Gaussian curvature to characterize the evaporation process, using curvature to delineate interface morphologies in oil-wet reservoir rocks, thereby providing pore-scale insights into the dynamics of two-phase fluid flow during oil and gas displacement. Alhosani et al. [1] demonstrated using interface curvature analysis that negative Gaussian curvature is a prerequisite for the continuity of oil–water phase within pore spaces. The geometric and topological features such as interface surface and curvature necessitate further complex and detailed examination.
Numerous experimental techniques have been employed to effectively characterize the pores and pore fluids within porous media. Techniques for studying interface characteristics include gamma-ray attenuation [12], time-domain reflectometry [13], nuclear magnetic resonance imaging [14], and X-ray computed tomography (CT) [15,16,17,18]. Among these, the CT method has been successfully applied to provide non-destructive, three-dimensional, and high-resolution image observations, thus being widely adopted in the engineering field for studies including internal damage inspection of laboratory or in situ samples and characterization of pore-scale features in porous media [19,20,21]. This has led to the exploration of CT technology for microstructural characterization of porous media mechanics, percolation processes, and more.
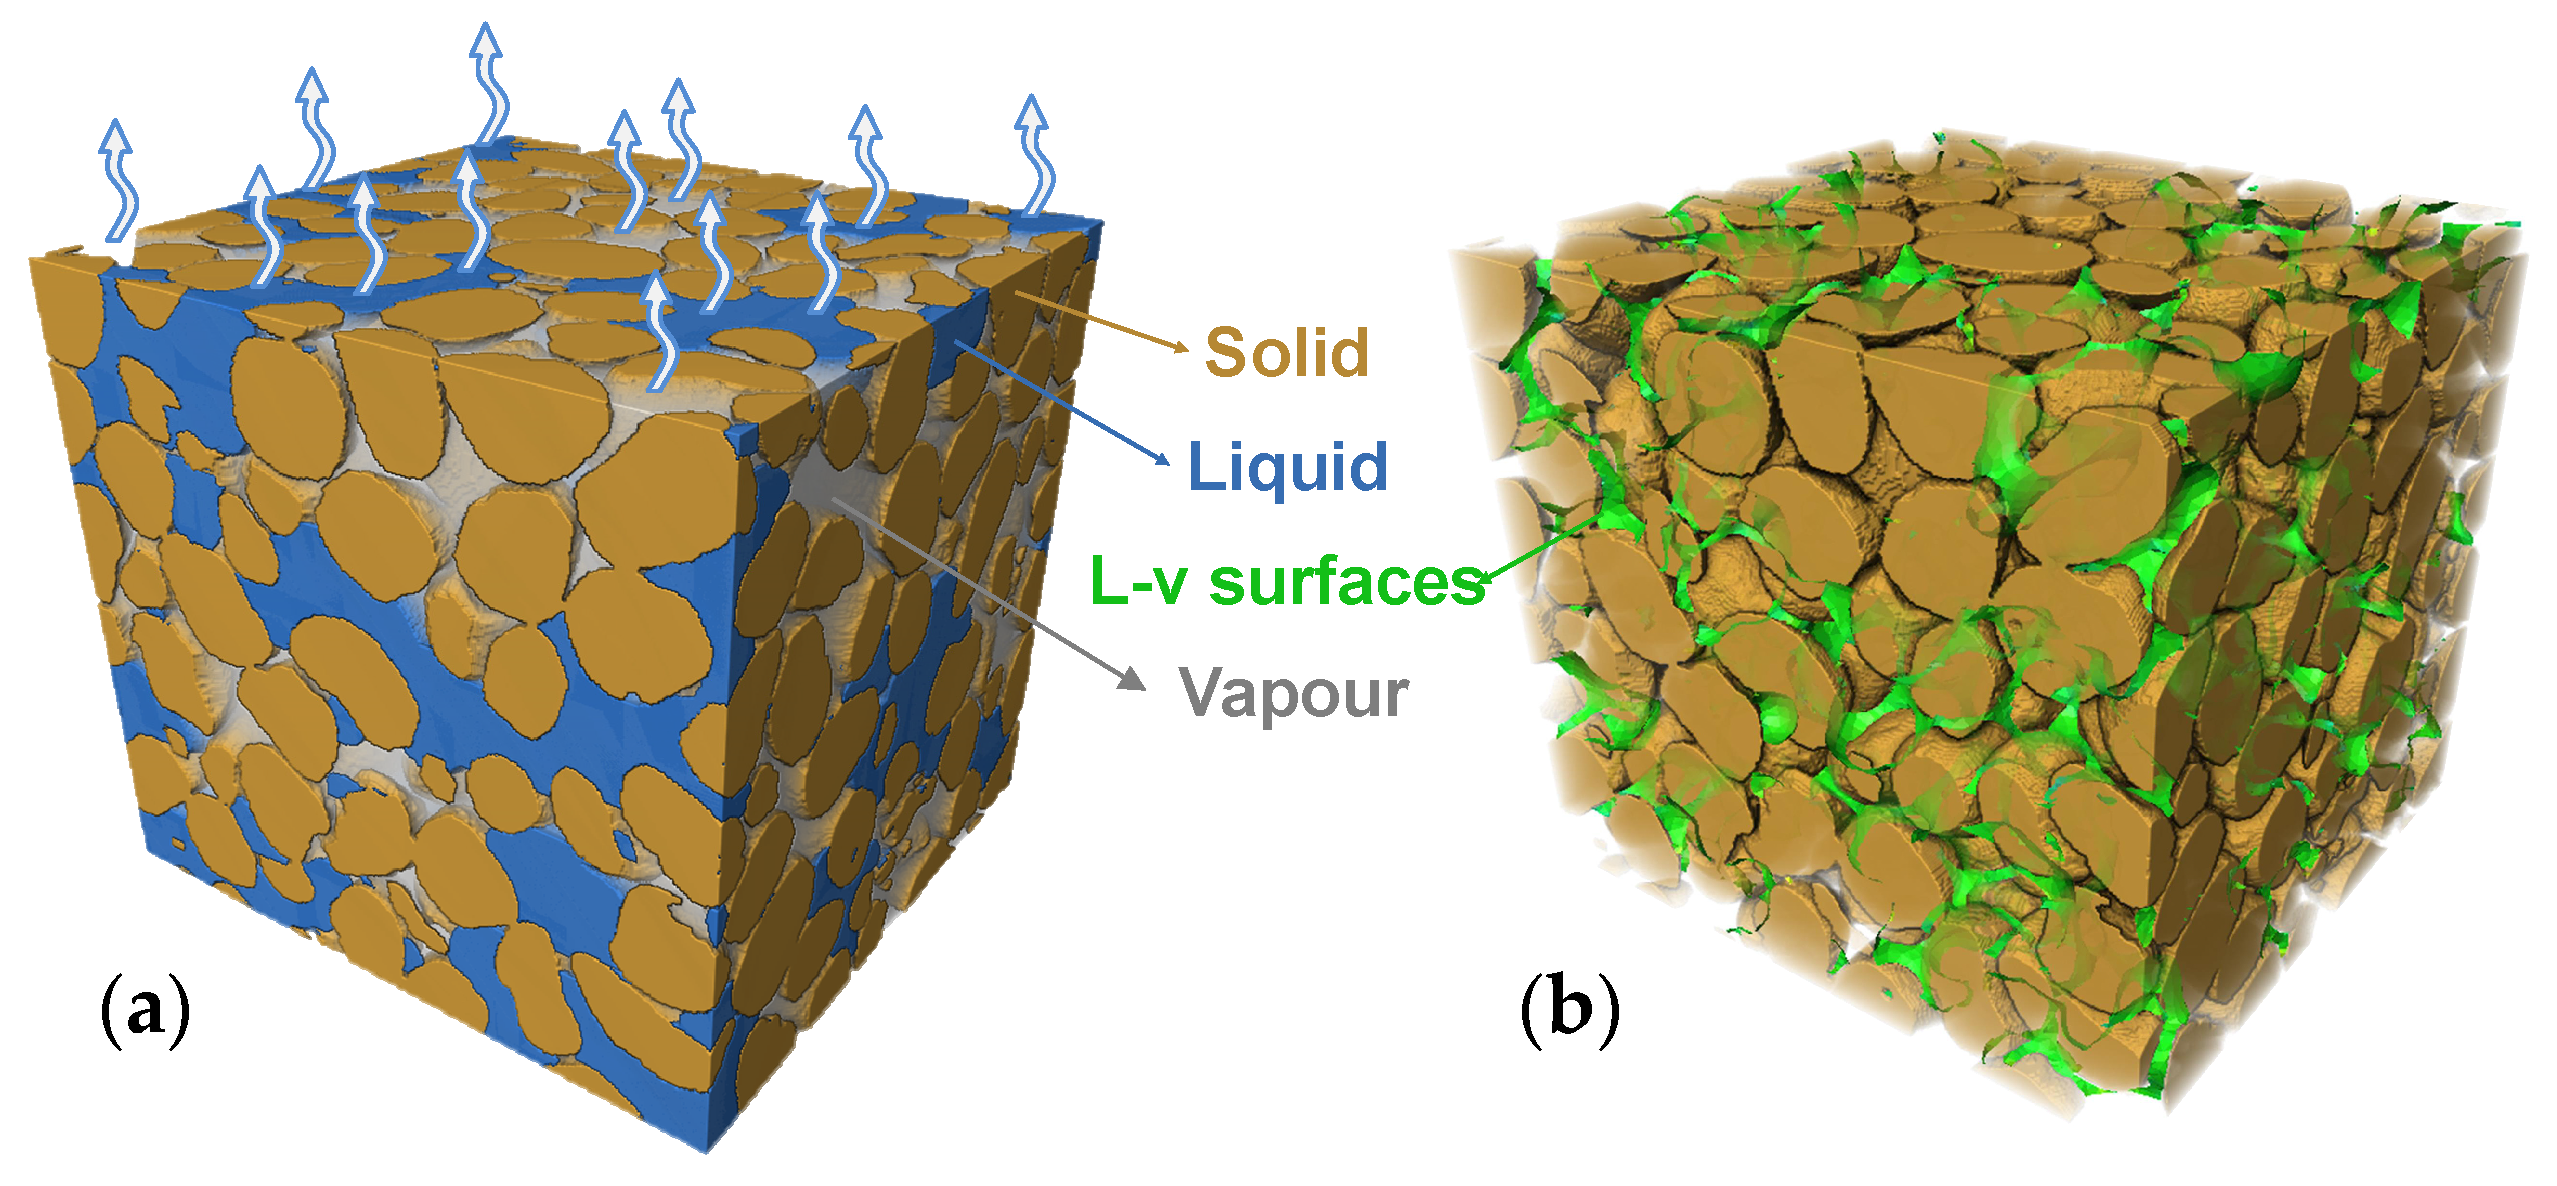
High-resolution X-ray imaging technology has revolutionized our understanding of multiphase flow within porous media, making the visualization of phase transitions at the pore scale a reality [22]. This work has been applied to address a wide range of issues, including drainage and wetting dynamics [23,24,25,26,27,28], and multiphase flow displacement [29,30,31]. Higo et al. [19,20] documented the failure morphologies of sand columns under triaxial stress using micro-CT scanning technology and obtained curvature values of local curved liquid surfaces, calculating local capillary forces according to the Young–Laplace equation. This study applied CT scanning technology in the field of geomechanics to visually characterize the failure morphology of sand columns in triaxial tests. However, capillary forces calculated from curvature values of local curved liquid surfaces obtained from two-dimensional CT images lack representativeness compared to macroscopic capillary forces measured by tensiometers. Wildenschild et al. [21] obtained soil sample grain and pore-size distribution information through CT scanning and determined the area variation curves of water–air interface, soil particle–water interface, and soil particle–air interface with saturation during the soil water evaporation process. The study found that the area of water–air interface first increases and then decreases as saturation decreases, and the size of the water–air interface area is related to the grain size distribution. In the evaporation process, while the soil surface or pores are the final regions for water vapour exchange between soil pores and the atmosphere, the liquid–vapour interface of pore water is the actual region for phase transition (Figure 1). Characterizing interface during air invasion into pores provides new insights into the evaporation mechanism.

Figure 1.
Illustrations of soil evaporation occurring at the interface: (a) distribution of soil three phase and the atmospheric exchange surface and (b) complex liquid–vapour interface within the soil.
In reality, image processing and phase characterization heavily depend on image quality, requiring high contrast between different phase, achieved by varying densities that lead to different X-ray attenuations. Therefore, saline solutions are commonly used instead of pure water to enhance contrast and image quality. Dong et al. [10] accurately characterized the liquid–vapour interface during evaporation using glass beads as an ideal soil material. In heterogeneous materials, results may show film-like artifacts. Rasband [32] suggested using edge detection functions to improve recognition, but relying solely on edge detection functions does not satisfactorily capture all material edges. Some machine learning algorithms, such as the U-net segmentation network and ilastik, consider both voxel intensity and edge detection for more accurate segmentation results [33].
Based on the accurate identification of glass beads, this study employs machine learning algorithms and watershed segmentation algorithms to solve the problem of the difficult distinction of soil edges, thereby accurately identifying and extracting different phases and their interfaces. The connectivity of the liquid phase during the evaporation process is described using the Euler number, demonstrating the general applicability of the liquid–vapour complementarity in soil materials. By combining typical interfaces for the classification and quantitative analysis of complex interfaces, the evolution of interface characteristics during the evaporation process is accurately described.
2. CT Sample Preparation
2.1. CT Scanning Experimental Setup
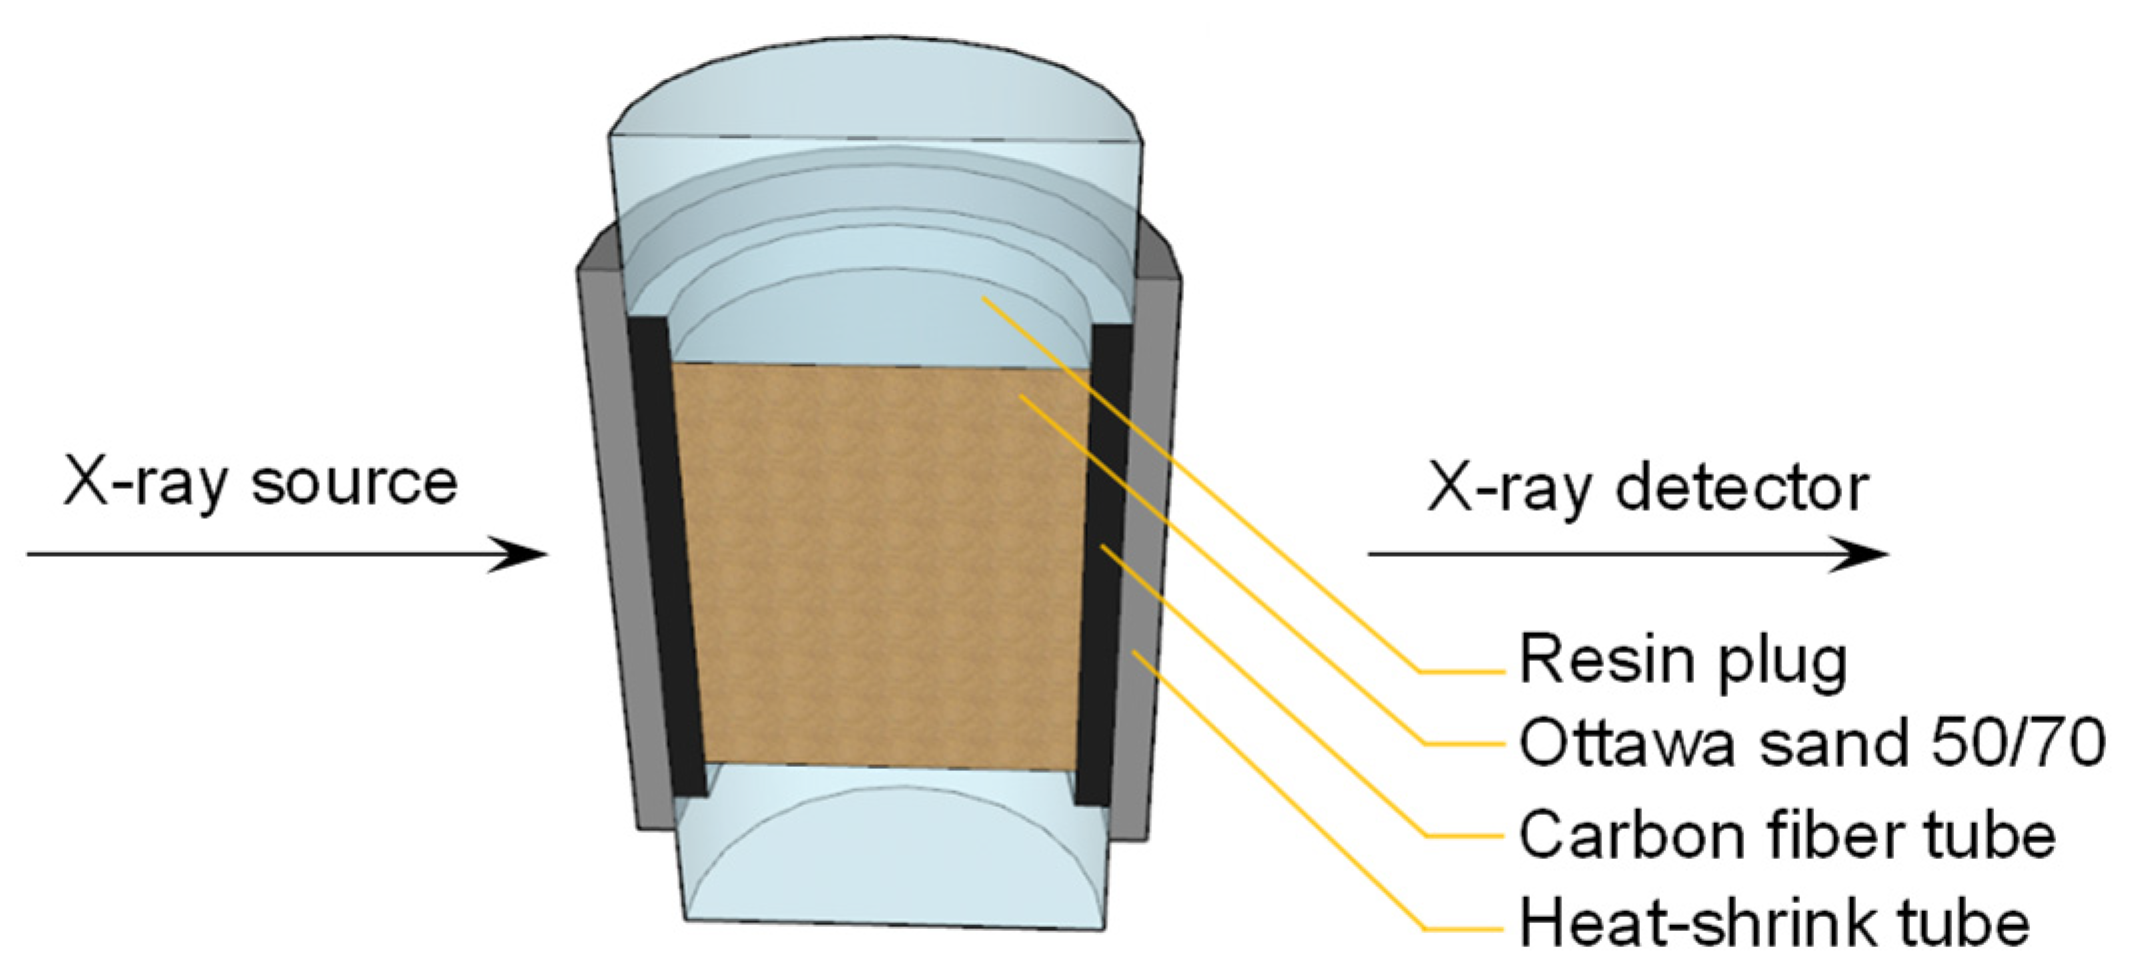
The experiments were conducted using Zeiss Xradia 410 Versa μCT instrument. The apparatus consists of an X-ray source for emitting X-rays, a sample stage, and a detector assembly, as shown in Figure 2. The sample stage is used to place the sample. A single scan takes approximately 2 h under dry conditions, thus the sample is carefully sealed to prevent moisture loss. The detector assembly includes a scintillator, an objective lens, and a CCD camera, which can enhance the resolution of the scanned sample to the micrometre level. This prevents the loss of details during image processing, allowing for a more complete and accurate extraction of the phases.

Figure 2.
Cross-sectional image of the sample obtained from CT scanning.
2.2. Sample Preparation
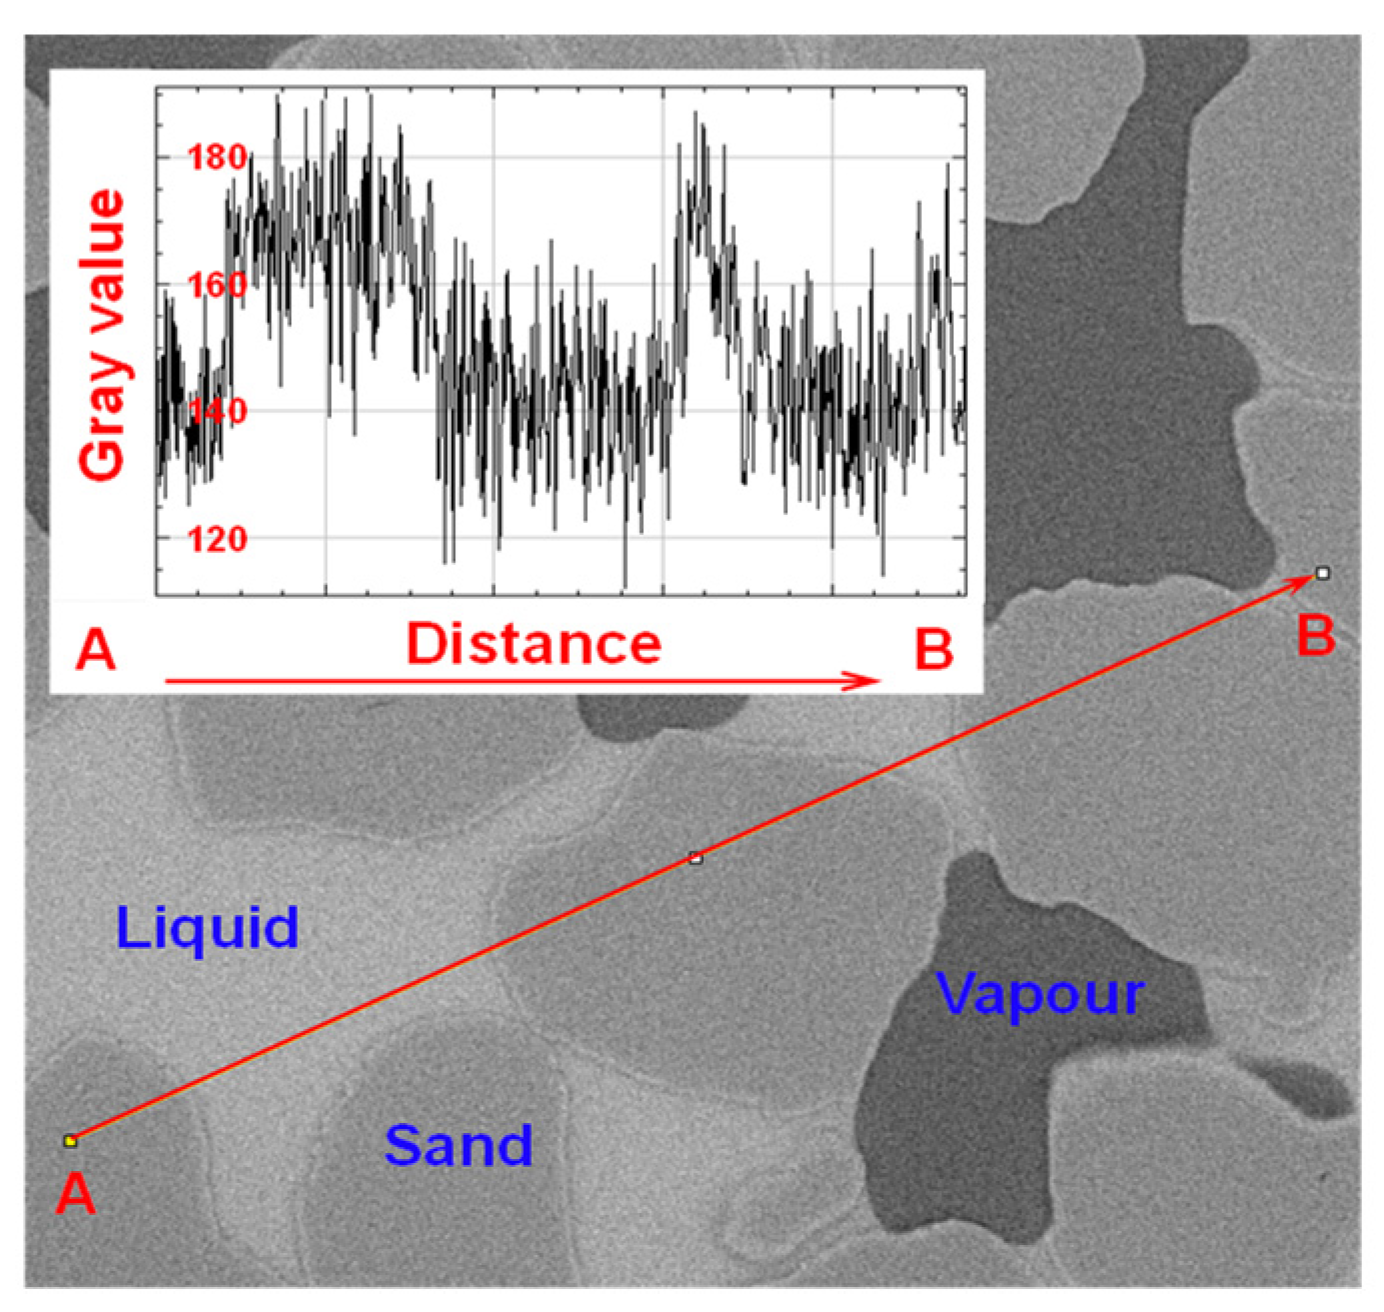
Due to the varied internal composition of sand particles, there is an overlap in grayscale values among the phase, making it challenging to find a suitable range of grayscale thresholds for distinguishing the three phase (Figure 3).
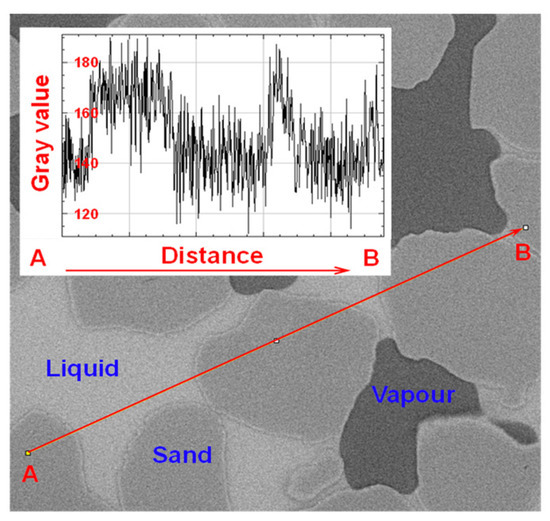
Figure 3.
Grayscale of the three phases when the liquid phase is pure water (Grey scale evolution of the line segment from point A to point B): Difficulty in extracting grayscale intervals for each phase.
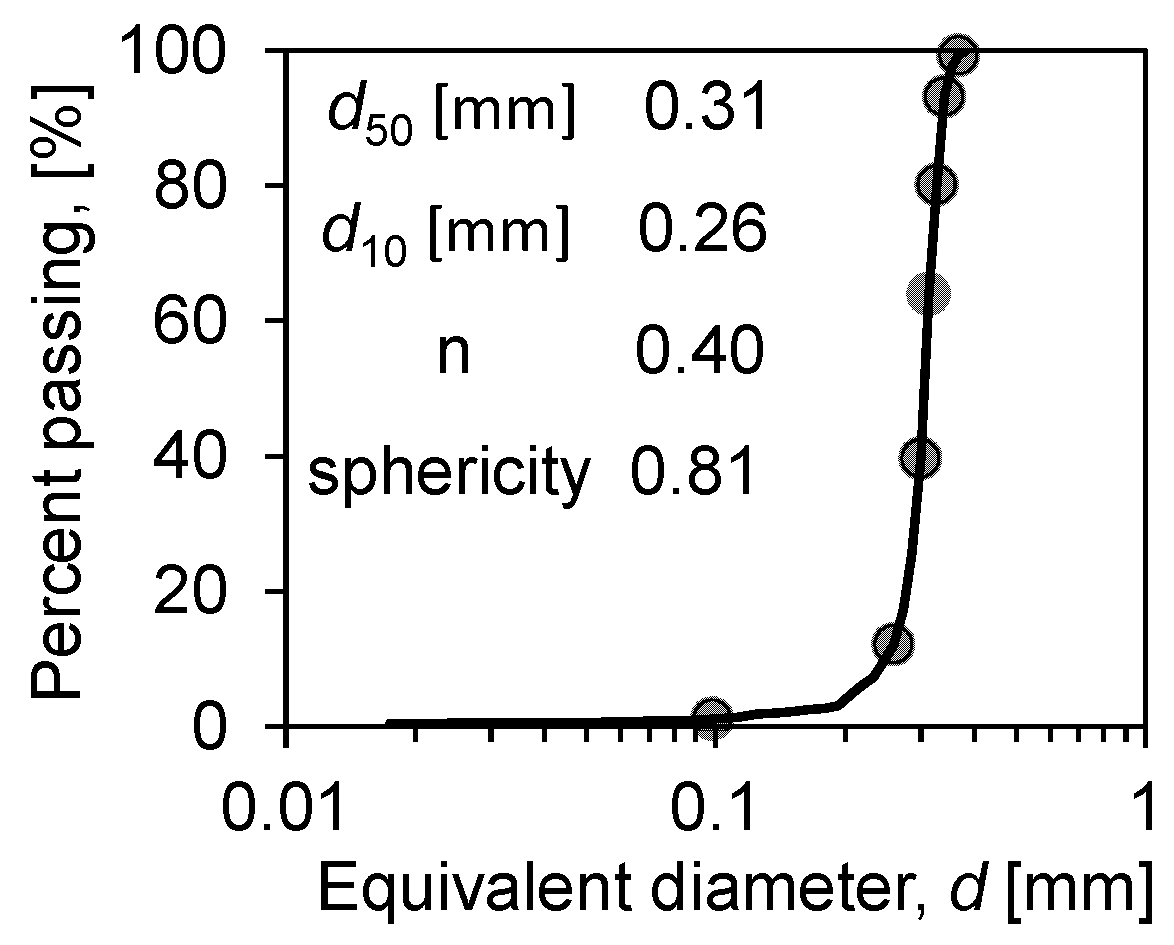
In prior experiments, to enhance the quality of image results, researchers have introduced contrast agents (e.g., low-concentration KI solution) into water to differentiate solid–liquid–vapour phase, based on their distinct X-ray absorption rates [21,34]. However, the concentration of contrast agent solution inside the soil may increase over time due to evaporation, potentially leading to localized crystallization and adversely affecting experimental outcomes, thereby complicating the execution of in situ experiments on individual samples undergoing continuous evaporation. This experiment prepared CT samples of Ottawa sand 50/70 (Figure 4 shows the particle size distribution of the soil) at various saturations (ranging from near saturation to nearly dry, a total of 12 sets of samples were characterised) to simulate different stages of the soil water evaporation process. To accurately represent the complete soil water evaporation process at different saturations (Sw, degree of water saturation), all samples were meticulously prepared according to the following steps:

Figure 4.
Particle size distribution of Ottawa sand 50/70.
- Soil samples were tightly packed into sample tubes based on their inner diameter (D = 2.7 mm) and height (H = 4.0 mm) and compacted to the target height using a given mass.
- The mass of KI solution (30% mass fraction) required for the intended saturation was calculated and added to the top of the soil sample using a pipette, which was then absorbed into the pores via capillary action.
- Pure water was added to the sample tube to fully saturate the soil sample, which was then allowed to evaporate freely to the target saturation level.
- The sample tube was sealed with a resin plug, and to prevent moisture escape, the exterior of the tube was sealed with sealant and heat-shrink tubing.
After scanning, the samples were reconstructed, and the saturation was re-measured to obtain the actual saturation of the samples. This meticulous procedure ensured uniform distribution of pore liquid within the samples and facilitated a comprehensive characterization of the pore water evaporation process during CT scanning.
3. CT Image Processing Process
After undergoing CT scanning, a series of grayscale images along the vertical height of the soil sample can be obtained. A single grayscale image is referred to as a slice, and the complete set of slices constitutes a stack. Unlike materials with high purity and smooth surfaces, such as glass beads [10], Ottawa sand is characterized by its irregular shape and rough surface [33,35]. Accurately extracting the liquid–vapour interface requires precise identification of the phase boundaries, where traditional watershed and top-hat techniques struggle to yield ideal results. In response to the complex grayscale distribution of sandy soils, this study employs axial light correction using ImageJ, enhances phase identification with Ilastik, and finally, conducts three-dimensional reconstruction using Avizo to extract features of soil porosity and the liquid–vapour interface.
3.1. Area Cropping and Luminance Normalisation
Before processing the data, invalid information at the edges of the sample is cropped to reduce the computational workload of graphics. A typical stack result is shown in Figure 5b. From a single slice, it is evident that after the addition of contrast agents, the three phase of grayscale exhibit clear distinctions, manifested as differences in brightness. The brightest white regions represent the liquid phase (KI solution), the darkest black regions represent the vapour phase (air), and the intermediate gray regions represent the solid phase (soil).
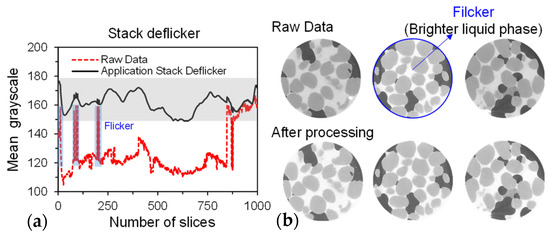
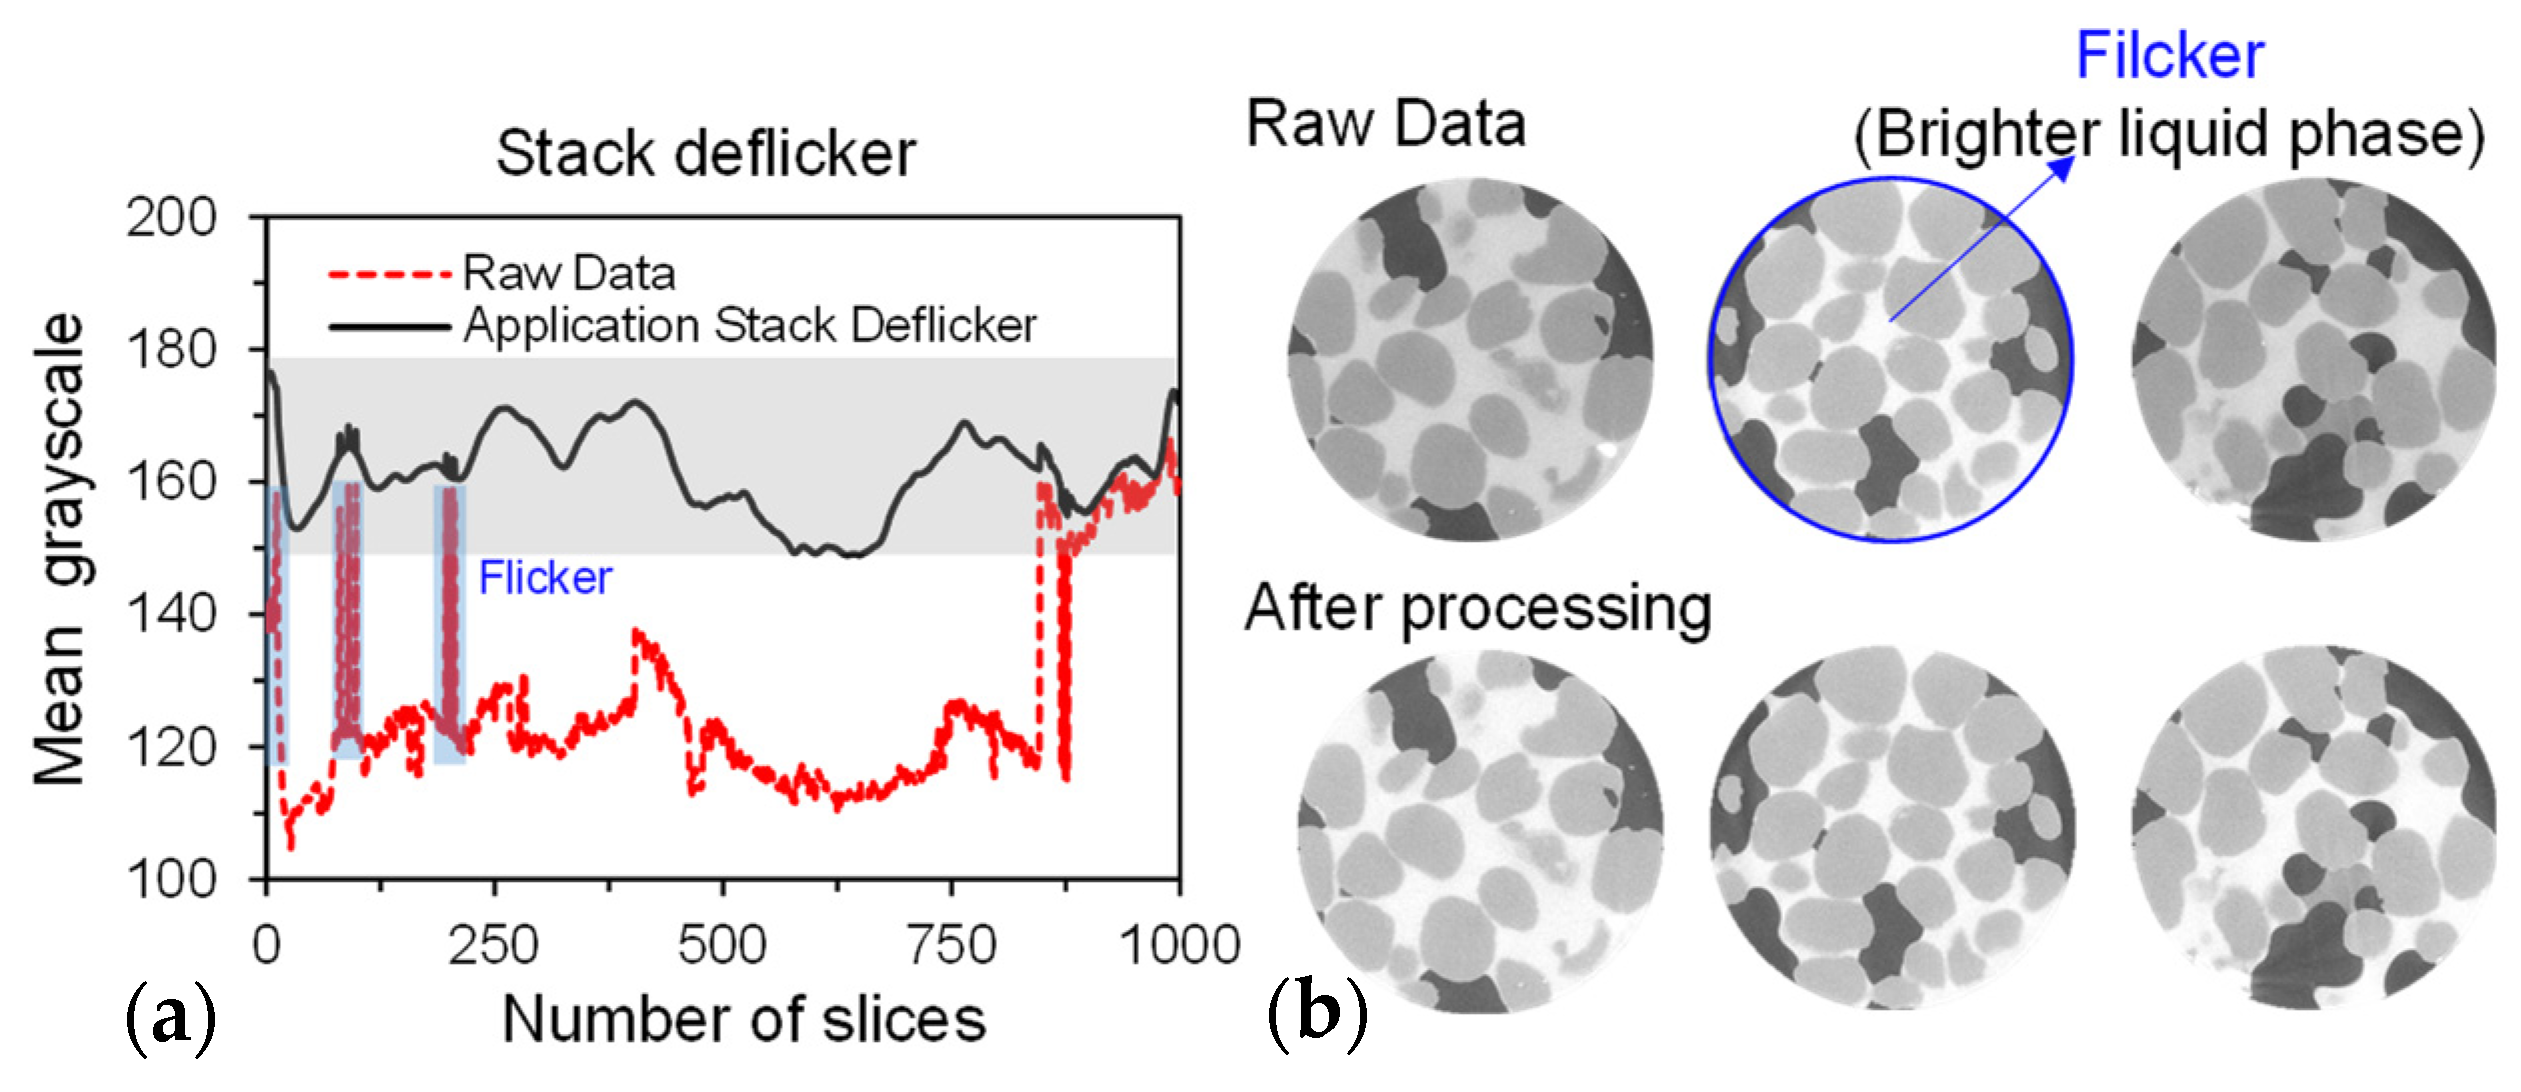
Figure 5.
Effectiveness of deflickering based on grayscale values: (a) average grayscale of height-directional slices and (b) visual change in stack brightness.
However, due to the intensity differences along the axial meridian during the X-ray scanning process, all CT slices exhibit uneven background grayscale, resulting in inconsistent grayscale value ranges for each phase within the stack images. In Figure 5b, it can be observed that some slices are significantly brighter than the ones before and after them. We calculated the average grayscale of each slice (Figure 5a), which showed several instances of fluctuation (brightness varying greatly), with some slices having abnormal average grayscale values. Segmenting solid, liquid, and vapour phase based on grayscale thresholds is challenging, especially for solid and liquid phase. This inconsistency was addressed by using Stack Deflicker (an ImageJ plugin that normalizes the background grayscale levels of image stacks. (Stack Deflicker, accessed on 15 December 2023, from http://www.phage.dk/plugins/deflicker.html).
3.2. Interactive Machine Learning for Enhanced Recognition
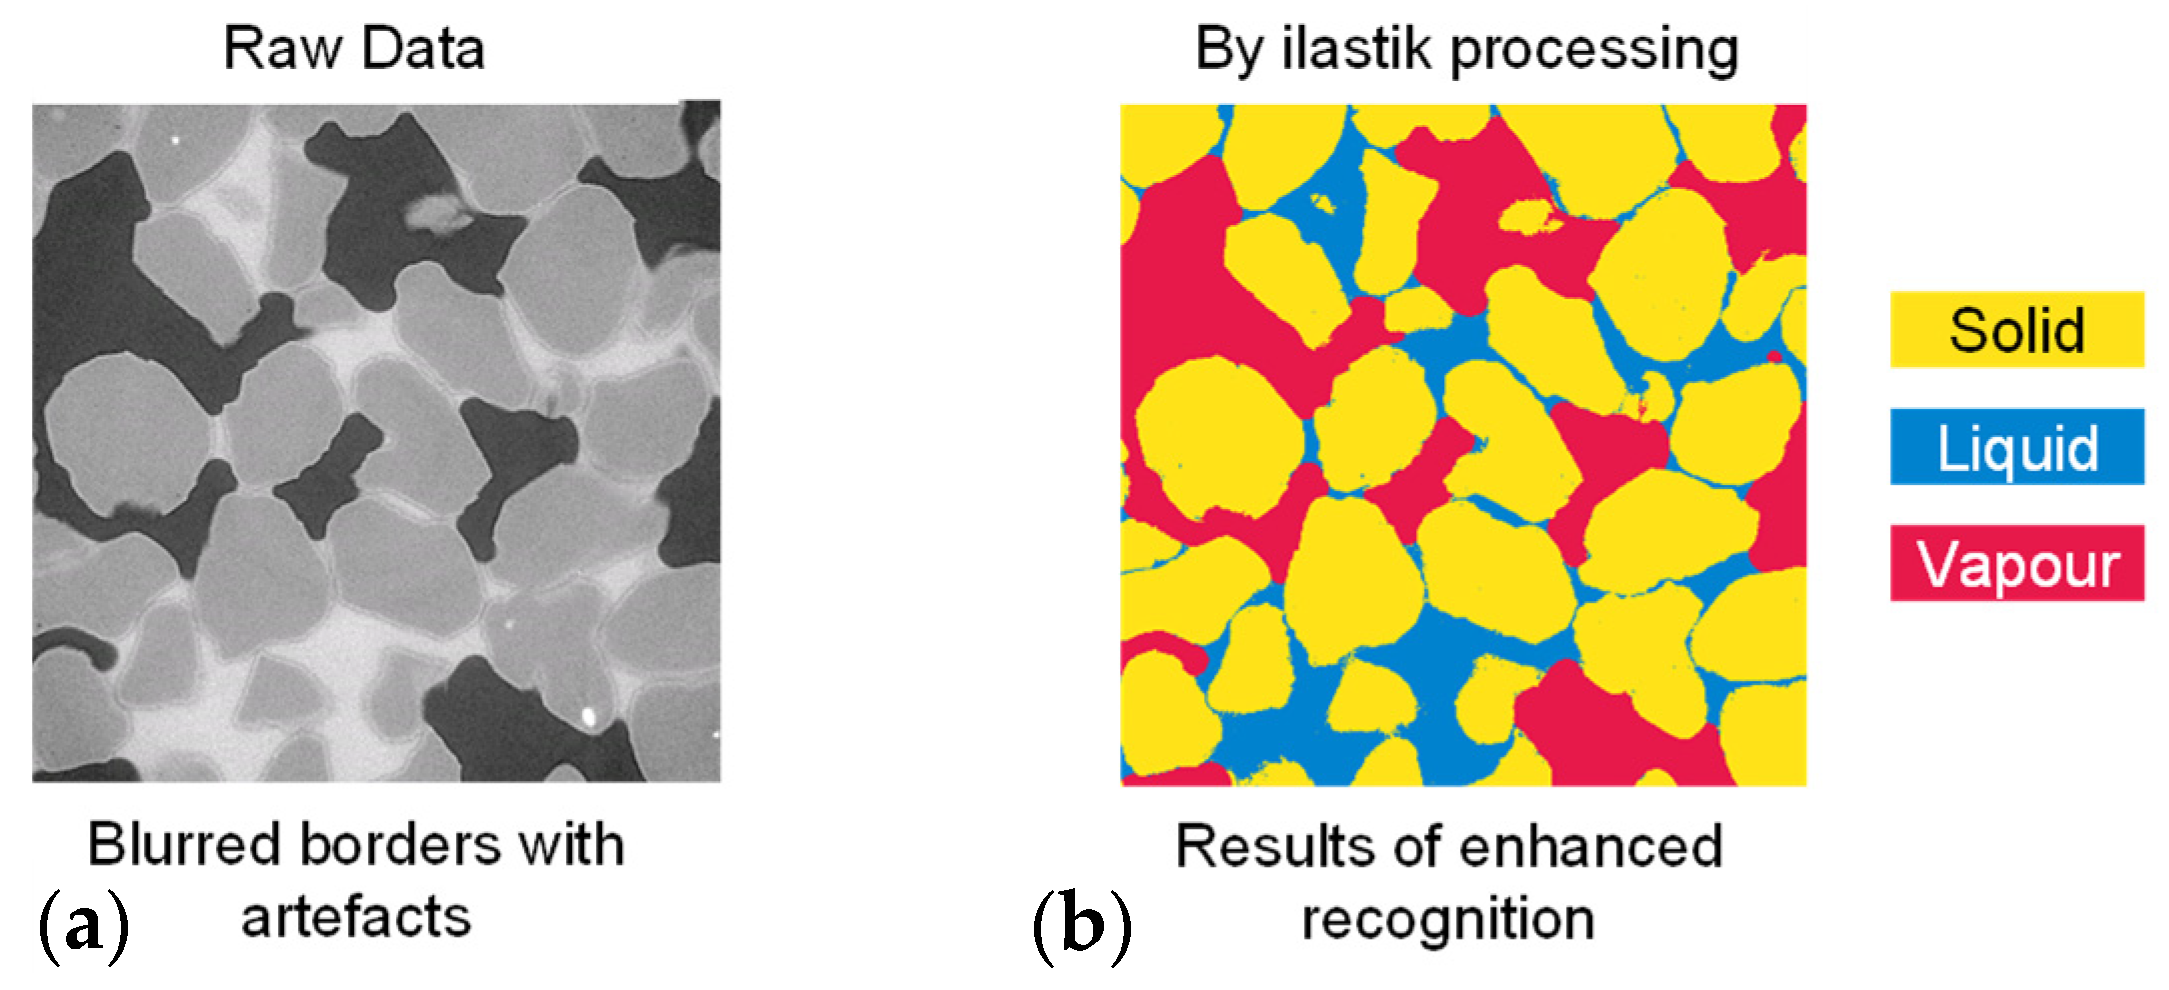
Following the normalization, the stack images are imported into ilastik [36], a software that utilizes machine learning algorithms to enhance phase recognition and segmentation. In the case of sandy soils, solid pixels might exhibit flickering with higher grayscale values close to those of the liquid phase and could be mistakenly identified as part of the liquid phase. This is particularly prominent in natural soil grains with mineral impurities. Selected typical slices are manually and carefully annotated, including the depiction within each phase and the sketching of each phase’s contours. The selected features, such as the colour/intensity, edges, and textures of each phase, are trained in the pixel classification module. This random forest workflow proceeds through the rest of the image stack and outputs clear segmentation results for solid, liquid, and vapour phase across all slices, the results are shown in Figure 6.
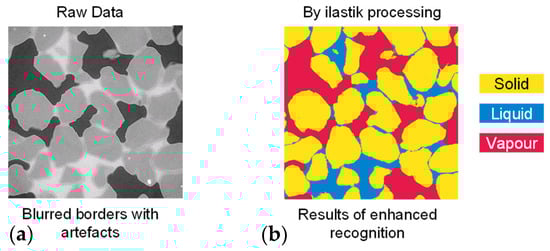
Figure 6.
Enhancing phase recognition and segmentation using the ilastik machine learning algorithm: (a) raw slices and (b) enhanced recognition results using ilastik.
3.3. Watershed Algorithm to Repair Interface
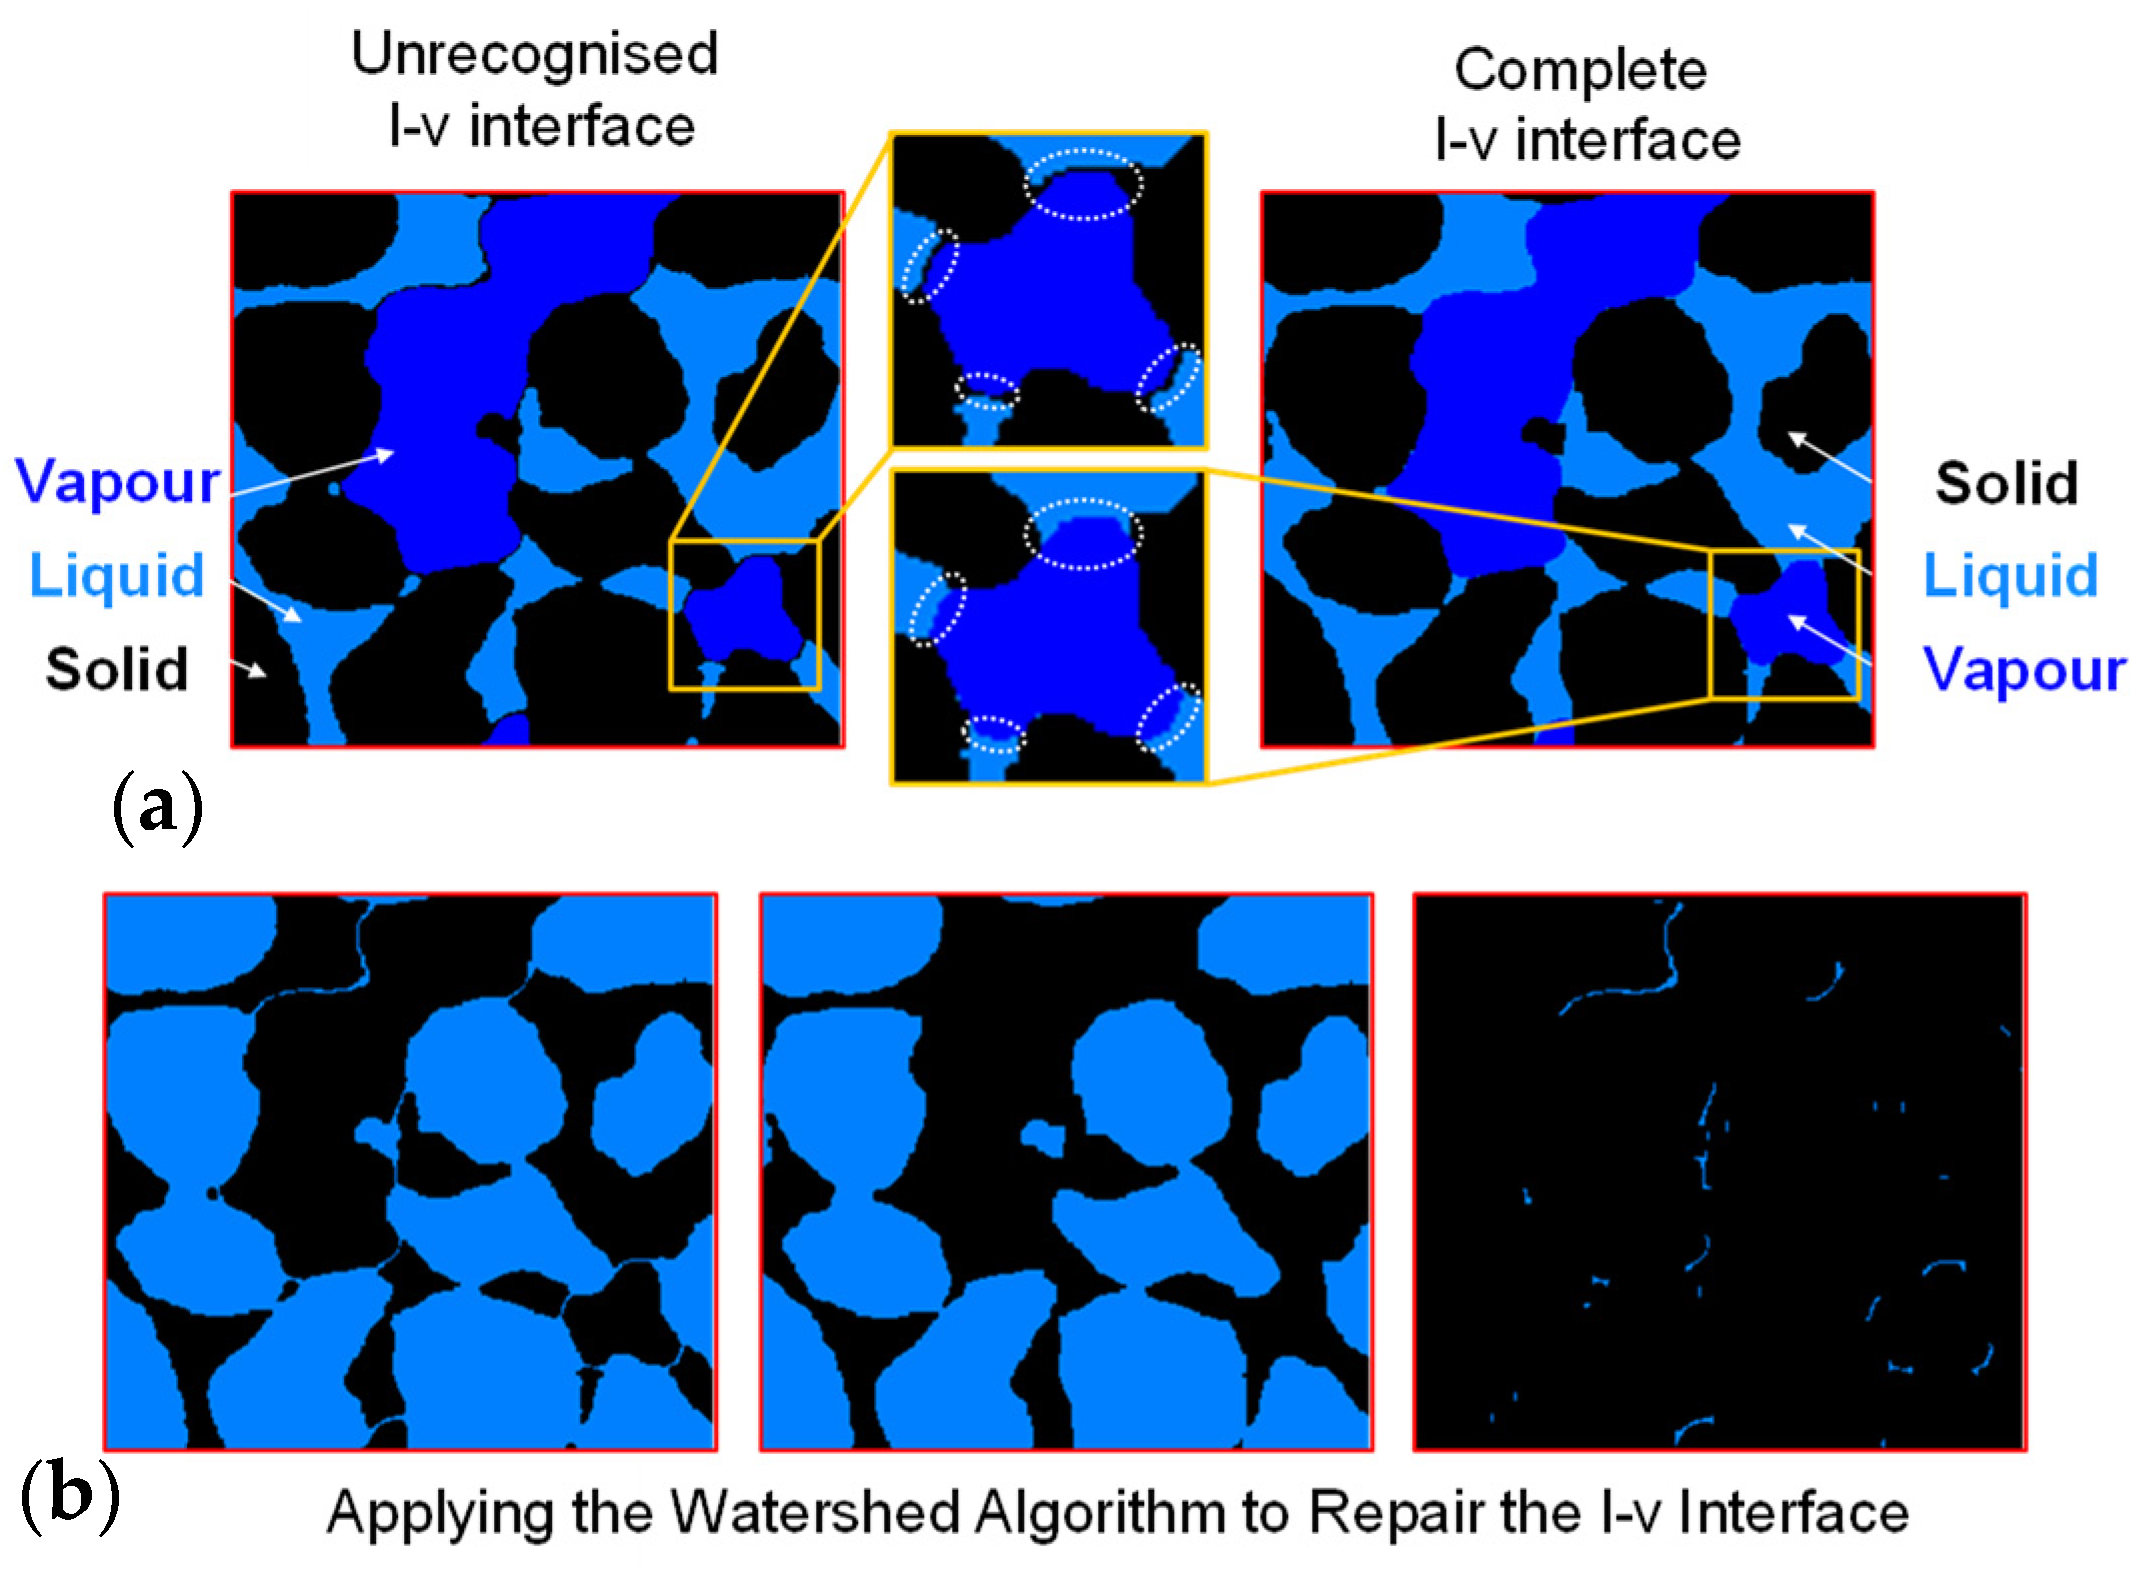
For the inaccuracies in boundary distinction within sandy soil materials caused by internal impurities and artifacts, the watershed algorithm is applied to correct the outcomes of enhanced recognition. Figure 7a exemplifies the typical absence of liquid–vapour interface and correct segmentation, a phenomenon resulting from the pseudo-edge artifacts’ grayscale values lying between the solid and liquid phase, leading to an incorrect classification into the solid phase and consequently incomplete liquid phase, preventing the formation of a complete liquid–vapour interface. To address this issue, the watershed segmentation algorithm is employed, enabling the establishment of a complete interface. Figure 7b illustrates the precise process of extracting the incorrectly segmented boundary: from left to right, the original solid phase, the solid phase following the removal of the incorrect boundary, and the segment of the boundary that is accurately extracted and can be attributed to the liquid phase. This algorithm can automatically reallocate pixels in the missing areas between the two phases, thereby ensuring the integrity of the interface.
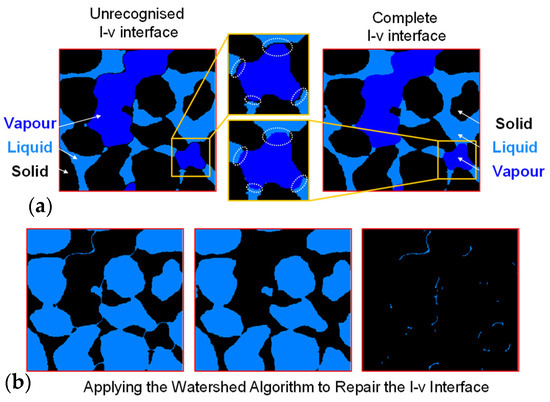
Figure 7.
Repairing boundaries through watershed algorithm: (a) examples of missing liquid–vapour interfaces and (b) repair of broken interface using watershed algorithm.
3.4. Three-Phase Identification and Interface Extraction
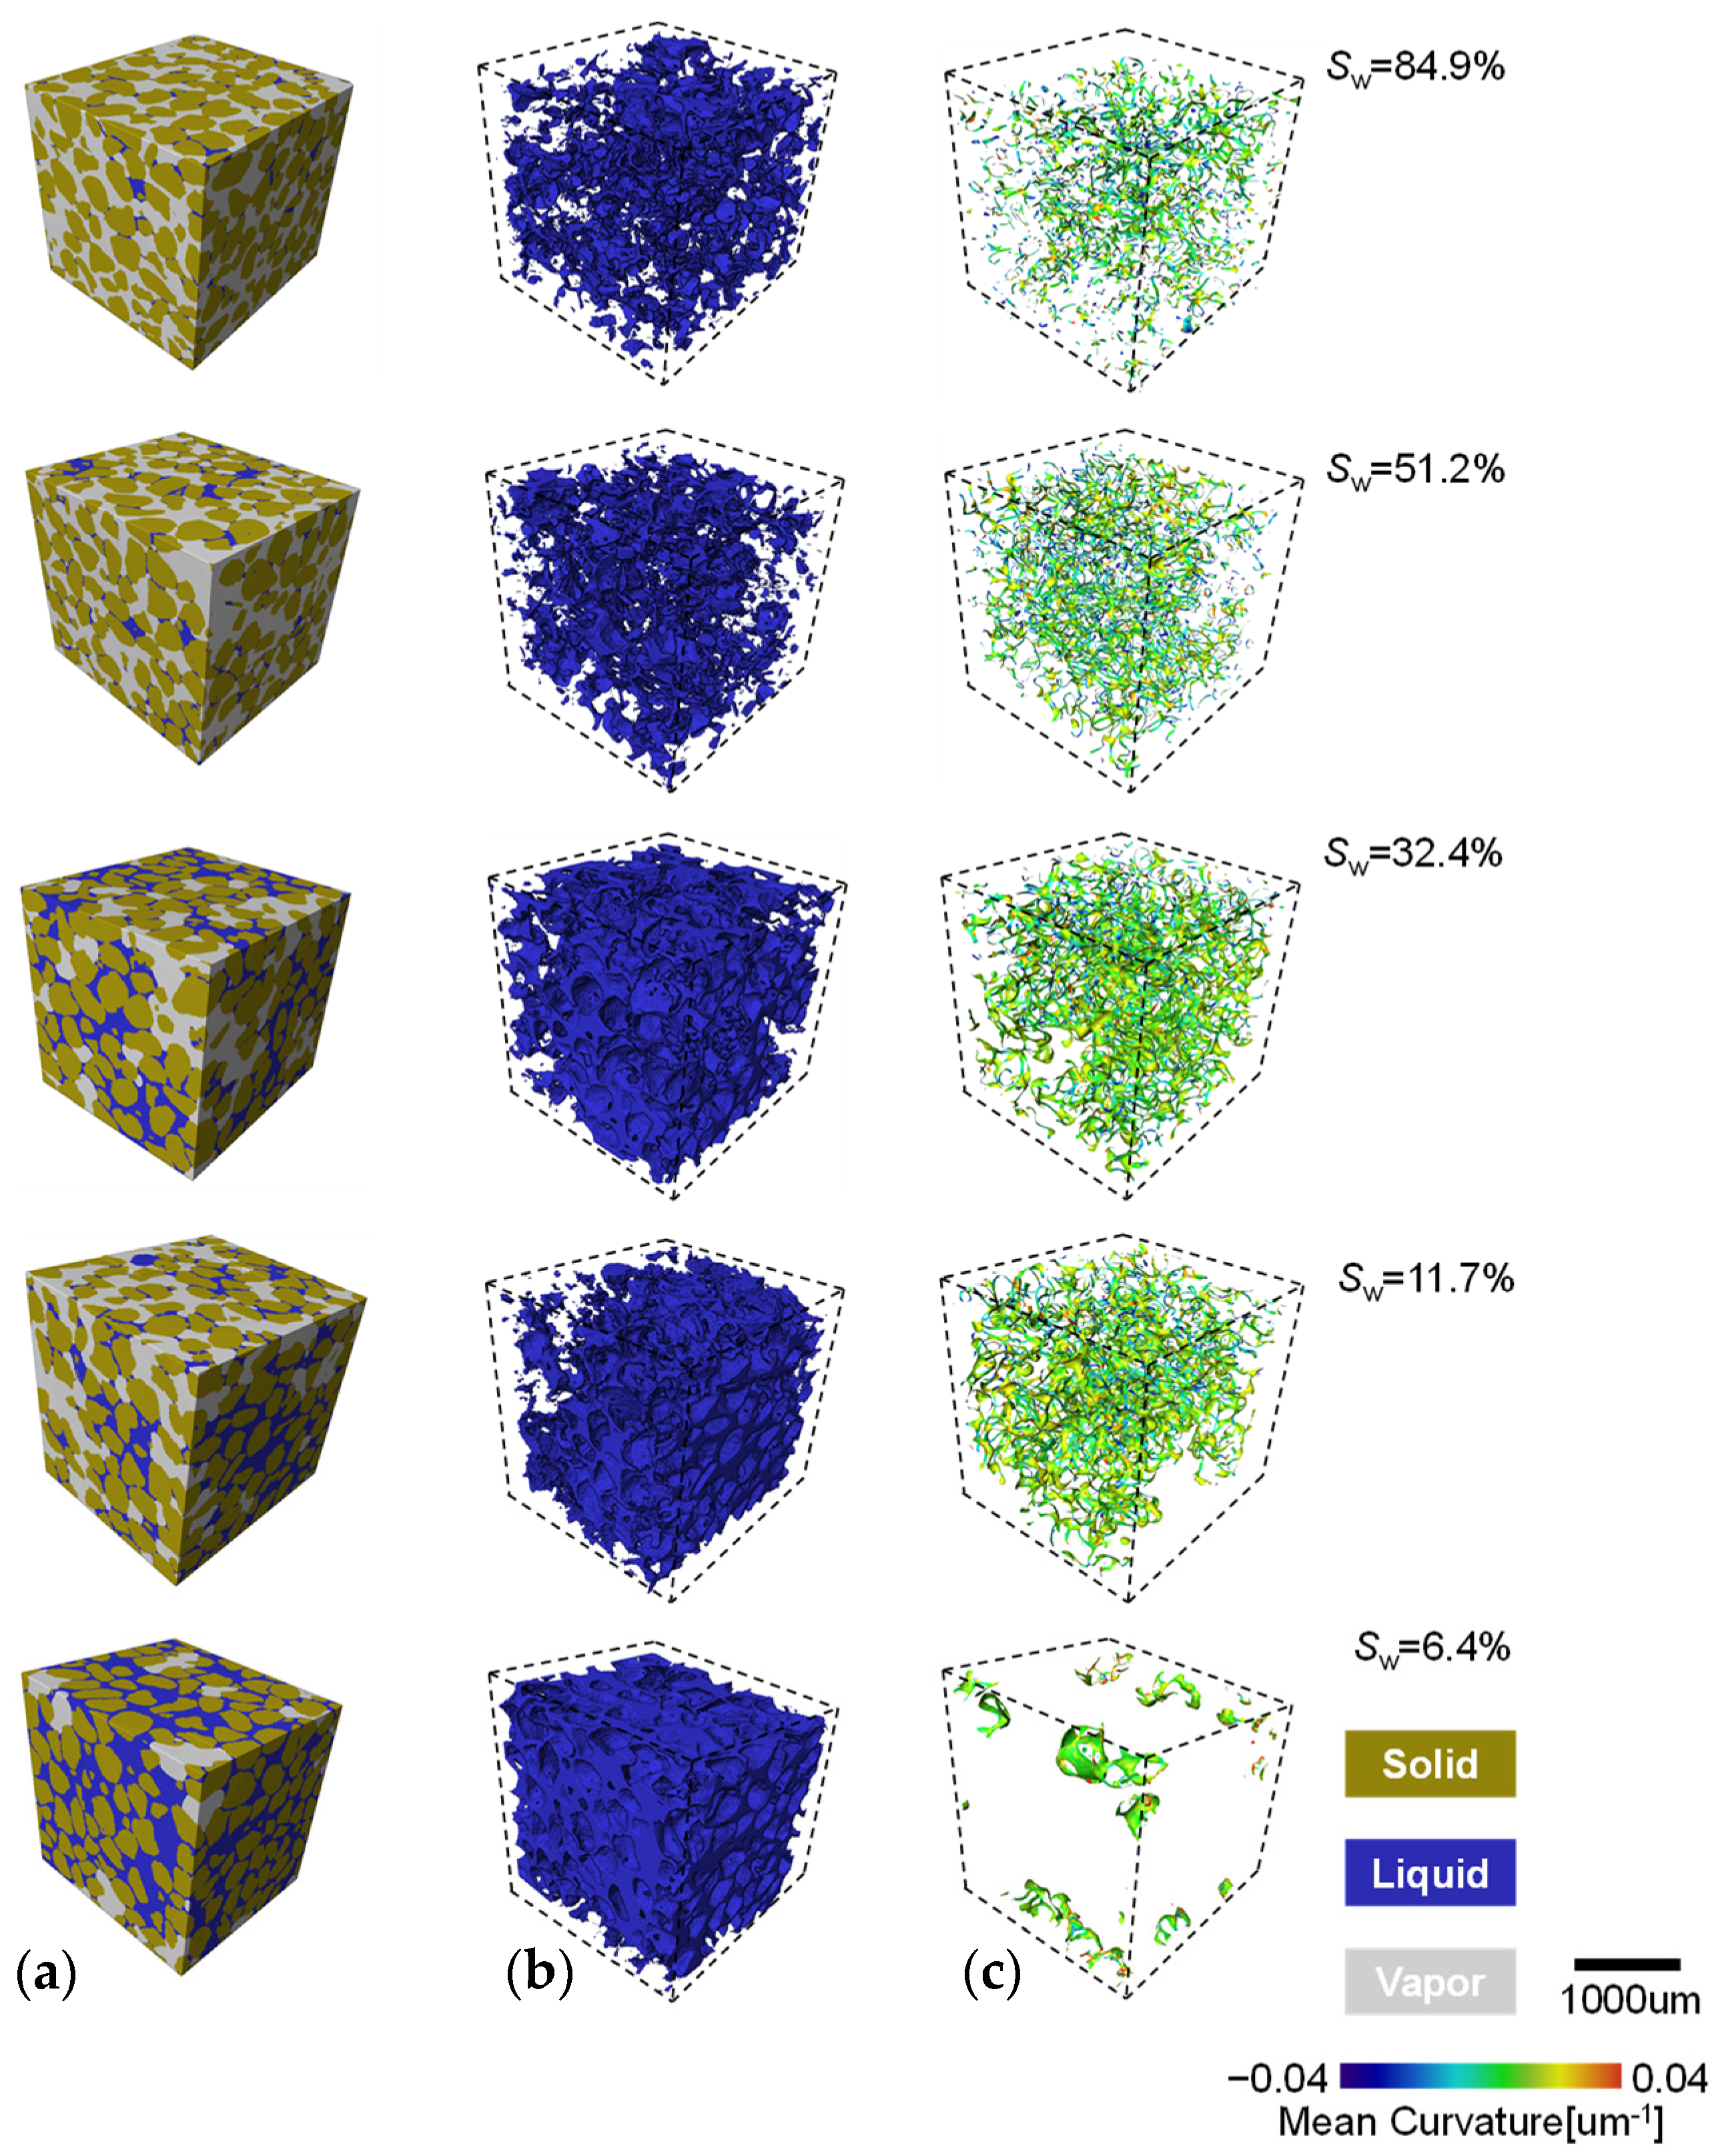
The segmented stack images are imported into Avizo Fire® for three-dimensional solid reconstruction. A representative cubic sample of the soil is cropped and presented with different saturations showing the three segmented phase (Figure 8a). The deep blue, green, and grey areas represent the solid, liquid, and vapour phases, respectively. The identification of each phase visualizes the sand grain skeleton and illustrates the distribution of liquid and vapour in the pores. With decreasing sand saturation, the evolution of droplets is akin to that observed with glass beads. During evaporation, the liquid–vapour interface of coarse and fine sands gradually fracture, and their geometric shapes become increasingly distorted and twisted as water recedes from the pores (Figure 8c). The colour spectrum from blue to red represents the distribution of average curvature on the interface. A positive average curvature is defined as a convex interface, with the normal vector of its tangent plane pointing towards the liquid phase. At high saturation levels (e.g., Sw > ~75%), cage-like clusters of liquid–vapour interface are observable, with relatively larger interface areas. Several isolated bowl-shaped interface clusters, or trapped bubbles, are scattered throughout the sample, expanding into the pore space in a more fragmented form as saturation decreases. As saturation drops from 40% to ~10%, clusters of aggregated liquid begin to separate and break apart, with the number of individual droplets and liquid–vapour interface rapidly increasing. An even distribution of average curvature in shades of orange and light green can be observed within the sample. At low saturations (Sw < ~7%), a bowl-shaped interface with negative average curvature (deep blue dots) intermittently appears within the sample.
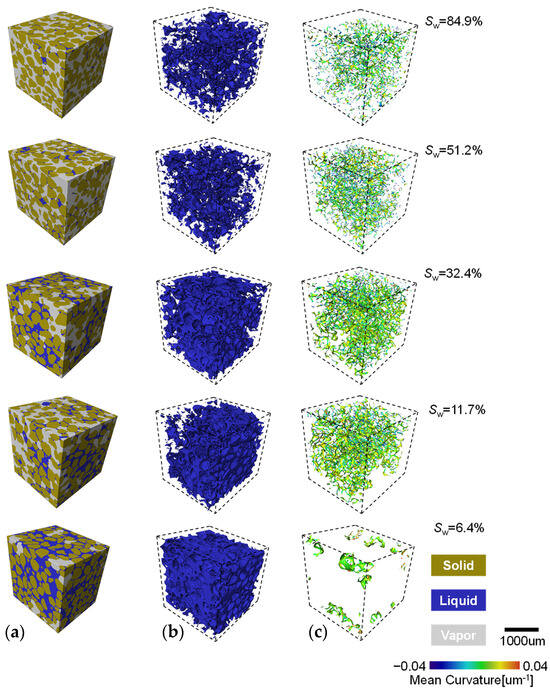
Figure 8.
The phase distribution and mean curvature evolution process with evaporation: (a) three phase distribution; (b) the liquid phase distribution; and (c) the l–v interface distribution and curvature evolution.
4. Discussion
4.1. Soil Pore Connectivity Characteristics
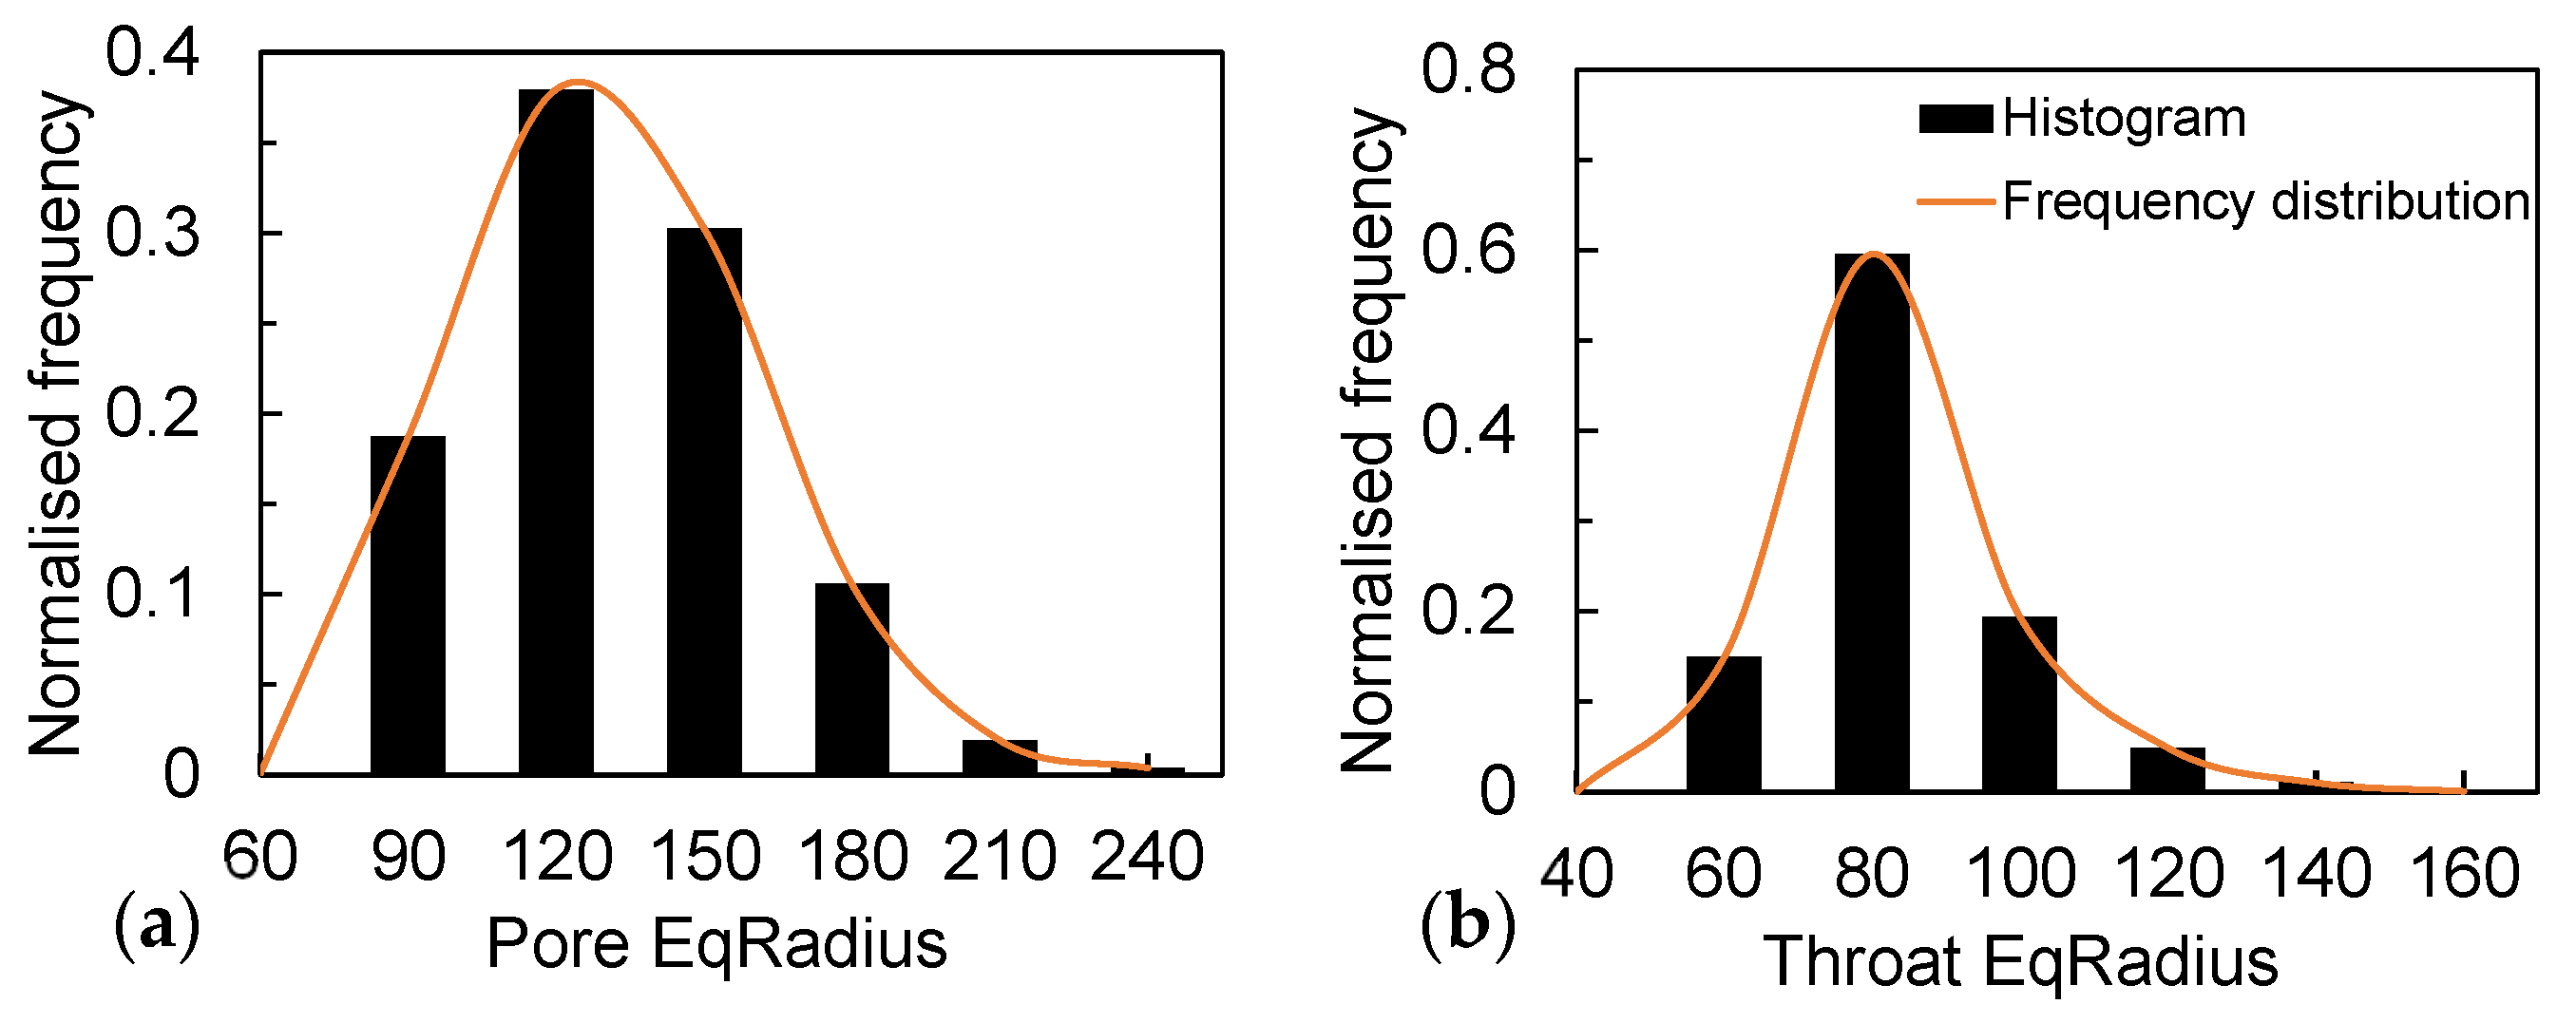
According to the structure, the measured average porosity is 0.40, and the sphericity is 0.81. A pore network model was developed to extract the throat diameter and the pore diameter distribution. The pore-throat diameter distributions, as shown in Figure 9, indicate that their average diameters are 132 μm and 85 μm, respectively. Meanwhile, in the Ottawa sand, where the median particle size is close to 300 μm, most of the pore/throat diameters are below 150 μm. This is due to the irregularity of the particle shape that makes a large number of dead spots in the soil. This phenomenon promotes the effect of capillary action in porous media, especially at low saturation (Sw < 15%), generating a large amount of solidified water film attached to the particle surface in the media, enhancing the liquid flow through the pore walls and throat [37,38]. This is why the evaporation rate of sandy soil particles with the same particle size is higher than that of glass beads under the same environmental conditions.
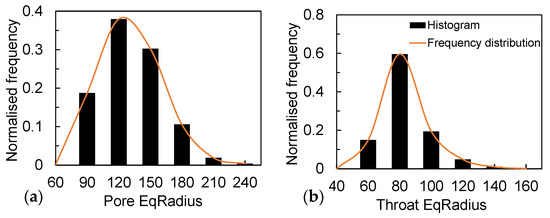
Figure 9.
(a) Distribution of pores in the pore-network model and (b) distribution of throats in the pore-network model.
4.2. Liquid–Vapour Phase Connectivity Analysis
During the evaporation of soil water, the topology of the liquid and vapour phase changes significantly and significantly affects the pore water migration and vapour diffusion. The Euler numbers of fluids, both liquid and vapour phase, calculate fluid clusters and intrinsic loops and reflect evaporation source and diffusion path characteristics. The Euler numbers of liquid and vapour phase, respectively, describe how the liquid phase is connected as an evaporation source and how much water vapour is transported in the void to the external environment during evaporation. Therefore, the Euler characteristic number is one of the critical indicators to characterize its conformational and morphological features and reflect the fluid connectivity in porous media. In the case of water as a wetting phase fluid, the Euler characteristic () is defined by Minkowski functionals [39,40]:
where is one of four morphological descriptors (), that is, the integrated Gaussian curvature; is the zeroth Betti number, referring to the number of distinct elements of the liquid ganglia; is the first Betti number, corresponding to the number of redundant loops or holes presented in the objects; and , the second Betti number, indicates the number of enclosed voids in the liquid phase (Table 1 gives the Betti and Euler numbers for the corresponding geometries in terms of typical liquid phase [21]).

Table 1.
Betti and Euler numbers for corresponding geometries of typical liquid phases.
Hence, the Euler number of fluids, either liquid or vapour phase, counts the fluid clusters and inherent loops and reflects the evaporation source features and the diffusion path characteristics. The Euler number of liquid and vapour phase describes how the liquid phase is connected as an evaporation source and how tortuous for water vapour to transport in the air void to the outside environment during evaporation. The shapes and particle sizes of the tested soil samples varied, but the experimental results showed the same trend. As shown in Figure 10, the good complementarity of the solid–liquid phase appears in the regular-shaped glass beads and extends to sandy soil particles and various porous rocks [39]. However, due to the uneven shape and rough surface of the sandy soil, some smaller blocks of liquid–vapour phase were produced in the interstices of the particles, especially at lower saturations. So, we selected more experimental points at low saturation to accurately reflect the trend of liquid–vapour phase connectivity. The experimental results have some scatter, but the overall trend line has been clearly shown.
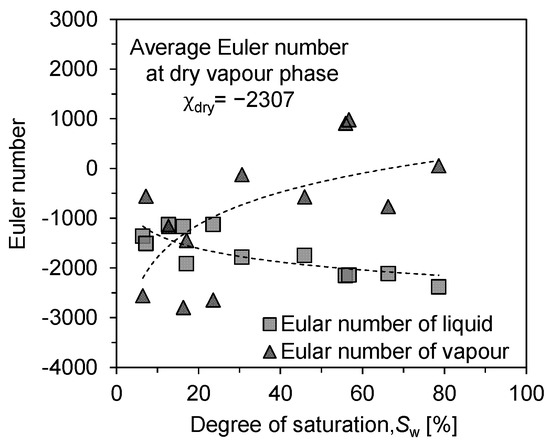
Figure 10.
Connectivity analysis of liquid and vapour phase: evolution of Euler characteristic number with saturation.
4.3. Evolutionary Trend of l–v Interface
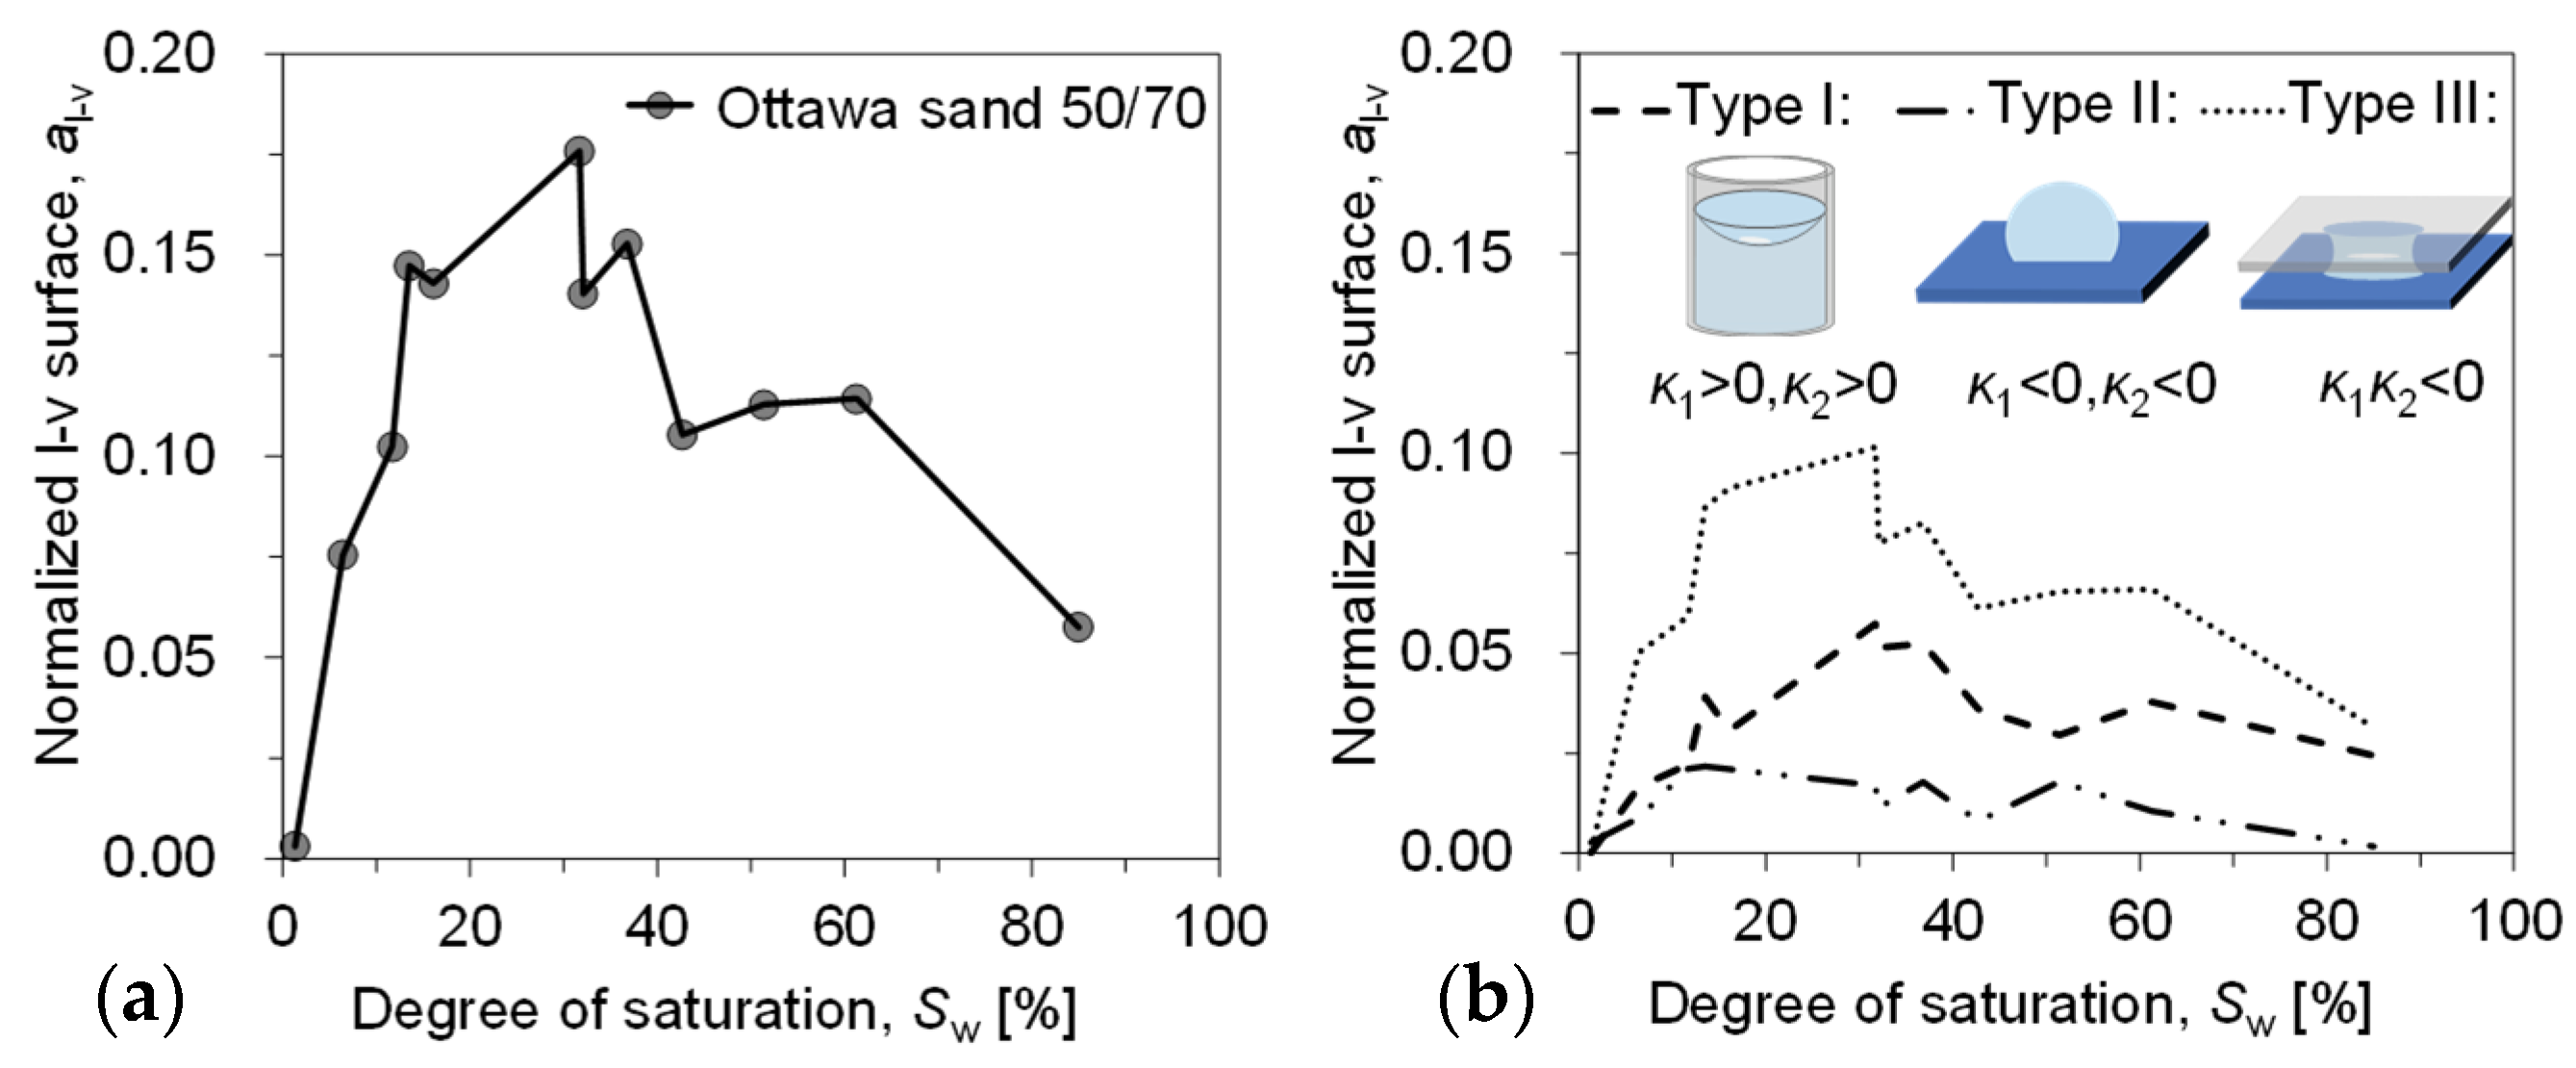
As phase boundaries/contact surfaces, the liquid–vapour and solid–liquid interface both play crucial roles in the mechanical and thermal behaviour of porous media, such as interparticle stress [41], as well as enhanced vapour diffusion and heat transfer [42,43]. The area of the l–v interface is calculated from the segmented image and classified according to the principal curvature. To mitigate the influence of sample size on the area, the liquid–vapour (l–v) interface area is divided by the solid area of the corresponding sample (with each sample having an equal porosity), resulting in a normalized interface area , which is modified in this study by considering the l–v interface [44,45], where the upper surface of the soil sample is in direct contact with the air. The surface area of the liquid phase of the first slice (the vapour–liquid interface in direct contact with the atmosphere), i.e., , was supplemented, and the evolution with saturation is shown in Figure 11. has a small value of 0.058 at the beginning of evaporation (Sw = 85.0%) and it keeps increasing nonlinearly until it reaches the peak value of 0.176 around the saturation of 31.7%. The same trend was also found in our experiments with glass beads [10]. The evolution of the internal interface during evaporation of sandy soils is directly investigated and its effect on the evaporation rate can be discussed in relation to the curvature of the interface.
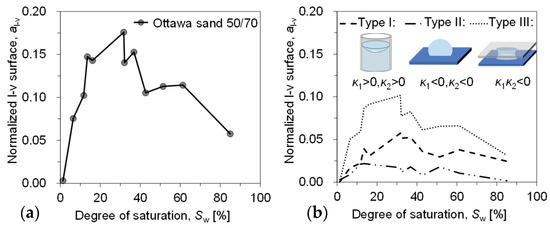
Figure 11.
Variation in l–v interface area with a saturation: (a) all internal interfaces and (b) interfaces categorised according to morphology.
Forming more liquid ganglia (liquid bridges, liquid rings, etc.) in the interparticle pore space increases the interparticle forces and enhances heat transfer and evaporation fluxes. To study the trend of interparticle forces in solids, we discuss the trend of the mean curvature of l–v after classifying them according to their morphology separately and thus apply while Young–Laplace equation Laplace equation to establish the relationship between capillary pressure and mean curvature [23,24].
Based on careful observation, the form of the l–v interface of the sample during the whole soil water evaporation process can be classified according to the principal curvature as follows: annular liquid bridge (Type III: < 0), porous liquid bridge (Type I: > 0, > 0) and attached droplet/isolated liquid ring (Type II: < 0, < 0).
Figure 12 visualizes the capillary pressure evolution of the produced ganglia within the soil as evaporation proceeds. The capillary pressure can be calculated using the Young–Laplace equation:
where represents the capillary pressure, is the surface tension of water at the curved liquid interface, and are the principal radii of curvature at the water–air interface. The Young–Laplace equation indicates that the magnitude of capillary pressure at the curved liquid interface can be determined by the liquid’s surface tension and the radius of curvature. The curvature of interface can be directly calculated from accurately extracted interface, thus reflecting the evolution of capillary pressure throughout the entire evaporation process.
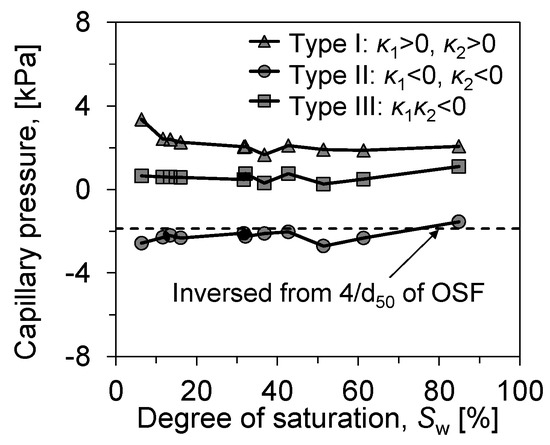
Figure 12.
Evolution of the mean curvature of the l–v interface in soils.
The suction of the liquid ganglia produced in the tested soil samples did not change significantly with evaporation until the remaining stage of evaporation (Sw = 6.4%). On the contrary, at Sw = 6.4%, there was a more pronounced increase in the samples’ curvature radius due to the liquid ganglia’s inability to maintain their morphology at more minor saturation levels. the l–v interface shrinks to smaller pores, corresponding to a larger capillary pressure, until it breaks down.
Attached droplets and porous liquid rings, which are more affected by saturation, are associated with particle diameter, especially attached droplets. We back calculated the capillary pressure of droplets produced by particles of the three soils by d50 (), and the results showed a good correlation, while the pressure of the liquid bridges did not vary significantly throughout the evaporation process. The liquid bridge, the dominant form in evaporation, develops throughout the evaporation process. By its capillary pressure, it can be seen that the development of liquid bridge morphology is more stable in soil samples. The capillary pressure of the meniscus within the pores changes more gradually at higher saturations but contracts more sharply at lower saturations. This phenomenon aptly illustrates the sequence of air invasion during the evaporation process: when the evaporation source is abundant, air tends to and preferentially occupies the larger pores that are easier to breach, with the shapes of the meniscus in smaller pores being more similar. It is not until the saturation becomes lower that the invasion begins towards the meniscus in smaller pores, thereby increasing the breakthrough capillary pressure correspondingly.
By comparing the classified results, we can more intuitively understand the trend of interparticle forces during soil and water evaporation and more deeply understand the contribution of the l–v interface to evaporation.
5. Conclusions
This study employs X-ray μ-CT technology to investigate the l–v interface of porous media at different saturation levels. We tested sandy soils at various saturations, using KI solution instead of pure water to enhance phase contrast and obtain high-quality images. Flickering issues in the image stack were preprocessed with deflicker. For artifacts generated by scanning heterogeneous materials, an interactive machine learning algorithm was used for enhanced recognition, allowing accurate differentiation of phase and characterizing the pore features of the porous medium. However, due to limitations in experimental approaches, this method has yet to be extended to the micropores of silty and clayey soils. From this, the three-dimensional pore structure was reconstructed based on microscopic permeability images, and the liquid–vapour interface was identified and extracted for geometric and topological analysis. Results show that as evaporation progresses, the liquid phase gradually disintegrates into separate entities. We quantified saturation, liquid surface area, interface area, curvature, and phase topology during the pore water evaporation process. The interface area distribution is bell shaped at certain saturation levels, indicating that the area available for evaporation initially increases and then decreases with drying, with the maximum interface area occurring at around 30% saturation. The connectivity of the liquid and vapour phase is complementary, suggesting that availability and accessibility are in competition. During evaporation, the vapour phase, serving as the pathway for evaporation, faces less obstruction, whereas the liquid phase, serving as the source of evaporation, is less abundant. The interface changes with evaporation can be categorized into three types based on the interface morphology: annular liquid bridges, porous liquid bridges, and attached droplets, with trends in capillary pressure changes with saturation for each morphology. The grain size distribution and particle shapes (such as roundness and sphericity) of natural granular soils create narrower pores, thus promoting capillary action.
Research on evaporation mechanisms can be applied in various fields, such as soil moisture conservation in arid regions, seawater desalination, and energy-saving buildings. This study provides detailed interface information on sand to further explore the evaporation mechanism of soil water. It also morphologically classifies previously difficult-to-identify l–v interface, thereby accurately understanding their impact on evaporation. Additionally, it may reveal characteristic relationships between interface curvature radius and intrinsic evaporation rate during soil water evaporation.
Author Contributions
Conceptualization, Y.D.; Methodology, Y.Z. and Y.D.; Software, Y.Z.; Validation, Y.Z.; Formal analysis, Y.Z.; Investigation, Y.Z.; Resources, Y.D.; Data curation, Y.D.; Writing—original draft, Y.Z.; Writing—review & editing, Y.Z. and Y.D.; Visualization, Y.Z.; Supervision, Y.D.; Project administration, Y.D.; Funding acquisition, Y.D. All authors have read and agreed to the published version of the manuscript.
Funding
This research was funded by the National Science Foundation of China (NSFC Grants 42277178).
Institutional Review Board Statement
Not applicable.
Informed Consent Statement
Not applicable.
Data Availability Statement
The raw data supporting the conclusions of this article will be made available by the authors on request.
Conflicts of Interest
The authors declare no conflicts of interest.
References
- Alhosani, A.; Scanziani, A.; Lin, Q.; Foroughi, S.; Alhammadi, A.M.; Blunt, M.J.; Bijeljic, B. Dynamics of water injection in an oil-wet reservoir rock at subsurface conditions: Invasion patterns and pore-filling events. Phys. Rev. E 2020, 102, 023110. [Google Scholar] [CrossRef] [PubMed]
- Huang, Z.; Chen, B.; Mo, X.; Yang, X.; Yu, L.; Hu, X.; Liu, K. Fast Water Evaporation from Nanopores. Adv. Mater. Interfaces 2021, 8, 2100660. [Google Scholar] [CrossRef]
- Mularczyk, A.; Lin, Q.; Blunt, M.J.; Lamibrac, A.; Marone, F.; Schmidt, T.J.; Büchi, F.N.; Eller, J. Droplet and percolation network interactions in a fuel cell gas diffusion layer. J. Electrochem. Soc. 2020, 167, 084506. [Google Scholar] [CrossRef]
- Hu, R.; Wan, J.; Yang, Z.; Chen, Y.; Tokunaga, T. Wettability and Flow Rate Impacts on Immiscible Displacement: A Theoretical Model. Geophys. Res. Lett. 2018, 45, 3077–3086. [Google Scholar] [CrossRef]
- Krevor, S.; Blunt, M.J.; Benson, S.M.; Pentland, C.H.; Reynolds, C.; Al-Menhali, A.; Niu, B. Capillary trapping for geologic carbon dioxide storage—From pore scale physics to field scale implications. Int. J. Greenh. Gas Control 2015, 40, 221–237. [Google Scholar] [CrossRef]
- Lu, Z.; Narayanan, S.; Wang, E.N. Modeling of evaporation from nanopores with nonequilibrium and nonlocal effects. Langmuir 2015, 31, 9817–9824. [Google Scholar] [CrossRef] [PubMed]
- Plawsky, J.L.; Ojha, M.; Chatterjee, A.; Wayner, P.C., Jr. Review of the effects of surface topography, surface chemistry, and fluid physics on evaporation at the contact line. Chem. Eng. Commun. 2008, 196, 658–696. [Google Scholar] [CrossRef]
- Wildenschild, D.; Culligan, K.A.; Christensen, B.S.B. Application of x-ray microtomography to environmental fluid flow problems. In Proceedings of the Optical Science and Technology, the SPIE 49th Annual Meeting, Denver, CO, USA, 2–6 August 2004; pp. 432–441. [Google Scholar]
- Willson, C.S.; Lu, N.; Likos, W.J. Quantification of Grain, Pore, and Fluid Microstructure of Unsaturated Sand from X-ray Computed Tomography Images. Geotech. Test. J. 2012, 35, 1–13. [Google Scholar] [CrossRef]
- Dong, Y.; Wang, L.; Wei, C. Characterization of liquid-vapour interface in pores during evaporation. Water. Resour. Res. 2021, 58, e2021WR031908. [Google Scholar] [CrossRef]
- Lin, Q.; Bijeljic, B.; Berg, S.; Pini, R.; Blunt, M.J.; Krevor, S. Minimal surfaces in porous media: Pore-scale imaging of multiphase flow in an altered-wettability Bentheimer sandstone. Phys. Rev. E 2019, 99, 063105. [Google Scholar] [CrossRef] [PubMed]
- Saba, T.; Illangasekare, T.; Ewing, J. Investigation of surfactant-enhanced dissolution of entrapped nonaqueous phase liquid chemicals in a two-dimensional groundwater flow field. J. Contam. Hydrol. 2001, 51, 63–82. [Google Scholar] [CrossRef] [PubMed]
- Noborio, K. Measurement of soil water content and electrical conductivity by time domain reflectometry: A review. Comput. Electron. Agric. 2001, 31, 213–237. [Google Scholar] [CrossRef]
- Johns, M.; Gladden, L. Magnetic resonance imaging study of the dissolution kinetics of octanol in porous media. J. Colloid Interface Sci. 1999, 210, 261–270. [Google Scholar] [CrossRef]
- Armstrong, R.T.; Pentland, C.H.; Berg, S.; Hummel, J.N.; Lichau, D.; Bernard, L. Estimation of curvature from micro-CT liquid-liquid displacement studies with pore scale resolution. In Proceedings of the International Symposium of the Society of Core Analysts (SCA), Aberdeen, UK, 27–30 August 2012. [Google Scholar]
- Armstrong, R.T.; Porter, M.L.; Wildenschild, D. Linking pore-scale interfacial curvature to column-scale capillary pressure. Adv. Water Resour. 2012, 46, 55–62. [Google Scholar] [CrossRef]
- Culligan, K.; Wildenschild, D.; Christensen, B.; Gray, W.; Rivers, M.; Tompson, A. Interfacial area measurements for un-saturated flow through a porous medium. Water. Resour. Res. 2004, 40, W12413. [Google Scholar] [CrossRef]
- Garing, C.; de Chalendar, J.A.; Voltolini, M.; Ajo-Franklin, J.B.; Benson, S.M. Pore-scale capillary pressure analysis using multi-scale X-ray micromotography. Adv. Water Resour. 2017, 104, 223–241. [Google Scholar] [CrossRef]
- Higo, Y.; Oka, F.; Kimoto, S.; Sanagawa, T.; Matsushima, Y. Study of strain localization and microstructural changes in par-tially saturated sand during triaxial tests using microfocus X-ray CT. Soils. Found. 2011, 51, 95–111. [Google Scholar] [CrossRef]
- Higo, Y.; Oka, F.; Sato, T.; Matsushima, Y.; Kimoto, S. Investigation of localized deformation in partially saturated sand under triaxial compression using microfocus X-ray CT with digital image correlation. Soils Found. 2013, 53, 181–198. [Google Scholar] [CrossRef]
- Wildenschild, D.; Sheppard, A.P. X-ray imaging and analysis techniques for quantifying pore-scale structure and processes in subsurface porous medium systems. Adv. Water Resour. 2013, 51, 217–246. [Google Scholar] [CrossRef]
- Blunt, M.J.; Bijeljic, B.; Dong, H.; Gharbi, O.; Iglauer, S.; Mostaghimi, P.; Paluszny, A.; Pentland, C. Pore-scale imaging and modelling. Adv. Water Resour. 2013, 51, 197–216. [Google Scholar] [CrossRef]
- Andrew, M.; Menke, H.; Blunt, M.J.; Bijeljic, B. the imaging of dynamic multiphase fluid flow using synchrotron-based X-ray microtomography at reservoir conditions. Transp. Porous Media 2015, 110, 1–24. [Google Scholar] [CrossRef]
- Berg, S.; Rücker, M.; Ott, H.; Georgiadis, A.; van der Linde, H.; Enzmann, F.; Kersten, M.; Armstrong, R.; de With, S.; Becker, J.; et al. Connected pathway relative permeability from pore-scale imaging of imbibition. Adv. Water Resour. 2016, 90, 24–35. [Google Scholar] [CrossRef]
- Berg, S.; Ott, H.; Klapp, S.A.; Schwing, A.; Neiteler, R.; Brussee, N.; Makurat, A.; Leu, L.; Enzmann, F.; Schwarz, J.-O.; et al. Real-time 3D imaging of Haines jumps in porous media flow. Proc. Natl. Acad. Sci. USA 2013, 110, 3755–3759. [Google Scholar] [CrossRef] [PubMed]
- Pak, T.; Butler, I.B.; Geiger, S.; van Dijke, M.I.J.; Sorbie, K.S. Droplet fragmentation: 3D imaging of a previously unidentified pore-scale process during multiphase flow in porous media. Proc. Natl. Acad. Sci. USA 2015, 112, 1947–1952. [Google Scholar] [CrossRef] [PubMed]
- Singh, K.; Menke, H.; Andrew, M.; Lin, Q.; Rau, C.; Blunt, M.J.; Bijeljic, B. Dynamics of snap-off and pore-filling events during two-phase fluid flow in permeable media. Sci. Rep. 2017, 7, 5192. [Google Scholar] [CrossRef] [PubMed]
- Reynolds, C.A.; Menke, H.; Andrew, M.; Blunt, M.J.; Krevor, S. Dynamic fluid connectivity during steady-state multi phase flow in a sandstone. Proc. Natl. Acad. Sci. USA 2017, 114, 8187. [Google Scholar] [CrossRef] [PubMed]
- Jackson, S.J.; Agada, S.; Reynolds, C.A.; Krevor, S. characterizing drainage multiphase flow in heterogeneous sandstones. Water Resour. Res. 2018, 54, 3139–3161. [Google Scholar] [CrossRef]
- Reynolds, C.A.; Blunt, M.J.; Krevor, S. Multiphase flow characteristics of heterogeneous rocks from CO2 storage reservoirs in the United Kingdom. Water. Resour. Res. 2018, 54, 729. [Google Scholar] [CrossRef]
- Pini, R.; Krevor, S.C.M.; Benson, S.M. Capillary pressure and heterogeneity for the CO2/water system in sandstone rocks at reservoir conditions. Adv. Water. Resour. 2012, 38, 48–59. [Google Scholar] [CrossRef]
- Rasband, W. ImageJ Software; National Institutes of Health: Bethesda, MD, USA, 1997; Volume 2012.
- Lei, L.; Seol, Y.; Jarvis, K. Pore-scale visualization of methanehydrate-bearing sediments with micro-CT. Geophys. Res. Lett. 2018, 45, 5417–5426. [Google Scholar] [CrossRef]
- Andrew, M.; Bijeljic, B.; Blunt, M.J. Pore-by-pore capillary pressure measurements using X-ray microtomography at reservoir conditions: Curvature, snap-off, and remobilization of residual CO2. Water. Resour. Res. 2014, 50, 8760–8774. [Google Scholar] [CrossRef]
- Arganda-Carreras, I.; Kaynig, V.; Rueden, C.; Eliceiri, K.W.; Schindelin, J.; Cardona, A.; Sebastian Seung, H. Trainable Weka Segmen-tation: A machine learning tool for microscopy pixel classification. Bioinformatics 2017, 33, 2424–2426. [Google Scholar] [CrossRef] [PubMed]
- Sommer, C.; Strähle, C.; Köthe, U.; Hamprecht, F.A. Ilastik: Interactive learning and segmentation toolkit Paper. In Proceedings of the Eighth IEEE International Symposium on Biomedical Imaging, Chicago, IL, USA, 30 March–2 April 2011. [Google Scholar]
- Rad, M.N.; Shokri, N. Effects of grain angularity on NaCl precipitation in porous media during evaporation. Water Resour. Res. 2014, 50, 9020–9030. [Google Scholar] [CrossRef]
- Rad, M.N.; Shokri, N.; Keshmiri, A.; Withers, P.J. Effects of Grain and Pore Size on Salt Precipitation During Evaporation from Porous Media. Transp. Porous Media 2015, 110, 281–294. [Google Scholar] [CrossRef]
- Armstrong, R.T.; McClure, J.E.; Robins, V.; Liu, Z.; Arns, C.H.; Schlüter, S.; Berg, S. Porous media characterization using Min-kowski functionals: Theories, applications and future directions. Transport. Porous. Med. 2019, 130, 305–335. [Google Scholar] [CrossRef]
- Herring, A.L.; Harper, E.J.; Andersson, L.; Sheppard, A.; Bay, B.K.; Wildenschild, D. Effect of fluid topology on residual non-wetting phase trapping: Implications for geologic CO2 sequestration. Adv. Water. Resour. 2013, 62, 47–58. [Google Scholar] [CrossRef]
- Greco, R.; Gargano, R. Anovel equation for determining thesuction stress of unsaturated soils from the water retention curve based onwetted surface area in pores. Water. Resour. Res. 2015, 51, 6143–6155. [Google Scholar] [CrossRef]
- Shahraeeni, E.; Or, D. Pore scale mechanisms for enhanced vapour transport through partially saturated porous media. Water. Resour. Res. 2012, 48, W05511. [Google Scholar] [CrossRef]
- Cass, A.; Campbell, G.S.; Jones, T.L. Enhancement of thermal water vapour diffusion in soil. Soil. Sci. Soc. Am. J. 1984, 48, 25–32. [Google Scholar] [CrossRef]
- Gray, W.G.; Miller, C.T. Elements of Thermodynamically Constrained Averaging Theory. Adv. Water. Resour. 2011, 34, 770–778. [Google Scholar] [CrossRef]
- Hassanizadeh, S.; Gray, W.G. Mechanics and thermodynamics of multiphase flow in porous media including interphase boundaries. Adv. Water Resour. 1990, 13, 169–186. [Google Scholar] [CrossRef]


Disclaimer/Publisher’s Note: The statements, opinions and data contained in all publications are solely those of the individual author(s) and contributor(s) and not of MDPI and/or the editor(s). MDPI and/or the editor(s) disclaim responsibility for any injury to people or property resulting from any ideas, methods, instructions or products referred to in the content. |
© 2024 by the authors. Licensee MDPI, Basel, Switzerland. This article is an open access article distributed under the terms and conditions of the Creative Commons Attribution (CC BY) license (https://creativecommons.org/licenses/by/4.0/).