Article

Enhancing Heartbeat Classification through Cascading Next Generation and Conventional Reservoir Computing

Electrical Engineering Department, University of 20 August 1955, Skikda 21000, Algeria
*
Author to whom correspondence should be addressed.
These authors contributed equally to this work.
Appl. Sci. 2024, 14(7), 3030; https://doi.org/10.3390/app14073030
Submission received: 28 February 2024 / Revised: 2 April 2024 / Accepted: 3 April 2024 / Published: 4 April 2024

Abstract

:
Electrocardiography (ECG) is a simple and safe tool for detecting heart conditions. Despite the diaspora of existing heartbeat classifiers, improvements such as real-time heartbeat identification and patient-independent classification persist. Reservoir computing (RC) based heartbeat classifiers are an emerging computational efficiency solution that is potentially recommended for real-time concerns. However, multiclass patient-independent heartbeat classification using RC-based classifiers has not been considered and constitutes a challenge. This study investigates patient-independent heartbeat classification by leveraging traditional RC and next-generation reservoir computing (NG-RC) solely or in a cascade. Three RCs were investigated for classification tasks: a linear RC featuring linear internal nodes, a nonlinear RC with a nonlinear internal node, and an NG-RC. Each of these has been evaluated independently using either linear ridge regression or multilayer perceptron (MLP) as readout models. Only three classes were considered for classification: the N, V, and S categories. Techniques to deal with the imbalanced nature of the data, such as the synthetic minority oversampling technique (SMOTE) and oversampling by replacement, were used. The MIT-BIH dataset was used to evaluate classification performance. The area under the curve (AUC) criterion was used as an evaluation metric. The NG-RC-based model improves classification performance and mitigates the overfitting issue. It has improved classification performance by 4.18% and 2.31% for the intra-patient and inter-patient paradigms, respectively. By cascading RC and NG-RC, the identification performance of the three heartbeat categories is further enhanced. AUCs of 97.80% and 92.09% were reported for intra- and inter-patient scenarios, respectively. These results suggest promising opportunities to leverage RC technology for multiclass, patient-independent heartbeat recognition.

1. Introduction

Accurate identification and classification of cardiac arrhythmias remains paramount in clinical cardiology, given their well-established association with significant morbidity and mortality [
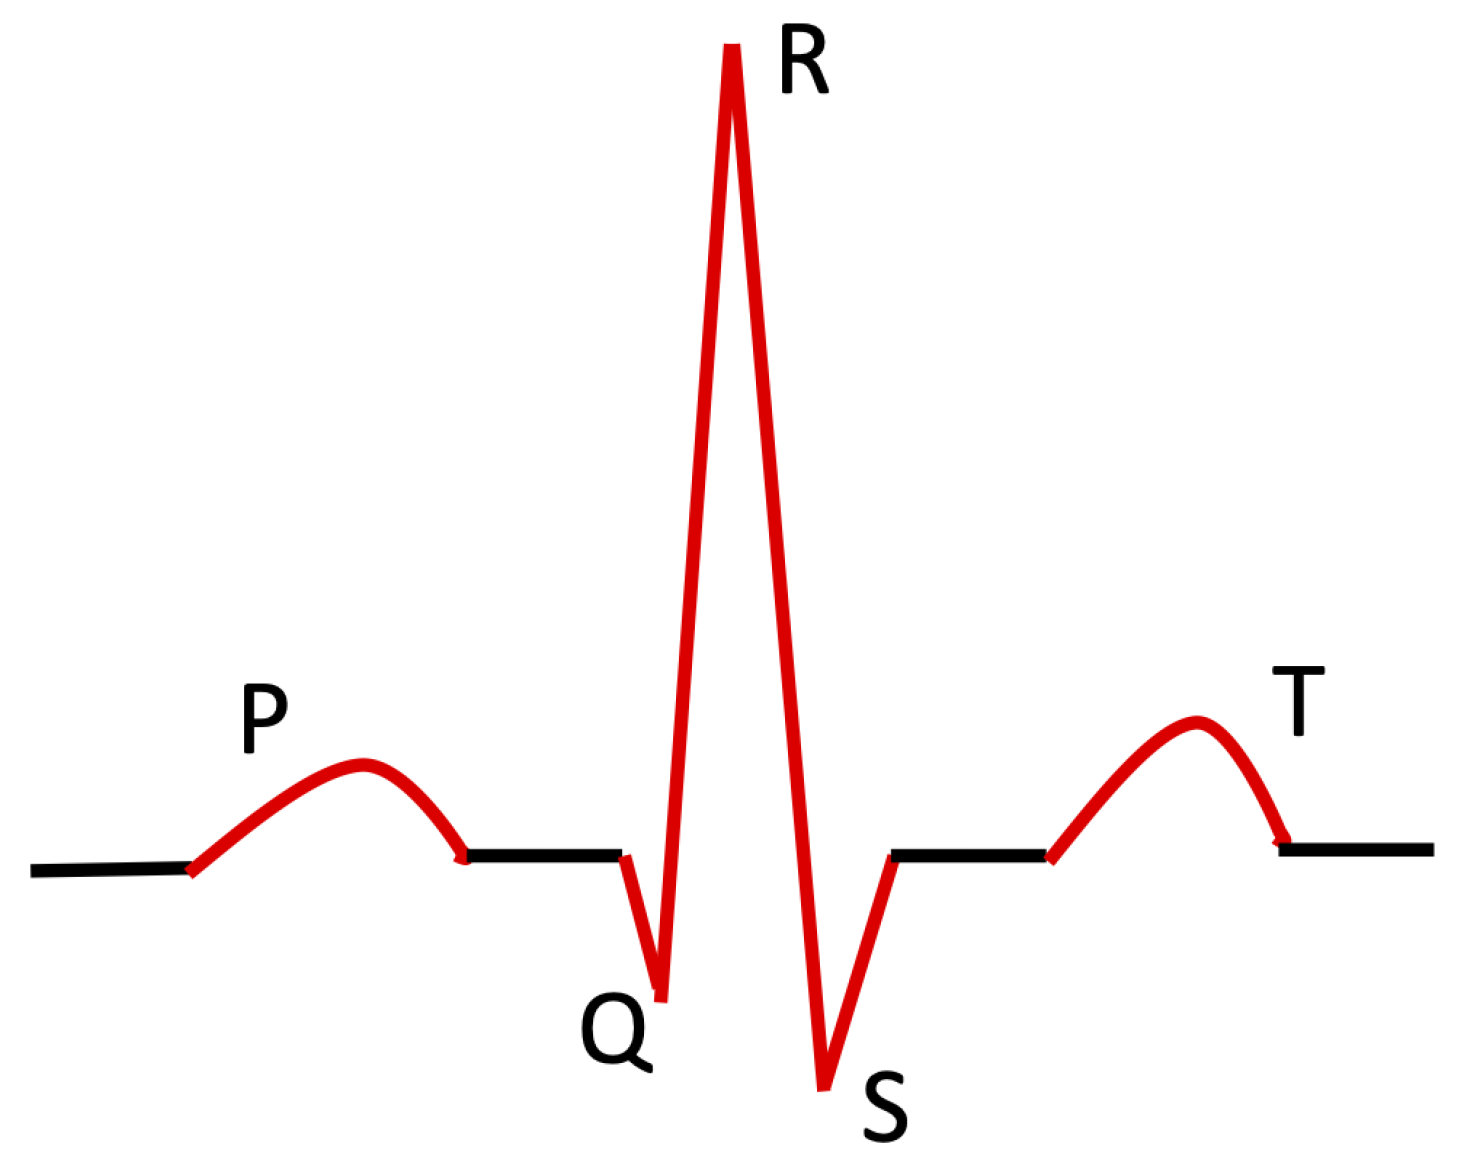
1]. Electrocardiograms (ECGs) offer a noninvasive and readily obtainable window into the electrical activity of the heart, allowing physicians to visually assess for arrhythmias by analyzing characteristic wave morphology, timing, and presence/absence (e.g., P wave, QRS complex, T wave, Figure 1). However, manual analysis, particularly of extended recordings such as Holter ECGs, can be time-consuming, prone to fatigue-induced errors, and potentially limit diagnostic efficiency. To alleviate the burden of time-consuming manual analysis, automatic classifiers that extend the capabilities of human experts have been proposed.
Researchers have developed a plethora of automatic arrhythmia detectors and classifiers following a four-step process. Initially, the ECG signal undergoes a preprocessing stage to eliminate undesirable noise. This endeavor is fulfilled via diverse techniques, including digital filters [2,3], wavelet transforms [4], adaptive filtering [5], and Bayesian filtering [6]. Subsequently, each heartbeat is delineated and discerned on the basis of its QRS complex. The extracted features are utilized for the classifier training process, which represents the third step. The classification process itself represents the final step.
Classification performance is strongly related to the effectiveness of the extracted features and the type of classifier. Traditional arrhythmia classifiers leverage handcrafted features extracted from the raw ECG signal across various domains.
Morphological features, such as the amplitude and duration of different waves, can be extracted from the time domain of the ECG signal [7,8,9,10,11]. Various classifiers trained on this category of features have been proposed. For instance, a decision tree-based classifier trained to recognize six arrhythmia types achieved an accuracy of 99.51% [7]. Similarly, a linear discriminant analysis (LDA)-based classifier produced an accuracy of 94.03% when used to discriminate between six types of heartbeat [8]. In [12], authors use cluster analysis to separate the five arrhythmia types. An accuracy of 94.00% is reported. An accuracy of 99.40% is realized using a regression neural network-based classifier to distinguish 5 types of arrhythmia [9]. Authors in [13] performed a comparative study between four linear classifiers using a combination of R-R interval and morphological handcraft features.
Detailed characteristics of the ECG signals can be obtained by applying the time-frequency domain through wavelet coefficients. In general, classifiers trained on wavelet-based features achieve better performance [14]. Several studies have found that incorporating rhythmic characteristics of the ECG signal, such as R-R intervals, into the feature vector enhances classification performance [15,16]. The nonlinear dynamics of the heartbeat ECG signal were obtained from statistical metrics such as high-order statistics (HOS), which were used to train a fuzzy hybrid neural network-based classifier. An accuracy of roughly 96.00% is registered [17].
Combining features from various domains into a single feature vector is a popular approach for leveraging complementary information captured by each domain. Several studies were developed with various classifiers, achieving enhanced results [18,19]. Comparative studies between morphological-based and frequency-based classifiers have also been presented [20].
These techniques (i.e., classifiers based on handcrafted features) have been largely superseded by emerging approaches, particularly those based on deep learning [21,22,23,24,25,26,27,28,29,30]. These novel approaches automatically extract relevant features that enhance classification accuracy, despite their elusive nature.
Despite the numerous arrhythmia classifiers in the literature [22,23,31,32,33,34,35,36,37,38], some of which have outperformed state-of-the-art methods [22,23,31,32], the need for high-speed and hardware-compatible classifiers still persists.
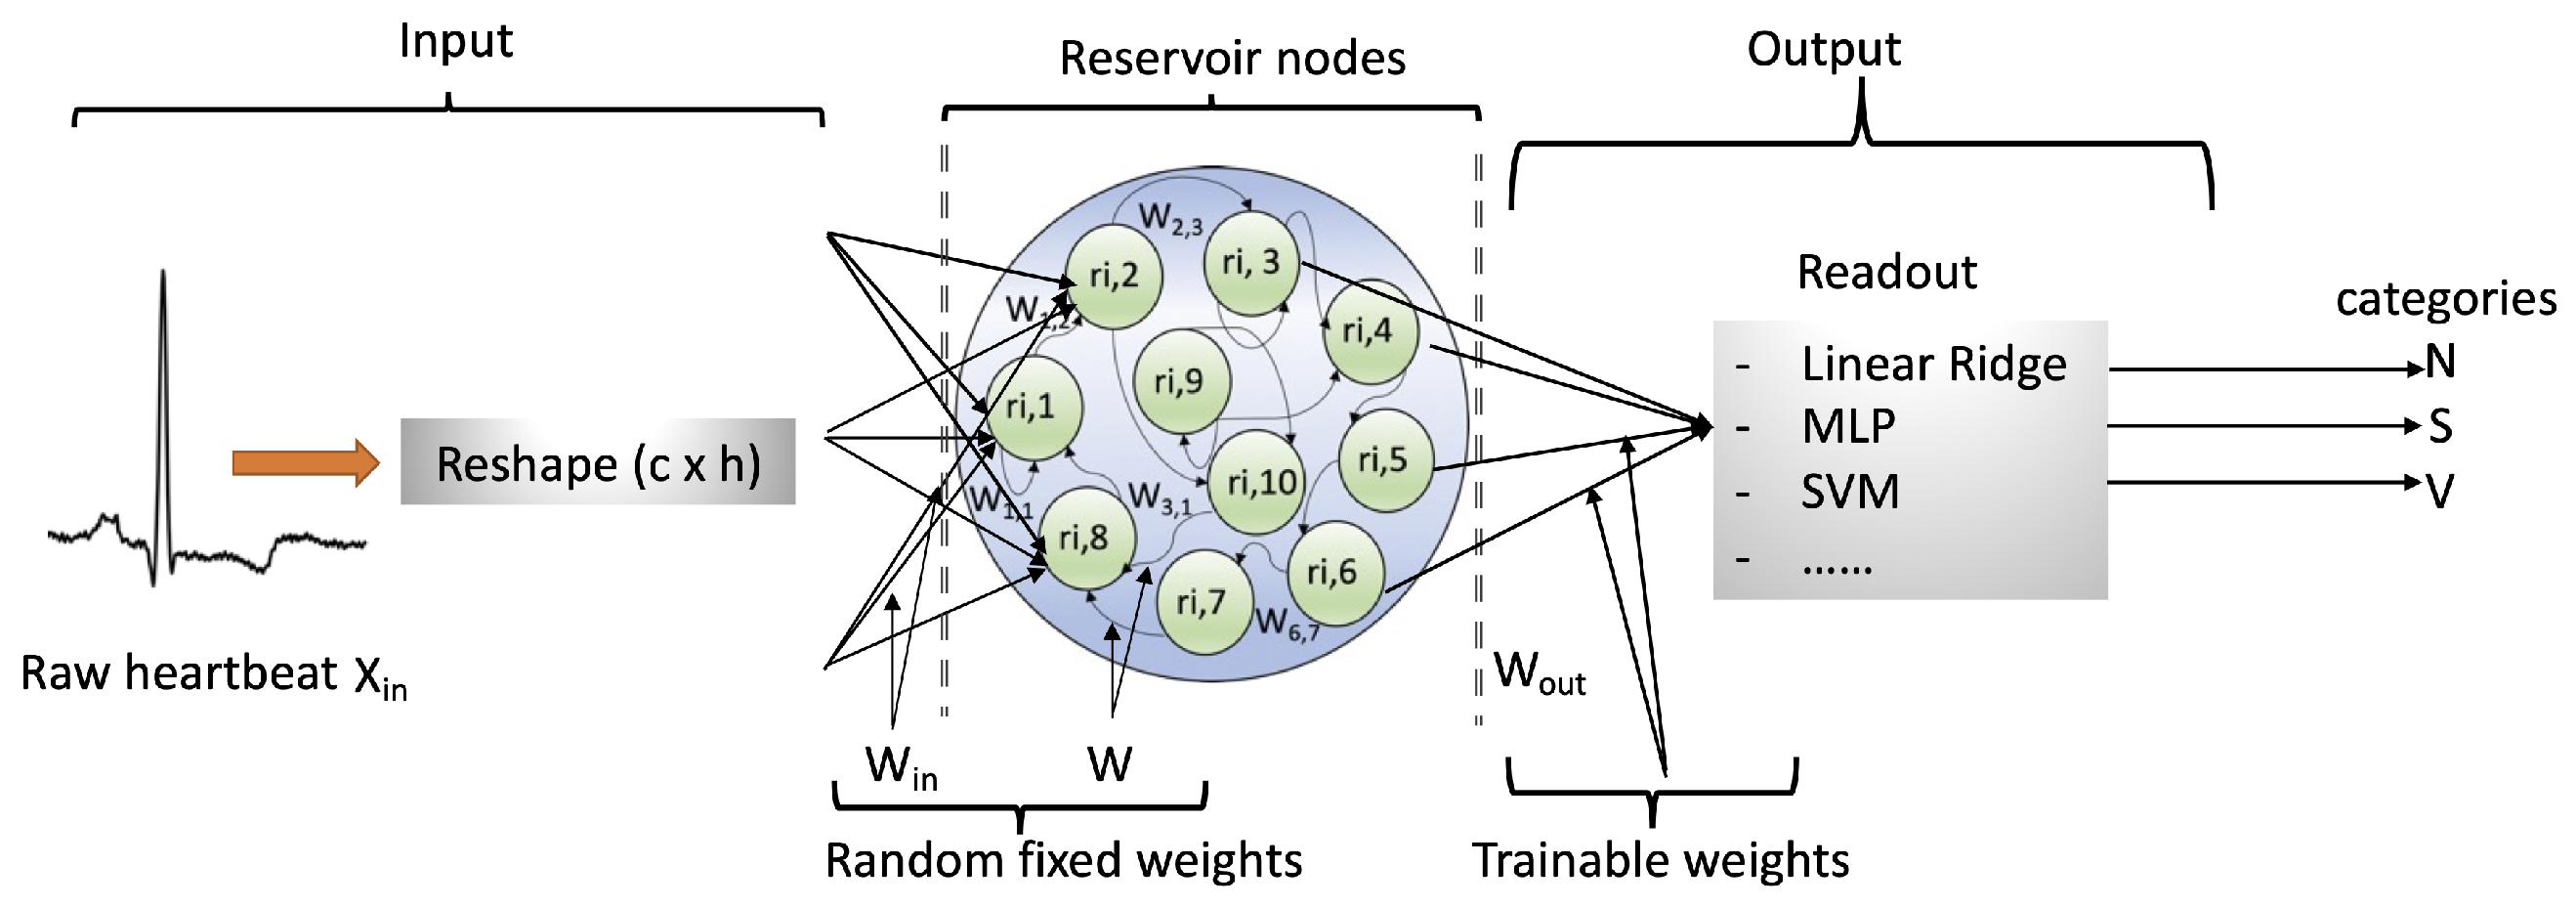
Reservoir computing (RC) models [39,40] provide a potential solution for computation that can overcome the limitations of conventional methods when it comes to execution speed and physical implementation [41,42]. These models present new opportunities and advantages that can improve automatic heartbeat classifiers and relieve various constraints, such as training speed and hardware compatibility. RC models have been widely applied to various applications that involve the analysis of ECG signals. These applications comprise ECG de-noising [43], ventricular heartbeat classification [44], stress detection [45], and arrhythmia detection [46,47].
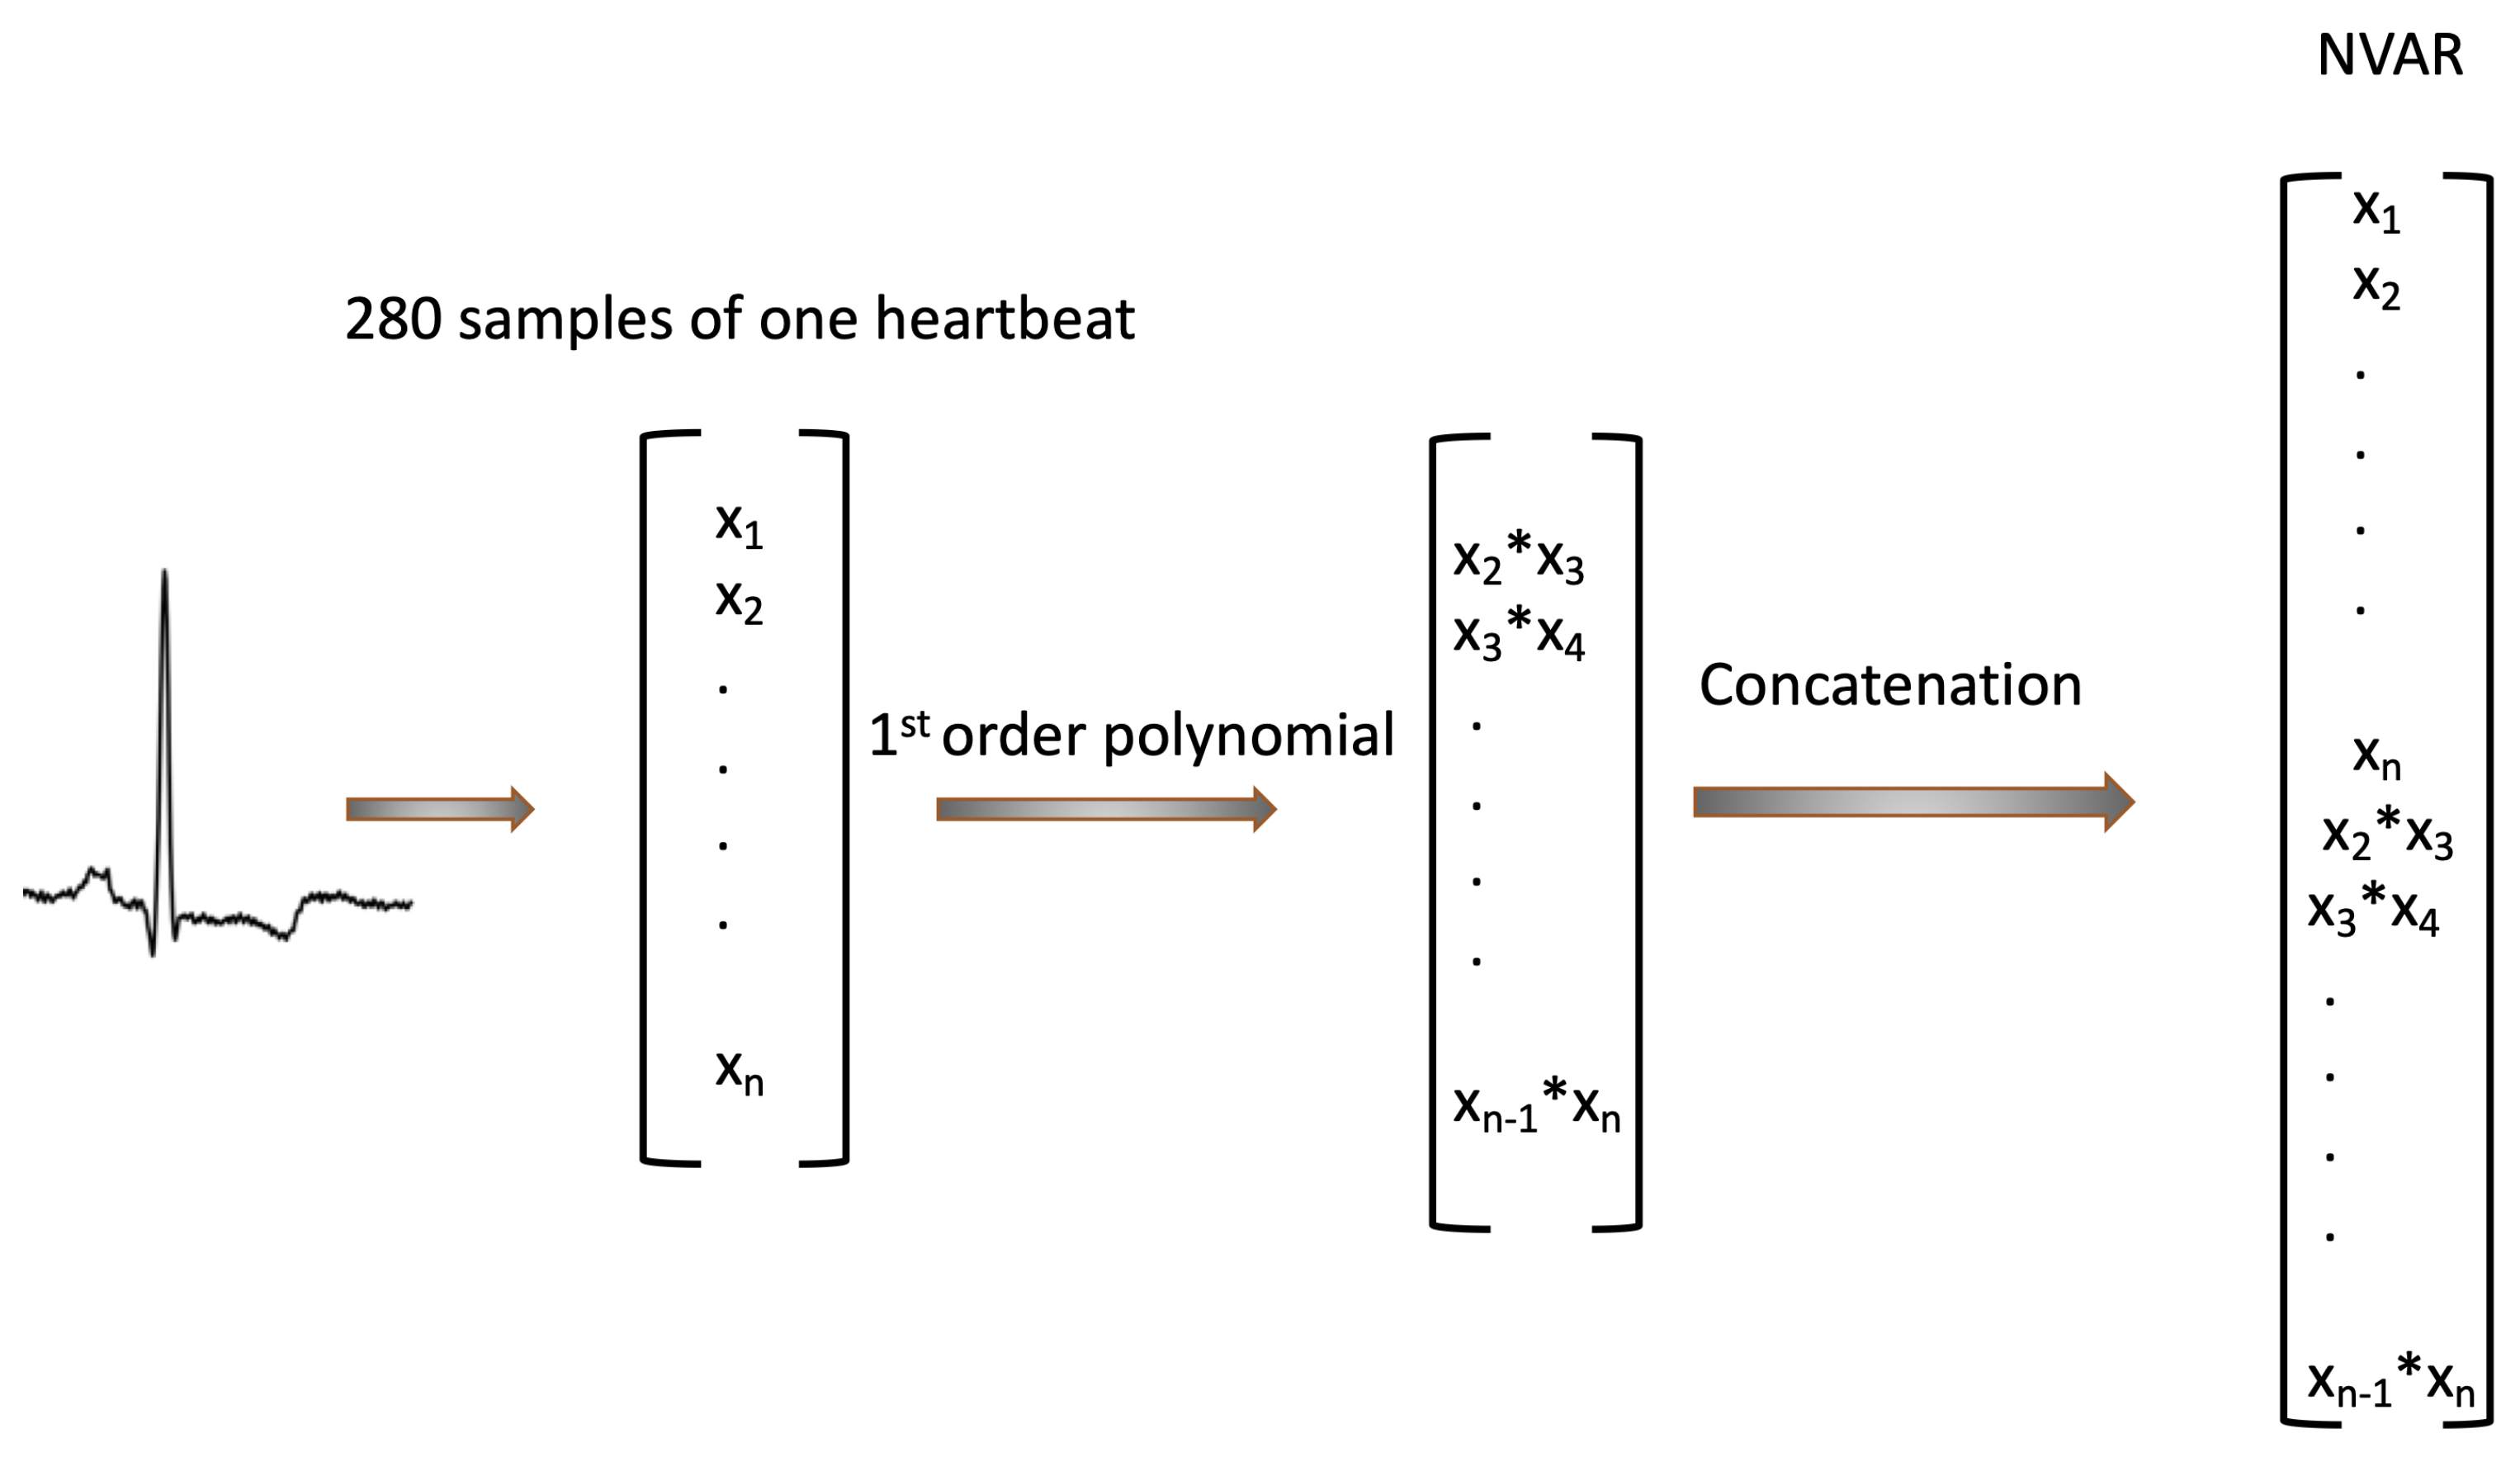
Next-generation reservoir computing (NG-RC) [48], which is based on nonlinear vector auto-regressive (NVAR) transformation, has shown promising results for forecasting complex dynamic systems. Extensive research has been conducted on reservoir computing (RC) [49,50], providing detailed explanations of the remarkable success of RCs and leading to the development of NG-RC. However, there has been insufficient research focused on the utilization of NG-RCs for arrhythmia classification.
RCs are potentially considered for real-time heartbeat classification due to their potential for offering a fast, scalable, and reliable solution [44,46,47,51,
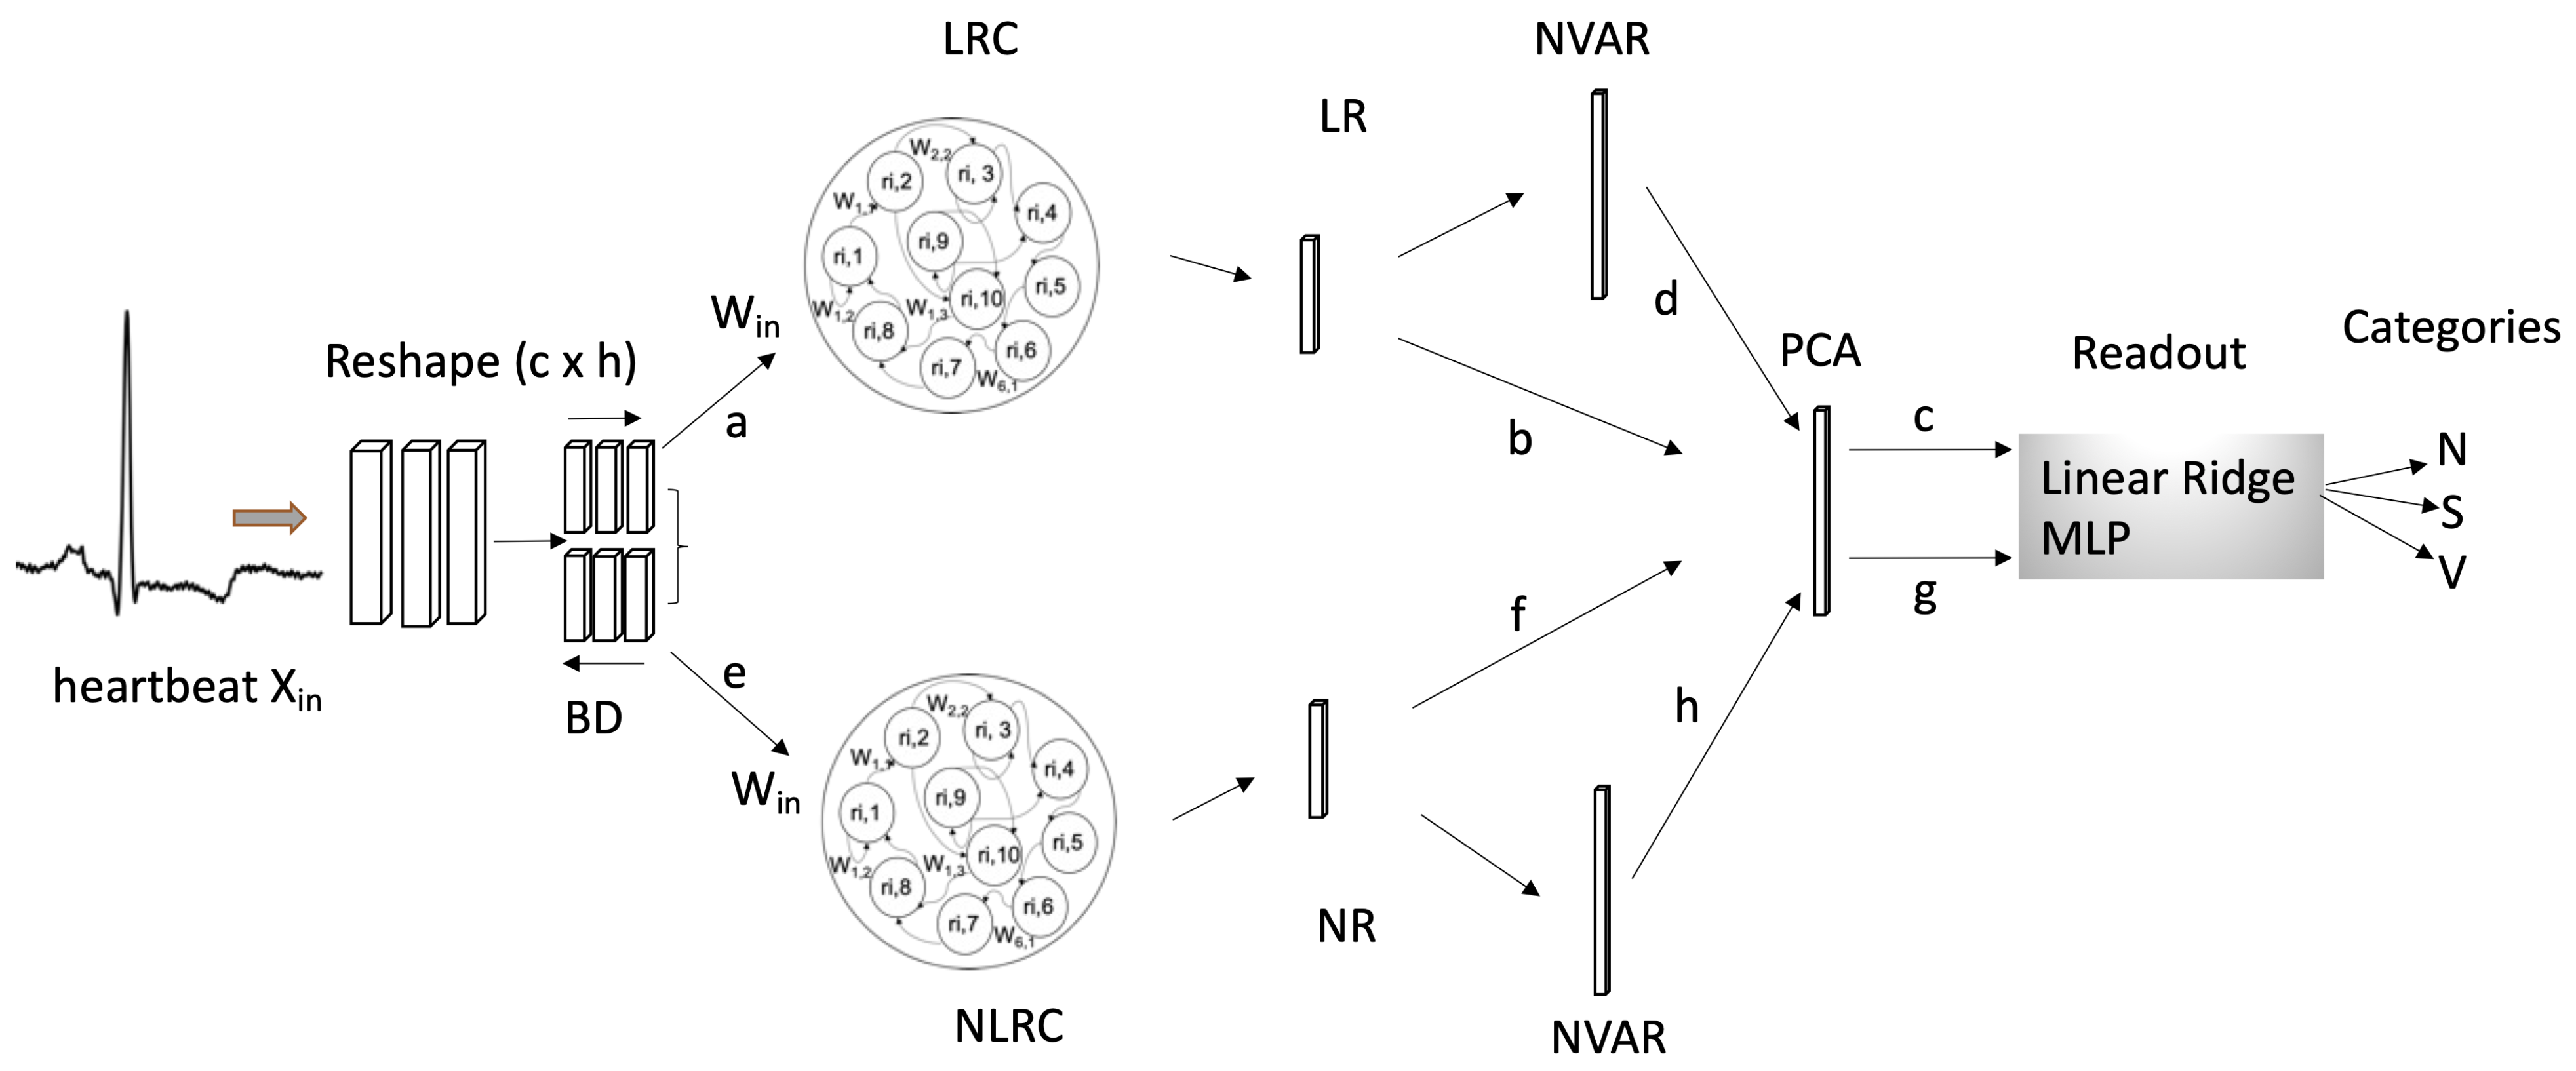
52]. However, they have only been considered for binary classification. Their exploitation for multiclass patient-independent heartbeat classification remains an under-investigated avenue. This study aims to explore traditional RC (linear RC and nonlinear RC) and next-generation RC for multiclass patient-independent heartbeat classification. By cascading RC and NG-RC, the study also aims to improve the classification performance while preserving the inherent RC’s computing potentiality and hardware amenability. This means that RC’s feature extraction and light training processes must not be burdened by additional trainable models.

2. Materials and Methods

2.1. Materials

ECG Database

The MIT-BIH arrhythmia database [53] is used to evaluate the underlying research. It comprises 48 records, each lasting 30 min, obtained over a 10 mV range with an 11-bit resolution and a sampling frequency of 360 Hz. Each file represents a distinct patient’s pathology. In this study, we excluded four files with paced beats and solely analyzed 44 records.
The AAMI EC57 standard [54] recommends organizing heartbeat classes into five distinct categories, as specified in Table 1, namely the N, V, S, F, and Q categories. This study focuses on the classification of three categories: supraventricular (S), normal (N), and ventricular ectopic (V). Figure 2 illustrates the manifestation of four heartbeat categories in one patient ECG signal (record 208).
Each heartbeat is represented by a segment of  D = 280  samples ( X R D ) taken from the raw single lead ECG signal in the time domain. The ECG in each record has been normalized to have a zero mean and a standard deviation equal to one. To ensure accurate heartbeat segmentation, we used precisely annotated QRS complex occurrences from the MIT–BIH database, which effectively eliminates biases introduced by imperfect QRS detection algorithms. This will enable a concise and objective classification performance assessment.

2.2. The Inter- and Intra-Patient Paradigm

To alleviate classification bias and address over-training concerns for inter-patient cases, the database was partitioned into two patient-independent sets according to AAMI EC57 guidelines. Specifically, a training set (Set-1) consisting of records: 101, 106, 108, 109, 112, 114, 115, 116, 118, 119, 122, 124, 201, 203, 205, 207, 208, 209, 215, 220, 223, and 230, as well as a testing set (Set-2) containing records: 100, 103, 105, 111, 113, 117, 121, 123, 200, 202, 210, 212, 213, 214, 219, 221, 222, 228, 231, 232, 233, and 234 are created (Table 2). It is worth noticing that the inter-patient paradigm refers to the situation in which training and testing datasets are not patient-dependent.
In the patient-dependent case or simply intra-patient paradigm, the training and testing datasets are regrouped into one set, shuffled, and subsequently randomly divided into two new sets with a percentage of 70% and 30% for the training and testing processes, respectively.

2.2.1. Data Imbalance and Overfitting Issues

Overfitting occurs when a model exhibits deteriorated classification performance on the unseen data while achieving the highest scores on the training data. For both readouts (i.e., linear ridge and MLP) we leveraged the regularization technique to mitigate this issue. To combat the MIT-BIH imbalance issue, two techniques are used, namely, synthetic minority over-sampling technique (SMOTE) [55]) and oversampling by replacement (REPLICA). The SMOTE technique generates synthetic samples for minority classes by perturbing existing samples using rotation and skew-like operations in their feature space, while the REPLICA technique replicates minority class samples to achieve parity with the majority class in terms of sample count. As depicted in Table 2, the dataset Set-1-Raw (original count), Set-1-SMOTE (dataset Set-1-Raw augmented by SMOTE), and Set-1-REPLICA (dataset Set-1-Raw augmented by REPLICA) are used in the training phase, while Set-2-Raw is used as test dataset.

2.2.2. Reservoir Computing Model

Reservoir computing presents a powerful and efficient framework for various machine-learning tasks, particularly appealing for its computational efficiency, scalability, and flexibility. Due to these distinctive features, RCs have garnered attention in various fields such as control theory [56], classification schemes [57], modeling complex systems [58], and forecasting and prediction schemes [59,60]. They are physically implemented through diverse technologies [61,62]. Consequently, many software frameworks and libraries have been developed and published in the literature [63,64].
Three layers constitute conventional RC models, Figure 3. The input layer receives observed data  X i n ( n ) R D  at time step n, with  D = 280  being the feature number of each heartbeat. Before being broadcast to the reservoir nodes, the data undergoes a reshaping process  ( c × h ) = ( 10 × 28 )  and then is projected onto the input weights  W i n .
The core of the RC is the reservoir (encoder), which has a pool of N internal nodes or states ( r ( n ) ). In general, nodes are fully or partially interconnected by fixed random weights. In response to input data (input data projected onto the input weights), the nodes act like dynamical systems that evolve into novel high-dimensional space states  r ( n + 1 ) R c × N , which are used as representative features of the corresponding input data. In other words, the reservoir acts as a feature extractor. Equations (1) and (2) are the differential equations that govern the evolution of the internal states for linear and nonlinear RC, respectively [50]:
r ( n + 1 ) = ( 1 α ) r ( n ) + α ( W r ( n ) + W i n X i n ( n ) + b )
r ( n + 1 ) = ( 1 α ) r ( n ) + α tanh ( W r ( n ) + W i n X i n ( n ) + b )
where  α  is the decay rate of the node, and b is the bias vector. The hyperbolic tangent function  tanh  provides the RC with the required non-linearity.  W i n  ( D × N ) denotes the input-weight matrix, and W( N × N ) represents the forward and recurrent connection weights between the reservoir’s internal nodes.
The  [ W , W i n ]  (the encoder parameters matrix) are randomly initialized and kept constant during the training process.
The output layer (decoder) could be constructed by various readout mechanisms such as linear regression, support vector machine, or multilayer perceptron. Here, two techniques are investigated, namely linear Ridge regression and MLP.
In the case of linear Ridge readout, the RC states are linearly combined through the output trainable weights (the only trainable parameters of the classifier) to map the input to the desired output (class labels), as outlined in Equation (3):
y ( n + 1 ) = W o u t r ( n + 1 ) + b o u t
where  [ W o u t , b o u t ]  are the decoder weights, and  y ( n )  is the network output.
When the readout is an MLP neural network, the weights  W o u t  designs the MLP weights.

2.2.3. Next-Generation Reservoir Computing

In contrast to traditional RCs, NVAR-based RCs (i.e., next-generation RCs) are straightforward to build and do not entail any computational burden. The input data  X ( n )  is transformed into a novel nonlinear form that encompasses nonlinear parts of the input data, such as squared samples, first-order nonlinear polynomial samples, and the original inputs, Figure 4.
Here, we construct the NG-RC by combining the original input data with its first-order nonlinear polynomial, as shown in Equation (4). We have not taken squared samples in the construction of the NG-RC.
r = [ r ( i , 1 ) , , r ( i , N ) , r ( i , 1 ) × r ( i , 2 ) , , r ( i , n 1 ) × r ( i , n ) ] T
The experiments performed in this study (training and testing processes) were developed using Python 3.11 and Tensorflow 2.12. The software was installed on an MSI laptop with 2.6 GHz, a quad-cores processor, and 16 GB of RAM running under Windows 10.

2.3. Methods

2.3.1. Ng-Rc Based Classifier

First, we investigate NG-RC for the classification process, Figure 5. Before broadcasting the input data into the linear ridge, or MLP, the data is transformed into novel nonlinear features through the NVAR transform, as illustrated in Figure 4.
We evaluated the two readouts (i.e., linear ridge and MLP) on the raw and the NVAR-transformed data to assess how the NVAR transformation affects classification accuracy. Following the path in Figure 5, we obtained four classifiers. They will be referred to as the Original Data + Ridge classifier (path ‘a-b’), Original Data + MLP (path ‘a-d’), NVAR + Ridge (path ‘c-b’), and NVAR + MLP (path ‘c-d’).

2.3.2. Rc Based Classifier

Due to the richness of RC architecture, RC-based classifiers can be constructed in various configurations. For instance, an RC-based classifier is constructed using linear nodes in the reservoir (LRC) and a linear ridge (Ridge) in the readout layer. This classifier is depicted as LRC + Ridge (path ‘a-b-c’) as a naming convention to simplify the designation of all possible combinations. Similarly, NLRC + Ridge (path ‘e-f-c’) is a classifier constructed using nonlinear nodes in the RC reservoir and the linear Ridge in the readout layer. As a result, two additional classifiers can be constructed based on the traditional architecture, namely the classifier LRC + MLP (path ‘a-b-g’), and the classifier NLRC + MLP (‘e-f-g’).

2.3.3. Cascade Based Classifier

When a cascade configuration is considered (i.e., RC in cascade with NG-RC), the NG-RC (NVAR) model will be cascaded with all RC-based classifiers. Four additional classifiers were obtained. Following the naming convention, the classifier LRC + NVAR + Ridge (path ‘a-d-c’) refers to the classifier constructed using linear RC in cascade with NG-RC and a linear Ridge. Finally, eight classifiers were obtained, which are illustrated in Figure 6. A comparative study of the eight classifiers will be performed to select the configuration that achieves the best classification performance.

2.3.4. Performance Evaluation Criterion

Due to the significant class imbalance, that characterizes the MIT-BIH arrhythmia database, we utilized the the Area Under Curve (AUC) criterion as a performance metric for hyper-parameter selection and classification evaluation. We leveraged the AUC criterion during the benchmarking process to select the best classifier because it is a concise single-value metric for overall classification performance and can be easily interpreted and compared. In addition, the AUC is a robust metric for the case of imbalanced datasets, such as the MIT-BIH database.
AUC is calculated by integrating the area under the receiver operating characteristic (ROC) curve over all possible thresholds. The ROC curve plots the true positive rate (TPR) against the false positive rate (FPR) at different thresholds, Figure 7. More information about AUC and ROC can be found in [55,65]. The convergence towards the upper-left quadrant signifies high performance characterized by both high sensitivity and specificity.
The ROC curve reflects the sensitivity (TPR) and specificity (1-FPR) of the model’s classification performance. The accuracy metric cannot be alone employed for evaluating the classification performance of a predictor trained on an imbalanced dataset since it results in a biased evaluation. However, when benchmarking with the literature, we utilized the overall accuracy (ACC) Equation (5), with sensitivity (SEN), Equation (6), positivity (PPV), Equation (7), and specificity (SPEC), Equation (8) metrics so that an unbiased evaluation could be performed. These metrics are commonly used in an imbalanced multi-class heartbeat classification problem.
A C C = T P + T N T N + T P + F N + F P .
S E N = T P T P + F N .
P P V = T P T P + F P .
S P E C = T N T N + T P .

2.3.5. Principal Component Analysis

Since the reservoir produces high-dimensional data, reducing its dimension space before the training process is paramount. Principal component analysis (PCA) [66,67] is a statistical technique that can reduce the dimensionality of data while preserving the most important information. Here, we leveraged the PCA to simplify the complex data generated by the RC. The PCA model projects the RC state’s high-dimensional space (c*N) into a reduced space, referred to as (dim). This parameter (i.e., dim) is selected through a scanning process to be  d i m = 40 .

3. Results

3.1. Classifier Training Process

The proposed classifier has three sets of weights (namely,  W i n , W W o u t , and  b o u t ). However, only the readout weights are trainable ( W o u t  and  b o u t ). A fixed seed value is employed for the pseudo random number generator responsible for initializing the model weights. The algorithm run for 5000 epoch.
To achieve optimal classification performance, the hyperparameters of the classifier components should be tuned.

3.1.1. Rc Hyperparameters Selection

The effectiveness of the RC for feature extraction hinges on a set of crucial hyperparameters, which govern the internal dynamics and representation capabilities of the RC:
  • The number of RC’s internal nodes N, which controls the RC capacity.
  • The spectral radius  ρ , which designs the scaling of the internal connections within the reservoir.
  • The connection percentage  β , which determines the sparsity of connections within the RC’s nodes.
  • The leakage percentage l, which introduces a decay factor to the RC’s internal activations over time.
  • The input scaling  ω , which scales the input data.
Three hyperparameters are considered in the scanning process, namely the spectral radius  ρ , and the internal nodes N. Experiments were conducted for the two spectral regimes of the RC (i.e., LSR ( ρ = 0.1 ) and HSR ( ρ = 0.98 )). Figure 8 and Figure 9 illustrate the results obtained while selecting the conventional RC internal state number N when the Ridge and MLP readouts are considered. Here, ‘dim’ is fixed to 24 features. The remaining hyperparameters are empirically selected. The connection percentage is selected to be equal to  β = 0.98 , the leakage percentage is  l = 0.98 , input scaling is   ω = 0.1 , and noise level is  ξ = 0.001 .
The highest score was obtained when N = 15 in the MLP readout case, whereas N was 55 in the Ridge readout case. However, some classifiers achieve better results for different dim hyperparameter values.

3.1.2. Linear Ridge Training Process

The regularized least-squares regression supervised learning algorithm is used to train the linear ridge parameters  W o u t  and  b o u t . Usually, this is achieved by optimizing the ridge regression loss function, Equation (9), imparting flexibility to RCs in the training process and parameter adjustment while imposing minimal computing resource requirements [57,68]:
[ W o u t * , b o u t * ] = m i n 1 2 W o u t r + b o u t y 2 + λ W o u t
The r’s in the precedent equation represent the reservoir model space proposed in [57].

3.1.3. Linear Ridge Readout Hyperparameters Selection

Linear ridge regression only requires tuning a regularization parameter  λ  to combat overfitting during training. Here, we selected this parameter empirically ( λ = 10 ).

3.1.4. Mlp Training Process

The MLP neural network has four layers: the input layer, two hidden layers, and the output layer. The backpropagation algorithm is used to train the MLP weights. L2 regularization is used to deal with the overfitting phenomenon. Its value has been selected empirically to be  L 2 = 0.001 .

3.1.5. Mlp Readout Hyperparameters Selection

The first layer of the MLP comprises an input layer with a size equivalent to the hyperparameter dim (i.e., 40 neurons). The optimal number of neurons in the first hidden layer is determined through a scanning process evaluated on three activation functions: logistic, tangent hyperbolic (tanh), and Rectified Linear Unit (ReLU). The second hidden layer is empirically set to have 3 neurons. Finally, the output layer consists of 3 neurons, corresponding to the number of categories to be classified. Our experiments reveal that employing 10 neurons in the first hidden layer alongside the ReLU activation function achieves the best performance among the tested configurations, Figure 10.

3.2. Results of the Ng-Rc Based Classification

The results of the first scenario, which focused on the application of NG-RC alone to the classification process, are presented in Table 3. The NG-RC, employed with the MLP-based classifier, achieved the highest AUC scores of 90.33% and 74.79% for intra- and inter-patient cases, respectively. An increase in the AUC score of 5.78% and 0.79% are observed for intra- and inter-patient cases when the NVAR transform was used with MLP readout. Similarly, an enhancement of 4.18% and 2.31% are registered for intra- and inter-patient cases when the NVAR transform was used with ridge readout. Conversely, the ridge readout produced the lowest score when only using the original data. This indicates that the arrhythmia classes are not linearly separable in the feature space, which requires nonlinear schemes. The obtained results of the NVAR+MLP are illustrated in the flowing confusion matrix, Figure 11.

3.3. Results of the Benchmarking Process

A benchmarking process was conducted to evaluate the performance of the eight classifiers performance under the inter- and intra-patient paradigms. First, the results obtained before using data balancing techniques will be presented. Subsequently, the results of applying these techniques will be illustrated.

Results before Data Balance Techniques

The results in Table 4 illustrates that the NLRC+NVAR+Ridge-based classifier with N = 55 and dim = 40 yielded the most pronounced AUC score, achieving 92.09% and 97.80% for the inter- and intra-patient paradigm, correspondingly. The highest AUC score of 76.94% was attained via the LRC+NVAR+MLP-based classifier when MLP-based classifiers were considered. The RC’s hyper-parameters are N = 15 and dim = 24. Figure 12 shows the confusion matrices of the obtained results.

3.4. Results after Data Balance Techniques

Table 5 illustrates the results obtained after data augmentation by the two techniques: SMOTE and REPLICA. the AUC score decreases for all the classifiers presented in the table.

4. Discussion

4.1. Discussion of the Hyperparameters Selection Results

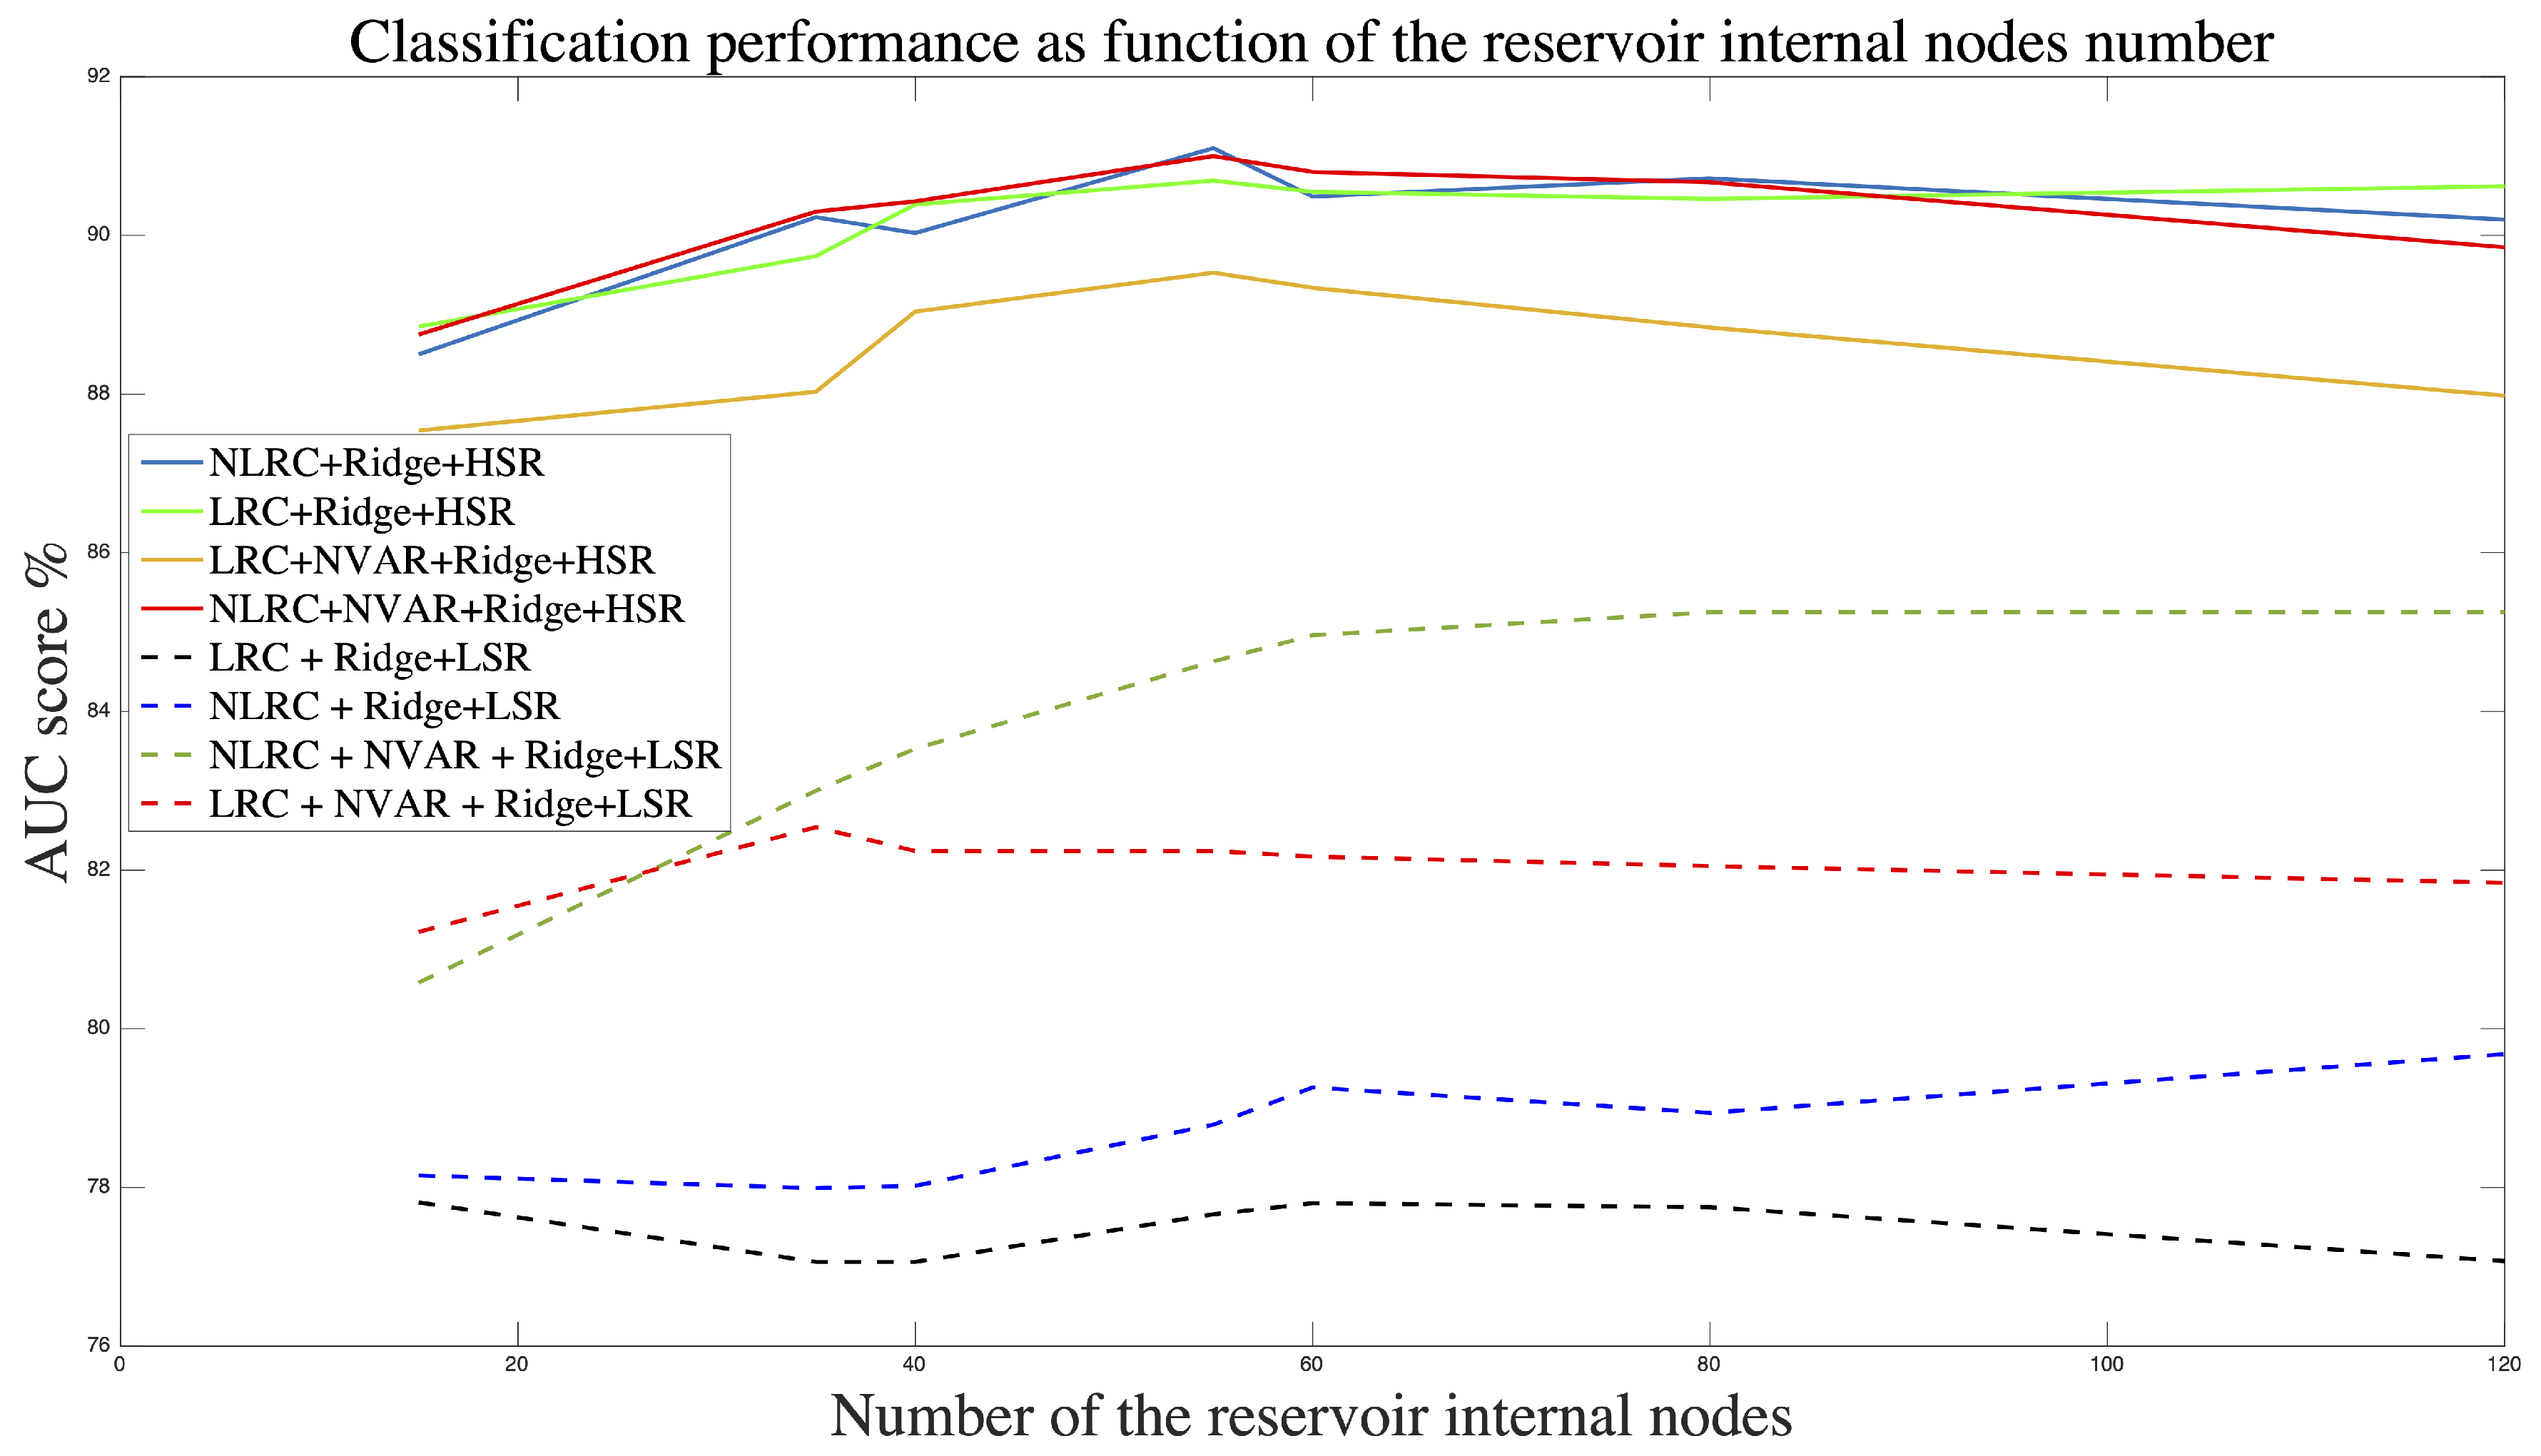
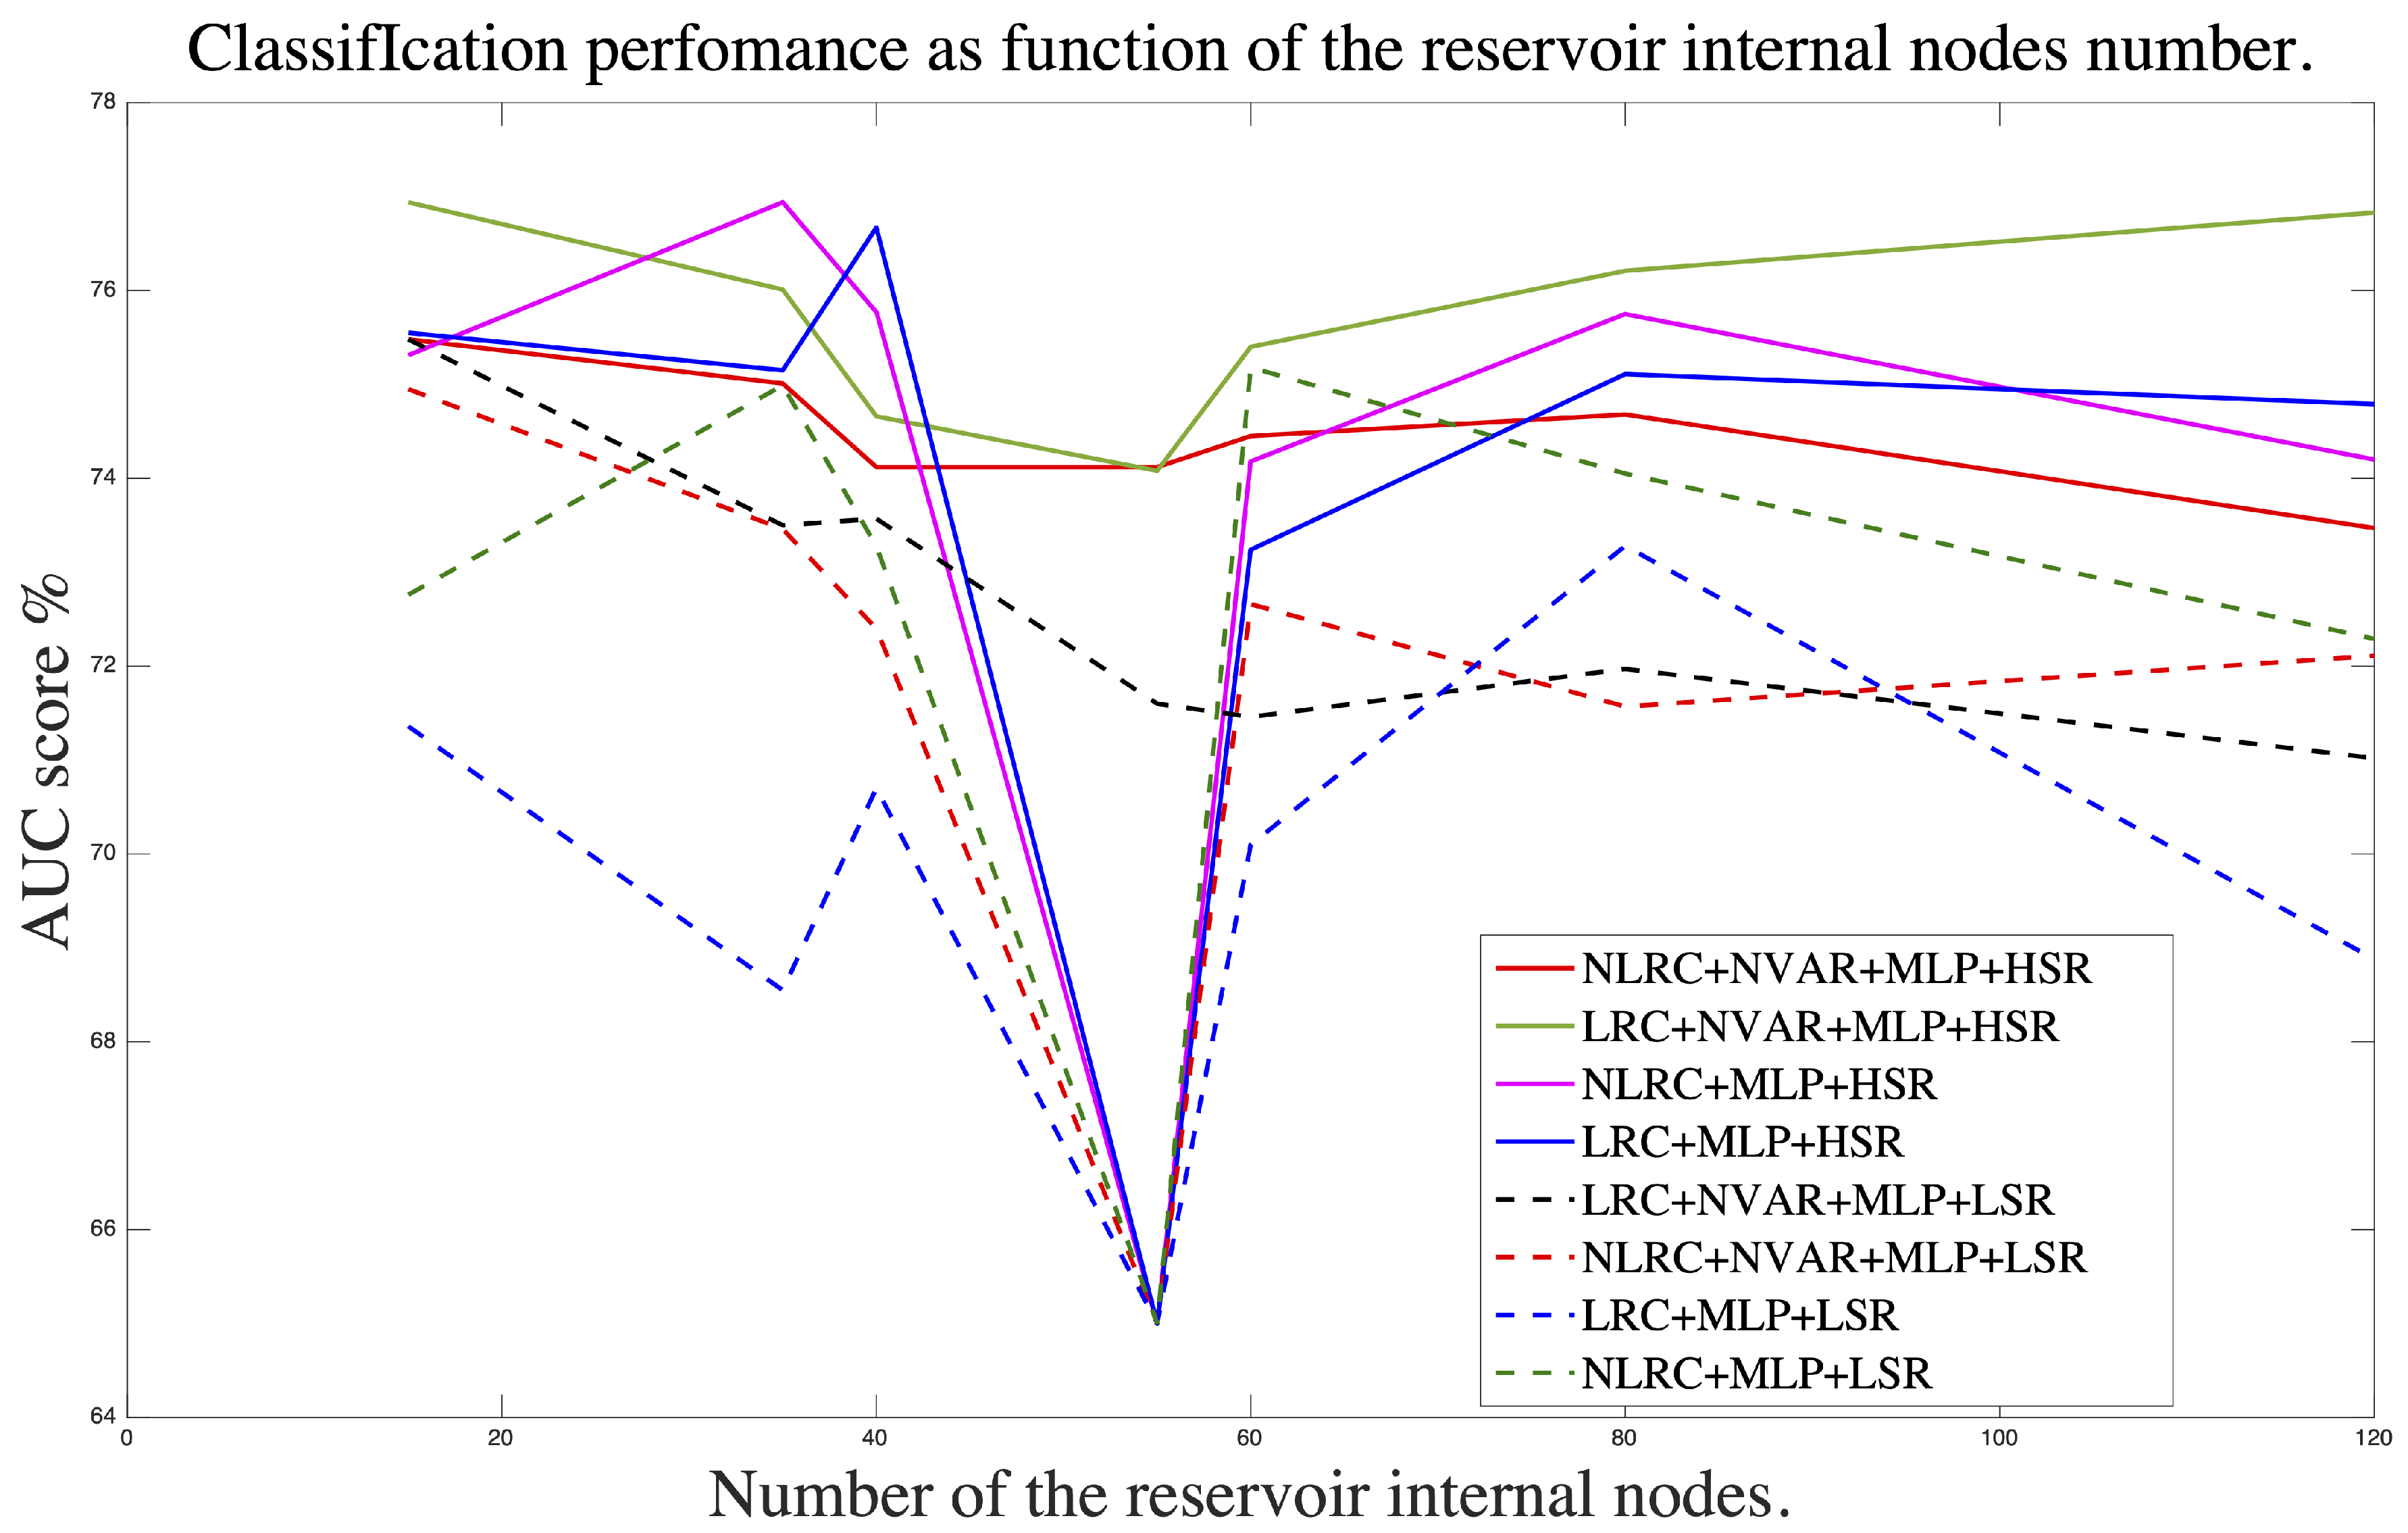
Conventional RCs constructed with LSR exhibit deteriorated classification performance compared with HSR-based RCs. This could be interpreted by the instability and randomness of the RC internal states triggered by HSR configuration. Effectively, arrhythmia category features seem to be projected into more separable regions of the state space, which facilitates their recognition.

4.2. Discussion of the Ng-Rc-Based Classification Results

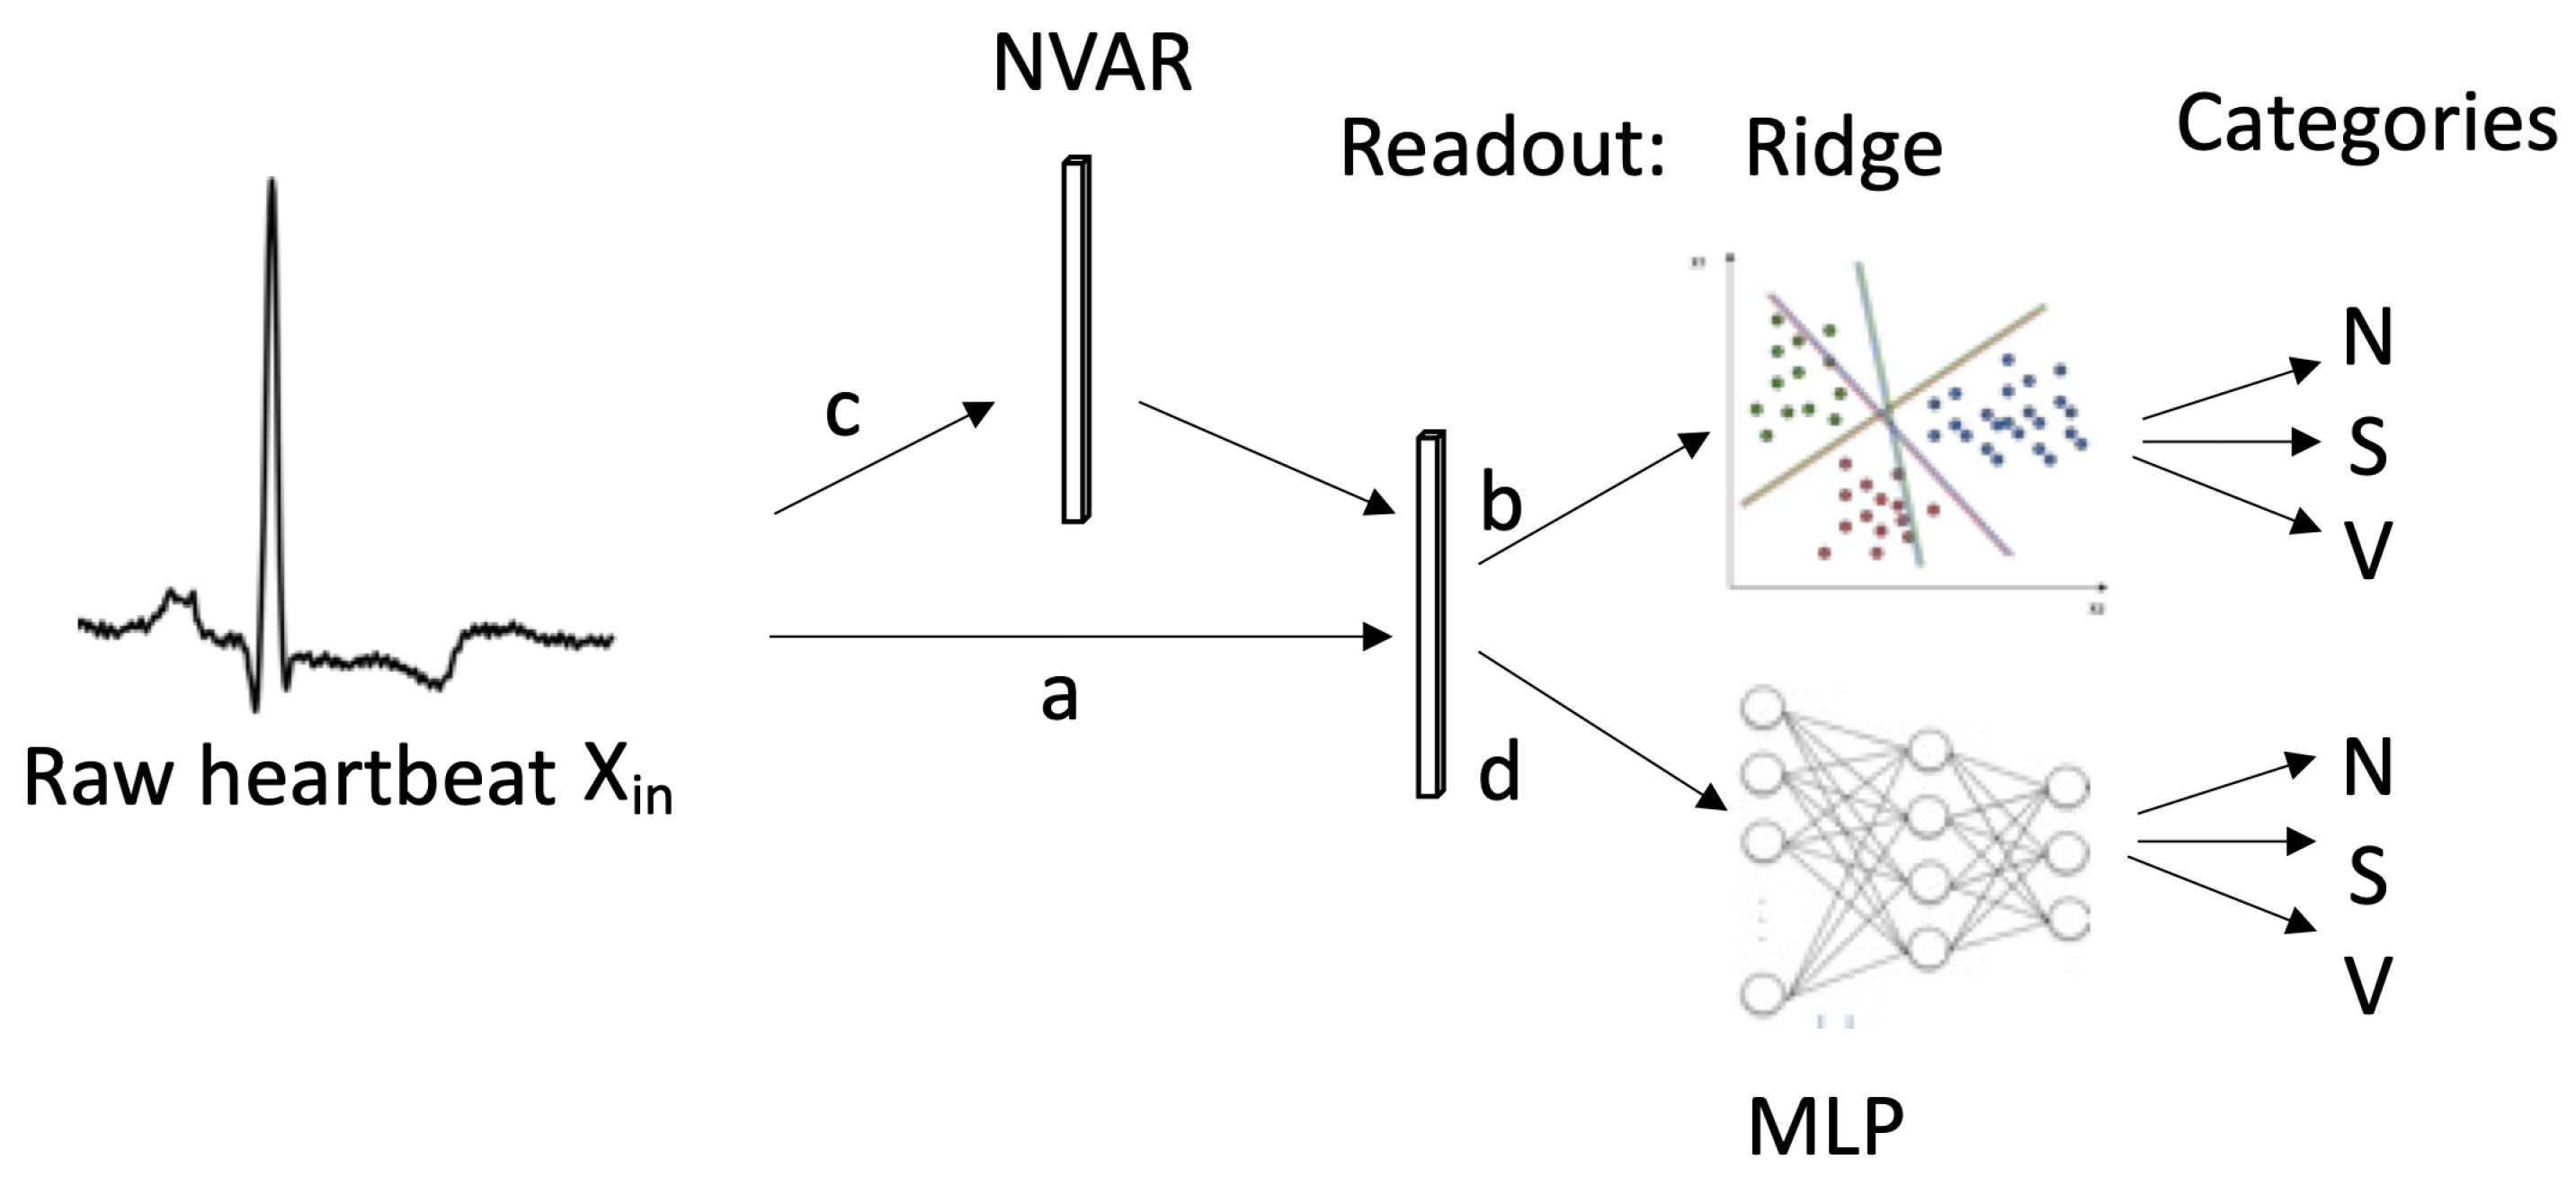
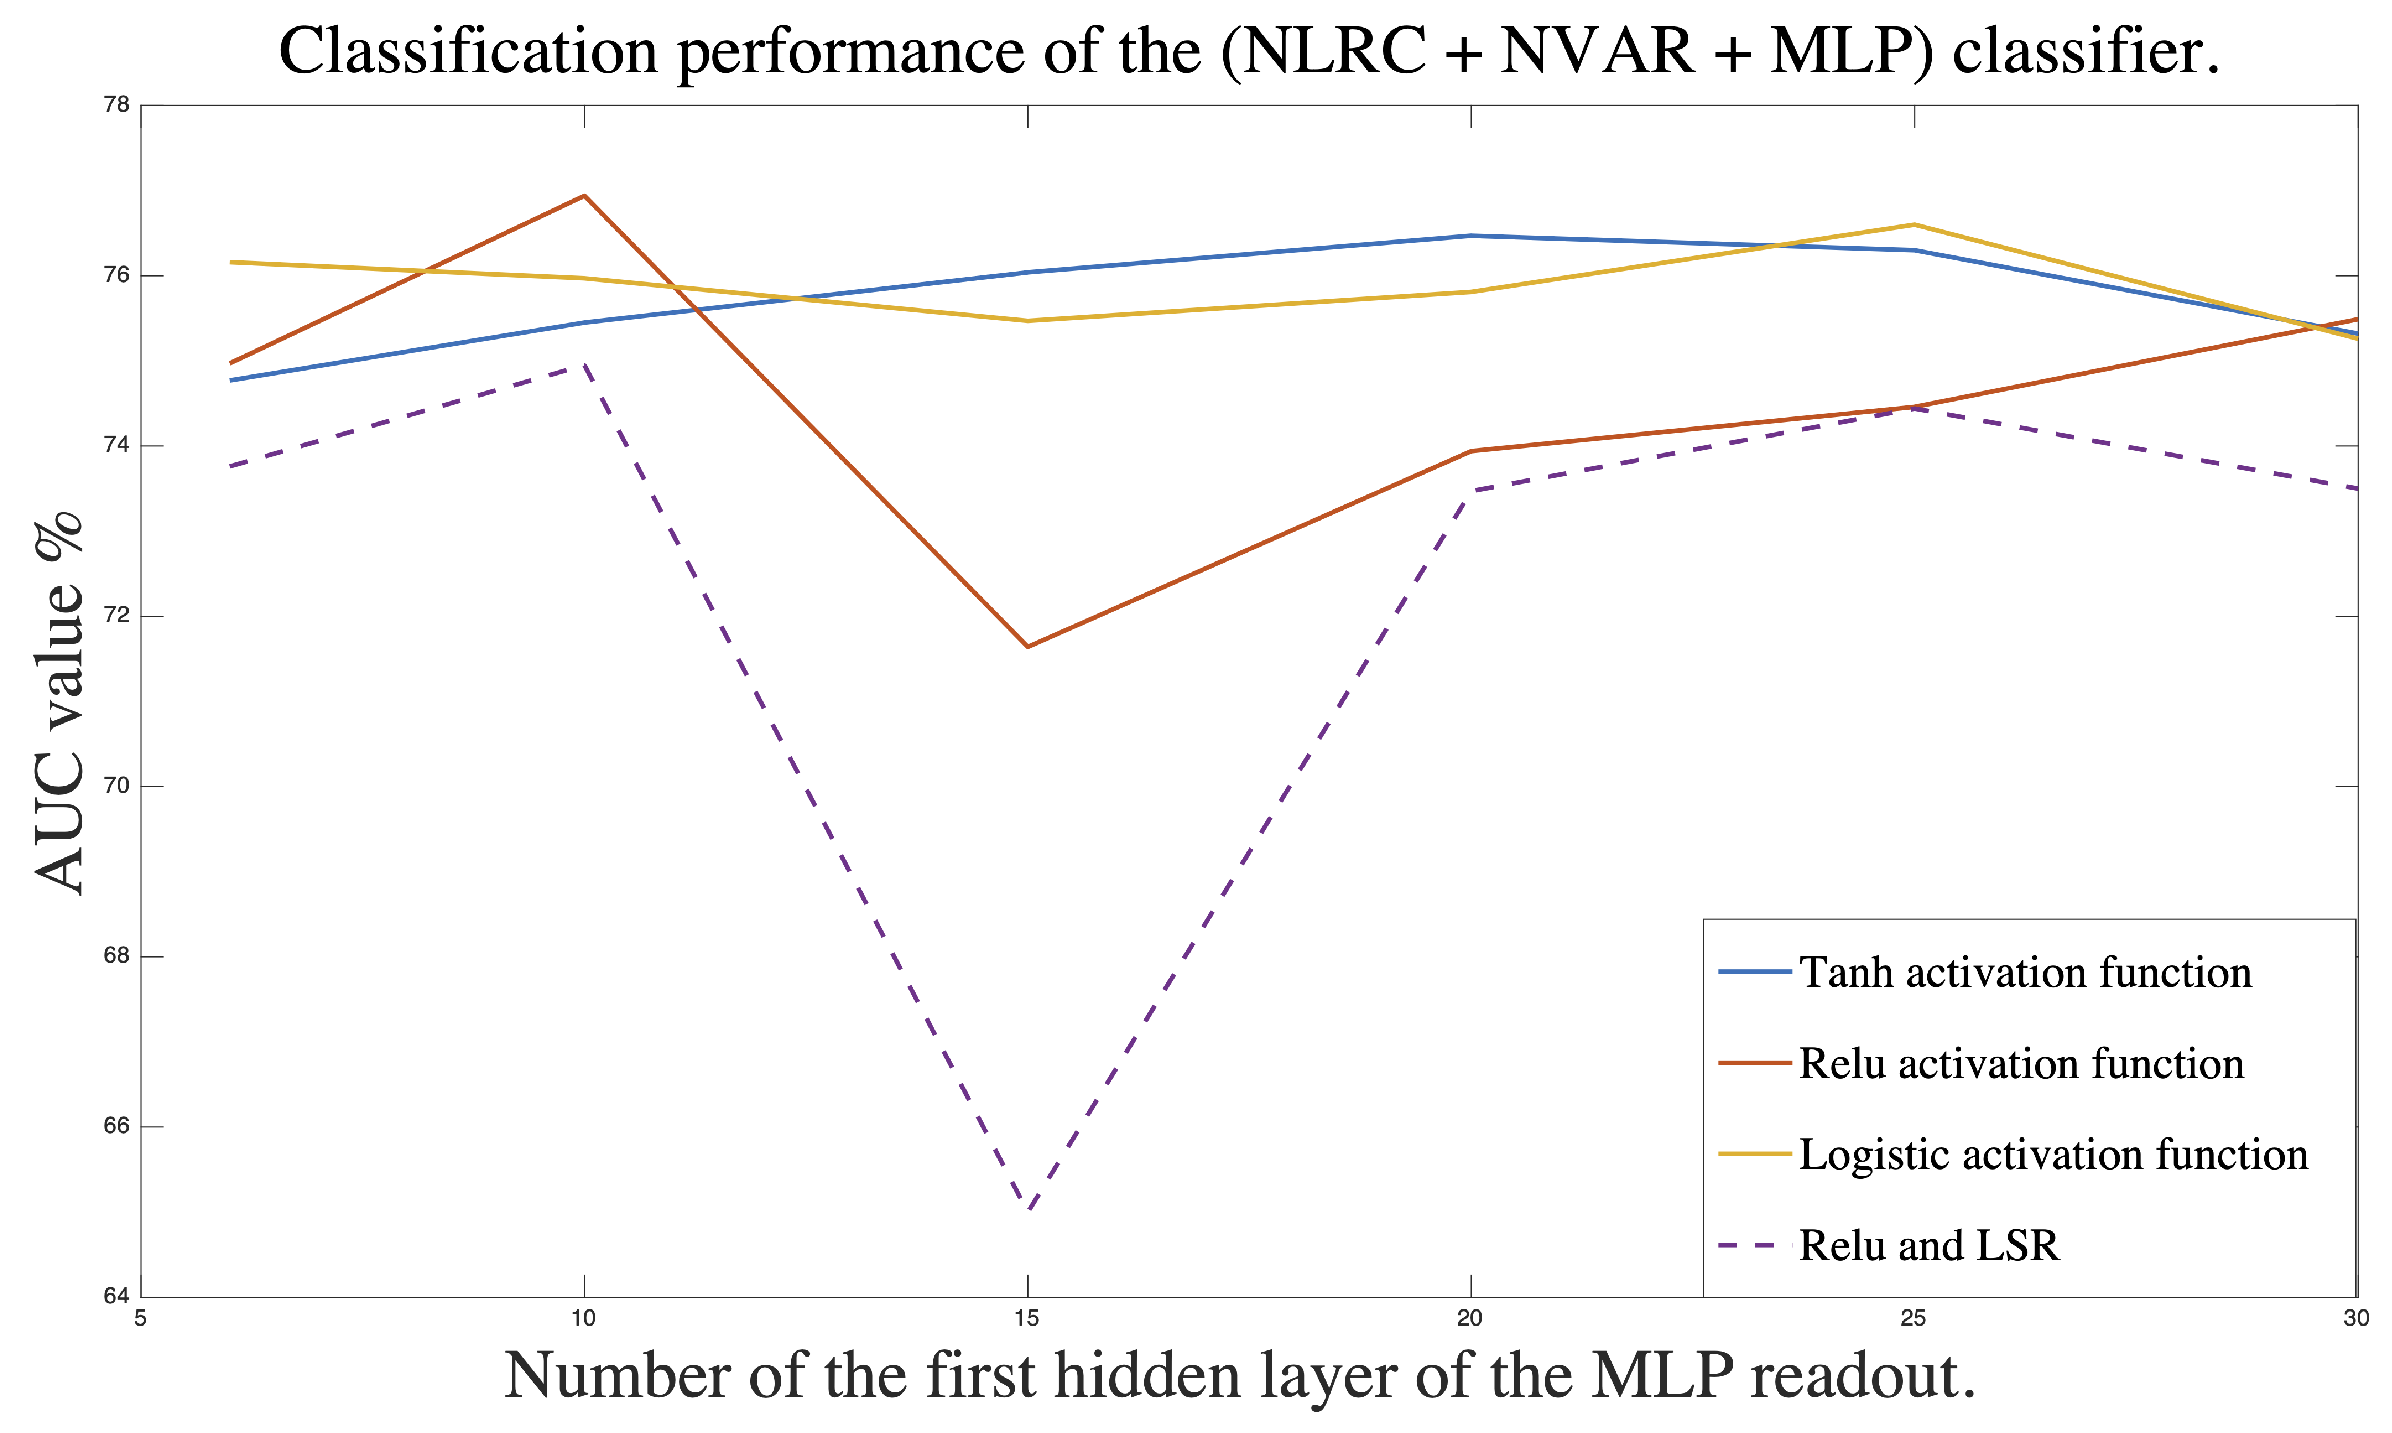
The first paradigm experiment’s findings (NG-RC alone) indicate that the NVAR-based classifier produces better results for both intra- and inter-patient paradigms using linear Ridge and MLP readouts compared with the original data. These outcomes show that NG-RC improves classification performance by providing additional nonlinearity to the linear classifier (NG-RC with a Ridge readout). However, for the nonlinear classifier (NG-RC with MLP readout), the technique tends to overfit the model, which indicates that the greater the nonlinearity over the data, the greater the overfitting.

4.3. Discussion Benchmarking Results

The benchmarking indicates that classifiers constructed using Ridge readouts outperform those based on MLP in both paradigms. Similar to the findings of the first scenario, overfitting phenomena appear when the MLP classifier is considered and are accentuated when combined with the NVAR. In contrast, overfitting is reduced when the Ridge readout is considered.
Typically, inter-patient outcomes are less accurate than intra-patient outcomes. Therefore, the classification results presented in 
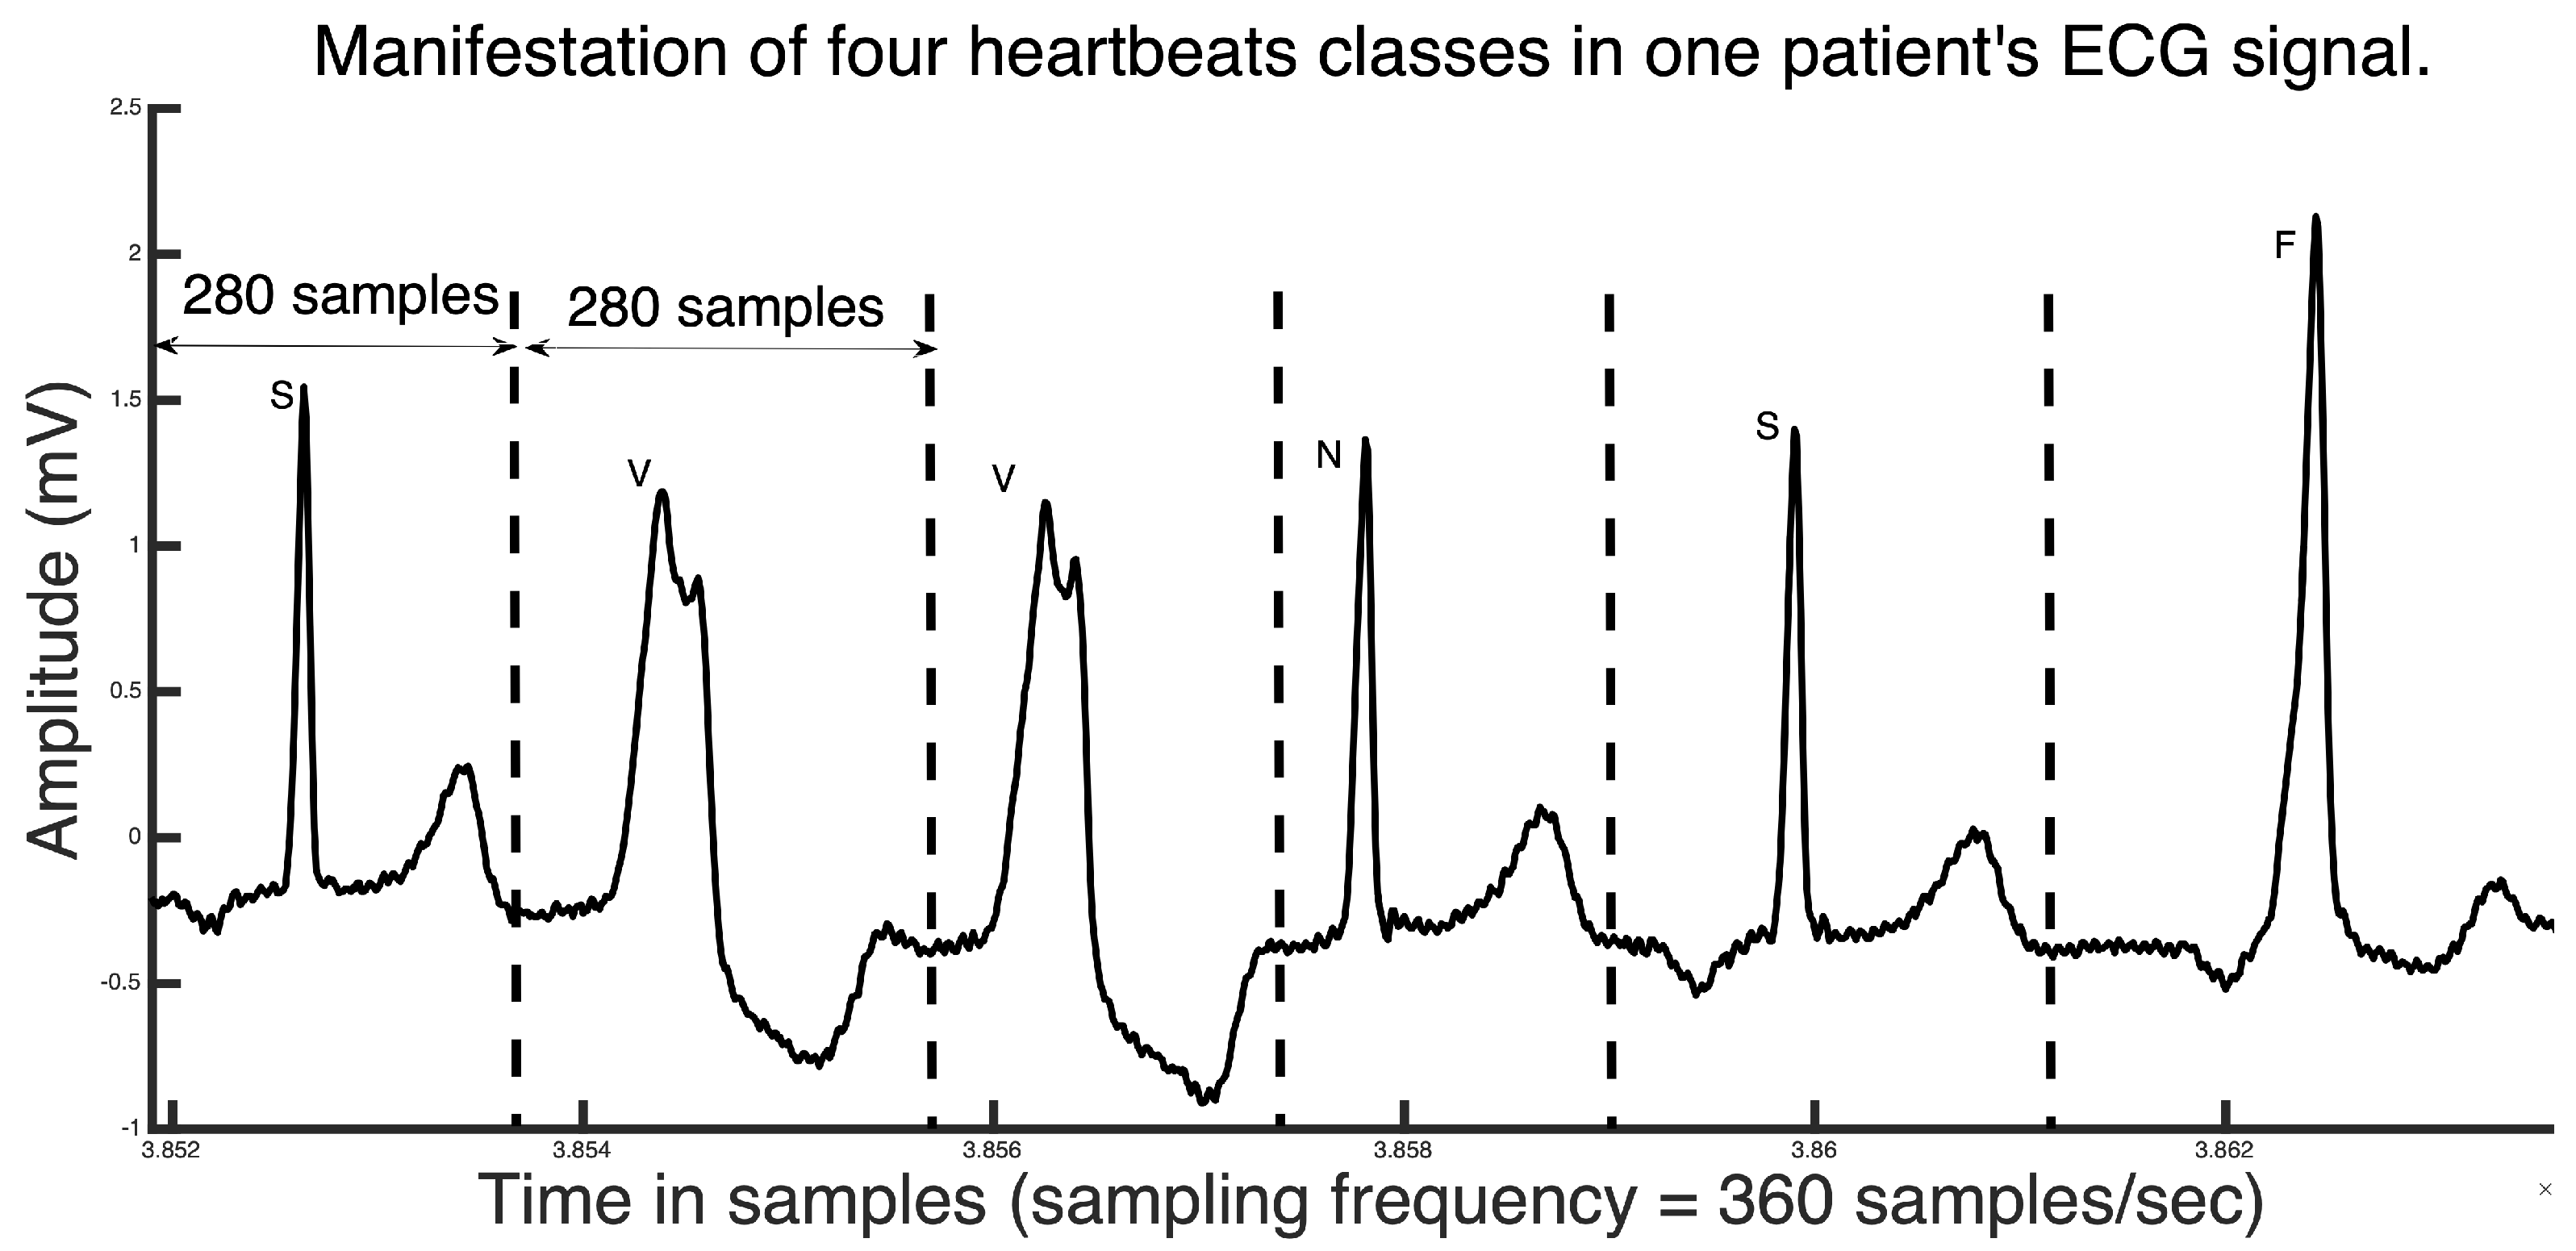
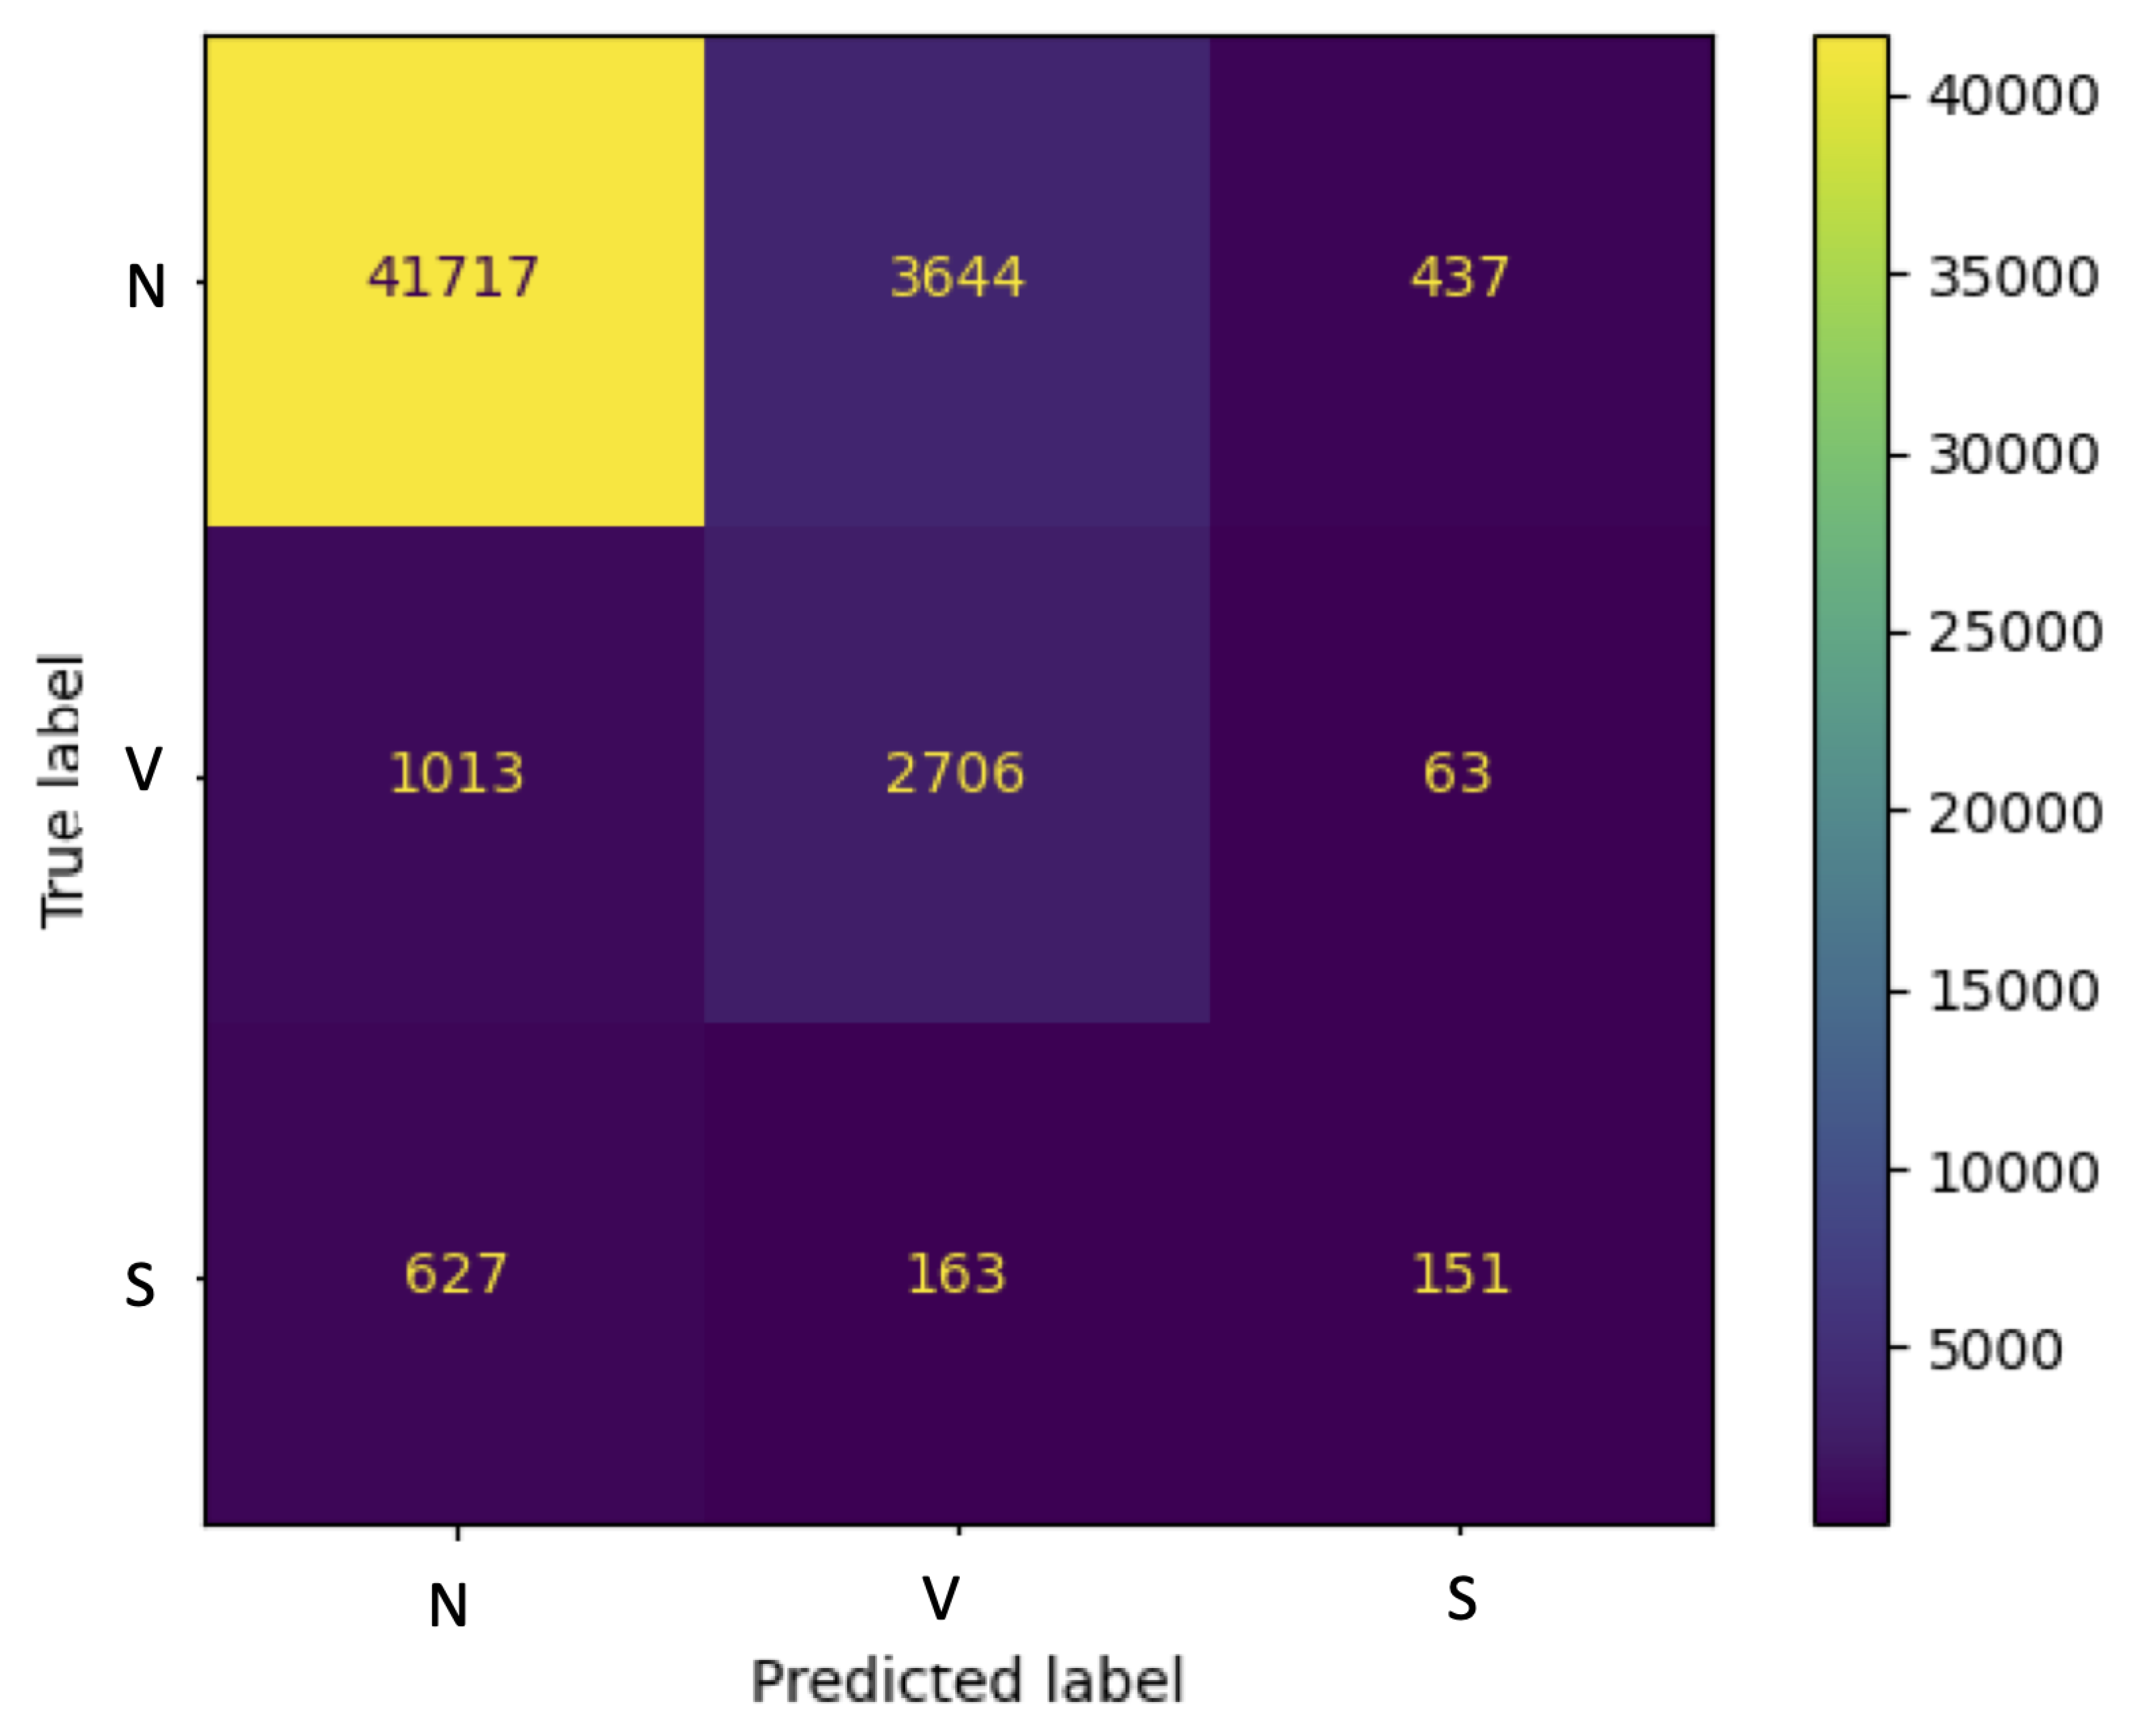
Table 6, which are obtained with the current algorithm, are promising. The high ACC of 96.06% is noteworthy, especially when compared to algorithms trained with balanced data (marked with an asterisk (*)), which is not the case for the proposed classifier. However, this classifier performed poorly in identifying the S category, with low levels of SPEC, SEN, and PPV pointing to its failure. The difficulty of correctly identifying the S category for the inter-patient classification task is due to its complex nature and its high similarity to the N category (see Figure 2) that requires additional rhythmic information, like the R-R interval (i.e., the interval between successive beats) [69]. Additionally, classifiers based on RCs are still in the early stages of development, and further improvements are necessary to adapt them to inter-patient classification in general.
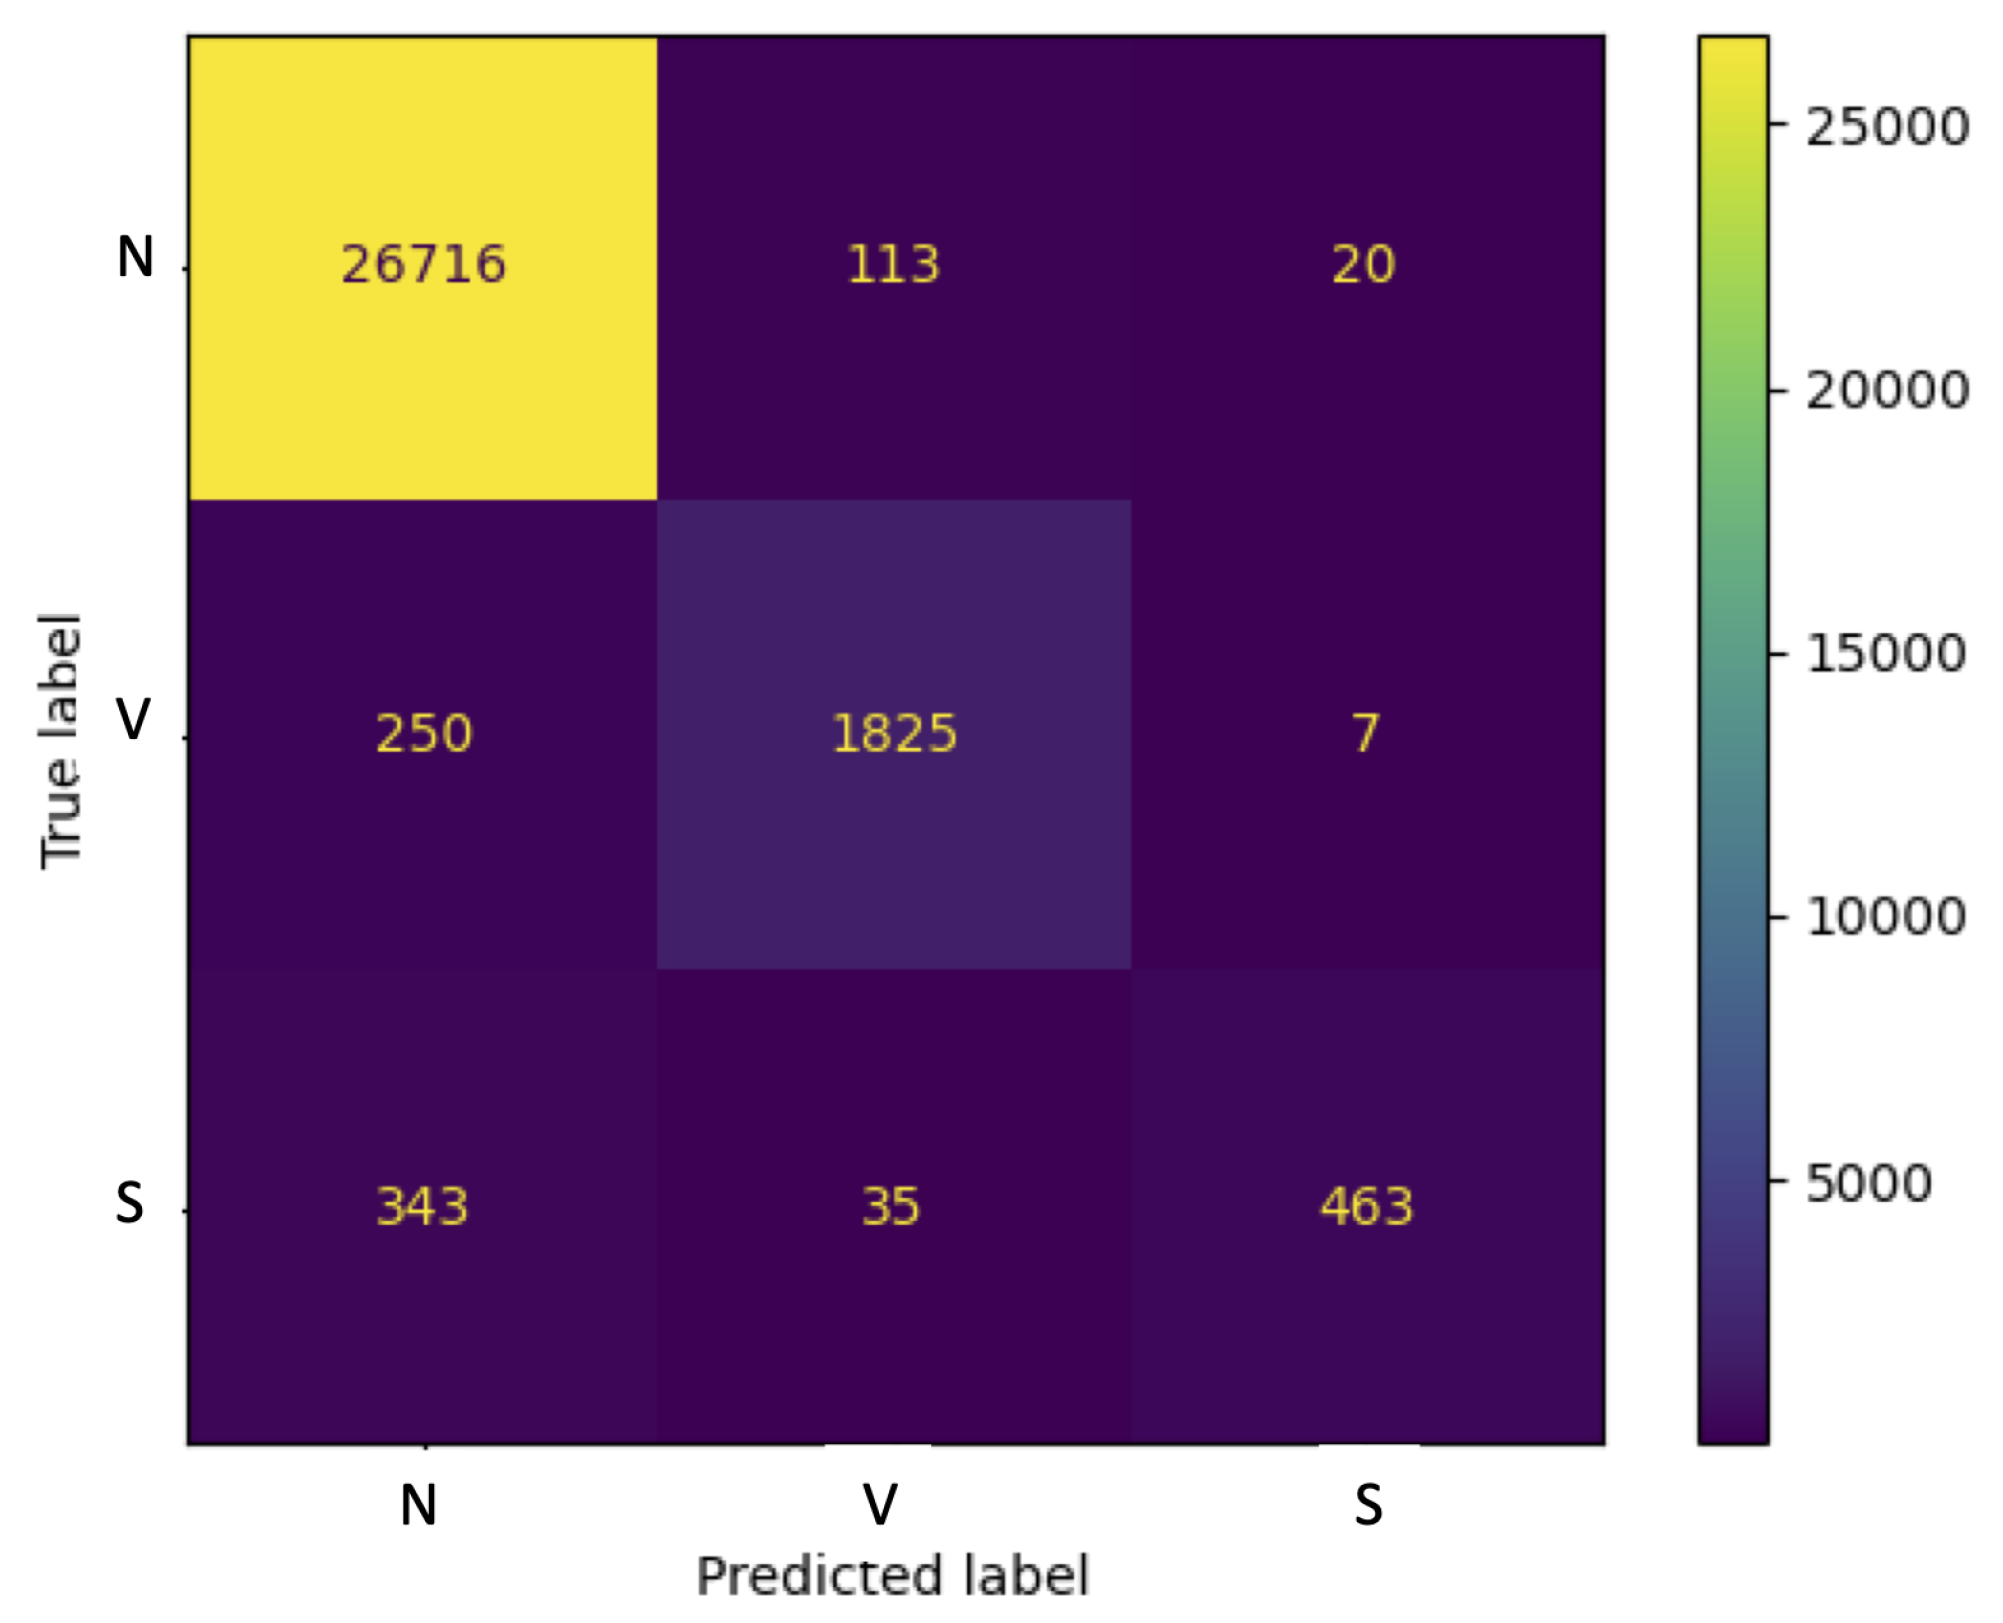
In the case of the intra-patient paradigm, Table 7, the inability of the proposed classifier to detect the S category persists. This is marked by the low values of the SEN and PPV. In contrast to the S category, the classification performance of the N and V categories could be compared favorably with that of the literature. On the whole, the intra-patient findings are similar to other results, but additional effort is required to improve the performance of the proposed classifier.
We also notice that some classifiers based on the MLP as a readout achieve better results using a specific configuration, especially a different number of internal nodes "N" and the number of features "dim". To illustrate, the (NLRC + NAVR + MPL) classifier demonstrates its optimal performance when utilizing N = 15 nodes and dim = 24 features. Furthermore, the impact of the circular implementation of the standard RC and the bidirectional nature of the broadcast data on the classification performance is intuitively positive which conforms to the results in [57].
In general, despite the deteriorated performance of the proposed method regarding the S category recognition. RCs technology applications in heartbeat classification and ECG signal analysis are paramount and promising avenues. They need more investigations, especially in their improvement which must take into consideration the training speed and hardware amenability. RCs have the characteristic to be physiologically plausible which makes them a powerful hot research topic.

4.4. Discussion of Classification Results after Balancing Technique

For both oversampling techniques used to balance the data (i.e., SMOTE and by REPLICA), the algorithm’s classification performance deteriorated. This outcome is surprising since usually, the balancing process enhances the classification performance. All the classifiers exhibit similar outcomes to balanced data. However, the results of the classifiers trained on the SMOTE-based augmented dataset exhibit a little decrease compared to those trained on the REPLICA-based augmented dataset. Alternative data augmenting techniques will be investigated in future works such as generative adversarial network.

5. Conclusions

In this study, we investigated the use of NG-RC in conjunction with typical RC as part in multiclass patient-independent arrhythmia classification framework. The assessment process was conducted on the MIT-BIH database, incorporating both intra- and inter-patient paradigms. We focused solely on three categories, namely the N, V, and S categories. It was discovered that NG-RC-based classifiers improve classification performance, and mitigate the overfitting issue in both intra- and inter-patient cases, even when used independently. Similarly, it turned out that conventional RCs working under the HSR regime outperform their counterparts working under LSR in terms of classification performance. In addition, they exhibit less sensitivity to the categories imbalance issue. In terms of intra-patient scenarios, the attained performance can be favorably compared to that reported in previous studies. Acceptable outcomes are also observed in the inter-patient paradigm, especially for N, and V categories. Nevertheless, further refinements are necessary to elevate the classifier’s efficacy in the case of S category. In addition, we find that classifiers that rely on the MLP readout are less performant than those based on the Ridge readout, especially when used with the NG-RC. Furthermore, the former exhibits overfitting in contrast to the latter despite the use of the regularization technique. This could be the result of the supplementary nonlinearity that the data have undergone. The results also suggest that oversampling techniques (oversampling by the synthetic minority oversampling technique and oversampling by replacement) failed to overcome the data imbalance issue. In future works, we will try to investigate deep RC with untrained attention-like mechanisms in order to mitigate S category under-recognition evaluated on various databases.

Author Contributions

Conceptualization, K.A. and A.B.; methodology, K.A. and A.B.; software, K.A. and A.B.; validation, K.A. and A.B.; formal analysis, K.A. and A.B.; investigation, K.A. and A.B.; writing—original draft preparation, K.A. and A.B.; writing—review and editing, K.A. and A.B.; supervision, K.A. and A.B.; project administration, K.A. and A.B.; funding acquisition, K.A. and A.B. All authors have read and agreed to the published version of the manuscript.

Funding

This research received no external funding.

Institutional Review Board Statement

Not applicable.

Informed Consent Statement

Not applicable.

Data Availability Statement

All experiments in this work have been carried out using the public, open-access ECG database provided by PhyisoNet, namely the MIT-BIH arrhythmia, which is cited in this article (accessed at https://physionet.org/content/mitdb/1.0.0/ on 1 January 2024).

Conflicts of Interest

The authors declare no conflict of interest.

References

  1. Acharya, U.R.; Oh, S.L.; Hagiwara, Y.; Tan, J.H.; Adam, M.; Gertych, A.; San Tan, R. A deep convolutional neural network model to classify heartbeats. Comput. Biol. Med. 2017, 89, 389–396. [Google Scholar] [CrossRef]
  2. Lynn, P. Recursive digital filters for biological signals. Med. Biol. Eng. 1971, 9, 37–43. [Google Scholar] [CrossRef]
  3. Ahlstrom, M.L.; Tompkins, W.J. Digital Filters for Real-Time ECG Signal Processing Using Microprocessors. IEEE Trans. Biomed. Eng. 1985, BME-32, 708–713. [Google Scholar] [CrossRef]
  4. El Bouny, L.; Khalil, M.; Adib, A. An end-to-end multi-level wavelet convolutional neural networks for heart diseases diagnosis. Neurocomputing 2020, 417, 187–201. [Google Scholar] [CrossRef]
  5. Thakor, N.V.; Zhu, Y.S. Applications of adaptive filtering to ECG analysis: Noise cancellation and arrhythmia detection. IEEE Trans. Biomed. Eng. 1991, 38, 785–794. [Google Scholar] [CrossRef]
  6. Sameni, R.; Shamsollahi, M.B.; Jutten, C.; Clifford, G.D. A nonlinear Bayesian filtering framework for ECG denoising. IEEE Trans. Biomed. Eng. 2007, 54, 2172–2185. [Google Scholar] [CrossRef]
  7. Mert, A.; Kılıç, N.; Akan, A. Evaluation of bagging ensemble method with time-domain feature extraction for diagnosing of arrhythmia beats. Neural Comput. Appl. 2014, 24, 317–326. [Google Scholar] [CrossRef]
  8. Lin, L.C.; Yeh, Y.C.; Chu, T.Y. Feature Selection Algorithm for ECG Signals and Its Application on Heartbeat Case Determining. Int. J. Fuzzy Syst. 2014, 16, 483–496. [Google Scholar]
  9. Li, P.; Wang, Y.; He, J.; Wang, L.; Tian, Y.; Zhou, T.s.; Li, T.; Li, J.S. High-performance personalized heartbeat classification model for long-term ECG signal. IEEE Trans. Biomed. Eng. 2016, 64, 78–86. [Google Scholar] [CrossRef]
  10. Zhu, J.; He, L.; Gao, Z. Feature extraction from a novel ECG model for arrhythmia diagnosis. Bio-Med. Mater. Eng. 2014, 24, 2883–2891. [Google Scholar] [CrossRef]
  11. Zadeh, A.E.; Khazaee, A.; Ranaee, V. Classification of the electrocardiogram signals using supervised classifiers and efficient features. Comput. Methods Programs Biomed. 2010, 99, 179–194. [Google Scholar] [CrossRef]
  12. Yeh, Y.C.; Chiou, C.W.; Lin, H.J. Analyzing ECG for cardiac arrhythmia using cluster analysis. Expert Syst. Appl. 2012, 39, 1000–1010. [Google Scholar] [CrossRef]
  13. Krasteva, V.; Jekova, I.; Leber, R.; Schmid, R.; Abächerli, R. Superiority of classification tree versus cluster, fuzzy and discriminant models in a heartbeat classification system. PLoS ONE 2015, 10, e0140123. [Google Scholar] [CrossRef]
  14. Qin, Q.; Li, J.; Zhang, L.; Yue, Y.; Liu, C. Combining low-dimensional wavelet features and support vector machine for arrhythmia beat classification. Sci. Rep. 2017, 7, 6067. [Google Scholar] [CrossRef]
  15. Lin, C.C.; Yang, C.M. Heartbeat classification using normalized RR intervals and morphological features. Math. Probl. Eng. 2014, 2014, 712474. [Google Scholar] [CrossRef]
  16. Doquire, G.; De Lannoy, G.; François, D.; Verleysen, M. Feature selection for interpatient supervised heart beat classification. Comput. Intell. Neurosci. 2011, 2011, 643816. [Google Scholar] [CrossRef]
  17. Osowski, S.; Linh, T.H. ECG beat recognition using fuzzy hybrid neural network. IEEE Trans. Biomed. Eng. 2001, 48, 1265–1271. [Google Scholar] [CrossRef]
  18. Ahmed, R.; Arafat, S. Cardiac arrhythmia classification using hierarchical classification model. In Proceedings of the 6th International Conference on Computer Science and Information Technology (CSIT), Amman, Jordan, 26–27 March 2014; pp. 203–207. [Google Scholar]
  19. Afsar Minhas, F.; Arif, M. Robust electrocardiogram (ECG) beat classification using discrete wavelet transform. Physiol. Meas. 2008, 29, 555. [Google Scholar] [CrossRef]
  20. Christov, I.; Gómez-Herrero, G.; Krasteva, V.; Jekova, I.; Gotchev, A.; Egiazarian, K. Comparative study of morphological and time-frequency ECG descriptors for heartbeat classification. Med. Eng. Phys. 2006, 28, 876–887. [Google Scholar] [CrossRef]
  21. Guo, L.; Sim, G.; Matuszewski, B. Inter-patient ECG classification with convolutional and recurrent neural networks. Biocybern. Biomed. Eng. 2019, 39, 868–879. [Google Scholar] [CrossRef]
  22. Jiang, K.; Liang, S.; Meng, L.; Zhang, Y.; Wang, P.; Wang, W. A two-level attention-based sequence-to-sequence model for accurate inter-patient arrhythmia detection. In Proceedings of the IEEE International Conference on Bioinformatics and Biomedicine (BIBM), Seoul, Republic of Korea, 16–19 December 2020; pp. 1029–1033. [Google Scholar]
  23. Mousavi, S.; Afghah, F. Inter-and intra-patient ecg heartbeat classification for arrhythmia detection: A sequence to sequence deep learning approach. In Proceedings of the ICASSP 2019—2019 IEEE International Conference on Acoustics, Speech and Signal Processing (ICASSP), Brighton, UK, 12–17 May 2019; pp. 1308–1312. [Google Scholar]
  24. Park, J.; Kim, J.k.; Jung, S.; Gil, Y.; Choi, J.I.; Son, H.S. ECG-signal multi-classification model based on squeeze-and-excitation residual neural networks. Appl. Sci. 2020, 10, 6495. [Google Scholar] [CrossRef]
  25. Hu, S.; Cai, W.; Gao, T.; Wang, M. An automatic residual-constrained and clustering-boosting architecture for differentiated heartbeat classification. Biomed. Signal Process. Control 2022, 77, 103690. [Google Scholar] [CrossRef]
  26. Li, F.; Wu, J.; Jia, M.; Chen, Z.; Pu, Y. Automated heartbeat classification exploiting convolutional neural network with channel-wise attention. IEEE Access 2019, 7, 122955–122963. [Google Scholar] [CrossRef]
  27. Li, H.; Lin, Z.; An, Z.; Zuo, S.; Zhu, W.; Zhang, Z.; Mu, Y.; Cao, L.; Garcia, J.D.P. Automatic electrocardiogram detection and classification using bidirectional long short-term memory network improved by Bayesian optimization. Biomed. Signal Process. Control 2022, 73, 103424. [Google Scholar] [CrossRef]
  28. Hu, S.; Cai, W.; Gao, T.; Zhou, J.; Wang, M. Robust wave-feature adaptive heartbeat classification based on self-attention mechanism using a transformer model. Physiol. Meas. 2021, 42, 125001. [Google Scholar] [CrossRef]
  29. Khaldi, Y.; Benzaoui, A.; Ouahabi, A.; Jacques, S.; Taleb-Ahmed, A. Ear Recognition Based on Deep Unsupervised Active Learning. IEEE Sens. J. 2021, 21, 20704–20713. [Google Scholar] [CrossRef]
  30. Arbateni, K.; Deriche, M. Support Vector Machine for Heart Beats Classification Based on Robust Filtering. In Proceedings of the 19th International Multi-Conference on Systems, Signals & Devices (SSD), Setif, Algeria, 6–10 May 2022; pp. 653–656. [Google Scholar] [CrossRef]
  31. Garcia, G.; Moreira, G.; Menotti, D.; Luz, E. Inter-patient ECG heartbeat classification with temporal VCG optimized by PSO. Sci. Rep. 2017, 7, 10543. [Google Scholar] [CrossRef]
  32. Lin, C.C.; Yang, C.M. Heartbeat classification using normalized RR intervals and wavelet features. In Proceedings of the International Symposium on Computer, Consumer and Control, Taichung, Taiwan, 10–12 June 2014; pp. 650–653. [Google Scholar]
  33. da S. Luz, E.J.; Schwartz, W.R.; Cámara-Chávez, G.; Menotti, D. ECG-based heartbeat classification for arrhythmia detection: A survey. Comput. Methods Programs Biomed. 2016, 127, 144–164. [Google Scholar] [CrossRef]
  34. Dias, F.M.; Monteiro, H.L.; Cabral, T.W.; Naji, R.; Kuehni, M.; Luz, E.J.d.S. Arrhythmia classification from single-lead ECG signals using the inter-patient paradigm. Comput. Methods Programs Biomed. 2021, 202, 105948. [Google Scholar] [CrossRef]
  35. Essa, E.; Xie, X. An ensemble of deep learning-based multi-model for ECG heartbeats arrhythmia classification. IEEE Access 2021, 9, 103452–103464. [Google Scholar] [CrossRef]
  36. Janveja, M.; Parmar, R.; Tantuway, M.; Trivedi, G. A DNN-based low power ECG co-processor architecture to classify cardiac arrhythmia for wearable devices. IEEE Trans. Circuits Syst. Ii Express Briefs 2022, 69, 2281–2285. [Google Scholar] [CrossRef]
  37. Ramkumar, M.; Kumar, R.S.; Manjunathan, A.; Mathankumar, M.; Pauliah, J. Auto-encoder and bidirectional long short-term memory based automated arrhythmia classification for ECG signal. Biomed. Signal Process. Control 2022, 77, 103826. [Google Scholar] [CrossRef]
  38. Kusuma, S.; Jothi, K. ECG signals-based automated diagnosis of congestive heart failure using Deep CNN and LSTM architecture. Biocybern. Biomed. Eng. 2022, 42, 247–257. [Google Scholar] [CrossRef]
  39. Herbert, J.; Harald, H. Harnessing Nonlinearity: Predicting Chaotic Systems and Saving Energy in Wireless Communication. Science 2004, 304, 78–80. [Google Scholar]
  40. Maass, W.; Natschläger, T.; Markram, H. Real-time computing without stable states: A new framework for neural computation based on perturbations. Neural Comput. 2002, 14, 2531–2560. [Google Scholar] [CrossRef] [PubMed]
  41. Lukoševičius, M.; Jaeger, H.; Schrauwen, B. Reservoir computing trends. KI-KÜNstliche Intell. 2012, 26, 365–371. [Google Scholar] [CrossRef]
  42. Gallicchio, C.; Micheli, A. Richness of deep echo state network dynamics. In Proceedings of the Advances in Computational Intelligence: 15th International Work-Conference on Artificial Neural Networks, IWANN 2019, Gran Canaria, Spain, 12–14 June 2019; pp. 480–491. [Google Scholar]
  43. Elbedwehy, A.N.; El-Mohandes, A.M.; Elnakib, A.; Abou-Elsoud, M.E. FPGA-based reservoir computing system for ECG denoising. Microprocess. Microsyst. 2022, 91, 104549. [Google Scholar] [CrossRef]
  44. Ortín, S.; Soriano, M.C.; Alfaras, M.; Mirasso, C.R. Automated real-time method for ventricular heartbeat classification. Comput. Methods Programs Biomed. 2019, 169, 1–8. [Google Scholar] [CrossRef] [PubMed]
  45. Chandrasekaran, S.T.; Bhanushali, S.P.; Banerjee, I.; Sanyal, A. A bio-inspired reservoir-computer for real-time stress detection from ECG signal. IEEE Solid-State Circuits Lett. 2020, 3, 290–293. [Google Scholar] [CrossRef]
  46. Alfaras, M.; Soriano, M.C.; Ortín, S. A fast machine learning model for ECG-based heartbeat classification and arrhythmia detection. Front. Phys. 2019, 7, 103. [Google Scholar] [CrossRef]
  47. Liang, X.; Fan, H.; Mercer, J.; Heidari, H. A delay-based neuromorphic processor for arrhythmias detection. In Proceedings of the IEEE International Symposium on Circuits and Systems (ISCAS), Virtual, 10–21 October 2020; pp. 1–5. [Google Scholar]
  48. Gauthier, D.J.; Bollt, E.; Griffith, A.; Barbosa, W.A. Next generation reservoir computing. Nat. Commun. 2021, 12, 5564. [Google Scholar] [CrossRef]
  49. Pyle, R.; Jovanovic, N.; Subramanian, D.; Palem, K.V.; Patel, A.B. Domain-driven models yield better predictions at lower cost than reservoir computers in Lorenz systems. Philos. Trans. R. Soc. 2021, 379, 20200246. [Google Scholar] [CrossRef]
  50. Bollt, E. On explaining the surprising success of reservoir computing forecaster of chaos? The universal machine learning dynamical system with contrast to VAR and DMD. Chaos Interdiscip. J. Nonlinear Sci. 2021, 31, 013108. [Google Scholar] [CrossRef]
  51. Mastoi, Q.U.A.; Wah, T.Y.; Gopal Raj, R. Reservoir computing based echo state networks for ventricular heart beat classification. Appl. Sci. 2019, 9, 702. [Google Scholar] [CrossRef]
  52. Wang, S.; Ding, C.; Wang, Z.; Shen, L.; Wang, J. Using normalized echo state network to detect abnormal ECG patterns. Int. J. Imaging Syst. Technol. 2024, 34, e22940. [Google Scholar] [CrossRef]
  53. Moody, G.B.; Mark, R.G. The impact of the MIT-BIH arrhythmia database. IEEE Eng. Med. Biol. Mag. 2001, 20, 45–50. [Google Scholar] [CrossRef]
  54. ANSI-AAMI. Testing and Reporting Performance Results of Cardiac Rhythm and St Segment Measurement Algorithms; American National Standards Institute: Arlington, VA, USA, 2008. [Google Scholar]
  55. Chawla, N.V.; Bowyer, K.W.; Hall, L.O.; Kegelmeyer, W.P. SMOTE: Synthetic minority over-sampling technique. J. Artif. Intell. Res. 2002, 16, 321–357. [Google Scholar] [CrossRef]
  56. Armenio, L.B.; Terzi, E.; Farina, M.; Scattolini, R. Model predictive control design for dynamical systems learned by echo state networks. IEEE Control Syst. Lett. 2019, 3, 1044–1049. [Google Scholar] [CrossRef]
  57. Bianchi, F.M.; Scardapane, S.; Løkse, S.; Jenssen, R. Reservoir computing approaches for representation and classification of multivariate time series. IEEE Trans. Neural Netw. Learn. Syst. 2020, 32, 2169–2179. [Google Scholar] [CrossRef]
  58. Chang, H.; Futagami, K. Convolutional Reservoir Computing for World Models. arXiv 2019, arXiv:abs/1907.08040. [Google Scholar]
  59. Li, Q.; Wu, Z.; Ling, R.; Feng, L.; Liu, K. Multi-reservoir echo state computing for solar irradiance prediction: A fast yet efficient deep learning approach. Appl. Soft Comput. 2020, 95, 106481. [Google Scholar] [CrossRef]
  60. Deepa, S.N.; Govindaraj, S.; Anand, T.S. Fuzzy Echo State Neural Network with Differential Evolution Framework for Time Series Forecasting. In Proceedings of the 17th IEEE International Conference on Machine Learning and Applications (ICMLA), Orlando, FL, USA, 17–20 December 2018; pp. 1322–1327. [Google Scholar] [CrossRef]
  61. Tanaka, G.; Nakane, R. Simulation platform for pattern recognition based on reservoir computing with memristor networks. Sci. Rep. 2022, 12, 9868. [Google Scholar] [CrossRef]
  62. Antonik, P.; Marsal, N.; Rontani, D. Large-scale spatiotemporal photonic reservoir computer for image classification. IEEE J. Sel. Top. Quantum Electron. 2019, 26, 1–12. [Google Scholar] [CrossRef]
  63. Trouvain, N.; Pedrelli, L.; Dinh, T.T.; Hinaut, X. Reservoirpy: An efficient and user-friendly library to design echo state networks. In Proceedings of the Artificial Neural Networks and Machine Learning–ICANN 2020: 29th International Conference on Artificial Neural Networks, Bratislava, Slovakia, 15–18 September 2020; pp. 494–505. [Google Scholar]
  64. Trouvain, N.; Hinaut, X. Reservoirpy: A Simple and Flexible Reservoir Computing Tool in Python. inria.hal.science. 2022. Available online: https://hal.science/hal-03699931/ (accessed on 1 January 2024).
  65. Bradley, A.P. The use of the area under the ROC curve in the evaluation of machine learning algorithms. Pattern Recognit. 1997, 30, 1145–1159. [Google Scholar] [CrossRef]
  66. Greenacre, M.; Groenen, P.J.; Hastie, T.; d’Enza, A.I.; Markos, A.; Tuzhilina, E. Principal component analysis. Nat. Rev. Methods Prim. 2022, 2, 100. [Google Scholar] [CrossRef]
  67. Abdi, H.; Williams, L.J. Principal component analysis. Wiley Interdiscip. Rev. Comput. Stat. 2010, 2, 433–459. [Google Scholar] [CrossRef]
  68. Scardapane, S.; Wang, D. Randomness in neural networks: An overview. Wiley Interdiscip. Rev. Data Min. Knowl. Discov. 2017, 7, e1200. [Google Scholar] [CrossRef]
  69. He, J.; Rong, J.; Sun, L.; Wang, H.; Zhang, Y. An advanced two-step DNN-based framework for arrhythmia detection. In Proceedings of the Advances in Knowledge Discovery and Data Mining: 24th Pacific-Asia Conference, PAKDD 2020, Singapore, 11–14 May 2020; pp. 422–434. [Google Scholar]
  70. Ye, C.; Coimbra, M.T.; Vijaya Kumar, B. Arrhythmia detection and classification using morphological and dynamic features of ECG signals. In Proceedings of the Annual International Conference of the IEEE Engineering in Medicine and Biology, Buenos Aires, Argentina, 31 August–4 September 2010; pp. 1918–1921. [Google Scholar] [CrossRef]
  71. Sun, L.; Wang, Y.; Qu, Z.; Xiong, N.N. BeatClass: A sustainable ECG classification system in IoT-based eHealth. IEEE Internet Things J. 2021, 9, 7178–7195. [Google Scholar] [CrossRef]
  72. Xia, Y.; Xu, Y.; Chen, P.; Zhang, J.; Zhang, Y. Generative adversarial network with transformer generator for boosting ECG classification. Biomed. Signal Process. Control 2023, 80, 104276. [Google Scholar] [CrossRef]
  73. Xia, Y.; Xiong, Y.; Wang, K. A transformer model blended with CNN and denoising autoencoder for inter-patient ECG arrhythmia classification. Biomed. Signal Process. Control 2023, 86, 105271. [Google Scholar] [CrossRef]
Figure 1. ECG signal of one heartbeat.
Applsci 14 03030 g001
Figure 2. Four heartbeat classes (record 208). Each heartbeat is represented by 280 samples (sampling frequency = 360 samples/s).
Applsci 14 03030 g002
Figure 3. Basic architecture of traditional RC. Three layers, the input layer receives the input data. The reservoir extracts the features. The readout layer maps the extracted features representing the input into the corresponding class. ‘ X i n ’: input data (280 samples for each heartbeat). ‘ W i n ’: input weights (initialized randomly and fixed). ‘W’: reservoir’s internal weights (initialized randomly and fixed). ‘ W o u t ’: output weights (the only trainable parameter). ‘SVM’: support vector machine. ‘MLP’: multilayer perceptron. c = 20, h = 28.
Applsci 14 03030 g003
Figure 4. Next-Generation RC concept (NVAR transform).
Applsci 14 03030 g004
Figure 5. NG-RC-based classification. ‘ X i n ’: input data (280 samples for each heartbeat). ‘NVAR’: nonlinear vector autoregressive. ‘PCA’:principal component analysis. Readout Ridge: Linear ridge regression. Readout MLP: Multilayer perceptron. ‘N, V, and S’: heartbeat categories.
Applsci 14 03030 g005
Figure 6. Architecture of the classifiers based on reservoir computing (NG-RC and RC). Each path in the schematic illustrates a scenario of classification. ‘LR’: linear RC states. ‘NR’: nonlinear RC states. ‘PCA’: principal component analysis. ‘MLP’: multilayer perception. ‘BD’: bidirectional. ‘ X i n ’: input data (280 samples for each heartbeat). ‘ W i n ’: input weights (initialized randomly and fixed). ‘NLRC’: nonlinear circular. ‘LRC’: linear circular. ‘NVAR’: nonlinear vector autoregressive.
Applsci 14 03030 g006
Figure 7. ROC curve. As the ROC curve approaches the upper left corner of the coordinate (1, 0), the AUC metric correspondingly increases. The blue and black curves are two ROC curves.
Applsci 14 03030 g007
Figure 8. Classification performance as a function of the reservoir internal node number in the case of linear Ridge readout. Experiments were performed to select the optimal number of the reservoir’s internal nodes.
Applsci 14 03030 g008
Figure 9. Classification performance as a function of the reservoir internal node number in the case of MLP readout. Experiments were performed to select the optimal number of the reservoir’s internal nodes.
Applsci 14 03030 g009
Figure 10. Classification performance as a function of the first hidden layer neuron’s number. Experiments were performed to select the optimal number of the first hidden layer of MLP readout evaluated on three activation functions: Tanh, ReLU, and Logistic.
Applsci 14 03030 g010
Figure 11. Confusion matrix corresponding to NVAR+MLP-based classifier.
Applsci 14 03030 g011
Figure 12. Confusion matrix corresponding to NLRC+NVAR+Ridge-based classifier with N = 55 and dim = 40.
Applsci 14 03030 g012
Table 1. Classes of heartbeat for each category.
CategoryClass
NLeft and right bundle branch block beats (L, R), Normal beat (N), Nodal (junctional) escape beat (j), Atrial escape beat (c)
SAberrated atrial premature beat (a), Atrial premature beat (A), Supra-ventricular premature beat (S), Nodal (junctional) premature beat (J)
VVentricular escape beat (E), Premature ventricular contraction (V)
FFusion of ventricular and normal beat (F)
QPaced beat (/), Fusion of paced and normal beat (f) Unclassified beat (U)
Table 2. The count of heartbeats in each category.
CategorySet-1-RawSet-1-SMOTESet-1-REPLICASet-2-Raw
N44,19844,19845,79645,738
S183646,03245,168941
V321746,24945,3603782
F415--388
Q8--7
Table 3. NG-RC evaluated alone in the intra- and inter-patient classification with Ridge and MLP readout.
Intra-PatientInter-Patient
ClassifierAUC%AUC%
Original Data + Ridge82.9270.57
NVAR + Ridge87.1072.88
Original Data + MLP84.5574.00
NAVR + MPL90.3374.79
Table 4. Ablation study for intra- and inter-patient classification for all scenarios.
Intra-PatientInter-Patient
ClassifierAUC%AUC%
NLRC + Ridge97.5591.48
NLRC + MLP92.8876.59 1
LRC + Ridge97.0291.55
LRC + MPL92.4375.69
NLRC + NVAR + Ridge97.8092.09
NLRC + NAVR + MPL93.8276.94 2
LRC + NAVR + Ridge97.7591.07
LRC + NAVR + MPL93.7276.63 3
1 These results are obtained using specific configurations of the underlying classifiers: N = 55 and dim = 18. 2 N = 15 and dim = 24. 3 N = 55 and dim = 35.
Table 5. Benchmaking classification results of classifier after database augmentation.
RawSMOTEREPLICA
ClassifierAUC%AUC%AUC%
NLRC + Ridge91.4888.7962.07
NLRC + MLP76.59 176.0163.05
LRC + Ridge91.5591.4762.65
LRC + MPL75.5975.3663.94
1 These results are obtained using specific configurations of the underlying classifiers: N = 55 and dim = 18.
Table 6. Benchmarking of the proposed algorithm with state-of-the-art work for the inter-patient scheme.
Overall (%)N (%)V (%)S (%)
MethodsAccSENSPECPPVSENSPECPPVSENSPECPPV
Jiang et al. [22] *99.8999.8798.5699.8499.9899.9799.9496.6999.9897.06
Mousavi et al. [23] *99.5399.6896.0599.5599.9499.9799.5088.9499.7292.57
Acharya et al. [1]96.6898.7262.4696.2268.0898.4377.9123.2799.9794.80
Ye et al. [70]75.2080.20-78.2050.20-48.5003.20-10.30
Sun et al. [71]98.7099.90-99.1097.10-99.1094.70-96.80
Xia et al. [72]94.6997.79-95.6972.26-94.0927.12-32.44
Xia et al. [73]97.6697.3571.0996.4773.2696.4271.6770.2899.4482.90
This method96.0598.0060.3495.9969.5497.6870.7902.8199.9332.08
* Trained with balanced data.
Table 7. Benchmarking of the proposed algorithm with state-of-the-art work for the intra-patient scheme.
Overall (%)N (%)V (%)S (%)
MethodsAccSENSPECPPVSENSPECPPVSENSPECPPV
Jiang et al. [22] *99.97100.0099.9799.70100.00100.0099.9797.65100.00100.00
Mousavi et al. [23] *99.92100.0099.8698.8799.5099.9799.9896.48100.00100.00
Acharya et al. [1]97.3791.6485.1796.0194.0795.0898.7489.0494.7698.77
Ye et al. [70]96.5098.7096.30-82.6097.80-72.4094.50-
This method98.2899.5079.7197.8387.6699.4792.5055.0599.9194.49
* Trained with balanced data.
Disclaimer/Publisher’s Note: The statements, opinions and data contained in all publications are solely those of the individual author(s) and contributor(s) and not of MDPI and/or the editor(s). MDPI and/or the editor(s) disclaim responsibility for any injury to people or property resulting from any ideas, methods, instructions or products referred to in the content.

