Article

Evaluation of Deviations for Horizontal Thin Walls Determined by Optical and Contact Methods for Milled Samples of Nickel Alloy Inconel 625

by
Szymon Kurpiel
1,*,
Krzysztof Zagórski
1,
Jacek Cieślik
1,
Krzysztof Skrzypkowski
2,* and
Witold Brostow
3
1
Faculty of Mechanical Engineering and Robotics, AGH University of Krakow, Mickiewicza 30 Ave., 30-059 Krakow, Poland
2
Faculty of Civil Engineering and Resource Management, AGH University of Krakow, Mickiewicza 30 Ave., 30-059 Krakow, Poland
3
Laboratory of Advanced Polymers & Optimized Materials (LAPOM), Department of Materials Science and Engineering, University of North Texas, 3940 North Elm Street, Denton, TX 76207, USA
*
Authors to whom correspondence should be addressed.
Appl. Sci. 2024, 14(7), 3034; https://doi.org/10.3390/app14073034
Submission received: 3 March 2024 / Revised: 23 March 2024 / Accepted: 2 April 2024 / Published: 4 April 2024

Abstract

:
The aerospace industry is imposing increasingly strict dimensional tolerances, which is forcing continuous development in component manufacturing. Ensuring tight dimensional tolerances is difficult for thin-walled structures due to their reduced stiffness, which are increasingly used in the aerospace industry, where titanium alloys and nickel alloys, among others, dominate. Developments in this area are causing a search for machining conditions that provide sufficient quality characteristics including dimensional and shape accuracy. We discuss, herewith, thin wall deformations in the horizontal orientation of Inconel 625 nickel alloy samples in cross-sections perpendicular and parallel to the direction of tool feed motion. We measured dimensional and shape accuracy using a 3D optical scanner and also using a coordinate measuring machine to correlate these results. We compared the results obtained by the two methods and obtained the maximum discrepancy of the results equal to around 8%. Samples made with adaptive cylindrical milling had similar values of thin wall deviations, with the smallest deviations observed for the sample made with the tool for high-performance machining using adaptive cylindrical milling.

1. Introduction

Deformations of thin-walled structures are being studied because of serious problems involved in component manufacturing [1]. Machining, including milling, of such products is complicated by low stiffness, which affects machining vibrations and, as a result, reduces the surface qualities of the finished products [2,3,4,5,6]. To remain competitive in the market, manufacturers of structures need to use dimensional tolerances tighter than before [7,8,9]. The use of harder materials and the demand for efficient manufacturing processes with the ability to create high-quality parts has led to the development of specialized tools, machining methods, and strategies for shaping individual operations when making parts by milling. It has been observed that the machining strategy has a significant impact on the characteristics of the finished product, so the development of new milling machining strategies to improve the machining process as well as the quality of the manufactured part can be seen [1,2,3,4,5,6,7,8,9]. One of the newer strategies for machining parts is adaptive milling, which is not yet widespread in research. The goal of this strategy is still to conduct machining more efficiently and effectively while ensuring sufficient quality of manufactured parts. Among other things, the strategy is used for groove shaping, the goal of which is to keep the tool in constant contact with the workpiece material for as long as possible and is derived from trochoidal milling [10,11].
The interest in thin-walled structures is seen in several industries, including aerospace. Needless to say, thin-walled structures reduce the total structure weight of structures, thus lowering operating costs [1]. The largest share in thin-walled aerospace structures have aluminum alloys, while the use of titanium alloys and of nickel alloys are also noted [12,13,14,15]. Although the percentage of nickel alloys in relation to the entire aircraft structure is low, these materials are studied extensively. Ni alloys are used in heavy-duty operation, while the products used in turbines are subject to restrictive requirements in terms of their shape and manufacturing quality [16].
The development of new methods in the metrology of manufactured products has made it possible to measure dimensional accuracy through modern measuring machines. This process aims to verify that the manufactured product conforms to the designed shape [17,18,19]. The most significant development and most comprehensive application is in modern optical methods. Such measuring machines include the 3D optical scanner from GOM, Zeiss Group. The scanner operates in triple scanning mode. Precise stripe patterns are projected onto the object’s surface and recorded simultaneously by two stereovision cameras. Based on the image of the mapped surface shape (waveform), the coordinates of the characteristic points on the three-dimensional surface created by the stripes’ intersections (projected in three directions) are determined. The geometry data of the surface of the manufactured object collected by this method are compared with the nominal data of the designed object shape. Presentation of the results takes place in the form of a color map, giving the deviation of the dimensions according to the adjusted scale [20,21]. An important advantage of this method is a much faster procedure than that in contact-based coordinate measuring machines. Additional advantages are the possibility of measuring surfaces of complex shapes, the possibility of evaluating selected dimensions after the measurement of the prepared point cloud, and the possibility of checking the dimensional deviation in each tested area (based on the color map) [1]. One of the difficulties when applying this machine is the measurement of small-sized parts, due to the necessity of projecting stripes on the surface of the product to evaluate the position in space [1,21].
In an earlier paper [1], we presented plots of the distribution of thin-wall dimensional deviations in the horizontal orientation of Ti6Al4V titanium alloy specimens. We measured the deformations using the optical method (a 3D optical scanner—Atos ScanBox 6130—was used) and the contact method (a Zeiss Contura coordinate measuring machine). The dimension deviations with the smallest value (up to 0.09 mm) were observed for the sample made with the tool for high-performance machining by adaptive face milling. The measured maximum deviations for the individual specimens ranged from 0.09 mm to 0.89 mm—depending on the input factors used. We found up to 8 per cent differences between the results obtained from measurements by optical and contact methods.
Also in earlier publications [21,22], some of us reported thin-wall deviations in vertical orientation for samples of titanium alloy Ti6Al4V and nickel alloy Inconel 625. We prepared the samples using a constant material removal rate of 2.03 cm3/g. We measured the dimensional and shape accuracy using the same 3D optical scanner. For both the Ti6Al4V alloy and the Inconel 625 nickel alloy, the deviations were no larger than 0.08 mm [22].
Bałon et al. [6] reported the possibility of using a 3D optical scanner for products containing thin walls. They presented color maps of an aircraft frame made of 7075 aluminum alloy, for which the semifinished product had overall dimensions equal to 1012 × 1354 × 55.8 mm.
Gang [23] reported the dimensional deviations of thin-wall (2.5 mm thick) Ti6Al4V samples in vertical orientation. The largest deviation value was 0.1 mm in the middle part of the thin wall. Hintze et al. [24] also reported a maximum thin-wall deviation of 0.1 mm for Ti6Al4V titanium alloy samples machined in various combinations of assembly methods. Polishetty et al. [25] reported for Ti6Al4V titanium alloy the deviations of the thin wall in the vertical orientation in the range of 0.06–0.34 mm. For the same alloy, Yusop et al. [26] reported the highest dimensional deviation equal to 0.18 mm while Zha et al. [27] found a maximum deviation of 0.21 mm for a sample containing a fan blade shape made of the same alloy.
Gapinski et al. [28] compared results for an aluminum alloy cube (not containing thin-walled structures) obtained using a coordinate measuring machine, a 3D optical scanner, and a 3D computer tomograph. The maximum difference was 0.05 mm; clearly, the results coincide.
The main objective of the experiment is to evaluate the dimensional and shape deviations of thin-walled specimens in horizontal orientation of nickel alloy 625 made under different variants of input factors—using a variety of cutting tools and two approaches of adaptive milling. An additional aim of the study is to correlate the dimensional values obtained by the optical method (using a 3D optical scanner) and by the contact method (using a coordinate measuring machine).
Several articles have presented results for specimens containing thin-walled shapes in other orientations [23,24,25,26,27,28]. No leading works containing studies of thin-walled components in horizontal orientation have been observed, so the advantage of the presented scope of work is the presentation of test results for thin-walled structures in horizontal orientation. Current scientific work mainly focuses on thin-walled structures in vertical orientation. Focusing on thin-walled products used in many industries, we note that they are a composite of various shapes, such as thin-walled structures with walls in vertical and horizontal orientations, cylindrical parts with thin walls, or circular parts (shafts, pins) with small diameters [6]. Depending on the shape to be performed, it is necessary to choose the suitable cutting strategy, which has a significant impact on the measured quantities. Based on this, it can be seen that tests should also be provided for other shapes or thin-wall orientations. Finished products contain walls in different orientations, so it is necessary to conduct research for different shapes [1].
Another advantage is the use of nickel alloy as a workpiece material for thin-walled structures. In the available studies, we see a lack of leading works presenting research for this material group. The most studied material for thin-walled products is aluminum alloy. A few works related to the study of thin-walled structures in titanium alloy are observed [29]. Enormous interest has been observed in the Inconel 625 nickel alloy used as a material for numerous studies. Zhang et al. [30], in their paper, presented microstructural kinetics data required to investigate the feasibility of annealing heat treatment at lower temperatures for Additive Manufactured Inconel 625 Alloy at 700 °C. Peters et al. [31] presented the effect of nano-oxides on the fracture properties of Inconel 625 nickel alloy. In the article by Yang et al. [32], they compared the microstructure and mechanical properties of Ni–Cr–Mo alloys prepared from a single alloy using two new digital manufacturing techniques—selective laser melting (SLM) and soft metal milling (SMM) and one conventional—lost-wax casting (LWC). Developments in materials engineering are prompting research into the manufacture of new, strong materials. In the field of thin-walled structures for the aerospace industry, one can see, for example, the results of Wu et al. [33], which presented fatigue performance for samples of porous structures made of beta titanium alloy obtained by laser powder bed fusion.
The development of optical methods results in newer and newer measuring instruments appearing on the market, which make it possible to reduce measurement time and provide higher measurement accuracy [1]. The presented paper includes the results of dimensional deviations determined by the optical method using a 3D optical scanner, which gives value to the study. The 3D optical scanner is a relatively new measuring instrument, so conducting research using this machine is justified [21,22].
In the aspect of dimensional deviation reduction, two approaches of adaptive milling strategy were used, which is a relatively new strategy and is therefore not yet widespread in scientific research.

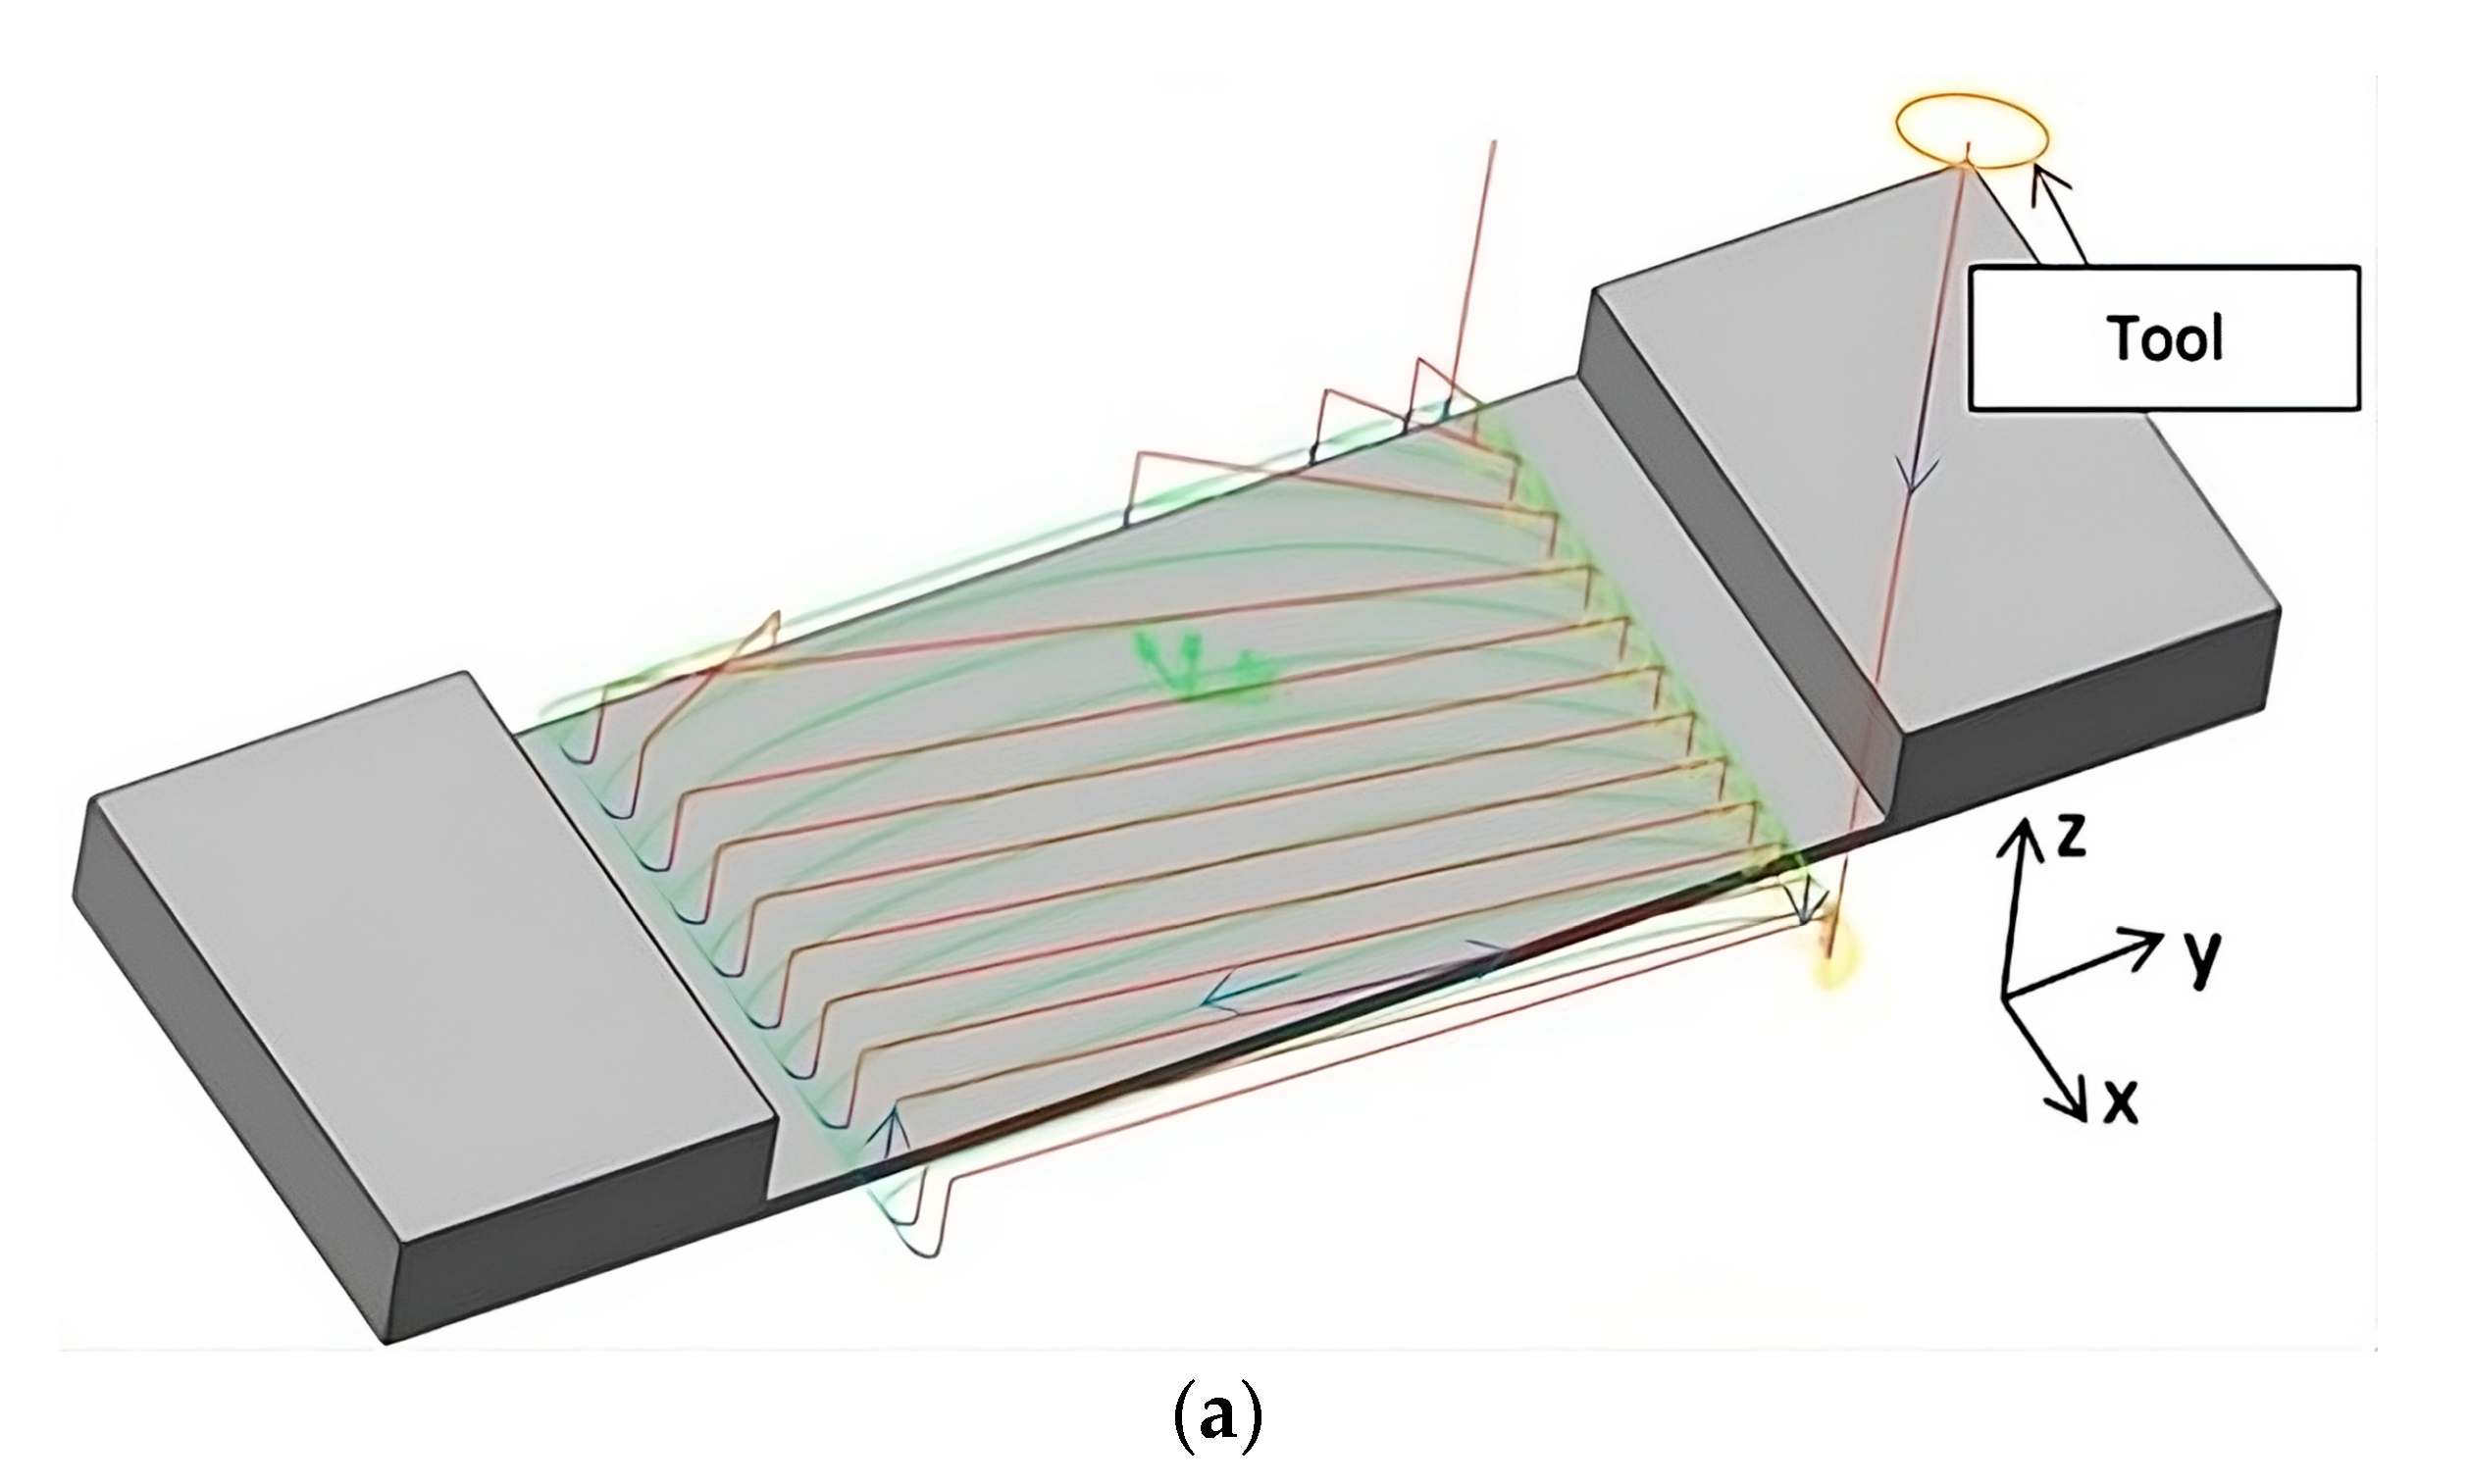
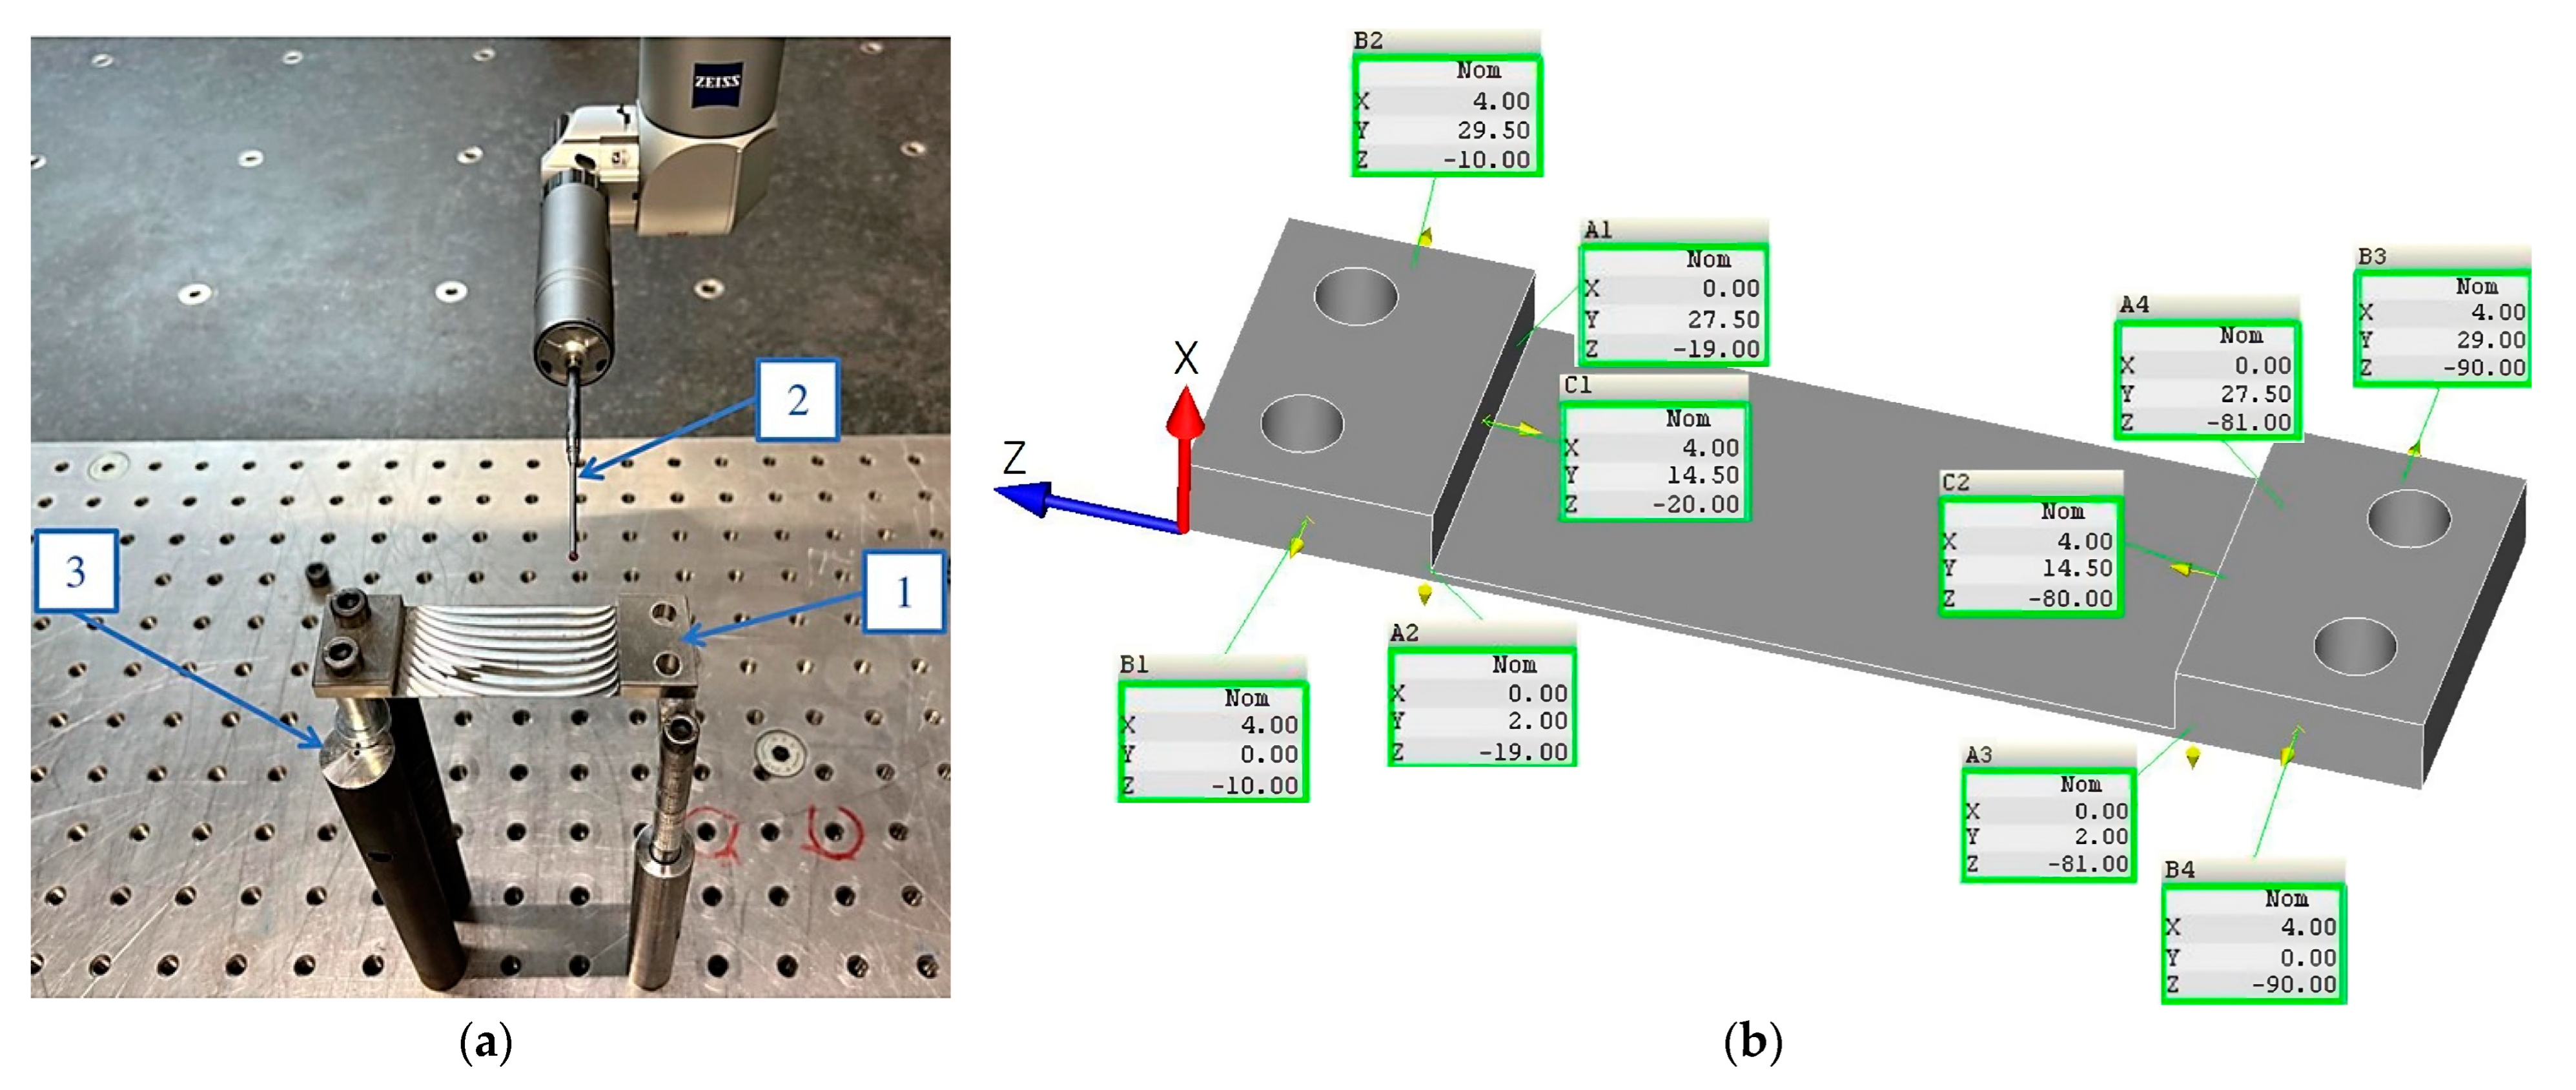
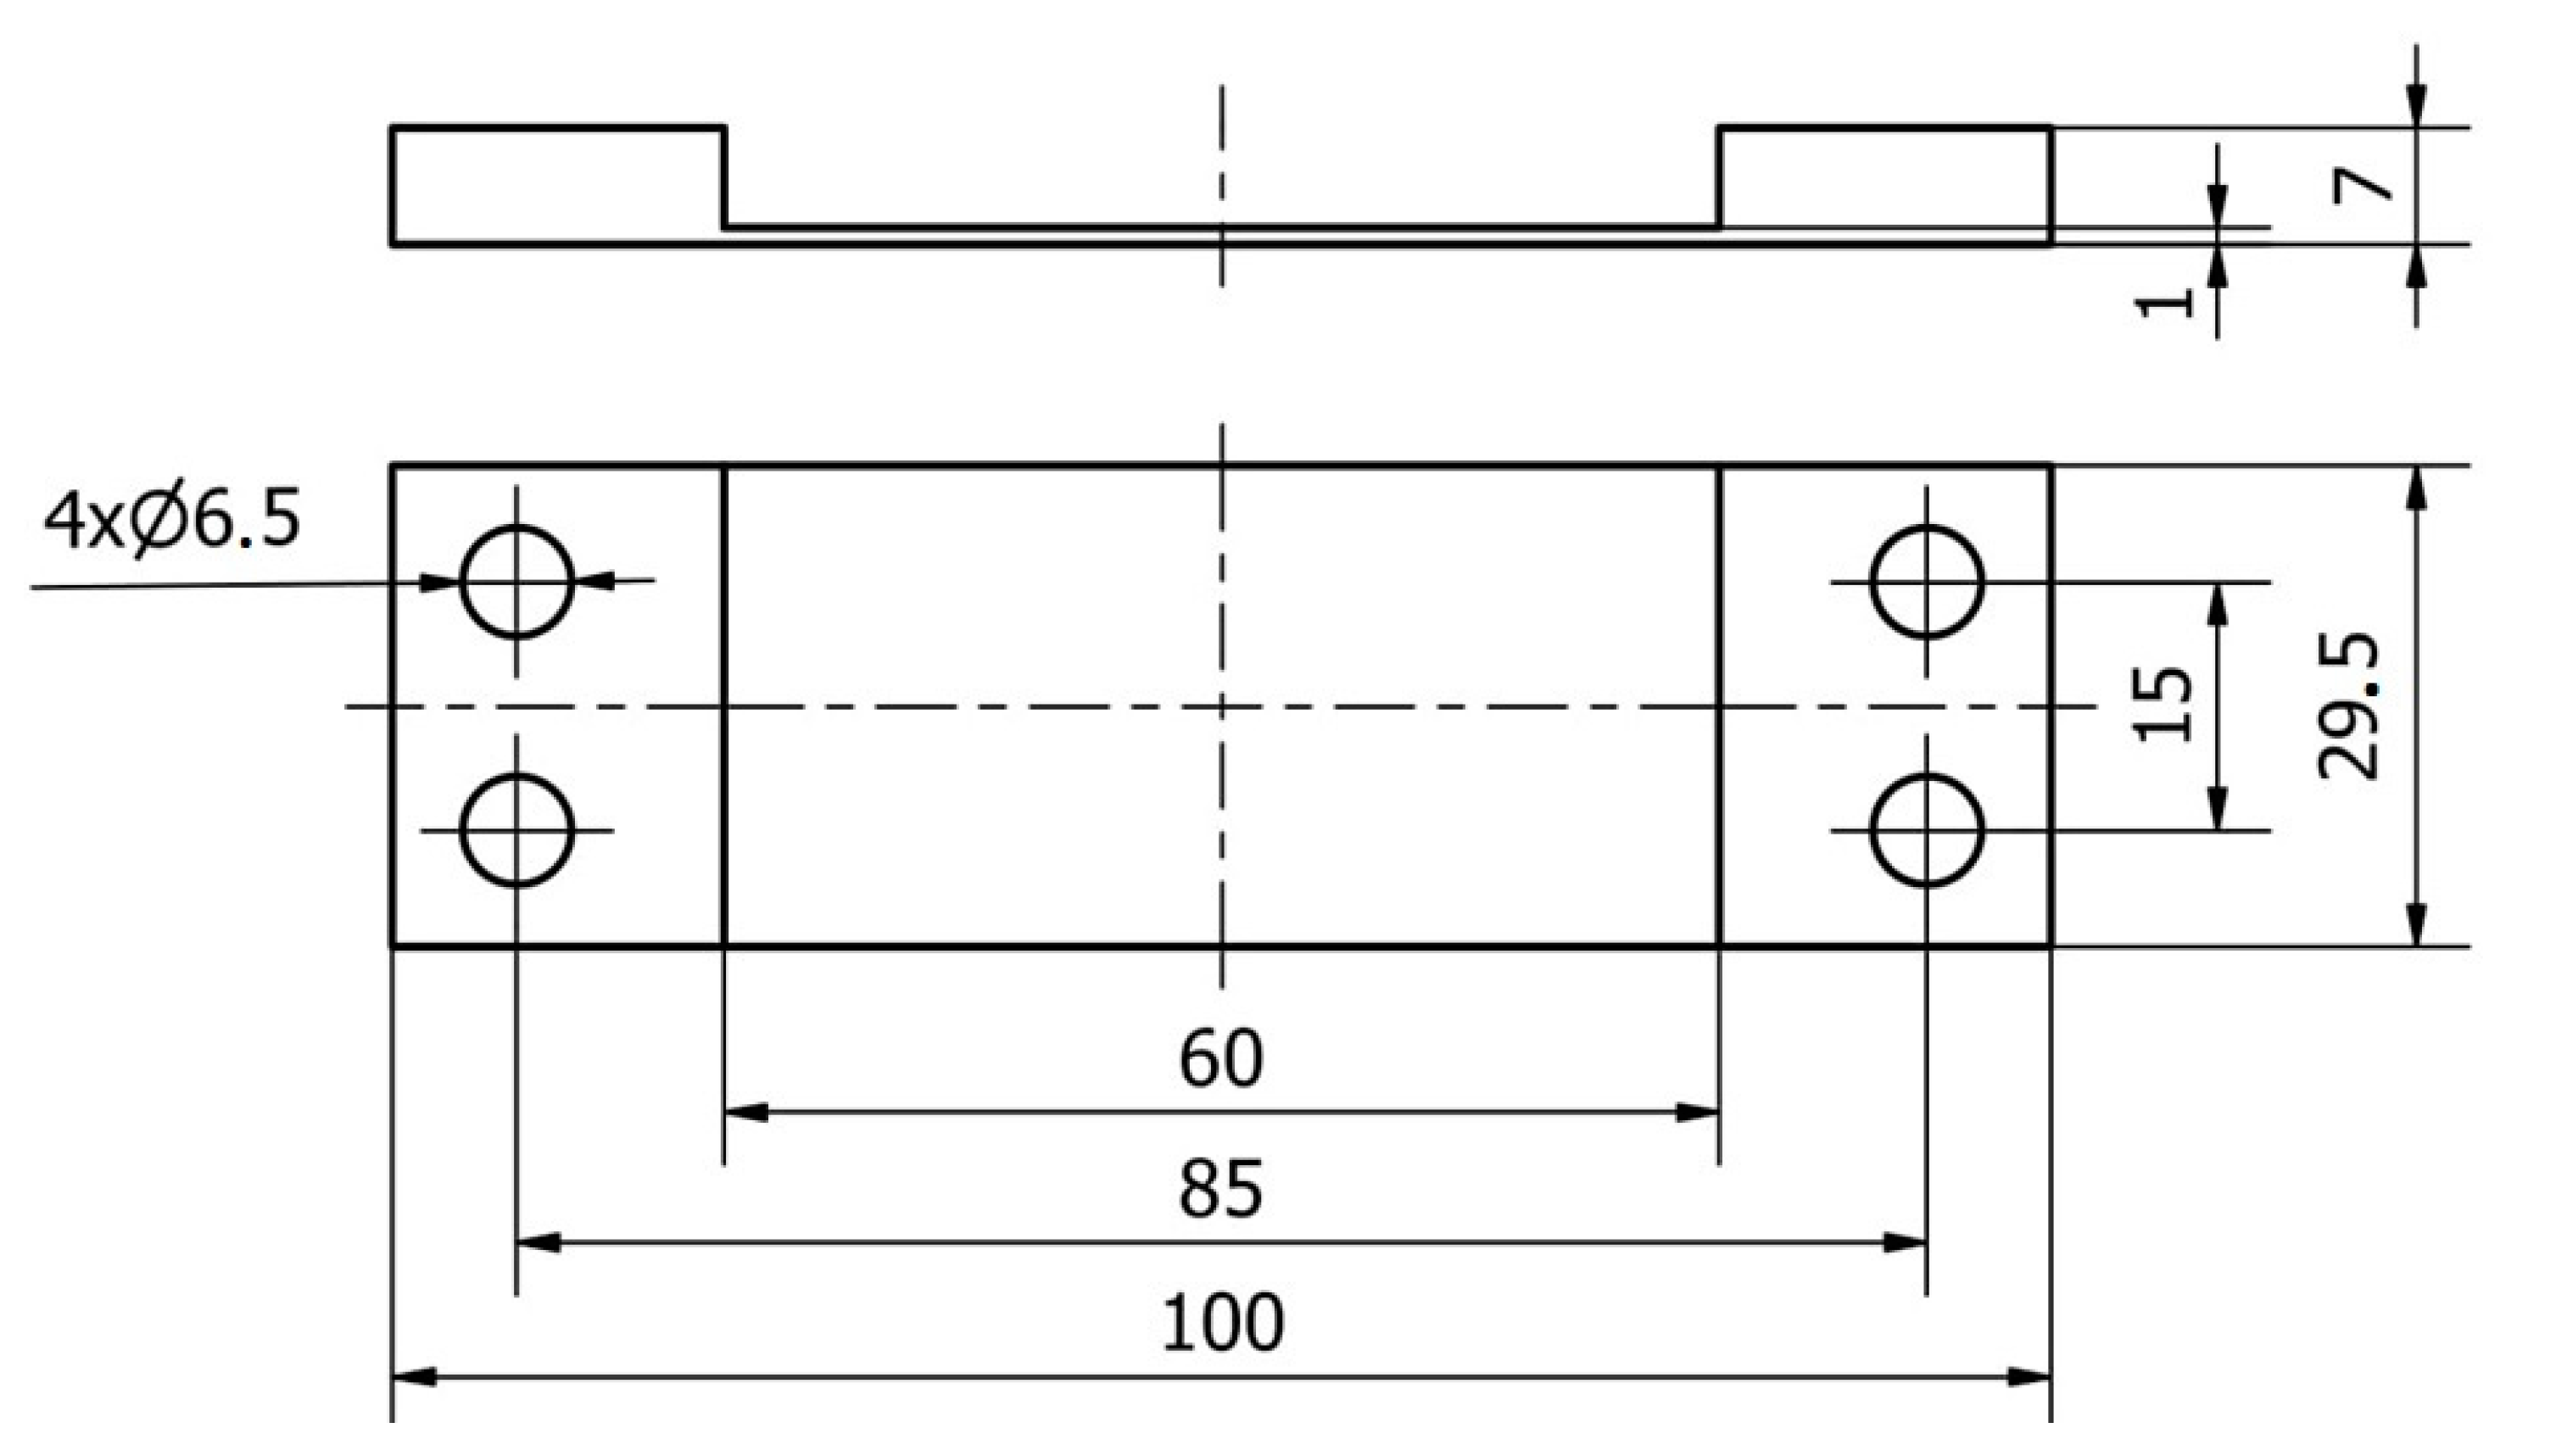
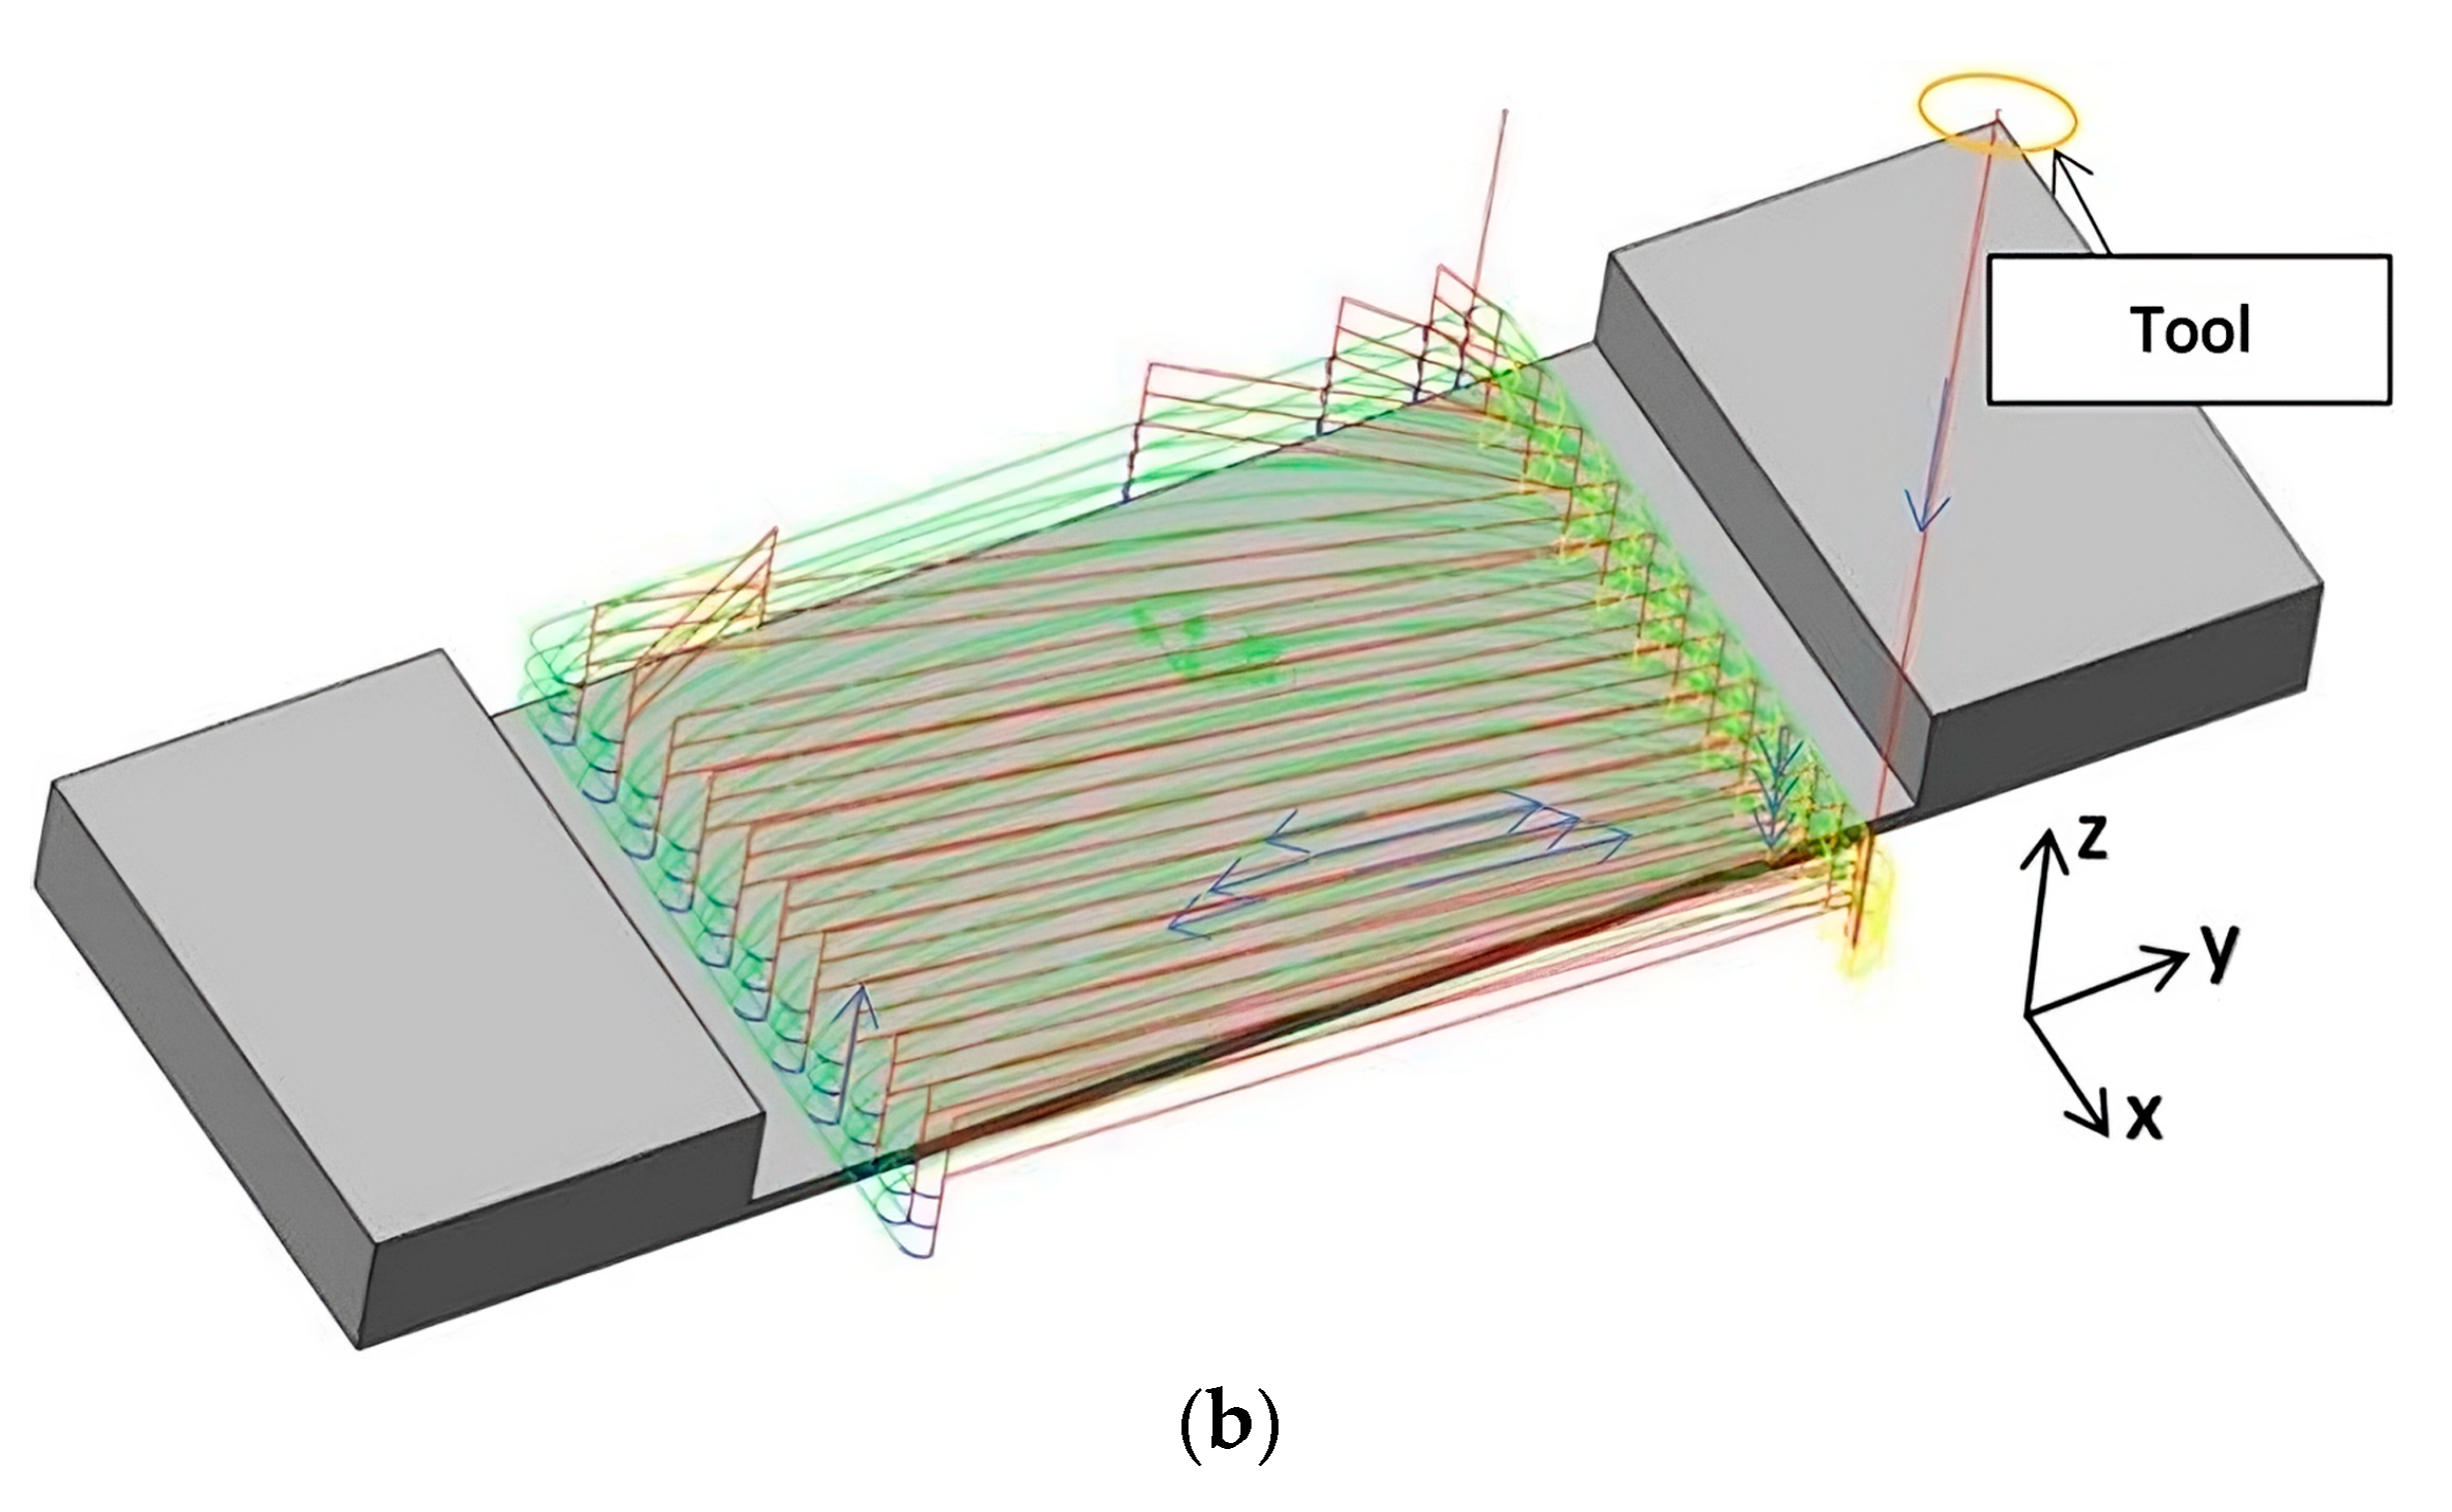
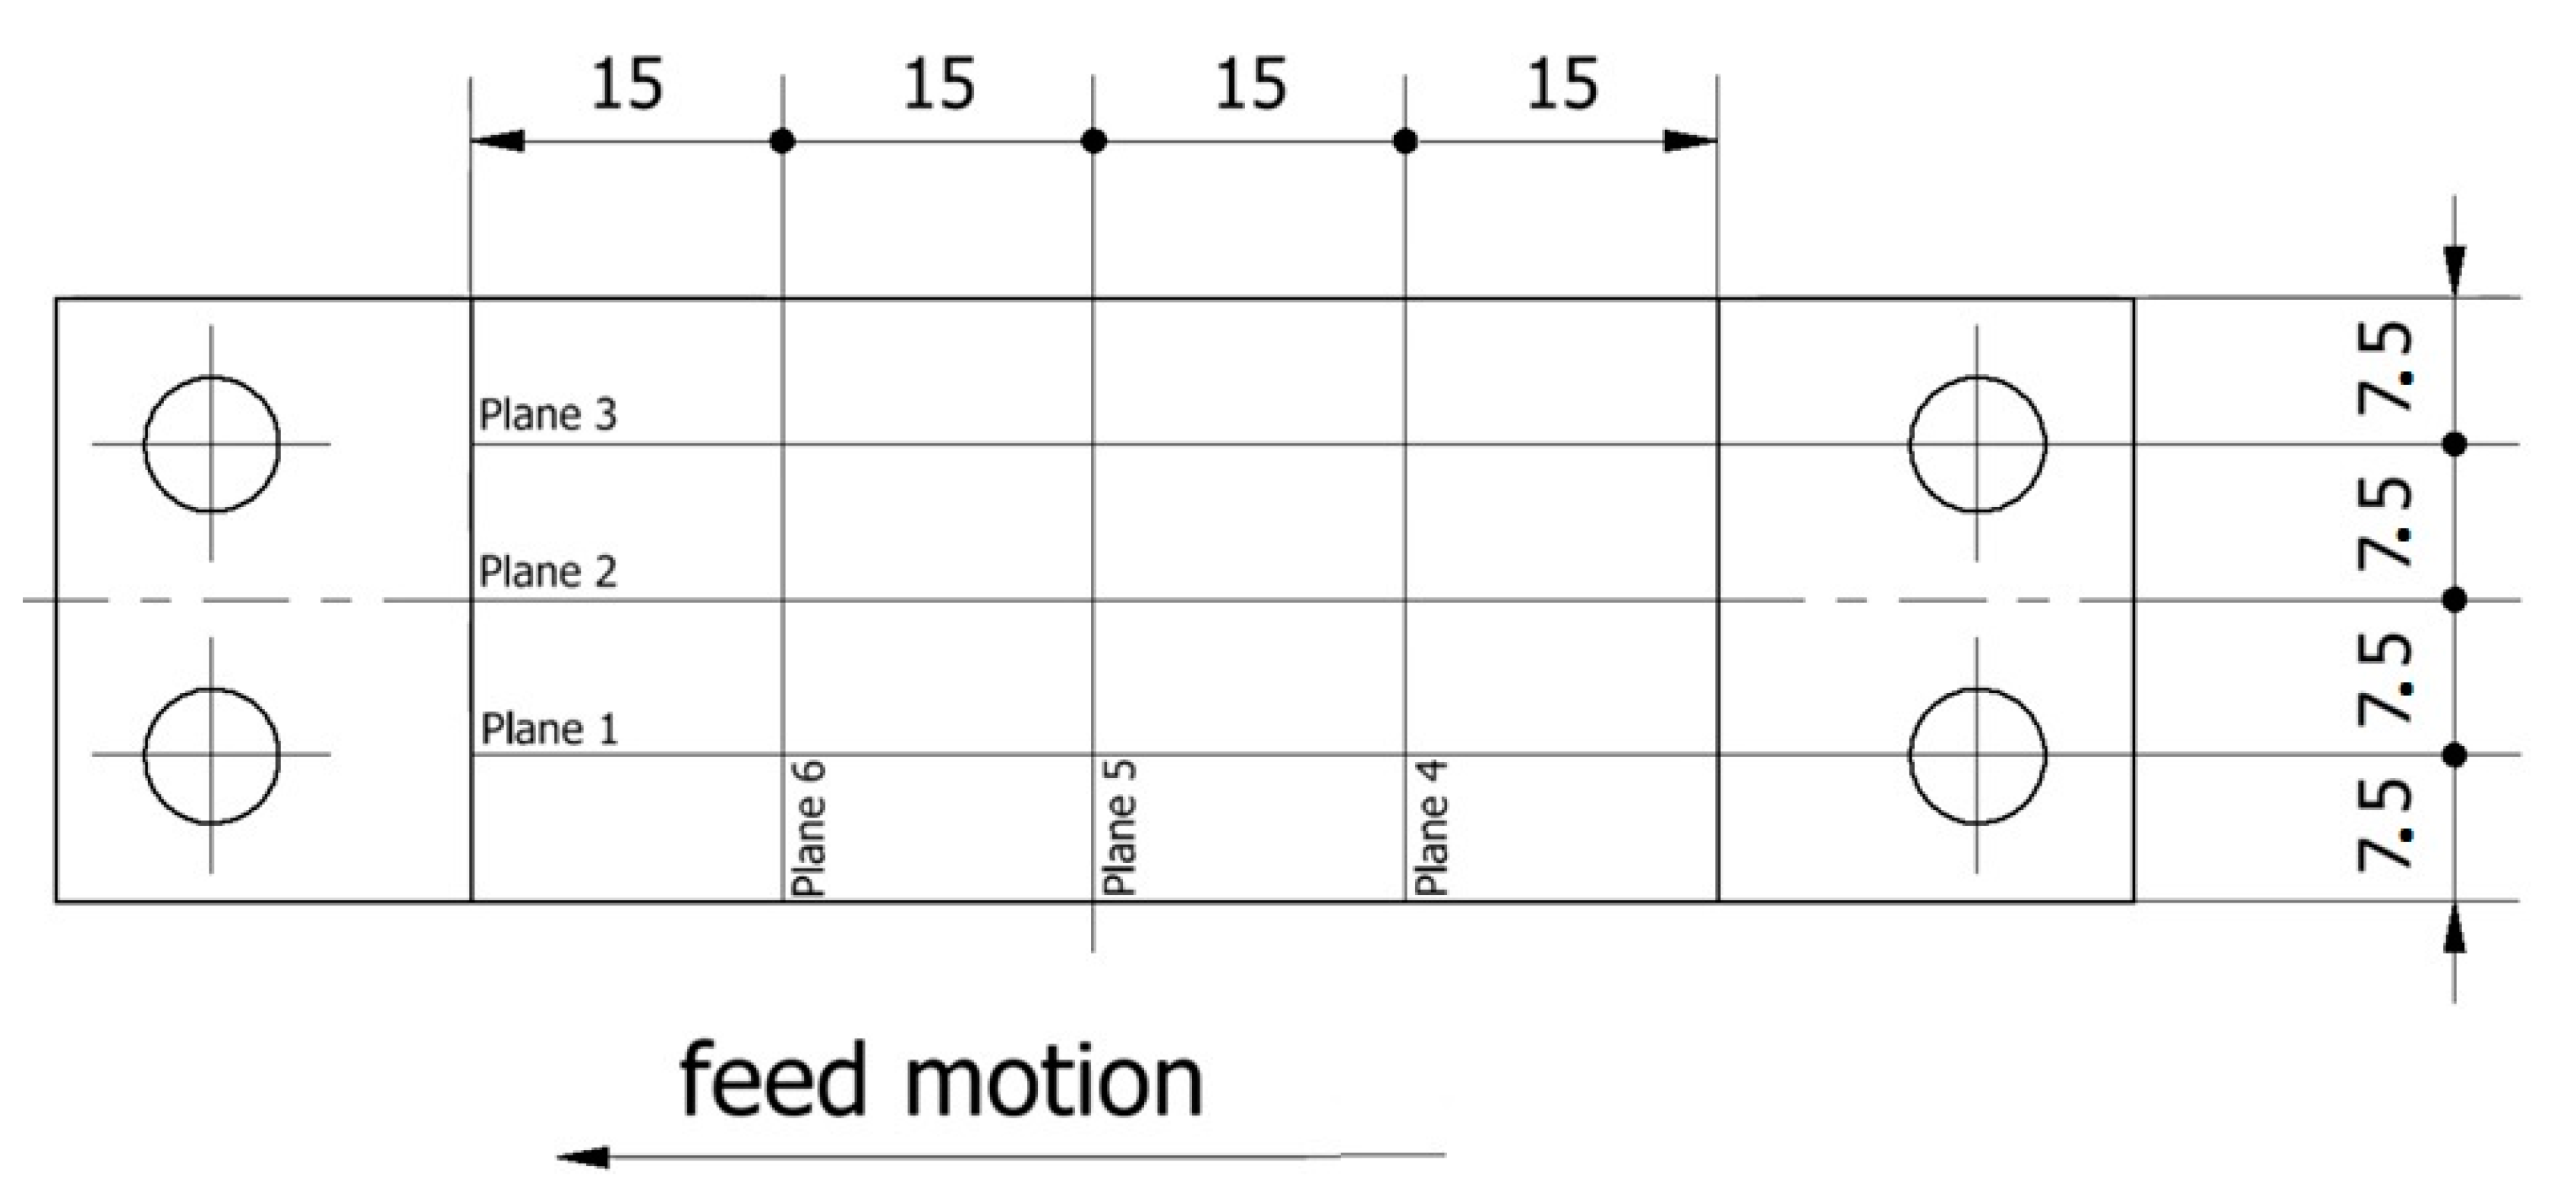
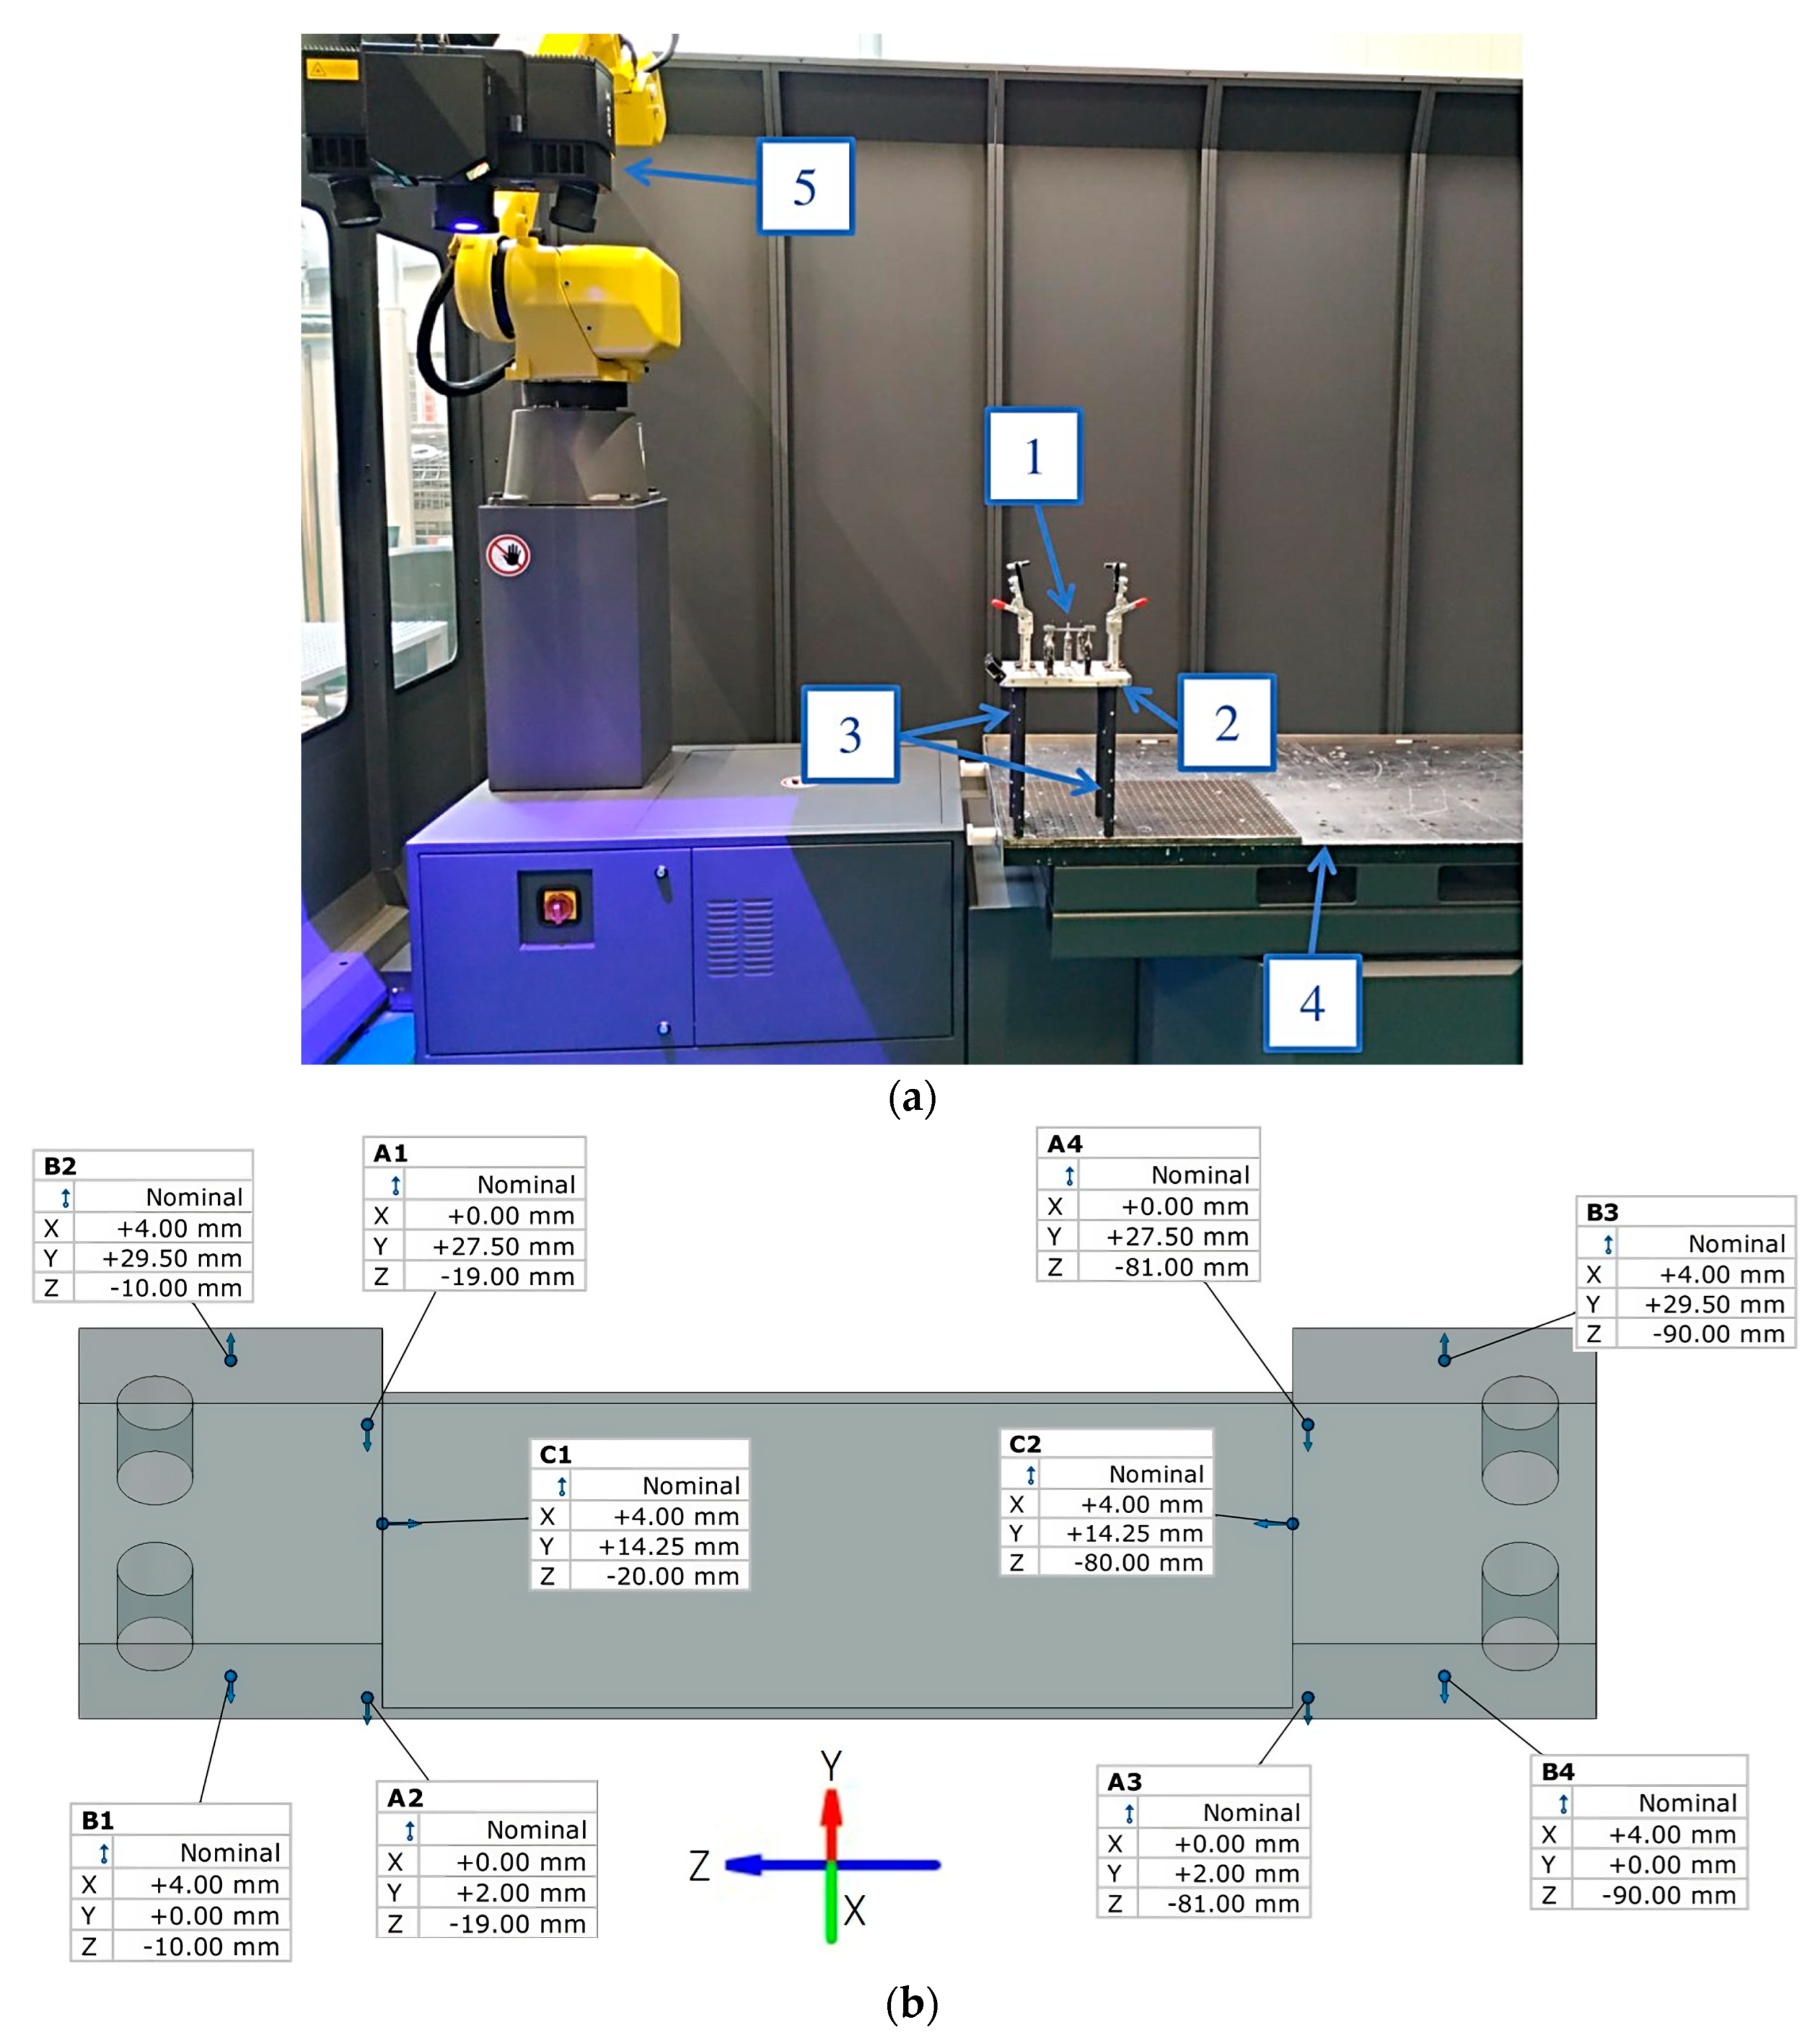
2. Materials and Methods

The same cutting conditions were applied in related papers [1,29]. Below, we provide some information about the experimental conditions.
The material used to machine the samples was Inconel 625 alloy, which is a popular material in the aerospace industry in the nickel alloy group. Nickel alloys, like titanium alloys, find their use in aerospace structures such as engine components in particular, where resistance to high temperatures is required (in the range of 900–1300 °C) [14,15]. Nickel alloys provide excellent heat-resistant properties, which means that they retain their strength, stiffness, dimensional stability, and ductility at much higher temperatures than common materials used in aerospace applications such as titanium alloys or aluminum alloys, and they are also characterized by high fatigue strength, resistance to stress cracking at high temperatures, and resistance to corrosion and oxidation [12]. The material properties and chemical composition of Inconel 625 nickel alloy are shown in Table 1 and Table 2. Thin-walled components such as turbine blades, for example, are observed in aircraft engines. Nickel-based alloys are the most commonly used materials in turbine engines due to their high strength and long fatigue time with good resistance to oxidation and corrosion at high temperatures [12]. The percentage of nickel alloys in the construction of the entire aircraft is small compared to other alloys used in their construction, but they are, nevertheless, the subject of research by scientists [30,31,32,33] due to the use of these materials in severe operating conditions [16].
A series of six nickel alloy specimens (Figure 1) were machined (milling) at a constant cutting speed of Vc = 40 m/min and feed rate of Vf = 255 mm/min using different machining strategies on a Mikron VCE 600 P-type numerical machine tool. During machining, SILUB MAX coolant was used—a water–oil emulsion with a mixture of 15% oil emulsion and 85% water [34].
Three ∅10 mm diameter monolithic cutters were used in the milling process: JS554100E2R050.0Z4-SIRA (the tool for general purpose—dedicated to machining all materials), JS754100E2C.0Z4A-HXT (the tool for high-performance machining—dedicated to machining titanium alloys and nickel superalloys), and JH730100D2R100.0Z7-HXT (the tool for high-speed machining—dedicated to machining titanium alloys and nickel superalloys) [35,36,37].
We adopted two different approaches for adaptive milling—face and cylindrical. During adaptive face milling, we assumed a depth of cut of 2.00 mm and a radial depth of 4.00 mm (Figure 2a). For adaptive cylindrical milling, we assumed a depth of cut of 6.00 mm and a radial depth of 1.33 mm (Figure 2b). Based on the feed rate, depth of cut, and depth of cut presented, one can see that the value of material removal rate MRR is constant and equal to 2.03 cm3/min. Table 3 shows the combination of cutting tools and cutting strategies used for the Inconel 625 nickel alloy samples marked N1–N6.
We assumed the determination of measuring cross-sections in three planes in the parallel direction (numbered 1–3 for machined surface and 1′–3′ for bottom of sample) and in the direction perpendicular (numbered 4–6 for machined surface and 4′–6′ for bottom of sample) to the direction of the cutter’s feed motion (Figure 3).
We carried out optical measurements using an Atos ScanBox 6130 optical scanner designed by GOM (Braunschweig, Germany) and prepared the results and measurement report in GOM Inspect 2020 (2020.0.4.135965). The experimental setup is shown in Figure 4a while the basing method used during optical measurement is shown in Figure 4b.
We performed the contact measurement using a Zeiss Contura coordinate measuring machine (Figure 5a) and recorded the results in Zeiss Calypso 2020 software which facilitates creating a report. During the contact method measurements, we used the same basing method (Figure 5b) and the same measurement conditions as for the optical method measurements (Figure 4b).
Given thin-wall deviations determined using both measurement methods, we carried out statistical analysis in Statistica v13.3, using the values obtained at each measurement point. We adopted the symbol “MS” for the values on the machined surface and “BOF” for the deviations measured from the bottom of the sample. In the first step, we prepared box-plot diagrams showing the average values, standard errors, and standard deviations. In the second step, we collected the average values, medians, minimum and maximum values, variances, standard errors, and standard deviations.

3. Results and Discussion

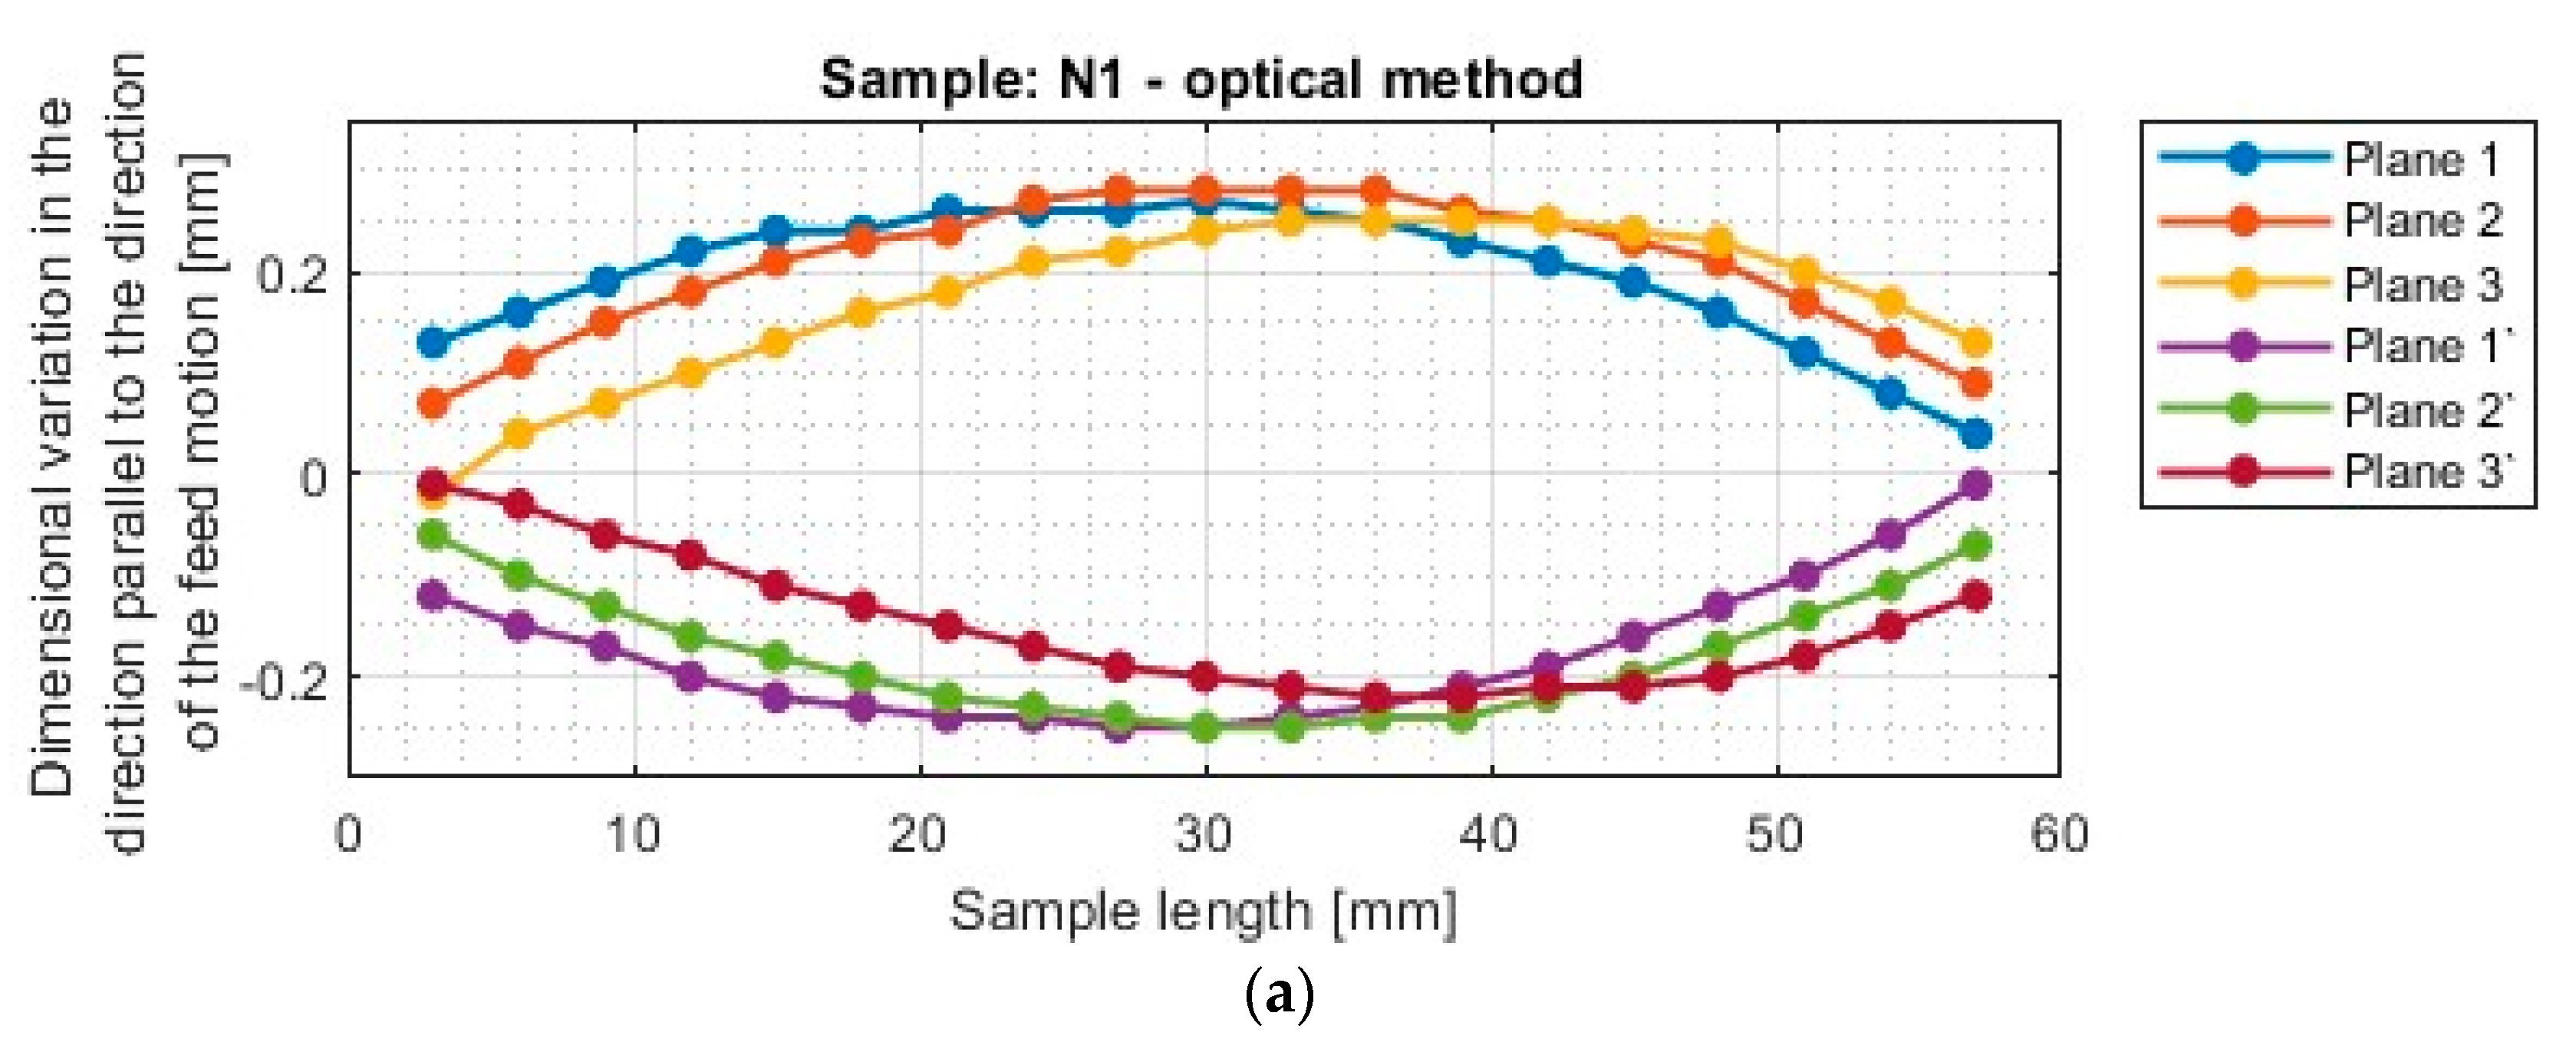
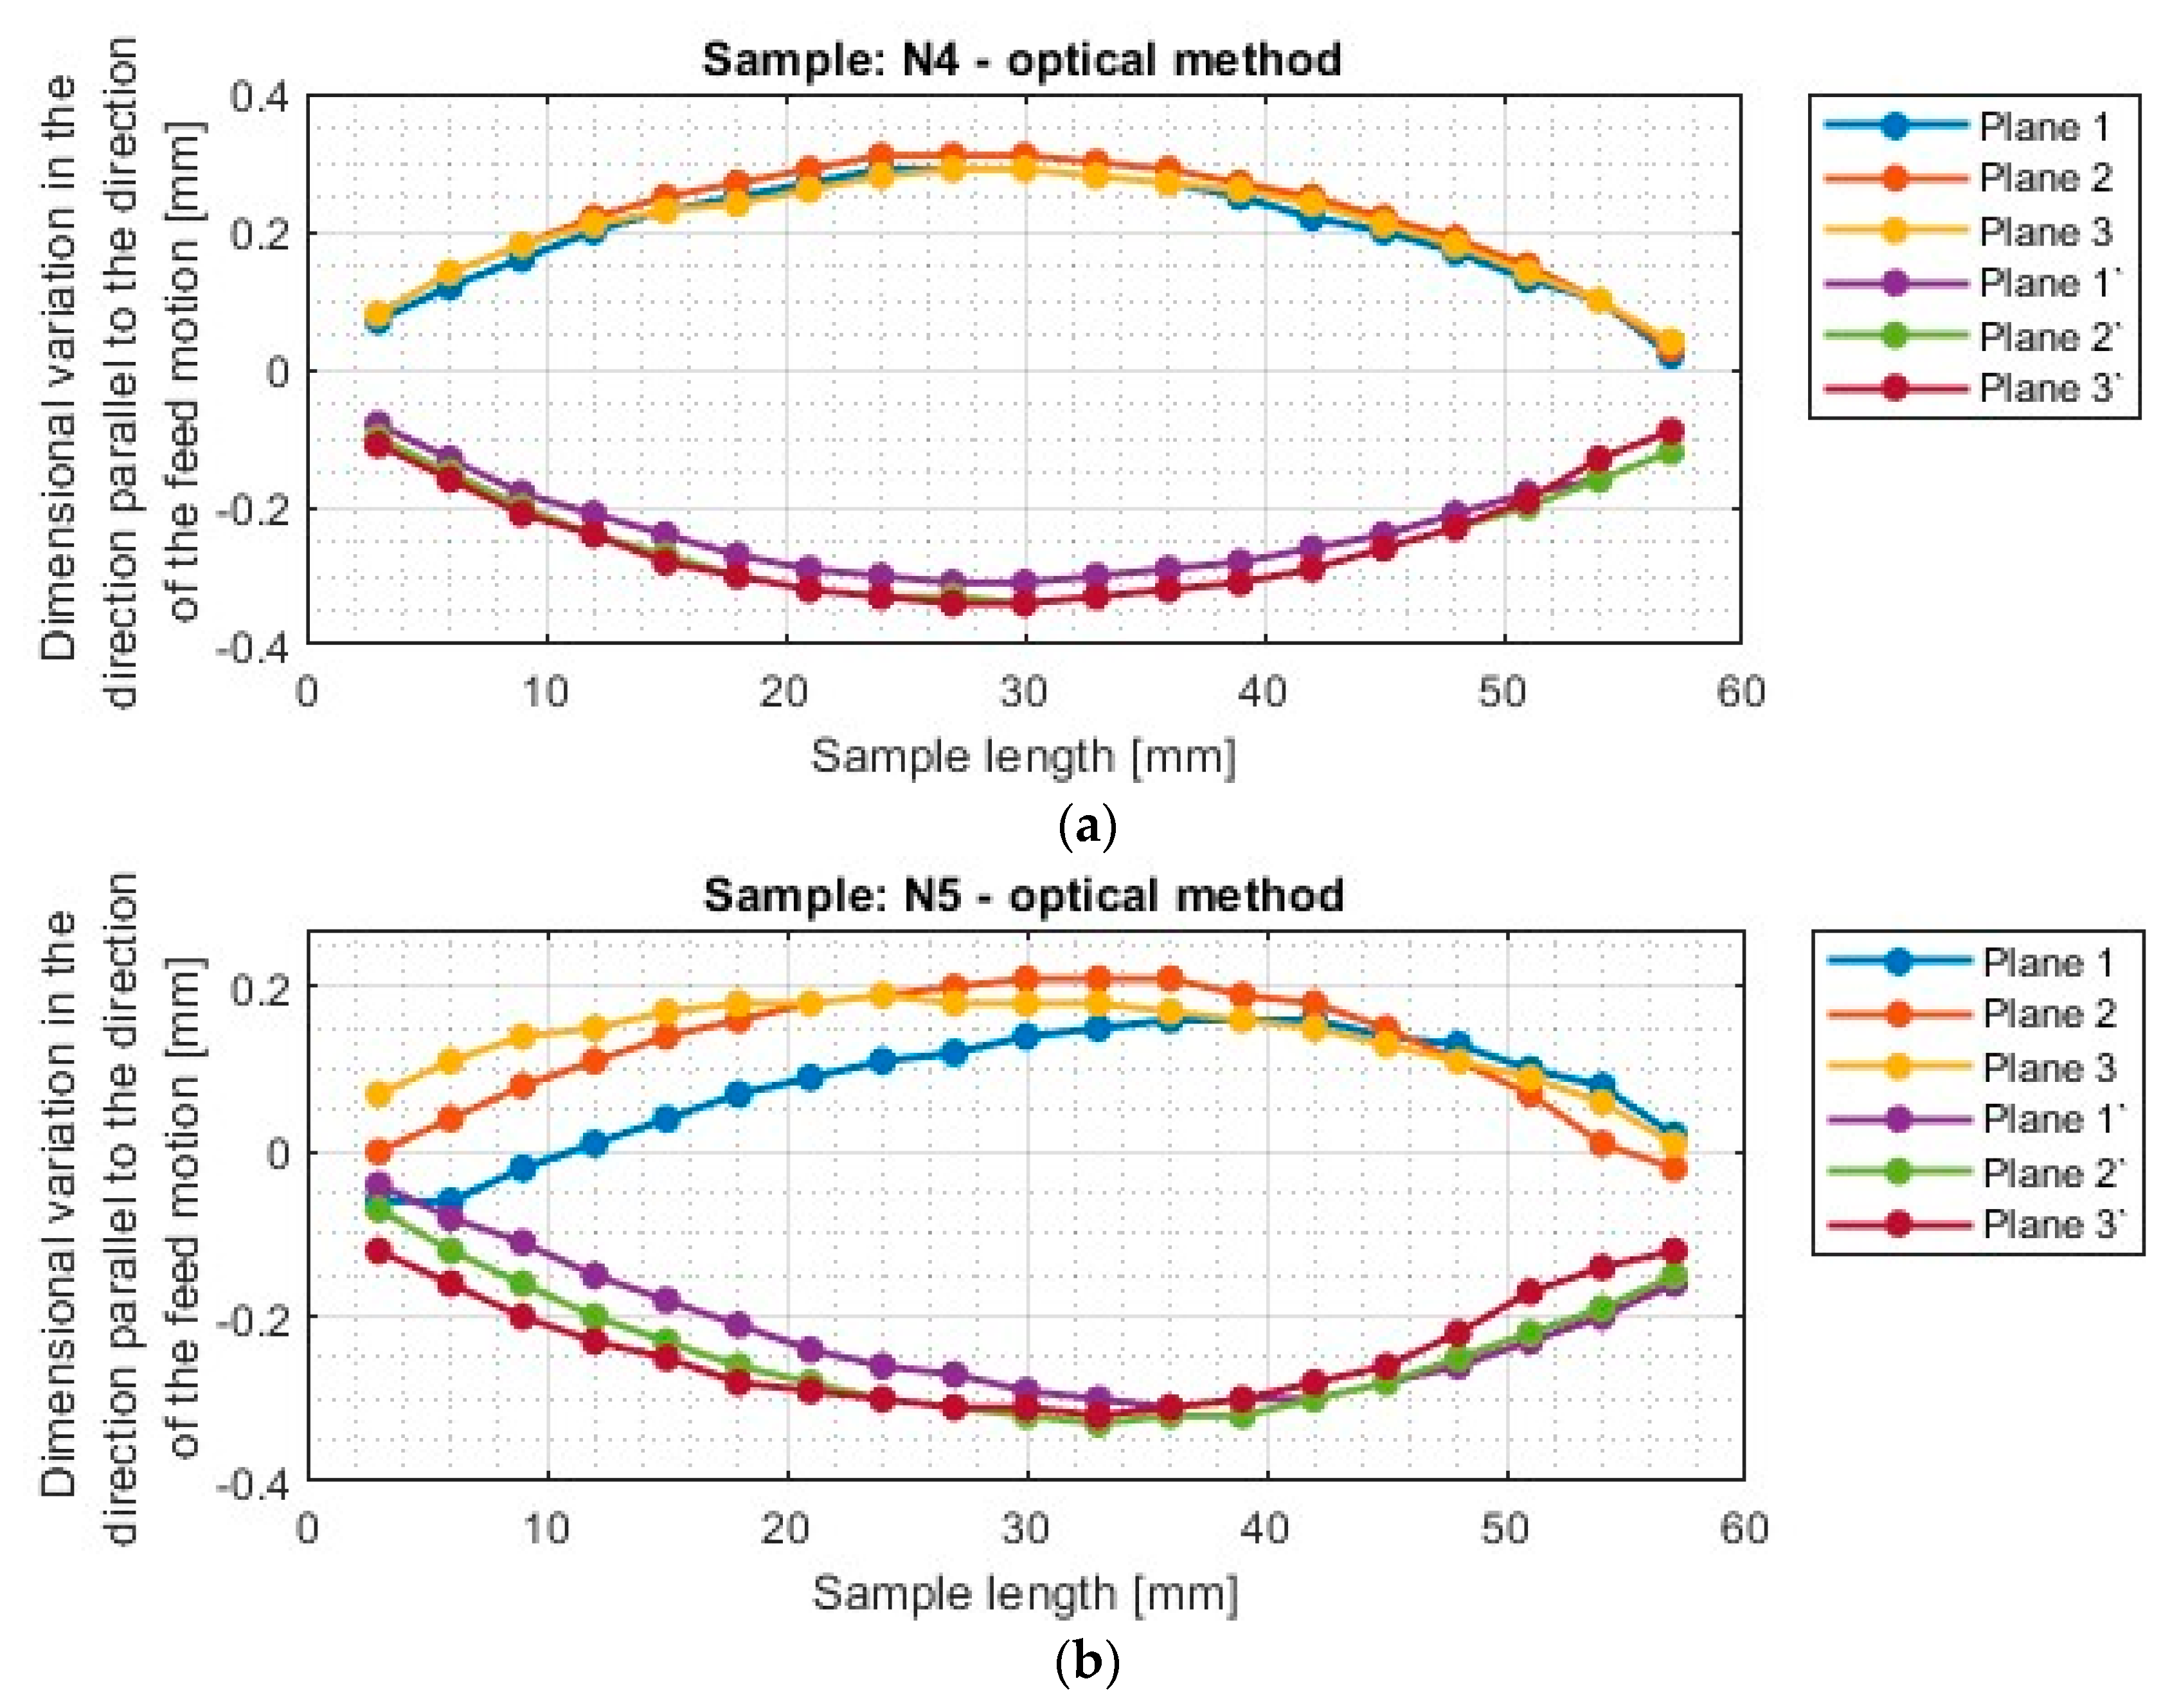
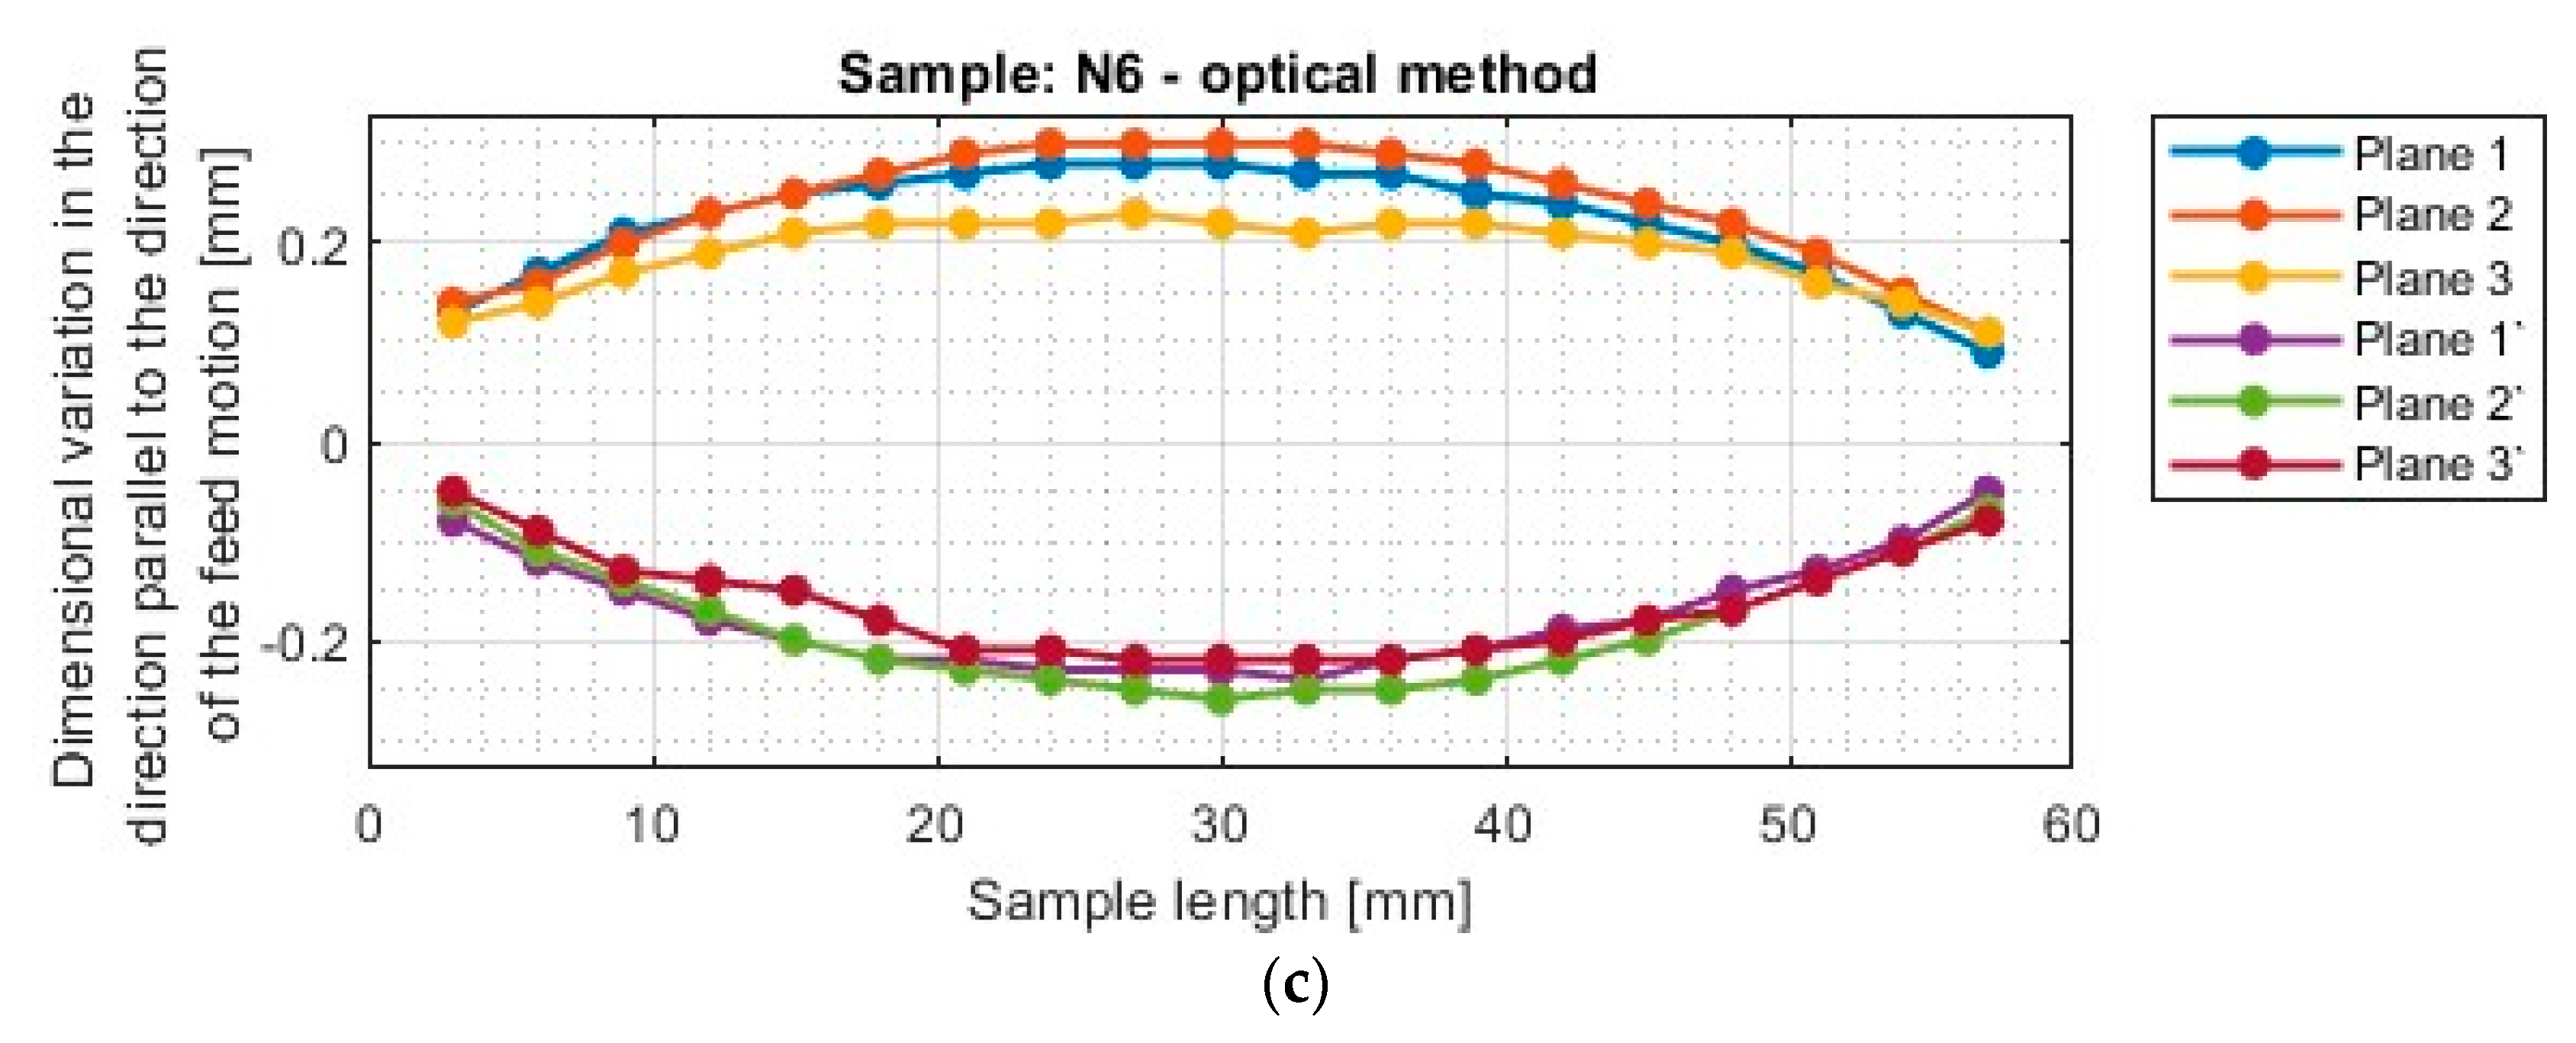
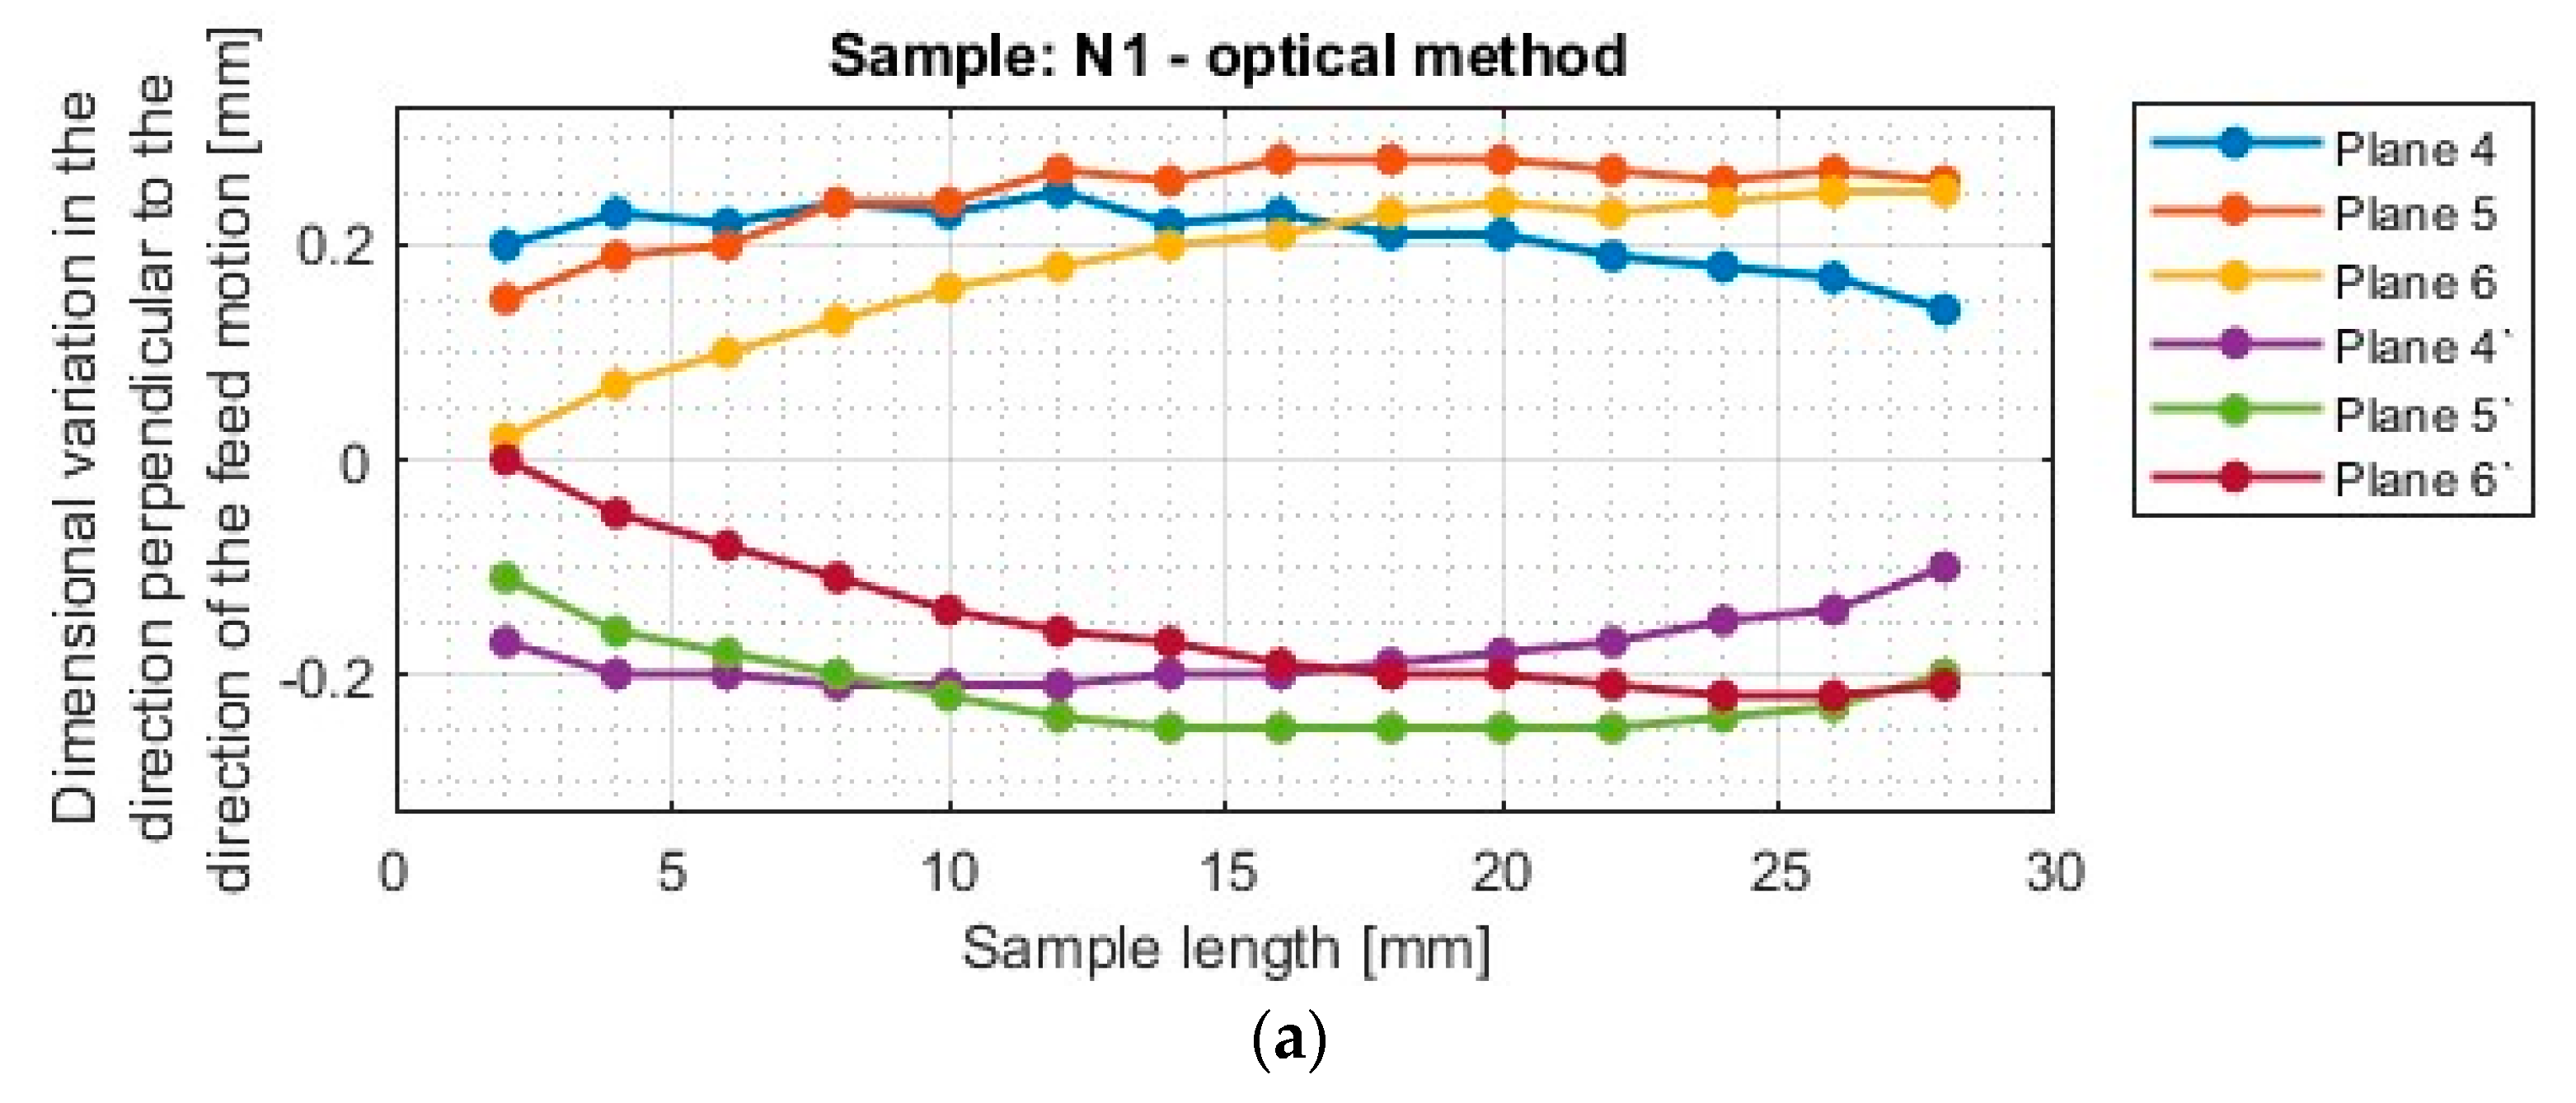
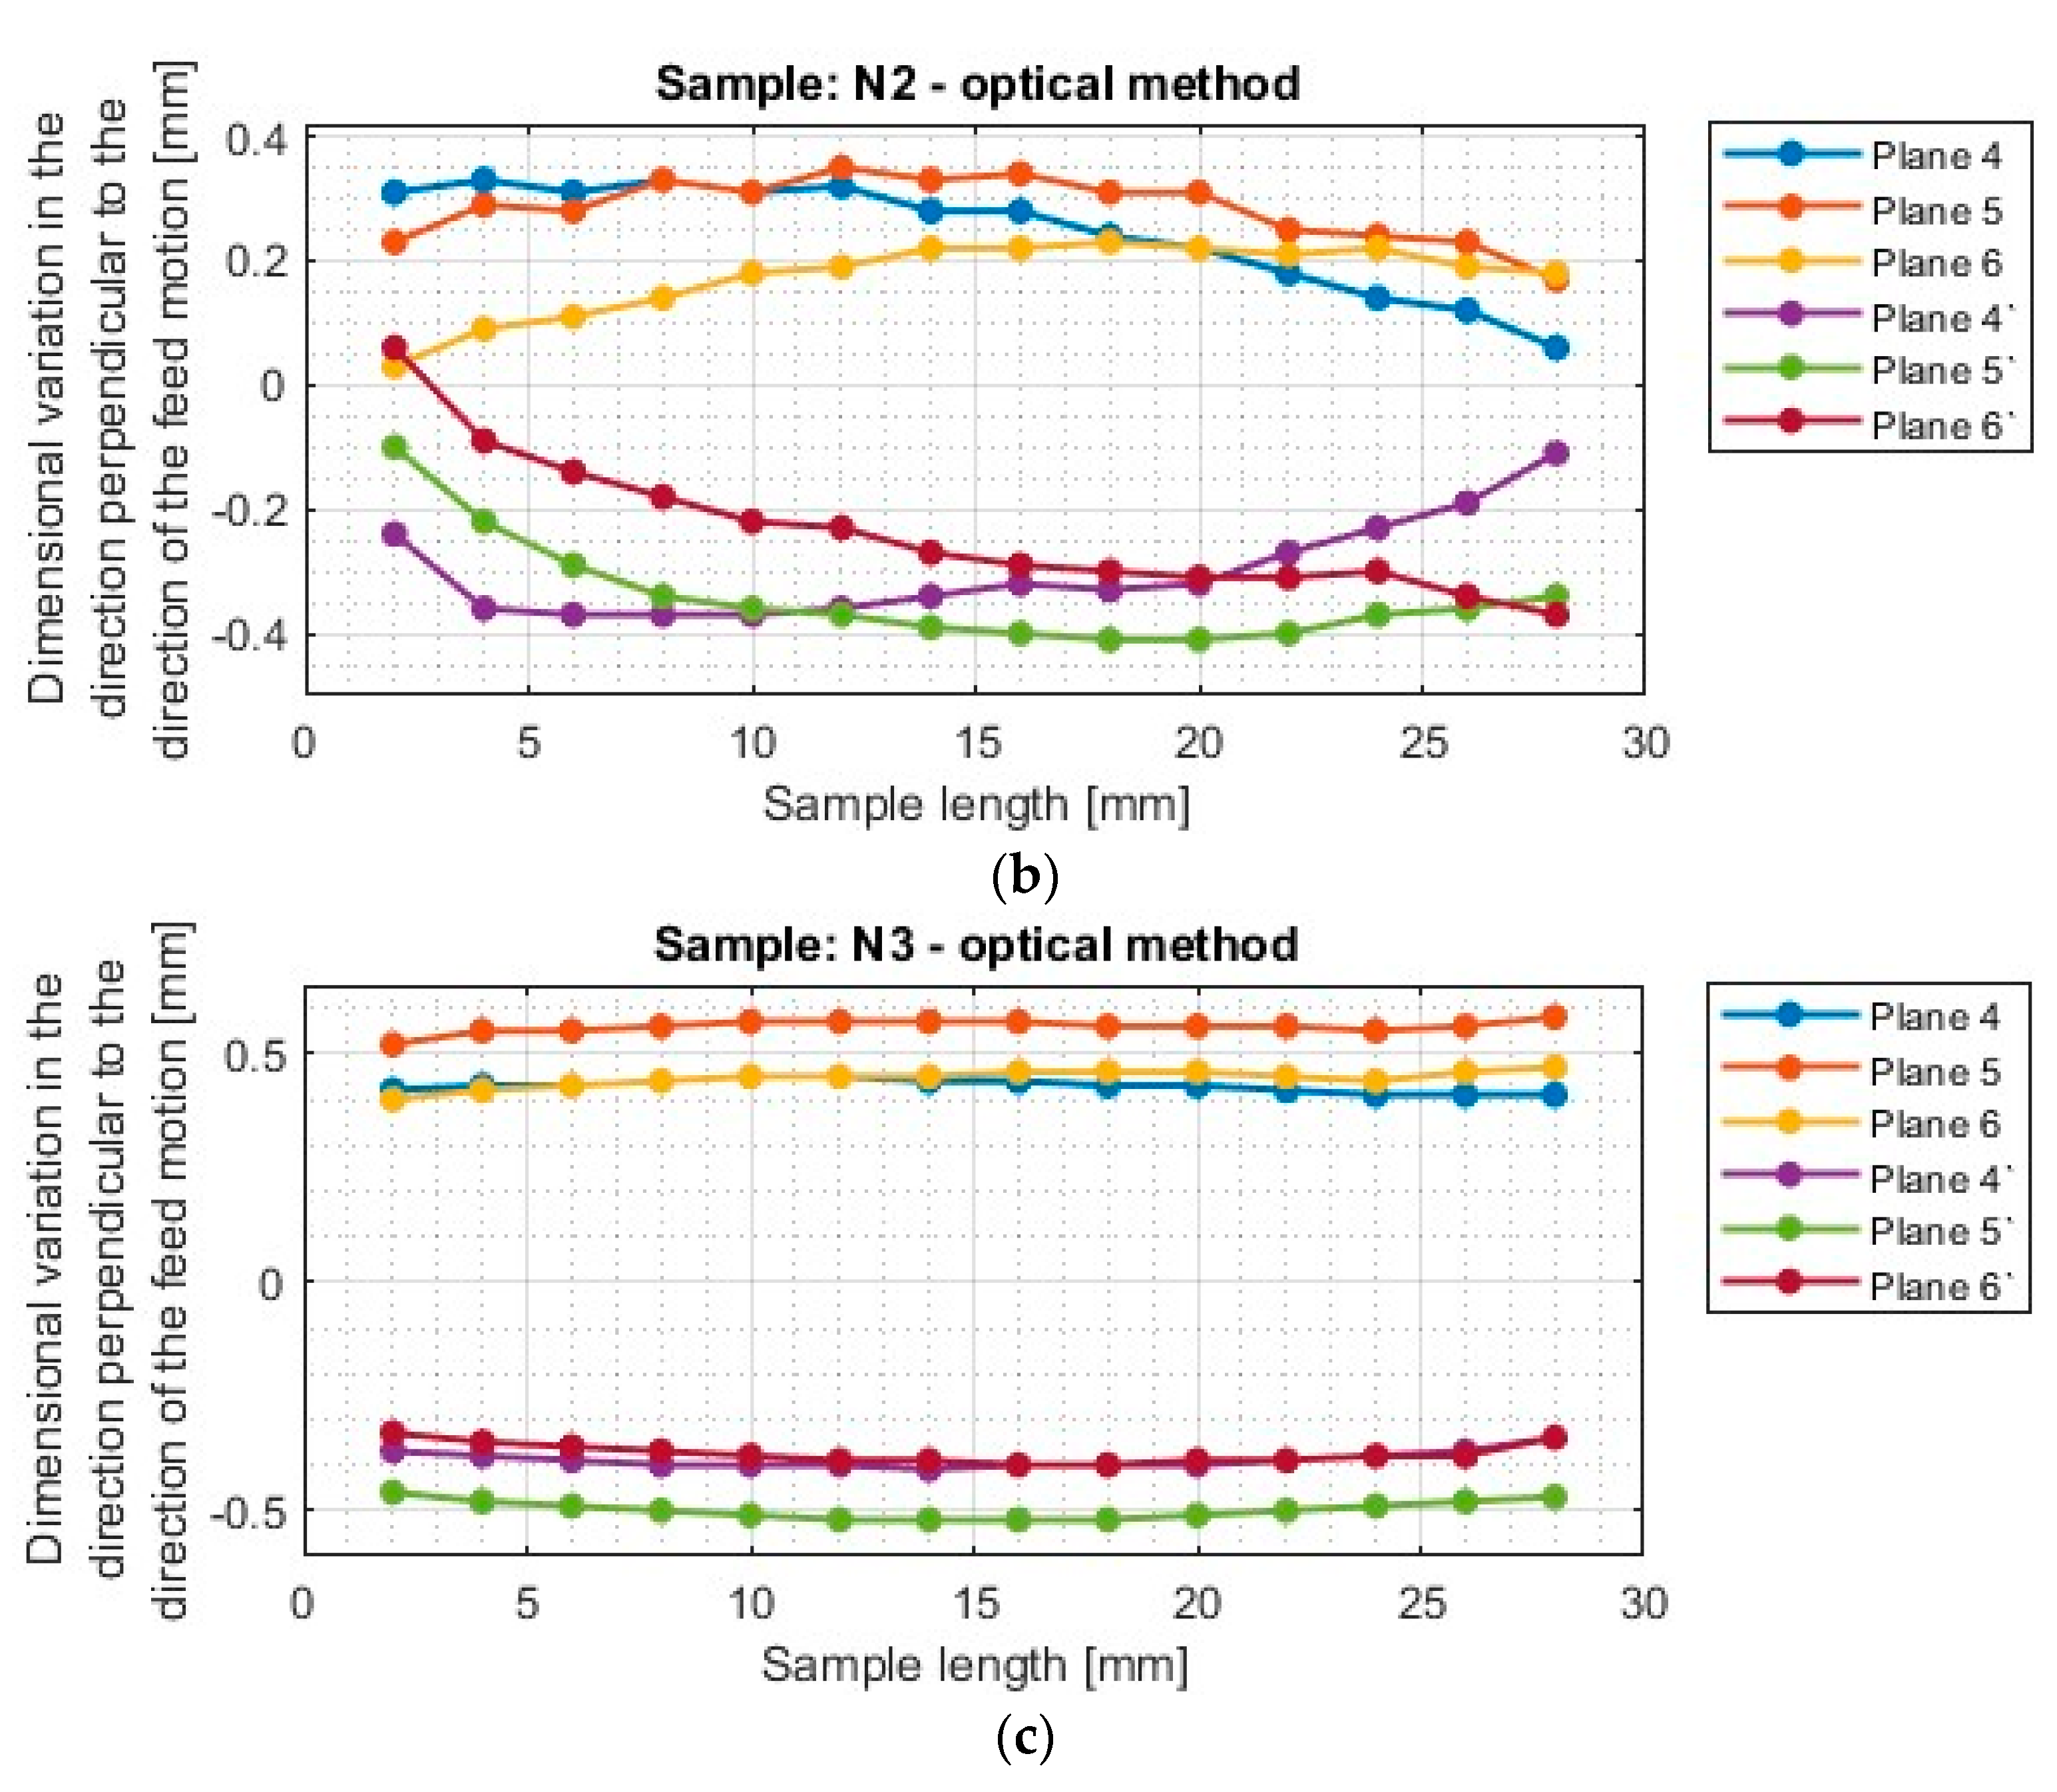
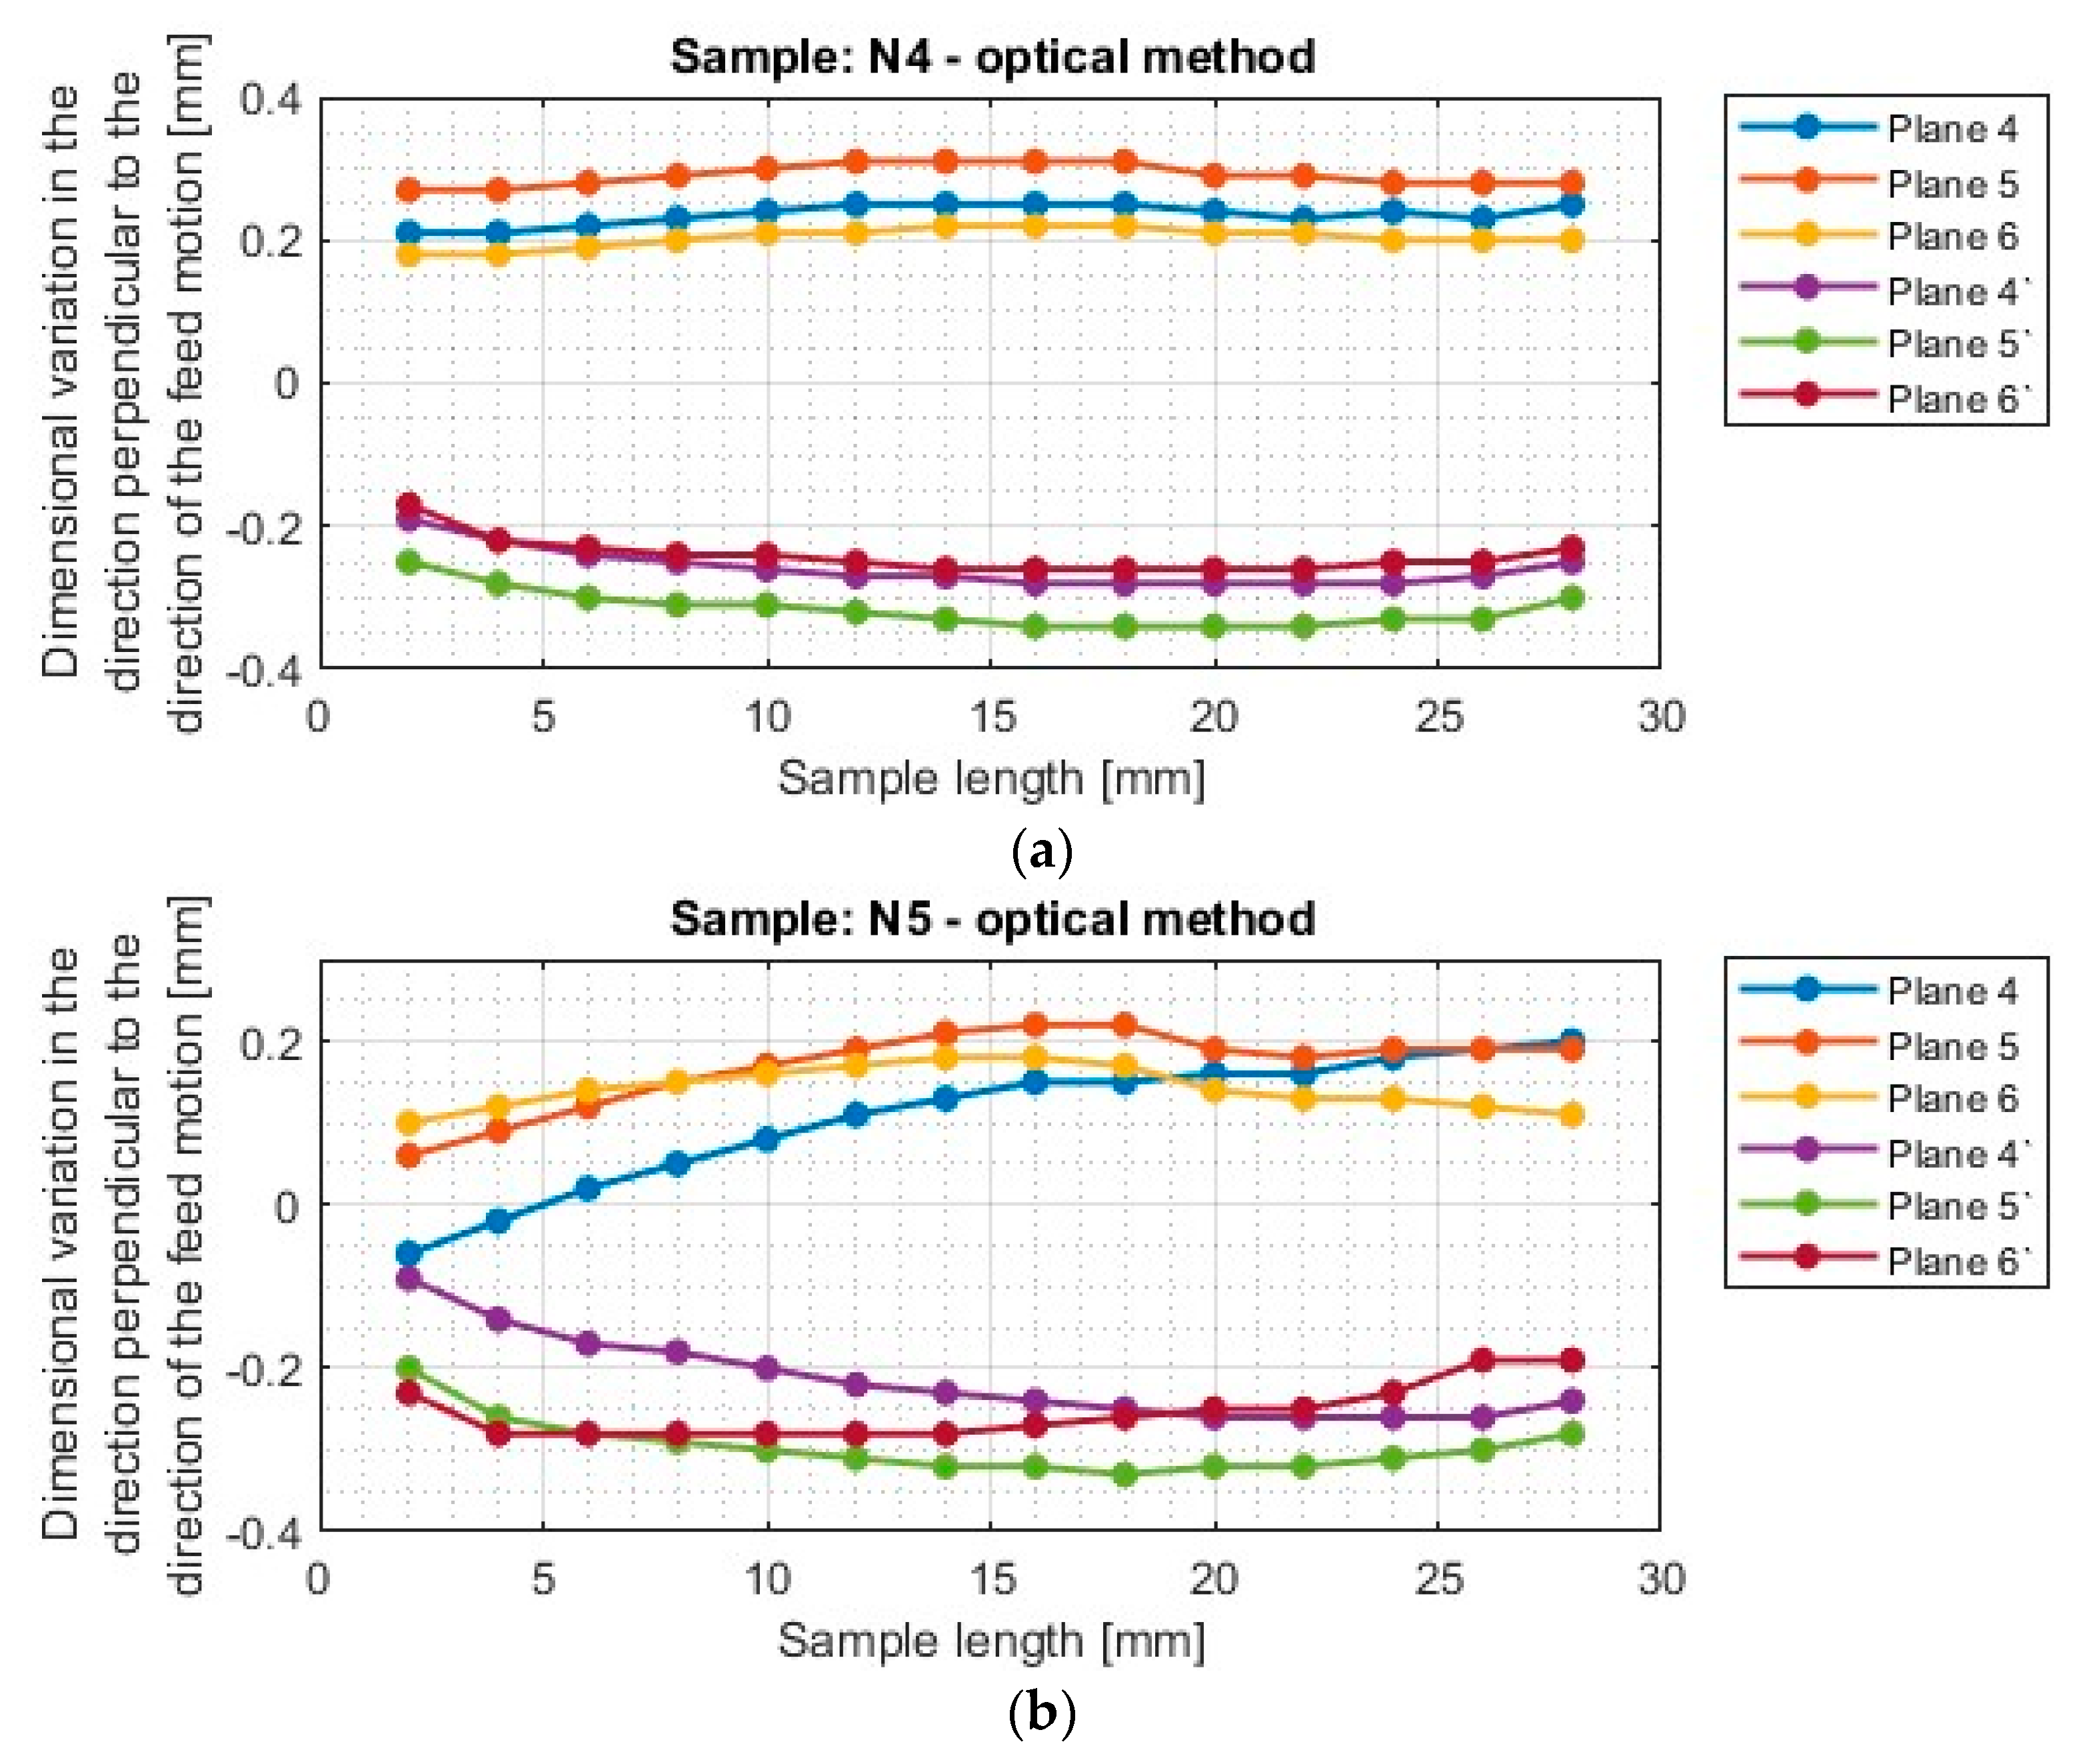
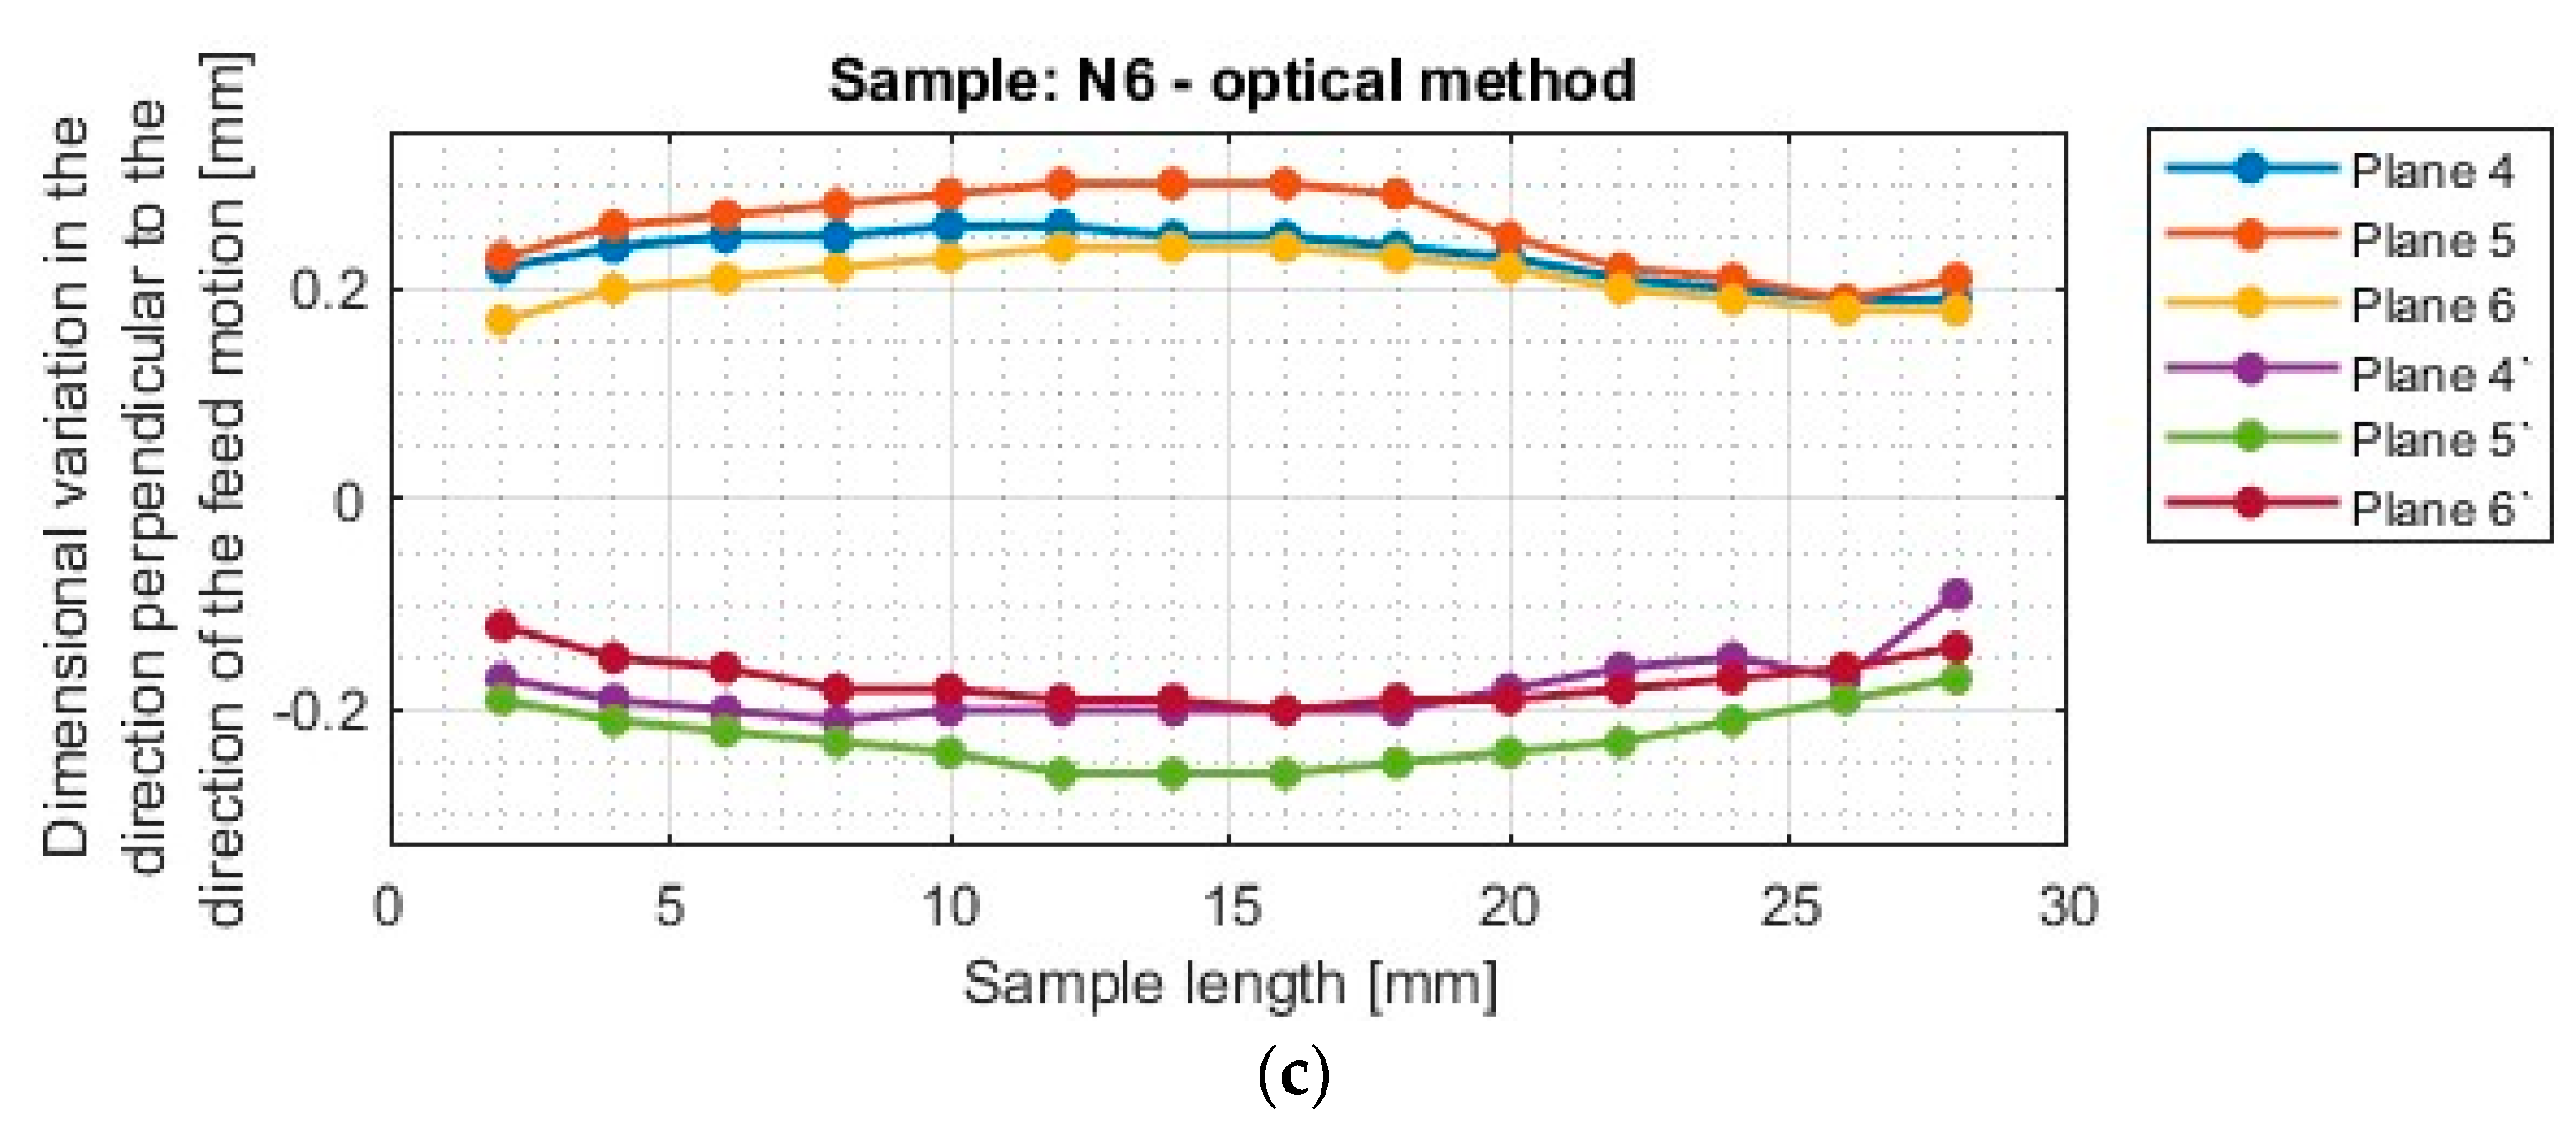
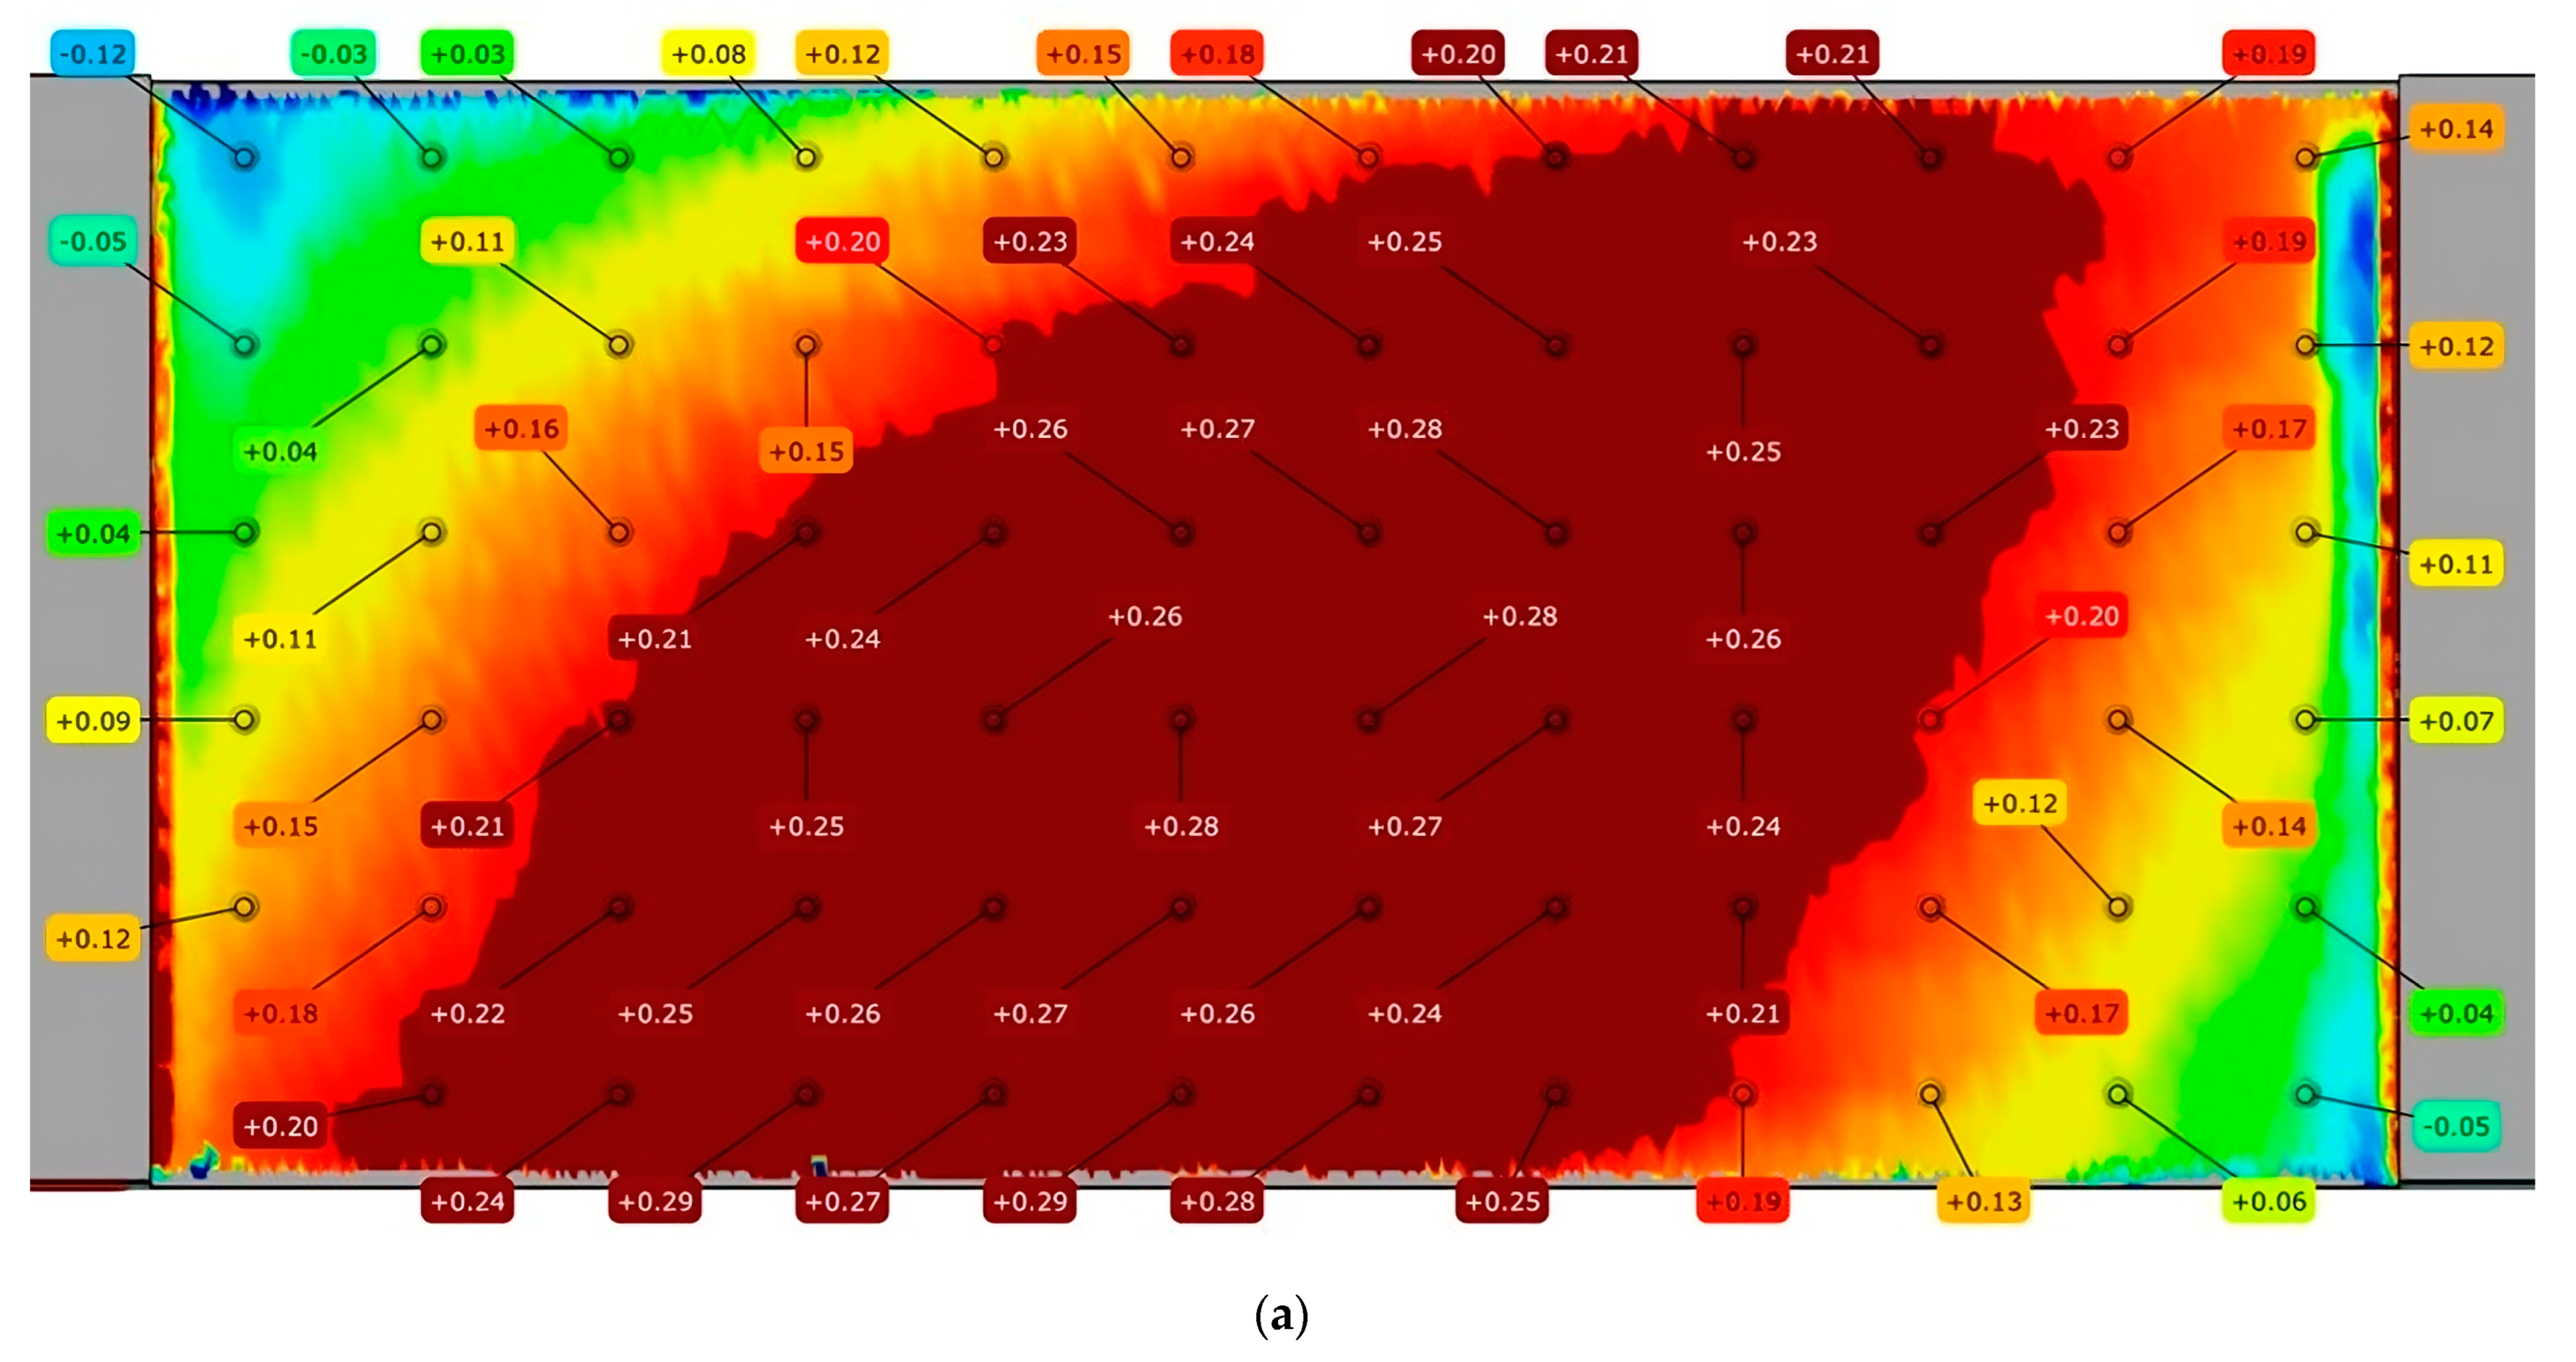
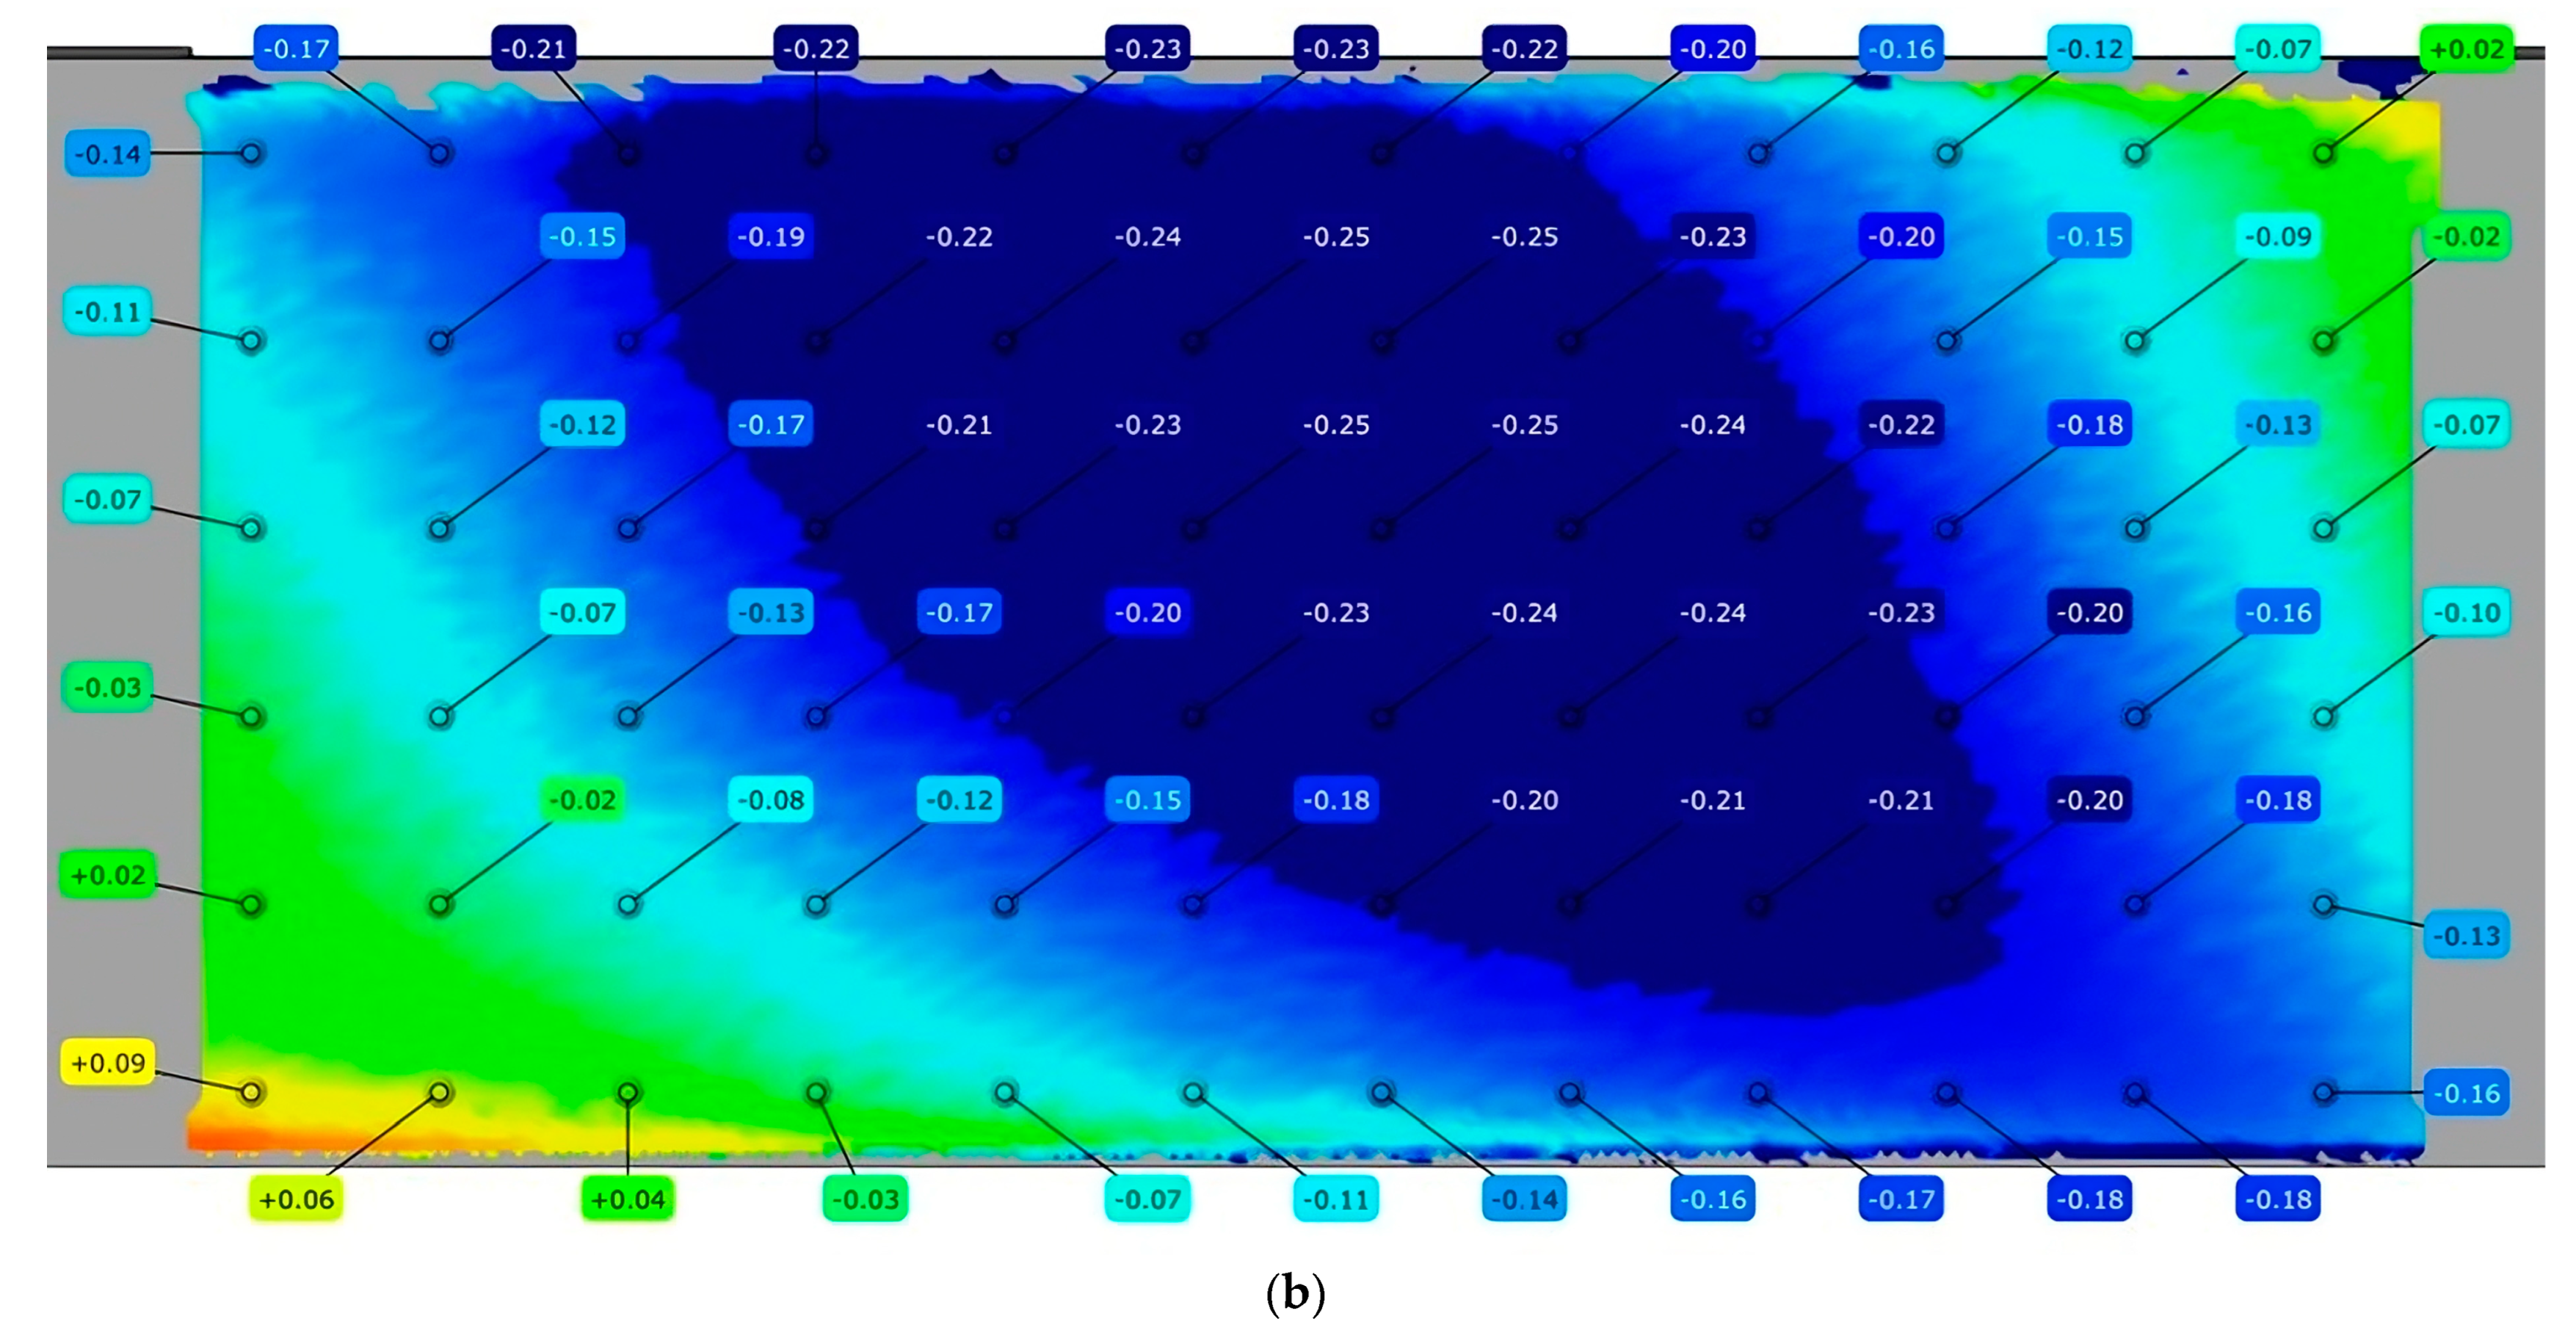
3.1. Results of Optical Measurements

An example of the color maps obtained for sample N1 using the optical method is shown in Appendix A in Figure A1. Figure 6 and Figure 7 show plots of the dimensional variation for specimens made of nickel alloy with horizontal thin walls, measured in a direction parallel to the direction of tool feed movement.
The plots of the dimensional variations for the nickel alloy specimens in the direction parallel to the feed direction of the milling cutter are similar. There is a symmetrical relationship between the dimensional deviations of the machined surface and the dimensional deviations occurring from the bottom of the specimen concerning the horizontal axis of the coordinate system y = 0 (N1–N6, excluding N5). A symmetrical relationship can be seen between the graphs for the same cross-sectional plane. The thin wall thickness for the specimens is close to 1.00 mm (positive value). An exception to this rule is observed for sample N5 (the tool for high-performance machining, adaptive cylindrical milling), where negative dimensional deviations are observed for the samples. Hence, material losses result. The curves are shifted towards the horizontal axis y = 0 by about 0.10 mm; hence, the resulting wall thickness is approximately 0.90 mm. The largest variation is seen in the middle of the sample length, i.e., in the central part between the mounting points.
The similarity of the curve shapes is not as pronounced as in the case of titanium alloy samples [1]. Two groups of curves of a similar nature are evident. In the first group, we have samples N1, N2, and N5; in the second group are samples N3, N4, and N6.
Figure 8 and Figure 9 show the dimensional variations for nickel alloy specimens with thin horizontal walls, measured in the direction perpendicular to the direction of feed movement, determined by the optical method.
The results for samples with thin horizontal wall of nickel alloy in the direction perpendicular to the direction of the milling cutter’s feed motion (Figure 8 and Figure 9) confirm the relationship observed when analyzing the results in the parallel direction, manifested by an approximately symmetrical distribution of the graphs with respect to the horizontal axis (y = 0) for specimens N1–N4 and N6. The symmetric distribution occurs between planes occurring in the same section. The N5 sample shows a shift of the curves toward negative values.
The results for nickel alloy samples (Figure 7 and Figure 8) show smaller values when using adaptive cylindrical milling (N4–N6) than those obtained with the adaptive face milling strategy (N1–N3). Although the use of adaptive cylindrical milling (N4–N6) gives more favorable results, a decrease in deviations on the planes of the machined surface can be observed from a length of about 20 mm. This seems related to the shining of the sample [1]. The largest limit of variation is seen for specimen N6, made with the tool for high-speed machining. The decrease in variation is approximately 0.1 mm. For specimens machined with the adaptive face milling strategy (N1–N3), this change is not so visible in our graphs (Figure 8).
Focusing on the individual samples, we can see that a scatter of values characterizes the N1 sample and is similar to both samples made with the tool for high-performance machining (N2 and N5). Apparently, the 6 and 6′ planes at the ends of the sample have variations almost equal to zero and, after increasing to a relatively large value, remain constant. This relationship does not occur for sample N4, which was machined with the same tool but with a different machining strategy (the tool for general purpose, adaptive cylindrical milling). In the case of this specimen, the curves are similar to the two specimens (N3 and N6) machined with the tool for high-speed machining, for which the absolute deflection values in the test planes have almost constant values. The most significant deformations are observed in the planes passing through the center of the specimen (planes 5 and 5′).
For samples (N2 and N5) milled with using the tool for high-performance machining, it is seen that the planes on one of the cross-sections have initially an almost zero deviation. For the N2 sample, the cross-section with zero value at the beginning of the sample length is seen for planes 6 and 6′, while for sample N5 it occurs for planes 4 and 4′. The other planes for both samples have similar shapes of their cross-sections. The use of the tool for high-performance machining with the strategy of adaptive face milling (N2) results in larger thin-wall deviations of about 25% compared to the opposite strategy—adaptive cylindrical milling (N5); with a significant scatter of values between individual planes for both samples.
The dimensional variation for nickel alloy samples (N3 and N6) in the direction perpendicular to the direction of tool feed motion prepared using the tool for high-speed machining have regular patterns for both strategies. The deviation plots for the samples machined with this tool clearly show—again for both strategies—that the largest deflections occur in the 5 and 5′ planes, i.e., in the planes passing through the centers of the samples. In these planes, the deviation is larger by about 0.05 mm compared to the other planes. The differences in deviations between planes 4 and 6 and planes 4′ and 6′ are small, nearly symmetrical with respect to the center.
Considering the data presented in Figure 6, Figure 7, Figure 8 and Figure 9, we see the smallest deviations of about 0.3 mm for the N1 sample—made with the tool for general purpose using an adaptive face milling strategy. The N5 sample (the tool for high-performance machining, adaptive cylindrical milling) also shows small deviations—similar to N1—but has a smaller thin wall thickness than expected. The largest deviations of ≈0.6 mm are seen for the sample made with the tool for high-speed machining using adaptive face milling (N3). It is notable that despite the largest deviations, the N3 sample has the most regular patterns compared to the other samples. The use of the tool for high-speed machining in combination with an adaptive face milling strategy (N6) is characterized by a half of the deviations (compared to N3), which are similar in value to the results obtained for the N1 sample.
Comparing the results for the sample obtained with the tool for general purpose (N1 and N4) to those performed with the tool for high-speed machining (N3 and N6), we see that the trend in deviation values is opposite, i.e., smaller values are obtained for adaptive face milling than for the cylindrical milling. The use of the tool for general purpose together with the adaptive cylindrical milling strategy (N4) gives larger values (by ≈0.1 mm) compared to the opposite strategy—adaptive face milling (N1). Despite the larger deviation values, we obtain more stable and repeatable diagrams for the N4 sample.
Figure 8, which shows a plot of deviations in the direction perpendicular to the feed motion for specimens N1 and N2 (the tool for general purpose and the tool for high-performance machining, respectively), shows that deviation values close to zero occur at a specimen length of about 2 mm, and they increase to reach a specimen length of about 10 mm (from which they stabilize), which is a value close to that of the tool diameter. This shows that during the successive passes the cutter was increasingly pushed away from the material, and the maximum was reached when the full contribution of the tool face part was achieved. In the initial passes, the front part of the tool was not fully constrained by the material on the underside, which slightly reduced the appearing deflection of the tool in the initial stage of milling. Such an observation is not seen in the graph for the sample made with the tool for high-speed machining (N3). This shows that the tool for high-speed machining is stiffer during machining and is not as susceptible as the others when the cylindrical part of the tool is significantly involved, i.e., using adaptive face milling. It is interesting to note that for the opposite strategy—adaptive cylindrical milling (Figure 9)—only the sample made with the tool for high-performance machining (N5) also presented such a trend, which may indicate the lower stiffness of the tool-spindle system when machining with this cutter. The deviation graphs for the samples made with adaptive cylindrical milling shown in Figure 9 (samples N4–N6) reveal an interesting feature near the end of the graph, i.e., in the range from about 20 mm to 30 mm. In this part, a decrease in the deviation values and their stabilization can be seen, which is the result of a shining in the final part of the sample (Figure 10). When the material was removed from the middle part of the specimen (see Figure 10), the cutter was not significantly pushed away from the material, so no perceptible boundary between the passes appeared, and the last passes caused the surface to be smoothed by the cutter—plastic deformation of the specimen surface occurred during these passes. If it were not for the shining that occurred, shown in Figure 10, the adaptive cylindrical milling strategy (N4–N6) would have produced relatively repeatable values with lower deviation values compared to adaptive face milling.

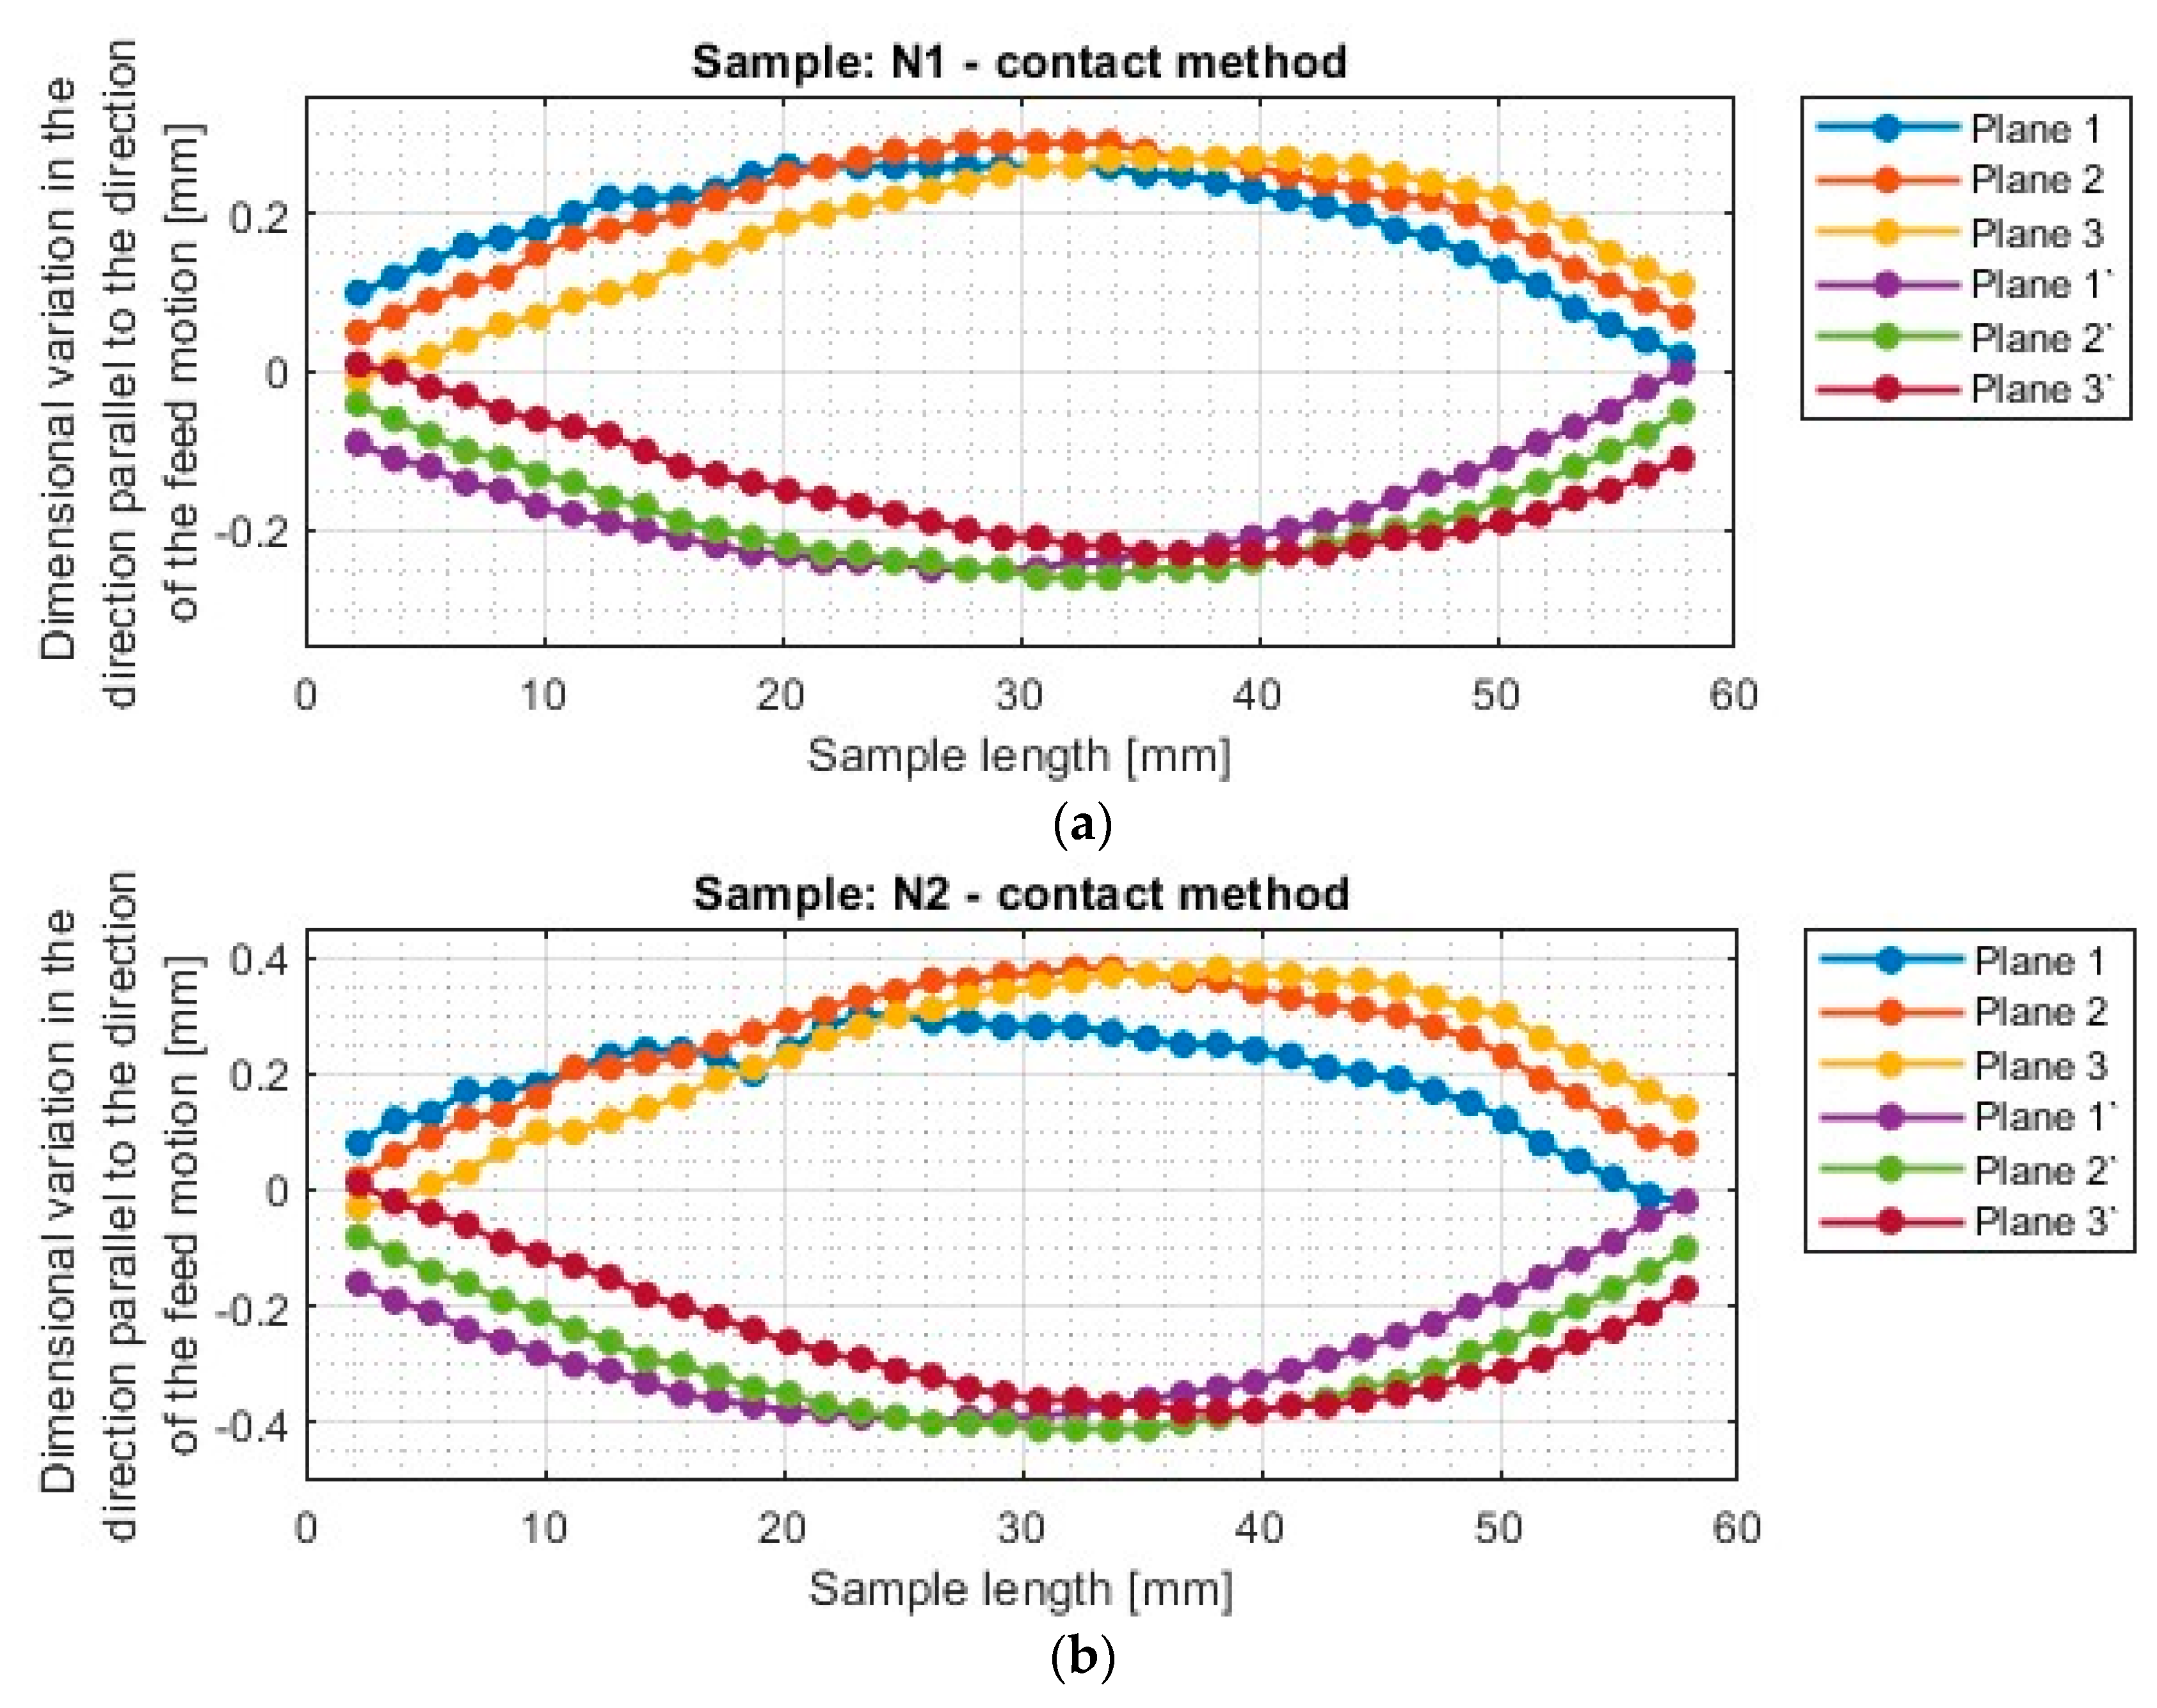
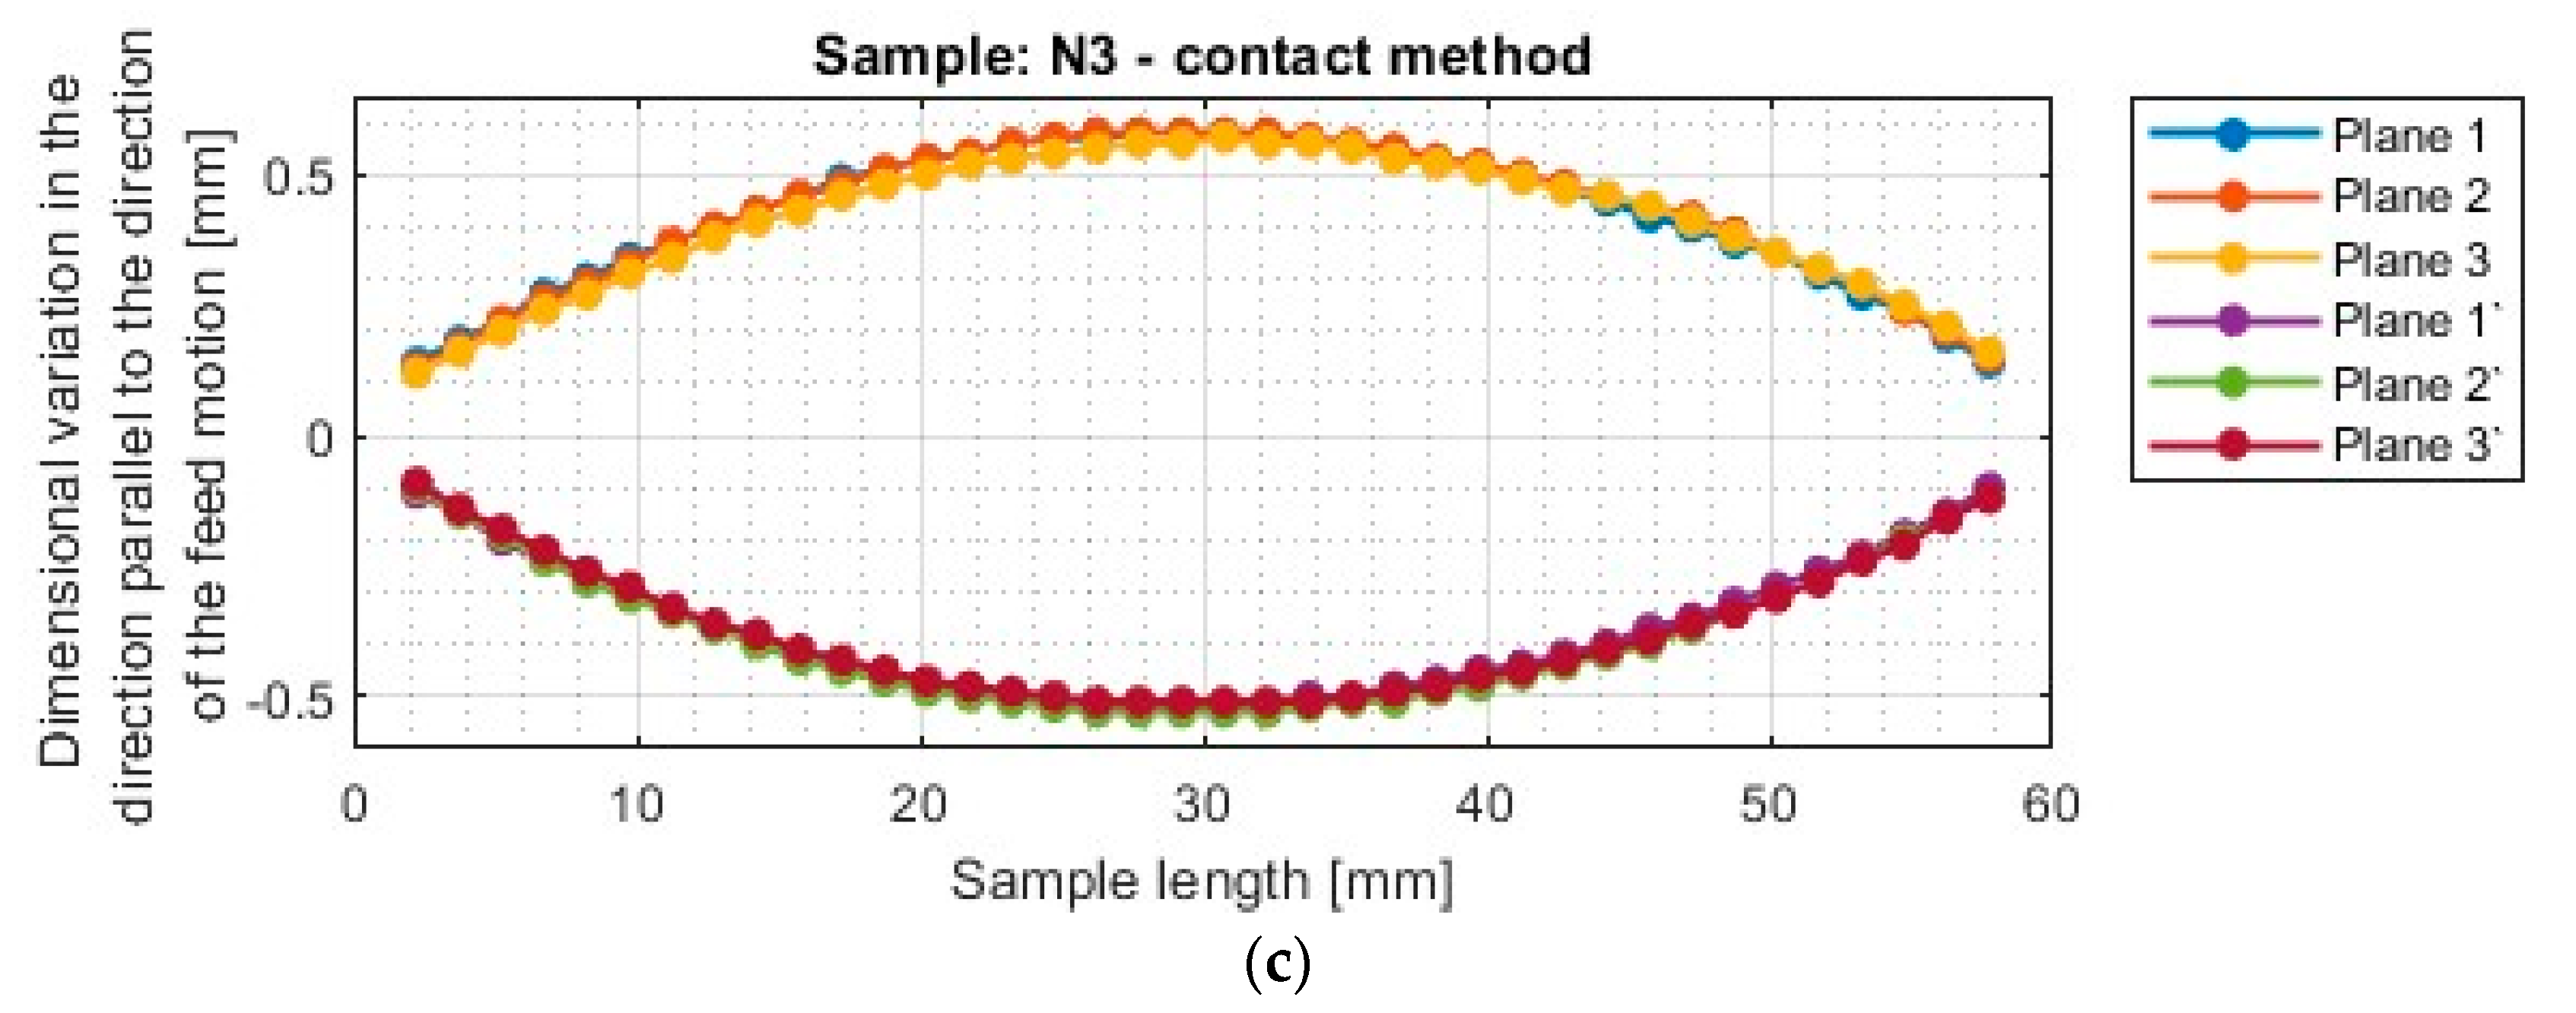
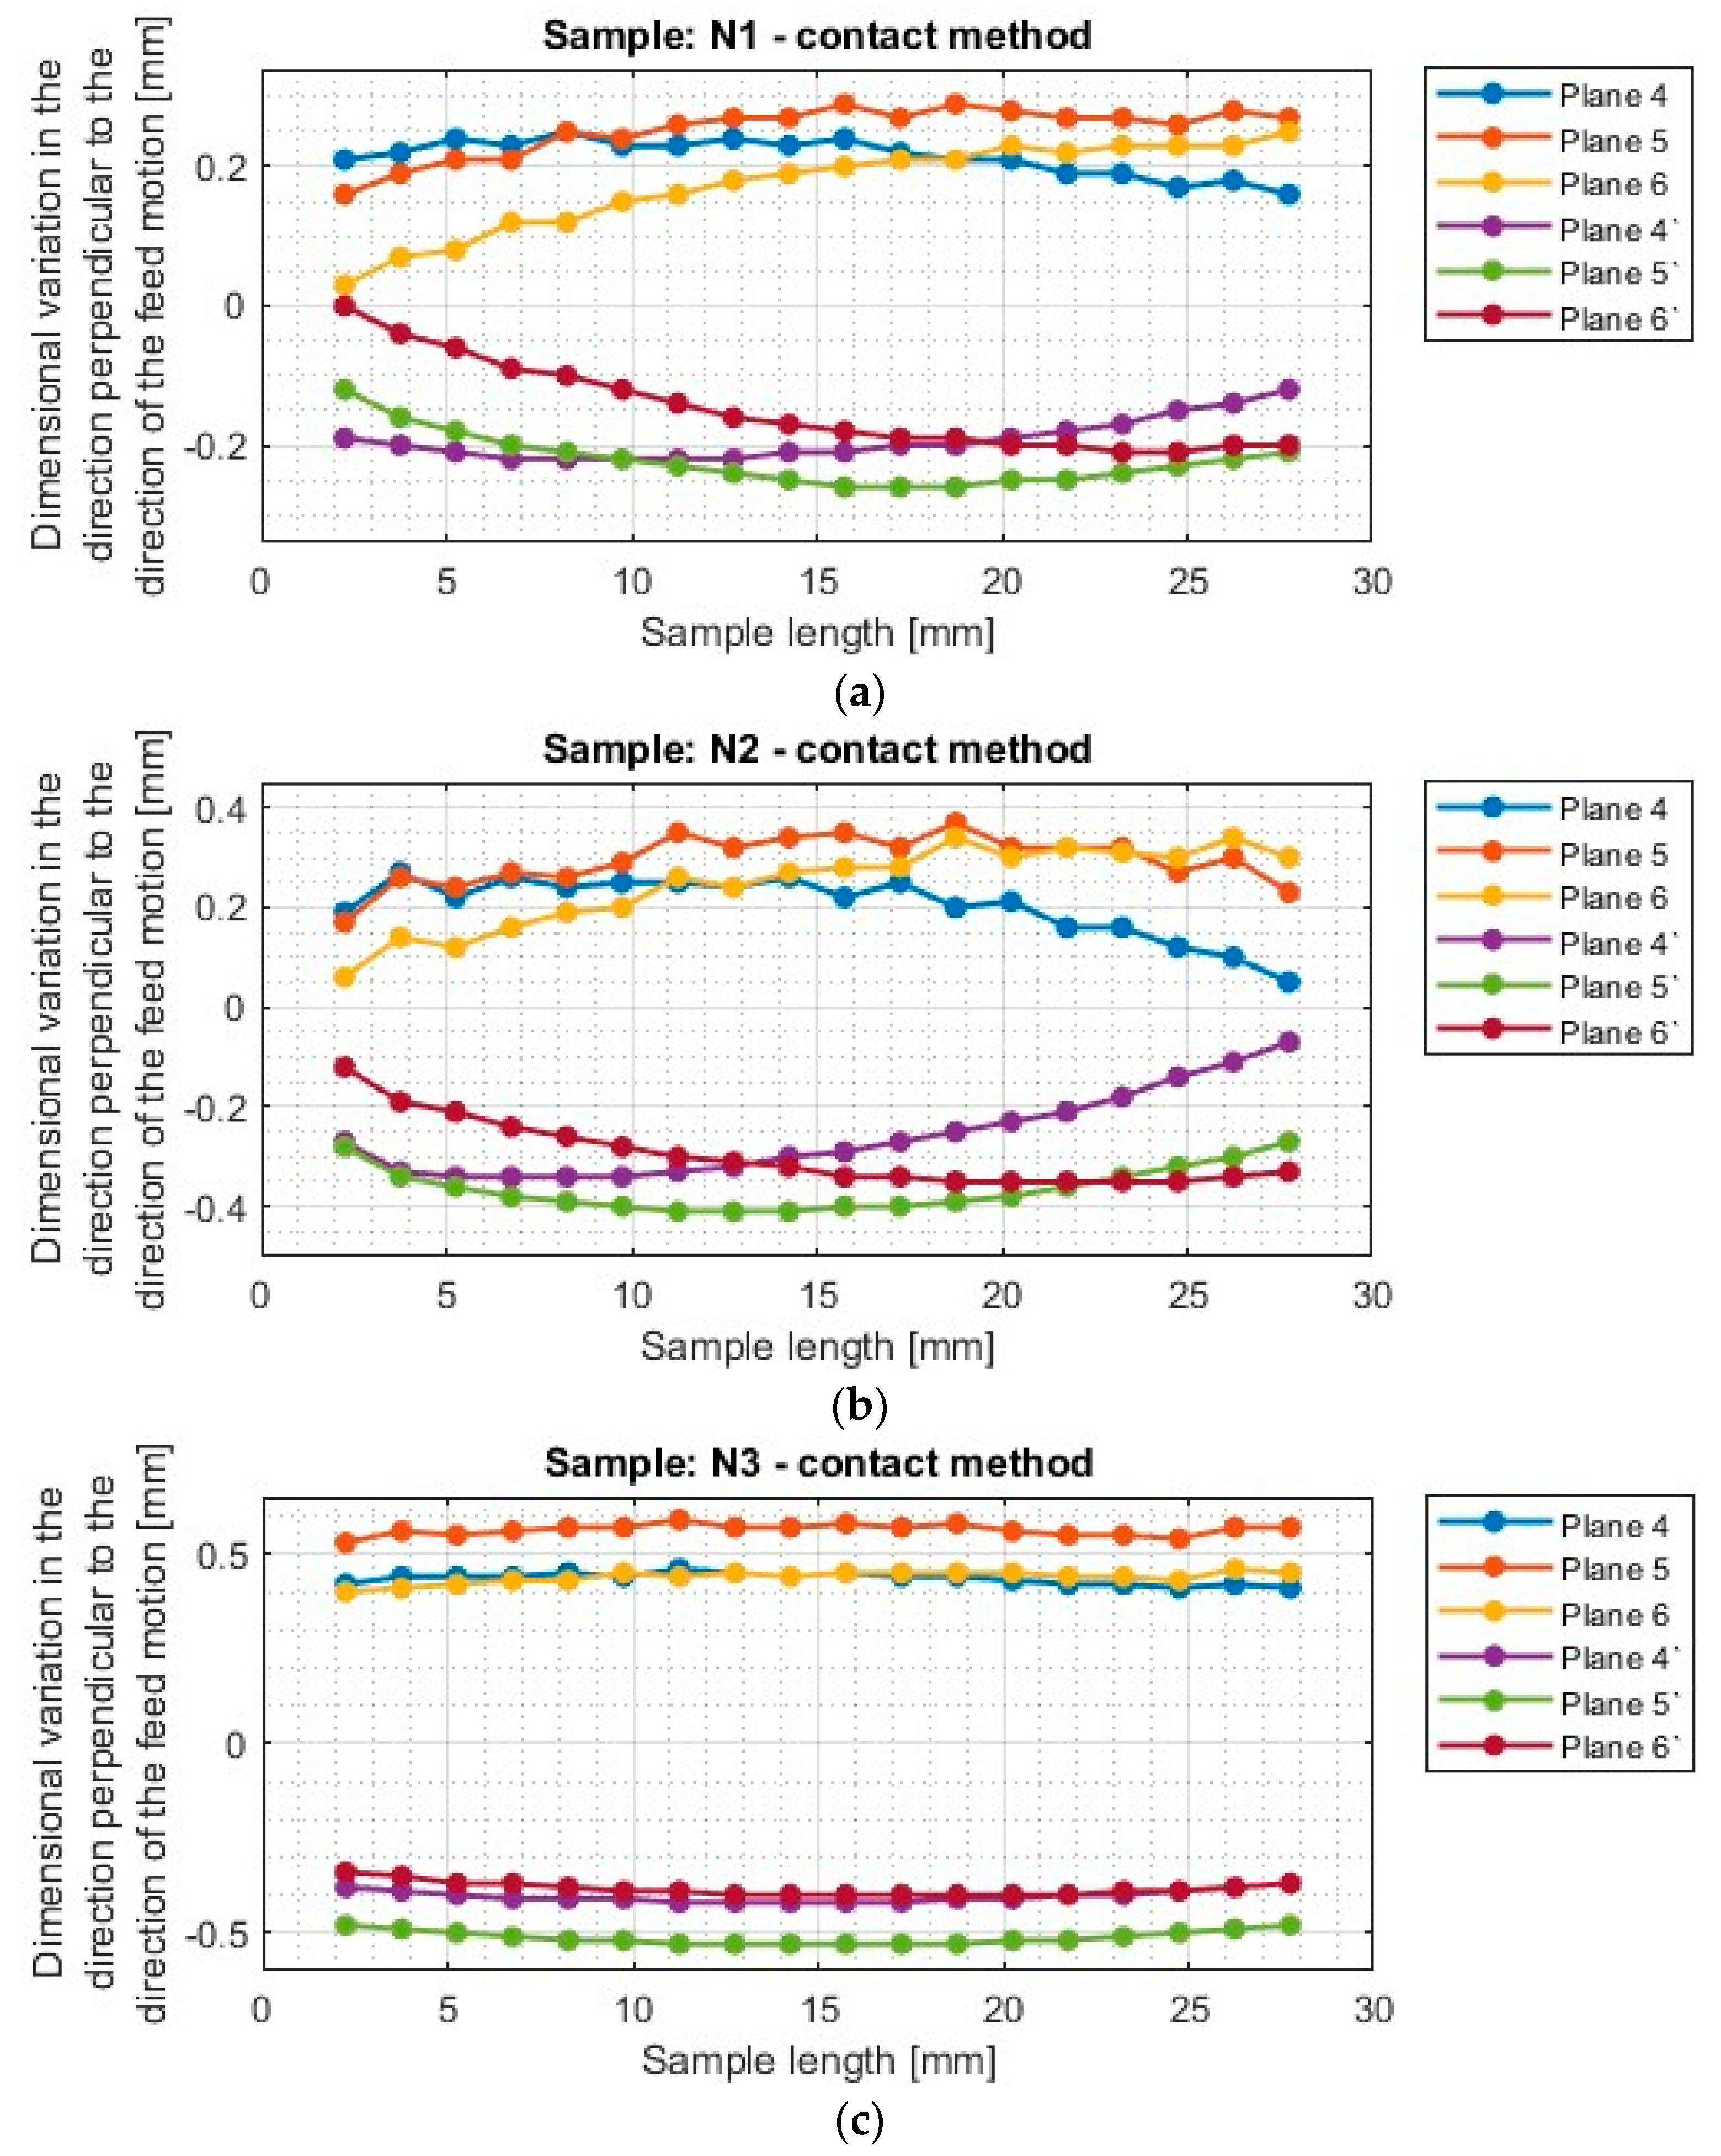
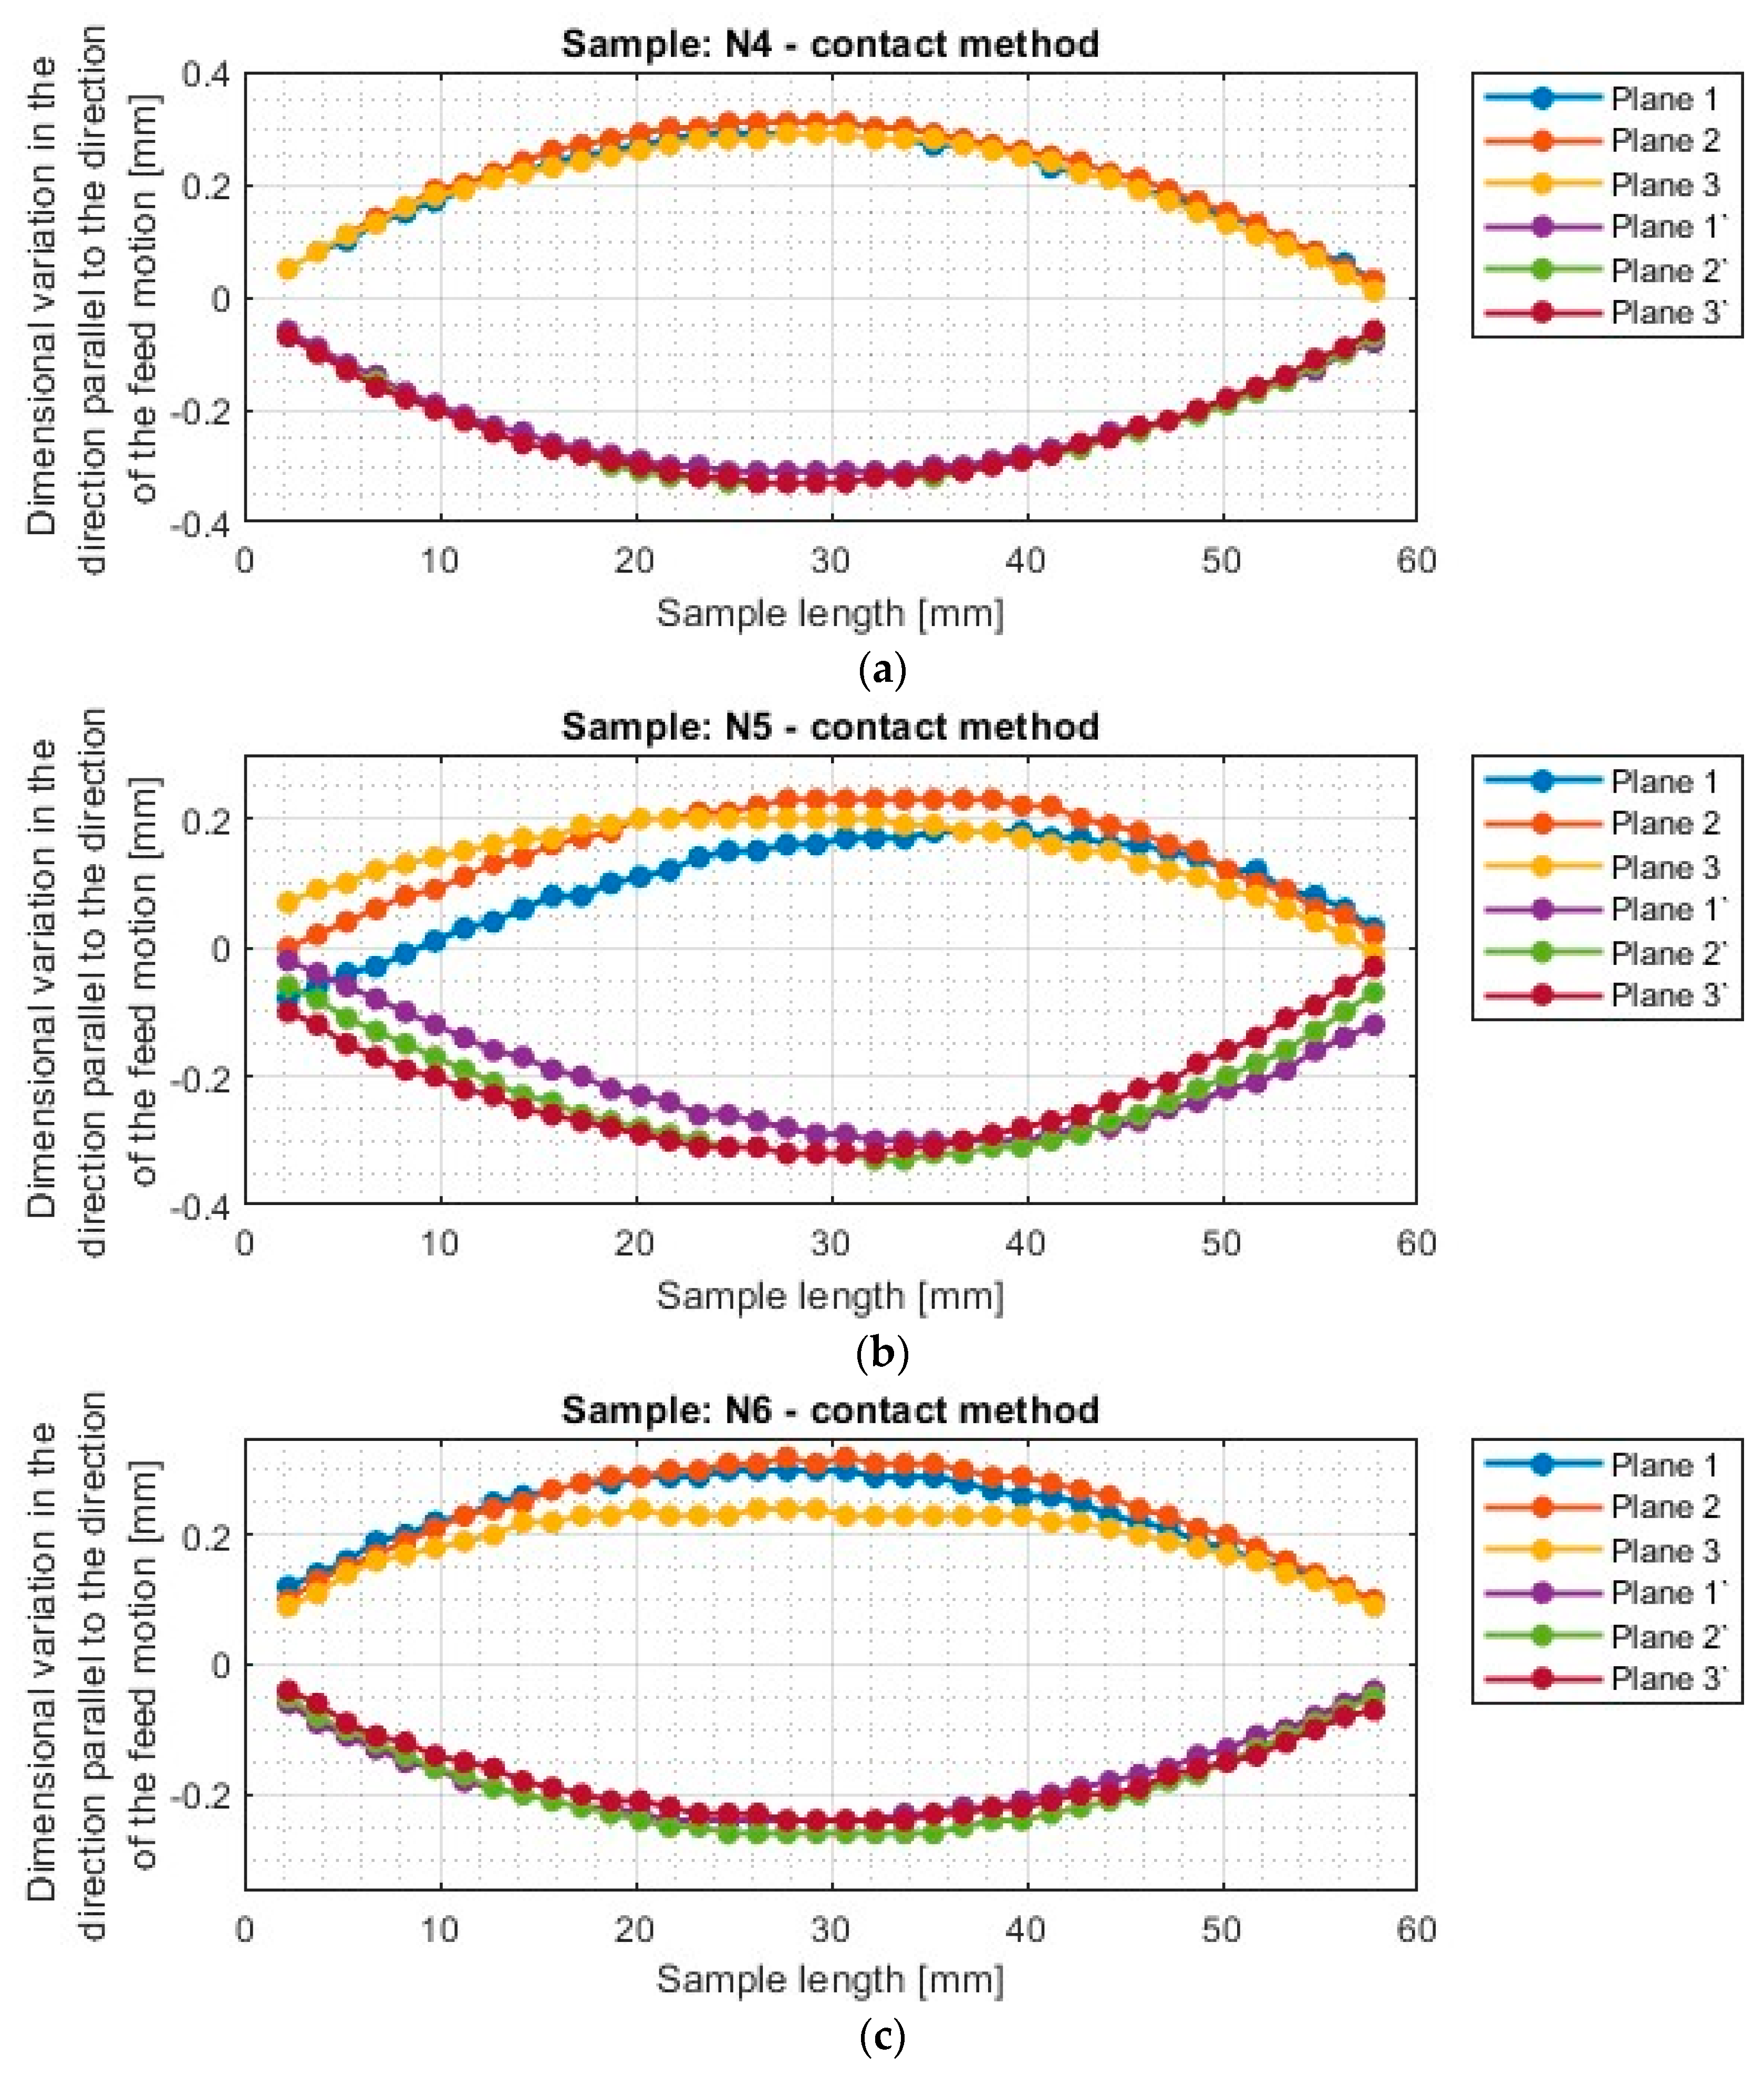
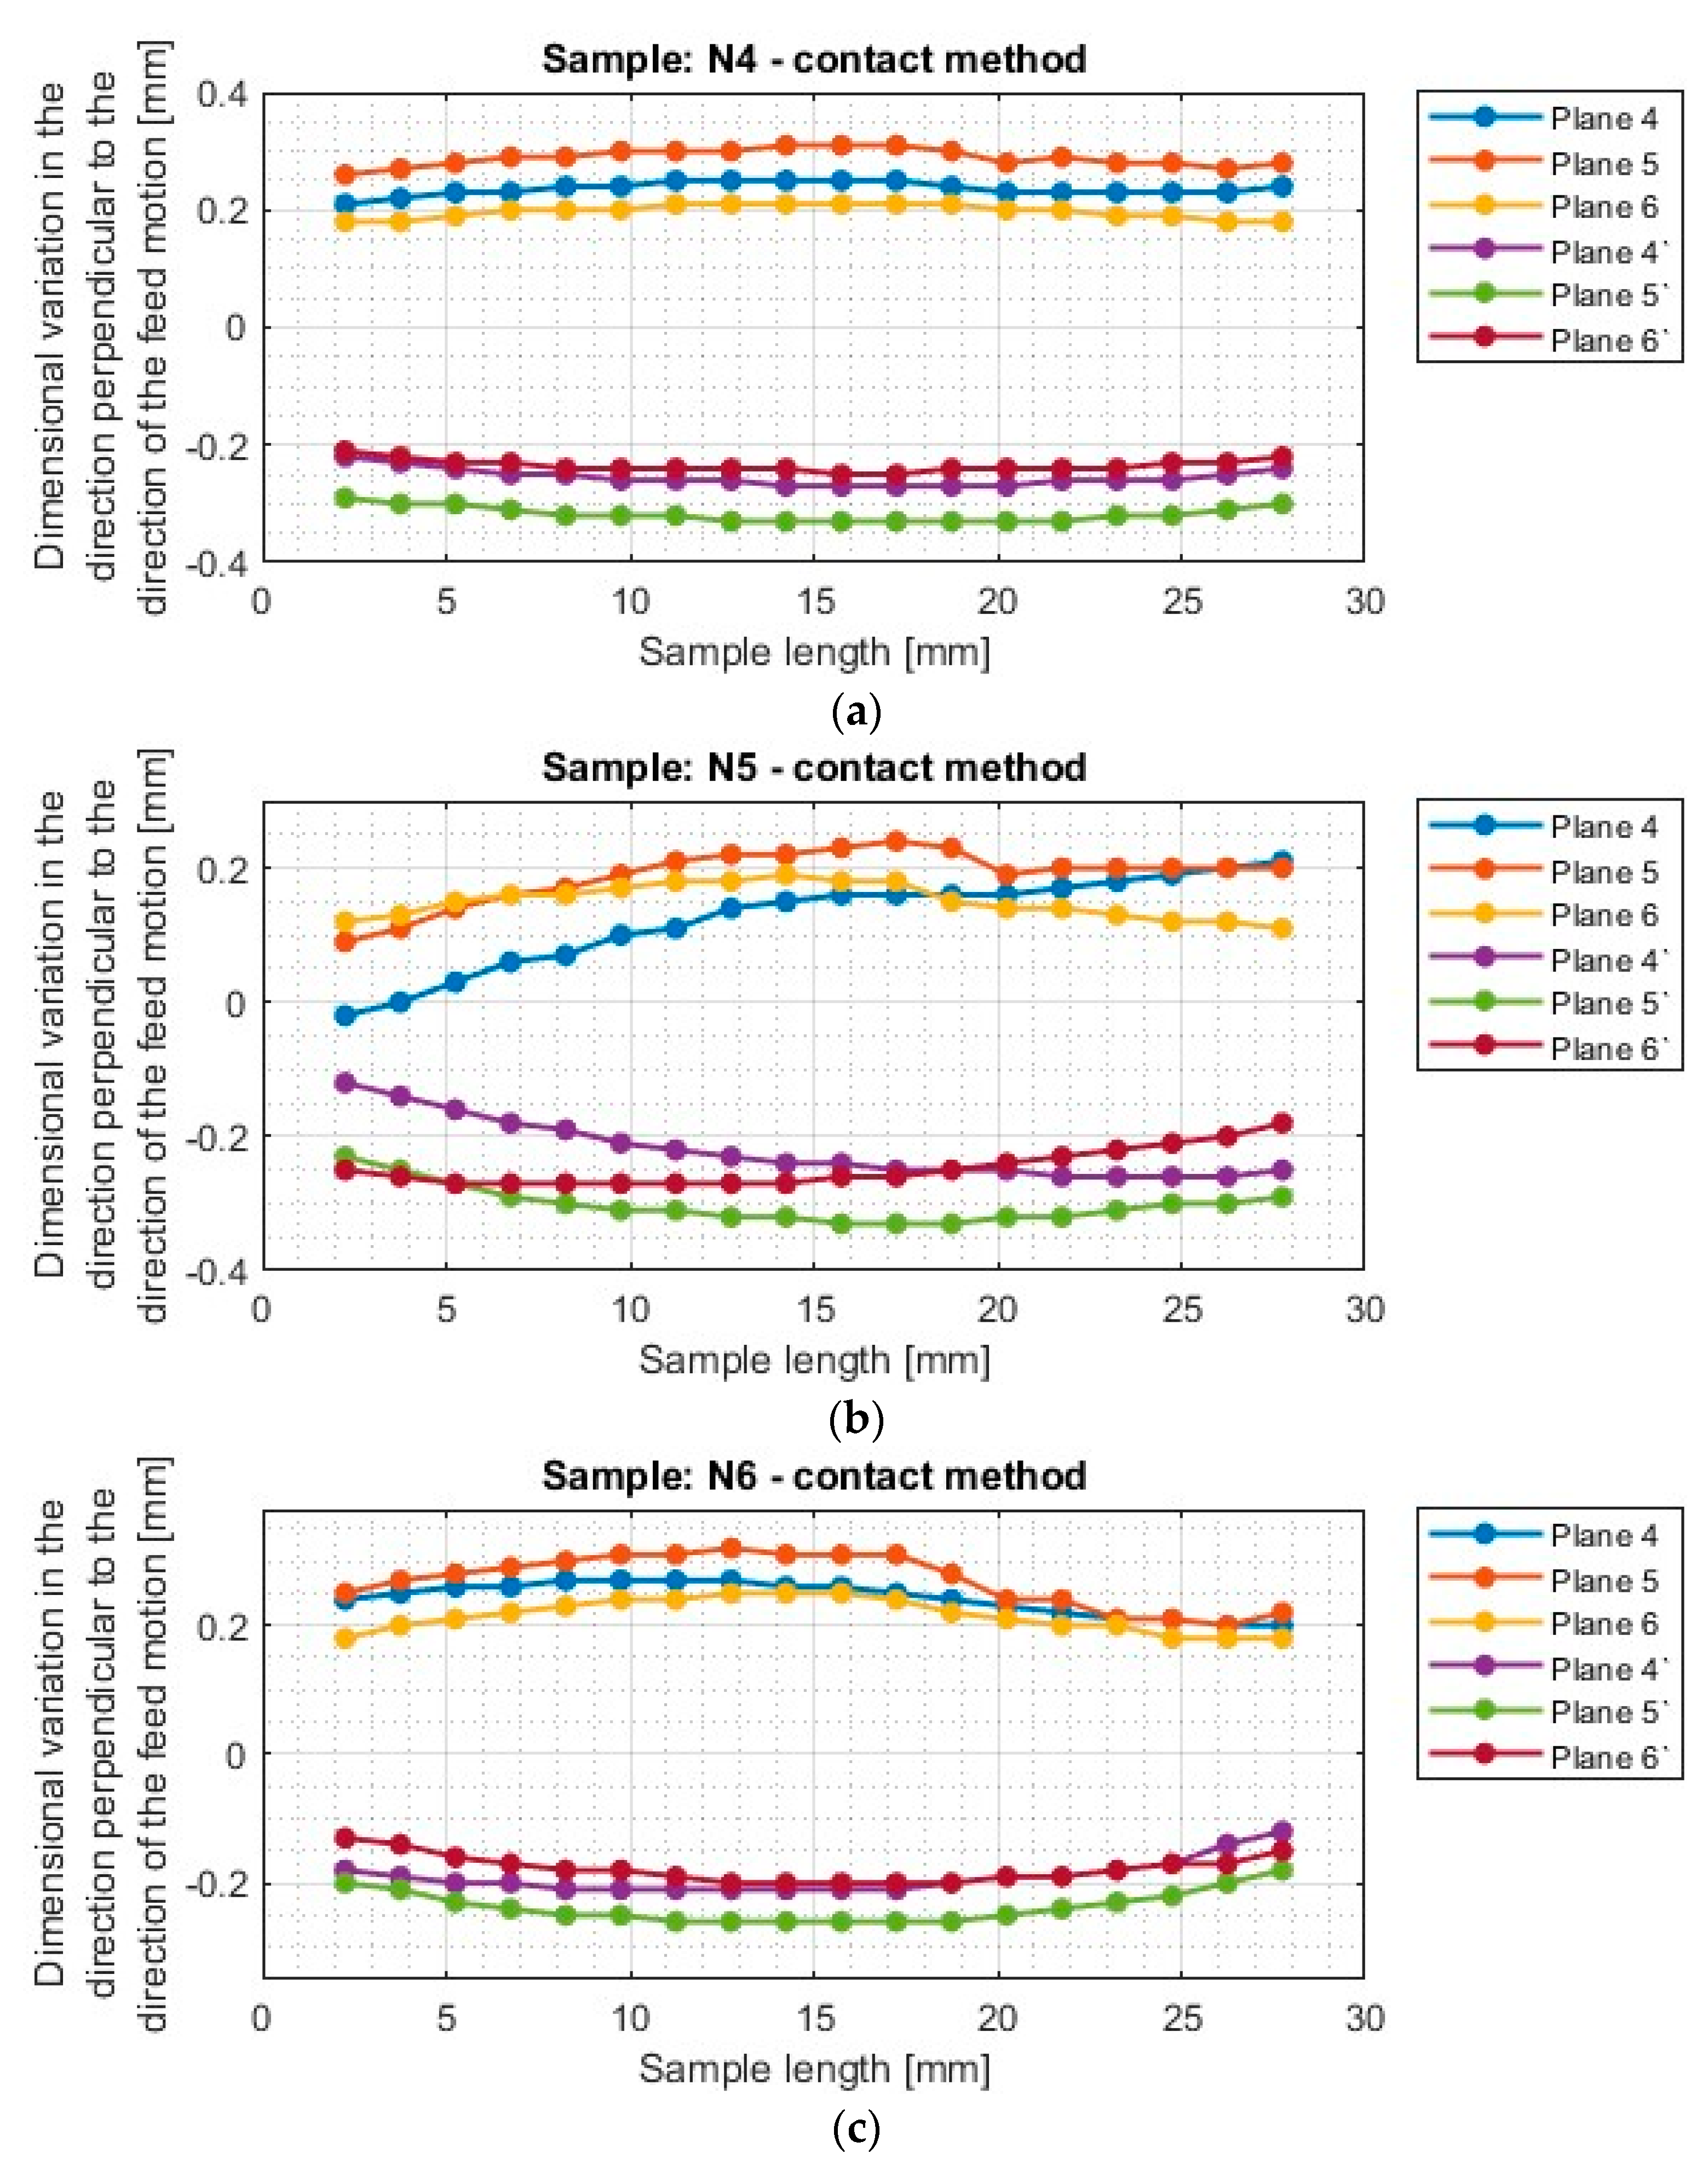
3.2. Results of Contact Method Measurements

We obtained deviation plots using the contact method similar to those obtained using the optical method (Figure 6, Figure 7, Figure 8 and Figure 9). Figure 11 and Figure 12 show deviation plots in the direction parallel to the direction of movement of the feed tool determined by the contact method, while Figure 13 and Figure 14 show dimensional variation plots in the direction perpendicular to the direction of tool feed motion determined by the contact.

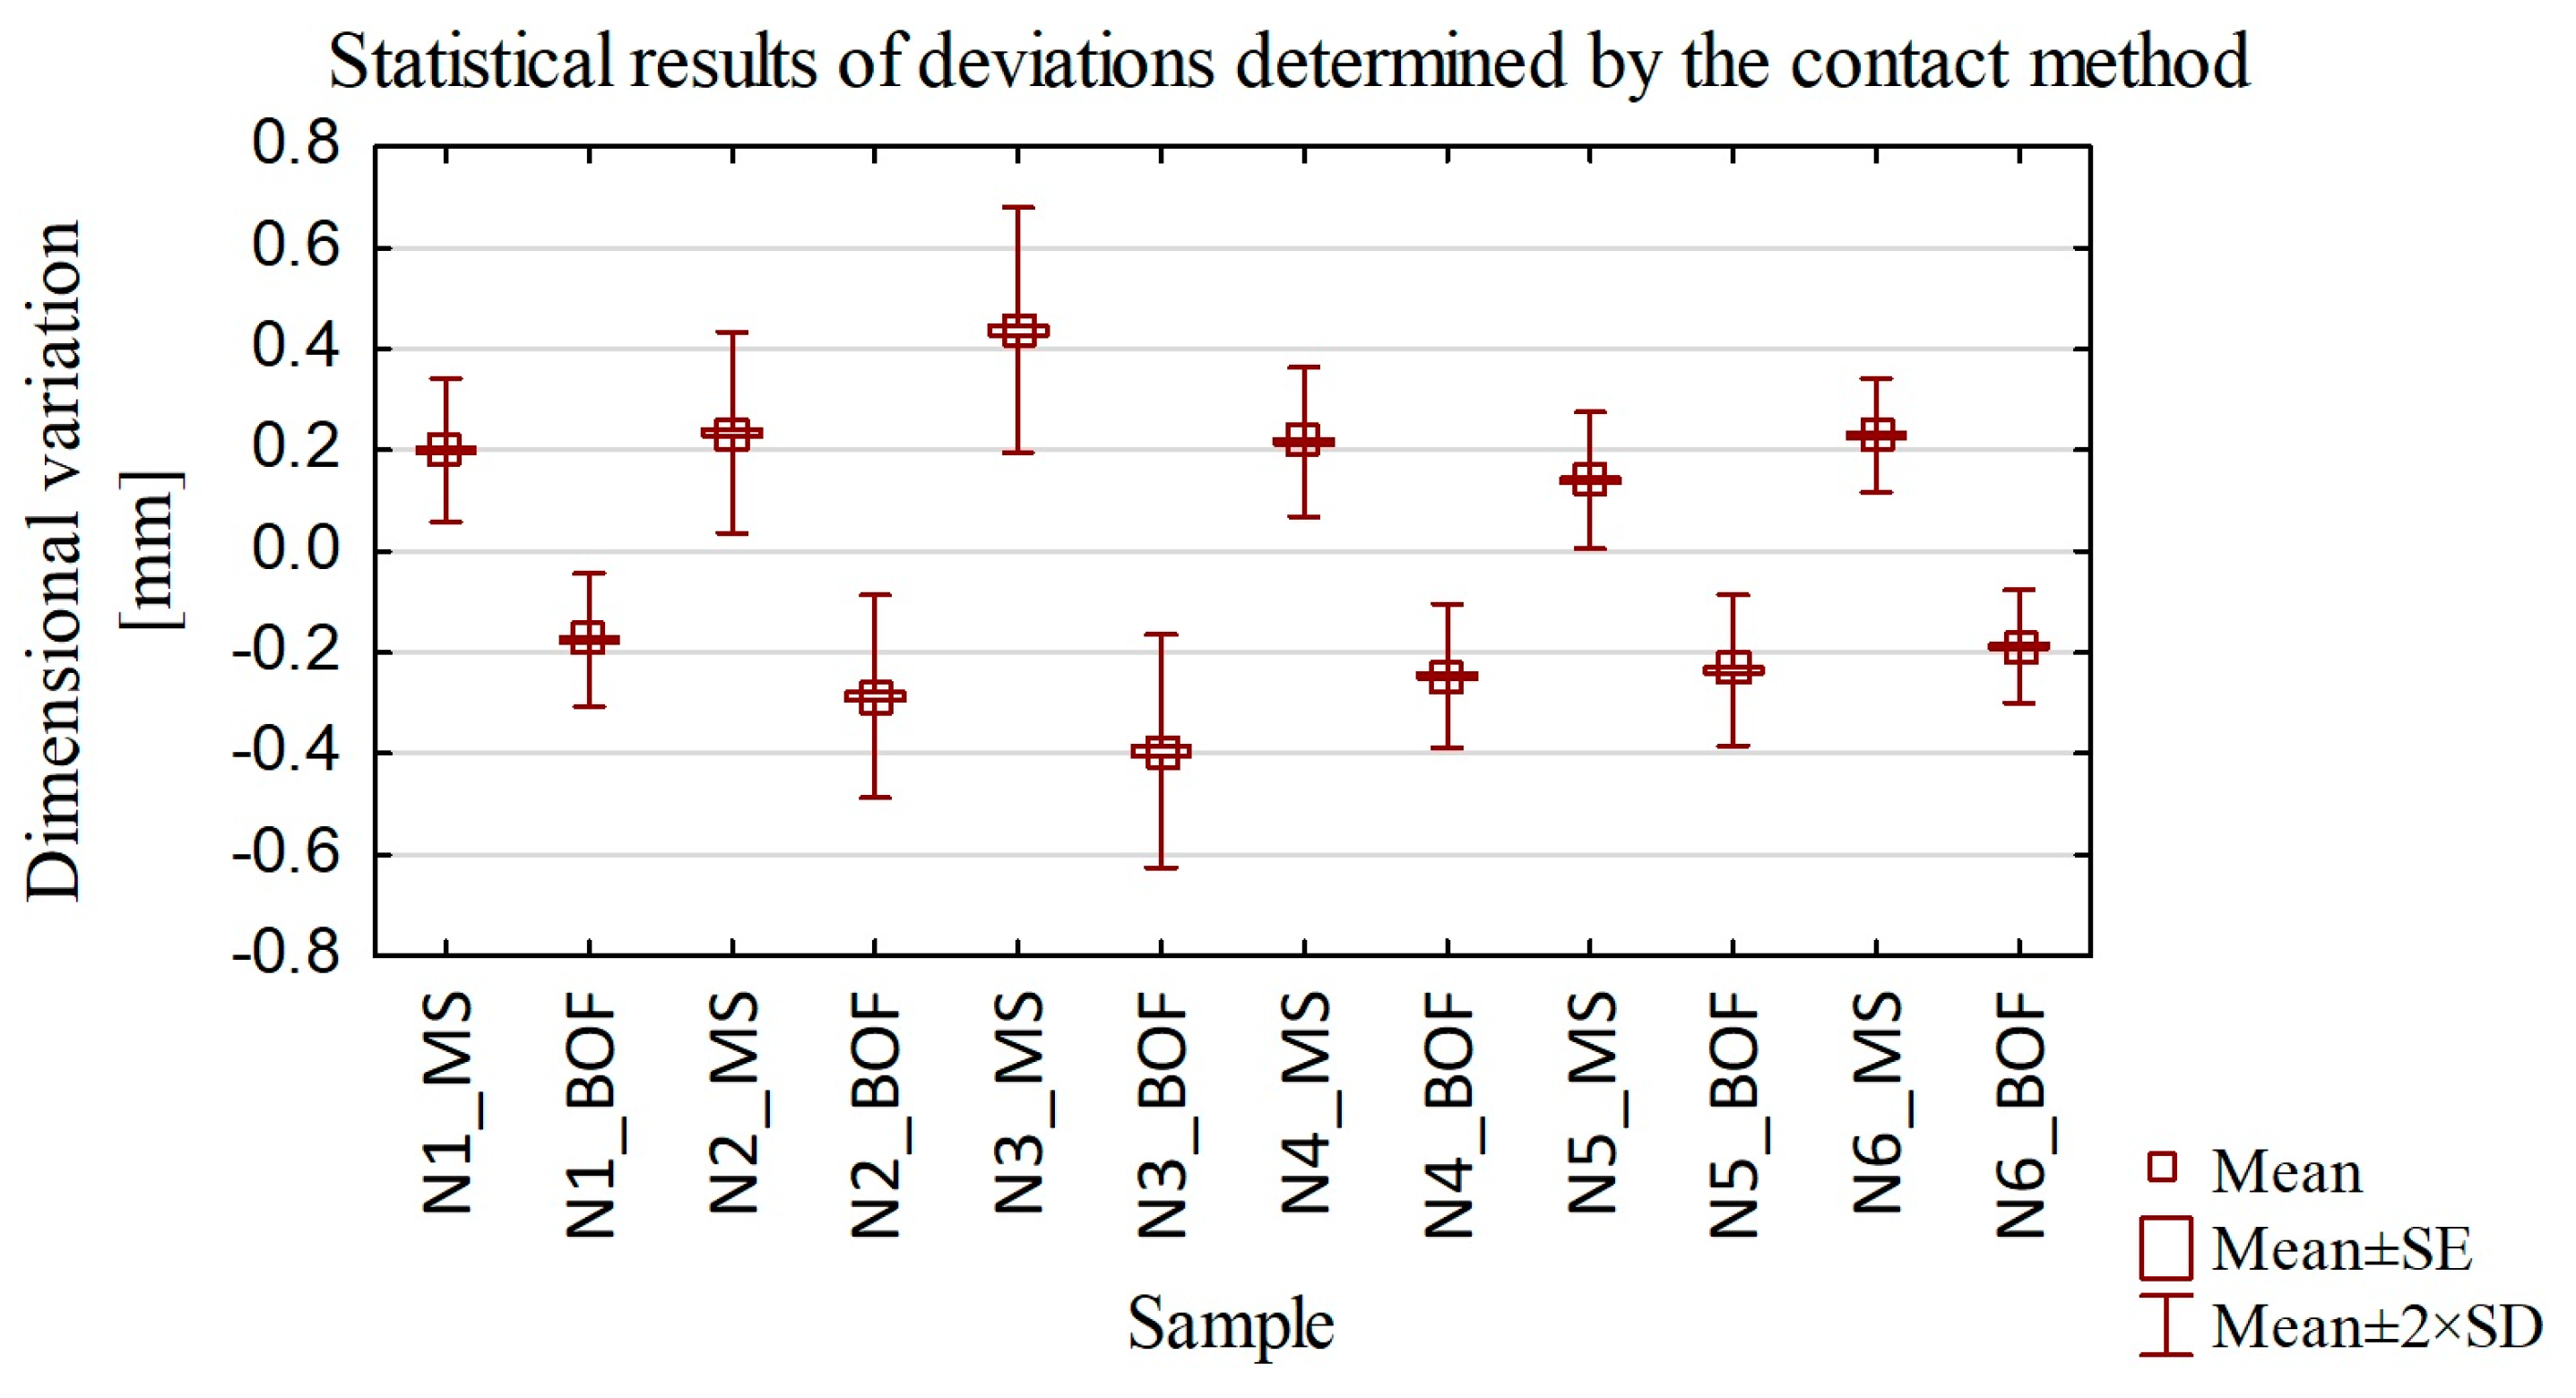
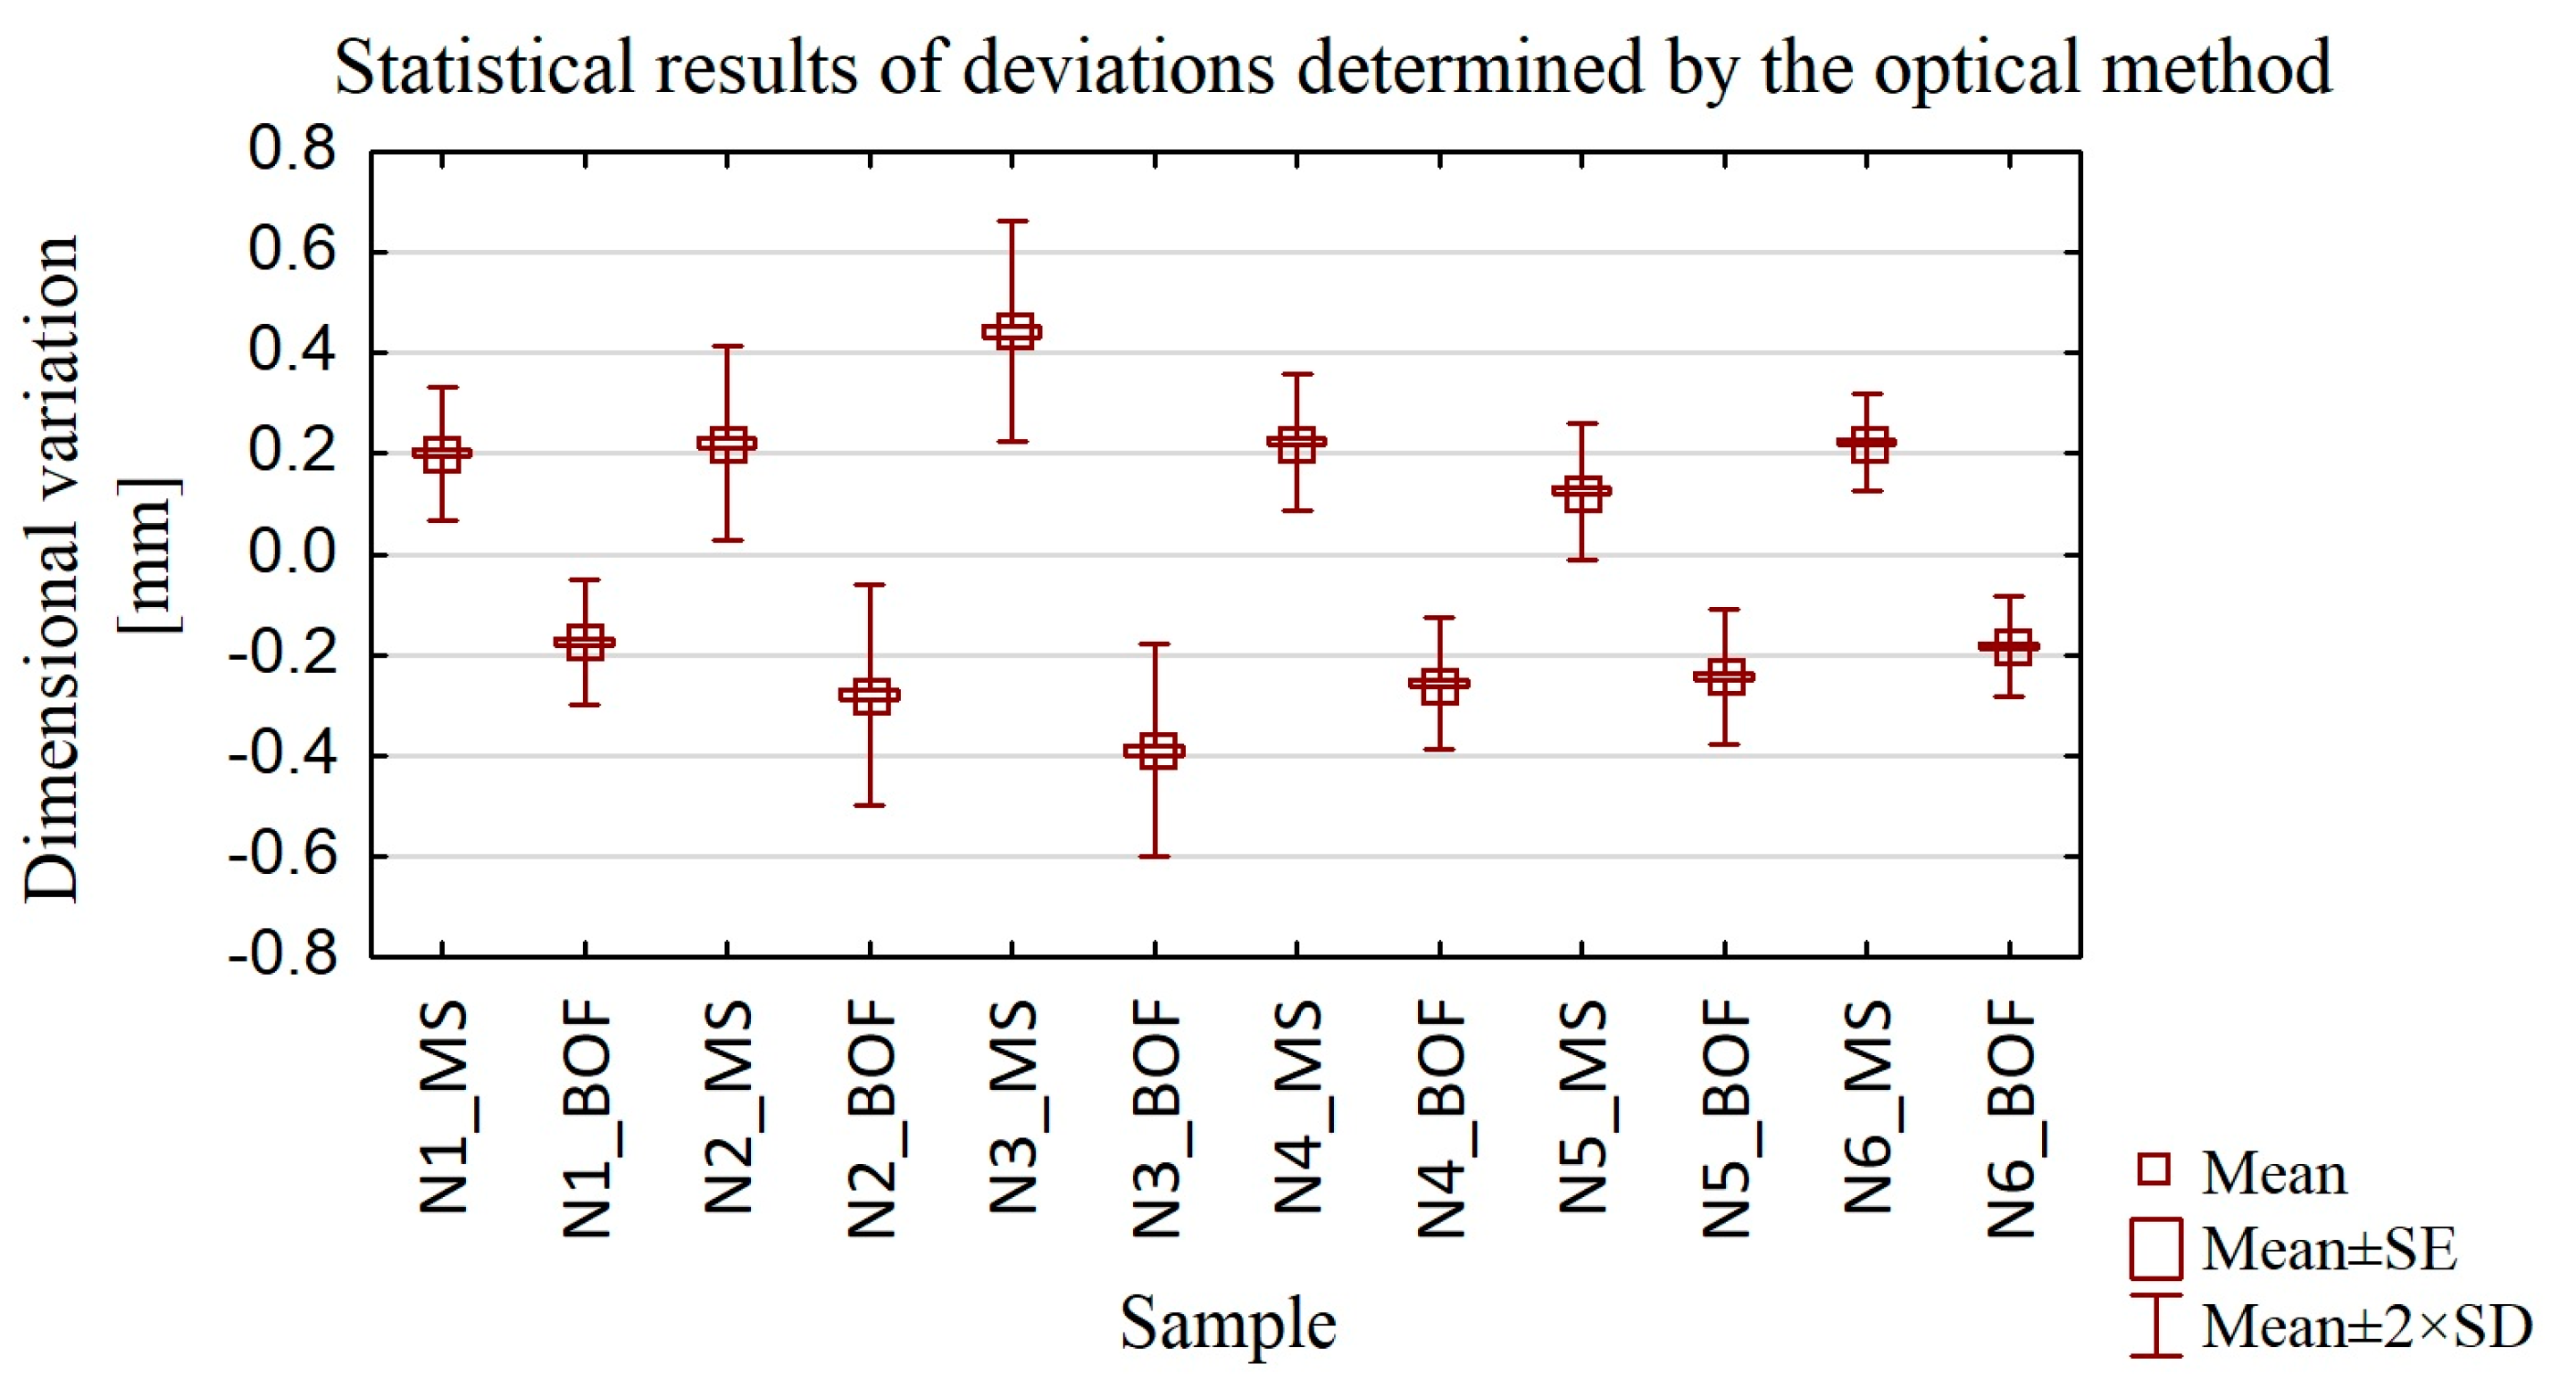
3.3. Statistical Analysis of the Results

Based on the deviation plots shown in Figure 6, Figure 7, Figure 8 and Figure 9, determined by the optical method, and Figure 11, Figure 12, Figure 13 and Figure 14, determined by the contact method, we created diagrams with statistical plots (Figure 15 and Figure 16) and a table containing the corresponding values (Table 4). In the diagrams below, positive values for machined surfaces (MSs) indicate material gain while negative values for the bottoms of the samples (BOFs) indicate material loss. There is a symmetric distribution of deviations with respect to the horizontal axis y = 0.
Using the minimum and maximum values of thin wall deviations in Table 4, we calculated the maximum differences between the optical and contact methods results on the machined surfaces—MSs (Table 5) and at the bottoms of the samples—BOFs (Table 6).
We see in Table 5 and Table 6 that the maximum differences between the values obtained by the optical and contact methods are approximately 8%. Gapinski and coworkers [28] reported a smaller value of 5%. On the basis of the box-plots in Figure 14 and Figure 15 and the descriptive statistics in Table 4, we formulated the following conclusions:
  • The use of an adaptive cylindrical milling strategy (N4–N6) results in less scatter between the values obtained than the use of the adaptive face milling strategy (N1–N3).
  • Similar average values of the dimensional variations are observed for samples machined with the tool for general purpose (N1 and N4). A larger scatter of results appears for samples made with the other tools (N2, N3, N5, N6).
  • The largest average value pertains to the N3 sample (the tool for high-speed machining, adaptive face milling).
  • The smallest average is seen for the N5 sample (the tool for high-performance machining, adaptive cylindrical milling), while the N1 sample (the tool for general purpose, adaptive face milling) has the lowest maximum deviation.
  • Sample N6 milled with the tool for high-performance machining and using adaptive cylindrical milling has the smallest difference between the minimum and maximum.
Conclusions can also be drawn from an earlier paper by some of us [1]:
  • Looking at results for both Ti6Al4V and Inconel 625, we see that the largest average value was observed for sample T6, while the smallest was for T2. For sample T6, the largest spread of measured deviation values in both material groups was also observed.
  • For nickel alloy samples, the effect of strategy on the deviation results was opposite compared to their titanium alloy counterparts, i.e., smaller values were obtained using the adaptive cylindrical milling strategy (N4–N6) than for the face milling strategy (N1–N3).
  • Higher average values were obtained for nickel alloy samples than for the titanium alloy (excluding T6).
The maximum deviations reported by Gang [23] and Hintze [24] are ≈0.10 mm, by Polishetty [25] 0.34 mm, by Yusop [26] 0.18 mm, and by Zha [27] 0.21 mm. The N1 sample (the tool for general purpose, adaptive face milling) has that deviation equal to 0.28 mm. Our other samples have comparable maximum deviations. Apparently, larger deviations are due to the use of the nickel alloy, which is a harder material.

4. Summary and Conclusions

We achieved our objectives defined in the beginning of this work. We determined the dimensional deviations of the thin walls in the horizontal orientation for manufactured Inconel 625 nickel alloy samples, machined with a combination of three cutting tools and two machining strategies. We obtained results for both perpendicular and parallel directions with respect to the feed motion. We measured the deviations using a 3D optical scanner (optical method) and a coordinate measuring machine (contact method). The present results might be considered in conjunction with those in other papers from our international team [1,29]. Thus, we provide some further conclusions:
  • The use of the tool for general purpose with an adaptive face milling strategy (N1) resulted in lower deviations compared to a combination of the same tool, however, with the opposite strategy—adaptive cylindrical milling (N4). For the other tools, i.e., the tool for high-performance machining and the tool for high-speed machining, lower deviations were recorded during using adaptive cylindrical milling (N5 and N6) compared to face milling (N2 and N3).
  • The lowest deviation value was characterized by specimen N1 (maximum deviation: 0.28 mm), which was made with the tool for general purpose using adaptive face milling, while the highest deviation was found in specimen N3 (maximum deviation: 0.58 mm), made with the same strategy but using the tool for high-speed machining.
  • Thin wall thickness close to the assumed value of 1 mm was obtained for all samples except N5, for which the value was about 0.9 mm.
  • For two specimens (N3—the tool for high-speed machining using adaptive face milling; N4—the tool for general purpose using adaptive cylindrical milling), the stability of taken deviation values was observed at individual measurement points.
  • For samples N1, N2 (adaptive face milling), and N5 (adaptive cylindrical milling), an increase in deviation values was observed until the face of the tool was fully engaged (up to about 10 mm). This is an effect of the stiffness of the tool-spindle system, which, in these cases, was due to the lack of constraining the mill with material on the underside, which slightly reduced the emerging tool deflection at the initial stage of milling.
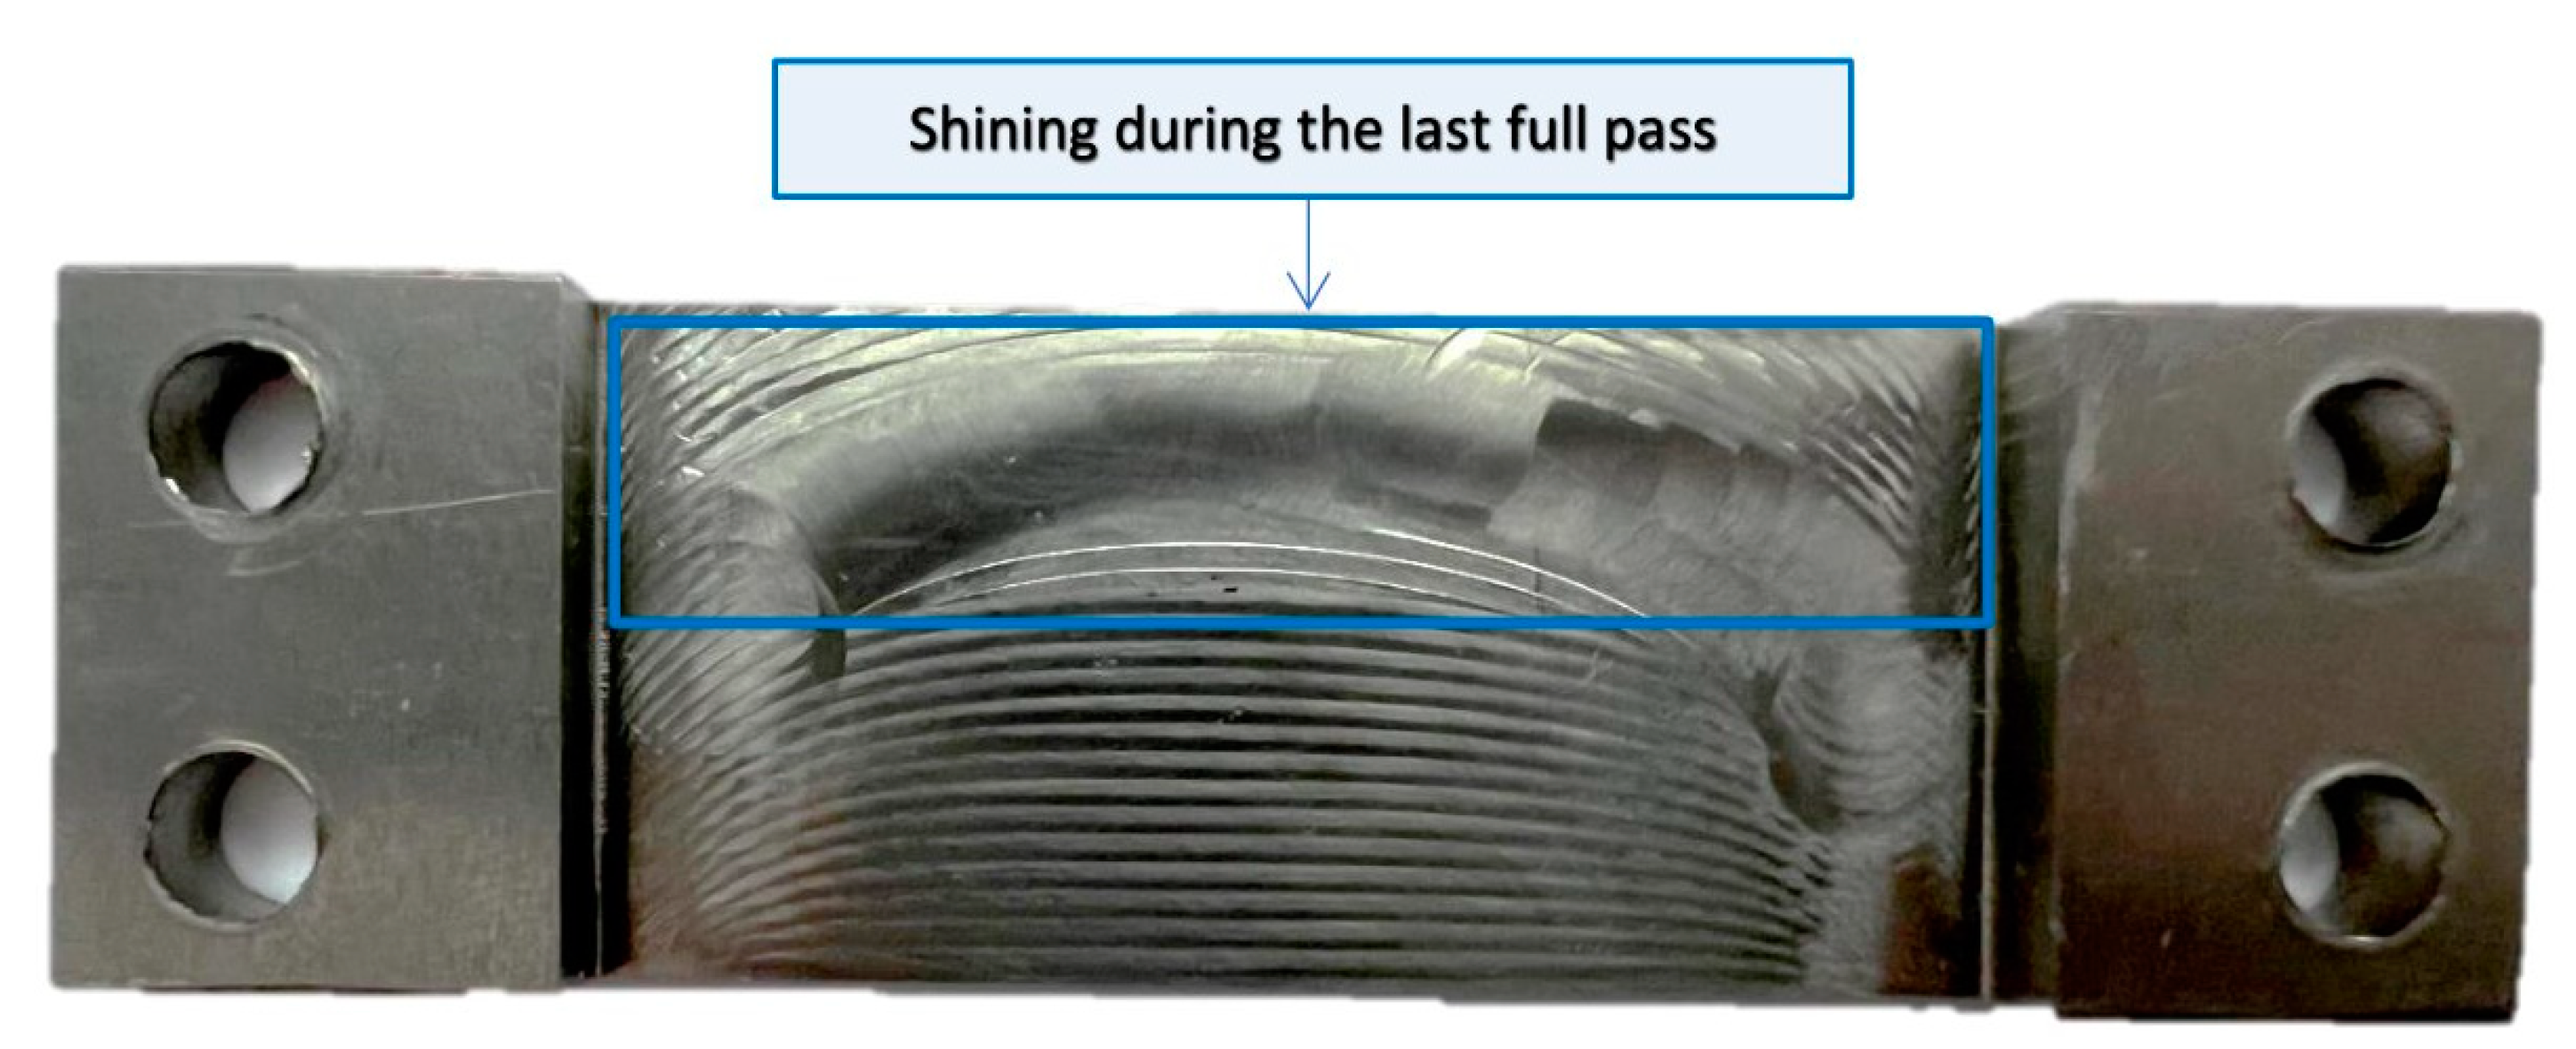
  • During the application of adaptive cylindrical milling, a characteristic shining appeared in the last passes, which caused a decrease in the deviation values.
A comparison of the deviation results obtained from the contact and optical method measurements revealed similarity in the distribution of graphs in selected sections. We obtained the maximum discrepancy of the results equal to 8%—as in the case of the previous study [1]. This result confirms that a 3D optical scanner can be used when measuring thin-walled structures of small dimensions with relatively good measurement accuracy.
Further research could focus on checking other machining parameters that would enable products with smaller dimensional deviations, as well as checking other ways of clamping the sample that would minimize vibration and, consequently, deformation of the thin walls.
As noted in the beginning, the use of thin-walled structures is increasing in several industries—including the aerospace industry. Consider, now, instruction in materials science and engineering (MSE). Teaching MSE typically includes ceramic materials and biomaterials [38], geopolymers [39], polymer classes such as epoxies [40], wood [41], wastewater recycling [42], or specific properties such as fire resistance [43]. Coverage of thin-walled structures in MSE instruction seems worthwhile.

Author Contributions

Conceptualization, S.K.; methodology, S.K. and K.Z.; software, S.K.; validation, K.Z., J.C. and K.S.; formal analysis, S.K.; investigation, S.K.; writing—original draft preparation, S.K., J.C. and W.B.; writing—review and editing, S.K., K.Z., J.C., K.S. and W.B.; visualization, S.K.; supervision, J.C. and K.S.; project administration, S.K. and K.S.; funding acquisition, S.K., J.C. and K.S. All authors have read and agreed to the published version of the manuscript.

Funding

The research was financed by AGH University of Krakow (contract project number: 16.16.130.942/Kurpiel).

Institutional Review Board Statement

Not applicable.

Informed Consent Statement

Not applicable.

Data Availability Statement

The original contributions presented in the study are included in the article, further inquiries can be directed to the corresponding authors.

Acknowledgments

Tools used for the experiment were provided by SECO Tools.

Conflicts of Interest

The authors declare no conflicts of interest.

Appendix A

Examples of color maps for sample N1 of nickel alloy with a thin horizontal wall obtained during measurement with a 3D optical scanner are shown in Figure A1.
Figure A1. Example of GOM optical scanner measurement results for sample N1 with a horizontal thin wall: (a) color map—machined surface; (b) color map—bottom of the sample.
Applsci 14 03034 g0a1aApplsci 14 03034 g0a1b

References

  1. Kurpiel, S.; Zagórski, K.; Cieślik, J.; Skrzypkowski, K.; Kapayeva, S.; Torekhanova, M. Dimensional Deviations of Horizontal Thin Wall of Titanium Alloy Ti6Al4V Determined by Optical and Contact Methods. Materials 2023, 16, 7272. [Google Scholar] [CrossRef] [PubMed]
  2. Zębala, W. Minimalizacja błędów przedmiotów cienkościennych. Inżynieria Masz. 2010, 15, 45–54. [Google Scholar]
  3. Wang, J.; Ibaraki, S.; Matsubara, A. A cutting sequence optimization algorithm to reduce the workpiece deformation in thin–wall machining. Precis. Eng. 2017, 50, 506–514. [Google Scholar] [CrossRef]
  4. Huang, P.L.; Li, J.F.; Sun, J. Study on performance in dry milling aeronautical titanium alloy thin–wall components with two types of tools. J. Clean. Prod. 2014, 67, 258–264. [Google Scholar] [CrossRef]
  5. Polzer, A.; Duvkova, K.; Pokorny, P. On the modern CNC milling with compensation of cutting tools and thin walled workpiece deflections. J. Mach. Eng. 2015, 15, 41–49. [Google Scholar]
  6. Bałon, P.; Rejman, E.; Smusz, R.; Kiełbasa, B. High speed machining of the thin–walled aircraft constructions. Mechanik 2017, 9, 726–729. [Google Scholar] [CrossRef]
  7. Tongyue, W.; Ning, H.; Liang, L. Stability of milling of thin–walled workpiece. In Proceedings of the International Conference on Mechanic Automation and Control Engineering (MACE), Wuhan, China, 26–28 June 2010. [Google Scholar]
  8. Arnaud, L.; Gonzalo, O.; Seguy, S.; Jauregi, H.; Peigné, G. Simulation of low rigidity part machining applied to thin–walled structures. Int. J. Adv. Manuf. Technol. 2011, 54, 479–488. [Google Scholar] [CrossRef]
  9. Herranz, S.; Campa, F.J.; López, L.N.; Rivero, A.; Lamikiz, A.; Ukar, E.; Sánchez, J.A.; Bravo, U. The milling of airframe components with low rigidity: A general approach to avoid static and dynamic problems. Proc. Inst. Mech. Eng. Part B J. Eng. Manuf. 2005, 219, 789–801. [Google Scholar] [CrossRef]
  10. Four New High-Performance Milling Techniques for 3D Machining—Adaptive Milling. Available online: https://www.mmsonline.com/articles/four-new-high-performance-milling-techniques-for-3d-machining (accessed on 16 March 2024).
  11. Adaptive Milling—New Technological Enhancement for High Speed Machining. Available online: https://www.sapience-group.com/adaptive-milling-new-technological-enhancement-for-high-speed-machining/ (accessed on 16 March 2024).
  12. Mouritz, A. Introduction to Aerospace Materials; Woodhead Publishing Limited: Cambridge, UK, 2012. [Google Scholar]
  13. Mrazowa, M. Advanced composite materials of the future in aerospace industry. Incas Bull. 2013, 5, 139–150. [Google Scholar]
  14. PCC—Gas Turbine Components. Available online: https://www.pccforgedproducts.com (accessed on 16 February 2024).
  15. Abotiheen, H.A.A.; Khidir, B.A.; Bashir, M.; Balasubramanian, R.; Oshkour, A.A. Machining of Titanium Alloys: A Review. In Proceedings of the Student Conference on Research and Development (SCOReD 2011), Cyberjaya, Malaysia, 19–20 December 2011. [Google Scholar]
  16. Parimi, L.L. Additive Manufacturing of Nickel Based Superalloys for Aerospace Applications. Ph.D. Thesis, The University of Birmingham, Birmingham, UK, 2014. [Google Scholar]
  17. Humienny, Z. Specyfikacje Geometrii Wyrobów (GPS); WNT: Warszawa, Poland, 2004. [Google Scholar]
  18. Ratajczyk, E. Współrzędnościowa Technika Pomiarowa; Oficyna Wydawnicza Politechniki Warszawskiej: Warszawa, Poland, 2005. [Google Scholar]
  19. Bosch, J.A. Coordinate Measuring Machines and Systems; Marcel Pekker Inc.: New York, NY, USA, 1995. [Google Scholar]
  20. ATOS ScanBox—Optical 3D Coordinate Measuring Machine (Brochure). Available online: https://scanare3d.com/wp-content/uploads/2020/08/GOM_Brochure_ATOS_ScanBox_EN.pdf (accessed on 14 January 2023).
  21. Kurpiel, S.; Zagórski, K.; Cieślik, J.; Skrzypkowski, K. Investigation of Selected Surface Topography Parameters and Deformation during Milling of Vertical Thin–Walled Structures from Titanium Alloy Ti6Al4V. Materials 2023, 16, 3182. [Google Scholar] [CrossRef]
  22. Kurpiel, S.; Zagórski, K.; Cieślik, J.; Skrzypkowski, K.; Tuleshov, A. Evaluation of the Surface Topography and Deformation of Vertical Thin–Wall Milled Samples from the Nickel Alloy Inconel 625. Materials 2024, 17, 295. [Google Scholar] [CrossRef]
  23. Gang, L. Study on deformation of titanium thin–walled part in milling process. J. Mater. Process. Technol. 2009, 209, 2788–2793. [Google Scholar] [CrossRef]
  24. Hintze, W.; Wenserski, R.; Junghans, S.; Möller, C. Finish machining of Ti6Al4V SLM components under consideration of thin walls and support structure removal. Procedia Manuf. 2020, 48, 485–491. [Google Scholar] [CrossRef]
  25. Polishetty, A.; Goldberg, M.; Littlefair, G.; Puttaraj, M.; Patil, P.; Kalra, A. A preliminary assessment of machinability titanium alloy Ti6Al4V during thin wall machining using trochoidal milling. Procedia Eng. 2014, 97, 357–364. [Google Scholar] [CrossRef]
  26. Yusop, M.S.M.; Said, A.Y.M.; Karim, Z.; Ramli, A.S.; Azman, R.; Rahman, A.B.A.; Kamil, F.N.A. Effect of Different Cutting Speed towards Machinability of Titanium (Ti6Al4V) Curved Thin Wall using Trochoidal Milling Path. Int. J. Eng. Adv. Technol. (IJEAT) 2019, 8, 3392–3396. [Google Scholar] [CrossRef]
  27. Zha, J.; Liang, J.; Li, Y.; Zhang, H.; Chen, Y. Large Cutting Depth and Layered Milling of Titanium Alloy Thin–Walled Parts. Materials 2020, 13, 1499. [Google Scholar] [CrossRef]
  28. Gapinski, B.; Wieczorowski, M.; Marciniak–Podsadna, L.; Dybala, B.; Ziolkowski, G. Comparison of Different Method of Measurement Geometry using CMM, Optical Scanner and Computed Tomography 3D. Procedia Eng. 2014, 69, 255–262. [Google Scholar] [CrossRef]
  29. Kurpiel, S.; Cudok, B.; Zagórski, K.; Cieślik, J.; Skrzypkowski, K.; Brostow, W. Influence of Tools and Cutting Strategy on Milling Conditions and Quality of Horizontal Thin–Wall Structures of Titanium Alloy Ti6Al4V. Sensors 2023, 23, 9905. [Google Scholar] [CrossRef]
  30. Zhang, F.; Ilavsky, J.; Lindwall, G.; Stoudt, M.R.; Levine, L.E.; Allen, A.J. Solid-State Transformation of an Additive Manufactured Inconel 625 Alloy at 700 °C. Appl. Sci. 2021, 11, 8643. [Google Scholar] [CrossRef]
  31. Peters, M.; Brodie, E.G.; Thomas, S.; Djumas, L.; Brameld, M.; Salasi, M.; Quadir, Z.; Iannuzzi, M.; Wang, J.; Sercombe, T.; et al. On the importance of nano-oxide control in laser powder bed fusion manufactured Ni-based alloys to enhance fracture properties. Materialia 2023, 32, 101958. [Google Scholar] [CrossRef]
  32. Yang, K.-R.; Hanawa, T.; Kwon, T.-Y.; Min, B.-K.; Hong, M.-H. Mechanical Property Comparison of Ni–Cr–Mo Alloys Fabricated via One Conventional and Two New Digital Manufacturing Techniques. Appl. Sci. 2021, 11, 9308. [Google Scholar] [CrossRef]
  33. Wu, Z.Y.; Liu, Y.J.; Wu, X.; Liu, X.C. Fatigue performance of beta titanium alloy topological porous structures fabricated by laser powder bed fusion. J. Mater. Res. Technol. 2024, 29, 4772–4789. [Google Scholar] [CrossRef]
  34. SIS—Industry Catalog. Available online: https://sisindustry.com/chemia-przemyslowa/przemyslowe-srodki-smarne/ (accessed on 1 April 2024).
  35. Seco Tools Catalog—JS554100E2R050.0Z4–SIRA. Available online: https://www.secotools.com/article/p_03029964 (accessed on 11 January 2024).
  36. Seco Tools Catalog—JS754100E2C.0Z4A–HXT. Available online: https://www.secotools.com/article/p_03186836 (accessed on 11 January 2024).
  37. Seco Tools Catalog—JH730100D2R100.0Z7–HXT. Available online: https://www.secotools.com/article/p_03127380 (accessed on 11 January 2024).
  38. Saenz, A.; Brostow, W.; Rivera, E.; Castaño, V.M. Ceramic biomaterials: An introductory overview. J. Mater. Ed. 1999, 21, 267. [Google Scholar]
  39. Davidovits, J. Geopolymers: Man-made rock geosynthesis and the resulting development of very early high strength cement. J. Mater. Ed. 1994, 16, 91–139. [Google Scholar]
  40. Bilyeu, B.; Brostow, W.; Menard, K.P. Epoxy thermosets and their applications. III. Kinetic equations and models. J. Mater. Ed. 2001, 23, 189. [Google Scholar]
  41. Brostow, W.; Datashvili, T.; Miller, H. Wood and wood derived materials. J. Mater. Ed. 2010, 32, 125. [Google Scholar]
  42. Dobiszewska, M. Waste materials used in making mortar and concrete. J. Mater. Ed. 2017, 39, 133. [Google Scholar]
  43. Flores, A. Indentation in polymers. J. Mater. Ed. 2017, 39, 173. [Google Scholar]
Figure 1. Manufacturing documentation of a sample with a thin wall in horizontal orientation [1,29].
Applsci 14 03034 g001
Figure 2. Tool path during sample machining using (a) adaptive face milling; (b) adaptive cylindrical milling [1]—the green color means tool path during milling, while the red color means tool paths during the tool return.
Applsci 14 03034 g002aApplsci 14 03034 g002b
Figure 3. Measuring planes for determining dimensional deviations [1].
Applsci 14 03034 g003
Figure 4. Measurement by the contact method: (a) 1—sample, 2—universal base, 3—posts, 4—machine rotary table, 5—measuring arm with GOM projector; (b) basing method [1].
Applsci 14 03034 g004
Figure 5. Measurements by the contact method: (a) 1—sample, 2—probe, 3—posts; (b) basing method [1].
Applsci 14 03034 g005
Figure 6. Dimensional variation of the horizontal thin wall in the direction parallel to the direction of tool feed motion, for samples made of nickel alloy machined using an adaptive face milling strategy—determined by the optical method: (a) N1; (b) N2; (c) N3.
Applsci 14 03034 g006aApplsci 14 03034 g006b
Figure 7. Dimensional variation of the horizontal thin wall in the direction parallel to the direction of tool feed motion, for samples made of nickel alloy machined using an adaptive cylindrical milling strategy—determined by the optical method: (a) N4; (b) N5; (c) N6.
Applsci 14 03034 g007aApplsci 14 03034 g007b
Figure 8. Dimensional variation of the horizontal thin wall in the direction perpendicular to the direction of tool feed motion, for samples made of nickel alloy machined using an adaptive face milling strategy—determined by the optical method: (a) N1; (b) N2; (c) N3.
Applsci 14 03034 g008aApplsci 14 03034 g008b
Figure 9. Dimensional variation of the horizontal thin wall in the direction perpendicular to the direction of tool feed motion, for samples made of nickel alloy machined using an adaptive cylindrical milling strategy—determined by the optical method: (a) N4; (b) N5; (c) N6.
Applsci 14 03034 g009aApplsci 14 03034 g009b
Figure 10. Defect on thin wall surface for samples prepared using adaptive cylindrical milling [1].
Applsci 14 03034 g010
Figure 11. Dimensional variation of the horizontal thin wall in the direction parallel to the direction of tool feed motion, for samples made of nickel alloy machined using an adaptive face milling strategy—determined by the contact method: (a) N1; (b) N2; (c) N3.
Applsci 14 03034 g011aApplsci 14 03034 g011b
Figure 12. Dimensional variation of the horizontal thin wall in the direction parallel to the direction of tool feed motion, for samples made of nickel alloy machined using an adaptive face milling strategy—determined by the contact method: (a) N4; (b) N5; (c) N6.
Applsci 14 03034 g012
Figure 13. Dimensional variation of the horizontal thin wall in the direction perpendicular to the direction of tool feed motion, for samples made of nickel alloy machined using an adaptive face milling strategy—determined by the contact method: (a) N1; (b) N2; (c) N3.
Applsci 14 03034 g013
Figure 14. Dimensional variation of the horizontal thin wall in the direction perpendicular to the direction of tool feed motion, for samples made of nickel alloy machined using an adaptive face milling strategy—determined by the contact method: (a) N4; (b) N5; (c) N6.
Applsci 14 03034 g014
Figure 15. Statistical results of dimensional variations determined by the optical method.
Applsci 14 03034 g015
Figure 16. Statistical results of dimensional variations determined by the contact method.
Applsci 14 03034 g016
Table 1. The mechanical properties of Inconel 625 [22].
Mechanical PropertiesValueUnit
Tensile strength Rmmin. 760MPa
Yield strength 0.2%min. 380MPa
Elongation at breakmin. 35%
Density8.44g/cm3
Table 2. The chemical composition of Inconel 625 [22].
ElementNiCrMoNbFeCMnSiSAlTiPCo
Percentage (%)≥5820–238–103.15–4.15≤5≤0.1≤0.5≤0.5≤0.015≤4.4≤0.4≤0.015≤1
Table 3. Combinations of cutting tools and machining strategies to perform samples (our own elaboration based on [10,11,35,36,37]).
Sample NumberMaterialToolMachining Strategy
N1Nickel alloy
Inconel 625
JS554100E2R050.0Z4–SIRAAdaptive face milling
N2JS754100E2C.0Z4A–HXTAdaptive face milling
N3JH730100D2R100.0Z7–HXTAdaptive face milling
N4JS554100E2R050.0Z4–SIRAAdaptive cylindrical milling
N5JS754100E2C.0Z4A–HXTAdaptive cylindrical milling
N6JH730100D2R100.0Z7–HXTAdaptive cylindrical milling
Table 4. Summary of statistical results of dimensional variation.
MethodSample NumberMean ValueMedian ValueMinimum ValueMaximum ValueVarianceStandard
Deviation
Standard
Error
Optical methodN1_MS0.200.22−0.020.280.000.070.01
N1_BOF−0.18−0.20−0.250.000.000.060.01
N2_MS0.220.23−0.050.350.010.100.01
N2_BOF−0.28−0.31−0.410.060.010.110.01
N3_MS0.440.450.160.580.010.110.01
N3_BOF−0.39−0.40−0.52−0.110.010.110.01
N4_MS0.220.230.020.310.000.070.01
N4_BOF−0.26−0.26−0.34−0.080.000.060.01
N5_MS0.130.14−0.060.220.000.070.01
N5_BOF−0.24−0.26−0.33−0.040.000.070.01
N6_MS0.220.220.090.300.000.050.00
N6_BOF−0.18−0.19−0.26−0.050.000.050.01
Contact methodN1_MS0.200.22−0.010.290.010.070.01
N1_BOF−0.18−0.20−0.260.010.000.070.01
N2_MS0.230.25−0.030.380.010.100.01
N2_BOF−0.29−0.32−0.410.010.010.100.01
N3_MS0.440.450.120.590.010.120.01
N3_BOF−0.40−0.41−0.53−0.090.010.120.01
N4_MS0.220.230.010.310.010.070.01
N4_BOF−0.25−0.26−0.33−0.060.010.070.01
N5_MS0.140.16−0.080.240.000.070.01
N5_BOF−0.24−0.26−0.33−0.020.010.070.01
N6_MS0.230.230.090.320.000.060.00
N6_BOF−0.19−0.20−0.26−0.040.000.060.00
Table 5. The discrepancy between the maximum values of dimensional variations on the machined surface obtained by optical and contact measurements.
SampleN1_MSN2_MSN3_MSN4_MSN5_MSN6_MS
Difference (mm)0.010.030.0100.020.02
Difference (%)3.47.91.708.36.2
Table 6. The discrepancy between the maximum values of dimensional variations from the bottom of sample obtained by optical and contact measurements.
SampleN1_BOFN2_BOFN3_BOFN4_BOFN5_BOFN6_BOF
Difference (mm)0.0100.010.0100
Difference (%)3.801.9300
Disclaimer/Publisher’s Note: The statements, opinions and data contained in all publications are solely those of the individual author(s) and contributor(s) and not of MDPI and/or the editor(s). MDPI and/or the editor(s) disclaim responsibility for any injury to people or property resulting from any ideas, methods, instructions or products referred to in the content.

