Article

Research on Hybrid Relay Protocol Design and Cross-Layer Performance Based on NOMA

1
Department of Electronics and Communication Engineering, North China Electric Power University, Baoding 071003, China
2
Hebei Key Laboratory of Power Internet of Things Technology, Baoding 071003, China
3
CSG Electric Power Research Institute, Guangzhou 510603, China
*
Author to whom correspondence should be addressed.
Appl. Sci. 2024, 14(7), 3044; https://doi.org/10.3390/app14073044
Submission received: 12 March 2024 / Revised: 28 March 2024 / Accepted: 1 April 2024 / Published: 4 April 2024
(This article belongs to the Section Electrical, Electronics and Communications Engineering)

Abstract

:
Wireless and power line communication hybrid relay technology can realize complementary advantages and comprehensively improve the communication coverage and performance of power Internet of Things. In order to study the mechanism of the physical layer and Media Access Control (MAC) layer algorithm that affects the performance of hybrid relay systems, the cross-layer performance modeling, optimization, and simulation analysis are carried out for the non-orthogonal multiple access (NOMA) technology. Firstly, a two-hop NOMA media access control protocol is designed based on the CSMA algorithm. Considering the effects of non-ideal channel transmission at the physical layer and competitive access at the MAC layer on the system performance, a cross-layer performance analysis model of hybrid wireless and power line communication relay system under NOMA is established. Finally, a cross-layer optimization model based on multi-objective programming is established for the hybrid relay system. By analyzing the relationship between transmitting power and performance index, the joint optimization of transmitting power and power distribution factor between users is realized. Simulation results verify the validity and reliability of the proposed cross-layer model. The results show that the hybrid relay algorithm combined with NOMA and CSMA can effectively improve the performance of the system throughput, packet loss probability, and delay.

1. Introduction

With the construction and development of smart grids, energy Internet of Things, and other applications, the number of terminal devices and service types are increasing, which requires future communication networks to achieve larger terminal access, stronger signal coverage performance, and a higher communication rate under the condition of limited spectrum resources [1,2,3]. NOMA can significantly improve the spectral efficiency and user fairness of the network [4,5]. NOMA-based wireless communication access and power line communication relay technology can not only improve the flexibility of network use and the overall performance of communication systems, but also have important theoretical research value and application prospects in scenarios such as remote automatic meter reading in power, ubiquitous power Internet of Things, and smart home.
NOMA is a multi-access technology that enables users to communicate with non-orthogonal resources at the cost of high receiver complexity [6]. It allows users to share the same channel resources with different channel power levels, uses overlay coding technology to achieve power domain multiplexing at the transmitting end, and uses sequential serial interference cancellation (SIC) technology to separate signals at the receiving end [4,5]. Because of its high spectral efficiency, it has attracted extensive attention in recent years. Ref. [6] studied the performance of a decoded and forwarded relay double-hop hybrid communication system based on NOMA, and derived the closed expressions of outage probability, asymptotic outage probability, and traversal capacity. Ref. [7] proposed a continuous user relay (SR) to improve the spectral characteristics of cooperative NOMA systems. By using a pair of near users to relay the signals of far users, the interrupt fairness and spectrum utilization between near and far users are significantly improved. Xinchen Wei et al. [4] studied an energy-efficient resource allocation technique for hybrid Time division multiple access (TDMA)-non-orthogonal multiple access (NOMA) systems. With the goal of maximizing the overall energy efficiency of the system under the constraints of minimum rate and transmission power per user, the available time slots and available transmission power are jointly allocated. In [5], the NOMA technology was applied to the downlink multi-relay cooperative Power Line Communication (PLC) network. In order to meet the destination node quality of Service (QoS) requirements and minimize the system power consumption, a distributed opportunistic relay selection scheme based on weighted harmonic mean was designed for Decode-and-Forward (DF) and Amplify-and-Forward (AF) protocols, respectively. The designed scheme can obtain better system performance than the benchmark scheme.
Existing research on NOMA technology mainly focuses on the physical layer or MAC layer of wireless and power line communication, and rarely analyzes from the perspective of cross-layer. It is shown that cross-layer analysis is critical for performance prediction, design, and optimization of protocols. Based on the downlink heterogeneous network NOMA system, Ref. [8] proposed a long-term cross-layer resource allocation model with dynamic traffic arrival and limited channel information. In the case of low-overhead single-bit feedback, the optimal decoding sequence, user scheduling and power allocation were analyzed. Ref. [9] studied the energy efficiency problem of NOMA-based cloud radio access network (C-RANs), which maximized the energy efficiency by jointly optimizing power allocation, analog precoding, and digital precoding under the constraints of front-end link capacity and total transmit power. Yuanrui Liu et al. [10] designed a cross-layer method suitable for NOMA systems to meet the delay requirements. By formulating the cross-layer scheduling problem as a joint optimization problem of transmission rate and decoding order, the optimal delay–power tradeoff was obtained in the NOMA system. In order to meet the requirements of quality of service, Hancheng Lu et al. [11] studied the design of a multi-user NOMA system for video transmission. By studying the semi-analytic rate distortion model of encoded video sequence and the physical layer model of multi-carrier NOMA network, the distortion-sensing power distribution problem was established to minimize the end-to-end distortion of the system. Ref. [12] studied the optimal delay uplink transmission of NOMA based on cross-layer design under block-fading channels. By using the constrained Markov decision process, a cross-layer optimization algorithm aiming at minimum average delay was established under the constraints of power and reliability. In order to improve the spectrum utilization rate and system capacity of wireless networks, ref. [13] applied NOMA technology to the unmanned aerial vehicle (UAV) auxiliary wireless networks to serve multiple users on the same spectrum at the same time, and proposed cross-layer resource allocation strategies, including UAV scheduling, user grouping, and power allocation.
The above cross-layer algorithms focus on using resource scheduling and optimal allocation [8,9,10,11,12], optimal decoding sequence [8,10], user pairing [13], and other methods to achieve tradeoff and optimization of system performance, but rarely in-depth analysis of the interaction mechanism between physical layer and MAC layer parameters and performance. In order to further elaborate the contribution of this paper, Table 1 summarizes the existing main literature based on NOMA technology in the past three years. The two-hop relay system can improve the reliability and coverage of data transmission, and the cross-layer research of the physical layer and MAC layer can realize the information exchange between the physical layer and MAC layer, and further optimize the network performance. Therefore, the cross-layer analysis and optimization of the two-hop hybrid communication system based on NOMA technology has important research value.
In this paper, aiming at the hybrid relay system of wireless and power line communication based on NOMA, the cross-layer performance modeling, optimization, and simulation analysis of the combined physical layer and MAC are carried out. The influence of the power level of the physical layer used for information transmission on the bandwidth efficiency and reliability of the system is studied, and the optimal power distribution model based on multi-objective programming is established to maximize the performance of the system.
The main contributions of this paper are as follows:
  • For the hybrid relay system of wireless and power line communication based on NOMA, the cross-layer performance analysis model of the combined physical layer and MAC layer is established. Based on the CSMA algorithm of IEEE 802.11 and IEEE 1901 standards [14,15], a media access control scheme of two-hop NOMA is presented. By studying the influence of power control on physical layer and MAC layer, a cross-layer performance analysis model is established considering MAC layer retreat flow and physical layer channel conditions, and expressions such as normalized throughput, packet loss probability, and delay are derived.
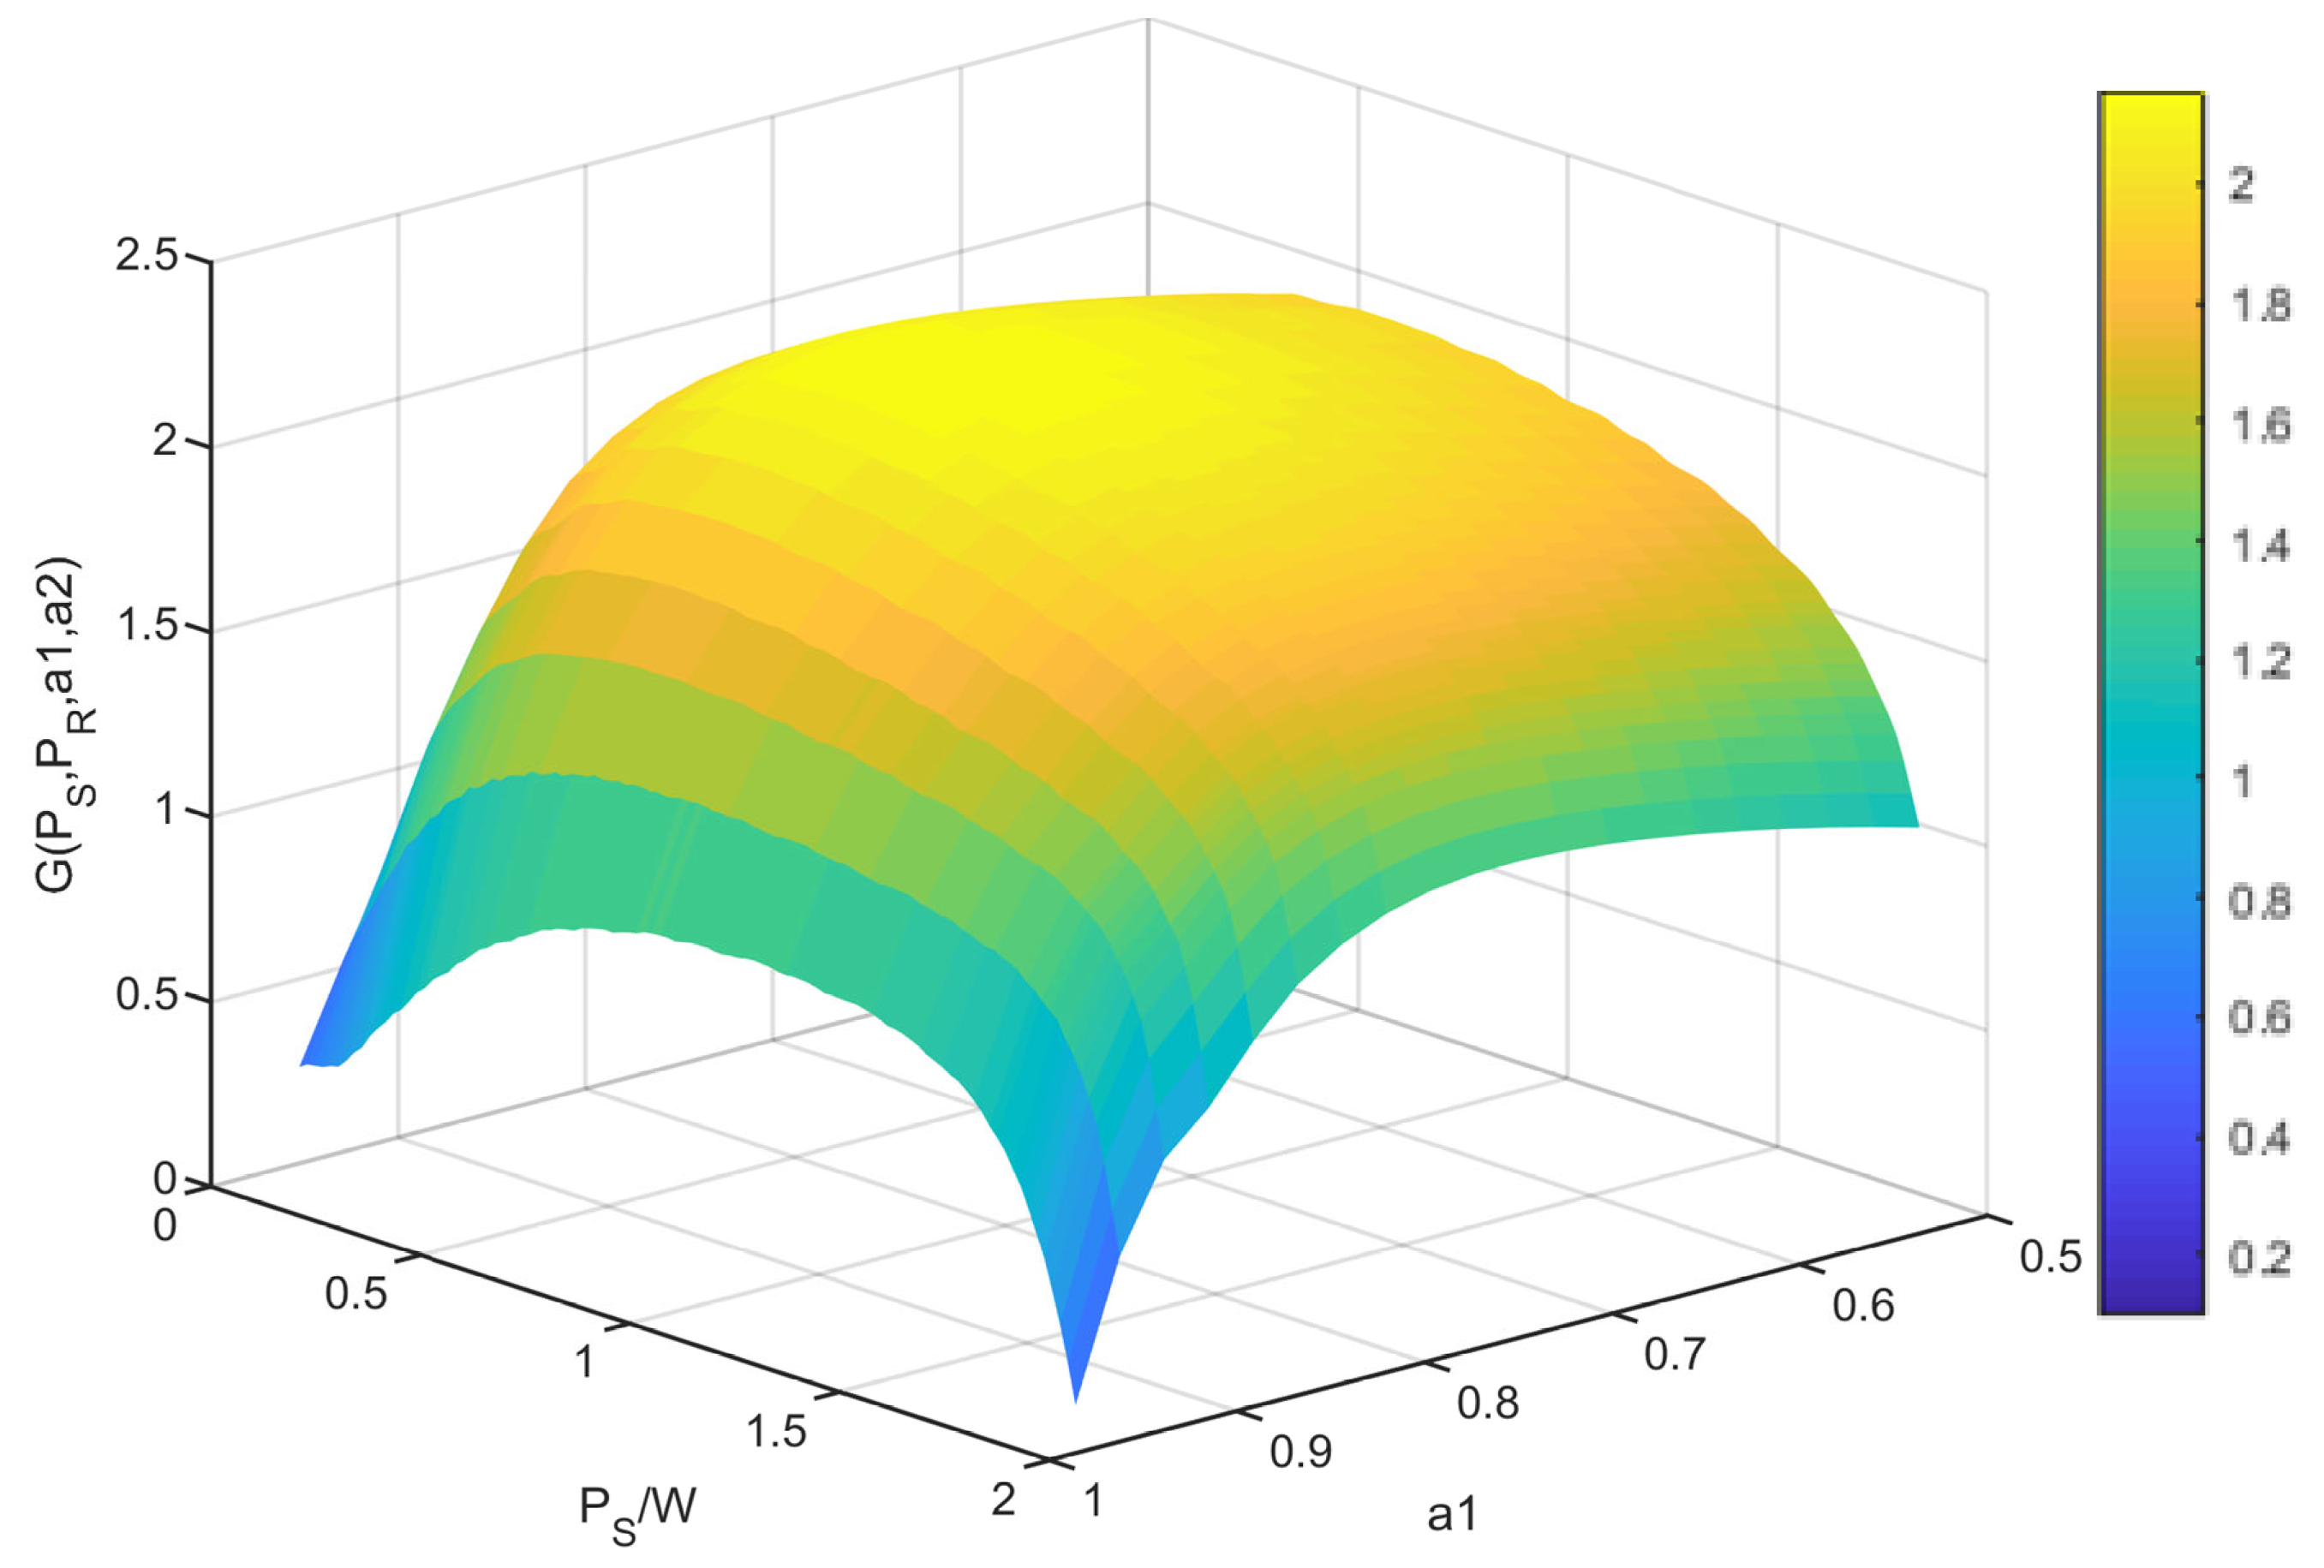
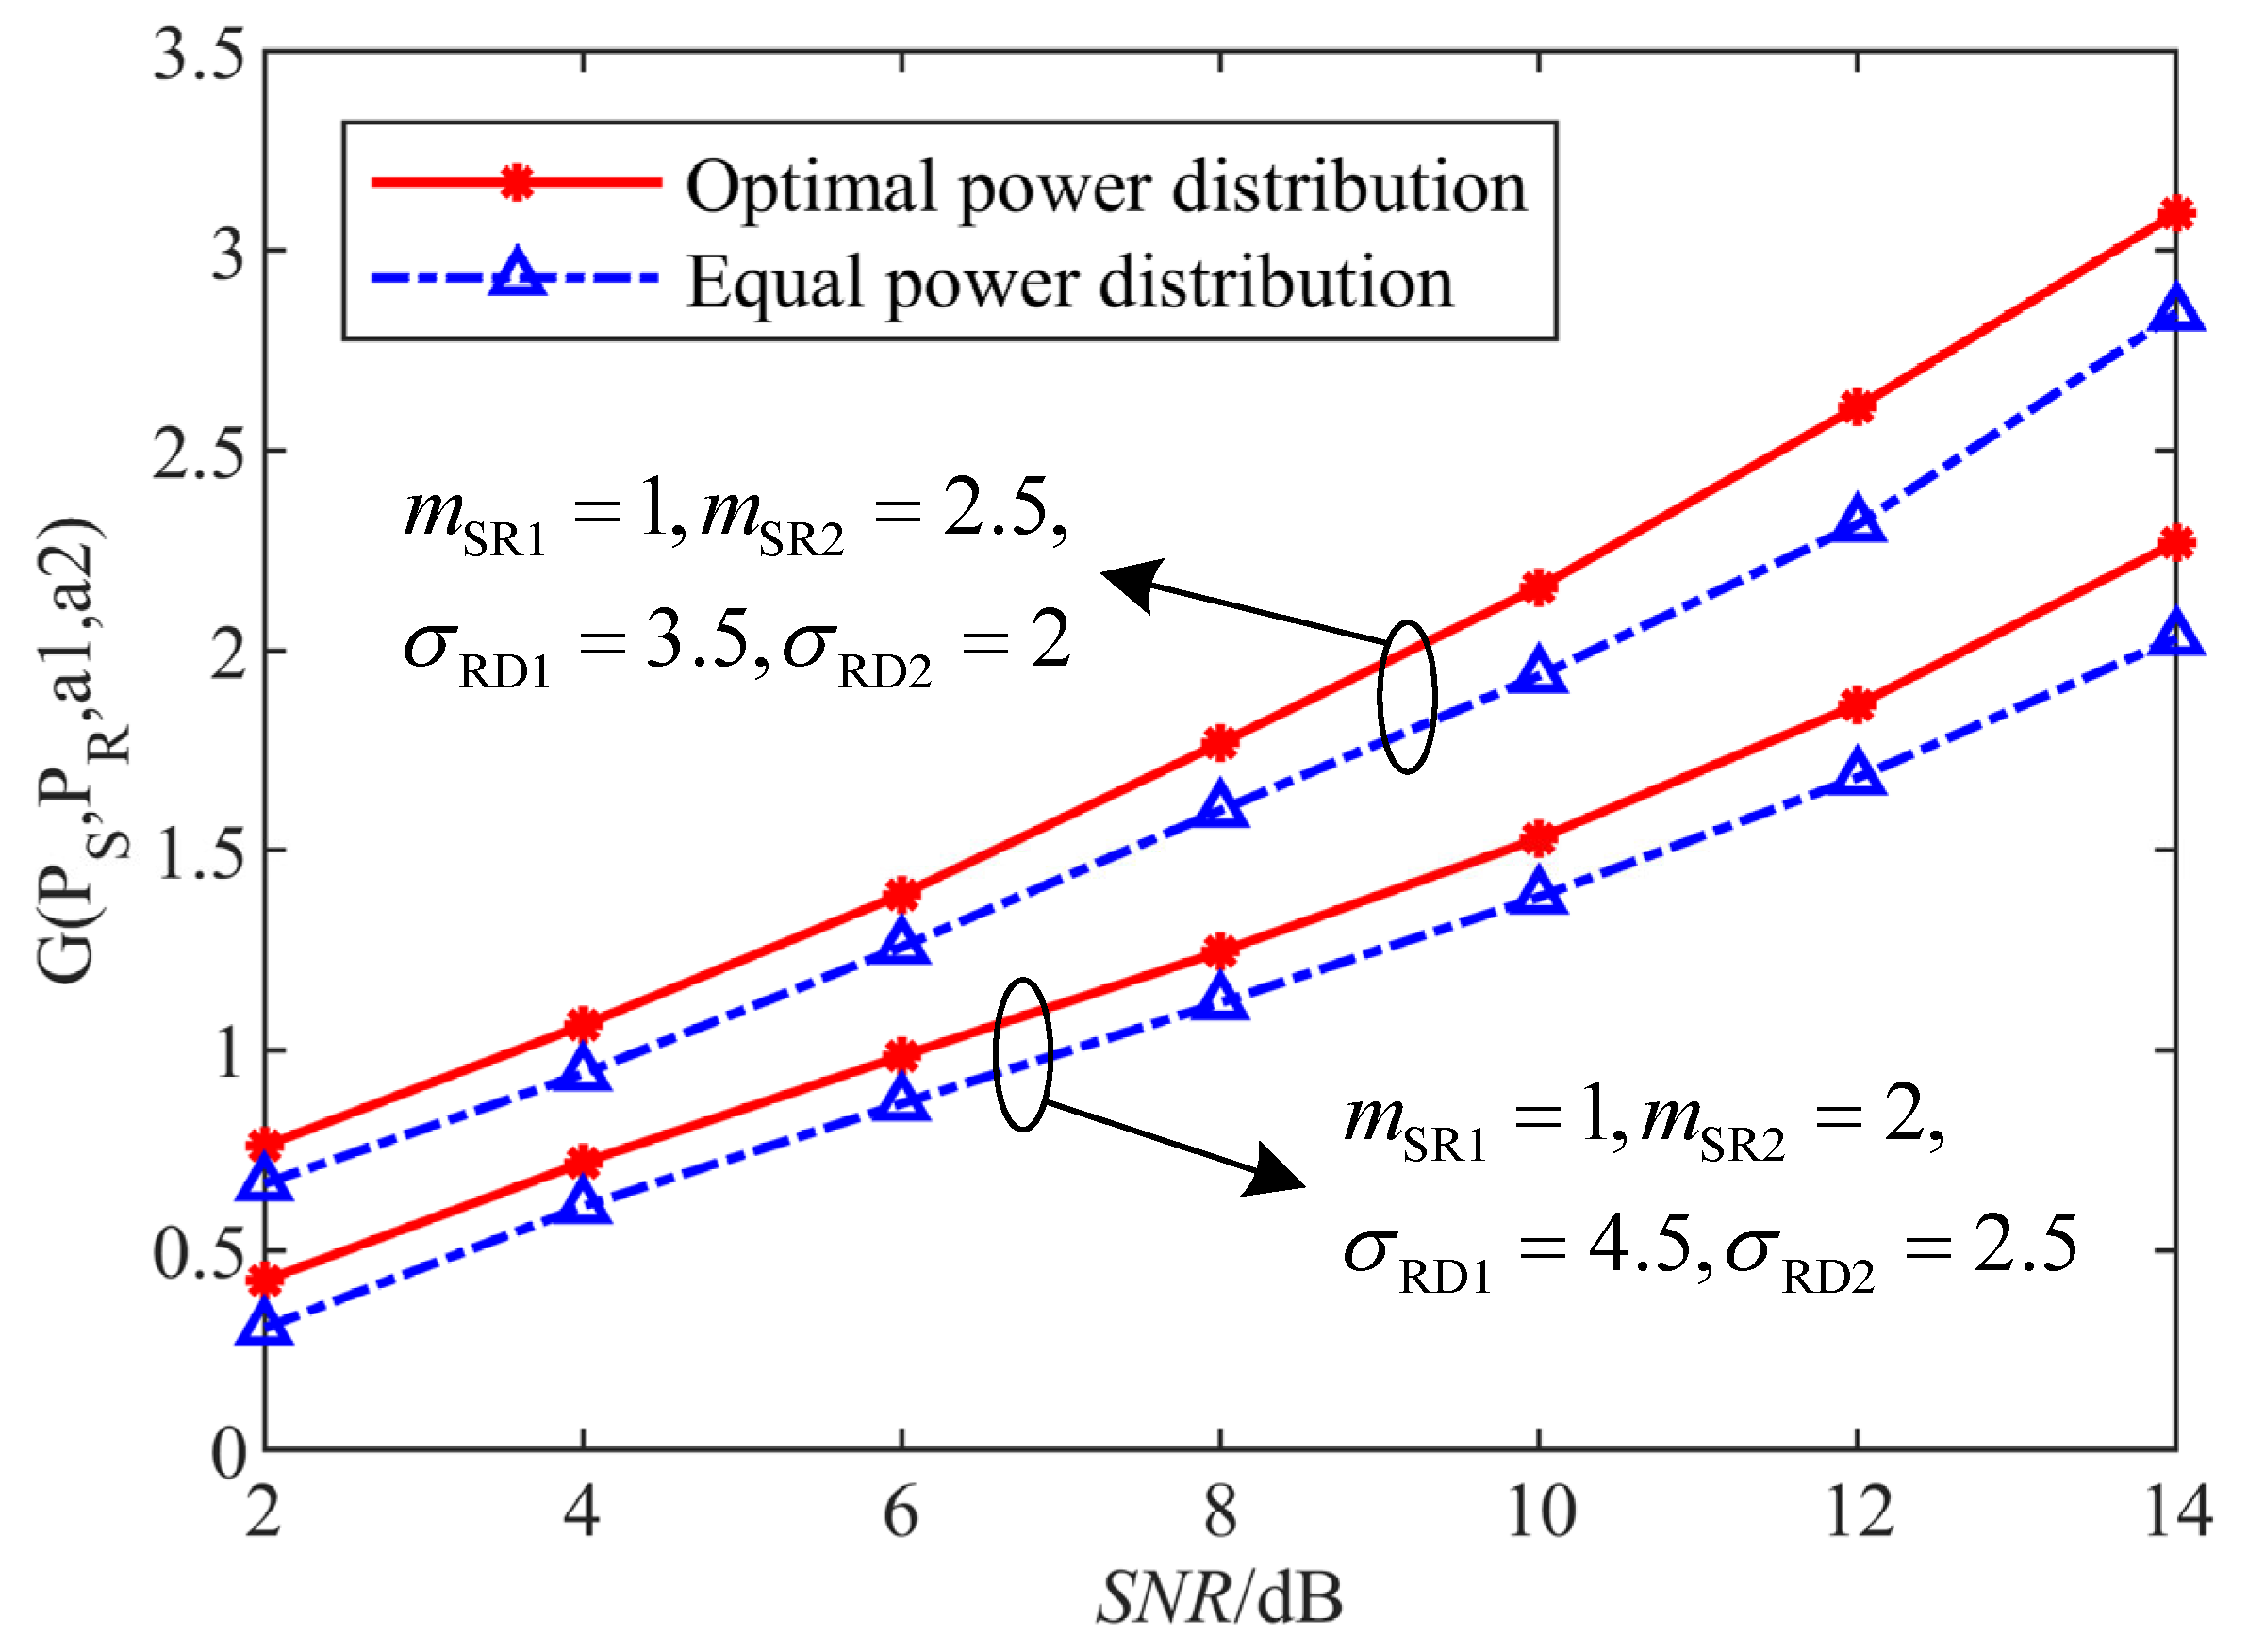
  • For the hybrid relay system of wireless and power line communication, by studying the influence of power control on the transmission reliability of the physical layer and the number of competing nodes in the MAC layer, a cross-layer optimization model based on multi-objective programming is established to realize the combined optimization of the transmitted power at the source end and the power distribution factor among users, and the optimal power distribution factor under different parameters is determined by using a genetic algorithm and exhaustion method.
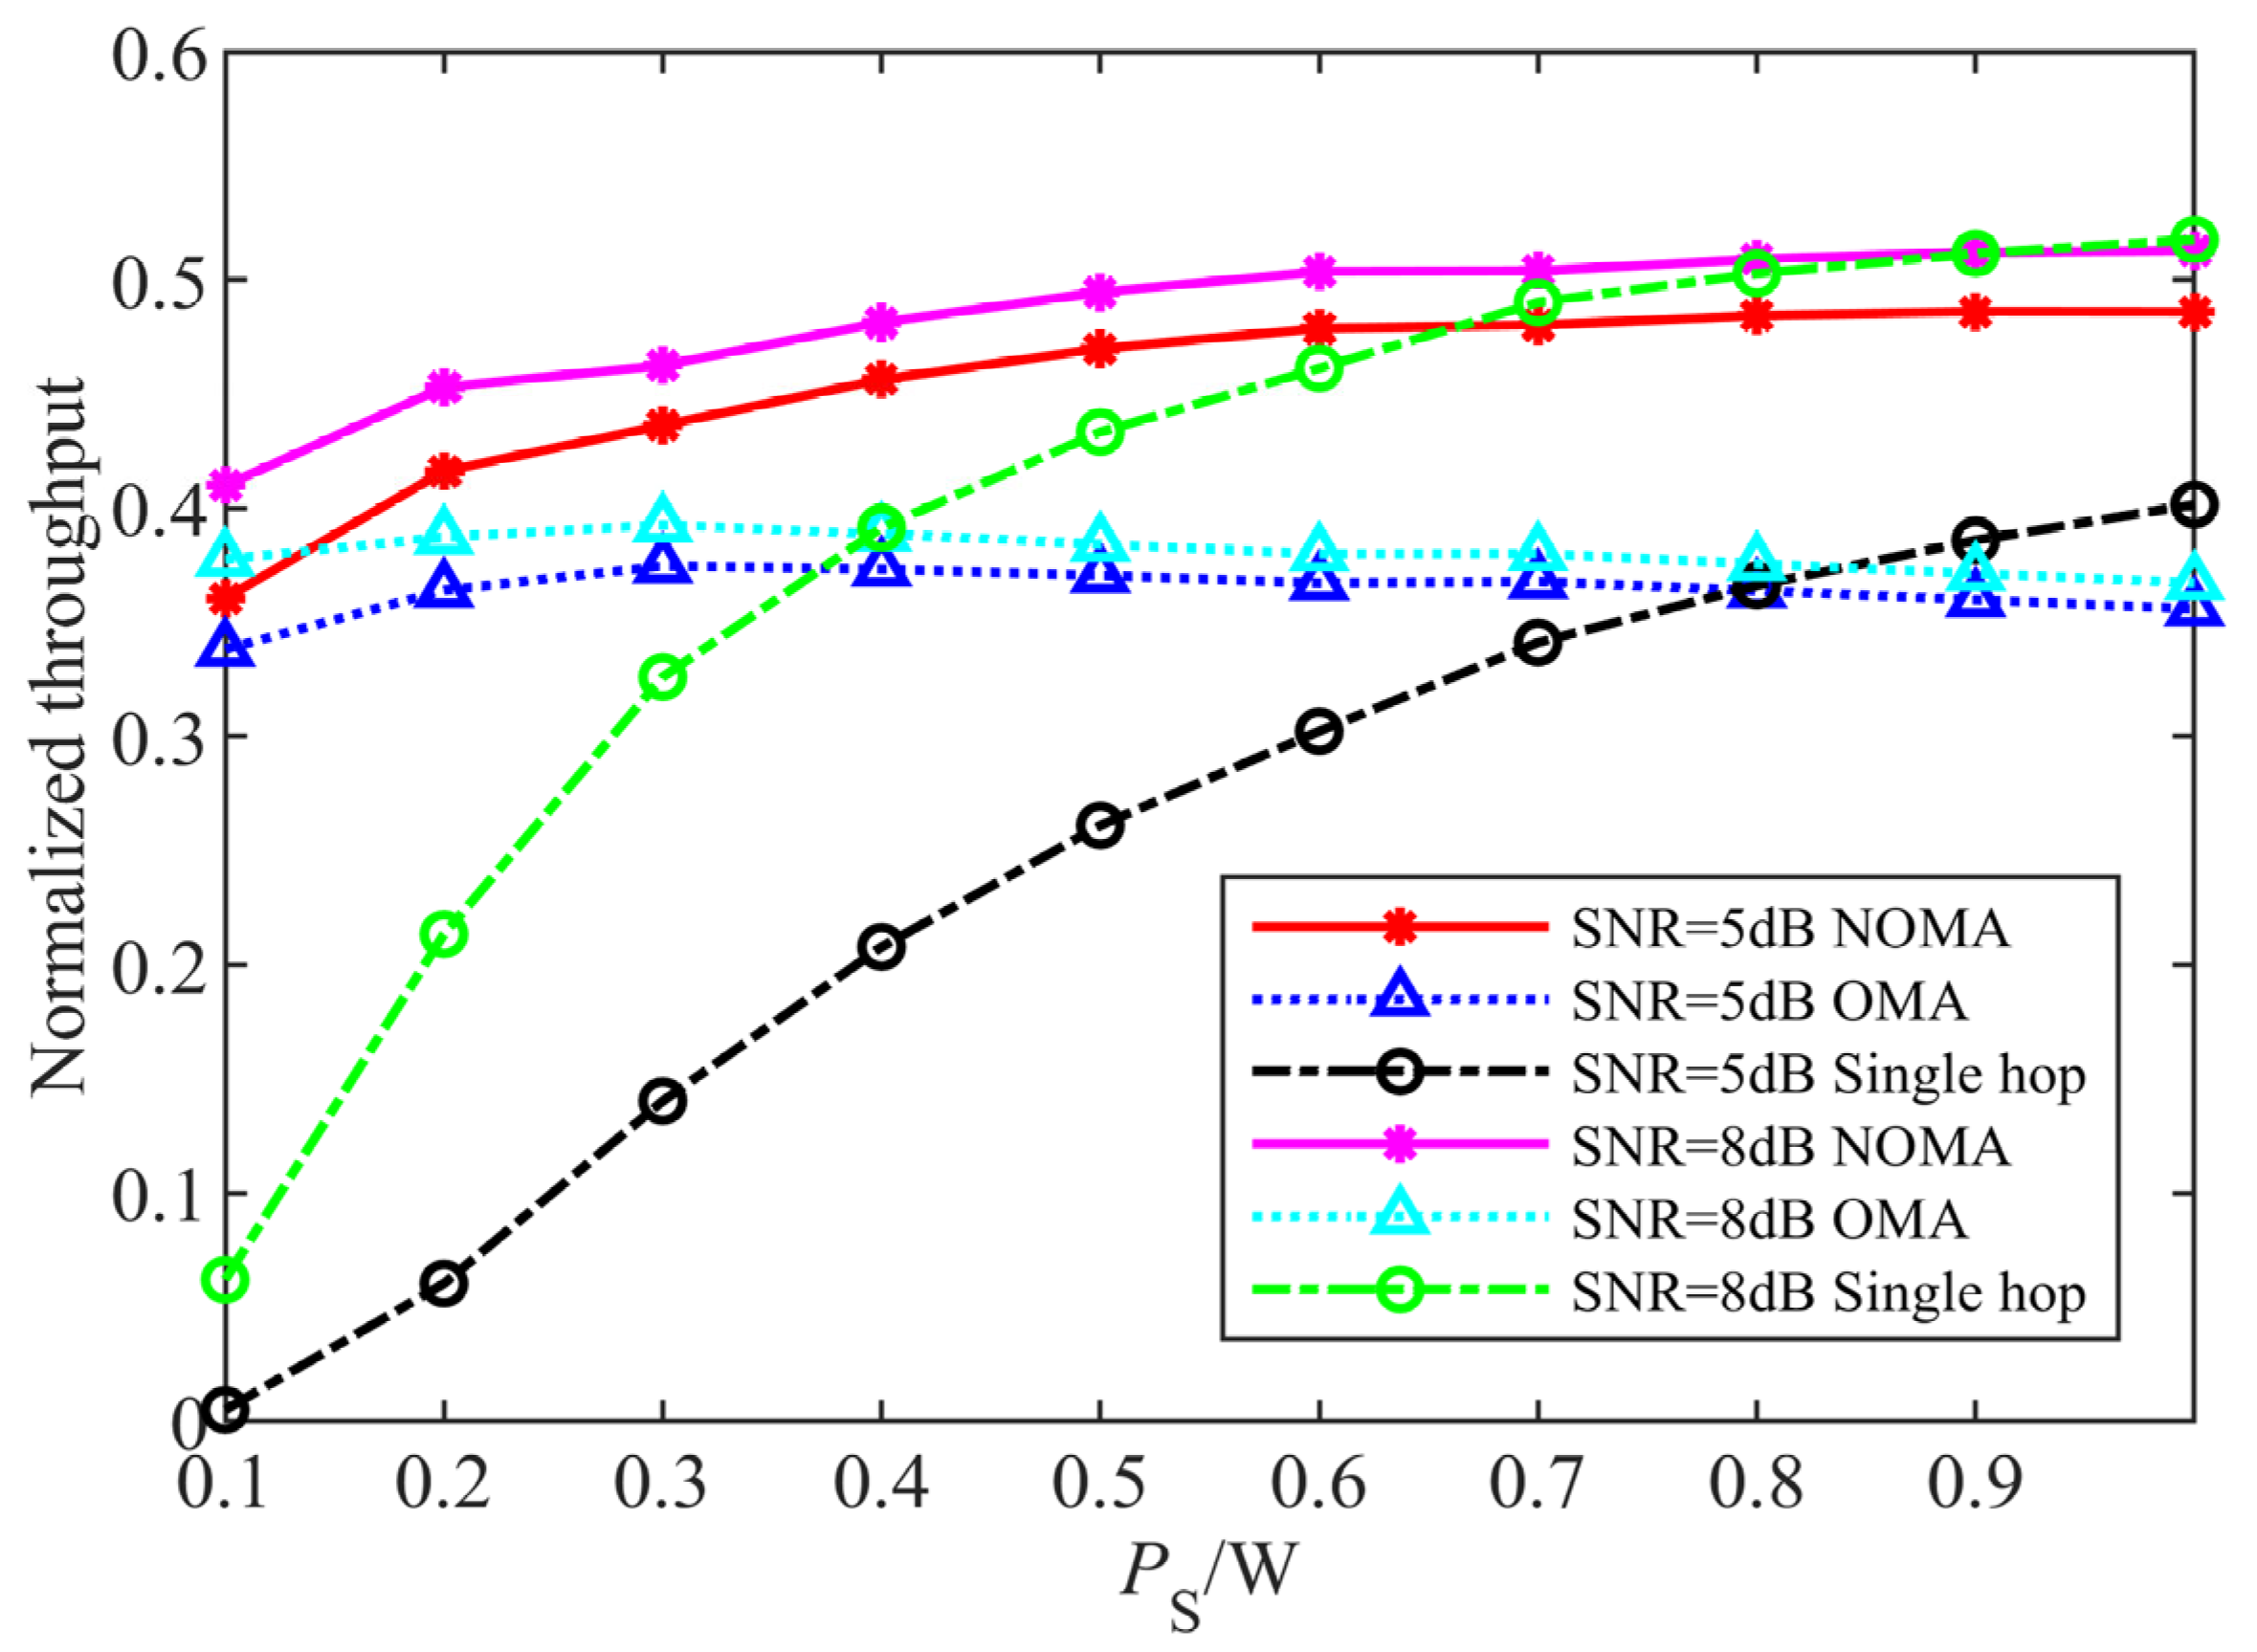
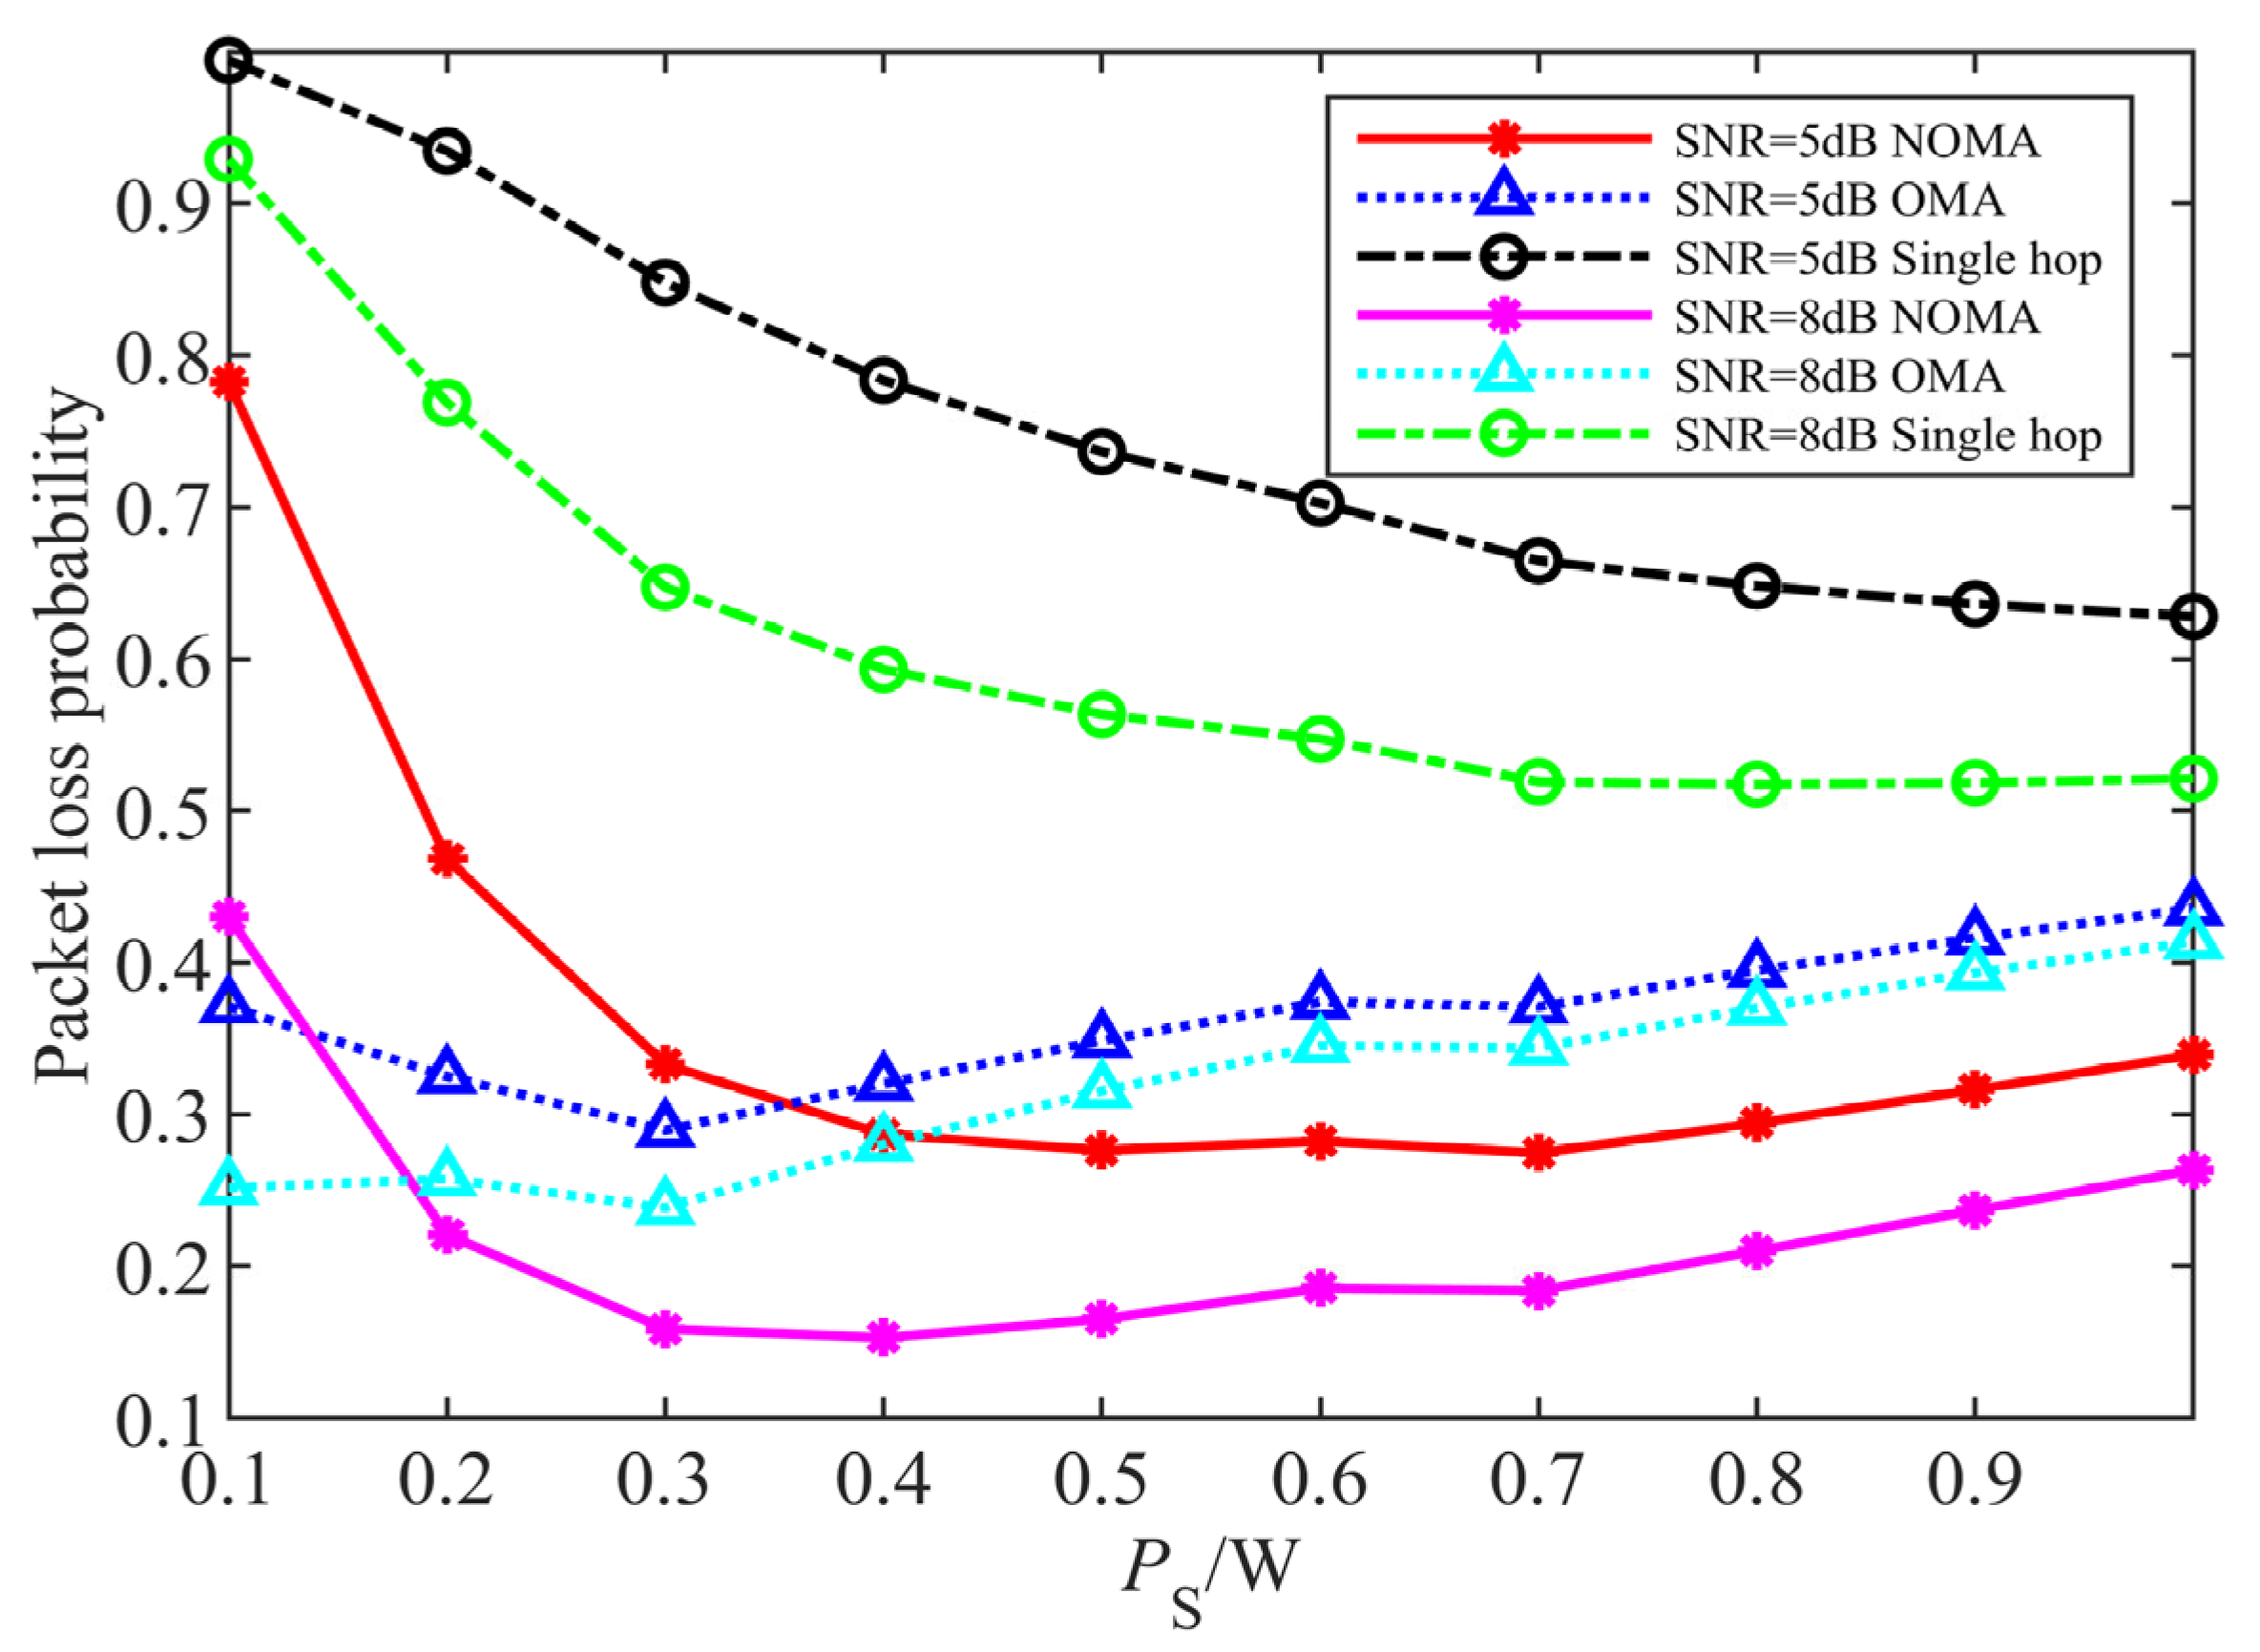
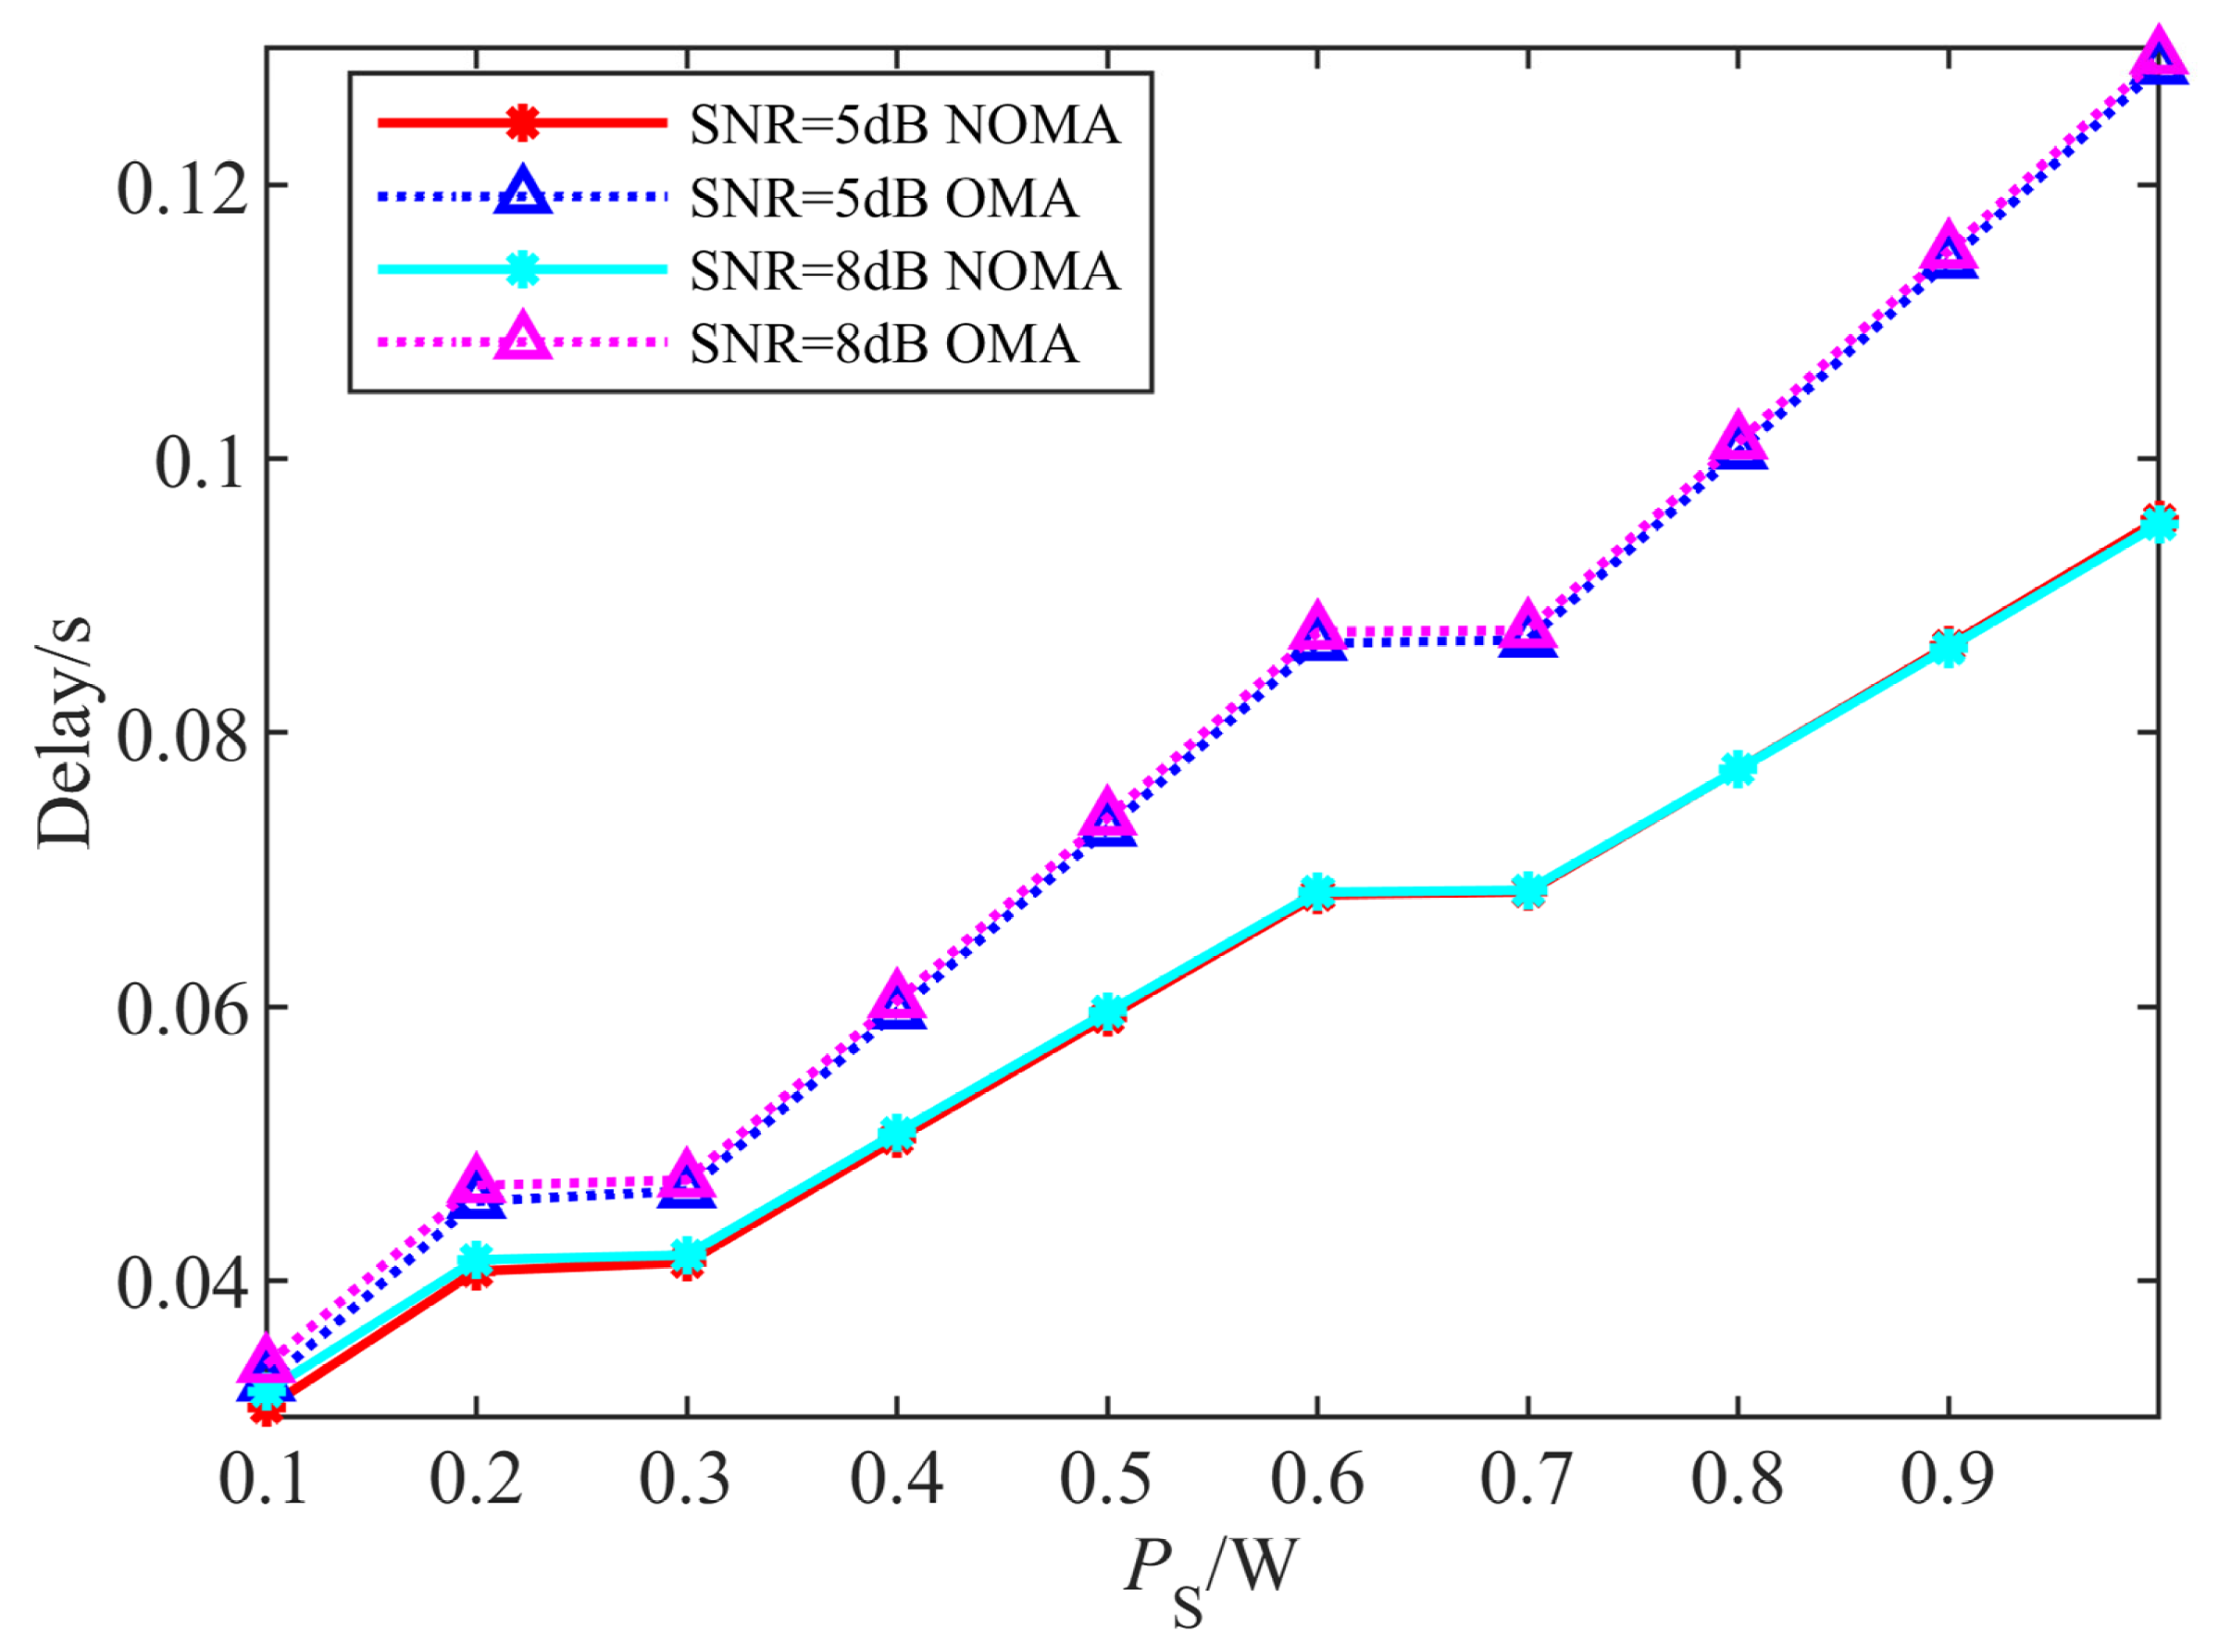
  • The model and algorithm performance are simulated through extensive Monte Carlo simulation. This paper compares the cross-layer performance of the system under different transmission schemes such as NOMA, OMA, and wireless single-hop, and analyzes the law of the influence of physical layer parameters and MAC layer parameters on system performance. The simulation results verify the validity and reliability of the theoretical model and show that the best power allocation algorithm in this paper makes the system have better performance in terms of normalized throughput, packet loss rate, and delay.
The rest of this study can be summarized as follows: Section 2 introduces the system model of this paper. Section 3 introduces the design of MAC layer transport protocol for two-hop relay system based on NOMA and establishes the cross-layer performance analysis model. Section 4 gives the simulation results. The combined optimization of the source transmit power and the power distribution factor between users is carried out for the system in Section 5. Section 6 summarizes the work of this paper.

2. System Model and Signal Processing
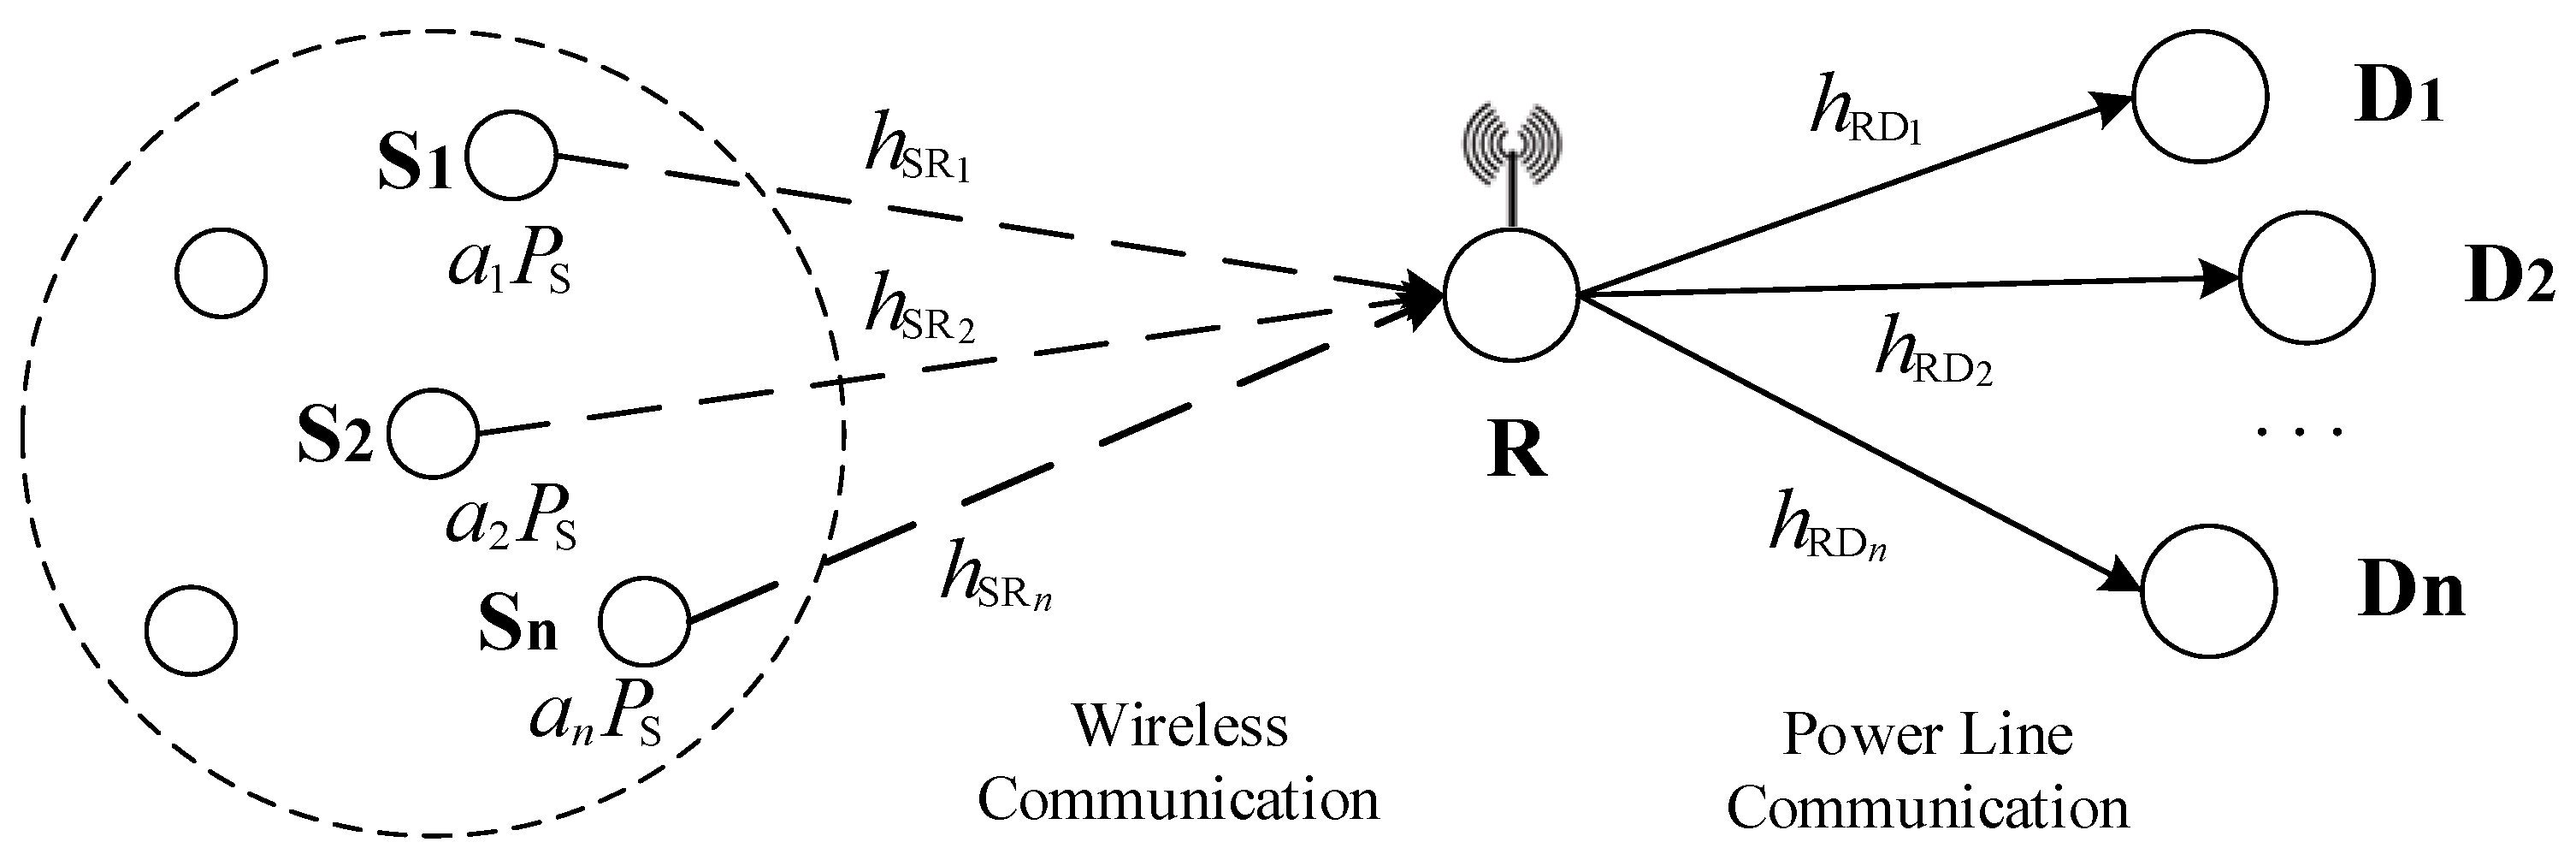
2.1. System Model

Figure 1 shows the two-hop hybrid communication system model based on NOMA. The system consists of source end S, destination end D, and a DF relay node R with wireless and PLC dual interface. The source S contains n stations S = { S 1 , S 2 , , S n } , and the destination D contains n stations D = { D 1 , D 2 , , D n } . First of all, the sites in the listening range of the source end S compete based on the CSMA access scheme of the IEEE 802.11 standard. The successful sites send packets to the relay R with different power levels by using superposition coding technology. After ideal SIC decoding at R, R re-encodes and multiplexes them and sends them to n destination terminals equipped with PLC interfaces, respectively. SIC is applied at the destination terminal to remove part of the inter-user interference by first decoding the stronger signal and treating other signals as interference until its own signal is decoded.
The above wireless and power line communication hybrid relay system model can be applied to scenarios such as power Internet of Things and smart grids, where terminals S and D refer to intelligent meters and sensors on factory equipment or independent. In order to solve problems such as the PLC not having mobile access, the penetration ability of high-frequency radio waves being limited, and the fading being large, the hybrid cooperation mode of wireless access and PLC relay can be adopted between the intelligent instrument or sensor (S) and the destination end (D) to achieve mobile access and long-distance communication, so as to ensure the coverage effect of indoor communication. At the same time, NOMA technology has the characteristic of high spectral efficiency, allowing large-scale terminal equipment access. The hybrid communication method of wireless and power line based on NOMA can improve the reliability and flexibility of communication in high load scenarios, which has important research value.

2.2. Signal Processing

This paper considers a hybrid relay system based on NOMA, assuming that multiple stations at the source end simultaneously send data to the relay node R. When the relay node R works in half-duplex mode, sending and receiving are completed in two orthogonal time slots, with no self-interference item, then the relay node R receives the following signals through the wireless interface:
y R = k = 1 n H SR k a k P S x k + n w ,
where P S is the total transmitted power of S, x k , k ( 1 , 2 , , n ) represents the data information of user D k , and a k represents the power distribution factor of user D k . Without loss of generality, let a 1 > a 2 > > a n and a 1 + a 2 + + a n = 1 . H S R k = h S R k / ( d S R k ) ν , k ( 1 , 2 , , n ) , d SR k represents the link distance between source node Sk and relay node R. ν is the path fading factor of the wireless channel, which is usually taken as 1.6 ~ 6 [16]. n w represents white gaussian noise satisfying the normal distribution N ( 0 , N w ) . h SR k represents the channel fading coefficient of the wireless channel S-R link.
Relay node R first decodes x1 using ideal SIC technology, and after successfully decoding and deleting it, R continues to decode x2 until all signals are decoded, then the signal-to-noise ratio (SNR) of the signal x 1 received by R to detect its own message is as follows [17]:
γ R , x k = a k Δ w d SR k 2 ν | h SR k | 2 i = k + 1 n a i Δ w d SR i 2 ν | h SR i | 2 + 1 , 1 k n 1 ,
where Δ w = P S / σ w 2 is the average signal-to-noise ratio of the wireless channel.
Assume that relay node R detects x n through the perfect SIC and its SNR is as follows:
γ R , x n = a n Δ w d SR n 2 ν | h SR n | 2
When signals are decoded, R re-encodes and multiplexes them, and transmits the multiplexed signal to the users through the PLC interface. The signal is as follows:
x R = k = 1 n a k P R x k ,
where P R represents the total transmitting power of relay node R.
Then the received signal at D j is as follows:
y D j = H RD j x R + n p , j ( 1 , 2 , , n ) ,
where H RD j = h RD j / ( d RD j ) α . d RD j represents the link distance between relay node R and user D j . α is the path fading factor of the power line channel, which usually takes the value 1.3 ~ 3.3 [18]. h RD j represents the channel fading coefficient of the power line channel. n p represents power line channel noise, which adopts Bernoulli–Gaussian model and consists of background noise and pulse noise. Its probability density function (PDF) has the following form [19]:
f ( n p ) = ( 1 p ) N ( 0 , N G ) + p N ( 0 , N G + N I ) ,
where N ( 0 , N G ) and N ( 0 , N G + N I ) represent normal distribution, respectively, p represents the probability of pulse noise occurrence, N G and N I represent the power of background noise and pulse noise, respectively, and the average total noise power is N p = N G + p N I . In order to simplify the model, let m = N G j / N I j , j ( 1 , 2 , , n ) represent the ratio of background noise and pulse noise.
On the destination terminal, each user applies SIC to remove some interference between users. Each user decodes strong signals first and regards other signals as interference until its own signal is decoded. When k < j , user j detects signal x k and deletes it successively from the received signal after decoding. For k > j , the signal x k will be treated as interference by the user k. Then, the SNR of x k is detected at D j as follows [17]:
γ ( D j , x k ) = a k Δ p l m d RD k 2 α | h RD k | 2 i = k + 1 n a i Δ p l m d RD i 2 α | h RD i | 2 + 1 , j k n 1 ,
where Δ p l m = P R / N m , m ( 0 , 1 ) is the average signal-to-noise ratio of the power line channel. N 0 = N G represents the noise power with only background noise, and N 1 = N G + N I represents the noise power when both background noise and pulse noise are present. h RD j represents the channel fading factor for each power line channel. d RD j indicates the link distance between the trunk node R and the use D j .
D n performs SIC to detect its information using the following SNR:
γ ( D n , x n ) = a n Δ p l m | h RD n | 2

3. Cross-Layer Performance Analysis of Two-Hop Relay System Based on NOMA

Previous research on the MAC layer of wireless or power line communication is often based on the ideal physical layer transmission, without considering the interruption caused by channel fading or noise, transmission failure is only caused by the conflict of the MAC layer. In this section, a dynamic relationship between the transmit power and the number of competing nodes is established for a wireless power line communication system, and the impact of physical layer outage on the overall performance of the MAC layer is studied. Considering the NOMA network with two users’ cooperation, the normalized throughput, packet loss rate, and delay of the cross-layer system between physical layer and MAC layer are analyzed and calculated. The algorithm process is shown in Algorithm 1.
Algorithm 1 Cross-layer performance analysis method combining physical layer and MAC layer
1:Step 1: The SNR γ R , x n , γ ( D n , x n ) of different links is calculated by Formulas (1) to (8)
2:Step 2: Calculate P out D 1 , P out D 2 and P out s y s by Formula (15) to Formula (21) by comparing the relationship between SNR and threshold
3:Step 3: Calculate n by Formulas (24) and (25), substitute the value of n into Formula (22) to solve the nonlinear equation and get τ and p
4:Step 4: Substitute the value of n, τ and p into Formula (22) to calculate P t r , P s , and P c
5:Step 5: Formulas (23) to (36) are used to calculate the relevant probabilities of system idle, successful transmission, collision and interruption and the time used in different cases.
6:Step 6: Substitute Formulas (37) to (39), and comprehensively consider the channel conditions of physical layer and the backoff process of MAC layer to calculate the system performance index S N O M A , p s y s , T N O M A ¯ .

3.1. Physical Layer Outage Probability

This paper considers that both wireless and power line channels are affected by multiplicative fading and additive noise. Wireless channel fading satisfies the Nakagami-m distribution, and power line channel involves LogN distribution fading and Bernoulli–Gaussian pulse noise.
Let h SR k represent the channel fading factor of the wireless channel, which satisfies the Nakagami distribution:
f h SR k ( x ) = 2 Γ ( m w k ) ( m w k Ω w k ) m w k x 2 m w k 1 e ( m w k x 2 Ω w k ) , k ( 1 , 2 ) ,
where m w k is the Nakagami distribution parameter, and m w k 0.5 ; Γ ( x ) is the gamma function; Ω w k represents the mean of the fading amplitude, that is, Ω w k = E ( | h SR k | 2 ) . In order to ensure that the fading does not change the average power of the received signal, the normalization is carried out and let Ω w k = 1 .
h SR k is known to obey the Nakagami distribution, then | h SR k | 2 satisfies the Gamma distribution G ( α w , β w ) , and according to the nature of the Gamma function, | h SR k | 2 ~ G ( m w k , Ω w k / m w k ) , then its PDF and cumulative distribution function (CDF) are shown as follows:
f | h SR k | 2 ( x ) = ( m w k Ω w k ) m w k x m w k 1 Γ ( m w k ) e m w k Ω w k x ,
F | h SR k | 2 ( x ) = 1 e ( m w k x Ω w k ) m = 0 m w k 1 ( ( m w k / Ω w k ) x ) m m ! .
Let h RD j represents the channel fading factor of the power line channel, satisfying the lognormal distribution:
f h RD j ( x ) = 1 2 π σ j x exp ( ( ln x μ j ) 2 2 σ j 2 ) , j ( 1 , 2 ) ,
where μ j and σ j are the mean and standard deviation of variables ln h R D j , respectively. Normalizing the fading energy, that is, E ( h RD j 2 ) = exp ( 2 μ RD j + 2 σ RD j 2 ) = 1 , yields μ RD j = σ RD j 2 .
By the nature of the logarithmic normal distribution, if x ~ log N ( μ , σ 2 ) , then x 2 ~ log N ( 2 μ , 4 σ 2 ) . So h RD j 2 ~ log N ( 2 μ j , 4 σ j 2 ) , its PDF and CDF are as follows:
f | h RD j | 2 ( x ) = 1 2 σ j 2 π · x e ( ln ( x ) 2 μ j ) 2 2 · 4 σ j 2 ,
F | h RD j | 2 ( x ) = Q ( 2 μ j ln ( x ) 4 σ j 2 ) .
The outage probability can be defined as the probability that the SNR falls below a certain threshold. For user D1, the outage occurs when either D1 or R fails to decode x 1 [6], then the outage probability of user D1 is expressed as follows:
P out D 1 = 1 P r ( γ R , x 1 > γ th 1 , γ D 1 , x 1 > γ th 1 )
where the expression of the correlation probability is as follows:
P r ( γ R , x 1 > γ th 1 ) = P r ( | h SR 1 | 2 > λ 1 Δ w d SR 1 2 ν ) = 1 F | h SR 1 | 2 ( λ 1 Δ w d SR 1 2 ν ) ,
P r ( γ D j , x 1 > γ th 1 ) = P r ( | h RD j | 2 > λ 1 Δ p l k d RD j 2 α ) = 1 F | h RD j | 2 ( λ 1 Δ p l k d RD j 2 α ) .
In the above equation, λ 1 = γ th 1 / ( a 1 a 2 γ th 1 ) . By substituting Formulas (11) and (14) into Formulas (16) and (17), respectively, the closed expression of outage probability of user D1 can be obtained.
For user D2, the outage occurs when either R or D2 fails to decode x 2 , then the outage probability of user D2 is expressed as
P out D 2 = 1 P r ( γ R , x 1 > γ th 1 , γ R , x 2 > γ th 2 , γ D 2 , x 1 > γ th 1 , γ D 2 , x 2 > γ th 2 ) ,
where the expression of the correlation probability is as follows:
P r ( γ R , x 2 > γ th 2 ) = P r ( | h SR 2 | 2 > λ 2 Δ w d SR 2 2 ν ) = 1 F | h SR 2 | 2 ( λ 2 Δ w d SR 2 2 ν ) ,
P r ( γ D 2 , x 2 > γ th 2 ) = P r ( | h RD 2 | 2 > λ 2 Δ p l k d RD 2 2 α ) = 1 F | h RD 2 | 2 ( λ 2 Δ p l k d RD 2 2 α ) .
In the above equation, λ 2 = γ t h 2 / a 2 . By substituting Formulas (11) and (14) into Formulas (19) and (20), the closed expression of outage probability of user D2 can be obtained.
When either R or D2 fails to detect both signals x 1 and x 2 , or D1 fails to detect x 1 , the system will be interrupted. Then the system outage probability is expressed as
P out s y s = 1 P r ( γ R , x 1 > γ th 1 , γ R , x 2 > γ th 2 , γ D 2 , x 1 > γ th 1 , γ D 2 , x 2 > γ th 2 , γ D 1 , x 1 > γ th 1 )

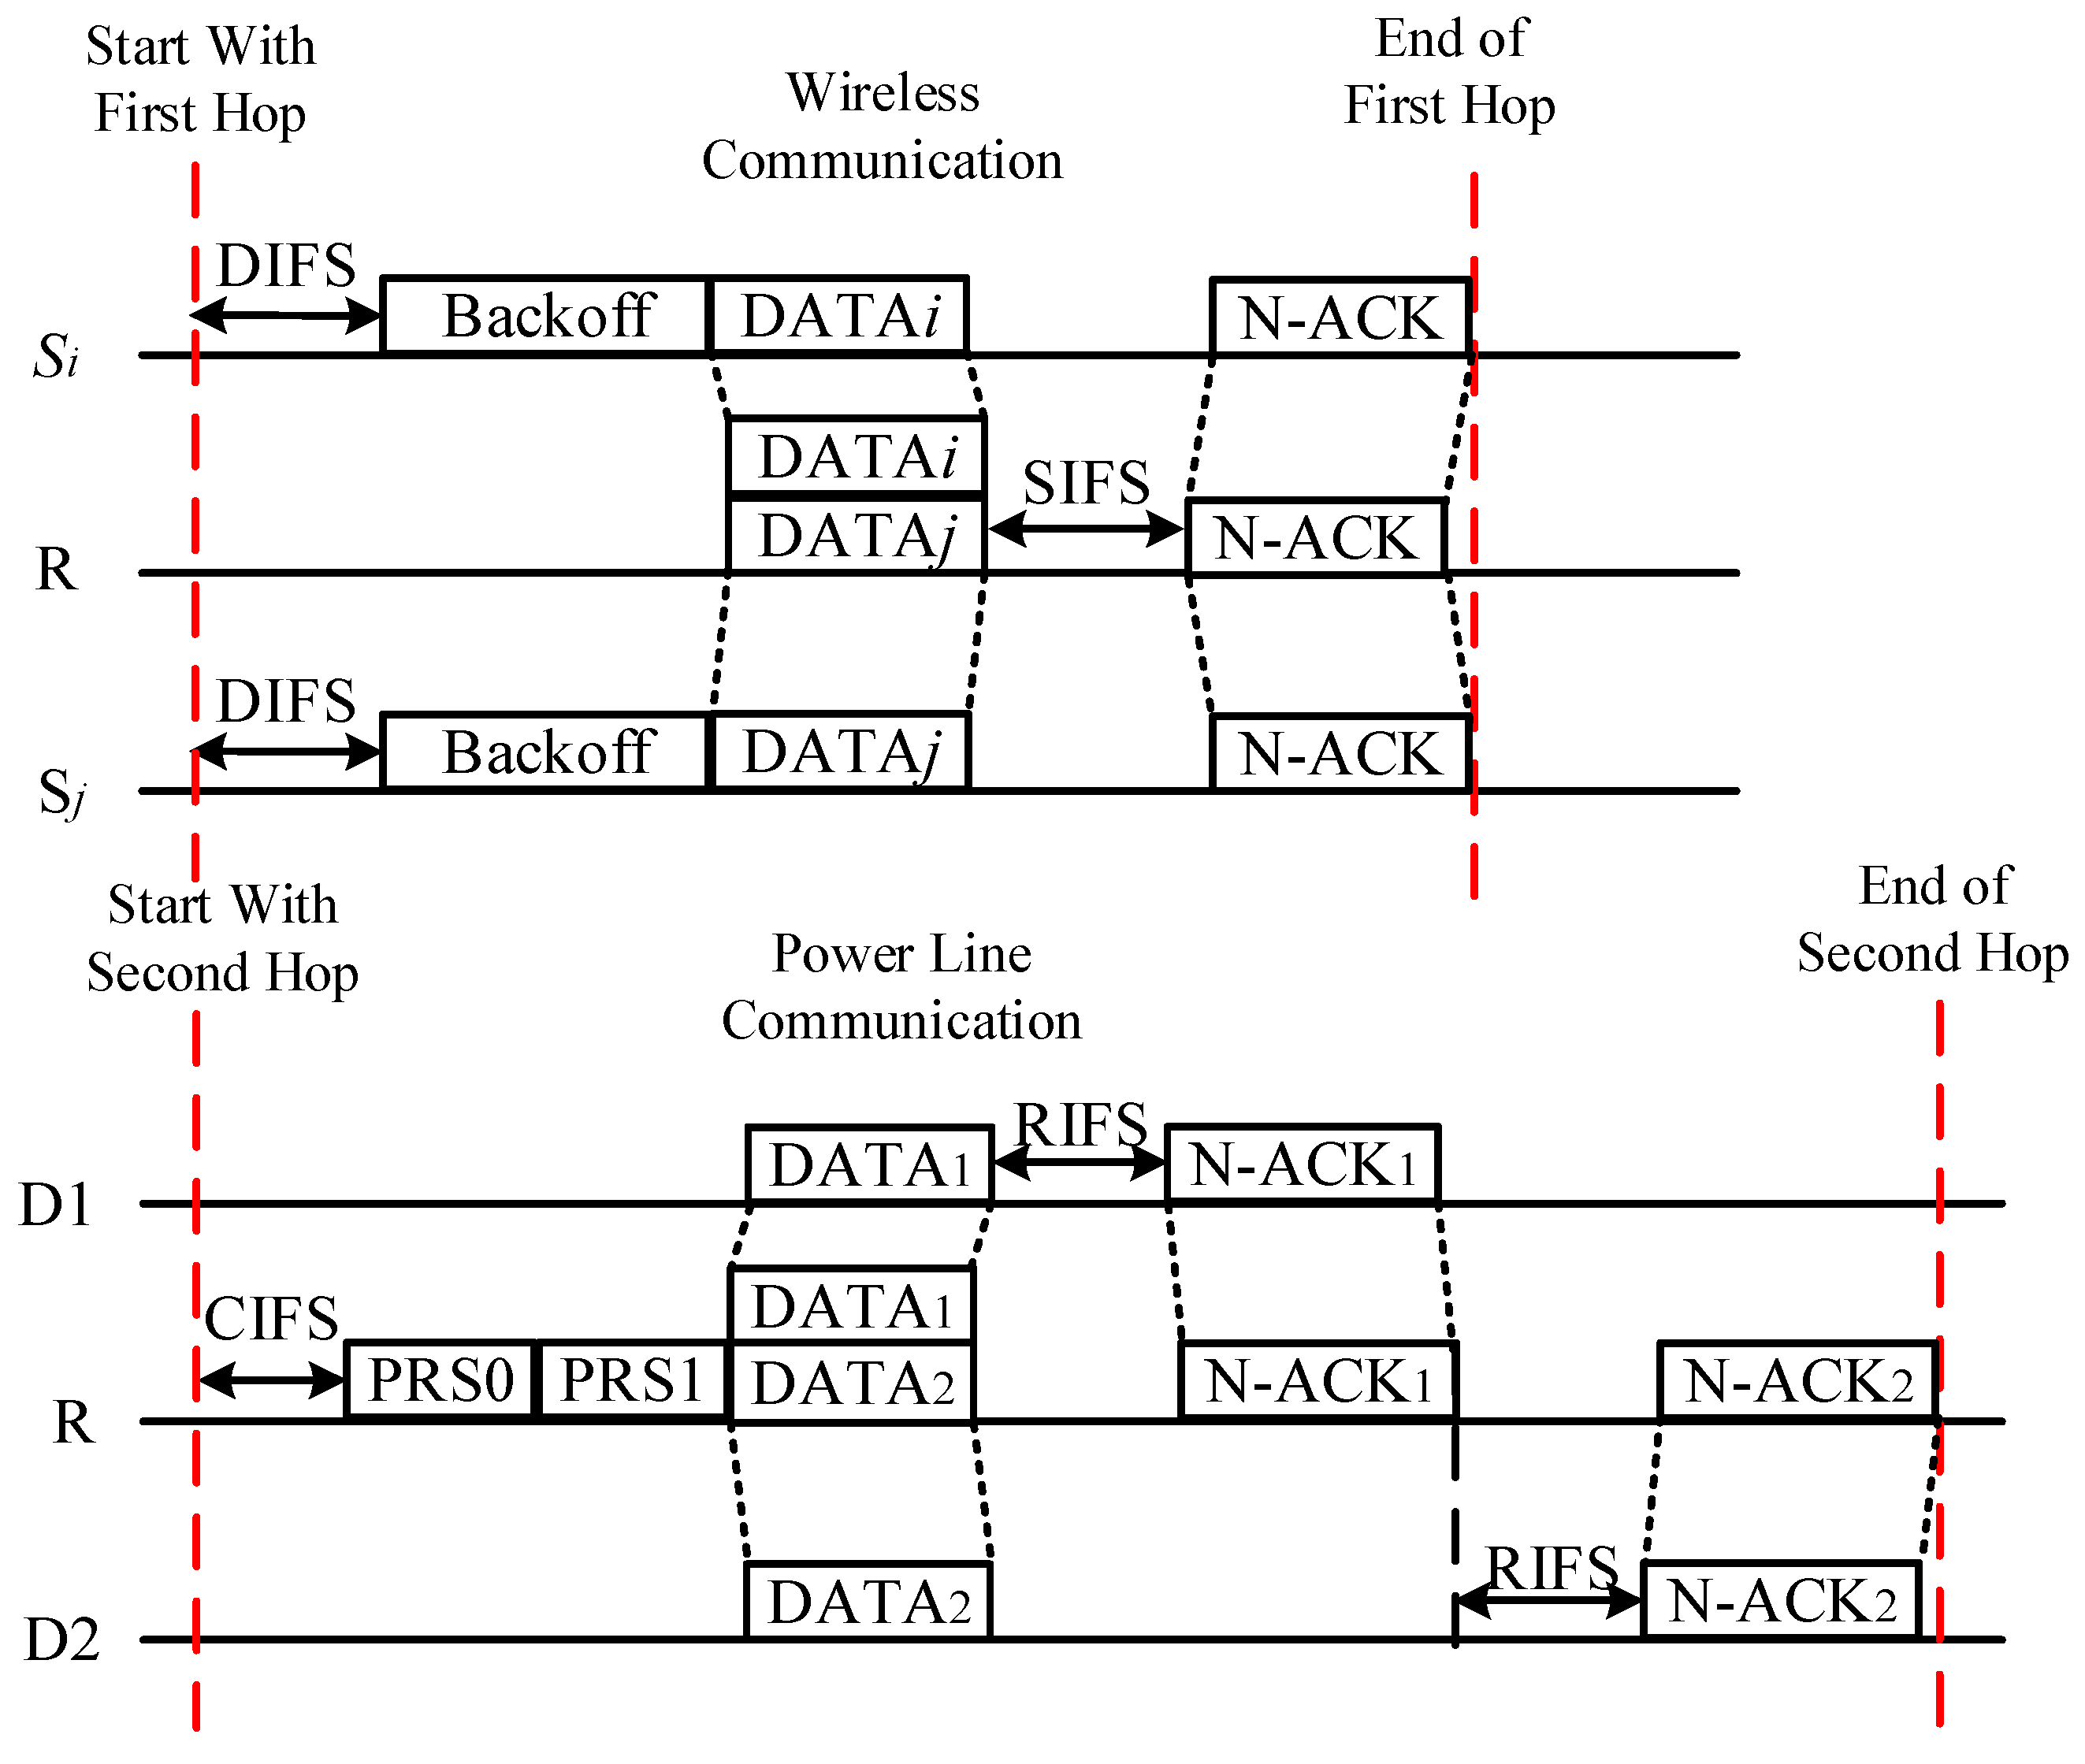
3.2. Two-Hop Transport Protocol Design Based on NOMA

The two-hop random access scheme in this paper is based on the CSMA protocol of IEEE 802.11 and IEEE 1901 standards. Only when the packet of the first hop is successfully transmitted to the R terminal, the transmission process of the second hop will occur. Considering the method of using a predetermined power level [20], NOMA does not require complete channel state information, but only receives signal strength information [21]. R periodically sends a beacon signal to the source site for synchronous transmission. When the coherence time with time-sharing duplex mode is long enough—that is, the channel gain remains constant within the frame—each station can use the beacon signal as a pilot signal to estimate its channel coefficient before the start of the frame based on channel reciprocity [20], thus selecting the transmit power itself.
Figure 2 shows the time slot diagram of the two-hop transmission scheme based on NOMA. In this scheme, NOMA Clear Send (N-CTS) and NOMA acknowledgement frame (N-ACK) are defined, both of which add a receiver address field [21]. The station of source S uses CSMA contention strategy, and the station that successfully competes obtains channel occupancy sends a data packet to R with different power levels. After receiving the data packet, R sends N-ACK to the source station for confirmation and transmits it to the two destinations through the power line channel after ideal SIC decoding. After SIC decoding at the destination end, R is answered with N-ACK1 and N-ACK2, respectively, to achieve acknowledgement. By introducing NOMA into the CSMA protocol, the system can simultaneously transmit two data packets without contention for the channel for each data packet, avoiding frequent collisions between stations, thereby improving the throughput and reliability of the system, reducing the delay, and saving a lot of transmission-signaling overhead. The proposed scheme can meet the reliable and stable transmission requirements of multiple users under high load.

3.3. Cross-Layer Performance Analysis

For the wireless channels, C W min is the minimum competition window value, τ is the transmission probability, p is the packet loss probability, m is the number of retreat stages, and N is the number of competing stations. Where τ and p form a closed expression, which can be obtained by solving nonlinear equations [22], then
{ τ = 2 ( 1 2 p ) ( 1 2 p ) ( C W min + 1 ) + p C W min [ 1 ( 2 p ) m ] p = 1 ( 1 τ ) n 1 ( n 1 ) τ ( 1 τ ) n 2 .
The successful transmission of data packets is divided into OMA transmission and NOMA transmission. P s OMA is the probability that only one station competes to the channel, and P s N O M A is the probability that two stations compete to the channel at the same time. Then, the probability of successful transmission P s , the probability of transmission with at least one site P t r , and the probability of collision during transmission P c are as follows:
{ P t r = 1 ( 1 τ ) n , P s O M A = n τ ( 1 τ ) n 1 P t r , P s N O M A = n ( n 1 ) τ 2 ( 1 τ ) n 2 2 P t r , P s = P s O M A + P s N O M A , P c = P t r ( 1 P s ) .
At the MAC layer, the dynamic relationship between transmit power and the number of competing stations is considered [23]. Assume that the minimum received signal power at which a listening station can detect a packet is Pth. Then, the reserved radius of the channel is
d resv = ( P S P th ) 1 α
Other stations within a radius around the receiving station compete with the source for channel access. Assuming that other stations are distributed in density a, x means to round up x, then the average number of competing stations n of the source station is
n - 1 = ρ π d resv 2 = ρ π ( P S P th ) 2 α .
Therefore, the number of competing stations increases as the transmitting power increases.
The total idle time of the system channel T e ¯ is
T e ¯ = ( 1 P t r ) σ w .
The total time of packet collision T c ¯ is
T c ¯ = P t r ( 1 P s ) T c .
where T c = T H + T D + T DIFS + δ is the duration of the conflict. σ w is the duration of the free slot.
The probability P s O M A of successful transmission by OMA, the probability P s D 1 of successful transmission by NOMA but only user D 1 receiving the data packet, and the probability P s D 1 , D 2 of successful transmission by NOMA and both user D 1 and user D 2 receiving the data packet is as follows:
{ P s O M A = P t r · P s O M A ( 1 P out O M A ) , P s D 1 = P t r · P s N O M A · P r ( γ R , x 1 > γ th 1 , γ D 1 , x 1 > γ th 1 )                 × ( 1 P t r ( γ R , x 2 > γ th 2 , γ D 2 , x 1 > γ th 1 , γ D 2 , x 2 > γ th 2 ) ) P s D 1 , D 2 = P t r · P s N O M A · P r ( γ R , x 1 > γ th 1 , γ R , x 2 > γ th 2 )                 × P r ( γ D 2 , x 1 > γ th 1 , γ D 2 , x 2 > γ th 2 , γ D 1 , x 1 > γ th 1 ) , ,
where P s O M A represents the probability that the packet was successfully transmitted without interruption of each hop transmission link, and P s D 1 represents the probability that the link between the signal and the user D 2 is interrupted, so only the user D 1 successfully receives the packet. P s D 1 , D 2 represents the probability that both user D 1 and user D 2 receiving the data packet without being interrupted.
Then, the duration of successful packet transmission T s ¯ is
T s ¯ = P s O M A · T s O M A + P s D 1 · T s D 1 + P s D 1 , D 2 · T s D 1 , D 2 .
The duration T s k O M A for successful OMA transmission in the k-th hop, the duration T s k D 1 for NOMA transmission in the k-th hop but only user D 1 successfully receives the data packet, and the duration T s k D 1 , D 2 for NOMA transmission in the k-th hop and both users D 1 and D 1 successfully receive the data packet are shown below:
{ T s 1 O M A = T s 1 D 1 = T s 1 D 1 , D 2 = T H + T D + T ACK w + T SIFS + T DIFS + 2 δ , T s 2 O M A = 2 T PRS + T P + T D + T RIFS + T CIFS + T ACK pl , T s 2 D 1 , D 2 = 2 T PRS + T P + T D + 2 T RIFS + T CIFS + 2 T ACK pl , T s 2 D 1 = 2 T PRS + T P + T D + 2 T RIFS + T CIFS + T ACK pl + T AT pl .
The total duration of successful system transmission in the above cases is as follows:
T s O M A = T s 1 O M A + T s 2 O M A ,
T s D 1 , D 2 = T s 1 D 1 , D 2 + T s 2 D 1 , D 2 ,
T s D 1 = T s 1 D 1 + T s 2 D 1 .
The probability P o 1 O M A of outage in the first hop wireless transmission when the system adopts OMA transmission, the probability P o 2 O M A of outage in the second hop power line transmission when the first hop wireless transmission succeeds, the probability P o 1 N O M A of outage in the first hop wireless transmission when the system adopts NOMA transmission, and the probability P o 2 N O M A of outage in the second hop power line transmission when the first hop wireless transmission succeeds are as follows:
{ P o 1 O M A = P t r · P s O M A · P out SR , P o 2 O M A = P t r · P s O M A ( 1 P out SR ) P out RD , P o 1 N O M A = P t r · P s N O M A ( 1 P r ( γ R , x 1 > γ th 1 , γ R , x 2 > γ th 2 ) ) , P o 2 N O M A = P t r · P s N O M A · P r ( γ R , x 1 > γ th 1 , γ R , x 2 > γ th 2 )                       × ( 1 P r ( γ D 2 , x 1 > γ th 1 , γ D 2 , x 2 > γ th 2 , γ D 1 , x 1 > γ th 1 ) ) .
The total time T o ¯ of transmission failure due to channel outage is
T o ¯ = P o 1 O M A · T o 1 O M A + P o 2 O M A ( T s 1 O M A + T o 2 O M A ) + P o 1 N O M A · T o 1 N O M A               + P o 2 N O M A ( T s 1 N O M A + T o 2 N O M A ) .
The duration of outage T o k O M A and T o k NOMA for the k-th hop using OMA and NOMA are as follows:
{ T o 1 O M A = T o 1 N O M A = T H + T D + T AT w + T SIFS + T DIFS + 2 δ , T o 2 O M A = 2 T PRS + T P + T D + 2 T RIFS + T CIFS + T AT pl , T o 2 N O M A = 2 T PRS + T P + T D + 2 T RIFS + T CIFS + 2 T AT pl .
The system throughput expression is as follows:
S N O M A = P s O M A · T D + P s D 1 · T D + P s D 1 , D 2 · 2 T D T e ¯ + T c ¯ + T s ¯ + T o ¯ .
The packet loss probability p s y s of the system consists of two parts: transmission failure due to collision during packet competition and transmission failure due to channel interruption. The expression is as follows:
p s y s = 1 ( 1 p ) ( 1 P out N O M A ) .
The average delay T N O M A ¯ required for successful two-hop transmission of packets in NOMA scheme is shown as follows, including the average backoff delay experienced by stations before sending packets, the time when packets collide during two-hop transmission, and the cost of other time intervals:
T N O M A ¯ = Ε [ X ] Ε [ s l o t ] + 1 P s N O M A P s N O M A T c N O M A + T s N O M A ,
where Ε [ X ] is the average time slot number of the retreat process taken by the node to successfully transmit the data packet, and Ε [ s l o t 1 ] represents the average time length of the BC retreat time slot of the first hop wireless and the second hop power line. The expression is as follows:
Ε [ X ] = ( 1 2 p ) ( C W min + 1 ) + p · C W min [ 1 ( 2 p ) m ] 2 ( 1 2 p ) ( 1 p ) ,
Ε [ s l o t ] = ( 1 P t r ) σ + P t r ( 1 P s ) T c + P o 1 O M A · T o 1 O M A + P o 2 O M A ( T s 1 O M A + T o 2 O A M )                       + P o 1 N O M A · T o 1 N O M A + P o 2 N O M A ( T s 1 N O M A + T o 2 N O A M )                       + P s O M A · T s O M A + P s D 1 · T s D 1 + P s D 1 , D 2 · T s D 1 , D 2 .

4. Simulation Results and Analysis

4.1. Simulation Parameter Settings

In this paper, an extensive Monte Carlo simulation is carried out to verify the accuracy of the theoretical formula, and the performance of the system using NOMA, OMA, wireless single-hop, and other transmission schemes under different parameters is compared and analyzed. Without loss of generality, the following default Settings are adopted for simulation parameters in this section unless otherwise specified [18,24]: for the physical layer, the link distance of each hop is normalized—let d SR = d RD = 1 —and the fading factors of wireless and power line channel path are ν = 2 , α = 1.5 ; let the average SNR of the wireless and power line channels be: Bernoulli–Gaussian pulse noise parameters are p = 0.1 , k = 0.02 , and wireless channel noise power is N w = 0.1   W ; the channel interrupt threshold is γ th = 0.1 ; for the MAC layer, m = 4 , C W = [ 16 , 32 , 64 , 128 ] , C W min = 16 ; the frame duration is T D = 5000   μ s . In addition, it is assumed that all packets use the same physical rate and adopt the standard prescribed time slot duration and timing parameters. The fixed general parameter settings [14,15,25,26] of the various overhead introduced by the MAC layer due to priority recognition, leading codes, acknowledgements, and interframe space are shown in Table 2 and Table 3.

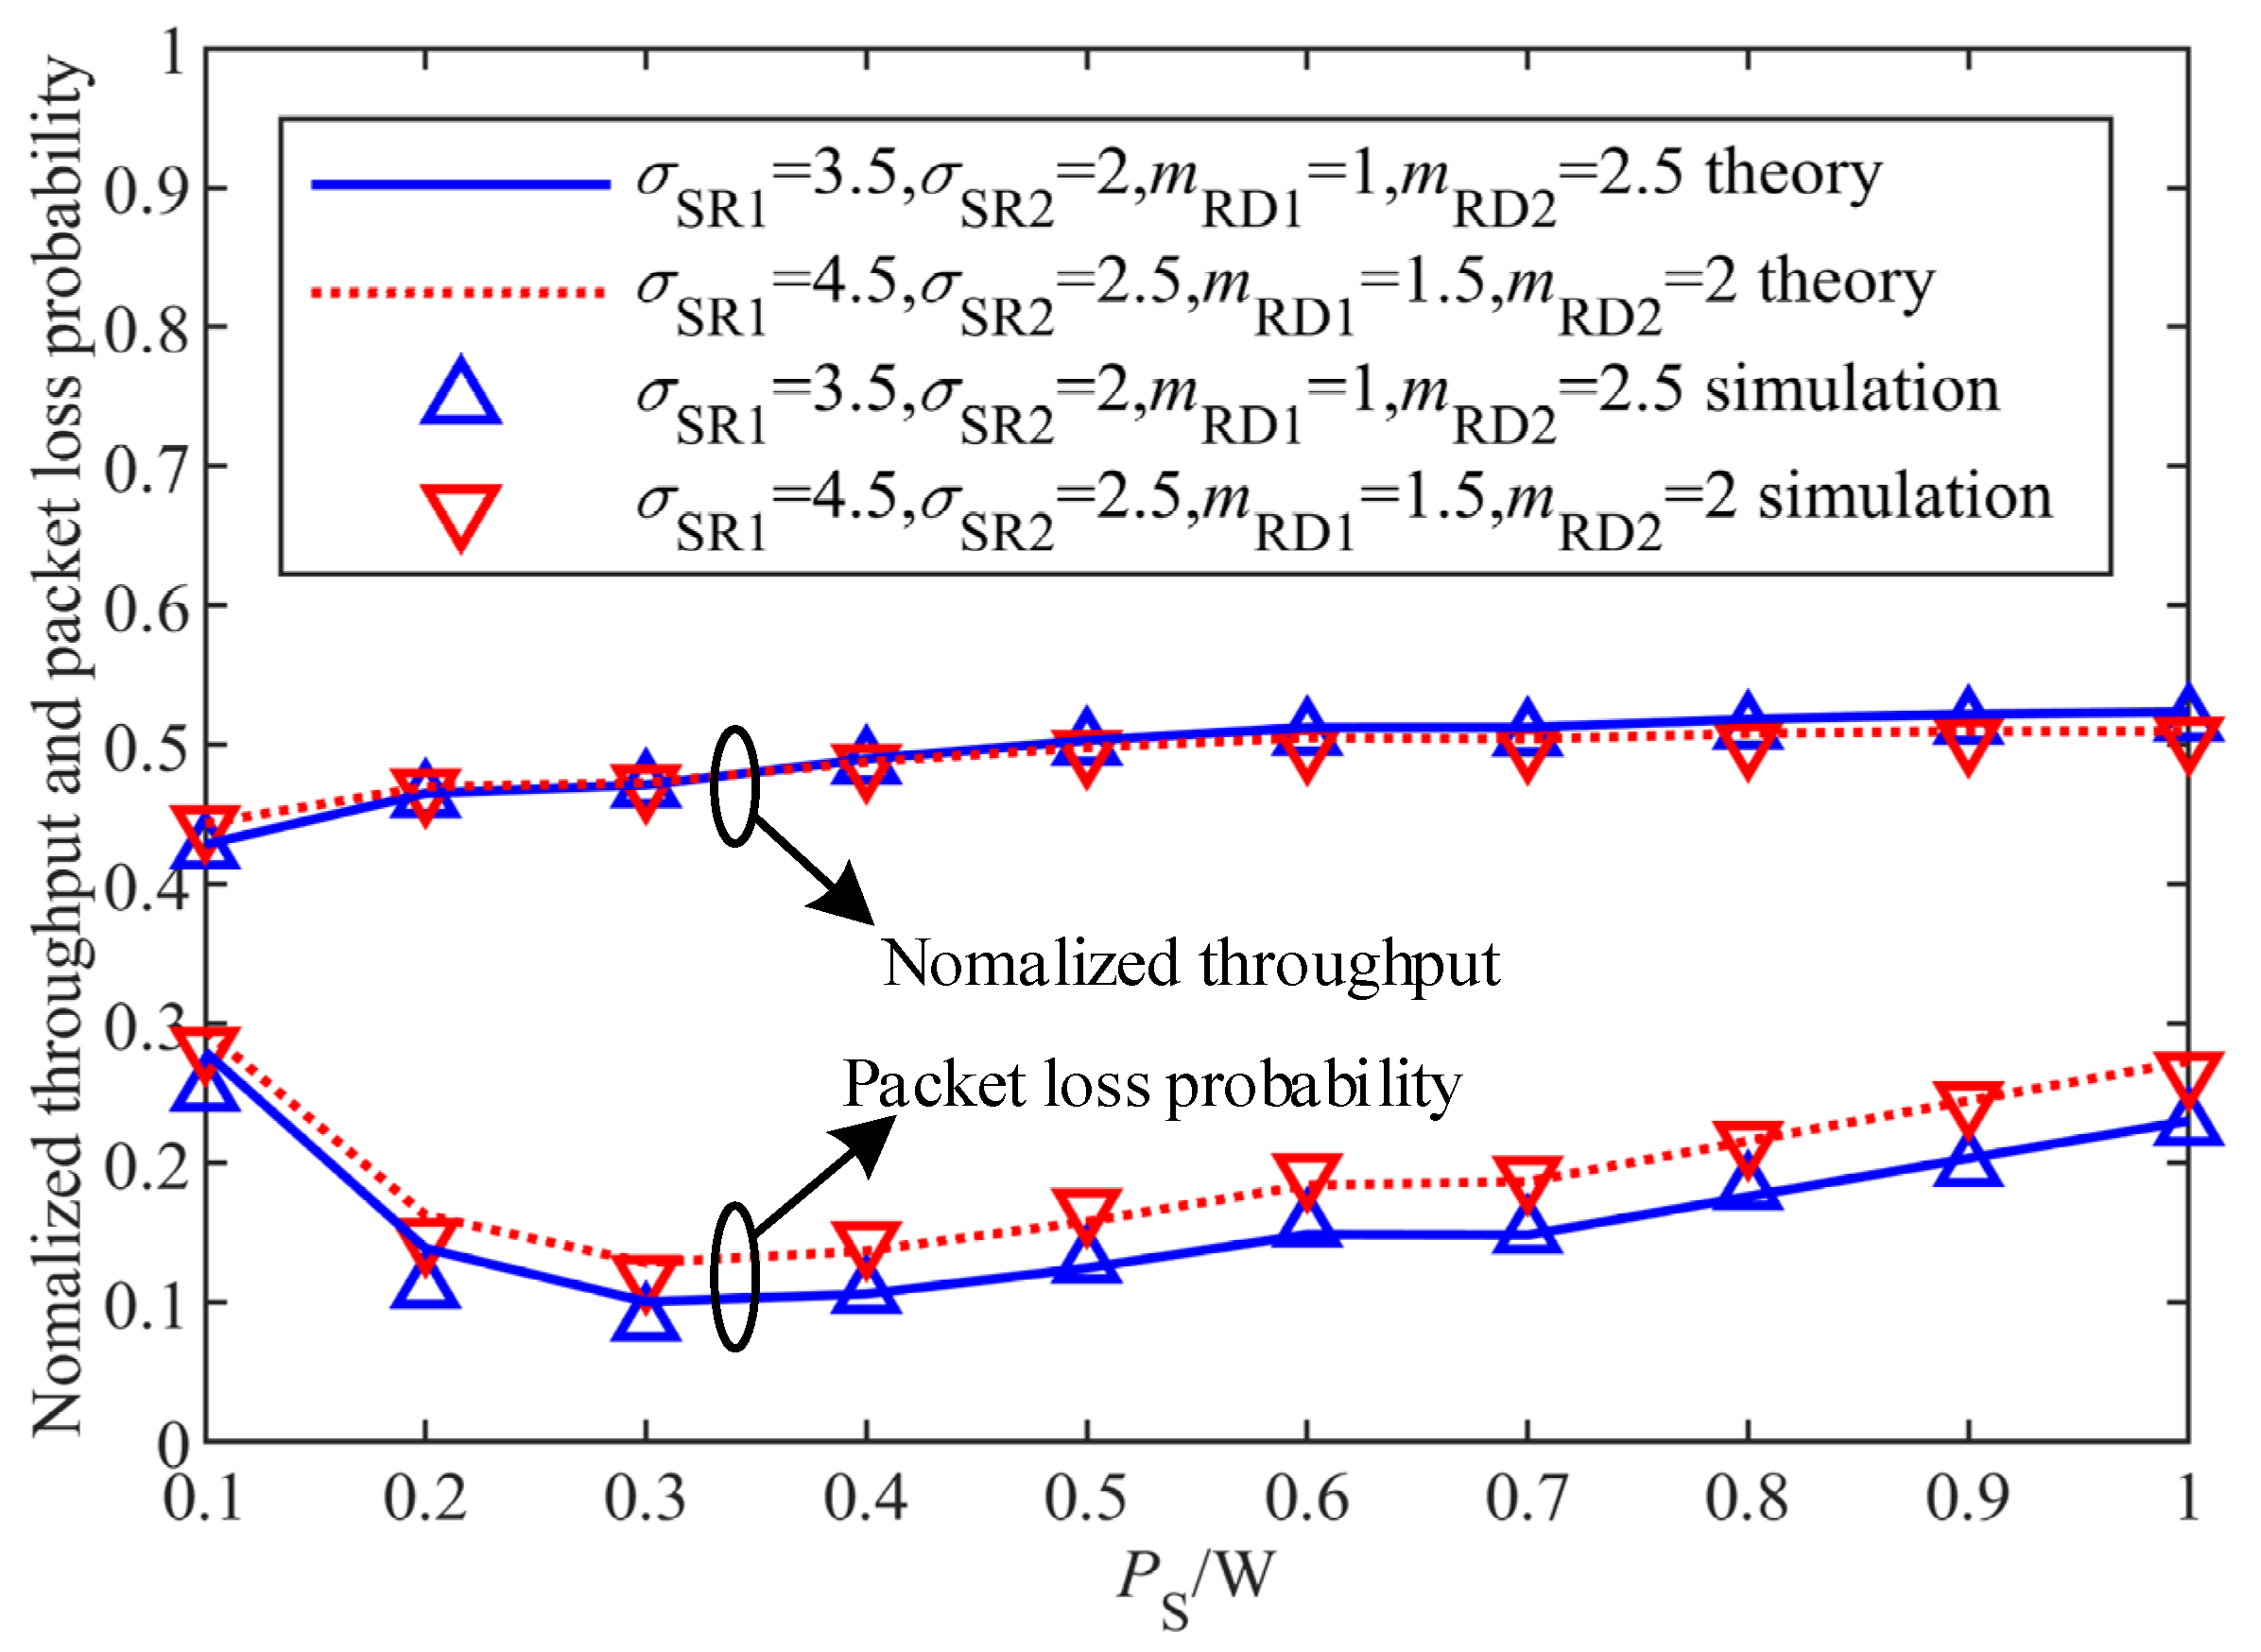
4.2. Simulation Results and Analysis

Let P t h = 4 × 10 10 , ρ = 10 9 . Figure 3 compares the normalized throughput and packet loss performance of the system using NOMA transmission scheme under different channel parameters. It can be seen from the figure that under different channel fading conditions, the theoretical calculation is consistent with the simulation results, which verifies the accuracy of the theoretical cross-layer model and performance formula. With the increase of the total transmitting power of S-end, the normalized throughput of the system increases first and then decreases, and the packet loss decreases first and then increases. This is because for the cross-layer algorithm in this paper, the increase of transmitting power will reduce the outage probability of the physical layer and improve the reliability of the physical layer. On the other hand, the number of competing stations in the MAC layer will increase, and the probability of packet collision will increase. With the increase of transmitting power, the physical layer of the system receives a significant beneficial effect, which leads to the increase of system throughput and the decrease of the packet loss rate. However, when the transmitting power continues to increase, the MAC layer gradually becomes the dominant factor, and the significant increase of the number of competing stations leads to the decrease of system performance. The cross-layer algorithm in this paper analyzes the relationship between transmitting power and performance index more comprehensively and accurately, and then selects the optimal transmit power according to the channel quality, which can achieve the best performance of the system.
Figure 4 and Figure 5 show the comparison of normalized throughput and packet loss probability of the system using two-hop NOMA, two-hop OMA, and single-hop transmission schemes under different channel average signal-to-noise ratios for wireless and power line channel fading coefficients m R D 1 = 1 , m R D 2 = 2.5 , σ R D 1 = 3.5 , σ R D 2 = 2 . As can be seen from the figure, with the increase of channel average signal-to-noise ratio S N R —that is, the wireless and power line channel conditions become better—the system throughput of different transmission schemes increases, the packet loss probability decreases, and the system performance improves. By comparing the system performance of different schemes, it can be found that the two-hop NOMA scheme has the highest throughput and the lowest packet loss probability, and the performance of this scheme decreases more slowly with the change of transmitting power. This is because there is serious large-scale and small-scale fading in the wireless environment. Compared with single-hop, the two-hop NOMA scheme reduces the outage probability of physical layer by introducing relay nodes and improves the reliability of physical layer packet transmission. At the same time, NOMA allows multiple users to share a given channel resource at the same time, which reduces the probability of collision caused by the simultaneous transmission of data packets by the stations. Therefore, the scheme has optimal performance, which can reduce the collision and congestion in the environment of high number of stations, and improve the stability and reliability of communication.
Figure 6 shows the delay performance comparison of different schemes under different channel average SNRs. As can be seen from the figure, the two-hop NOMA scheme has better delay performance, because NOMA reduces the collision probability of packets, thus shortening the average time required for the node retreat process. The curve is not smooth because the number of competing stations in Formula (25) needs to be an integer based on the function corresponding to the transmitting power. In addition, compared with S N R = 5 dB , the delay performance of S N R = 8 dB is slightly improved. This is because increasing the average signal-to-noise ratio will improve the communication reliability at the physical layer, thus improving the channel utilization efficiency at the MAC layer. However, the delay performance of the system is not significantly affected by the parameters at the physical layer, and its performance is mainly affected by the number of stations at the MAC layer.

5. Power optimal Allocation Algorithm

Based on NOMA two-hop hybrid communication, the optimal power distribution problem of combined system normalized throughput and packet loss probability can be described by the following mathematical model:
{ max G ( P S , P R , a 1 , a 2 ) = β 1 · S ( P S , P R , a 1 , a 2 ) β 2 · γ ( P S , P R , a 1 , a 2 )               C 1 : P S + P R = 2               C 2 : P S 0               C 3 : P R 0               C 4 : a 1 + a 2 = 1               C 5 : 0.5 a 1 1               C 6 : Formula   ( 22 )               C 7 : Formula   ( 15 ) - Formula   ( 21 )               C 8 : Formula   ( 24 ) - Formula   ( 25 )
where S ( P S , P R , a 1 , a 2 ) and γ ( P S , P R , a 1 , a 2 ) are the normalized throughput and packet loss rate of the system, respectively. β 1 and β 2 represent the weight of indicators, which can be flexibly set according to the needs of different service indicators. Without loss of generality, this paper lets β 1 = β 2 = 0.5 ; P S represents the total transmitting power of the source S, and P R represents the total transmitting power of the relay R. a j , j ( 1 , 2 ) indicates the power allocation factor of user D j . Without loss of generality, it may be assumed that a 1 > a 2 , and thus a 1 + a 2 = 1 . C6 ensures that MAC layer nonlinear equations are solved; C7 ensures that physical layer solution is met; C8 ensures that the number of competing stations and transmitting power meet a certain relationship.
Figure 7 shows the three-dimensional curve of optimization target G ( P S , P R , a 1 , a 2 ) changing with transmitting power P S and power distribution factor d of user D 1 . It can be seen from the figure that under different combinations of P S and a 1 parameters, the system optimization objective G ( P S , P R , a 1 , a 2 ) has a unique extreme point in the interval, indicating that the optimization objective function with P S and a 1 as variables is continuously derivable and there is a global optimal solution.
The above optimization problem is a mixed-integer nonlinear solving problem due to the corresponding relationship between the transmitting power and the number of competing stations in the listening range, and the nonlinear equations need to be solved during the solving process. In order to simplify the solution complexity and ensure the accuracy, this paper uses genetic algorithm and other methods to determine the optimal transmission power PS and power distribution factor a1 with accuracy of 0.01 and verifies it using an exhaustive method.
Figure 8 and Figure 9, respectively, show the comparison of optimization objective and delay of different algorithms with the change of SNR. It can be seen from the figure that under different SNRs and channel fading coefficient conditions, the optimal power allocation algorithm has better performance than the average power allocation system. This is because the optimal power allocation algorithm in this paper establishes the dynamic relationship between the transmitting power and the number of competing stations, comprehensively considers the influence of non-ideal channel transmission at the physical layer and competitive access at the MAC layer on system performance, and optimizes the total transmit power at the source end and the power allocated to different users, so that the system has better performance in terms of normalized throughput, packet loss rate, and delay. At the same time, it can adapt to the change of channel conditions.

6. Conclusions

In this paper, the physical layer and MAC layer of a wireless and power line communication hybrid relay system based on NOMA are studied comprehensively. By determining the optimal power allocation factor, the comprehensive performance of the combined normalized throughput and packet loss probability is optimized. Simulation results show that the cross-layer algorithm in this paper can achieve the best system performance by analyzing the relationship between transmitting power and performance index more comprehensively and accurately, so as to select the optimal total transmitting power at the source end and the power allocated to different users according to channel quality. The relevant conclusions can provide necessary theoretical support for the application of wireless and power line hybrid relay communication technology. However, the stations at the source of this paper compete based on the CSMA access scheme, and users use random user pairing when sending data, so the fairness and reliability of the system need to be further improved. In the future, we can continue to study the protocol improvement of the MAC layer and user pairing problems based on NOMA technology, so as to improve the transmission reliability and user fairness of the physical layer and further improve the overall performance of the system.

Author Contributions

Conceptualization, Z.C.; formal analysis, T.C.; methodology, Z.C.; software, P.W.; validation, P.W.; writing—original draft, T.C.; writing—review & editing, J.F. All authors have read and agreed to the published version of the manuscript.

Funding

This research was funded by the National Natural Science Foundation of China Youth Fund Project, grant number 61601182, and the Central University Research Fund Project, grant number 2023MS113.

Institutional Review Board Statement

Not applicable.

Informed Consent Statement

Not applicable.

Data Availability Statement

The data that support the findings of this study are available from the corresponding author upon reasonable request.

Conflicts of Interest

The authors declare no conflicts of interest.

References

  1. Orlando, M.; Estebsari, A.; Pons, E.; Pau, M.; Quer, S.; Poncino, M.; Bottaccioli, L.; Patti, E. A smart meter infrastructure for smart grid IoT applications. IEEE Internet Things J. 2021, 9, 12529–12541. [Google Scholar] [CrossRef]
  2. De Mba Dib, L.; Fernandes, V.; Filomeno, M.L.; Ribeiro, M.V. Hybrid PLC/wireless communication for smart grids and internet of things applications. IEEE Internet Things J. 2017, 5, 655–667. [Google Scholar]
  3. Chen, Z.X.; Zhang, Z.K.; Cao, T.S.; Zhenyu, Z. PLC for In-Vehicle Network: A DRL-Based Algorithm of Diversity Combination of OFDM Subcarriers. Chin. J. Electron. 2023, 32, 1245–1257. [Google Scholar]
  4. Wei, X.; Al-Obiedollah, H.; Cumanan, K.; Ding, Z.; Dobre, O.A. Energy efficiency maximization for hybrid TDMA-NOMA system with opportunistic time assignment. IEEE Trans. Veh. Technol. 2022, 71, 8561–8573. [Google Scholar] [CrossRef]
  5. Pu, H.H.; Liu, X.S.; Han, M.; Xv, D.G. Distributed opportunity Relay Selection for Cooperative non-orthogonal multiple access systems in Power line communication channels. Trans. China Electrotech. Soc. 2020, 35, 2306–2318. (In Chinese) [Google Scholar]
  6. Samir, A.; Elsayed, M.; El-Banna, A.A.A.; Wu, K.; ElHalawany, B.M. Performance of noma-based dual-hop hybrid powerline-wireless communication systems. IEEE Trans. Veh. Technol. 2022, 71, 6548–6558. [Google Scholar] [CrossRef]
  7. Liau, Q.Y.; Leow, C.Y. Successive user relaying in cooperative NOMA system. IEEE Wirel. Commun. Lett. 2019, 8, 921–924. [Google Scholar] [CrossRef]
  8. Ding, H.; Leung, K.C. Cross-Layer Resource Allocation in HetNet NOMA Systems with Dynamic Traffic Arrivals. IEEE Trans. Commun. 2023, 71, 1403–1415. [Google Scholar] [CrossRef]
  9. Tang, J.; Zhao, Y.; Feng, W.; Zhao, X.; Zhang, X.Y.; Liu, M.; Wong, K.-K. Cross-Layer Optimization for Industrial Internet of Things in NOMA-Based C-RANs. IEEE Internet Things J. 2021, 9, 16962–16975. [Google Scholar] [CrossRef]
  10. Liu, Y.; Chen, W.; Lee, J. Joint queue-aware and channel-aware scheduling for non-orthogonal multiple access. IEEE Trans. Wirel. Commun. 2021, 21, 264–279. [Google Scholar] [CrossRef]
  11. Lu, H.; Jiang, X.; Chen, C.W. Distortion-aware cross-layer power allocation for video transmission over multi-user NOMA systems. IEEE Trans. Wirel. Commun. 2020, 20, 1076–1092. [Google Scholar] [CrossRef]
  12. Zhao, X.; Chen, W. Non-orthogonal multiple access for delay-sensitive communications: A cross-layer approach. IEEE Trans. Commun. 2019, 67, 5053–5068. [Google Scholar] [CrossRef]
  13. Yin, Y.; Liu, M.; Gui, G.; Gacanin, H.; Sari, H.; Adachi, F. Cross-layer resource allocation for UAV-assisted wireless caching networks with NOMA. IEEE Trans. Veh. Technol. 2021, 70, 3428–3438. [Google Scholar] [CrossRef]
  14. Bianchi, G. Performance analysis of the IEEE 802.11 distributed coordination function. IEEE J. Sel. Areas Commun. 2000, 18, 535–547. [Google Scholar] [CrossRef]
  15. Hao, S.; Zhang, H. Theoretical modeling for performance analysis of IEEE 1901 power-line communication networks in the multi-hop environment. J. Supercomput. 2020, 76, 2715–2747. [Google Scholar] [CrossRef]
  16. Safari, M.; Uysal, M. Cooperative diversity over log-normal fading channels: Performance analysis and optimization. IEEE Trans. Wirel. Commun. 2008, 7, 1963–1972. [Google Scholar] [CrossRef]
  17. Rahdari, F.; Khayyambashi, M.R.; Movahhedinia, N. QoE-aware NOMA user grouping in 5G mobile communications using a multi-stage interval type-2 fuzzy set model. Ad Hoc Netw. 2023, 149, 103227. [Google Scholar] [CrossRef]
  18. Dubey, A.; Mallik, R.K.; Schober, R. Performance analysis of a multi-hop power line communication system over log-normal fading in presence of impulsive noise. IET Commun. 2015, 9, 1–9. [Google Scholar] [CrossRef]
  19. Di Bert, L.; Caldera, P.; Schwingshackl, D.; Tonello, A.M. On noise modeling for power line communications. In Proceedings of the 2011 IEEE International Symposium on Power Line Communications and Its Applications, Udine, Italy, 3–6 April 2011; pp. 283–288. [Google Scholar]
  20. Choi, J. Re-transmission diversity multiple access based on SIC and HARQ-IR. IEEE Trans. Commun. 2016, 64, 4695–4705. [Google Scholar] [CrossRef]
  21. Kwon, Y.; Baek, H.; Lim, J. Uplink NOMA using power allocation for UAV-aided CSMA/CA networks. IEEE Syst. J. 2020, 15, 2378–2381. [Google Scholar] [CrossRef]
  22. Bianchi, G. IEEE 802.11-saturation throughput analysis. IEEE Commun. Lett. 1998, 2, 318–320. [Google Scholar] [CrossRef]
  23. Kim, S.; Stark, W. Cross-layer analysis of energy–throughput tradeoff for relay networks. IEEE Trans. Wirel. Commun. 2014, 13, 6716–6726. [Google Scholar] [CrossRef]
  24. Chen, Z.X.; Han, D.S.; Qiu, L.J. Research on Performance of Indoor Wireless and Power Line Dual-Medium Cooperative Communication System. Proc. CSEE 2017, 37, 2589–2599. (In Chinese) [Google Scholar]
  25. Al-Khasawneh, M.A.S.; Faheem, M.; Aldhahri, E.A.; Alzahrani, A.; Alarood, A.A. A MapReduce based approach for secure batch satellite image encryption. IEEE Access 2023, 11, 62865–62878. [Google Scholar] [CrossRef]
  26. Faheem, M.; Kuusniemi, H.; Eltahawy, B.; Bhutta, M.S.; Raza, B. A lightweight smart contracts framework for blockchain-based secure communication in smart grid applications. IET Gener. Transm. Distrib. 2024, 18, 625–638. [Google Scholar] [CrossRef]
Figure 1. NOMA-based two-hop hybrid communication system model.
Applsci 14 03044 g001
Figure 2. Timeslot diagram of two-hop transmission scheme based on NOMA.
Applsci 14 03044 g002
Figure 3. System normalized throughput and packet loss probability curve with different channel parameters.
Applsci 14 03044 g003
Figure 4. Performance comparison of system throughput for different schemes.
Applsci 14 03044 g004
Figure 5. Performance comparison of system packet loss probability for different schemes.
Applsci 14 03044 g005
Figure 6. Performance comparison of delay for different schemes.
Applsci 14 03044 g006
Figure 7. Three-dimensional curve of optimization target with transmission power and user power allocation factor.
Applsci 14 03044 g007
Figure 8. Comparison of optimization target of different algorithms with SNR.
Applsci 14 03044 g008
Figure 9. Comparison of delay of different algorithms with SNR.
Applsci 14 03044 g009
Table 1. Summary of existing research in the last three years.
Ref.YearMajor FocusOptimization Objective and Performance
[4]2022Hybrid TDMA-NOMA system.Joint allocation of available time slots and available transmit power in hybrid TDMA-NOMA systems to maximize energy efficiency.
[6]2023Hybrid wireless and power line communication systems.A power allocation optimization technique is proposed to achieve an outage-optimal performance.
[8]2023A long-term cross-layer resource allocation model with dynamic traffic arrivals and limited channel information.Minimizes long-term average total power consumption while meeting QoS requirements.
[9]2021Cloud Radio Access Network (C-RAN) based on NOMA.Maximize energy efficiency by jointly optimizing power distribution, analog and digital precoding.
[10]2021NOMA system with delay requirements.Get the best delay power trade-off in NOMA systems
[13]2021Unmanned Aerial Vehicle (UAV) Assisted Wireless Cache Network (WCN).A cross-layer resource allocation strategy including UAV scheduling, number of grouped users and power allocation is proposed to reduce file interrupt probability and improve hit probability.
Table 2. Main parameters and values of MAC layer protocol of wireless communication.
ParameterNumerical Value
Slot Time ( σ w ) 50   μ s
Packet Header ( T H ) 400   μ s
Short interframe space ( T SIFS ) 28   μ s
Distributed Interframe Space ( T DIFS ) 128   μ s
Acknowledgement frame ( T ACK w ) 240   μ s
Channel propagation delay ( δ ) 1   μ s
T AT w T ACK w + 60   μ s
Table 3. Main parameters and values of MAC layer protocol of wireless communication of PLC.
ParameterNumerical Value
Slot Time ( σ pl ) 35.84   μ s
Priority Resolution Slot ( T PRS ) 35.84   μ s
Preamble ( T P ) 110.48   μ s
Contention Interframe Space ( T CIFS ) 100   μ s
Response Interframe Space ( T RIFS ) 140   μ s
Acknowledgement frame ( T ACK pl ) 110.48   μ s
Extended Interframe Space ( T EIFS ) 2920.64   μ s
T AT pl T ACK pl + 60   μ s
Disclaimer/Publisher’s Note: The statements, opinions and data contained in all publications are solely those of the individual author(s) and contributor(s) and not of MDPI and/or the editor(s). MDPI and/or the editor(s) disclaim responsibility for any injury to people or property resulting from any ideas, methods, instructions or products referred to in the content.

