
Prediction and Detection of Ventricular Fibrillation Using Complex Features and AI-Based Classification


Abstract
1. Introduction
2. Materials and Methods
2.1. Features
2.2. Databases
2.2.1. The Database for the Detection of Ventricular Fibrillation
2.2.2. The Database for Forecast of Ventricular Fibrillation
2.3. Segmentation of ECG Recordings
2.3.1. Segmentation for the Detection of Ventricular Fibrillation
2.3.2. Segmentation of ECG Recordings and Building Database for Forecast of Ventricular Fibrillation
2.3.3. The Classifiers
3. Results
3.1. Results for the Detection of Ventricular Fibrillation
3.2. Results for Forecast of Ventricular Fibrillation
4. Discussion
5. Conclusions
Author Contributions
Funding
Institutional Review Board Statement
Informed Consent Statement
Data Availability Statement
Conflicts of Interest
References
- Mjahad, A.; Rosado-Muñoz, A.; Guerrero-Martinez, J.; Bataller-Mompean, M.; Frances-Villora, J.V. ECG, Analysis for Ventricular Fibrillation Detection Using a Boltzmann Network. In Proceedings of the VI Latin American Congress on Biomedical Engineering CLAIB 2014, Parana, Argentina, 29–31 October 2014; Braidot, A., Hadad, A., Eds.; Springer: Cham, Switzerland, 2015; Volume 49, pp. 532–535. [Google Scholar]
- Jekova, I. Shock advisory tool: Detection of life threatening cardiac arrhythmias and shock success prediction by means of a common parameter set. Biomed. Signal Process. Control 2007, 2, 25–33. [Google Scholar] [CrossRef]
- Jekova, I.; Krasteva, V. Real time detection of ventricular fibrillation and tachycardia. Physiol. Meas. 2004, 25, 1167. [Google Scholar] [CrossRef] [PubMed]
- Srinivasan, N.T.; Schilling, R.J. Sudden Cardiac Death and Arrhythmias. Arrhythm. Electrophysiol. Rev. 2018, 7, 111–117. [Google Scholar] [CrossRef] [PubMed]
- Xie, H.B.; Zhong-Mei, G.; Liu, H. Classification of Ventricular Tachycardia and Fibrillation Using Fuzzy Similarity-based Approximate Entropy. Expert Syst. Appl. 2011, 38, 3973–3981. [Google Scholar] [CrossRef]
- Kaur, L.; Singh, V. Ventricular Fibrillation Detection using Empirical Mode Decomposition and Approximate Entropy. Int. J. Emerg. Technol. Adv. Eng. 2013, 3, 260–268. [Google Scholar]
- Ibaida, A.; Khalil, I. Distinguishing between Ventricular Tachycardia and Ventricular Fibrillation from Compressed ECG Signal in Wireless Body Sensor Networks. In Proceedings of the 2010 Annual International Conference of the IEEE Engineering in Medicine and Biology, Buenos Aires, Argentina, 31 August–4 September 2010; pp. 2013–2016. [Google Scholar]
- Tan, W.; Foo, C.L.; Chua, T.W. Type-2 Fuzzy System for ECG Arrhythmic Classification. In Proceedings of the 2007 IEEE International Fuzzy Systems Conference, London, UK, 23–26 July 2007; pp. 1–6. [Google Scholar]
- Phong, P.A.; Thien, K.Q. Classification of Cardiac Arrhythmias Using Interval Type-2 TSK Fuzzy System. In Proceedings of the 2009 International Conference on Knowledge and Systems Engineering, Hanoi, Vietnam, 13–17 October 2009; pp. 1–6. [Google Scholar]
- Fira, M. Detection of P300 in a BCI Speller. In Convergence and Hybrid Information Technology. ICHIT 2011. Communications in Computer and Information Science; Lee, G., Howard, D., Ślęzak, D., Eds.; Springer: Berlin/Heidelberg, Germany, 2011; Volume 206. [Google Scholar]
- Fira, M.; Goras, L. A New Method for EEG Compressive Sensing. Adv. Electr. Comput. Eng. 2012, 12, 71–76. [Google Scholar] [CrossRef]
- Verma, A.; Dong, X. Detection of Ventricular Fibrillation Using Random Forest Classifier. Biomed. Sci. Eng. 2016, 9, 259–268. [Google Scholar] [CrossRef]
- Alonso-Atienza, F.; Morgado, E.; Fernandez-Martínez, L.; Garcia-Alberola, A.; Rojo-Alvarez, J. Detection of Life-Threatening Arrhythmias Using Feature Selection and Support Vector Machines. IEEE Trans. Biomed. Eng. 2014, 61, 832–840. [Google Scholar] [CrossRef] [PubMed]
- Hajeb-Mohammadalipour, S.; Ahmadi, M.; Shahghadami, R.; Chon, K. Automated Method for Discrimination of Arrhythmias Using Time, Frequency, and Nonlinear Features of Electrocardiogram Signals. Sensors 2018, 18, 2090. [Google Scholar] [CrossRef]
- Tripathy, R.K.; Zamora-Mendez, A.; de la O Serna, J.A.; Paternina, M.R.A.; Arrieta, J.G.; Naik, G.R. Detection of Life Threatening Ventricular Arrhythmia Using Digital Taylor Fourier Transform. Front. Physiol. 2018, 9, 722. [Google Scholar] [CrossRef] [PubMed]
- Li, Q.; Rajagopalan, C.; Clifford, G.D. Ventricular fibrillation and tachycardia classification using a machine learning approach. IEEE Trans. Biomed. Eng. 2013, 61, 1607–1613. [Google Scholar] [PubMed]
- Acharya, U.R.; Fujita, H.; Lih, O.S.; Hagiwara, Y.; Tan, J.H.; Adam, M. Automated detection of arrhythmias using different intervals of tachycardia ECG segments with convolutional neural network. Inf. Sci. 2017, 405, 81–90. [Google Scholar] [CrossRef]
- Ibtehaz, N.; Rahman, M.S.; Rahman, M.S. VFPred: A fusion of signal processing and machine learning techniques in detecting ventricular fibrillation from ECG signals. Biomed. Signal Process. Control 2019, 49, 349–359. [Google Scholar] [CrossRef]
- Xia, D.; Meng, Q.; Chen, Y.; Zhang, Z. Classification of ventricular tachycardia and fibrillation based on the lempel-ziv complexity and EMD. In International Conference on Intelligent Computing; Springer: Berlin/Heidelberg, Germany, 2014; pp. 322–329. [Google Scholar]
- Xu, Y.; Wang, D.; Zhang, W.; Ping, P.; Feng, L. Detection of ventricular tachycardia and fibrillation using adaptive variational mode decomposition and boosted-cart classifier. Biomed. Signal Process. Control. 2018, 39, 219–229. [Google Scholar] [CrossRef]
- Mjahad, A.; Frances-Villora, J.V.; Bataller-Mompean, M.; Rosado-Muñoz, A. Ventricular Fibrillation and Tachycardia Detection Using Features Derived from Topological Data Analysis. Appl. Sci. 2022, 12, 7248. [Google Scholar] [CrossRef]
- Mohanty, M.; Sahoo, S.; Biswal, P.; Sabut, S. Efficient classification of ventricular arrhythmias using feature selection and C4. 5 classifier. Biomed. Signal Process. Control 2018, 44, 200–208. [Google Scholar] [CrossRef]
- He, M.; Gong, Y.; Li, Y.; Mauri, T.; Fumagalli, F.; Bozzola, M.; Ristagno, G. Combining multiple ECG features does not improve prediction of defibrillation outcome compared to single features in a large population of out-of-hospital cardiac arrests. Crit Care 2015, 19, 425. [Google Scholar] [CrossRef]
- Neurauter, A.; Eftestøl, T.; Kramer-Johansen, J.; Abella, B.S.; Sunde, K.; Wenzel, V.; Lindner, K.H.; Eilevstjønn, J.; Myklebust, H.; Steen, P.A.; et al. Prediction of countershock success using single features from multiple ventricular fibrillation frequency bands and feature combinations using neural networks. Resuscitation 2007, 73, 253–263. [Google Scholar] [CrossRef]
- Chicote, B.; Irusta, U.; Aramendi, E.; Isasi, I.; Alonso, D.; Vicente, F.; Sanchez, M. Nonlinear energy operators for defibrillation shock outcome prediction. In Proceedings of the 2016 Computing in Cardiology Conference (CinC), Vancouver, BC, Canada, 11–14 September 2016; pp. 61–64. [Google Scholar]
- Podbregar, M.; Kovacic, M.; Podbregar-Mars, A.; Brezocnik, M. Predicting defibrillation success by ‘genetic’ programming in patients with out-of-hospital cardiac arrest. Resuscitation 2003, 57, 153–159. [Google Scholar] [CrossRef]
- Sherman, L.D.; Rea, T.D.; Waters, J.D.; Menegazzi, J.J.; Callaway, C.W. Logarithm of the absolute correlations of the ECG waveform estimates duration of ventricular fibrillation and predicts successful defibrillation. Resuscitation 2008, 78, 346–354. [Google Scholar] [CrossRef] [PubMed]
- Gong, Y.; Lu, Y.; Zhang, L.; Zhang, H.; Li, Y. Predict Defibrillation Outcome Using Stepping Increment of Poincare Plot for Out-of-Hospital Ventricular Fibrillation Cardiac Arrest. Biomed. Res. Int. 2015, 2015, 493472. [Google Scholar] [CrossRef] [PubMed]
- Rosso, O.A.; Blanco, S.; Yordanova, J.; Kolev, V.; Figliola, A.; Schürmann, M.; Başar, E. Wavelet entropy: A new tool for analysis of short duration brain electrical signals. J. Neurosci. Methods 2001, 105, 65–75. [Google Scholar] [CrossRef] [PubMed]
- Eftestol, T.; Sunde, K.; Ole Aase, S.; Husoy, J.H.; Steen, P.A. Predicting outcome of defibrillation by spectral characterization and nonparametric classification of ventricular fibrillation in patients with out-of-hospital cardiac arrest. Circulation 2000, 102, 1523–1529. [Google Scholar] [CrossRef] [PubMed]
- Greenwald, S.D. Development and Analysis of a Ventricular Fibrillation Detector. Master’s Thesis, MIT Dept. of Electrical Engineering and Computer Science, Cambridge, MA, USA, 1986. [Google Scholar]
- Goldberger, A.; Amaral, L.; Glass, L.; Hausdorff, J.; Ivanov, P.C.; Mark, R.; Mietus, J.E.; Moody, G.B.; Peng, C.K.; Stanley, H.E. PhysioBank, PhysioToolkit, and PhysioNet: Components of a new research resource for complex physiologic signals. Circulation 2000, 101, e215–e220. [Google Scholar] [CrossRef] [PubMed]
- Chicote, B.; Irusta, U.; Aramendi, E.; Alcaraz, R.; Rieta, J.J.; Isasi, I.; Alonso, D.; Baqueriza, M.D.M.; Ibarguren, K. Fuzzy and Sample Entropies as Predictors of Patient Survival Using Short Ventricular Fibrillation Recordings during out of Hospital Cardiac Arrest. Entropy 2018, 20, 591. [Google Scholar] [CrossRef] [PubMed]
- Fira, M.; Costin, H.; Goras, L. Analysis of the Detection of Ventricular Fibrillation in its First 3 Seconds using Different Features and Classifiers. In Proceedings of the IEEE 10th Int. Conference on E-Health and Bioengineering—”EHB 2022”, Iasi, Romania, 17–18 November 2022. [Google Scholar]
- Tseng, L.-M.; Tseng, V.S. Predicting Ventricular Fibrillation through Deep Learning. IEEE Access 2020, 8, 221886–221896. [Google Scholar] [CrossRef]
- Fira, M.; Goras, L. On Database, Segmentation and Classifier Influence in Ventricular Fibrillation Detection. In Proceedings of the IEEE 16-th International Symposium on Signals, Circuits and Systems—ISSCS 2023, Iasi, Romania, 13–14 July 2023. [Google Scholar]
- Available online: https://www.physionet.org/content/nsrdb/1.0.0/ (accessed on 1 March 2023).
- Available online: https://physionet.org/content/sddb/1.0.0/ (accessed on 1 March 2023).
- Available online: https://physionet.org/content/vfdb/1.0.0/ (accessed on 1 March 2023).
- Muñoz-Gil, G.; Garcia-March, M.A.; Manzo, C.; Martín-Guerrero, J.D.; Lewenstein, M. Single trajectory characterization via machine learning. New J. Phys. 2020, 22, 013010. [Google Scholar] [CrossRef]
- Thapa, S.; Lomholt, M.A.; Krog, J.; Cherstvy, A.G.; Metzler, R. Bayesian analysis of single-particle tracking data using the nested-sampling algorithm: Maximum-likelihood model selection applied to stochastic-diffusivity data. Phys. Chem. Chem. Phys. 2018, 20, 29018–29037. [Google Scholar] [CrossRef] [PubMed]
- Rücker, C.; Rücker, G.; Meringer, M. y-Randomization and its variants in QSPR/QSAR. J. Chem. Inf. Model. 2007, 47, 2345–2357. [Google Scholar] [CrossRef] [PubMed]
- Filzmoser, P.; Liebmann, B.; Varmuza, K. Repeated double cross validation. J. Chemom. 2009, 23, 160–171. [Google Scholar] [CrossRef]
- Bro, R.; Kjeldahl, K.; Smilde, A.K.; Kiers, H.A.L. Cross-validation of component models: A critical look at current methods. Anal. Bioanal. Chem. 2008, 390, 1241–1251. [Google Scholar] [CrossRef]
- Nejc Ilc. Rank Aggregation, MATLAB Central File Exchange. 2024. Available online: https://www.mathworks.com/matlabcentral/fileexchange/41835-rank-aggregation (accessed on 25 March 2024).


| No. Class | No. Examples | |
|---|---|---|
| AFIB: atrial fibrillation | 14 | 993 |
| ASYS: asystole | 13 | 0 |
| B: ventricular bigeminy | 12 | 152 |
| BI: first degree heart block | 11 | 1322 |
| HGEA: high grade ventricular ectopic activity | 10 | 282 |
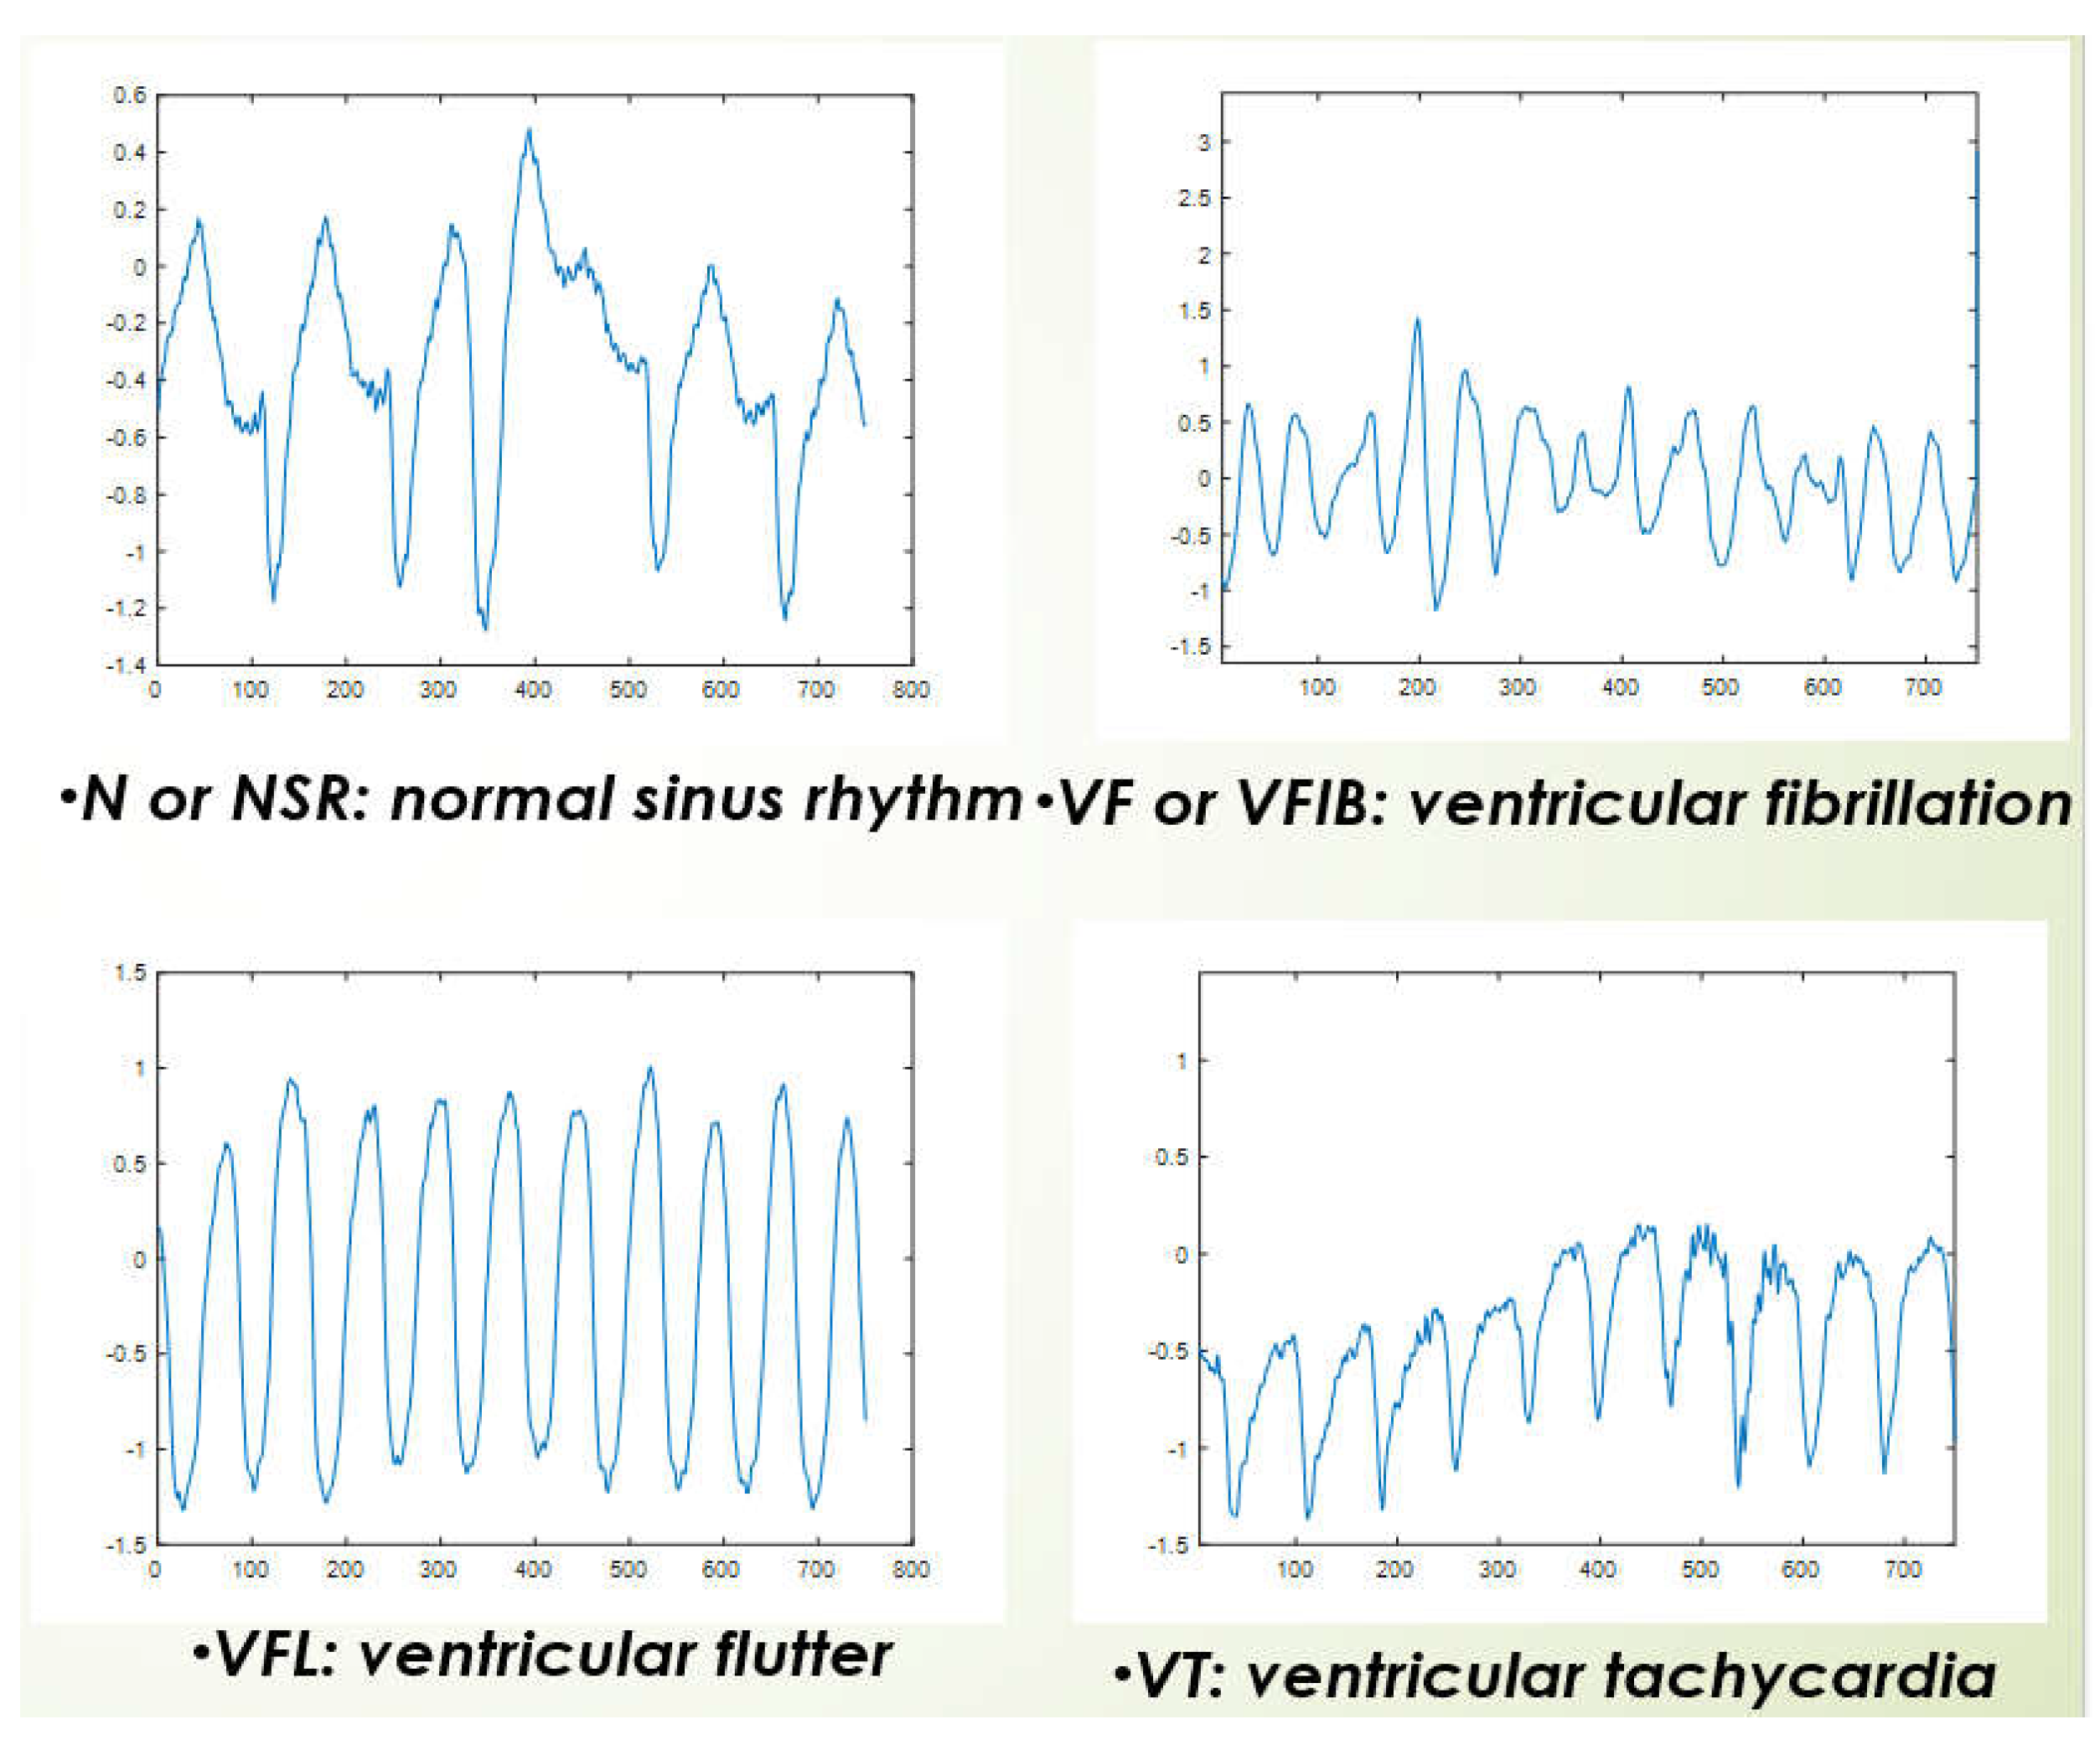
| N or NSR: nonrmal sinus rhythm | 1 | 5124 |
| NOD: nodal (“AV junctional”) rhythm | 9 | 0 |
| NOISE: noise | 2 | 1122 |
| PM: pacemaker (paced rhythm) | 8 | 408 |
| SBR: sinus bradycardia | 7 | 8 |
| SVTA: supraventricular tachyarrhythmia | 6 | 426 |
| VER: ventricular escape rhythm | 5 | 14 |
| VF or VFIB: ventricular fibrillation | 4 | 712 |
| VFL: ventricular flutter | 0 | 825 |
| VT: ventricular tachycardia | 3 | 980 |
| No. Classes | Method | Classification Rate |
|---|---|---|
| ventricular fibrillation (VF) vs. remainder | ||
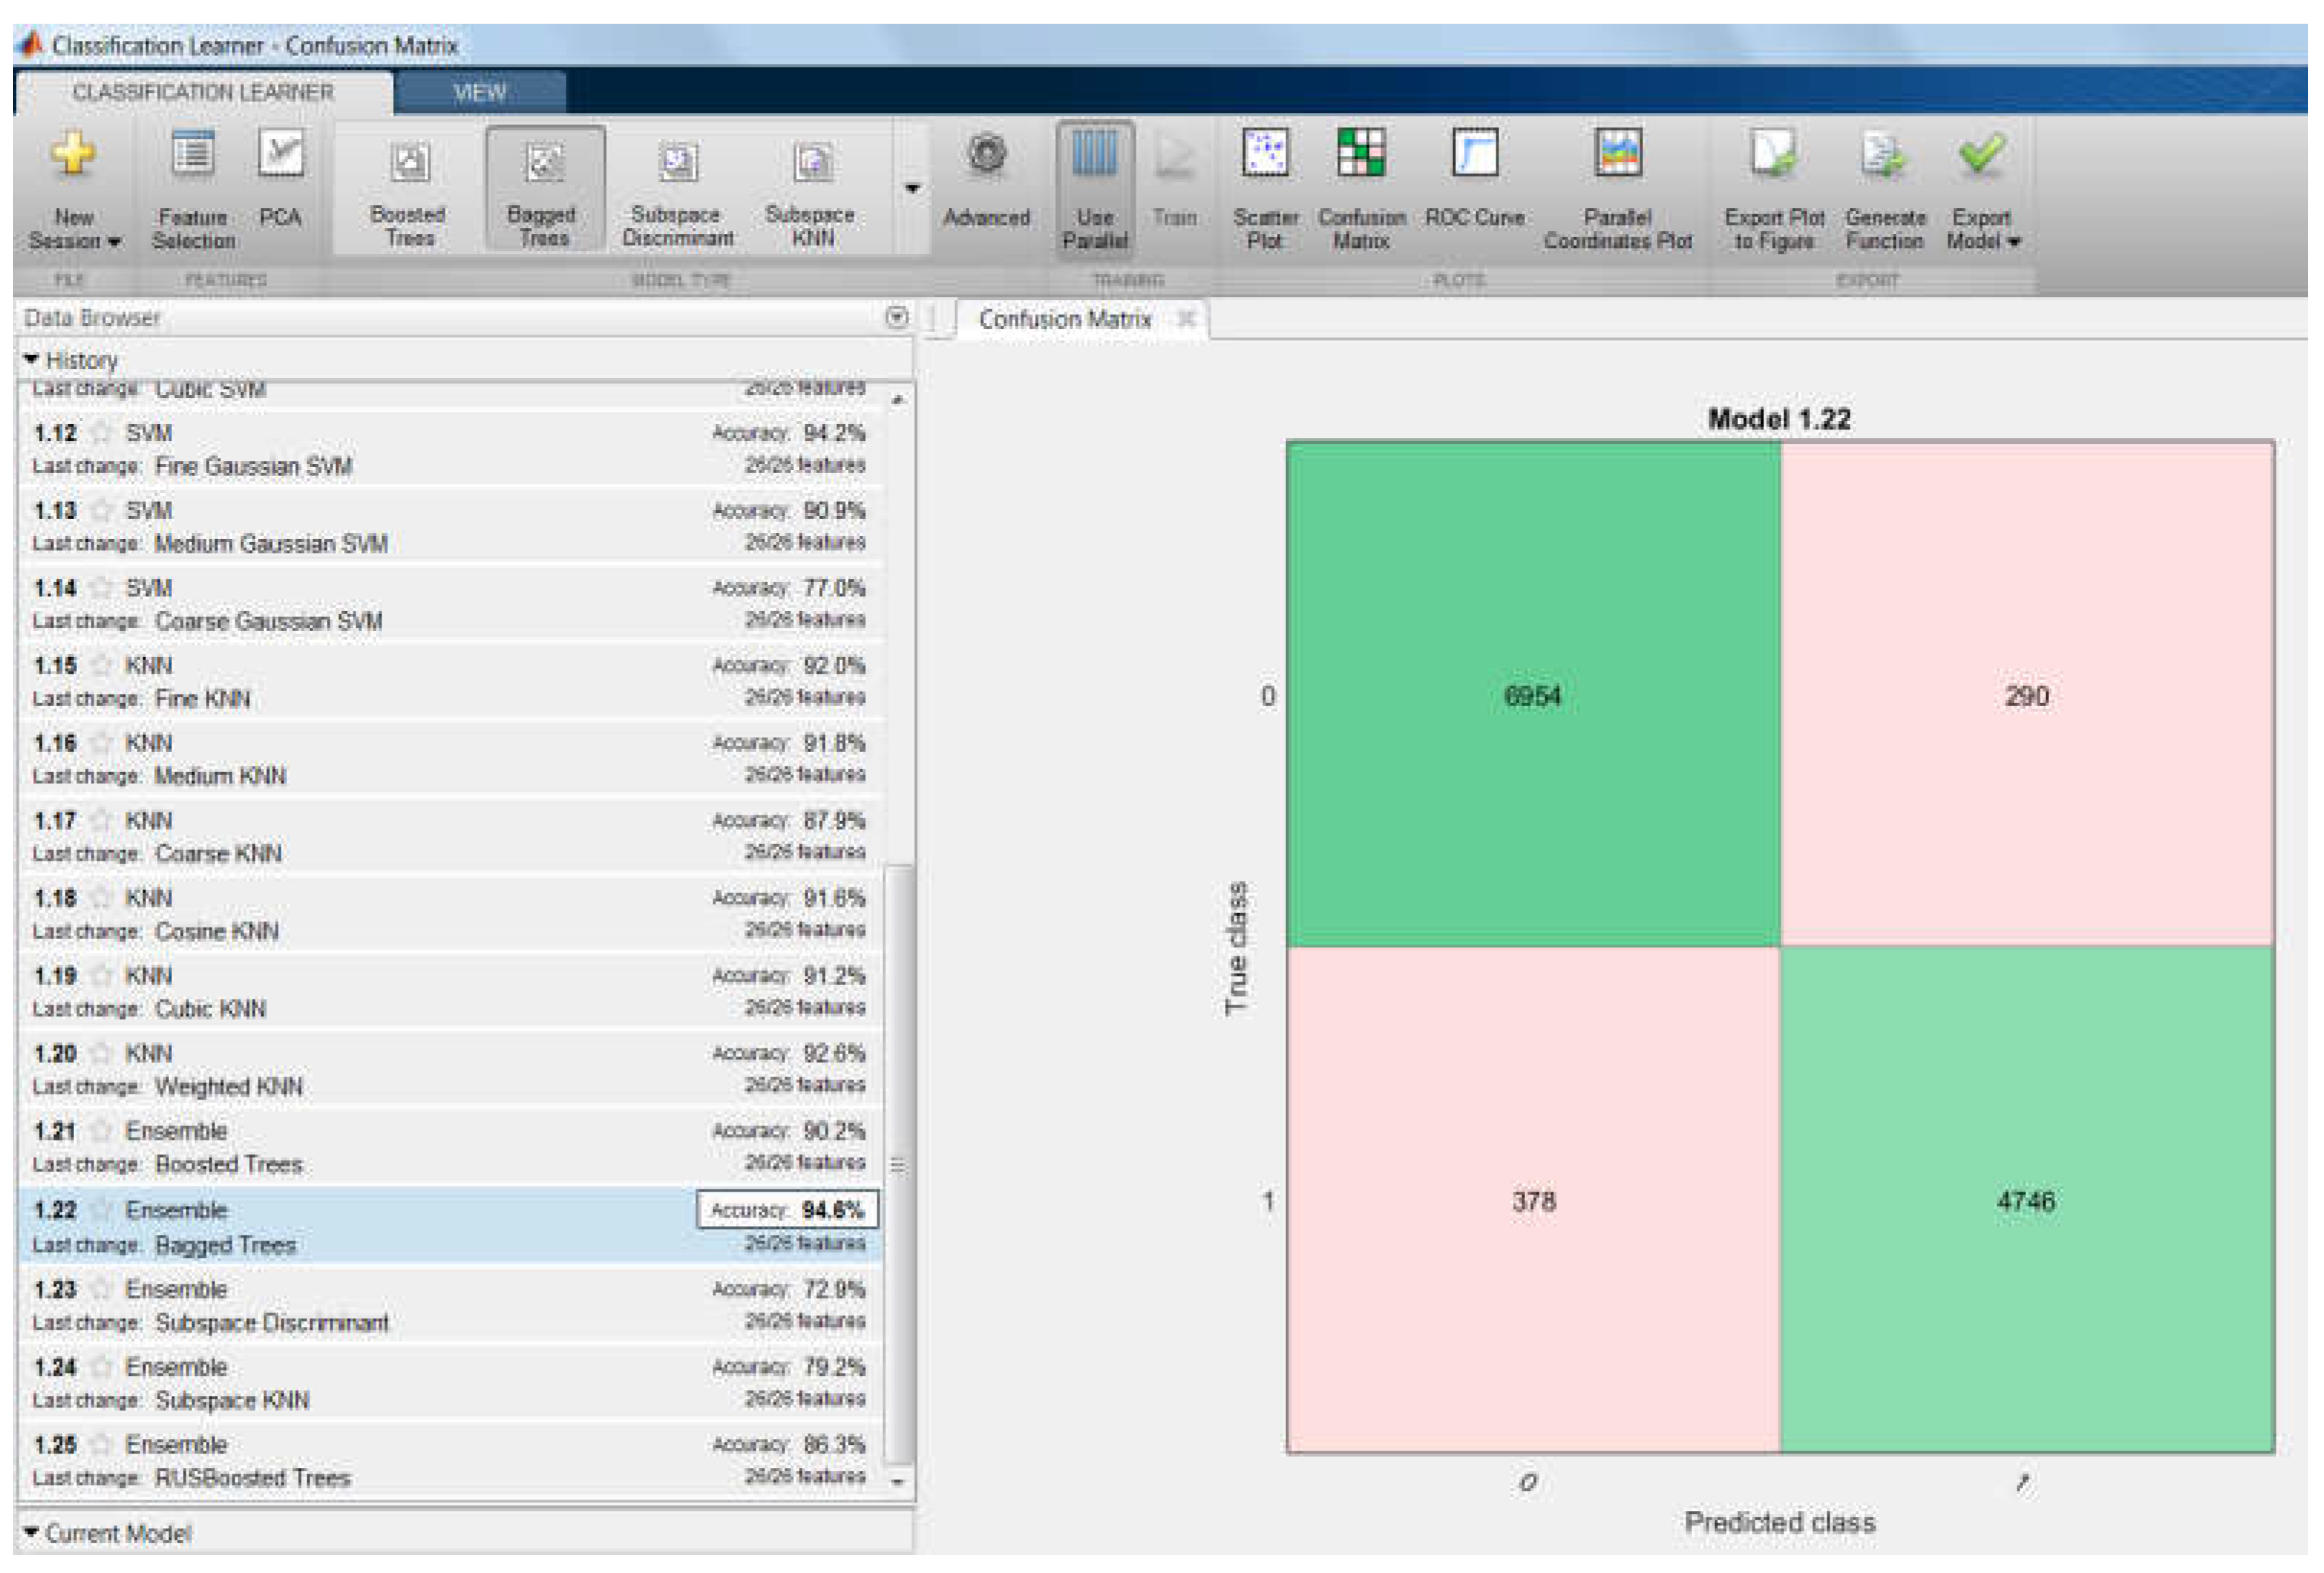
| 2 | 94.6% | Ensemble of classifiers |
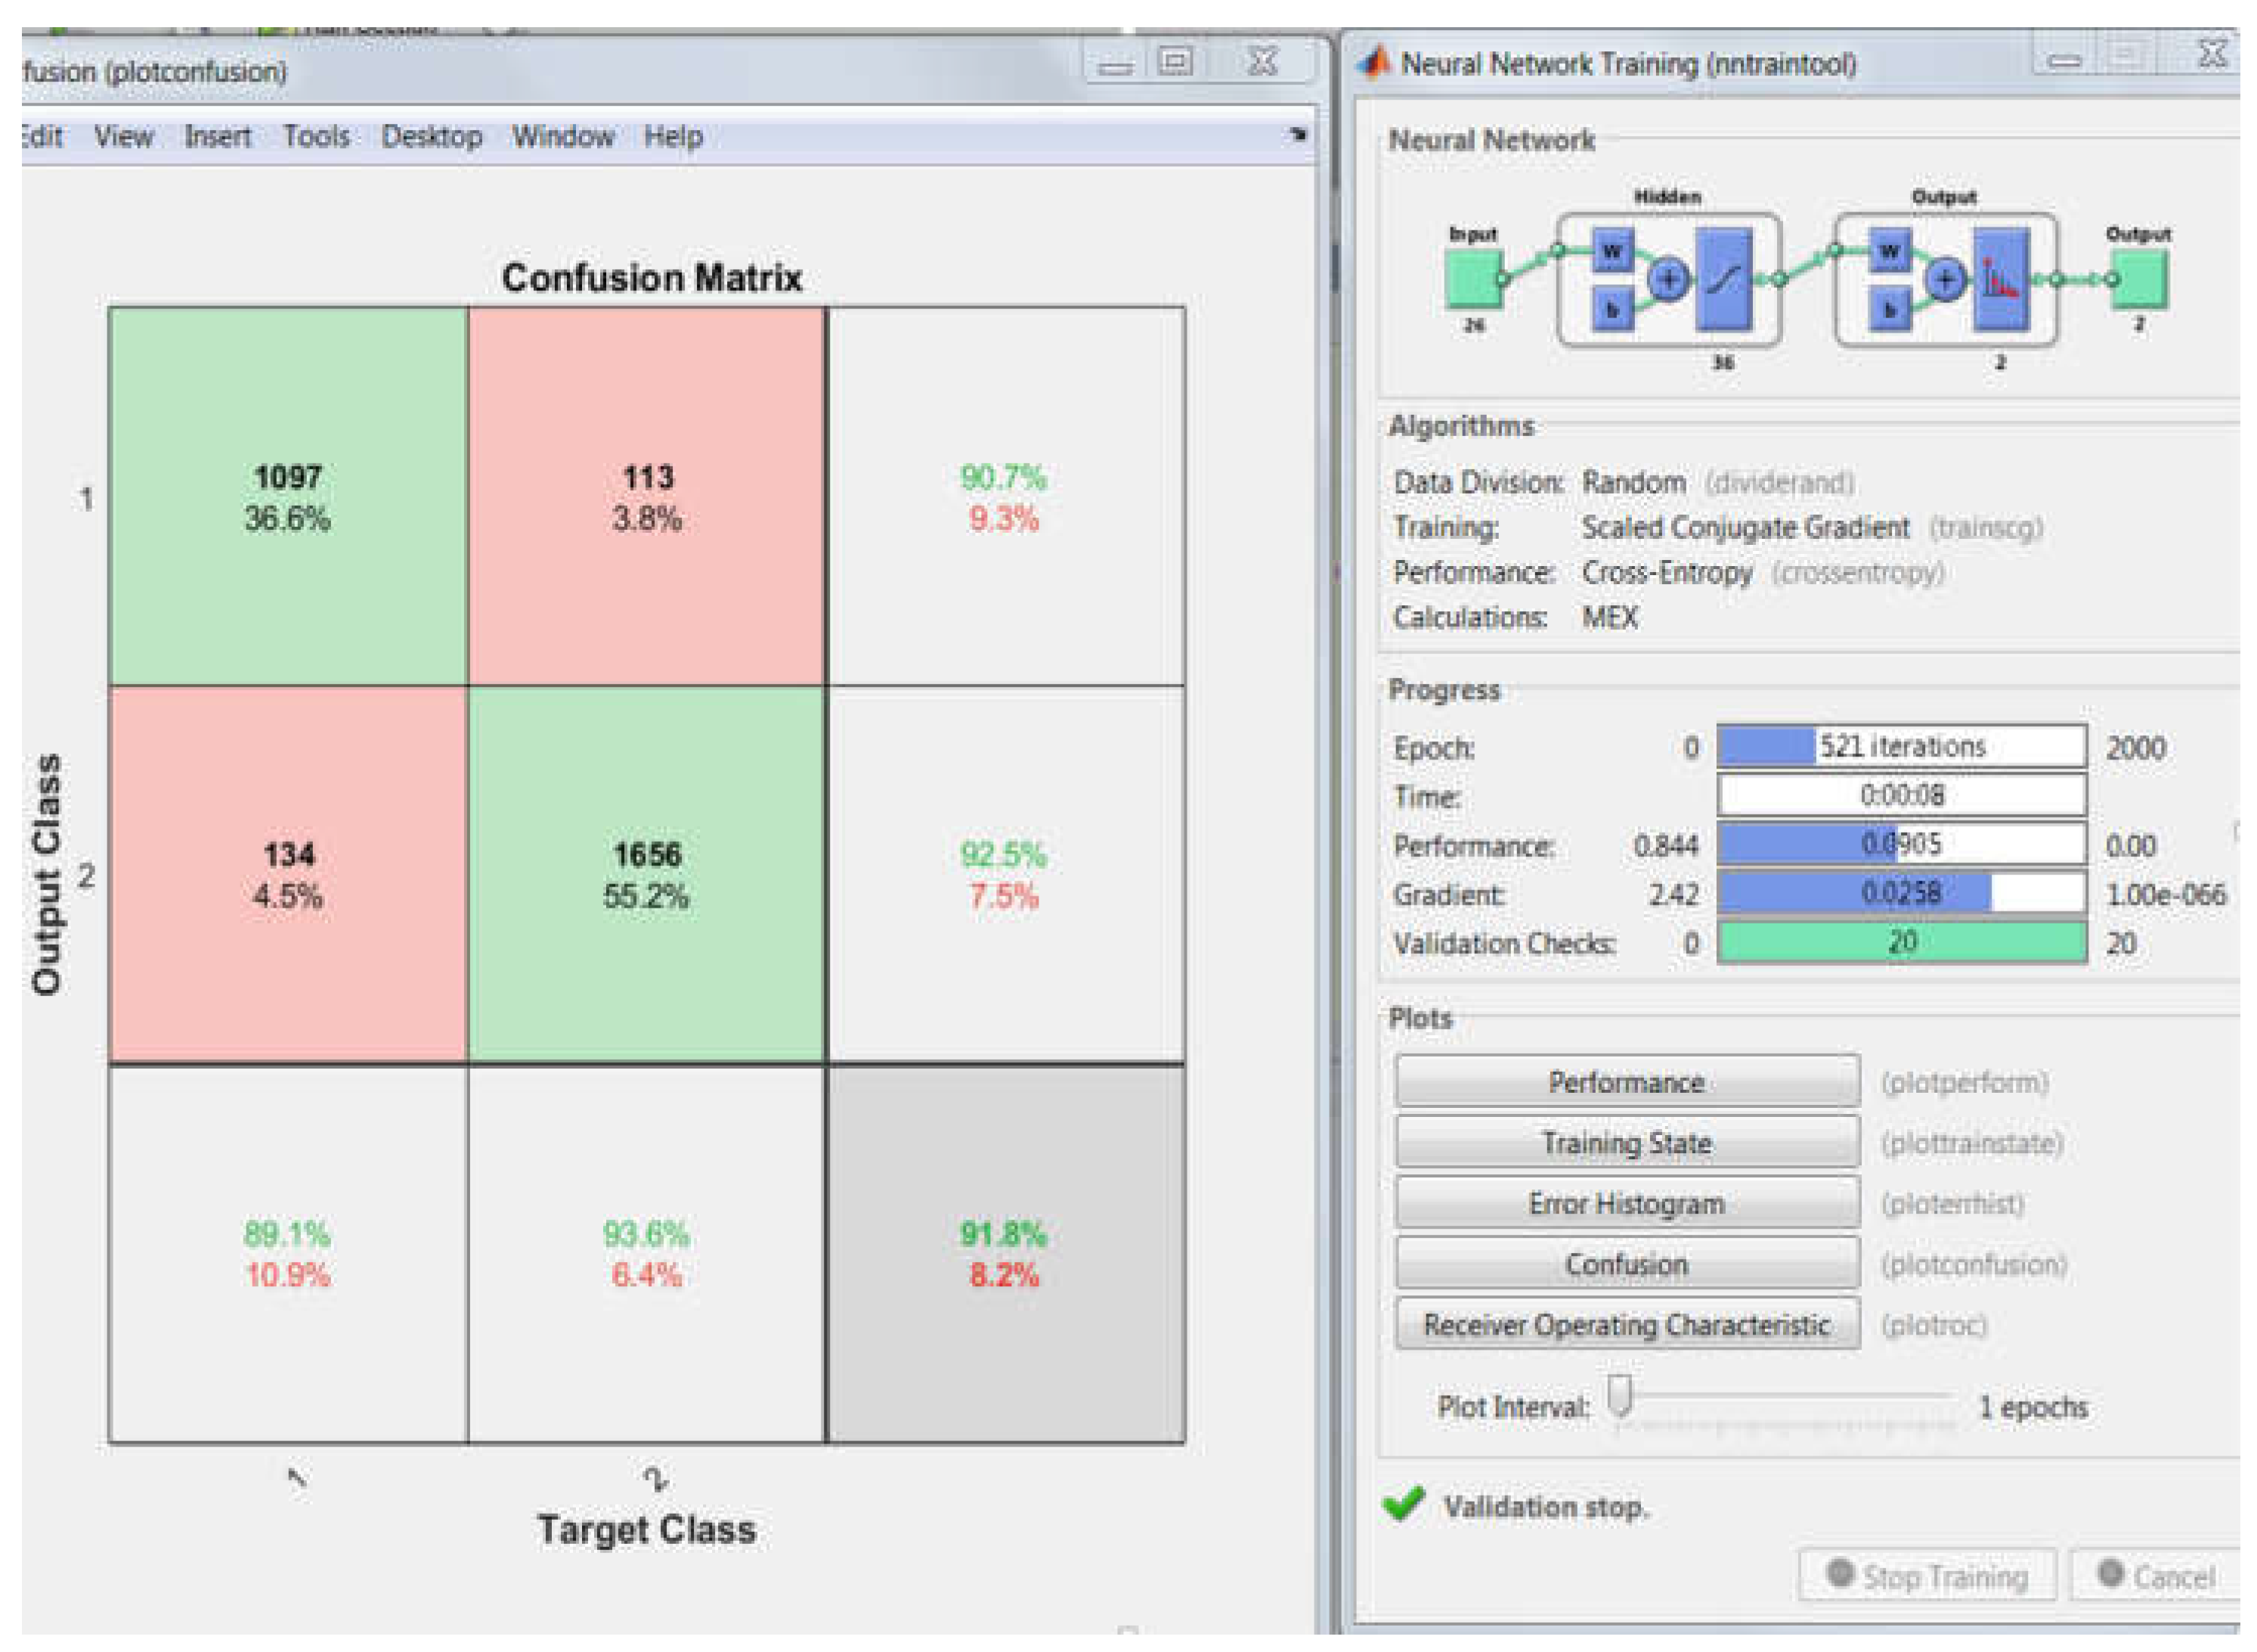
| 2 | 91.8% | MLP |
| 2 | 94.2% | SVM |
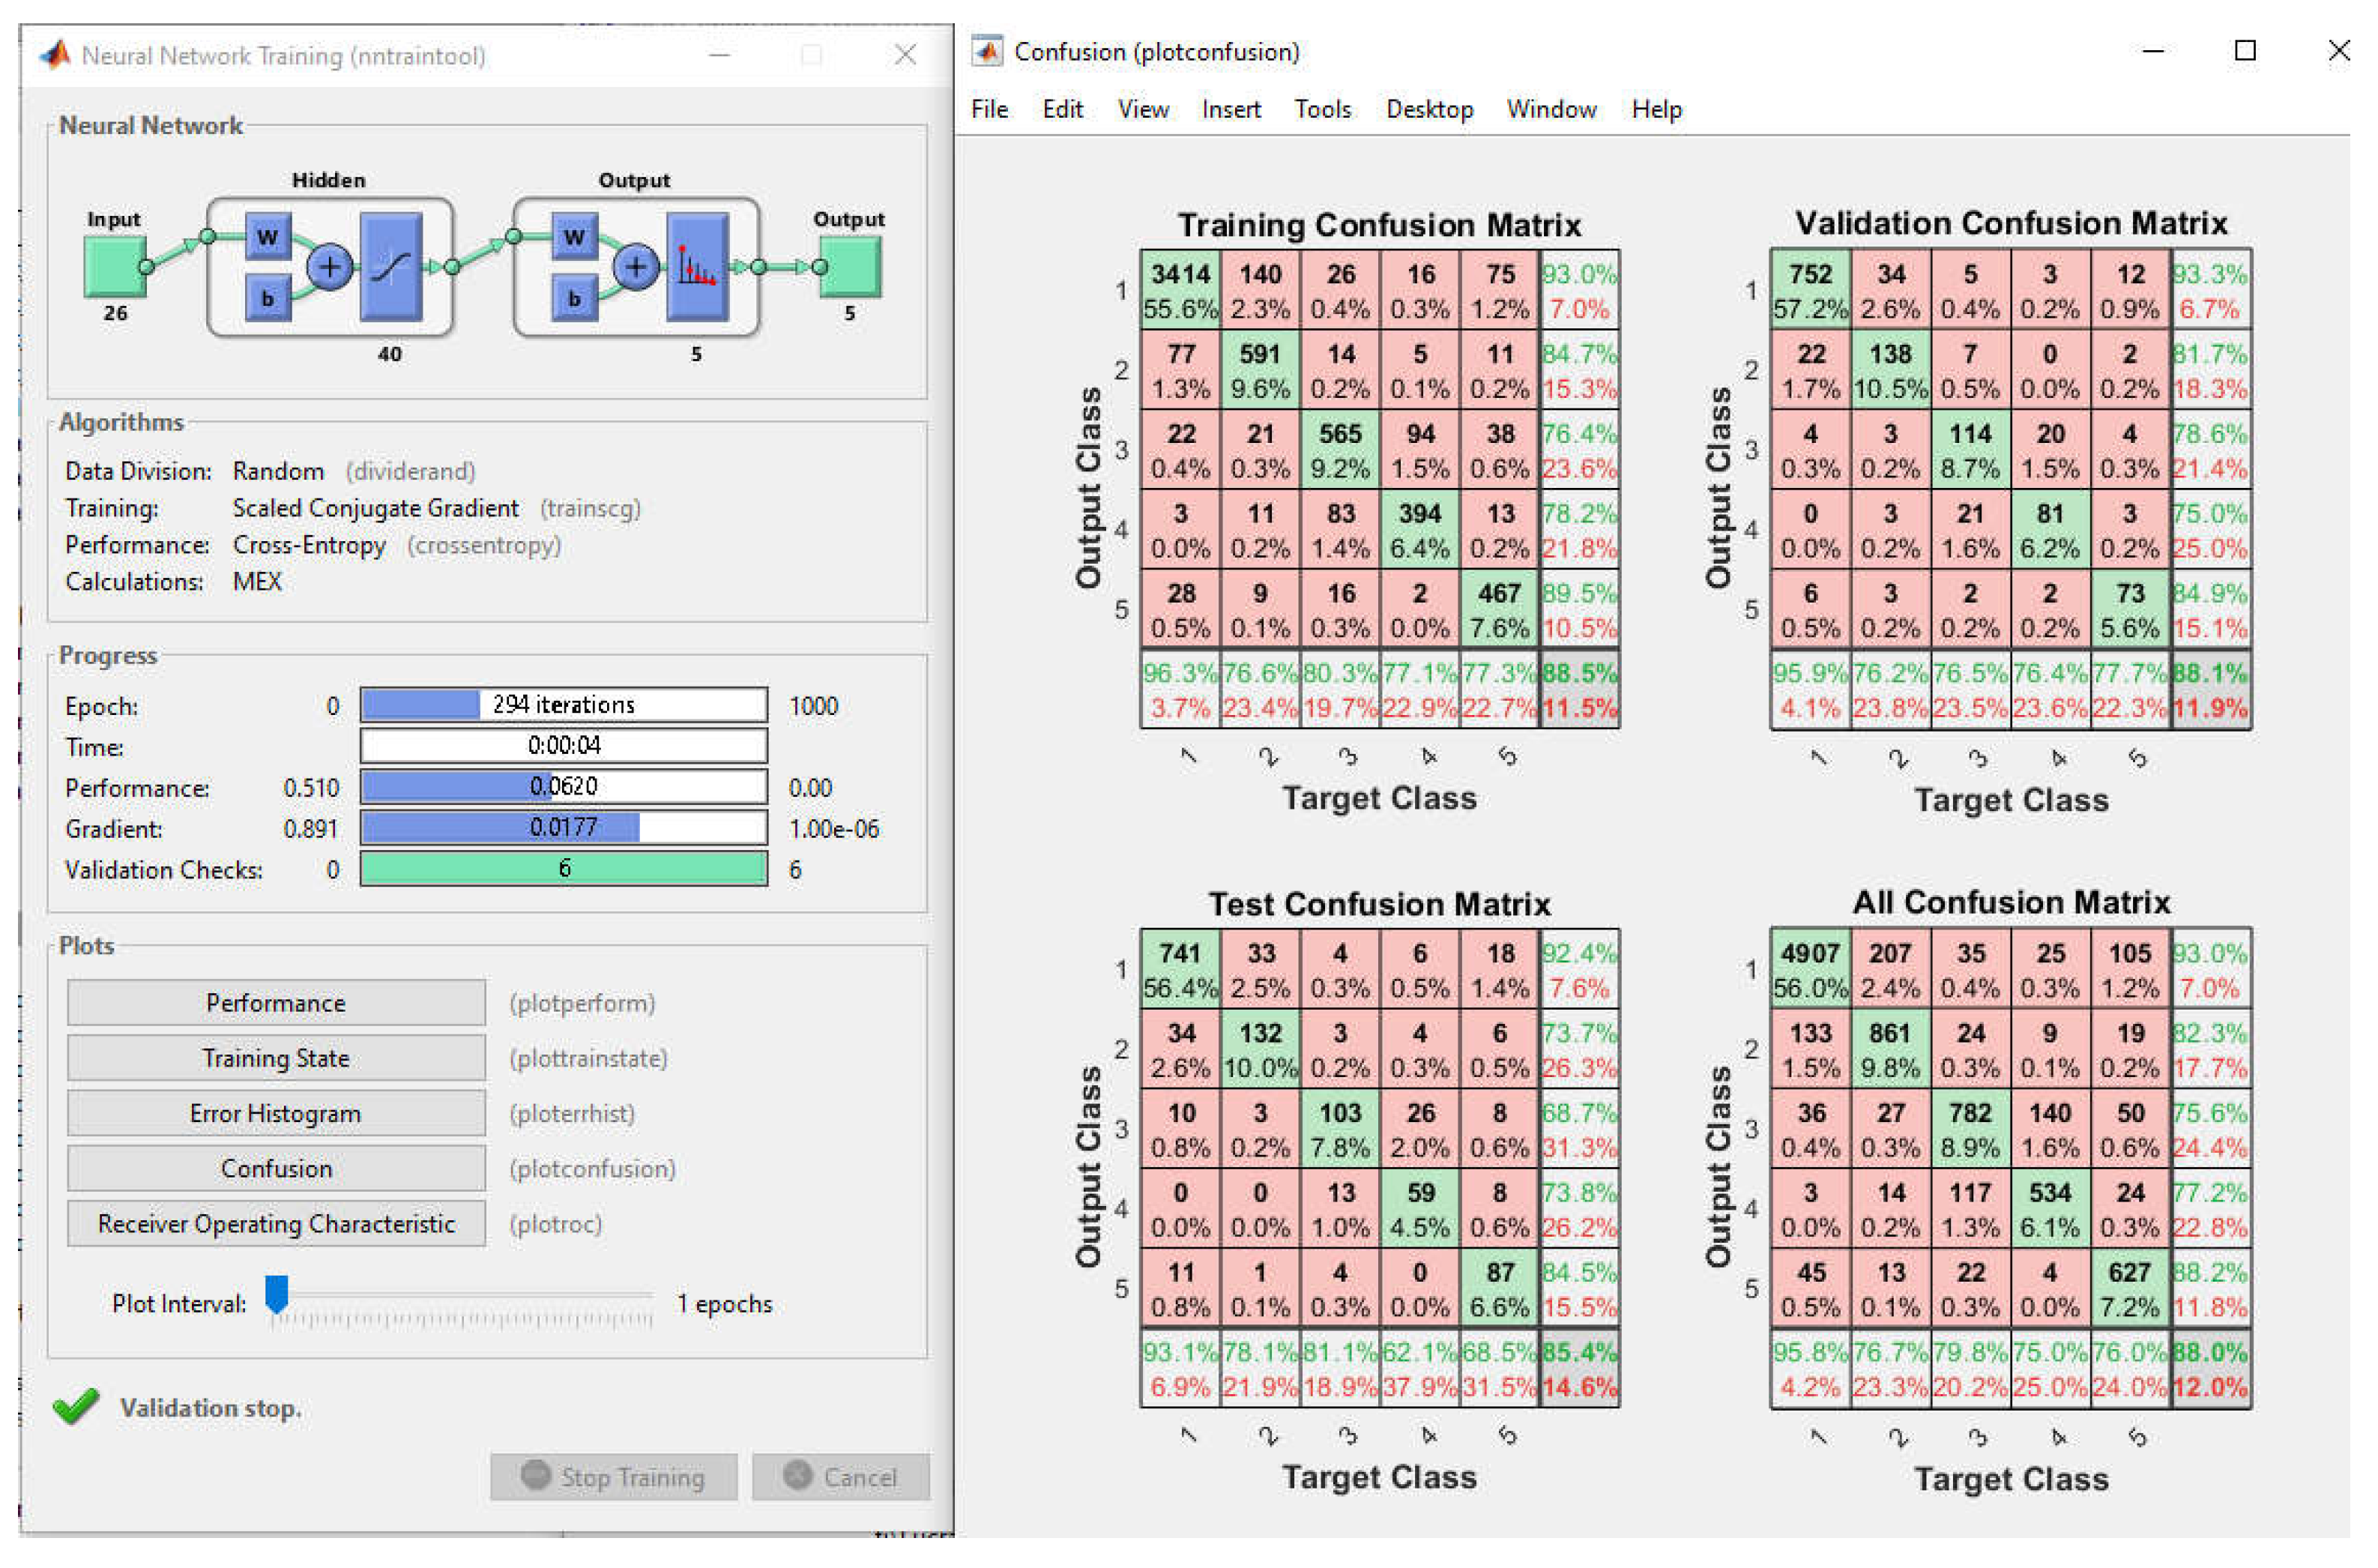
| normal, VF, VFL, VT, Noise | ||
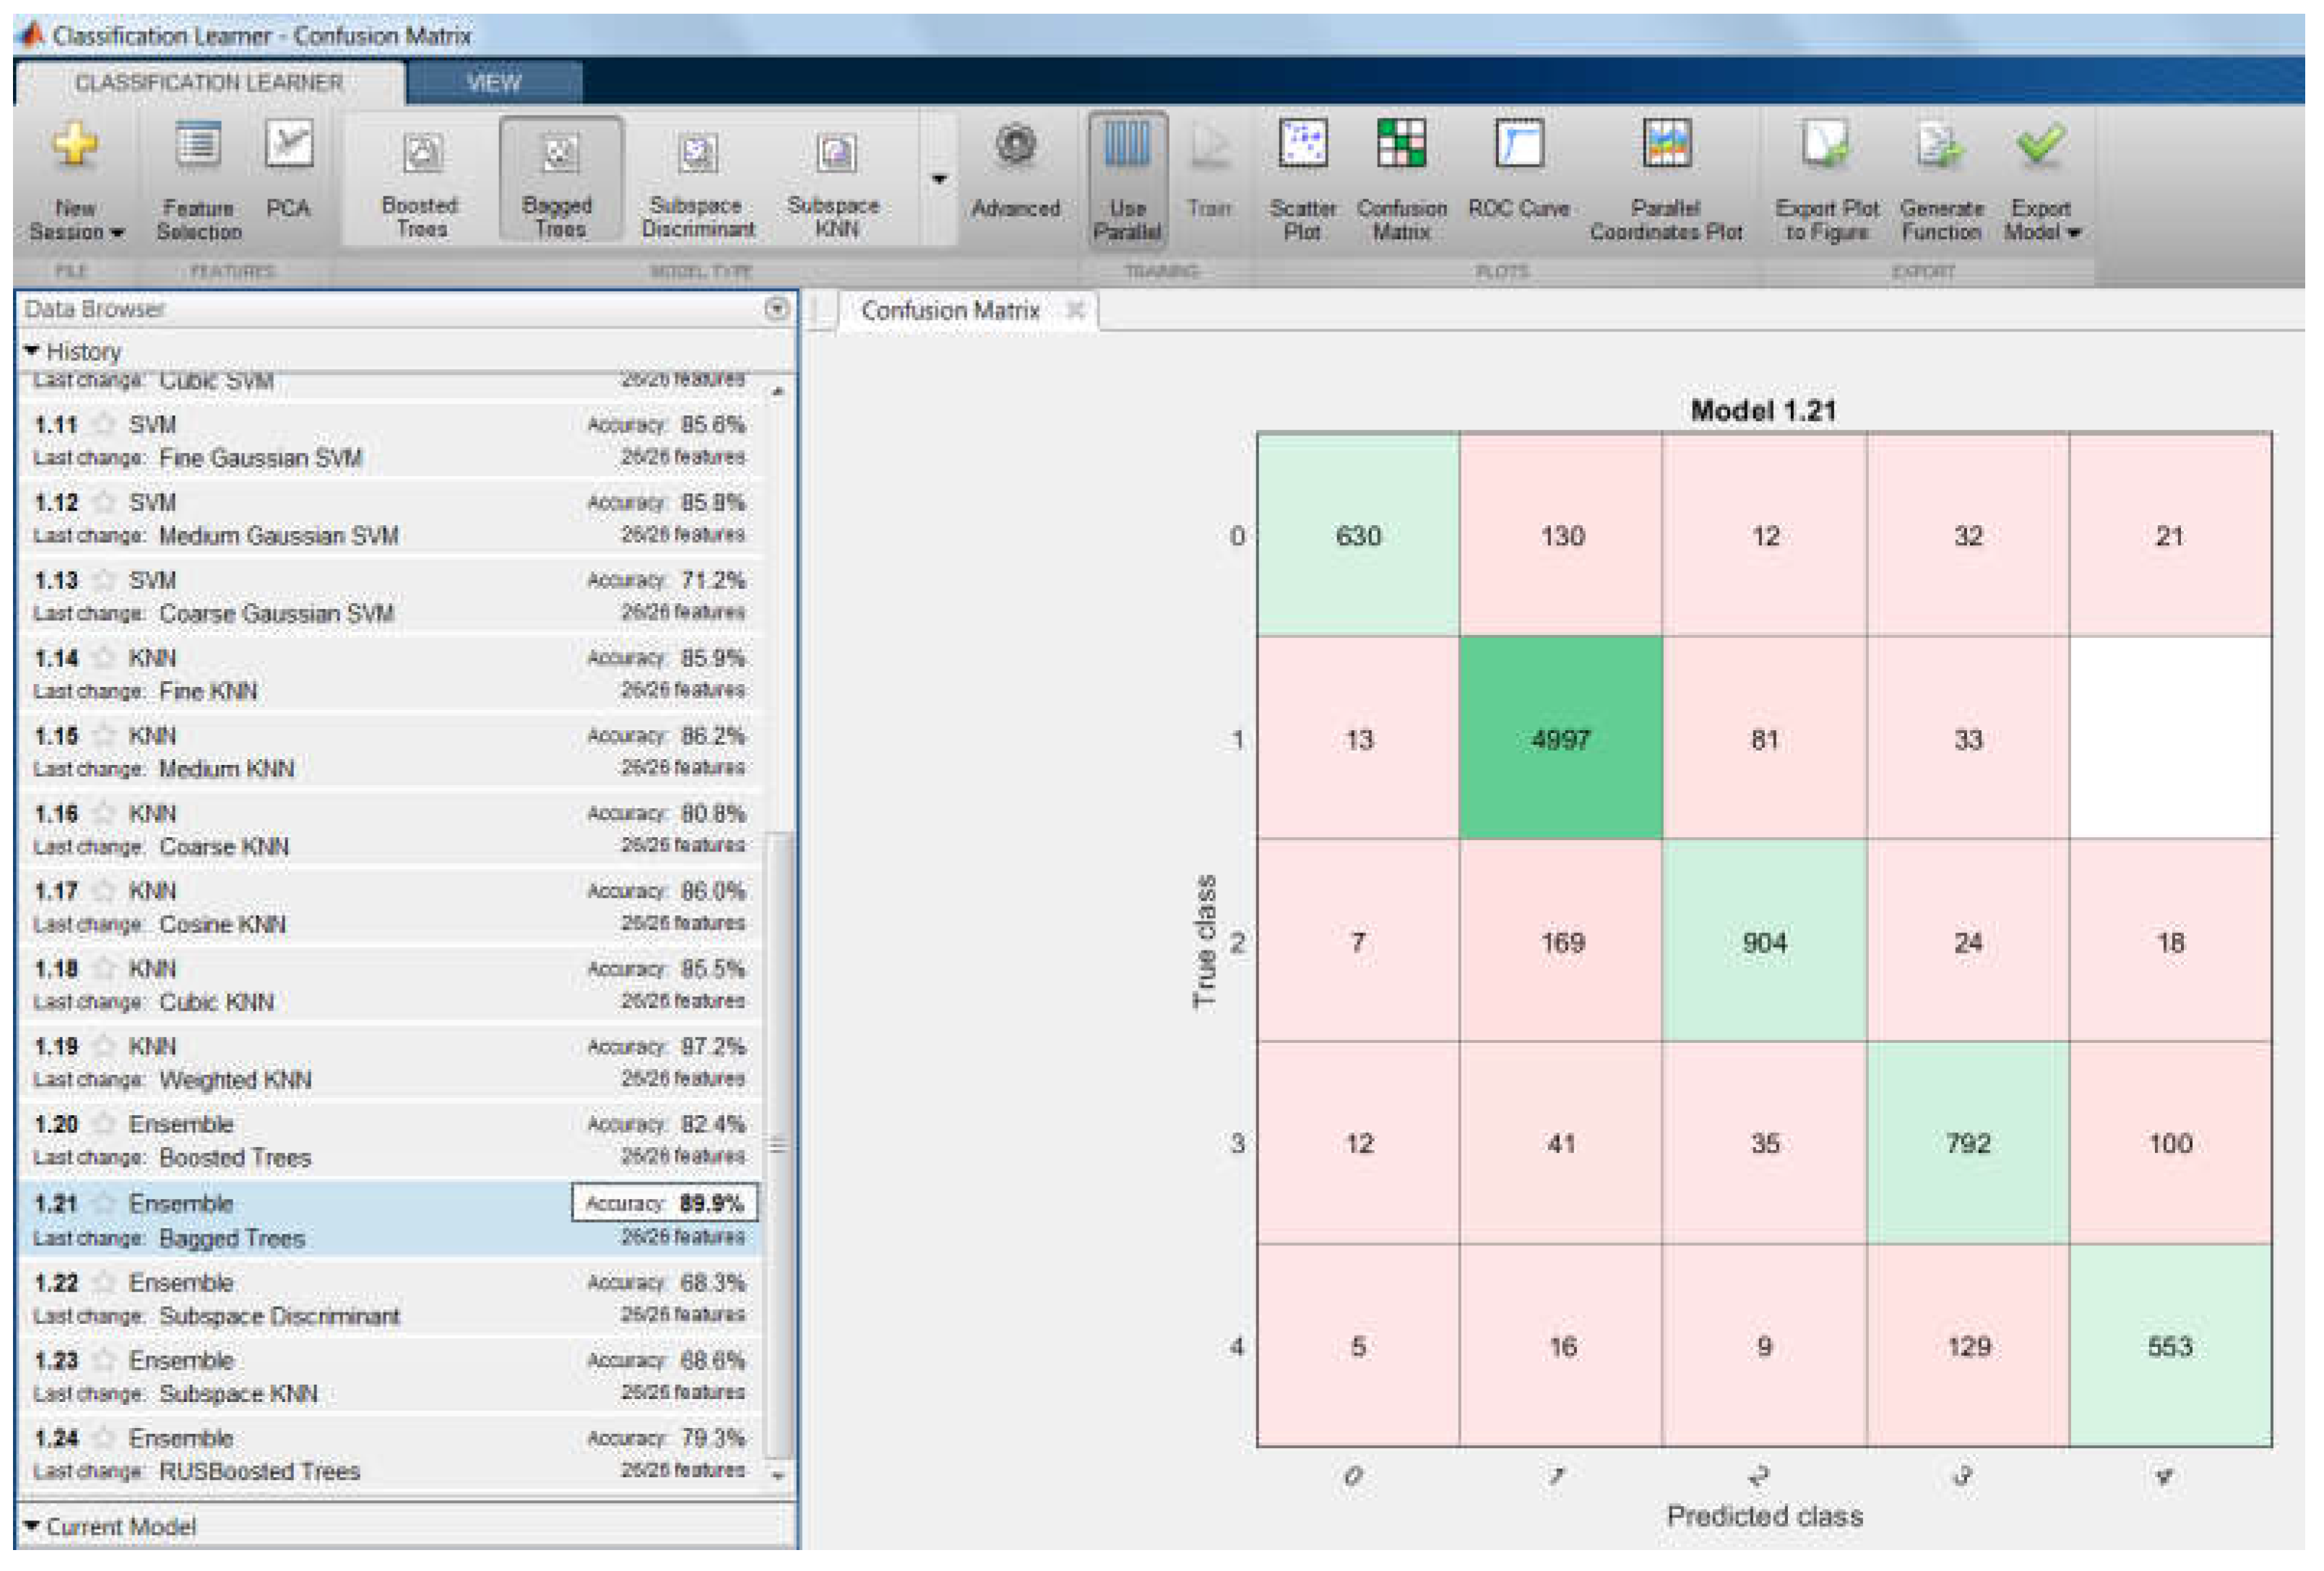
| 5 | 89.9% | Ensemble of classifiers |
| 5 | 85.4% | MLP |
| 5 | 85.6% | SVM |
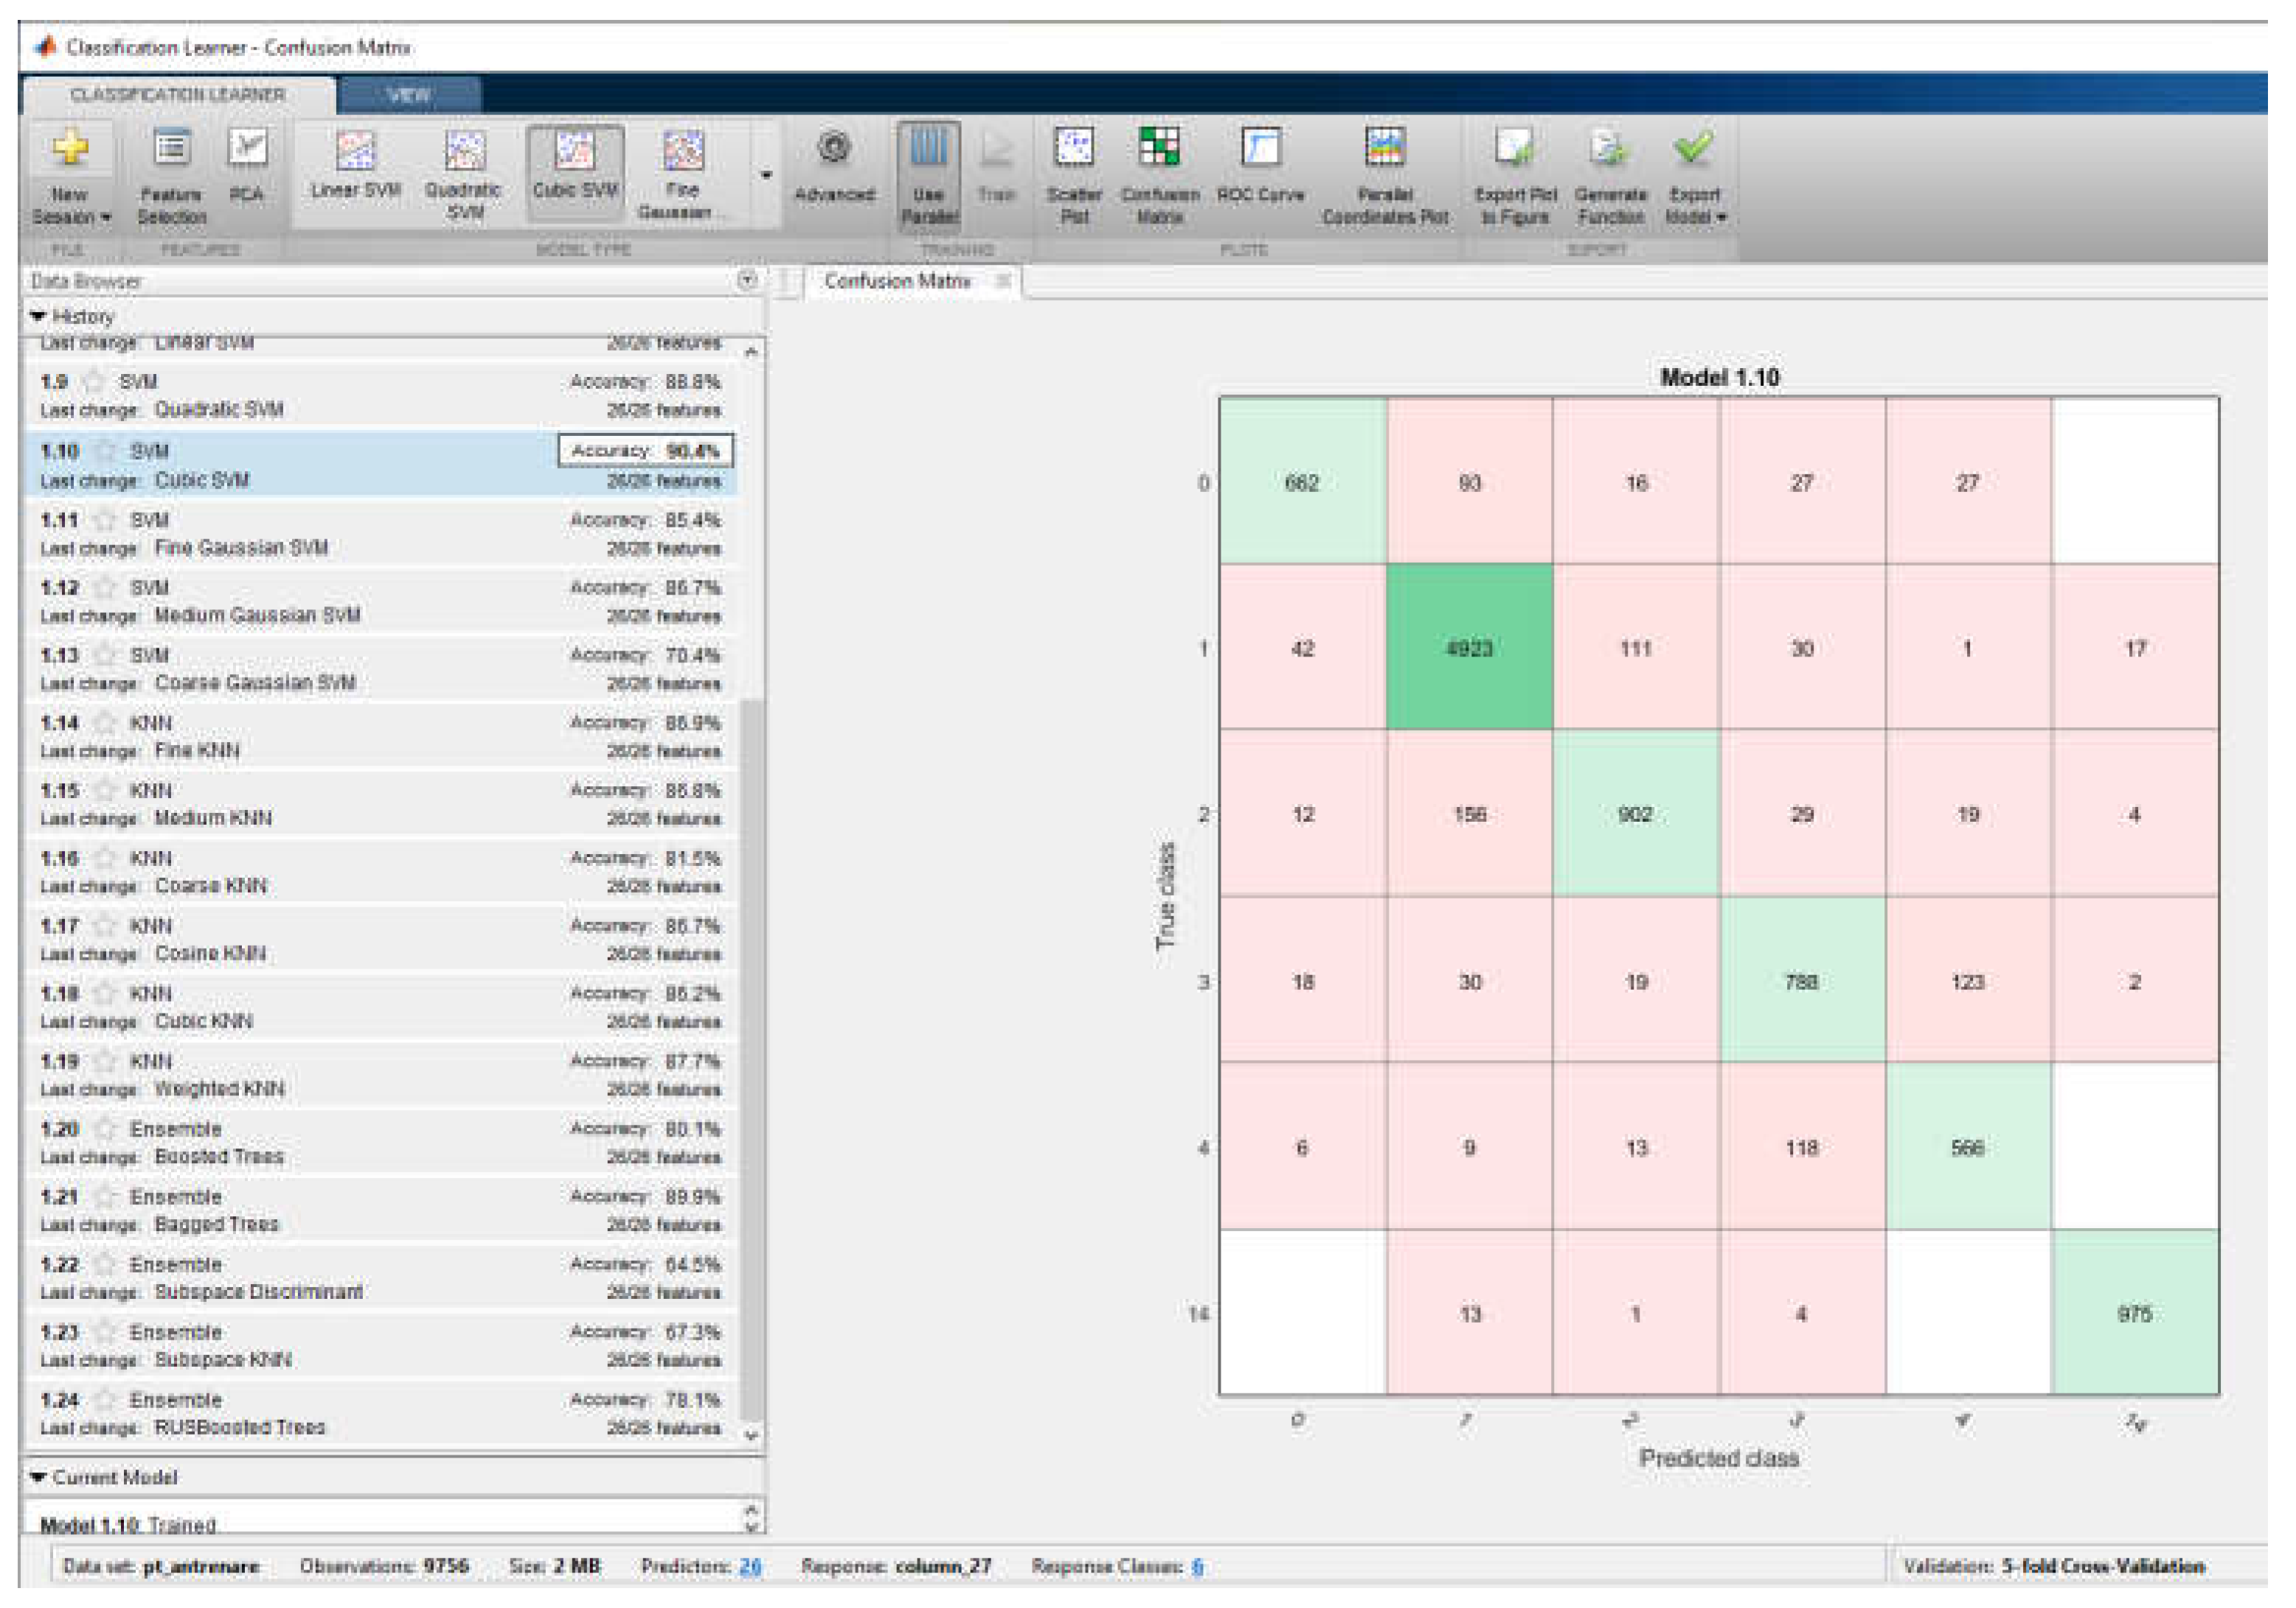
| normal, VF, VFL, VT, Noise, AFIB | ||
| 6 | 89.9% | Ensemble of classifiers |
| 6 | 85.4% | MLP |
| 6 | 90.4% | SVM |
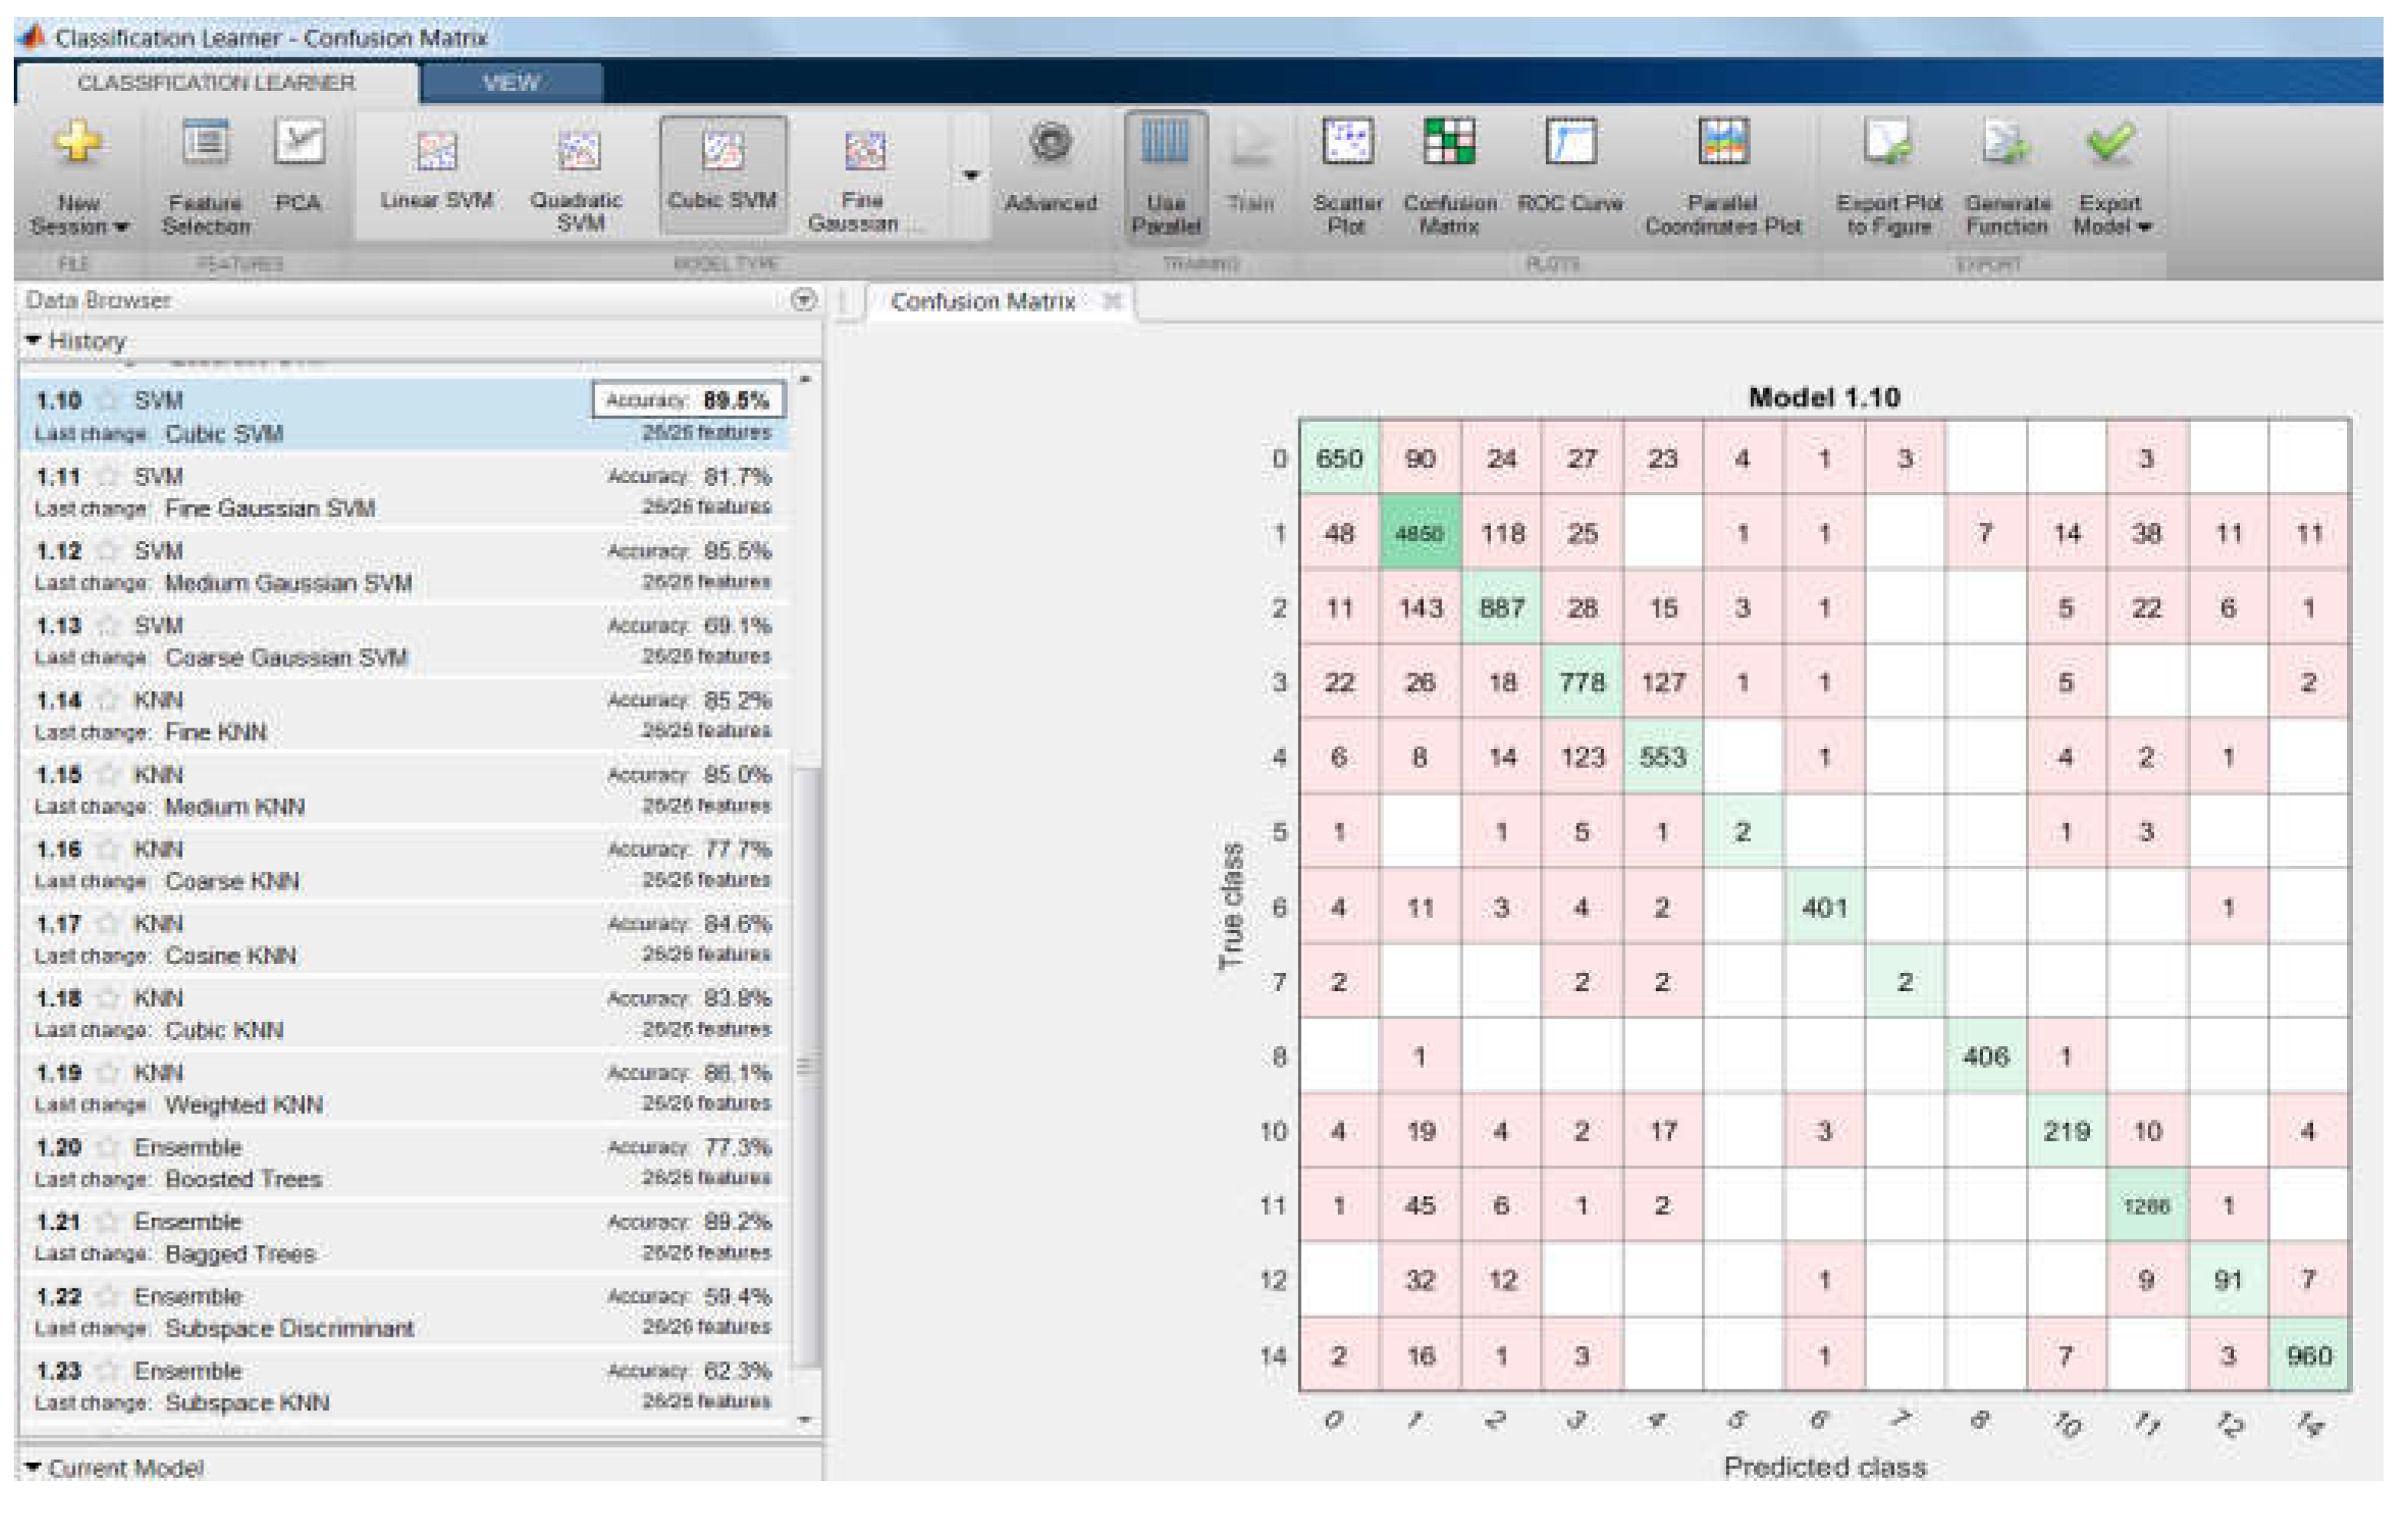
| All classes | ||
| 15 | 89.5% | Ensemble of classifiers |
| 15 | 86.4% | MLP |
| 15 | 89.2% | SVM |
| Aggregated ranks | ||
| AggRanks_weighted mean | AggRanks_mean | |
| Ensemble | 0.0377 | 0.4167 |
| MLP | 0.1027 | 1 |
| SVM | 0.0728 | 0.5833 |
| 5-Fold Cross-Validation | 10-Fold Cross-Validation | 20% Held Out | 30% Held Out | 40% Held Out | 50% Held Out |
|---|---|---|---|---|---|
| 89.8% | 90.1% | 90.2% | 90.2% | 88.8% | 88.8% |
| 20 min before VF Predicted class (Ensemble of classifiers 99.7%) Recall = 99.72%; Specificity = 99.67; Error Rate = 0.26%; Precision = 99.63%; F1 score = 99.56% | Predicted class | |||
| Normal | VF | |||
| True class | Normal | 1076 | 4 | |
| VF | 2 | 1196 | ||
| 30 min before VF Predicted class (Ensemble of classifiers 98.9%) Recall = 99.62%; Specificity = 98.36%; Error Rate = 1.05%; Precision = 98.15%; F1 score = 98.89% | Predicted class | |||
| Normal | VF | |||
| True class | Normal | 1060 | 20 | |
| VF | 4 | 1196 | ||
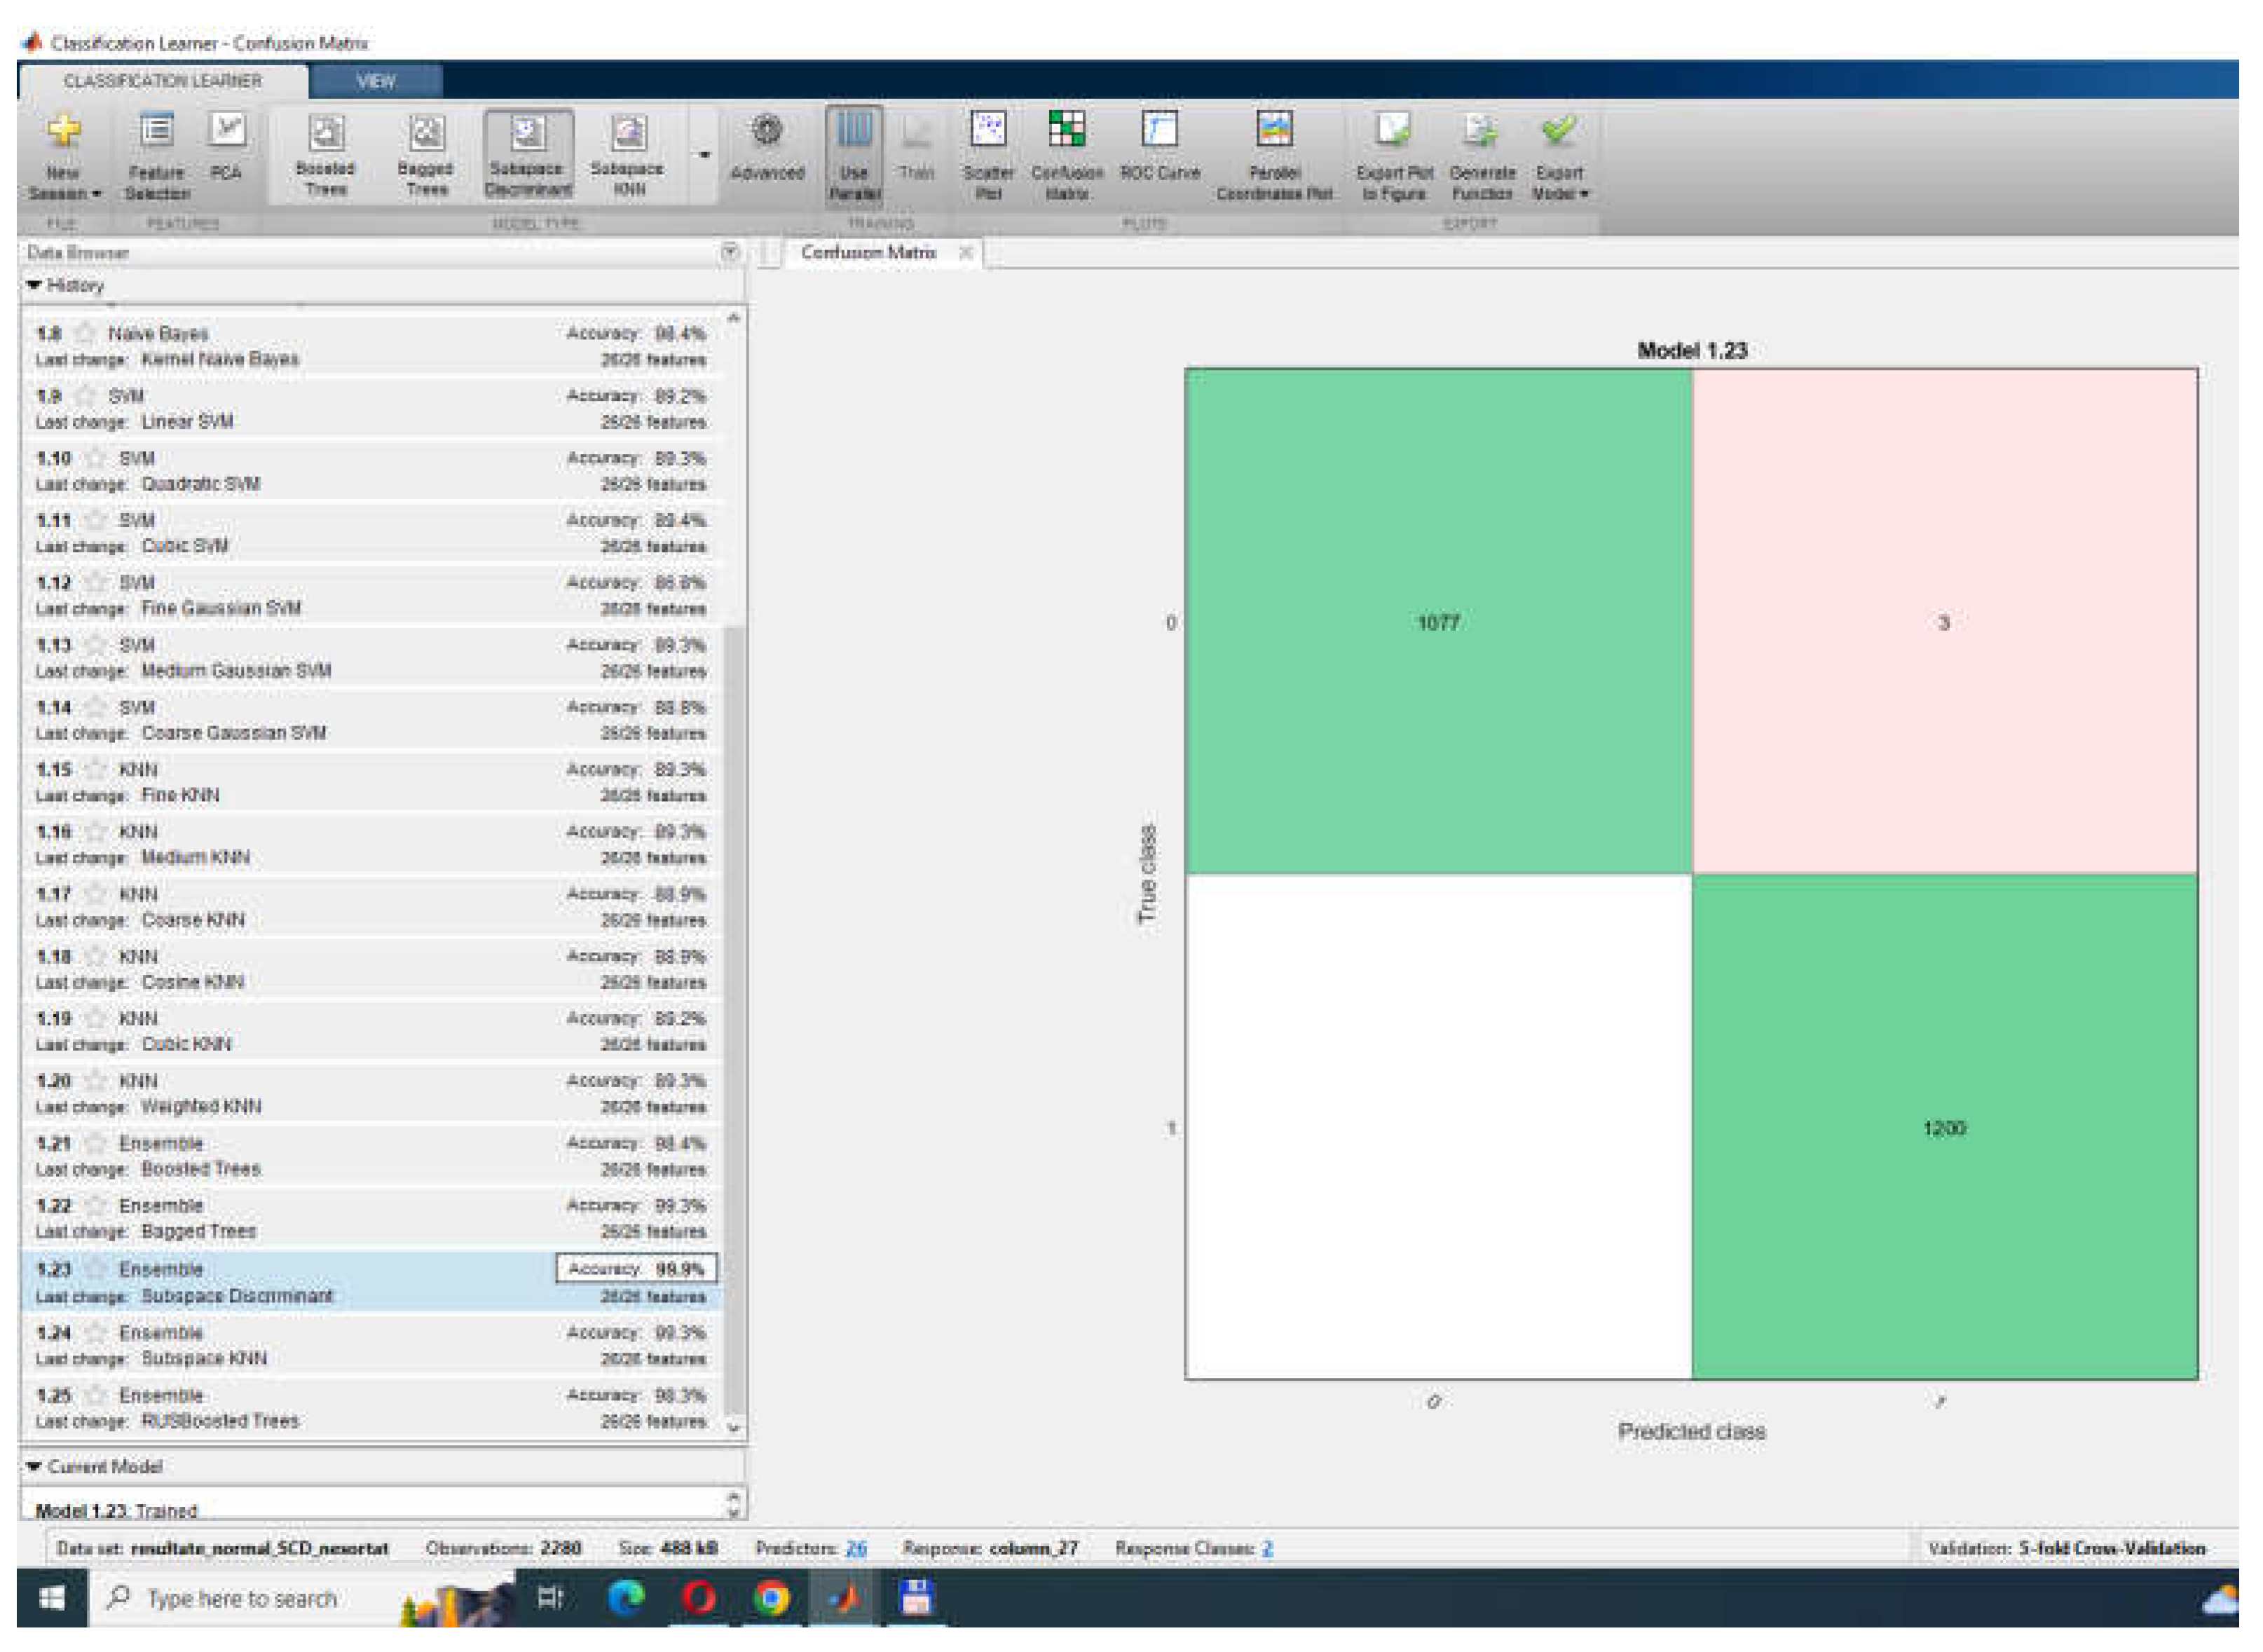
| 40 min before VF Predicted class (Ensemble of classifiers 99.9%) Recall = 100%; Specificity = 99.75%; Error Rate = 0.13%; Precision = 99.72%; F1 score = 99.72% | Predicted class | |||
| Normal | VF | |||
| True class | Normal | 1077 | 3 | |
| VF | 0 | 1200 | ||
| 50 min before VF Predicted class (Ensemble of classifiers 99.6%) Recall = 99.81%; Specificity = 99.42%; Error Rate = 0.39%; Precision = 99.35%; F1 score = 99.58% | Predicted class | |||
| Normal | VF | |||
| True class | Normal | 1073 | 7 | |
| VF | 2 | 1198 | ||
| 40 min before VF Predicted class (MLP = 95.3%) Recall = 94.29%; Specificity = 96.39%; Error Rate = 4.68%; Precision = 95.91%; F1 score = 95.28% | NSR and SCDH | Predicted class | ||
| Normal | VF | |||
| True class | Normal | 305 | 13 | |
| VF | 19 | 347 | ||
| 50 min before VF Predicted class (MLP = 96.1%) Recall = 92.28%; Specificity = 99.44%; Error Rate = 3.95%; Precision = 99.34%; F1 score = 95.55% | NSR and SCDH | Predicted class | ||
| Normal | VF | |||
| True class | Normal | 299 | 2 | |
| VF | 25 | 358 | ||
| 30 min before VF Predicted class (Ensemble of classifiers 86.7%) Recall = 86.94%; Specificity = 86.32%; Error Rate = 13.32%; Precision = 83.53%; F1 score = 85.07% | Only SCDH | Predicted class | ||
| Normal | VF | |||
| True class | Normal | 852 | 168 | |
| VF | 127 | 1073 | ||
| 40 min before VF Predicted class (Ensemble of classifiers 88.3%) Recall = 88.08%; Specificity = 88.41%%; Error Rate = 11.71%; Precision = 86.18%; F1 score = 87.06% | Only SCDH | Predicted class | ||
| Normal | VF | |||
| True class | Normal | 879 | 141 | |
| VF | 119 | 1081 | ||
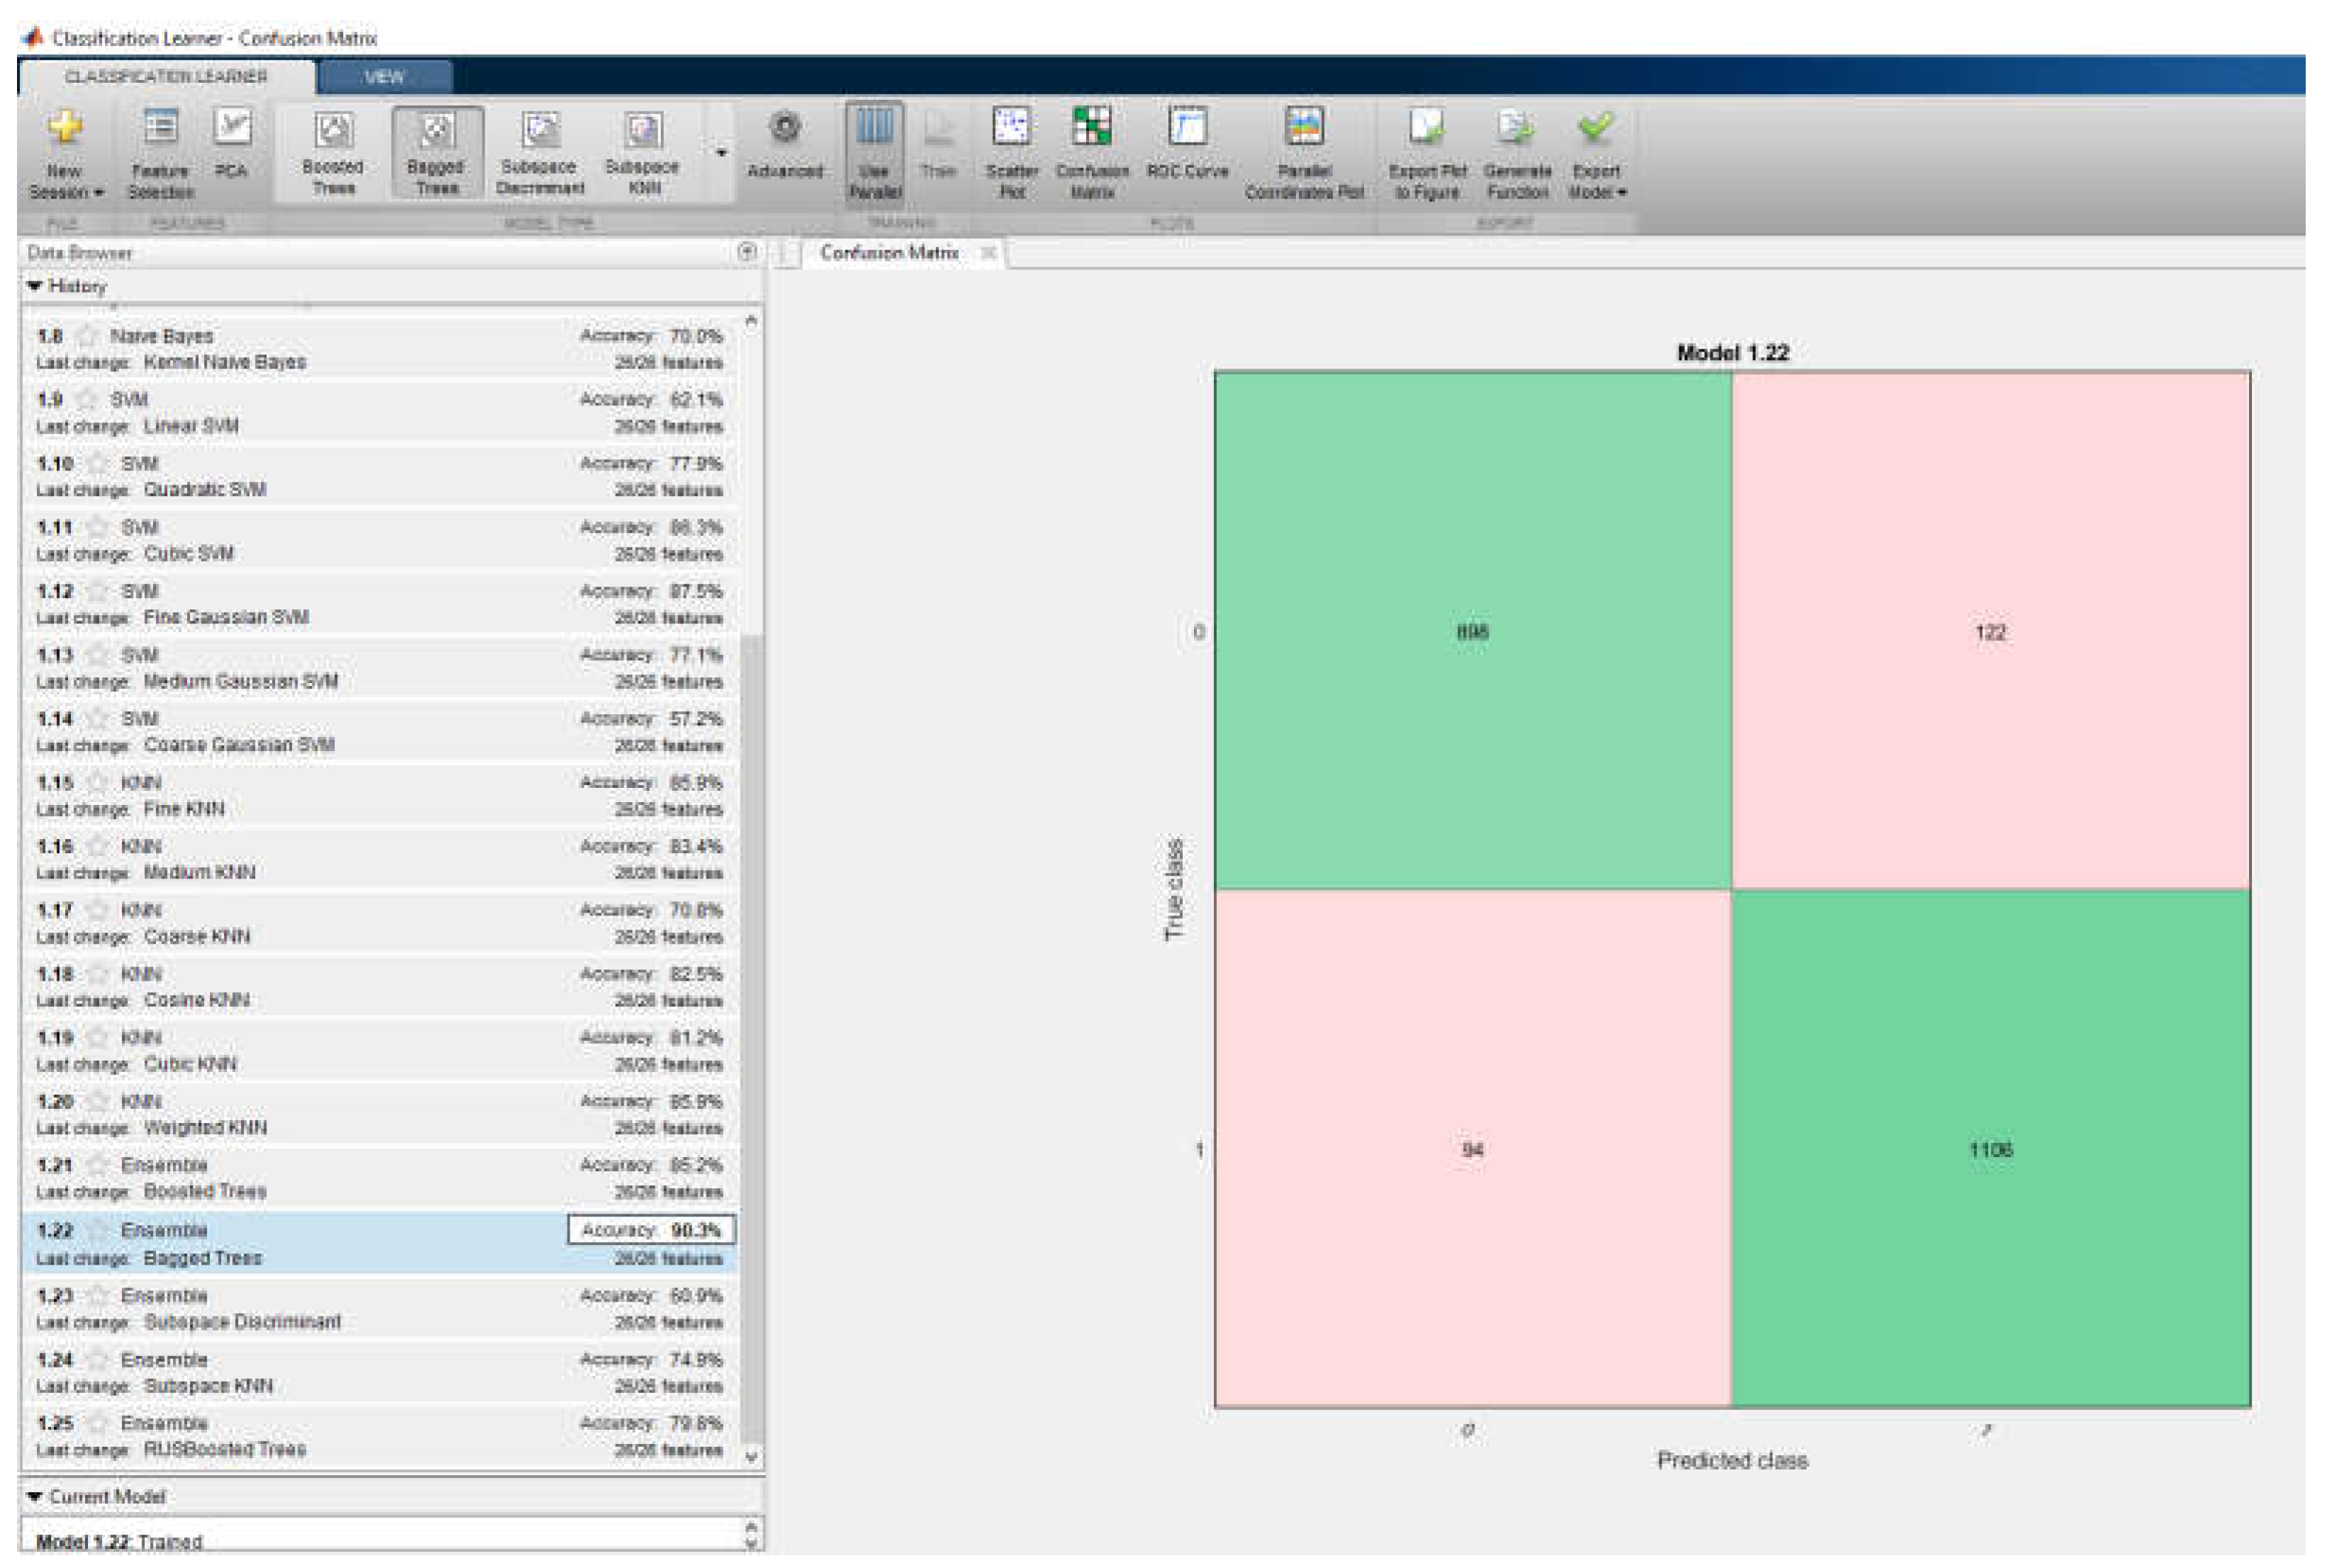
| 50 min before VF Predicted class (Ensemble of classifiers 90.3%) Recall = 90.52%; Specificity = 90.13%%; Error Rate = 9.73%; Precision = 88.04%; F1 score = 89.16% | Only SCDH | Predicted class | ||
| Normal | VF | |||
| True class | Normal | 898 | 122 | |
| VF | 94 | 1106 | ||
| MLP Configurations | Learning Rate | Classification Rate |
|---|---|---|
| MLP with hypermathematical optimization technique | ||
| 26–25–1 | 0.00382 | 86.3% |
| 26–33–1 | 0.00115 | 87.3% |
| 26–30–1 | 0.99815 | 87.1% |
| MLP without hypermathematical optimization technique | ||
| 25–10–1 | default | 87.3% |
| The Method | Sens % | Spec % | Acc % | Database |
|---|---|---|---|---|
| DETECTION of VF in this paper | ||||
| with MLP in 3 s | 91.8% | VFDB MIT-BIH | ||
| with ensemble of classifiers | 94.6% | VFDB MIT-BIH | ||
| With SVM | 94.2% | VFDB MIT-BIH | ||
| PREDICTION of VF in this paper | ||||
| with MLP—20 min in advance | 99.7% | NSR & SCDH MIT-BIH | ||
| with MLP—30 min in advance | 98.9% | NSR & SCDH MIT-BIH | ||
| with MLP—40 min in advance | 99.9% | NSR & SCDH MIT-BIH | ||
| with MLP—50 min in advance | 99.6% | NSR & SCDH MIT-BIH | ||
| with MLP—40 min in advance | 95.3% | NSR & SCDH MIT-BIH | ||
| with MLP—50 min in advance | 96.1% | NSR & SCDH MIT-BIH | ||
| with ensemble of classifiers—30 min in advance | 86.7% | SCDH MIT-BIH | ||
| with ensemble of classifiers—40 min in advance | 88.3% | SCDH MIT-BIH | ||
| with ensemble of classifiers—50 min in advance | 90.3% | SCDH MIT-BIH | ||
| with MLP with hiperparameters optimization | 87.3% | SCDH MIT-BIH | ||
| using Boltzmann [1] | 92.52 | MIT-BIH | ||
| using Discriminant Analysis [2] | 94.10 | 93.80 | AHA & MIT-BIH | |
| using Filter and Counts [3] | 94.40 | 95.90 | 94.70 | AHA & MIT-BIH |
| using Approximate Entropy [5] | 91.84 | 90.20 | 91.00 | MIT-BIH |
| using EMD & App Entropy [6] | 90.47 | 91.66 | 91.20 | MIT-BIH |
| using KNN [7] | 98.10 | 88.00 | 93.20 | MIT-BIH |
| using RBF [7] | 91.53 | 90.91 | 91.30 | MIT-BIH |
| using Fuzzy [8] | 90.90 | MIT-BIH | ||
| using TSK Fuzzy [9] | 93.30 | MIT-BIH | ||
| using Mamdani Fuzzy [9] | 86.60 | MIT-BIH | ||
| using Random Forest Classifier [12] | 95.04 | 94.78 | 94.79 | CU & MIT-BIH |
| using SVM [13] | 95.00 | 99.00 | CU & MIT-BIH | |
| using Binary Decision Tree [14] | 95.30 | 94.50 | 94.20 | CU & MIT-BIH |
| using SVM [14] | 90.40 | 91.60 | 89.30 | CU & MIT-BIH |
| using LS-SVM with RBF kernels [15] | 85.20 | 82.46 | 83.75 | CU & MIT-BIH |
| using Lempel-Ziv and EMD [19] | 98.15 | 96.01 | 97.10 | CU & MIT-BIH |
Disclaimer/Publisher’s Note: The statements, opinions and data contained in all publications are solely those of the individual author(s) and contributor(s) and not of MDPI and/or the editor(s). MDPI and/or the editor(s) disclaim responsibility for any injury to people or property resulting from any ideas, methods, instructions or products referred to in the content. |
© 2024 by the authors. Licensee MDPI, Basel, Switzerland. This article is an open access article distributed under the terms and conditions of the Creative Commons Attribution (CC BY) license (https://creativecommons.org/licenses/by/4.0/).
Share and Cite
Fira, M.; Costin, H.-N.; Goras, L. Prediction and Detection of Ventricular Fibrillation Using Complex Features and AI-Based Classification. Appl. Sci. 2024, 14, 3050. https://doi.org/10.3390/app14073050
Fira M, Costin H-N, Goras L. Prediction and Detection of Ventricular Fibrillation Using Complex Features and AI-Based Classification. Applied Sciences. 2024; 14(7):3050. https://doi.org/10.3390/app14073050
Chicago/Turabian StyleFira, Monica, Hariton-Nicolae Costin, and Liviu Goras. 2024. "Prediction and Detection of Ventricular Fibrillation Using Complex Features and AI-Based Classification" Applied Sciences 14, no. 7: 3050. https://doi.org/10.3390/app14073050
APA StyleFira, M., Costin, H.-N., & Goras, L. (2024). Prediction and Detection of Ventricular Fibrillation Using Complex Features and AI-Based Classification. Applied Sciences, 14(7), 3050. https://doi.org/10.3390/app14073050