
A Stay Cable Icing Identification Method Based on the Fusion of U-Net and ResNet50

Abstract
1. Introduction
- (1)
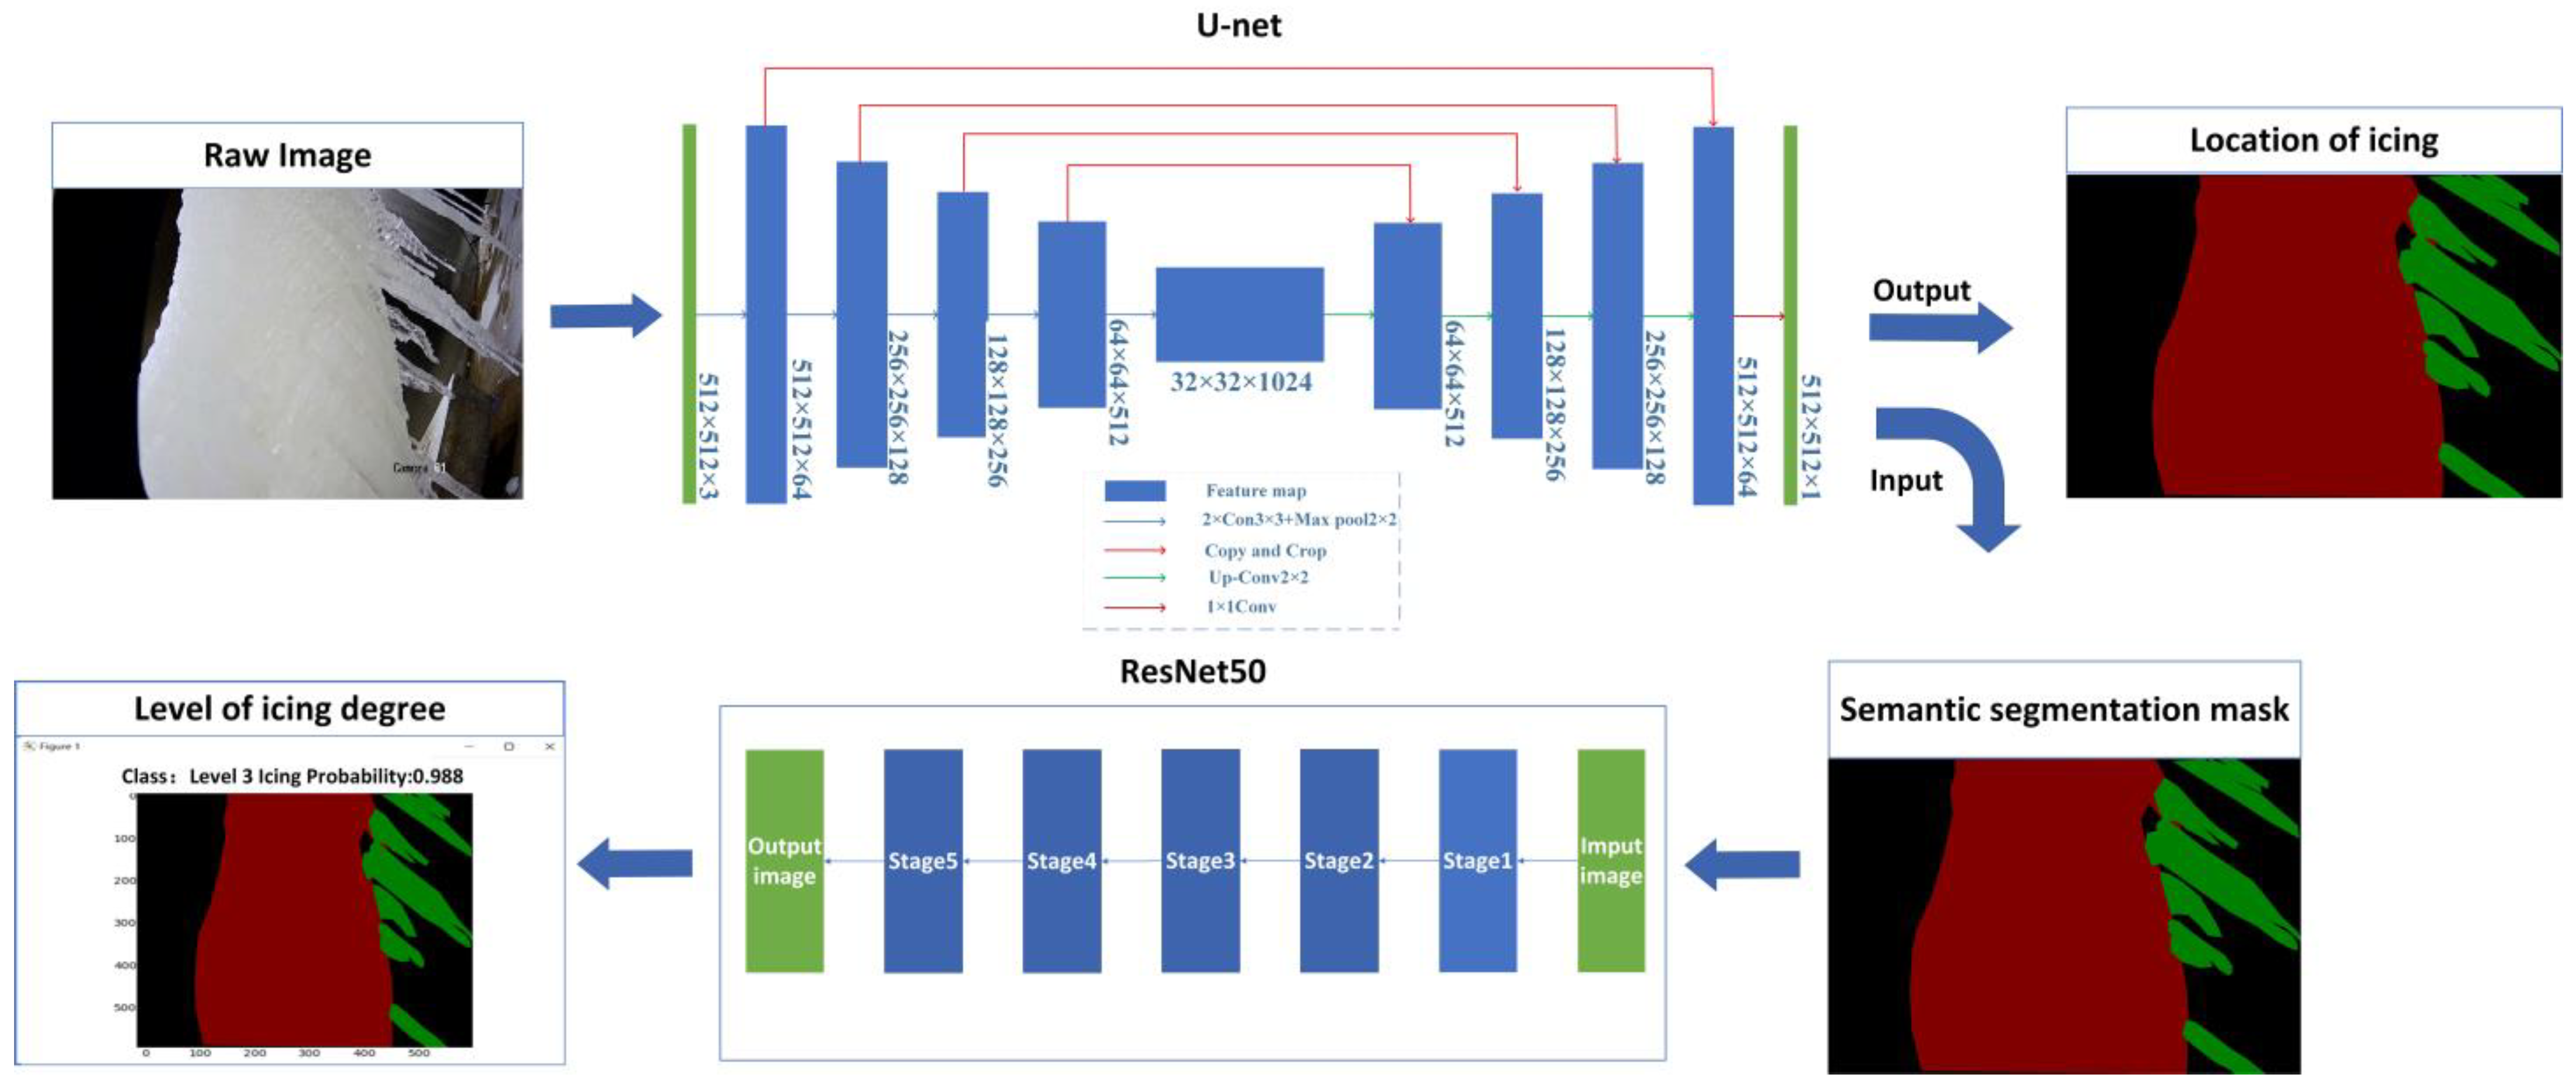
- A stay cable icing identification model with a two-stage architecture was proposed based on deep learning. This model achieved the accurate segmentation of the surface ice and icicles and the classification of icing degree grade, which provided a basis for the precise deicing of the stay cable deicing robot.
- (2)
- An icing degree grade classification method was proposed. The method calculates the mask area and uses it as a label to input into the classification network. Compared with the direct use of mask area to classify the icing level, this method improved the generalization ability [21].
- (3)
- The cable icing data set was made, which makes up for the vacancy in this field.
2. The Establishment of the Cable Icing Data Set
2.1. Experiment Preparation
2.1.1. Experimental Equipment
- The step-in laboratory had constant humidity and temperature; the model was RH-60 (Andersen Instrument Equipment Co., Ltd., Wuhan, China), with an external size of 10 m × 5 m × 2.8 m and a temperature range of −60. The height of the rainfall device (Andersen Instrument Equipment Co., Ltd., Wuhan, China) was 2400 mm, the upper width was 2000 mm, and the three spray devices were evenly distributed. The spray flow range was 0~3 L/min, and the water temperature control range was 0.5~2 °C.
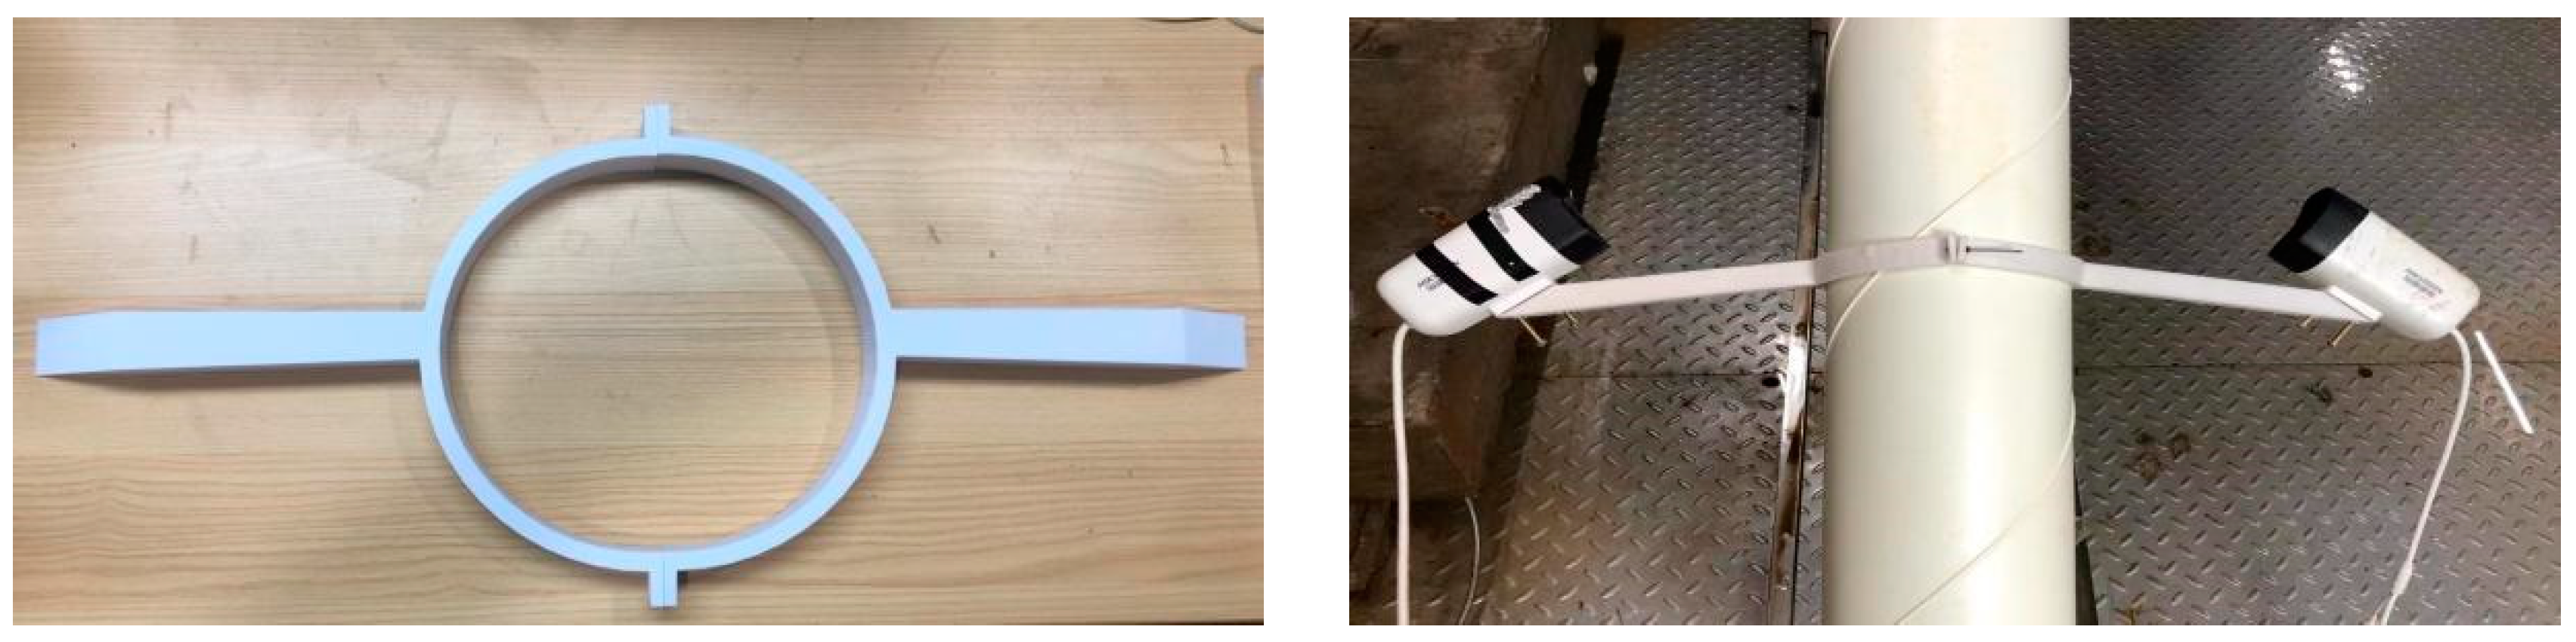
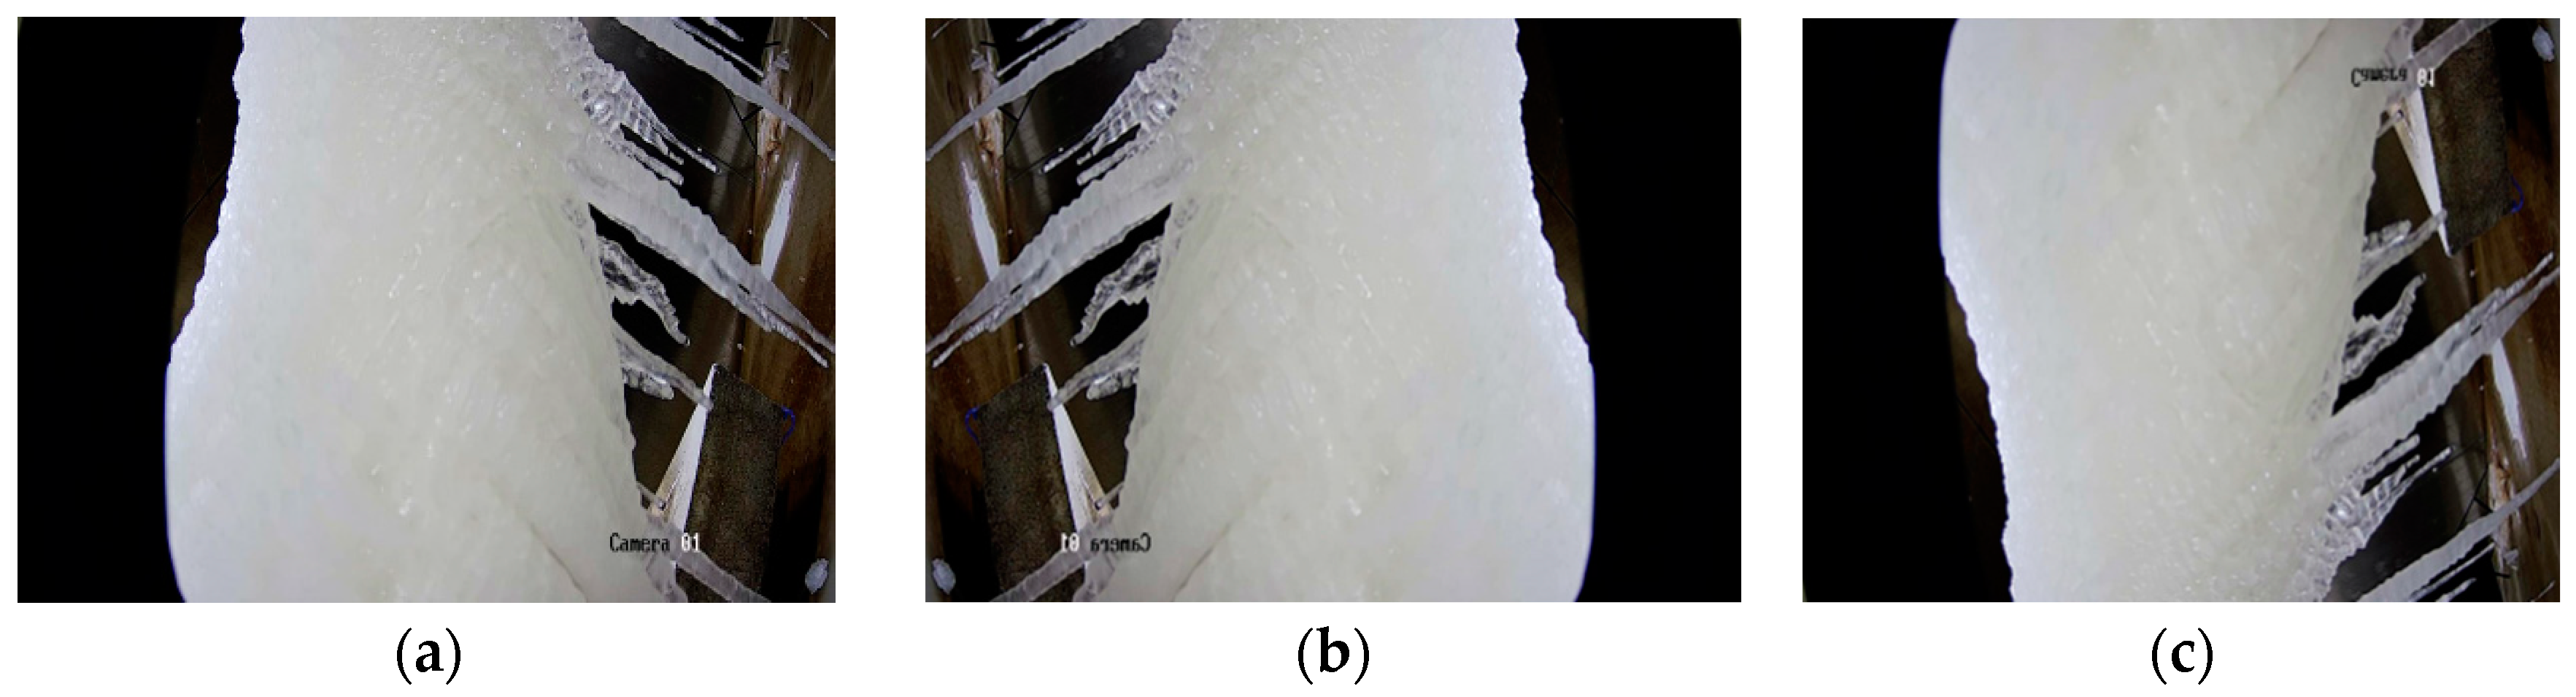
- The camera fixed bracket (Made by a 3D printer Andersen Instrument Equipment Co., Ltd., Wuhan, China) simulated the perspective of the stay cable deicing robot, as shown in Figure 1. The size was 21 cm × 5 cm × 10 cm (diameter × thickness × length). The two cameras were connected by a 10 cm pole and the horizontal angle between the camera and the cable was set to 30°. Through two cameras, the degree of icing on one side of the stay cable can be judged separately, and the diversity of the data set can be increased.
- A practical engineering stay cable sheath with a diameter of 0.2 m, a wall thickness of 0.005 m, and a length of 2 m was used, and the sheath was smooth and hydrophobic.
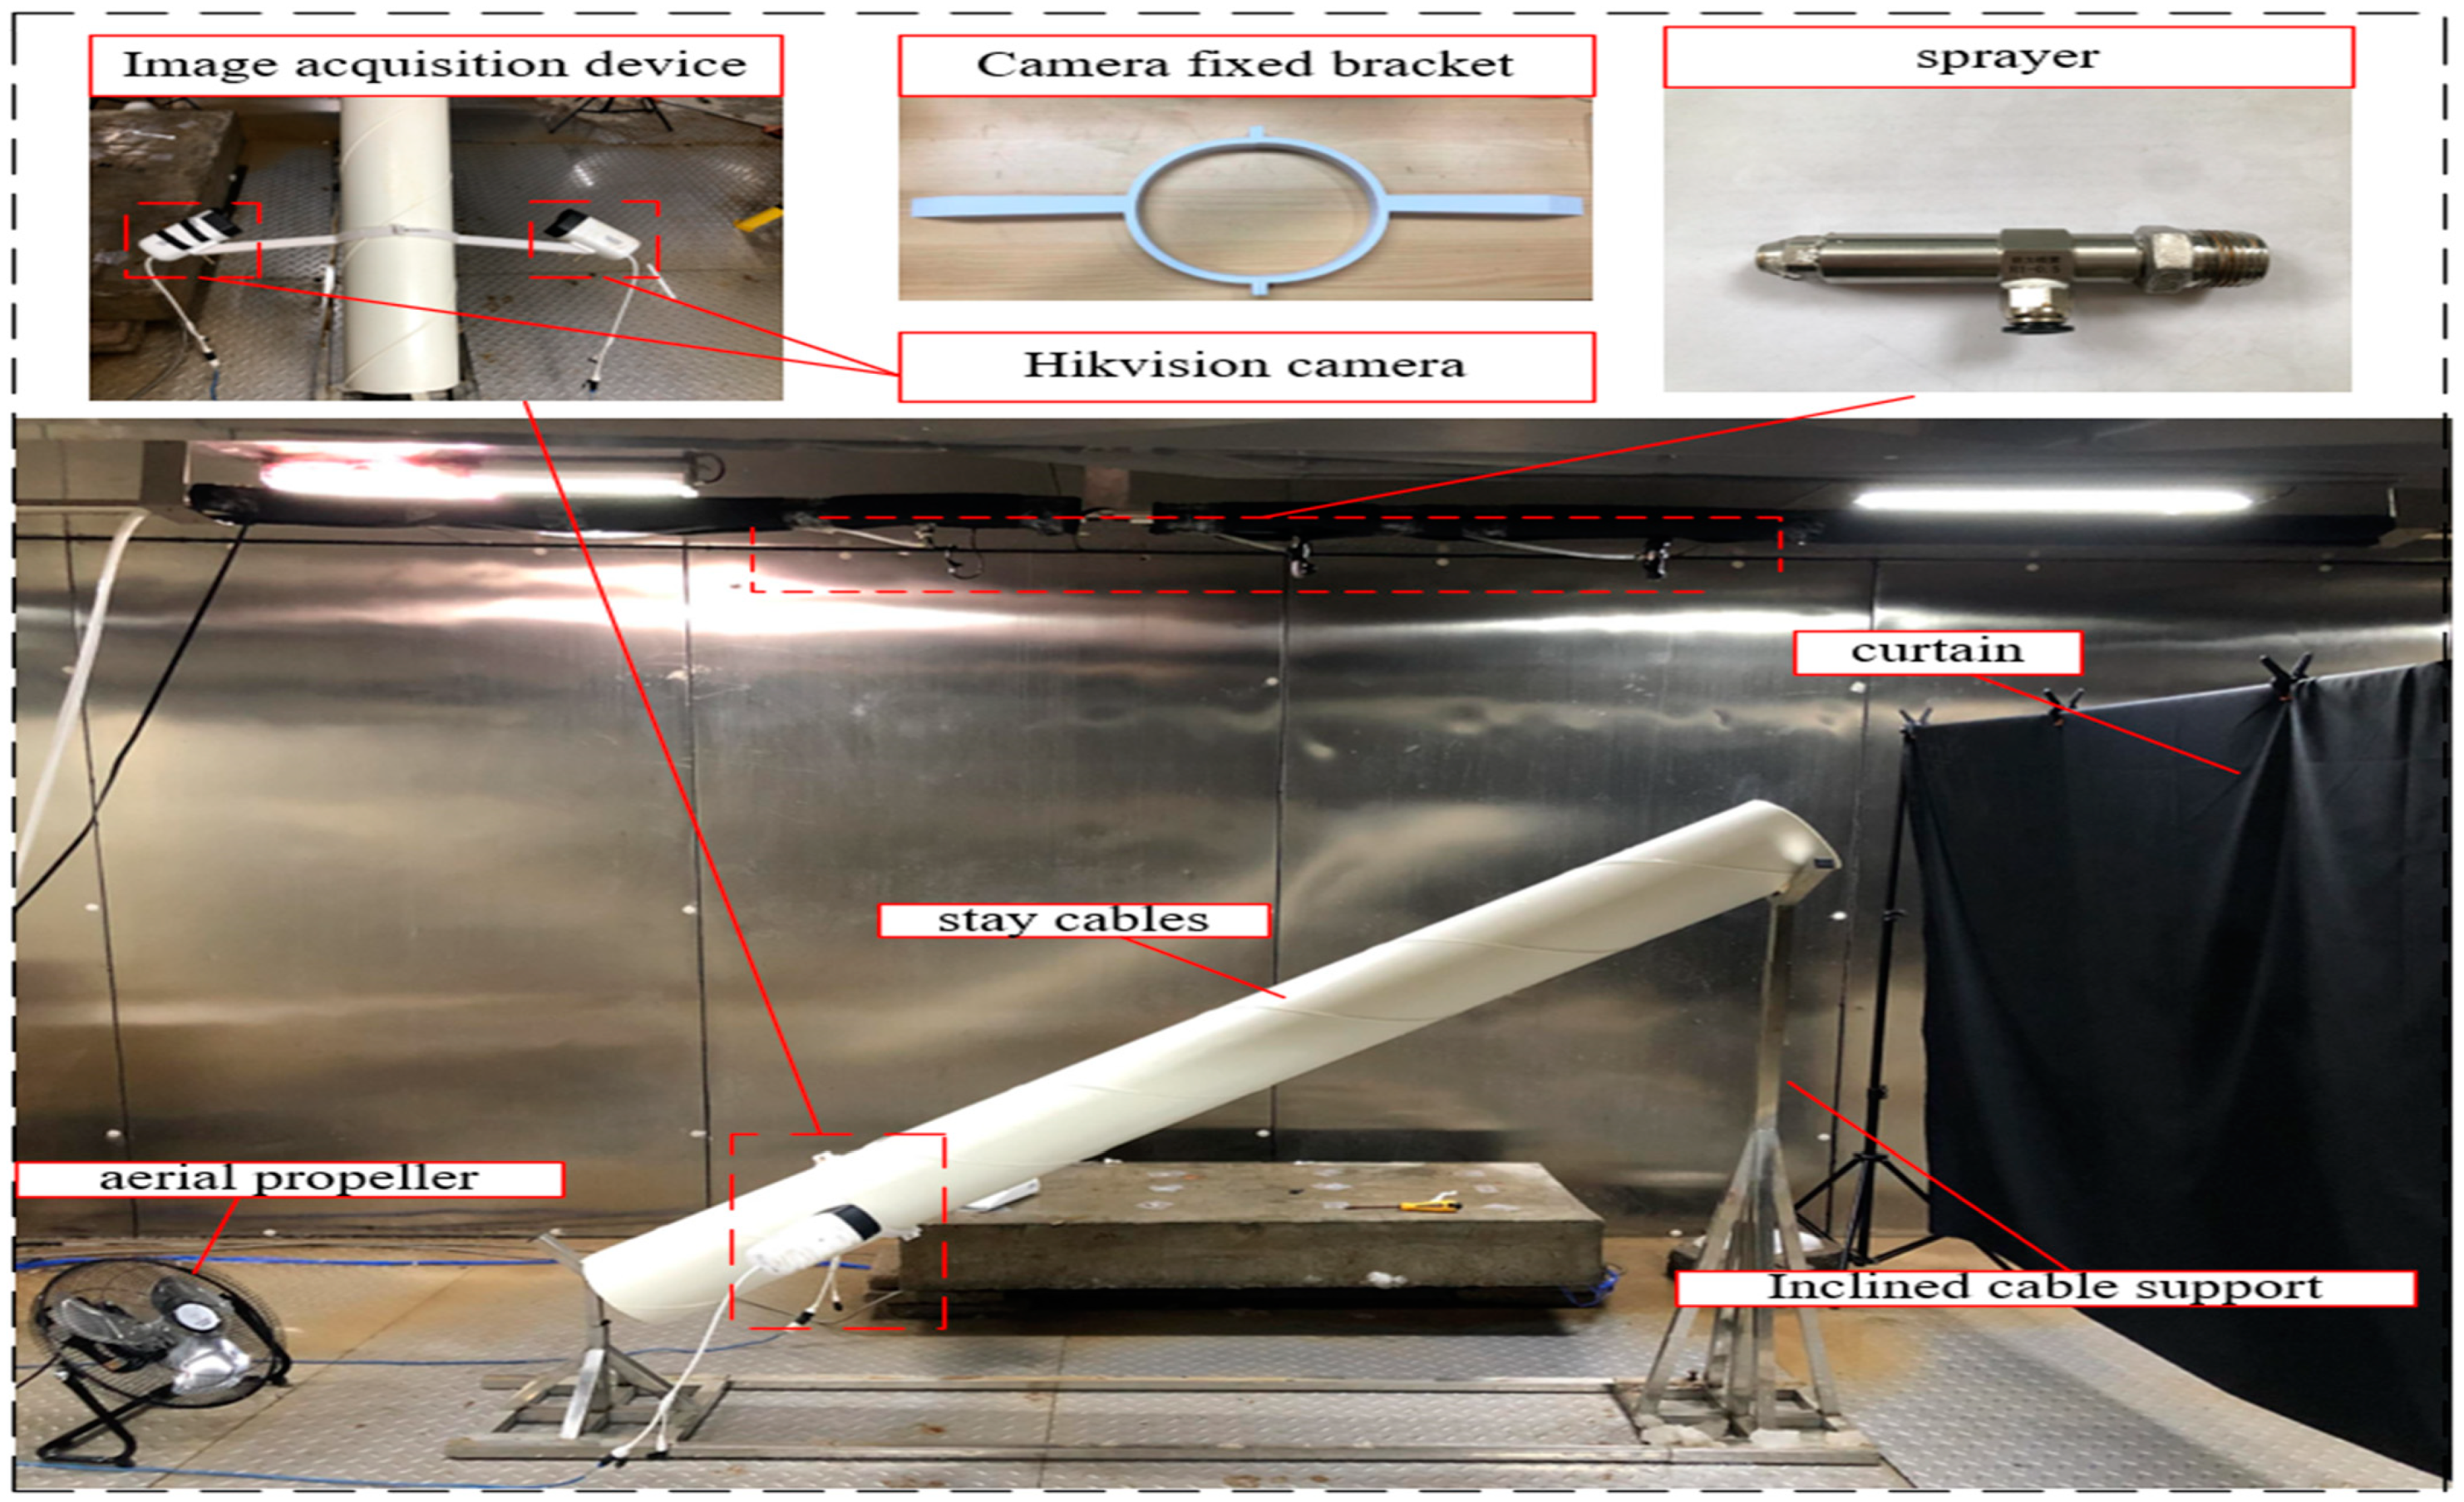
- Other equipment used in this experiment included a meteorological instrument (Beijing Sun Technology Co., Ltd., Wuhan, Chain), a cable-stayed bracket with adjustable angle, a fan, two Hikvision network cameras (DS-IPC-B12V2-1) (HIKVISION Co., Ltd., Zhejiang, Chain), and an anemometer, as shown in Figure 2 (stay cable ice experimental equipment).
2.1.2. Experimental Conditions of Stay Cable Icing
- (1)
- Environmental temperature: The minimum temperature of Wuhan in the past five years was −8 °C, and the classic icing environment of the bridge is −4 °C. Therefore, this paper assumes that the ambient temperature is −8 °C and −4 °C.
- (2)
- Wind speed: The dominant wind direction in winter is northwest wind. In this experiment, a fan was set in the direction the of northwest wind, and its wind speed was set to 2 m/s.
- (3)
- Cooling time: This experiment selected the cooling time from 3:00 a.m. to 6:00 a.m. (3 h). After cooling, the indoor temperature was adjusted to 2 °C until the ice was completely melted, and the complete icing and melting process was recorded.
- (4)
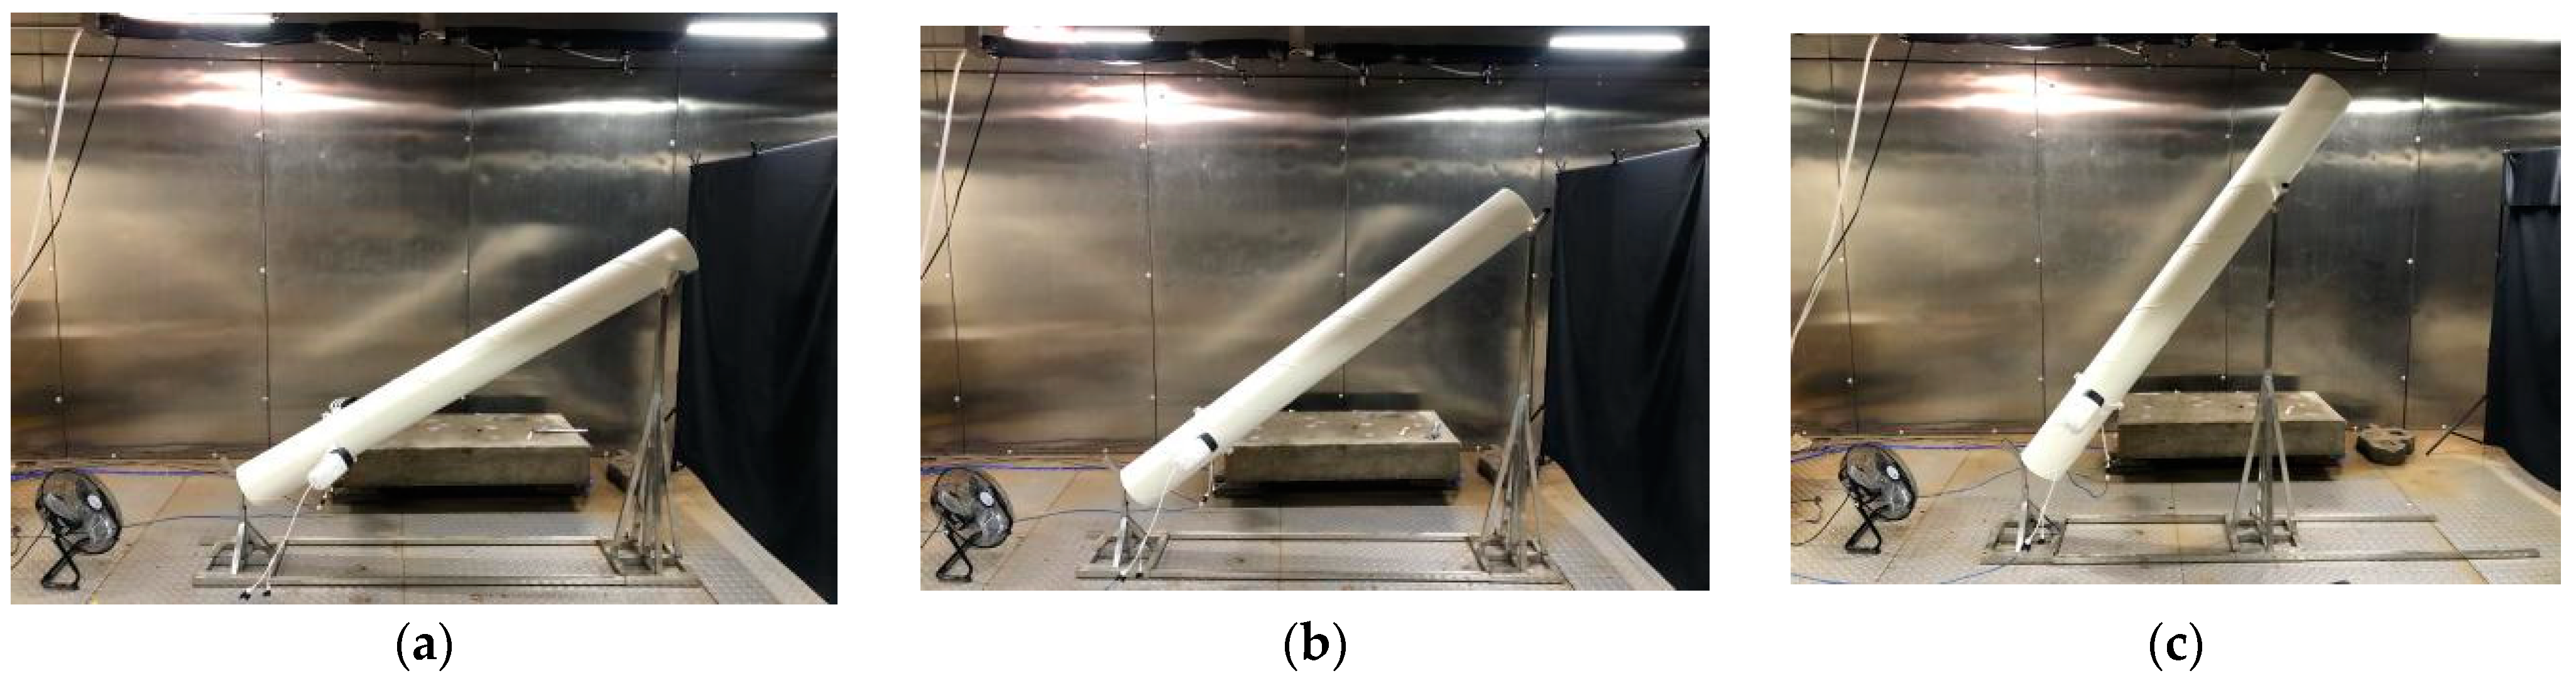
- The inclination angle of the stay cable sleeve: The previous research data found that the ice thickness of the stay cable decreases with the increase in the inclination angle of the stay cable. Therefore, to make the network model more robust, the scaffold inclination angle was adjusted to 30°, 45°, and 60°, and the stay cable sleeve was placed according to the adjusted angle.
2.1.3. Experimental Steps of Stay Cable Icing
- (1)
- Before the experiment, the spray water was purified to prevent clogging the nozzle. Secondly, the spray water temperature was reduced to 0.5 °C.
- (2)
- The stay cable sheath was arranged under the nozzle. After the inclination angle of the scaffold was adjusted to 30°, 45°, and 60°, the stay cable sleeve was placed according to the adjusted angle, as shown in Figure 3.
- (3)
- The constant temperature and humidity laboratory refrigeration was activated to maintain the indoor temperature constant at −8°C and −4 °C, and the camera was turned on.
- (4)
- The rainfall device simulated rainfall with a spray flow rate set to 3 L per minute. The water temperature in the spray was 0.5 degrees Celsius. Simultaneously, the fan was turned on as required.
- (5)
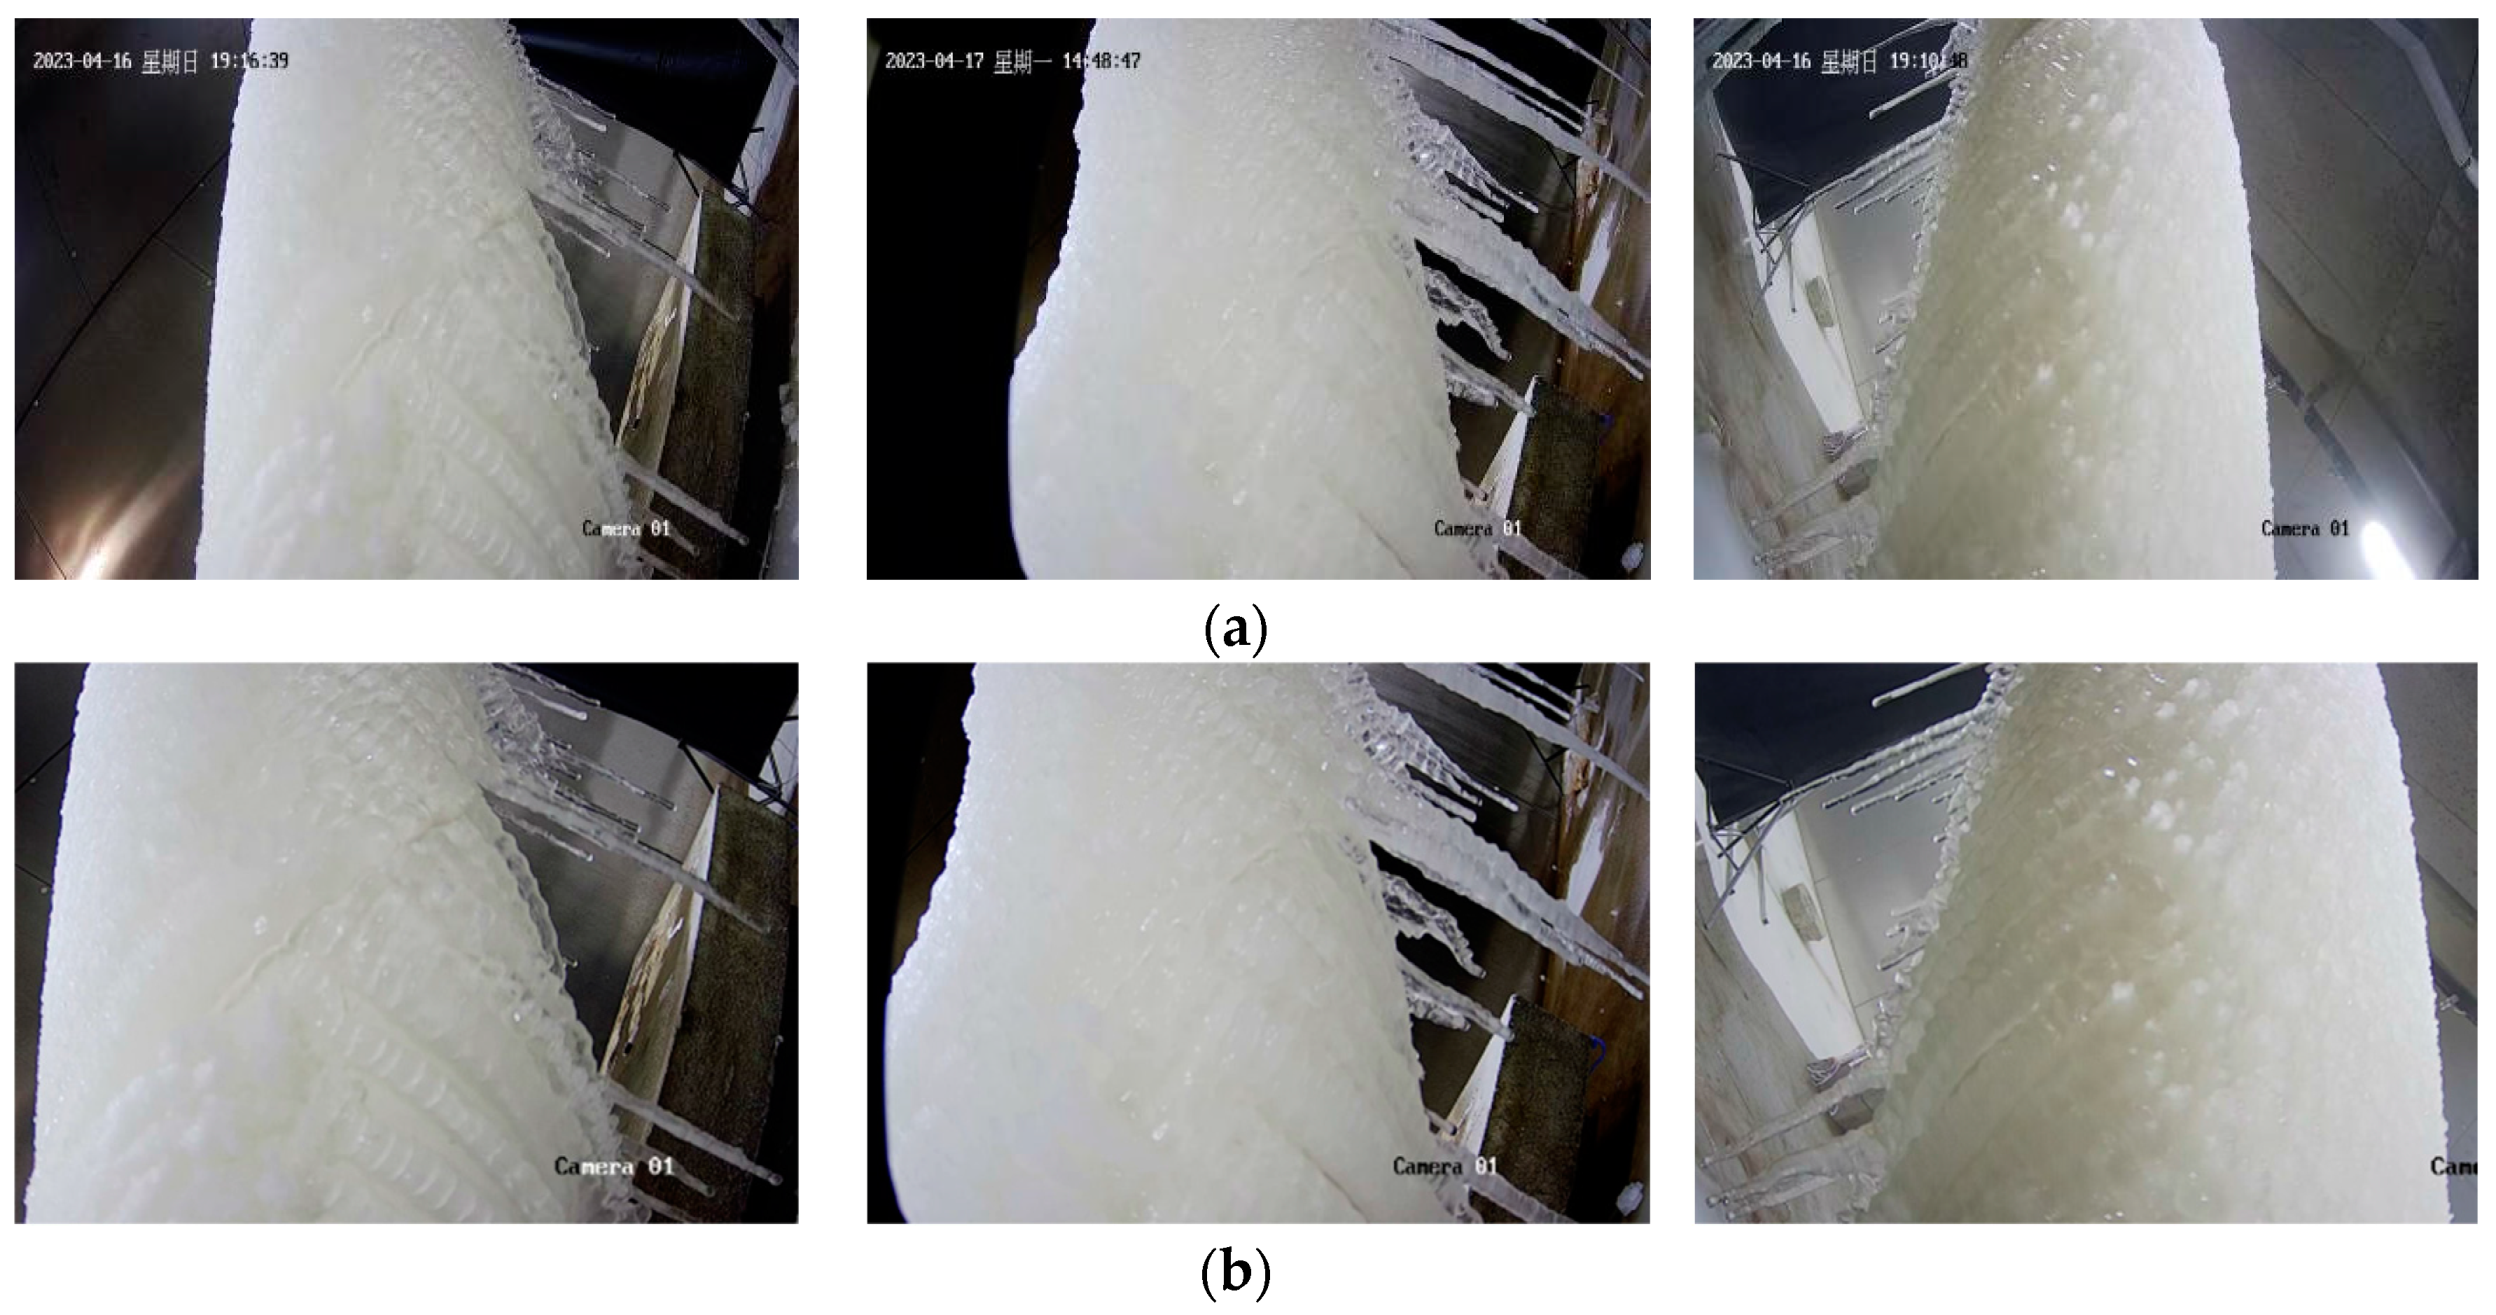
- The spraying was stopped after three hours, the cooling process was halted, and the temperature was adjusted to 2 degrees Celsius. This temperature was maintained until all the ice had completely melted, while the entire freezing and melting process was recorded using a camera.
- (6)
- The inclined tension cables were dried to prepare them for the next set of experiments.
2.2. Data Processing
2.3. Data Enhancement
2.4. Image Classification Data Labels
3. Two-Stage Model
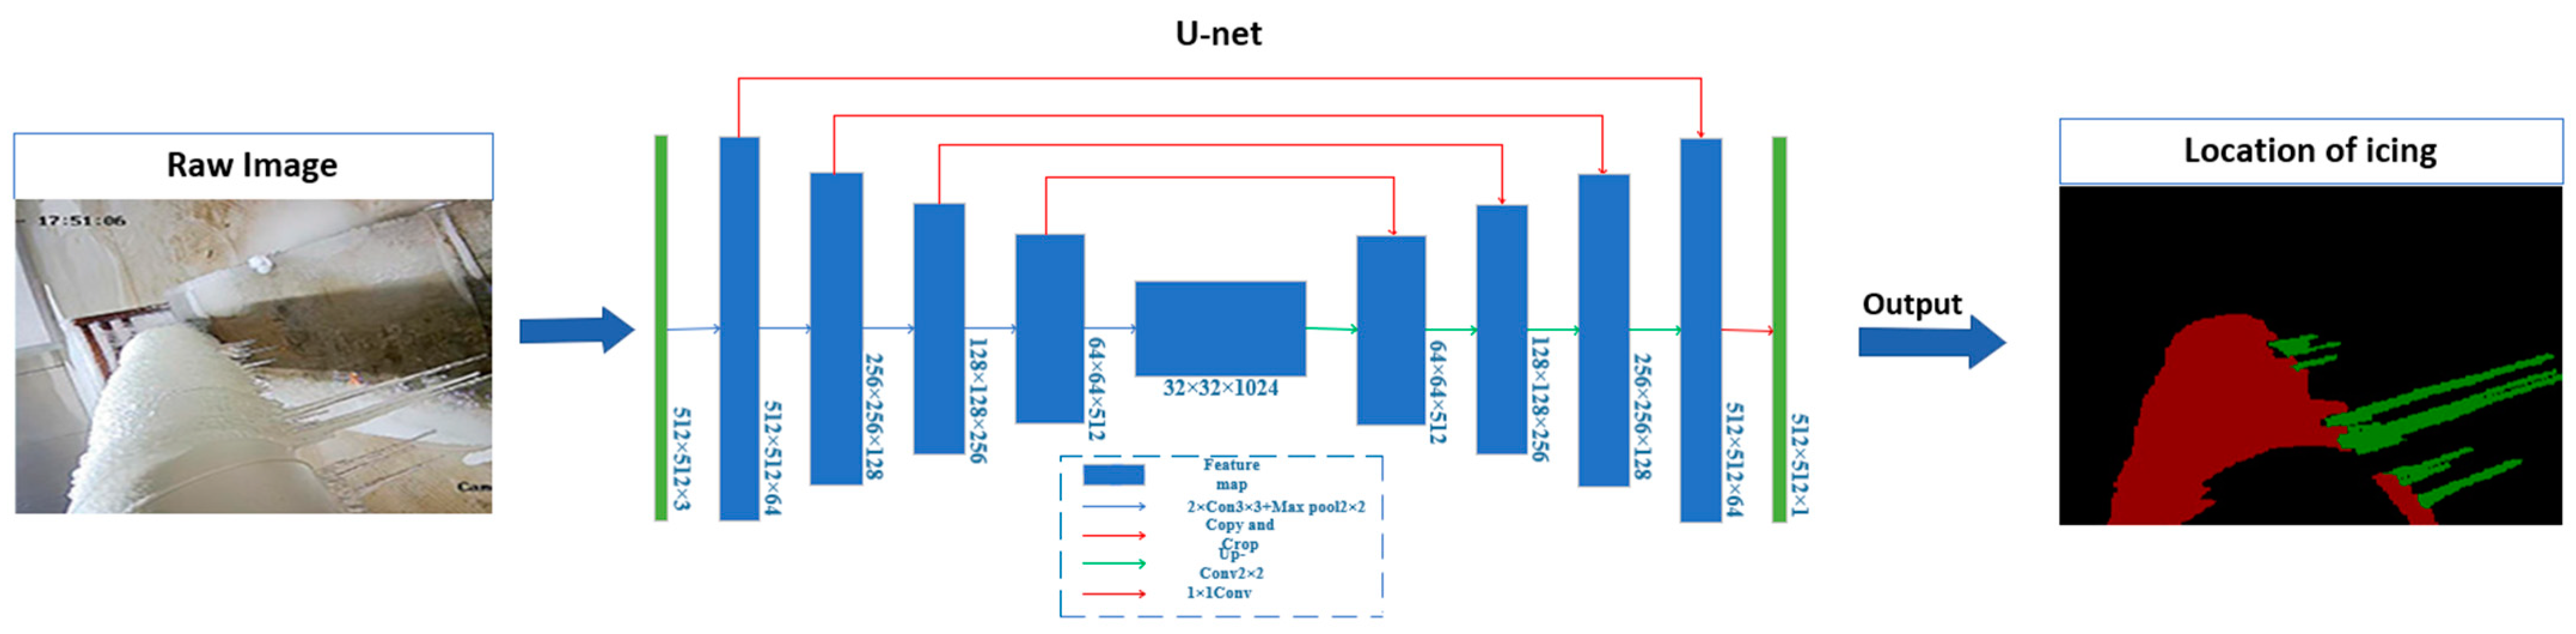
3.1. The First-Stage Model: U-Net
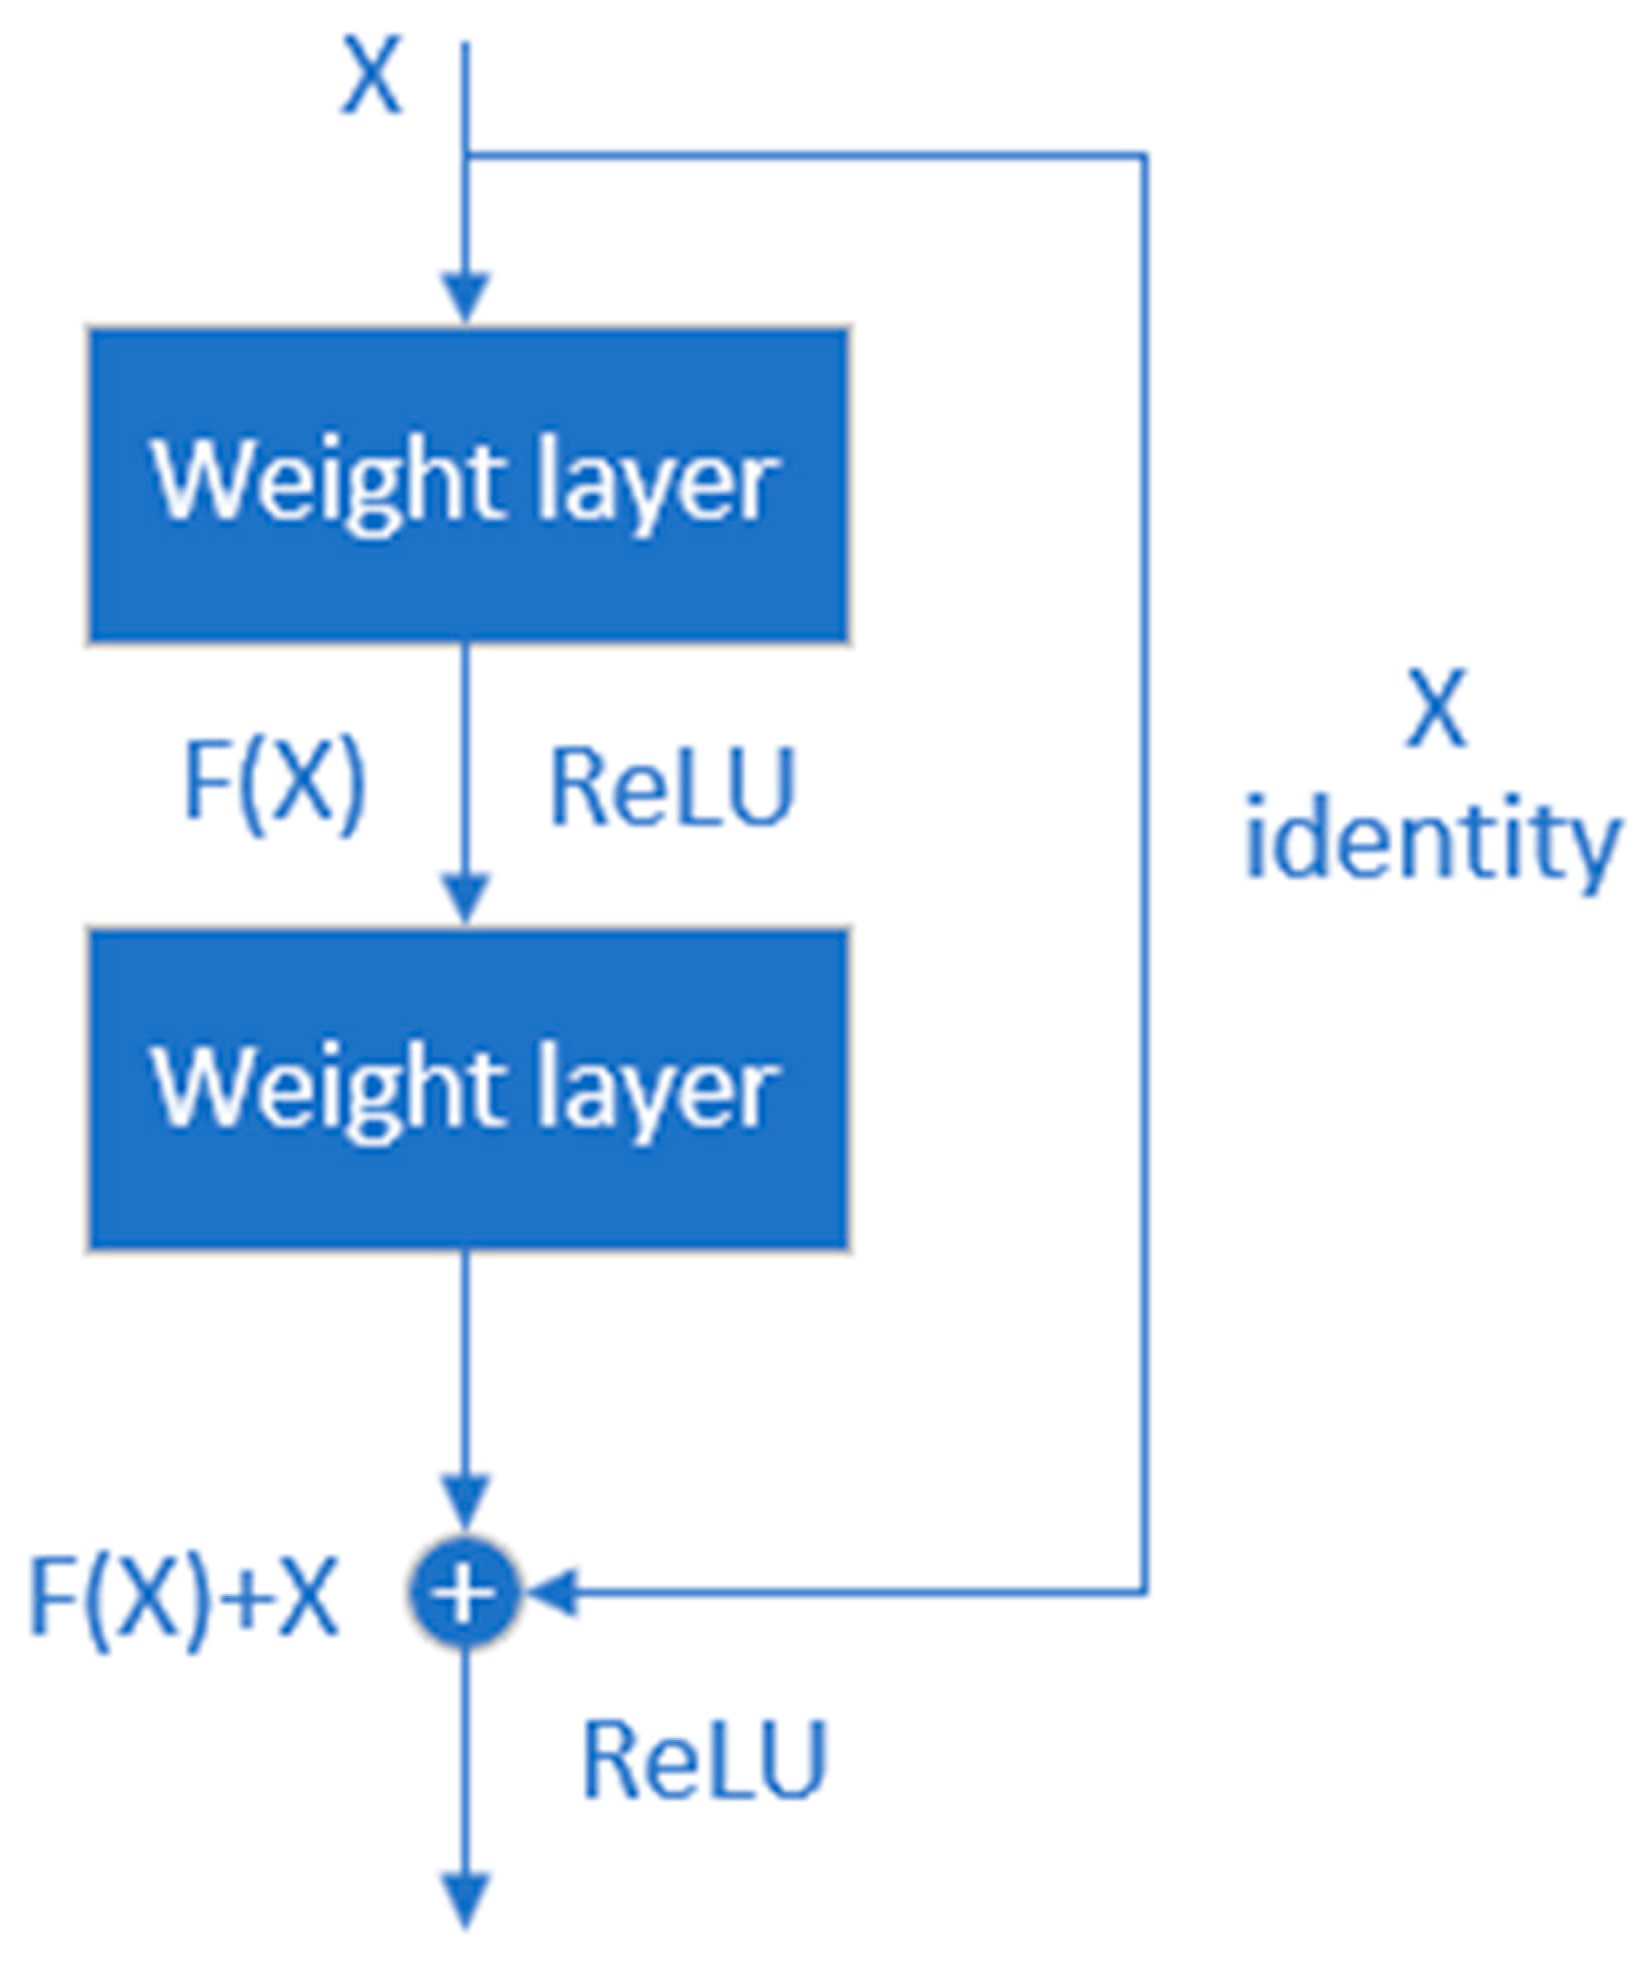
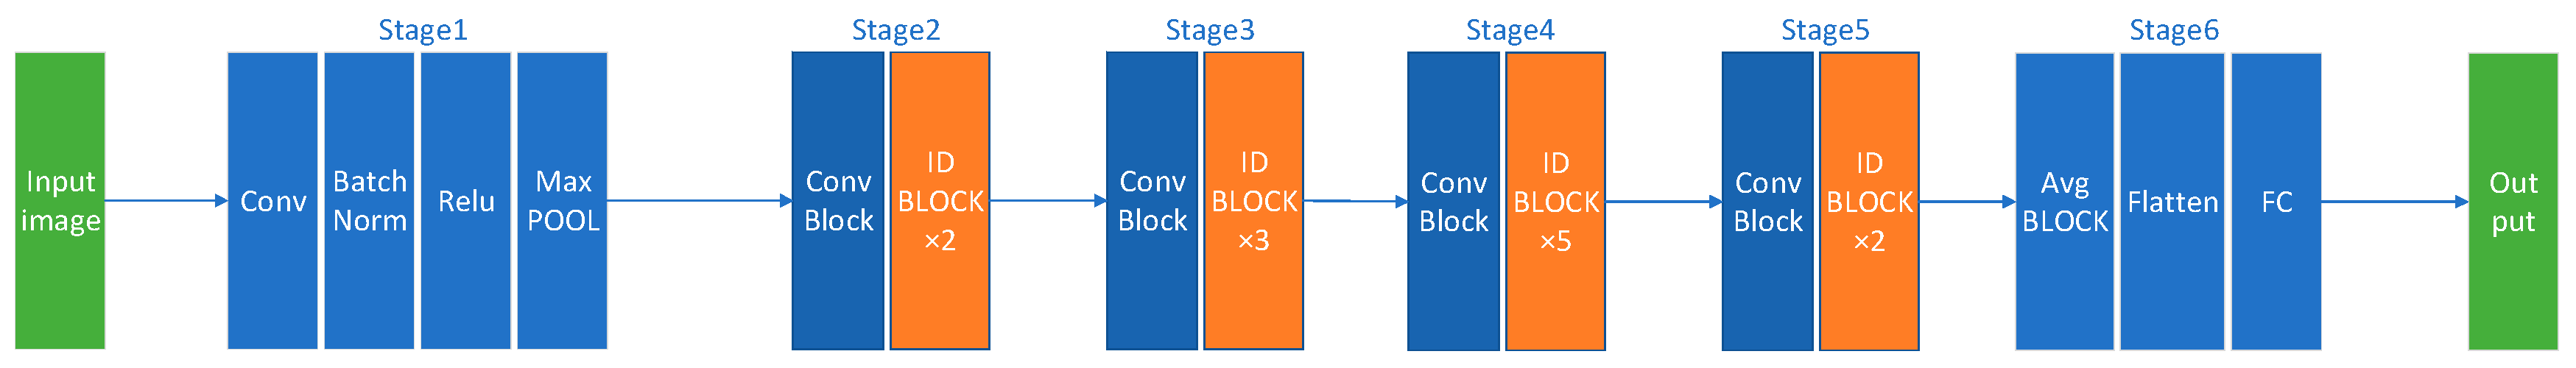
3.2. The Second-Stage Model: ResNet50
3.3. The Stay Cable Icing Recognition Framework
4. Experiment
4.1. Experiment Description
4.1.1. Data and Computation Source
4.1.2. Evaluation Indicators
4.2. Experimental Results and Analysis
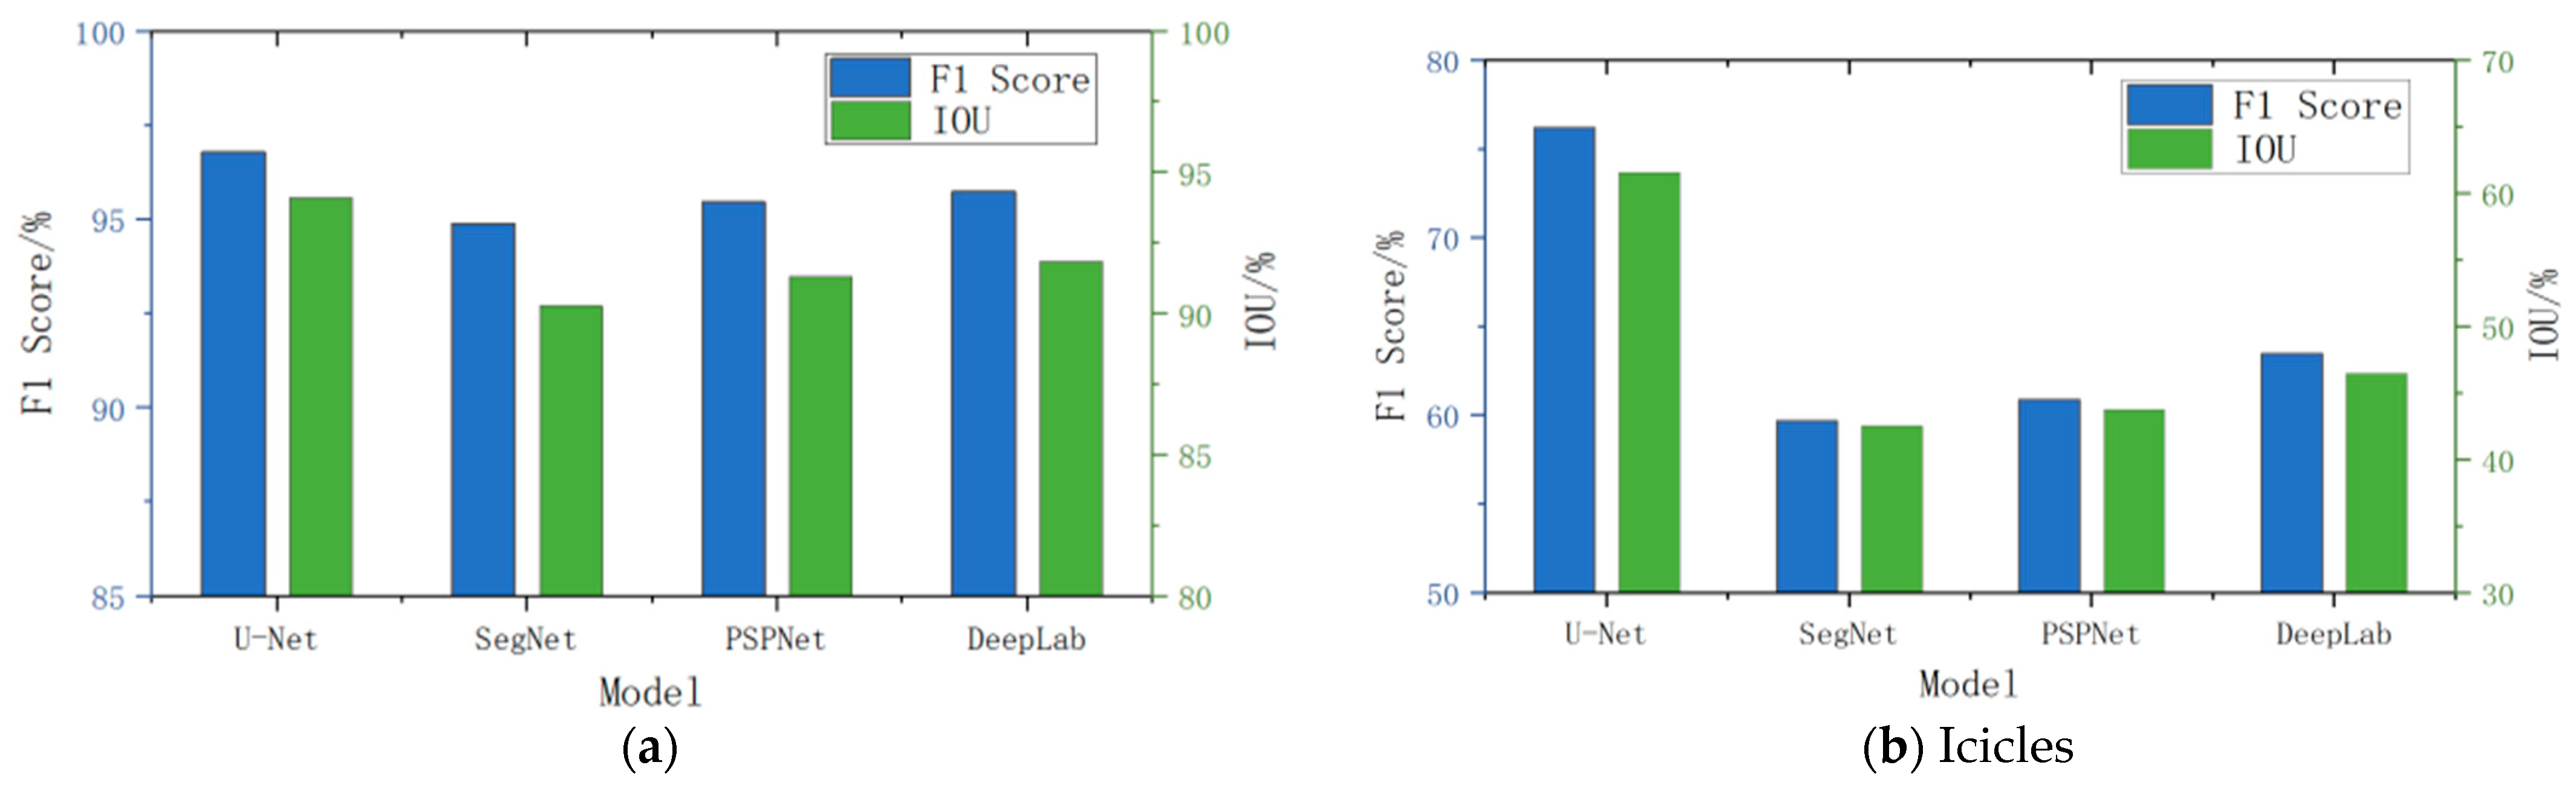
4.2.1. Comparison of Segmentation Models
4.2.2. Icing Severity Classification
5. Conclusions
Author Contributions
Funding
Institutional Review Board Statement
Informed Consent Statement
Data Availability Statement
Conflicts of Interest
References
- Li, S.; Wu, T.; Huang, T.; Chen, Z. Aerodynamic Stability of Iced Stay Cables on Cable-Stayed Bridge. Wind. Struct. 2016, 23, 253–273. [Google Scholar] [CrossRef]
- Liu, Q.; Han, Y.; Fan, X. Research on Hot Air Ice Melt System for Cable Sheaths of Er’qi Yangtze River Bridge. E3S Web Conf. 2021, 237, 02006. [Google Scholar] [CrossRef]
- Zicun, H.; He, K.; Xu, Y.G.; Fang, H.; Zuo, Q.; Li, Z. Design and Research on Impact Deicing Mechanism of Cable Climbing Robot. In Proceedings of the Design and Research on Impact Deicing Mechanism of Cable Climbing Robot 2021, Shanghai, China, 8–10 January 2021. [Google Scholar] [CrossRef]
- Kumpf, J.; Helmicki, A.; Nims, D.K.; Hunt, V.; Agrawal, S. Automated Ice Inference and Monitoring on the Veterans’ Glass City Skyway Bridge. J. Bridge Eng. 2012, 17, 975–978. [Google Scholar] [CrossRef]
- Roldsgaard, J.H.; Kiremidjian, A.S.; Georgakis, C.; Faber, M.H. Preliminary Probabilistic Prediction of Ice/Snow Accretion on Stay Cables Based on Meteorological Variables. In Proceedings of the 11th International Conference on Structural Safety & Reliability Conference, New York, NY, USA, 16–20 June 2014; pp. 5531–5538. [Google Scholar] [CrossRef]
- Andre, J.; Kiremidjian, A.S.; Georgakis, C. Statistical Modeling of Time Series for Ice Accretion Detection on Bridge Cables. J. Cold Reg. Eng. 2018, 32, 04018004. [Google Scholar] [CrossRef]
- Xiong, L.; Zhang, J.; Zheng, X.; Wang, Y. Context Transformer and Adaptive Method with Visual Transformer for Robust Facial Expression Recognition. Appl. Sci. 2024, 14, 1535. [Google Scholar] [CrossRef]
- Wang, B.; Fuqi, M.; Ge, L.; Ma, H.; Wang, H.; Mohamed, M.A. Icing-EdgeNet: A Pruning Lightweight Edge Intelligent Method of Discriminative Driving Channel for Ice Thickness of Transmission Lines. IEEE Trans. Instrum. Meas. 2021, 70, 1–12. [Google Scholar] [CrossRef]
- Bindu, N.P.; Sastry, P.N. Automated Brain Tumor Detection and Segmentation Using Modified UNet and ResNet Model. Soft Comput. 2023, 27, 9179–9189. [Google Scholar] [CrossRef]
- Fischl, B.; Salat, D.H.; Busa, E.; Albert, M.; Dieterich, M.; Haselgrove, C.; van der Kouwe, A.; Killiany, R.; Kennedy, D.; Klaveness, S.; et al. Whole Brain Segmentation: Automated Labeling of Neuroanatomical Structures in the Human Brain. Neuron 2002, 33, 341–355. [Google Scholar] [CrossRef] [PubMed]
- Ronneberger, O.; Fischer, P.; Brox, T. U-Net: Convolutional Networks for Biomedical Image Segmentation. In Proceedings of the Medical Image Computing and Computer-Assisted Intervention–MICCAI; Springer: Berlin/Heidelberg, Germany, 2015; pp. 234–241. [Google Scholar]
- Zhou, Z.; Rahman Siddiquee, M.M.; Tajbakhsh, N.; Liang, J. UNet++: A Nested U-Net Architecture for Medical Image Segmentation. In Proceedings of the Deep Learning in Medical Image Analysis and Multimodal Learning for Clinical Decision Support; Springer: Cham, Switzerland, 2018. [Google Scholar]
- Bahadure, N.B.; Ray, A.K.; Thethi, H.P. Comparative Approach of MRI-Based Brain Tumor Segmentation and Classification Using Genetic Algorithm. J. Digit. Imaging 2018, 31, 477–489. [Google Scholar] [CrossRef] [PubMed]
- Long, J.; Shelhamer, E.; Darrell, T. Fully convolutional networks for semantic segmentation. In Proceedings of the IEEE Conference on Computer Vision and Pattern Recognition, (CVPR), Boston, MA, USA, 7–12 June 2015; pp. 3431–3440. [Google Scholar] [CrossRef]
- Guo, Q.; Xiao, J.; Hu, X. New Keypoint Matching Method Using Local Convolutional Features for Power Transmission Line Icing Monitoring. Sensors 2018, 18, 698. [Google Scholar] [CrossRef] [PubMed]
- Pan, G.; Fu, L.; Yu, R.; Muresan, M. Evaluation of Alternative Pre-Trained Convolutional Neural Networks for Winter Road Surface Condition Monitoring. In Proceedings of the 2019 5th International Conference on Transportation Information and Safety (ICTIS), Liverpool, UK, 14–17 July 2019. [Google Scholar]
- Veerakumar, R.; Gao, L.; Liu, Y.; Hu, H. Dynamic Ice Accretion Process and Its Effects on the Aerodynamic Drag Characteristics of a Power Transmission Cable Model. Cold Reg. Sci. Technol. 2020, 169, 102908. [Google Scholar] [CrossRef]
- Sampedro, C.; Rodriguez-Vazquez, J.; Rodriguez-Ramos, A.; Carrio, A.; Campoy, P. Deep Learning-Based System for Automatic Recognition and Diagnosis of Electrical Insulator Strings. IEEE Access 2019, 7, 101283–101308. [Google Scholar] [CrossRef]
- Wang, C.-S.; Du, P.; Wu, H.; Li, J.; Zhao, C.; Zhu, H. A Cucumber Leaf Disease Severity Classification Method Based on the Fusion of DeepLabV3+ and U-Net. Comput. Electron. Agric. 2021, 189, 106373. [Google Scholar] [CrossRef]
- He, K.; Zhang, X.; Ren, S.; Sun, J. Deep residual learning for image recognition. In Proceedings of the IEEE Computer Society Conference on Computer Vision and Pattern Recognition (CVPR), Las Vegas, NV, USA, 27–30 June 2016; pp. 770–778. [Google Scholar] [CrossRef]
- Liu, T.; Tao, D.; Song, M.; Maybank, S.J. Algorithm-Dependent Generalization Bounds for Multi-Task Learning. IEEE Trans. Pattern Anal. Mach. Intell. 2017, 39, 227–241. [Google Scholar] [CrossRef] [PubMed]
- Badrinarayanan, V.; Kendall, A.; Cipolla, R. SegNet: A Deep Convolutional Encoder-Decoder Architecture for Image Segmentation. IEEE Trans. Pattern Anal. Mach. Intell. 2017, 39, 2481–2495. [Google Scholar] [CrossRef] [PubMed]
- Chen, L.-C.; Papandreou, G.; Kokkinos, I.; Murphy, K.; Yuille, A.L. DeepLab: Semantic Image Segmentation with Deep Convolutional Nets, Atrous Convolution, and Fully Connected CRFs. IEEE Trans. Pattern Anal. Mach. Intell. 2018, 40, 834–848. [Google Scholar] [CrossRef]
- Zhao, H.; Shi, J.; Qi, X. Pyramid Scene Parsing Network. Proc. IEEE Conf. Comput. Vis. Pattern Recognit. 2017, 2017, 2881–2890. [Google Scholar]


| Group Number | Inclination Angle (°) | Ambient Temperature (°C) | Cooling Time (h) | Wind Velocity (m/s) |
|---|---|---|---|---|
| 1 | 30 | −4 | 3 | 2 |
| 2 | 30 | −8 | 3 | 2 |
| 3 | 45 | −4 | 3 | 2 |
| 4 | 45 | −8 | 3 | 2 |
| 5 | 60 | −4 | 3 | 2 |
| 6 | 60 | −8 | 3 | 2 |
| Level of Icing Degree | Icing Condition | Icing Pixel Area/mm² |
|---|---|---|
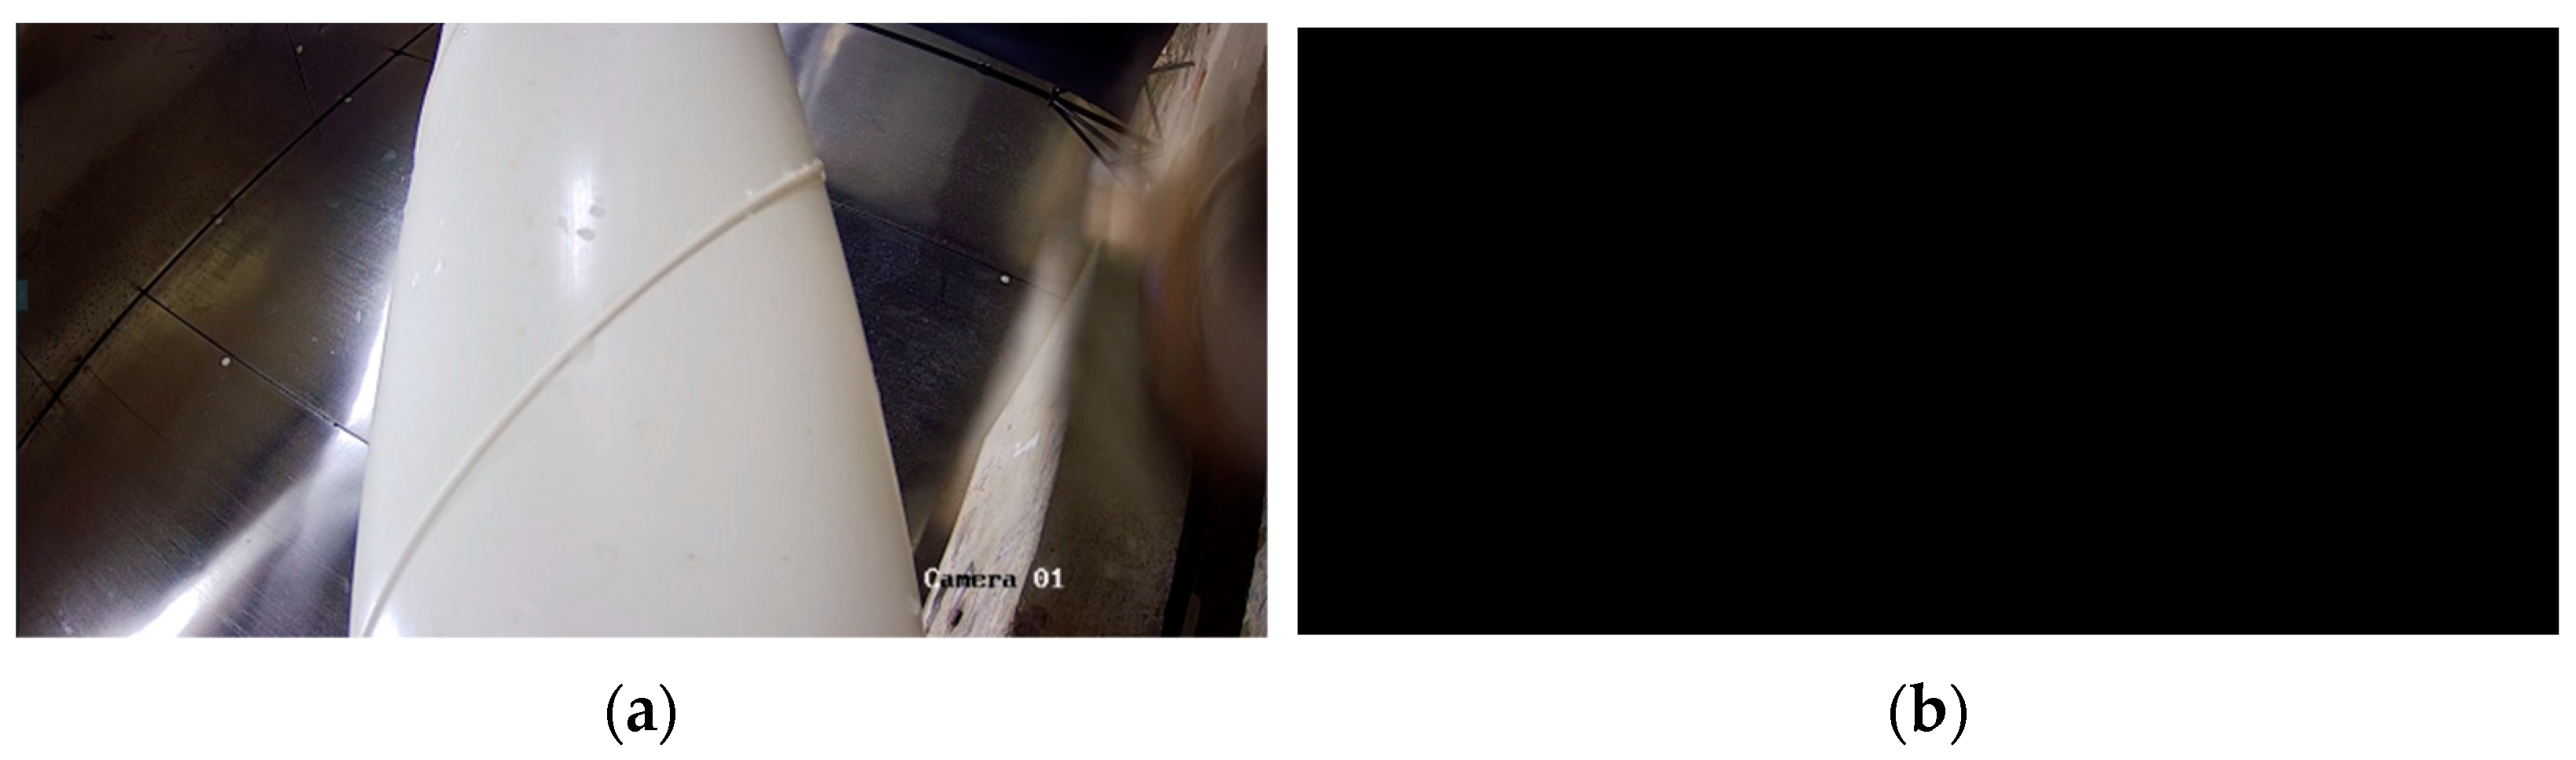
| zero level | no obvious icing | S = 0 |
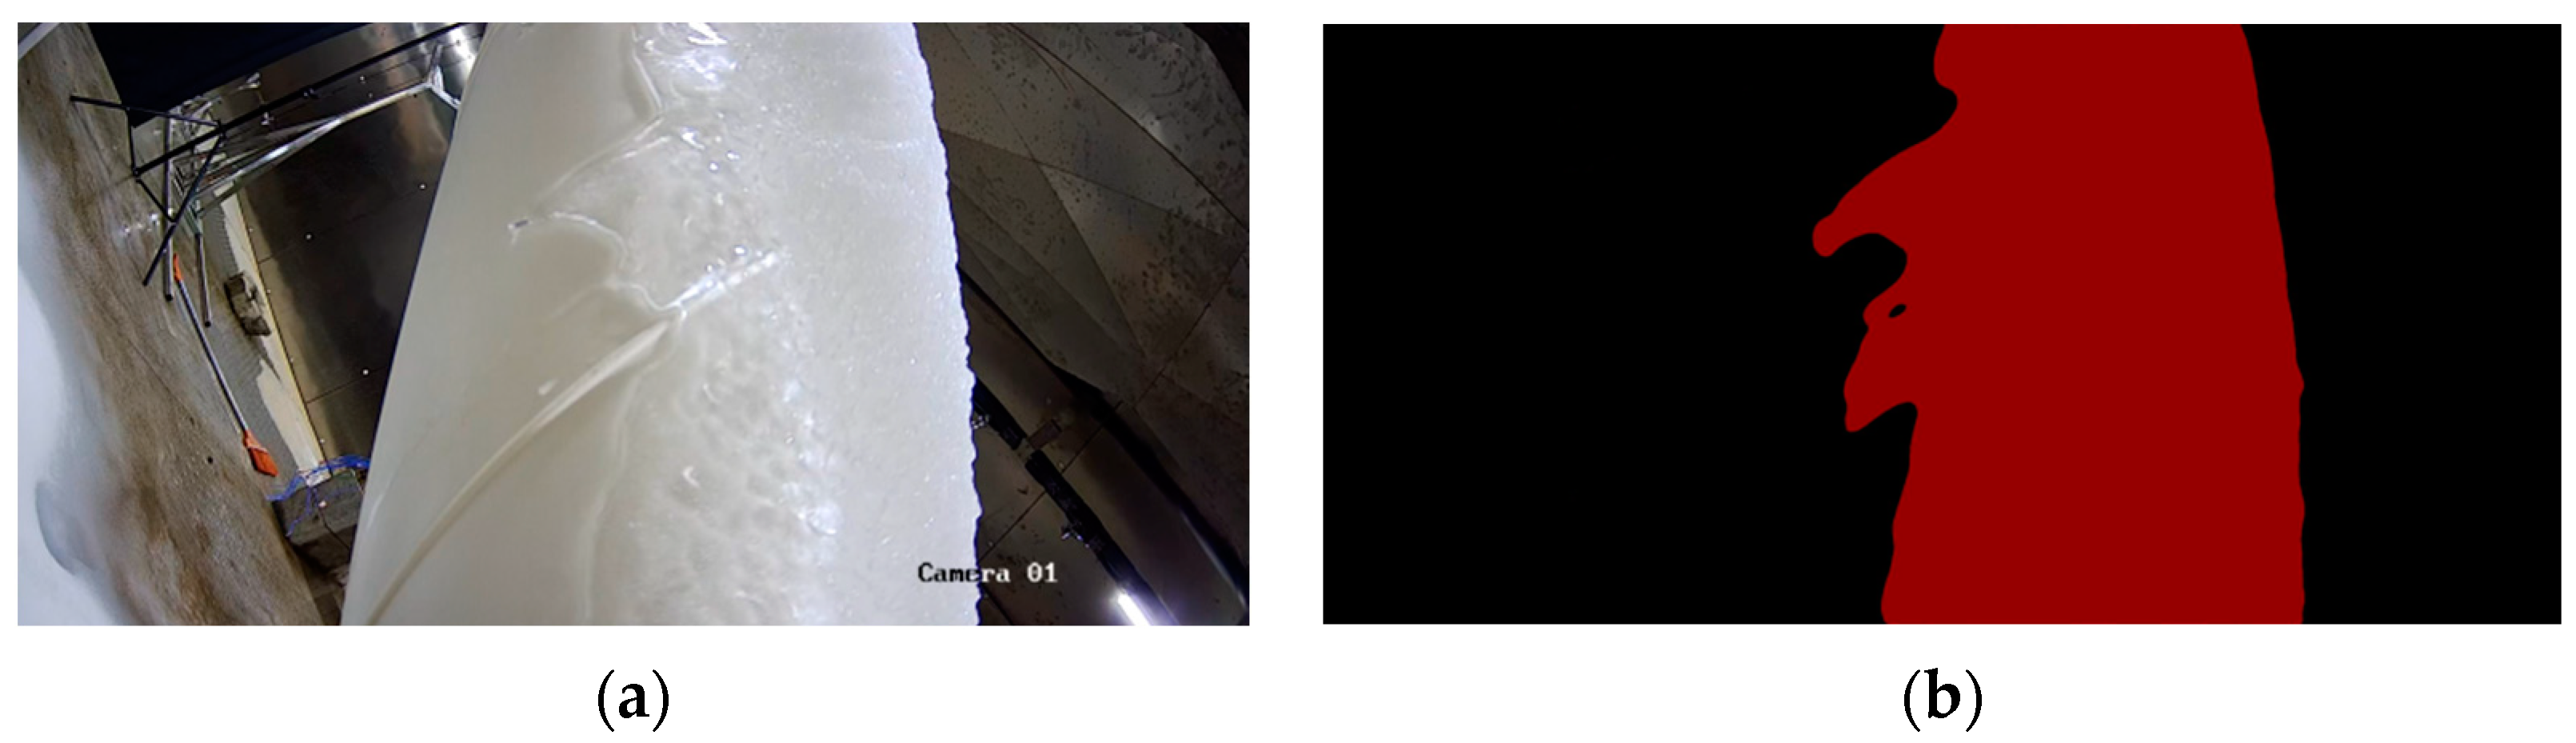
| first level | icing in some areas | 0 < S < 100,000 |
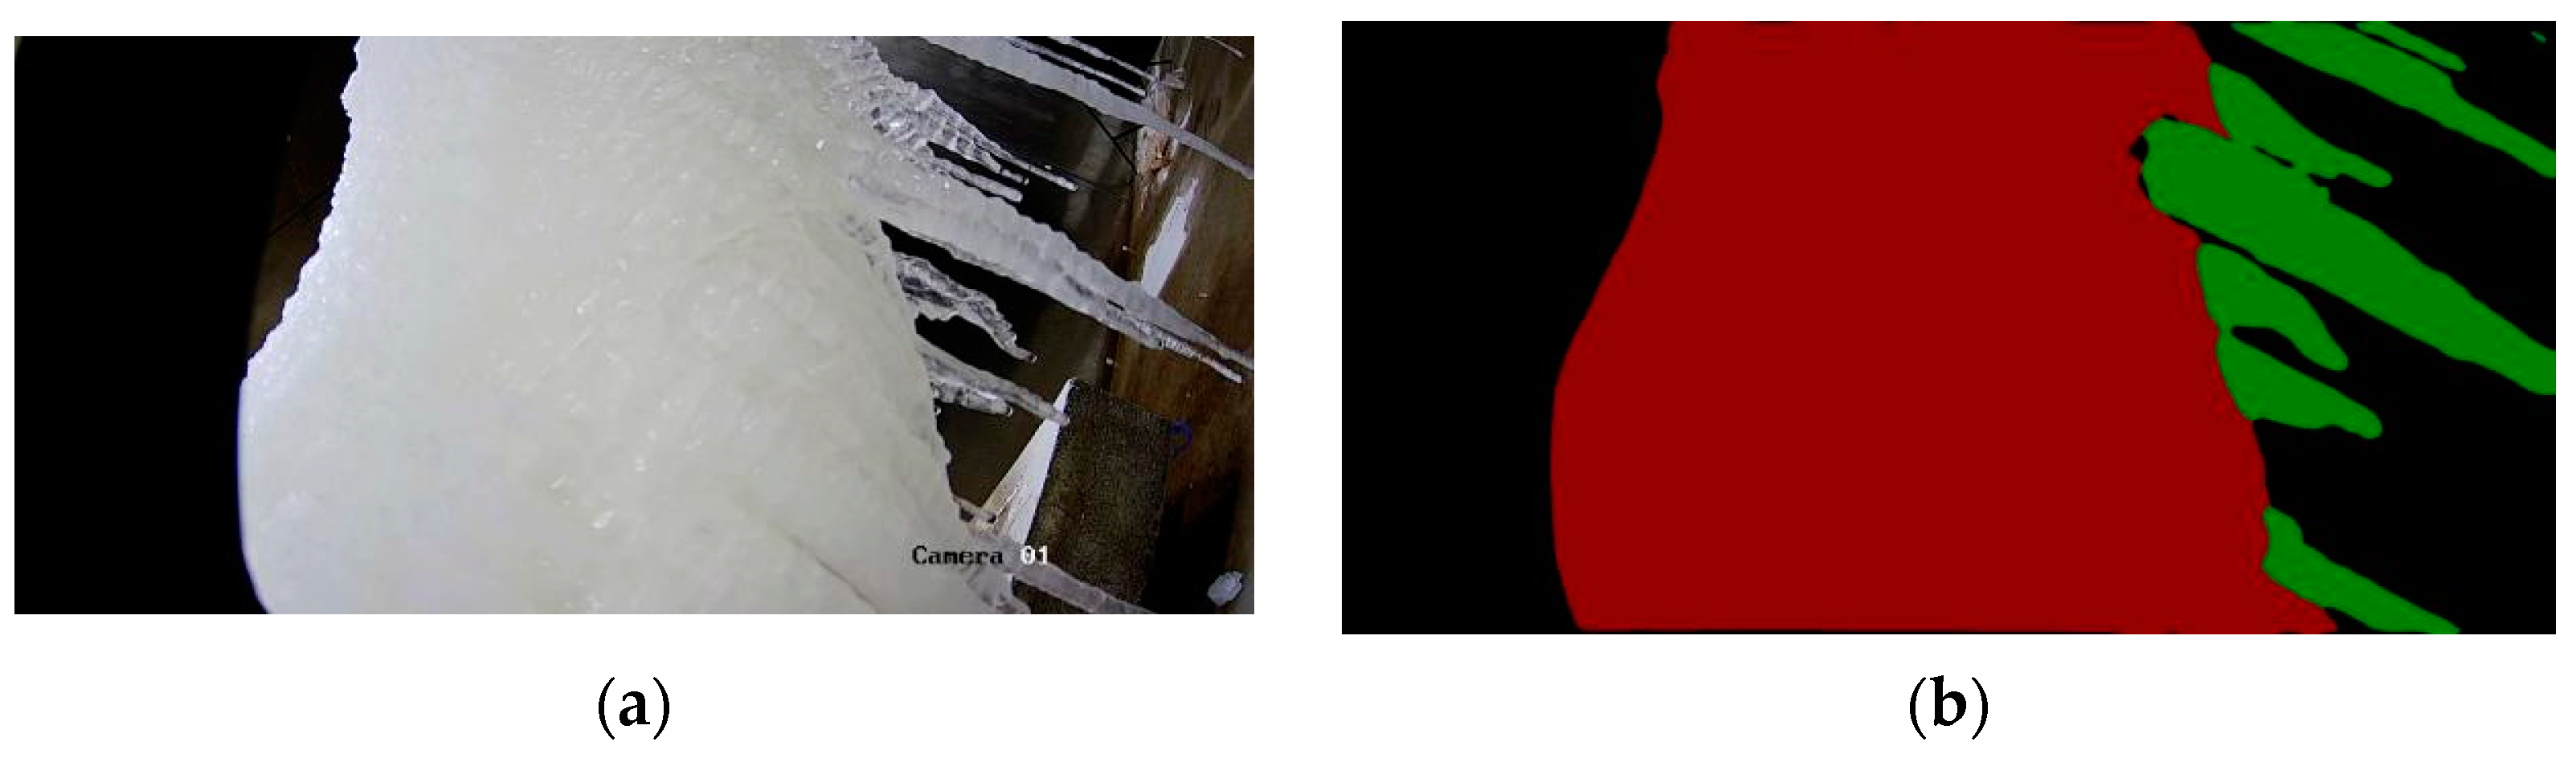
| second level | icing in all areas | S > 100,000 |
| Level of Icing Degree | Data Set | Train | Test |
|---|---|---|---|
| Zero level | 93 | 74 | 19 |
| First level | 521 | 416 | 105 |
| Second level | 886 | 708 | 178 |
| True/Forecast | Icicles | Surface Ice | No Icing |
|---|---|---|---|
| Icicles | TP | FN | FN |
| Surface ice | FP | TP | TN |
| No icing | FP | FP | TP |
| Model | Category | Accuracy | IoU | Precision | Recall | F1 |
|---|---|---|---|---|---|---|
| DeepLab | background | 93.48 | 87.04 | 92.97 | 93.17 | 93.07 |
| surface ice | 96.09 | 91.84 | 96.09 | 95.40 | 95.74 | |
| icicles | 96.29 | 46.50 | 61.97 | 65.07 | 63.48 | |
| PSPNet | background | 93.15 | 86.51 | 92.08 | 93.46 | 92.77 |
| surface ice | 95.63 | 91.31 | 95.45 | 95.46 | 95.46 | |
| icicles | 96.40 | 43.75 | 65.93 | 56.54 | 60.87 | |
| SegNet | background | 92.76 | 85.85 | 91.40 | 93.40 | 92.39 |
| surface ice | 95.10 | 90.27 | 95.22 | 94.55 | 94.88 | |
| icicles | 96.28 | 42.54 | 64.52 | 55.53 | 59.69 | |
| U-Net | background | 95.41 | 90.62 | 95.80 | 94.37 | 95.08 |
| surface ice | 97.08 | 94.11 | 96.95 | 96.98 | 96.97 | |
| icicles | 97.48 | 61.58 | 71.59 | 81.49 | 76.22 |
| Camera Perspective | Origin | Ground Truth | SegNet | DeepLab | PSPNet | U-Net |
|---|---|---|---|---|---|---|
| Left camera |  |  |  |  |  |  |
 |  |  |  |  |  | |
 |  |  |  |  |  | |
| Right camera |  |  |  |  |  |  |
 |  |  |  |  |  | |
 |  |  |  |  |  |
| Model | A/% |
|---|---|
| U-Net + VGG16 (Simonyan, 2014) | 86.32 |
| U-Net + AlexNet (Krizhevsky et al., 2012) | 88.95 |
| U-Net + ResNet50 (He et al., 2016) | 95.71 |
| U-Net + GoogleNet (Szegedy et al., 2015) | 89.43 |
Disclaimer/Publisher’s Note: The statements, opinions and data contained in all publications are solely those of the individual author(s) and contributor(s) and not of MDPI and/or the editor(s). MDPI and/or the editor(s) disclaim responsibility for any injury to people or property resulting from any ideas, methods, instructions or products referred to in the content. |
© 2024 by the authors. Licensee MDPI, Basel, Switzerland. This article is an open access article distributed under the terms and conditions of the Creative Commons Attribution (CC BY) license (https://creativecommons.org/licenses/by/4.0/).
Share and Cite
Yang, Z.; Xiong, F.; Pei, Y.; Chen, Z.; Zhan, C.; Hu, E.; Zhang, G. A Stay Cable Icing Identification Method Based on the Fusion of U-Net and ResNet50. Appl. Sci. 2024, 14, 3062. https://doi.org/10.3390/app14073062
Yang Z, Xiong F, Pei Y, Chen Z, Zhan C, Hu E, Zhang G. A Stay Cable Icing Identification Method Based on the Fusion of U-Net and ResNet50. Applied Sciences. 2024; 14(7):3062. https://doi.org/10.3390/app14073062
Chicago/Turabian StyleYang, Zhiyong, Feng Xiong, Yaoyao Pei, Zhi Chen, Chuanhai Zhan, Enjie Hu, and Guanghao Zhang. 2024. "A Stay Cable Icing Identification Method Based on the Fusion of U-Net and ResNet50" Applied Sciences 14, no. 7: 3062. https://doi.org/10.3390/app14073062
APA StyleYang, Z., Xiong, F., Pei, Y., Chen, Z., Zhan, C., Hu, E., & Zhang, G. (2024). A Stay Cable Icing Identification Method Based on the Fusion of U-Net and ResNet50. Applied Sciences, 14(7), 3062. https://doi.org/10.3390/app14073062